introduction to geographic information systems/science...
TRANSCRIPT
Introduction to Geographic Information Systems/Science (GIS)
Jenny Palomino ELP 2015 July 16, 2015
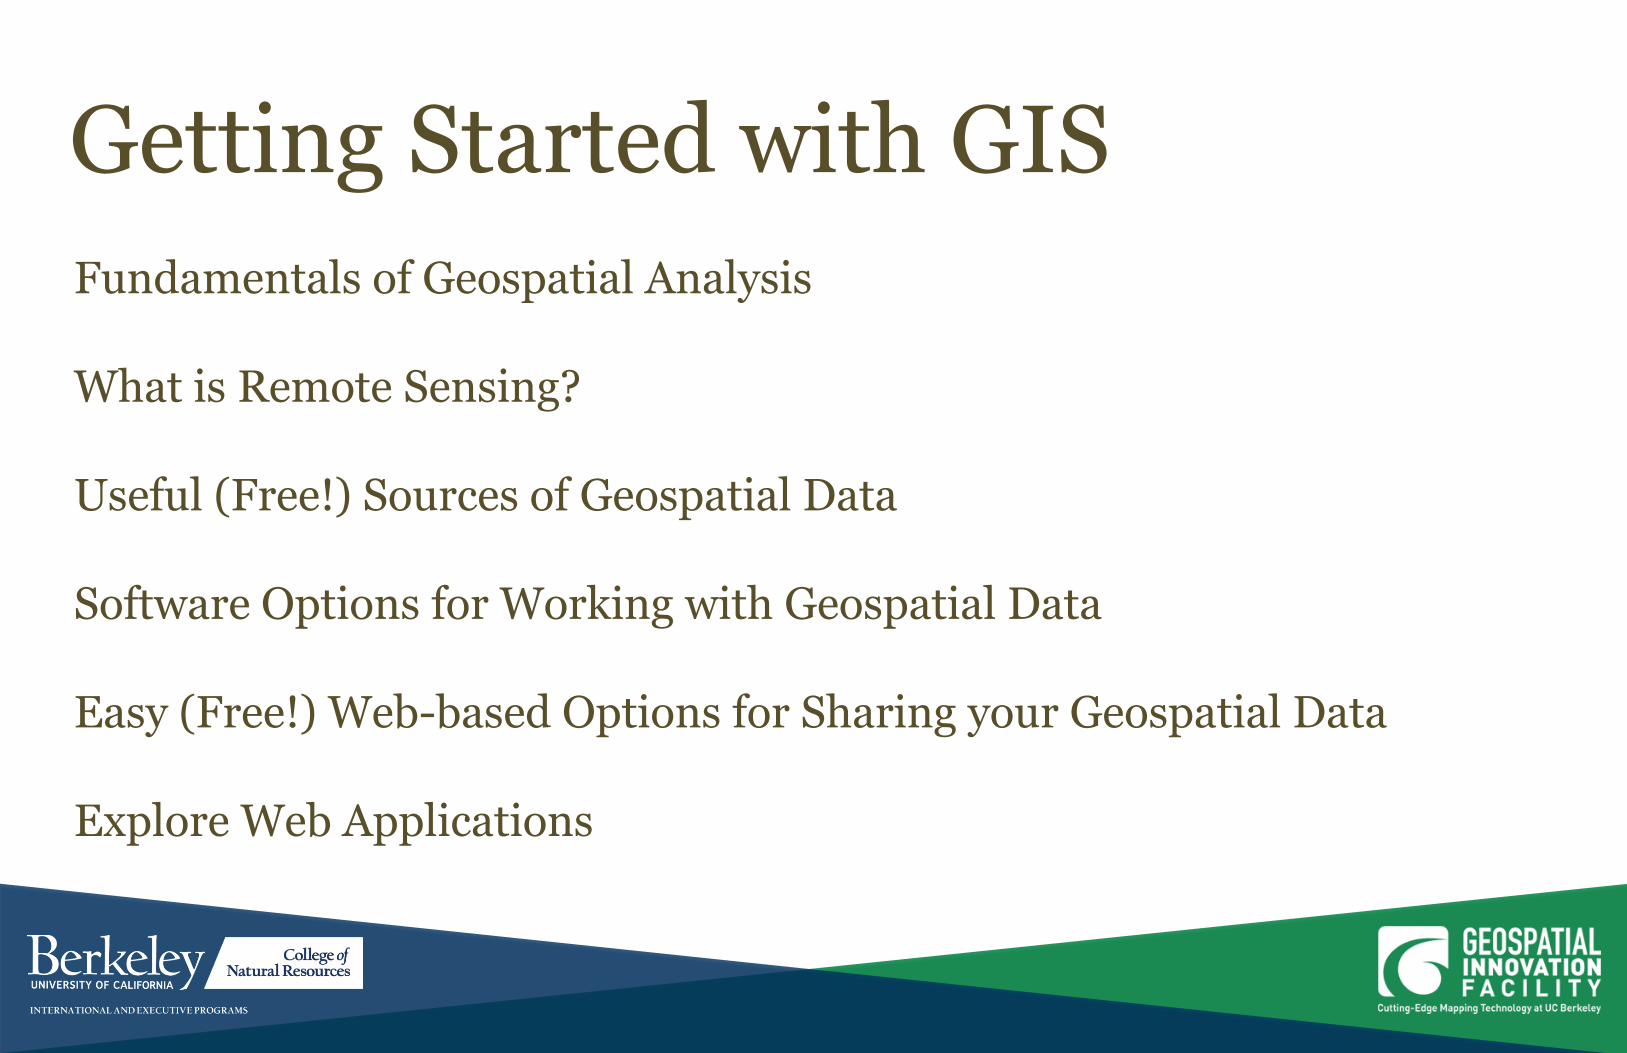
Getting Started with GIS
Fundamentals of Geospatial Analysis What is Remote Sensing? Useful (Free!) Sources of Geospatial Data Software Options for Working with Geospatial Data Easy (Free!) Web-based Options for Sharing your Geospatial Data Explore Web Applications
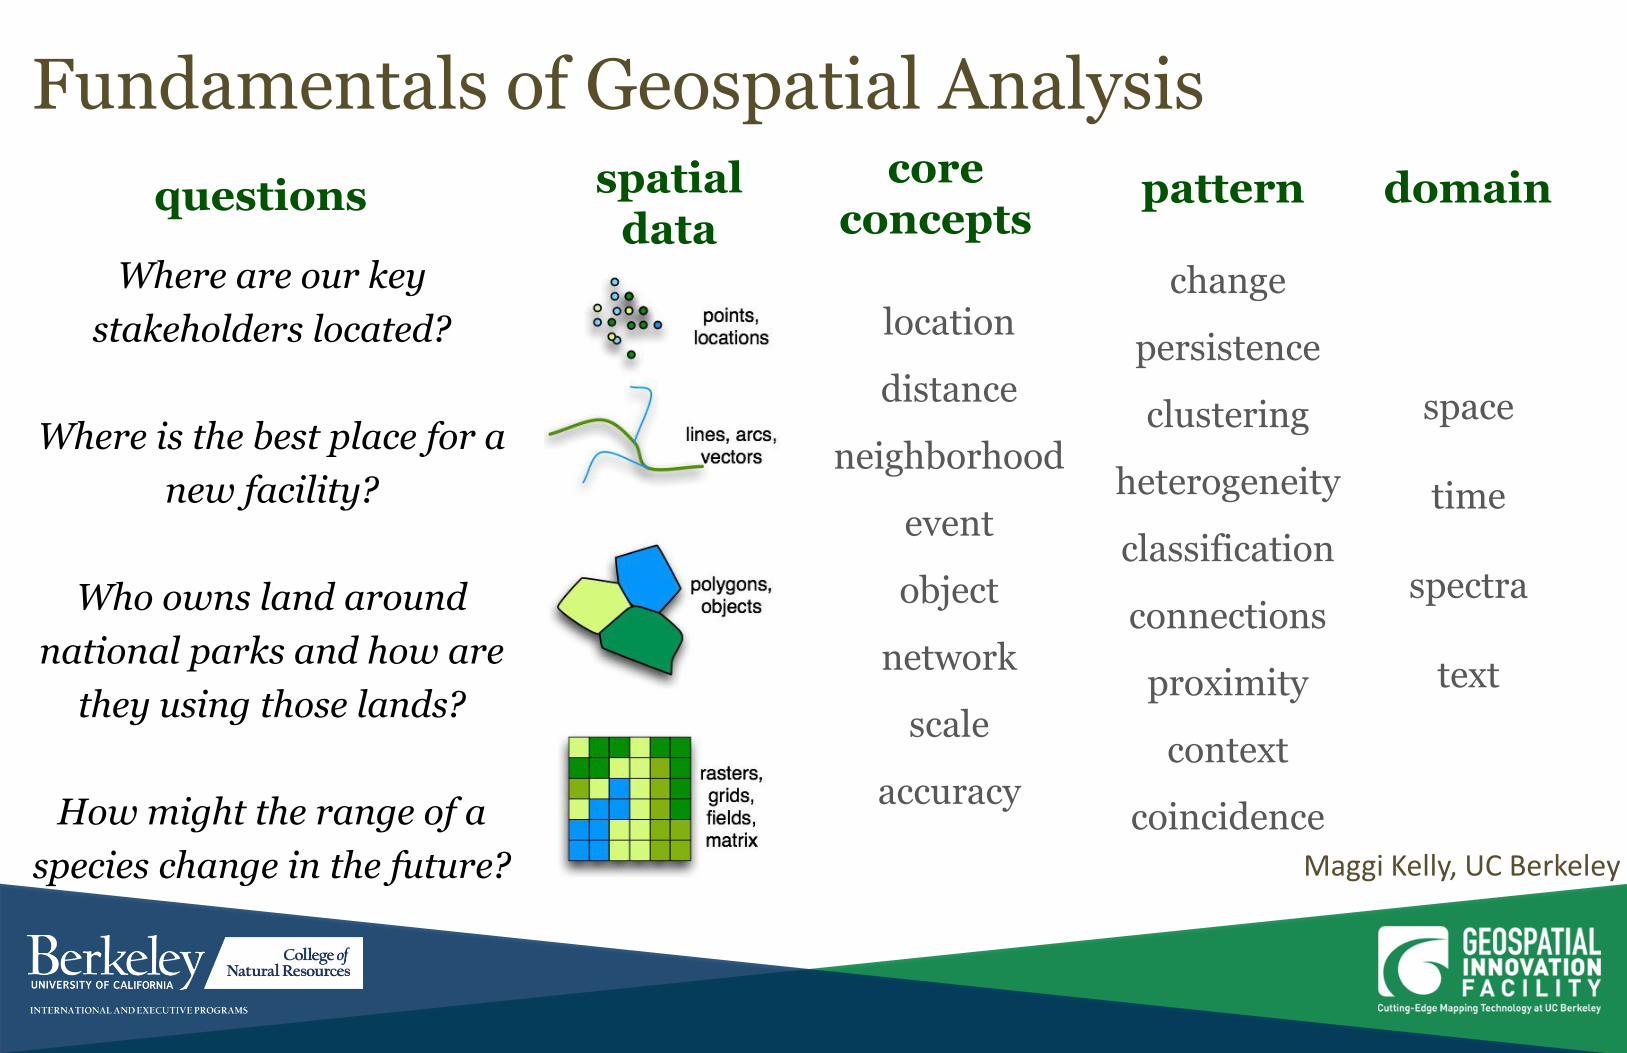
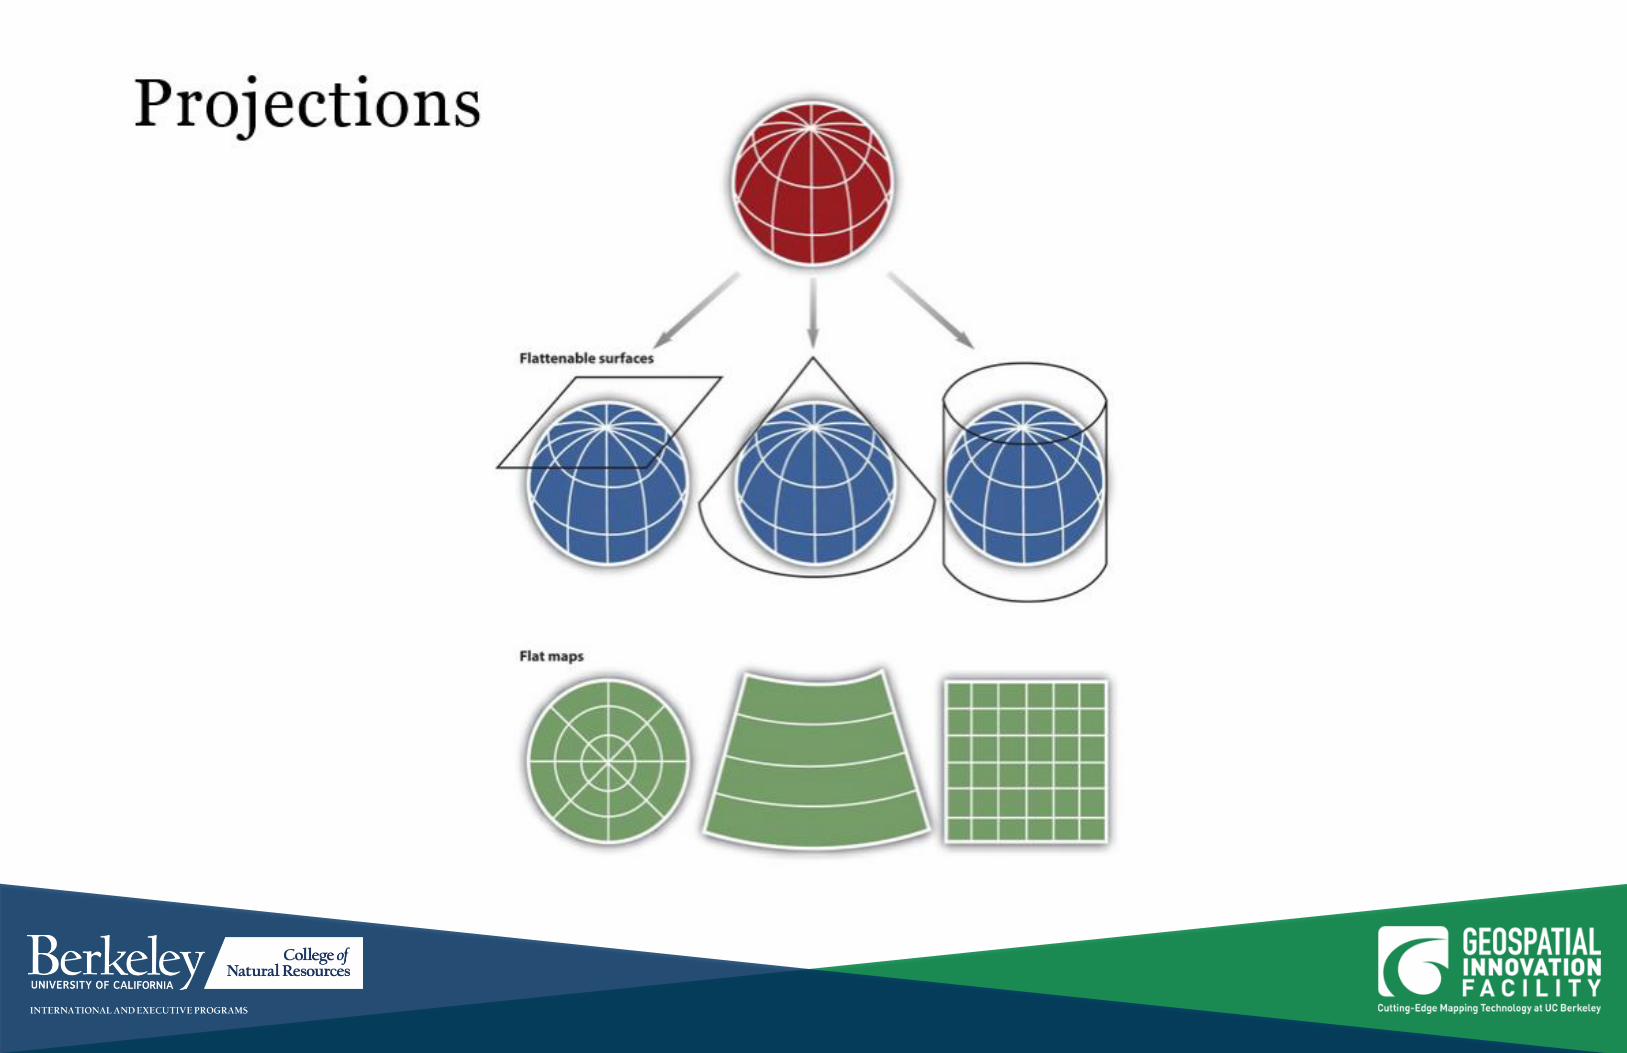
Fundamentals of Geospatial Analysis
pattern spatial data
location
distance
neighborhood
event
object
network
scale
accuracy
space
time
spectra
text
domain
change
persistence
clustering
heterogeneity
classification
connections
proximity
context
coincidence
core concepts
questions
Where are our key
stakeholders located?
Where is the best place for a
new facility?
Who owns land around
national parks and how are
they using those lands?
How might the range of a
species change in the future? Maggi Kelly, UC Berkeley

What is Spatial Data?
Primary Data Types
vector: point, line, polygon
raster: continuous (e.g. elevation) or discrete
surfaces (e.g. land use)
Common Data Formats
vector: shapefile, database geometry, tables
(.dbf, .xlsx), KML, GeoJSON
raster: ASCII, GeoTIFF, JPEG2000, MrSID,
IMG, GRID, HDF5
Image: Maggi Kelly, UC Berkeley
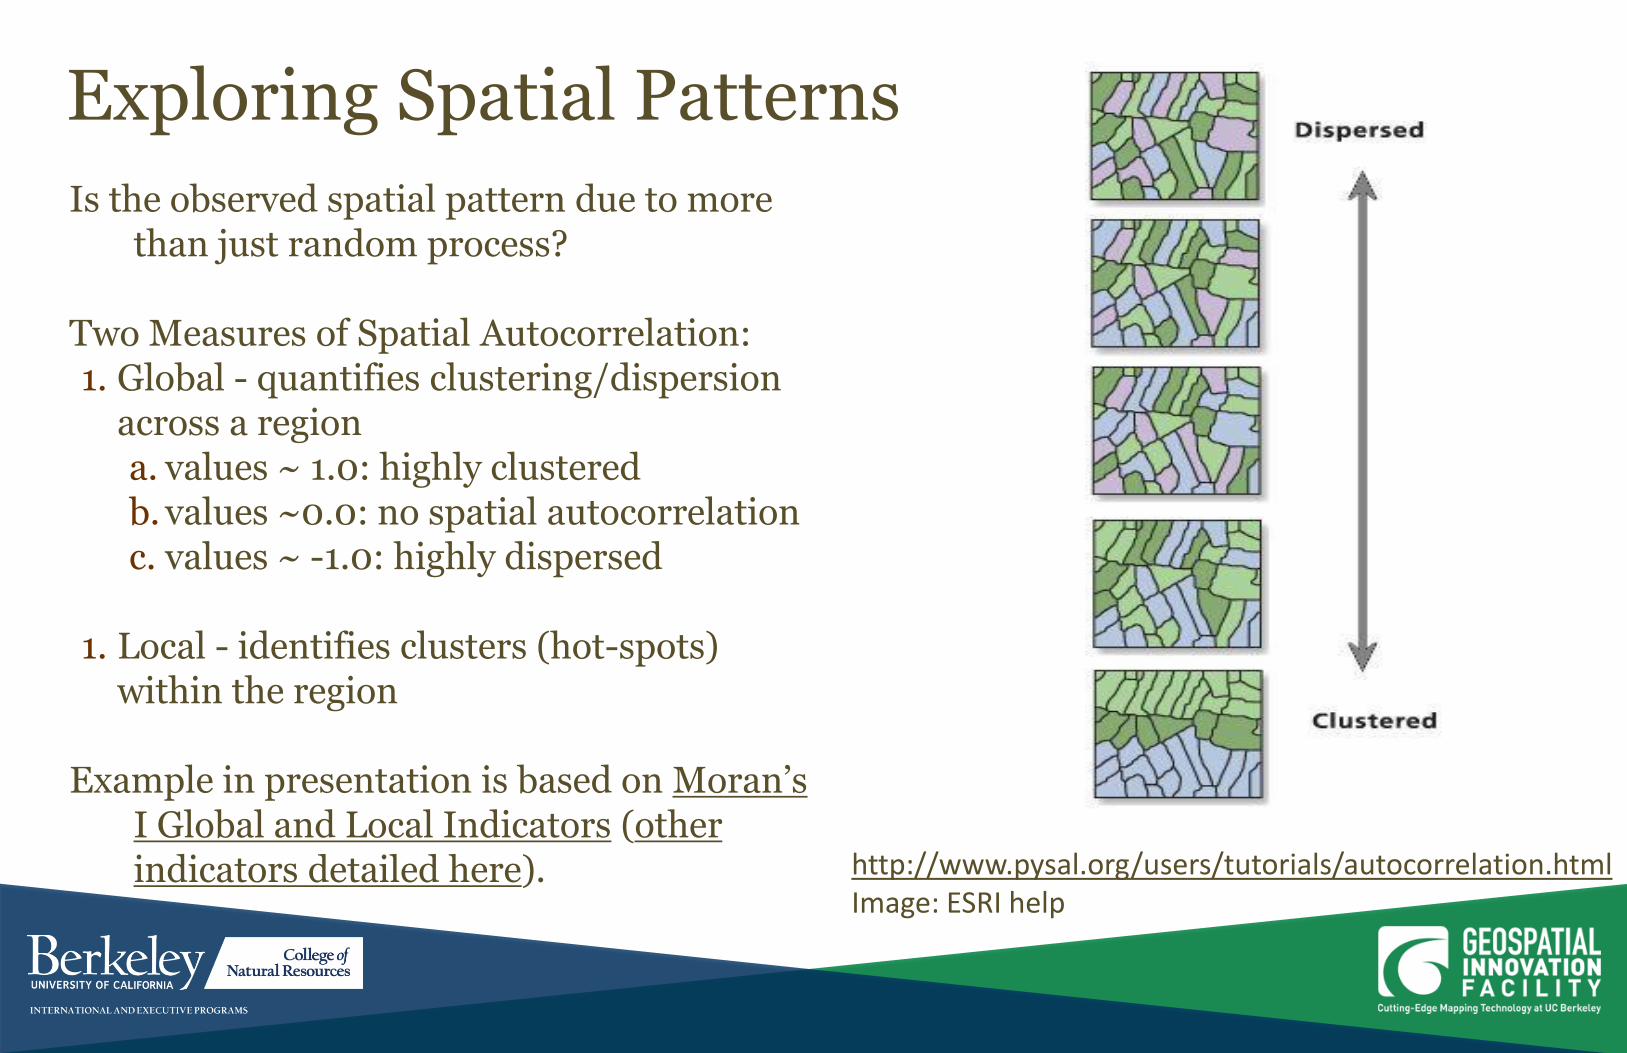
Exploring Spatial Patterns
Is the observed spatial pattern due to more than just random process?
Two Measures of Spatial Autocorrelation: 1. Global - quantifies clustering/dispersion
across a region a. values ~ 1.0: highly clustered b. values ~0.0: no spatial autocorrelation c. values ~ -1.0: highly dispersed
1. Local - identifies clusters (hot-spots)
within the region Example in presentation is based on Moran’s
I Global and Local Indicators (other indicators detailed here). http://www.pysal.org/users/tutorials/autocorrelation.html
Image: ESRI help
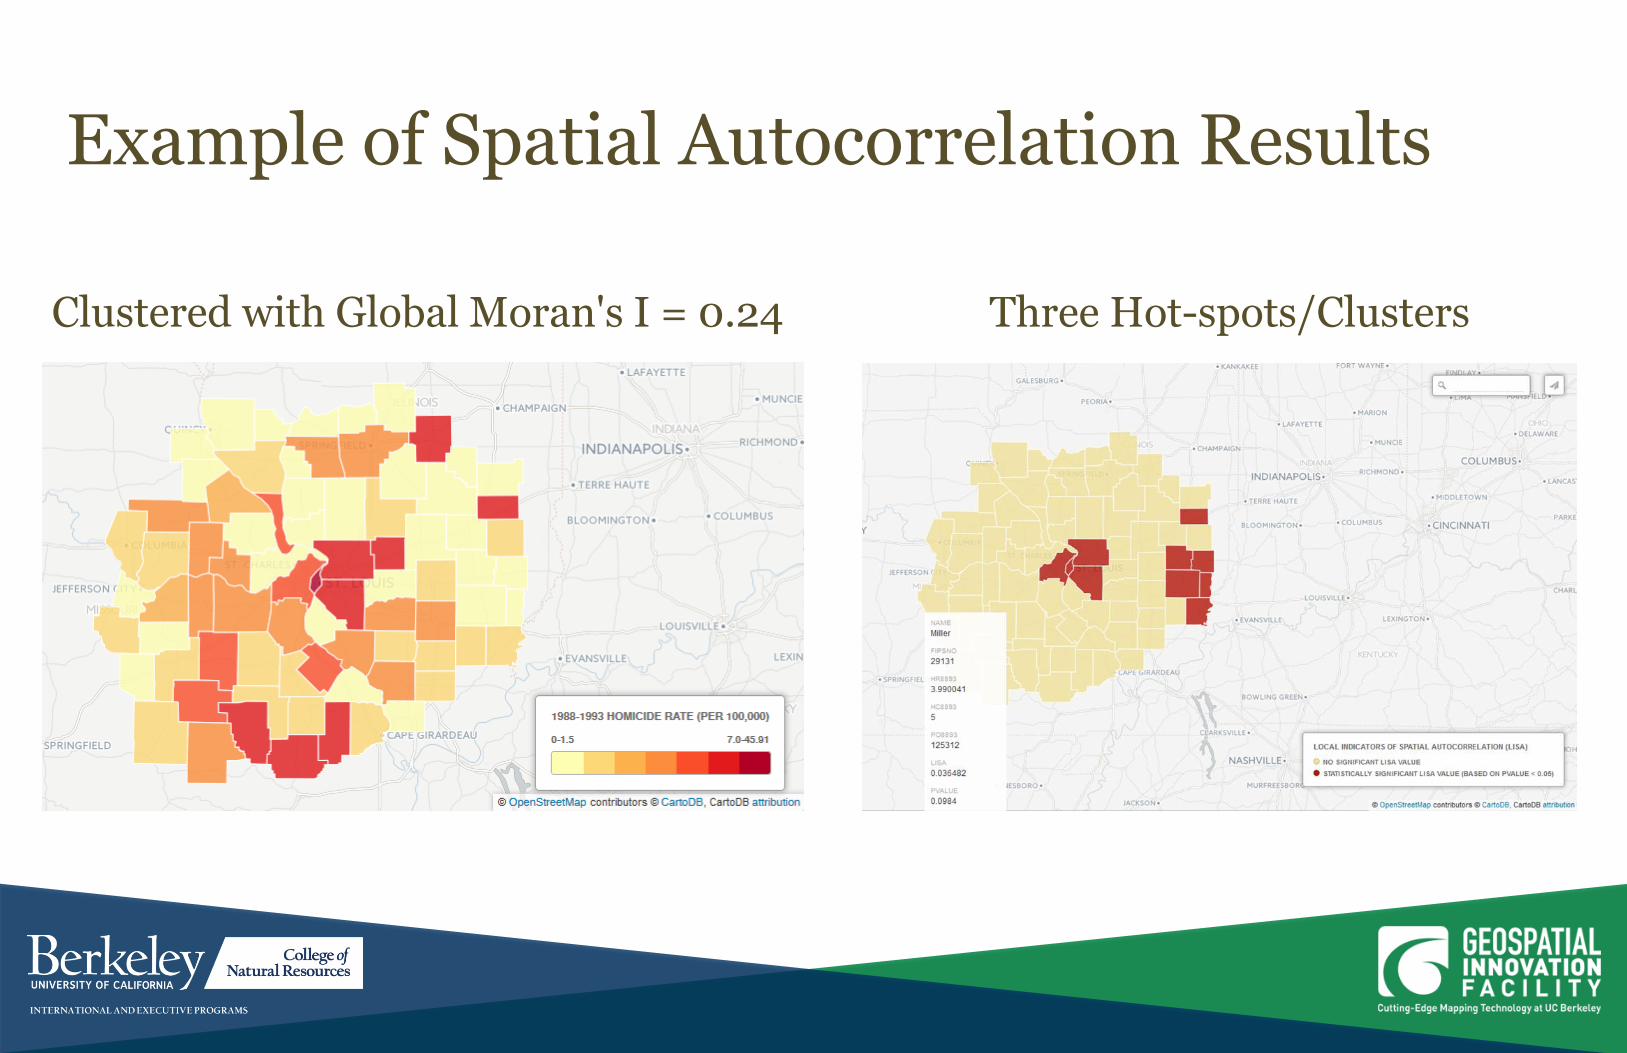
Example of Spatial Autocorrelation Results
Clustered with Global Moran's I = 0.24
Three Hot-spots/Clusters
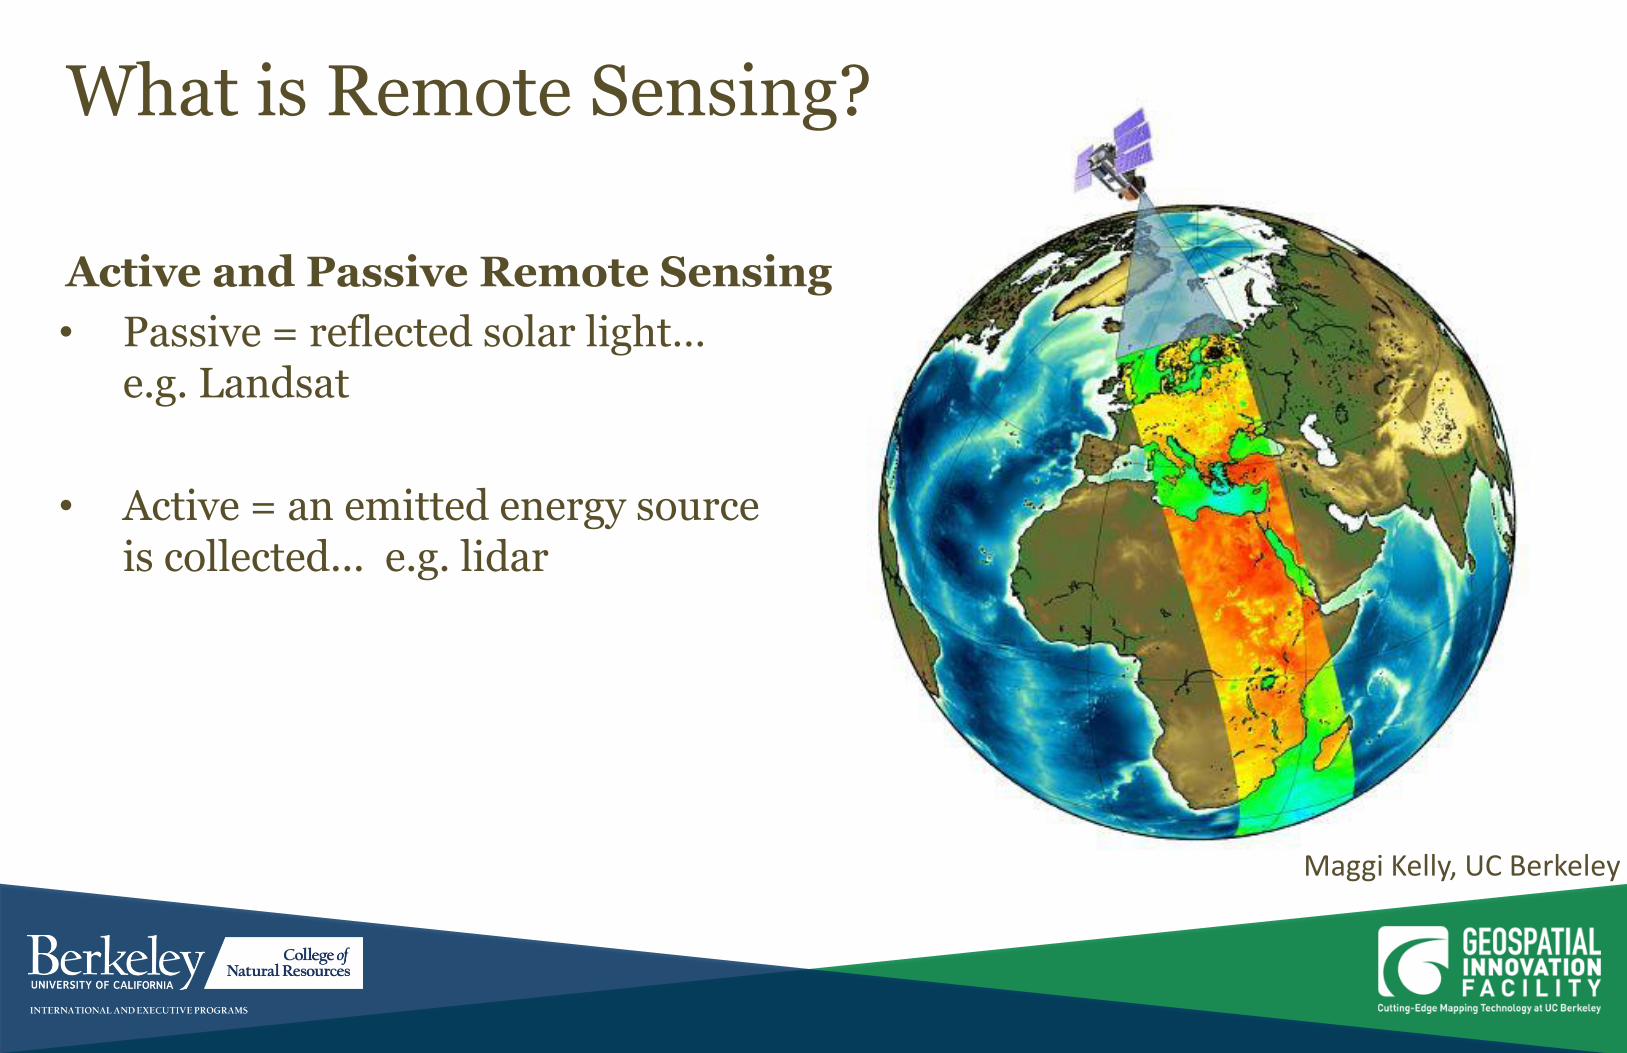
What is Remote Sensing?
Active and Passive Remote Sensing
• Passive = reflected solar light… e.g. Landsat
• Active = an emitted energy source is collected... e.g. lidar
Maggi Kelly, UC Berkeley
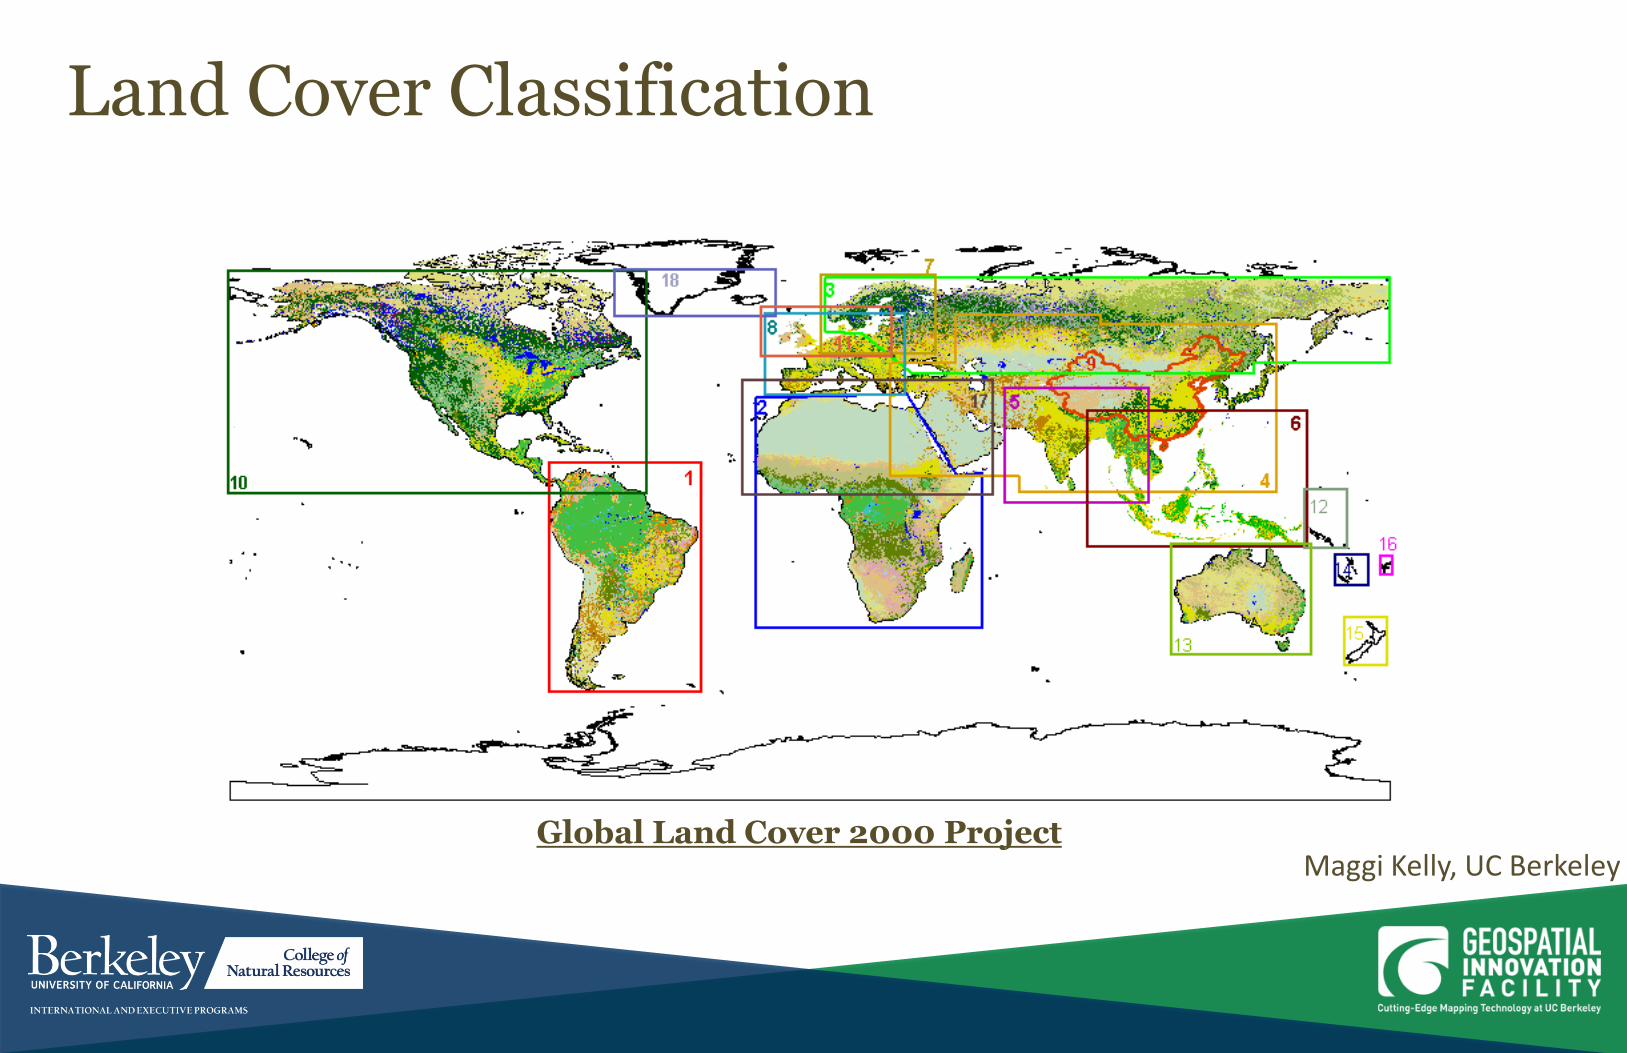
Land Cover Classification
Global Land Cover 2000 Project Maggi Kelly, UC Berkeley
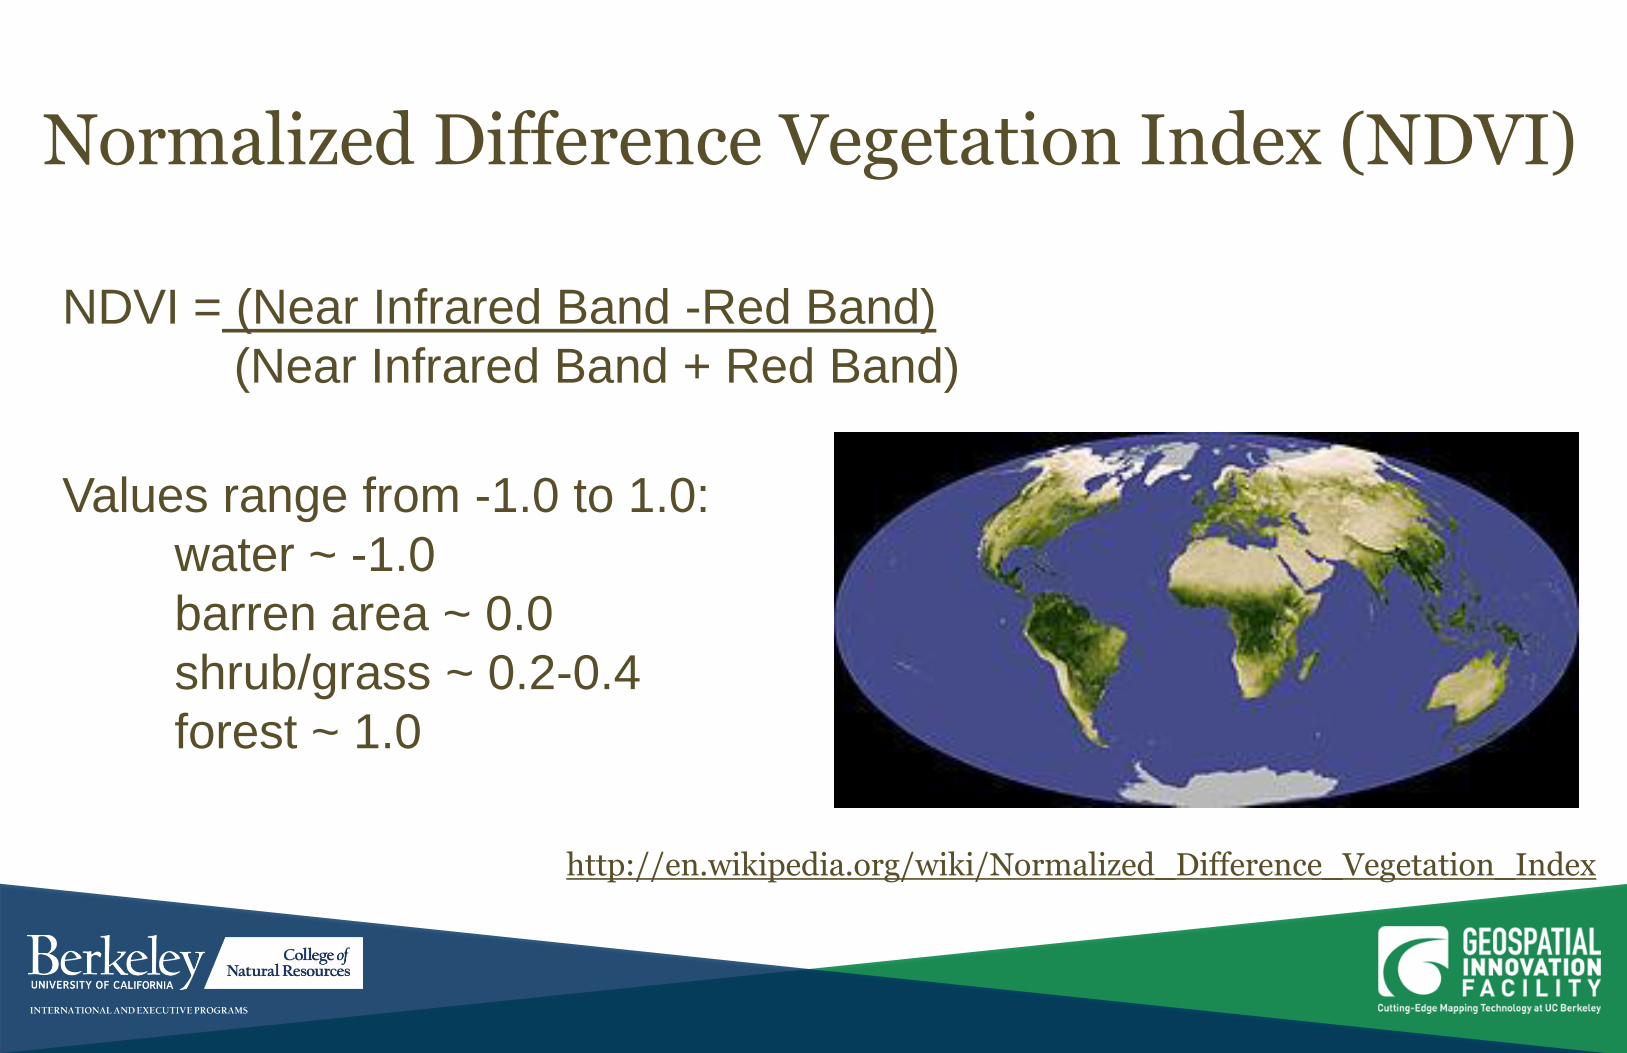
Normalized Difference Vegetation Index (NDVI)
NDVI = (Near Infrared Band -Red Band)
(Near Infrared Band + Red Band)
Values range from -1.0 to 1.0:
water ~ -1.0
barren area ~ 0.0
shrub/grass ~ 0.2-0.4
forest ~ 1.0
http://en.wikipedia.org/wiki/Normalized_Difference_Vegetation_Index
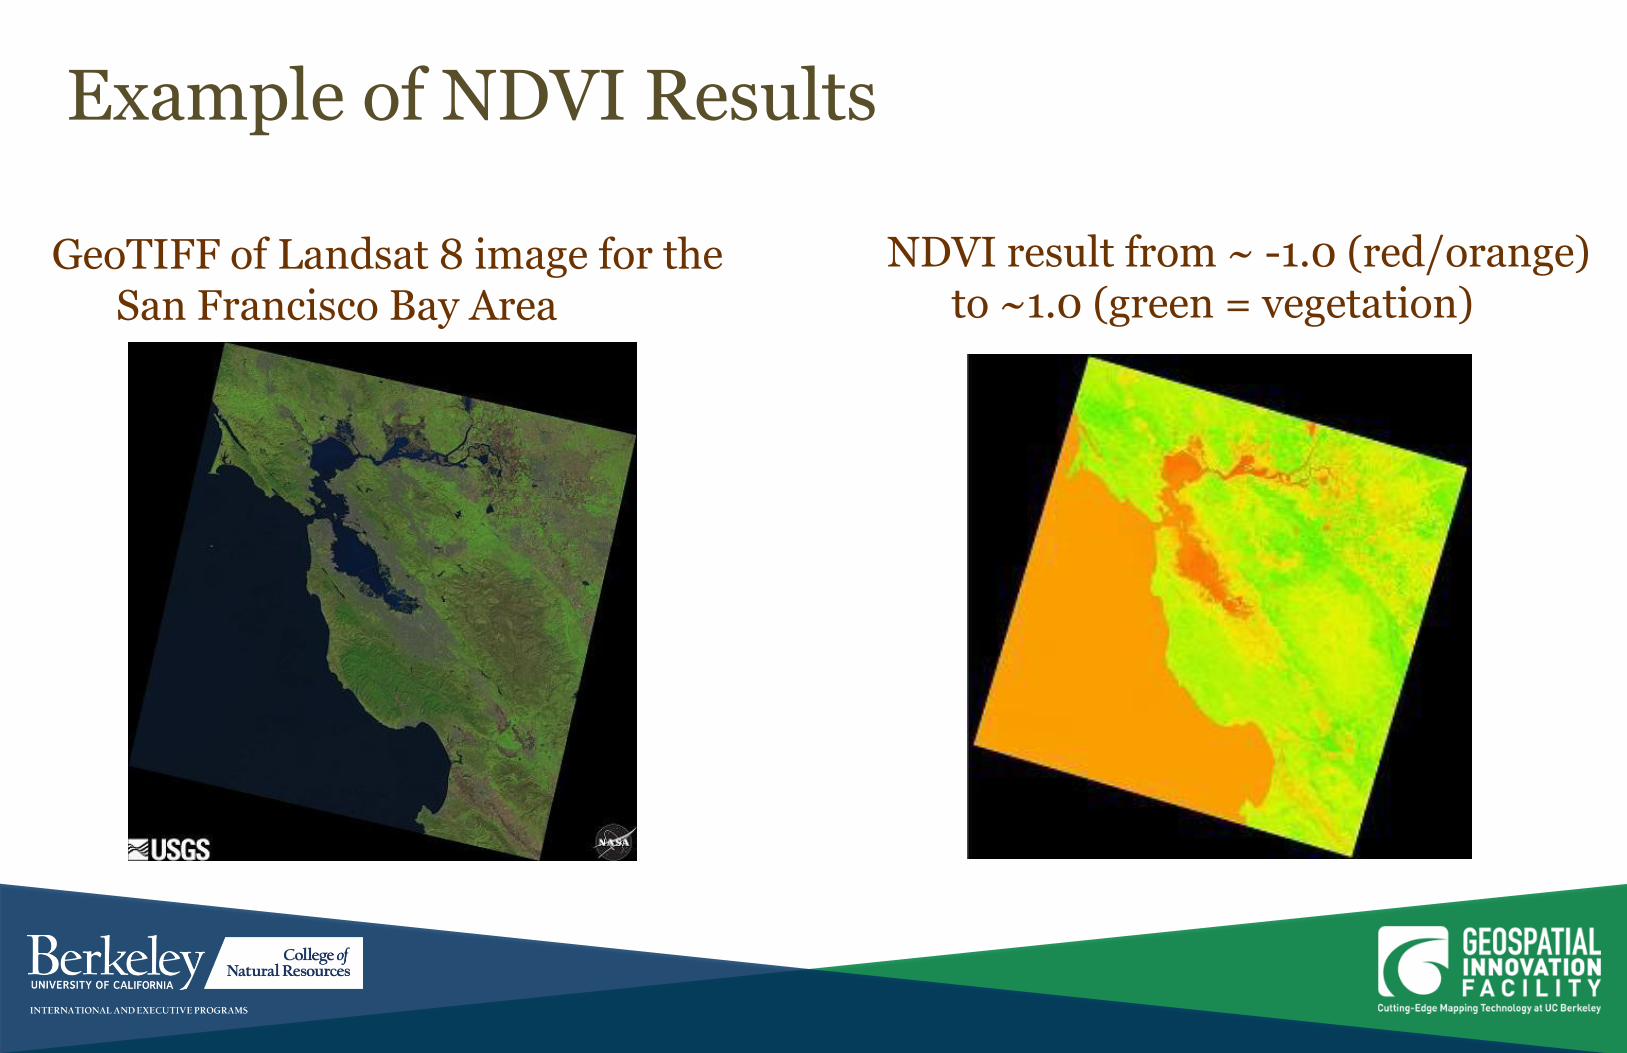
Example of NDVI Results
GeoTIFF of Landsat 8 image for the San Francisco Bay Area
NDVI result from ~ -1.0 (red/orange) to ~1.0 (green = vegetation)
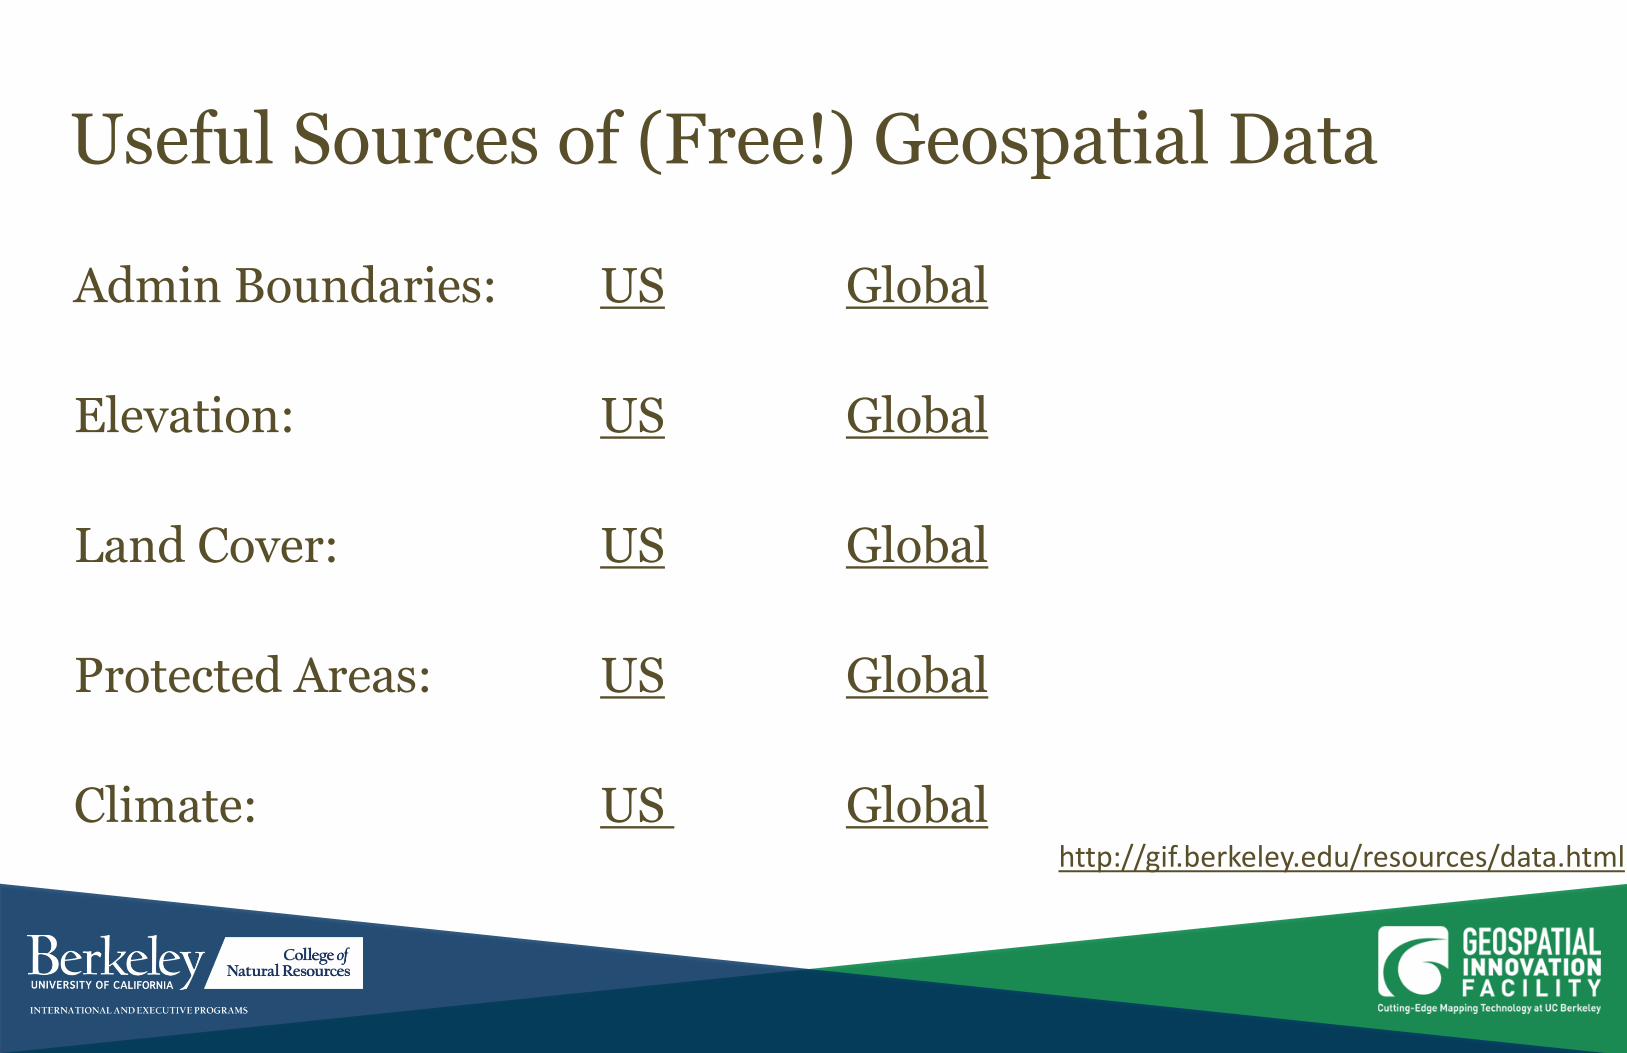
Useful Sources of (Free!) Geospatial Data
Admin Boundaries: US Global
Elevation: US Global
Land Cover: US Global
Protected Areas: US Global
Climate: US Global
http://gif.berkeley.edu/resources/data.html
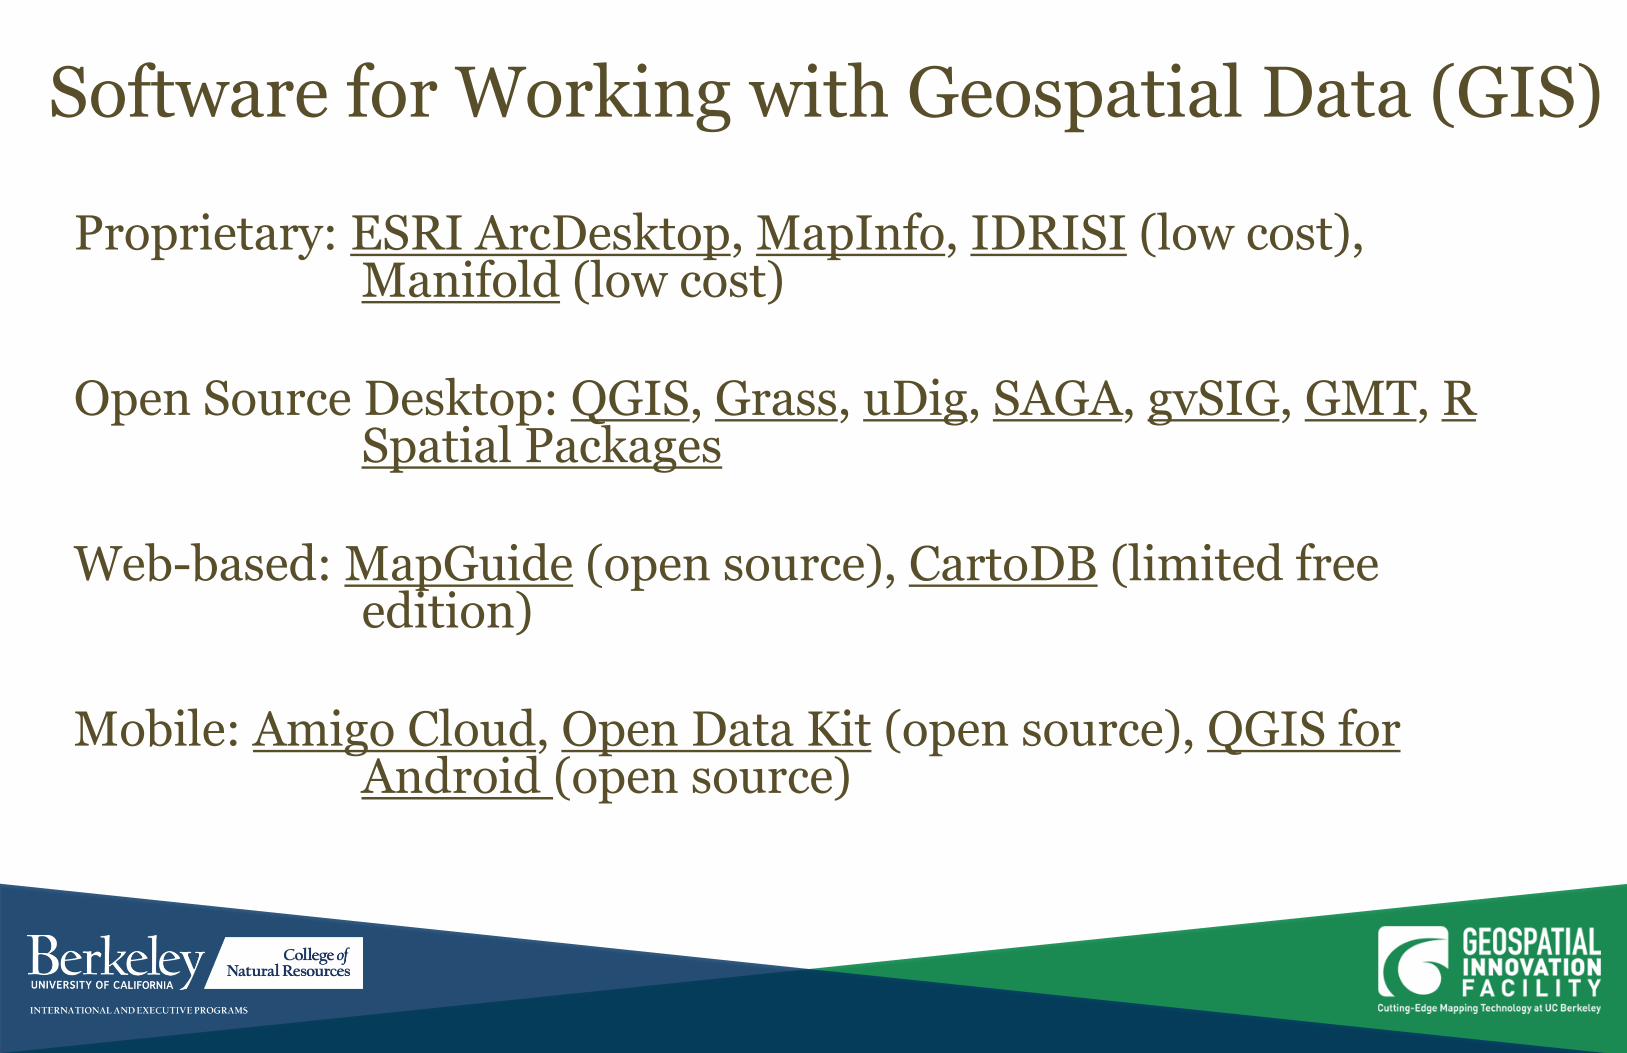
Software for Working with Geospatial Data (GIS)
Proprietary: ESRI ArcDesktop, MapInfo, IDRISI (low cost), Manifold (low cost)
Open Source Desktop: QGIS, Grass, uDig, SAGA, gvSIG, GMT, R
Spatial Packages Web-based: MapGuide (open source), CartoDB (limited free
edition) Mobile: Amigo Cloud, Open Data Kit (open source), QGIS for
Android (open source)
ArcMap Demonstration – Exploring the 10 mile buffer surrounding
National Parks in California

Software for Working with Geospatial Data (Remote Sensing)
Proprietary: ENVI, ERDAS Imagine, PCI Geomatica, IDRISI, ESRI ArcDesktop
Open Source Remote Sensing Tools: Orfeo Toolbox, Grass, R, SAGA, QGIS, Opticks, OSSIM, ILWIS, Python packages (Rasterio, scikit-learn, scikit-image )
Free (but not open source) Remote Sensing Tools:
– Object-based image analysis: Spring
– Web-based: Google Earth Engine (currently free to Trusted Testers)
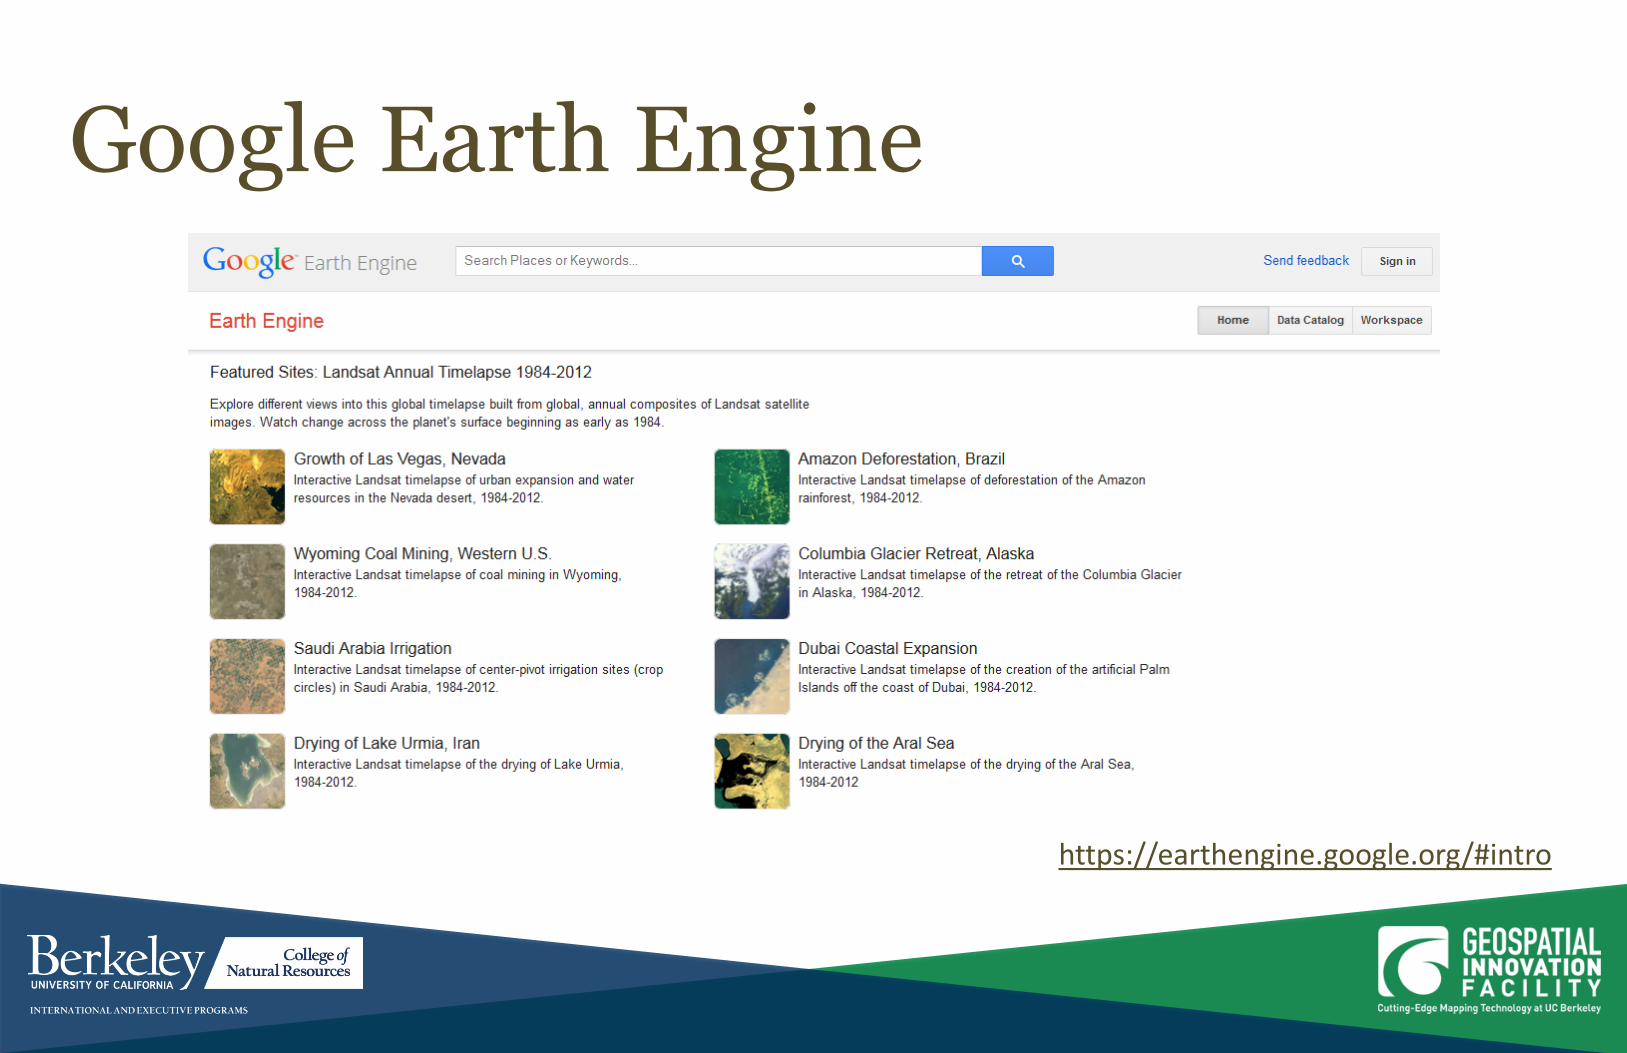
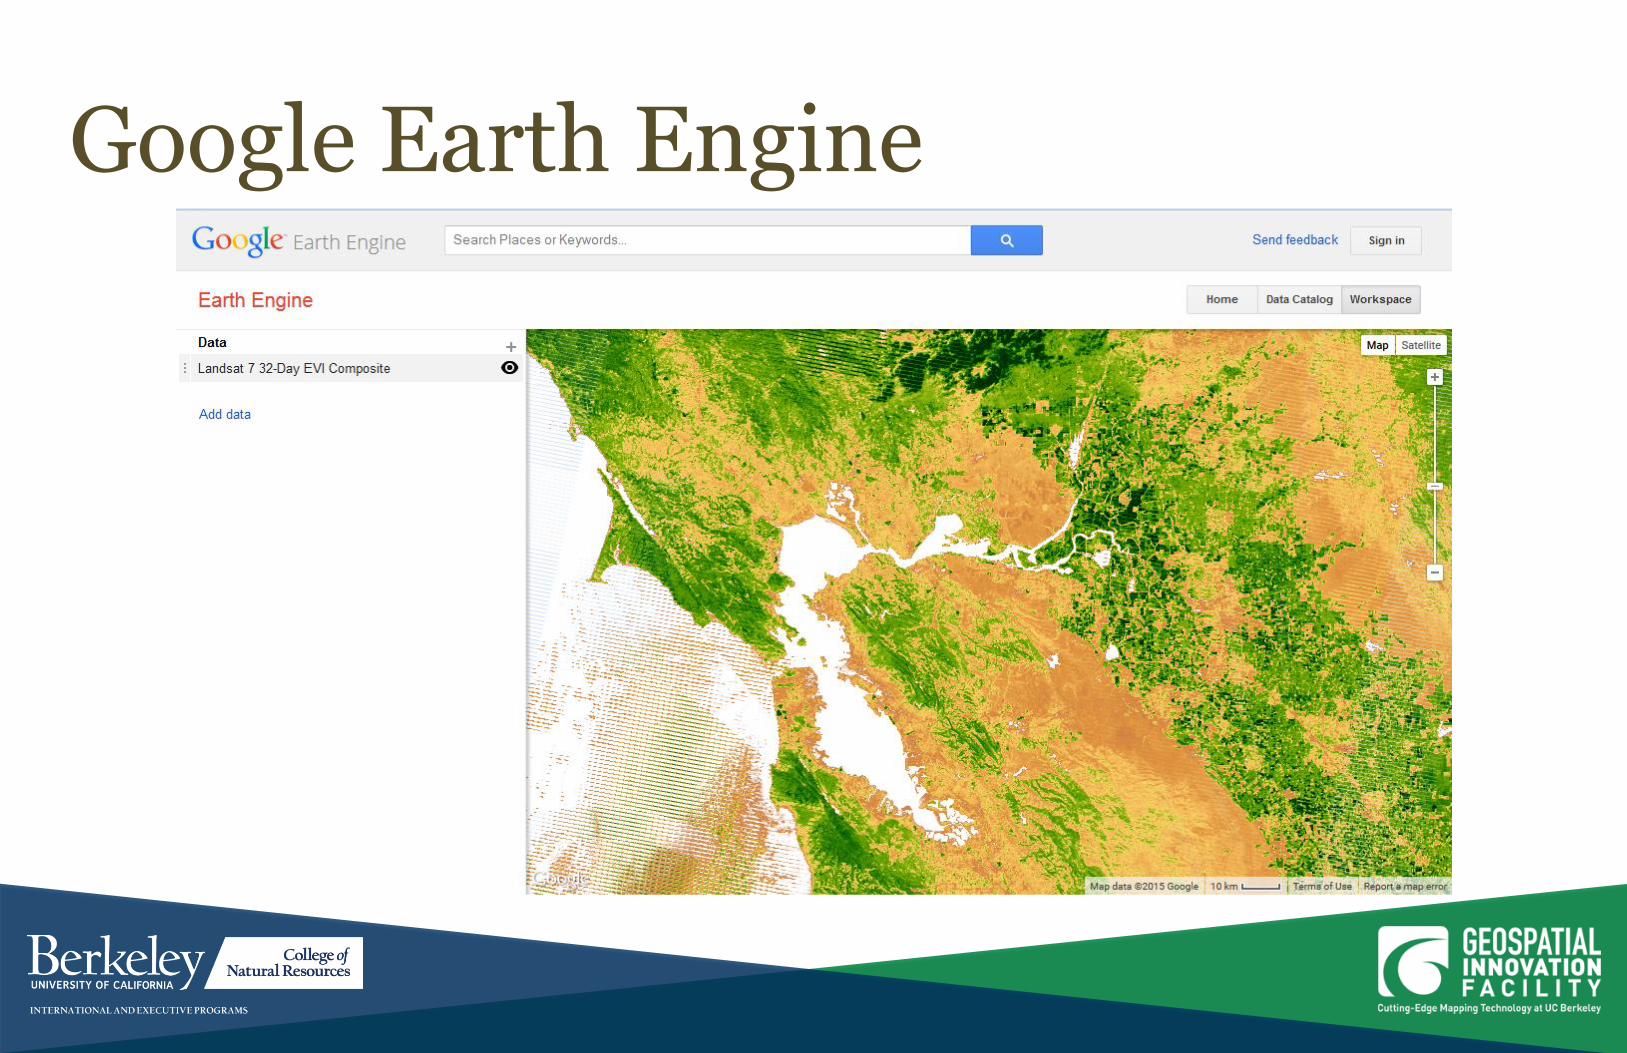
Google Earth Engine

Free & Open Source Software in 2012
Steiniger and Hunter, 2013. Computers, Environment and Urban Systems, 39: 136-150
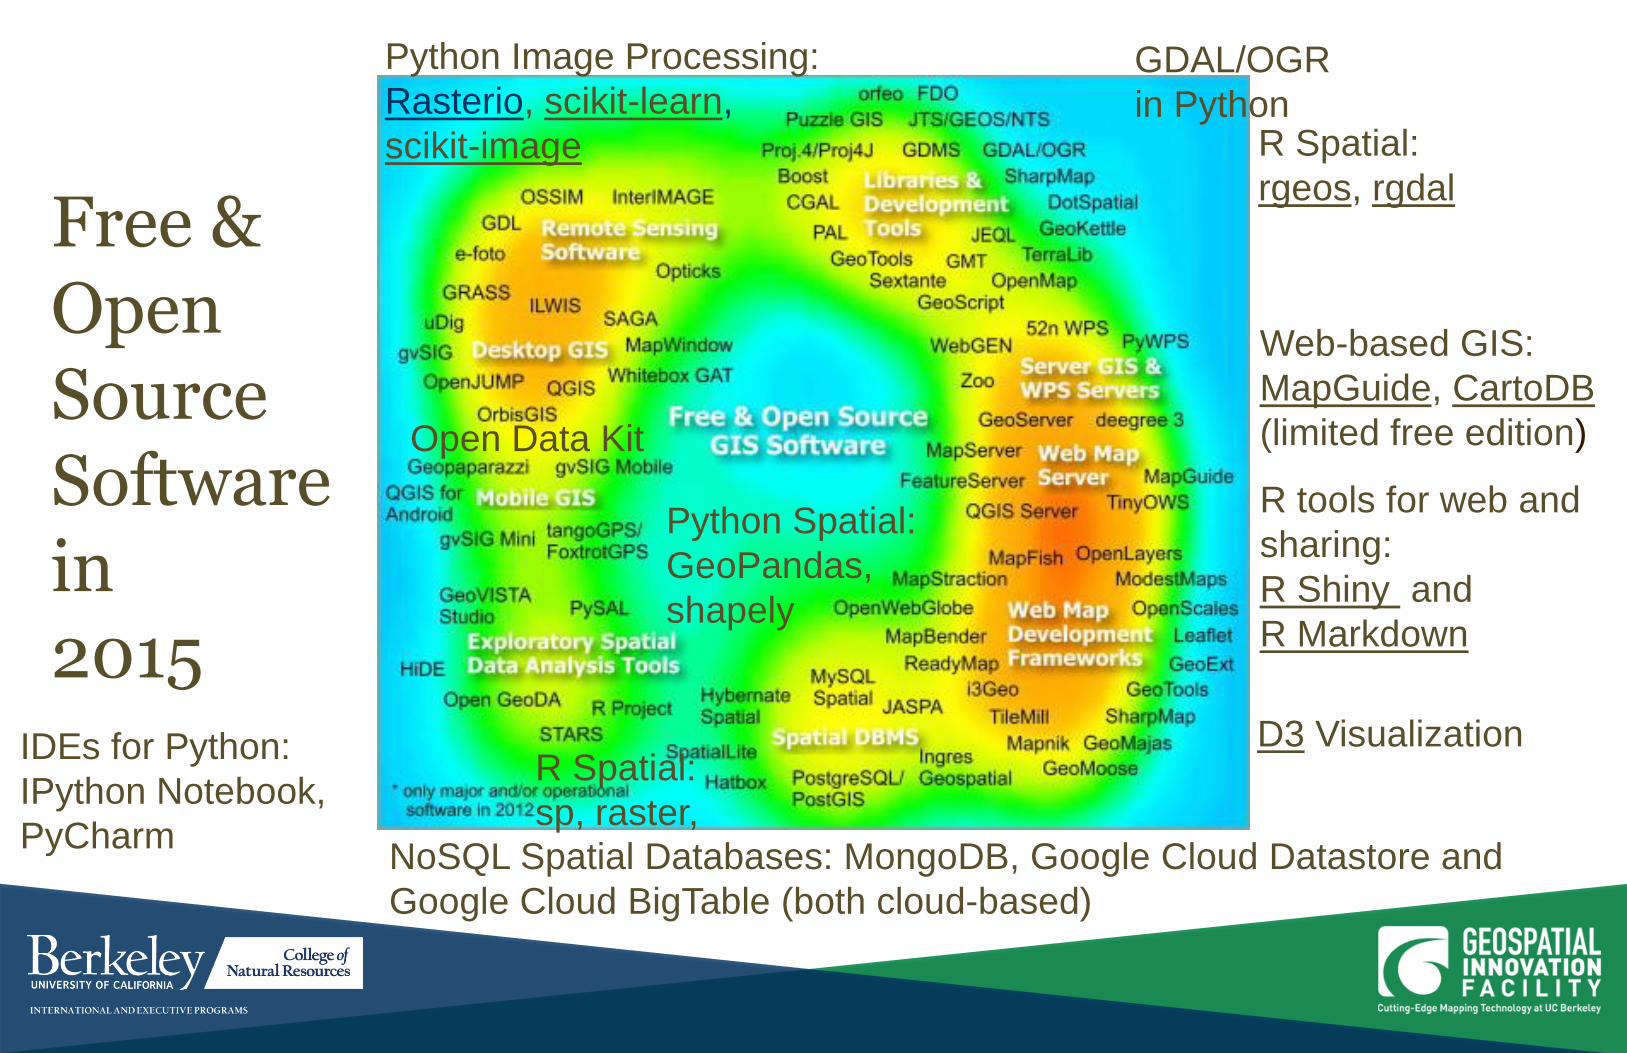
D3 Visualization
R tools for web and
sharing:
R Shiny and
R Markdown
NoSQL Spatial Databases: MongoDB, Google Cloud Datastore and
Google Cloud BigTable (both cloud-based)
Open Data Kit
IDEs for Python:
IPython Notebook,
PyCharm
Web-based GIS:
MapGuide, CartoDB
(limited free edition)
Python Spatial:
GeoPandas,
shapely
Python Image Processing:
Rasterio, scikit-learn,
scikit-image
R Spatial:
sp, raster,
R Spatial:
rgeos, rgdal
GDAL/OGR
in Python
Free & Open Source Software in 2015

Easy (Free!) Web-based Options for Sharing Geospatial Data
CartoDB (limited free edition): example 1 example 2
Google Maps API and Fusion Tables
ArcGIS Online and ArcGIS Open Data
(both open to non-ESRI license holders)
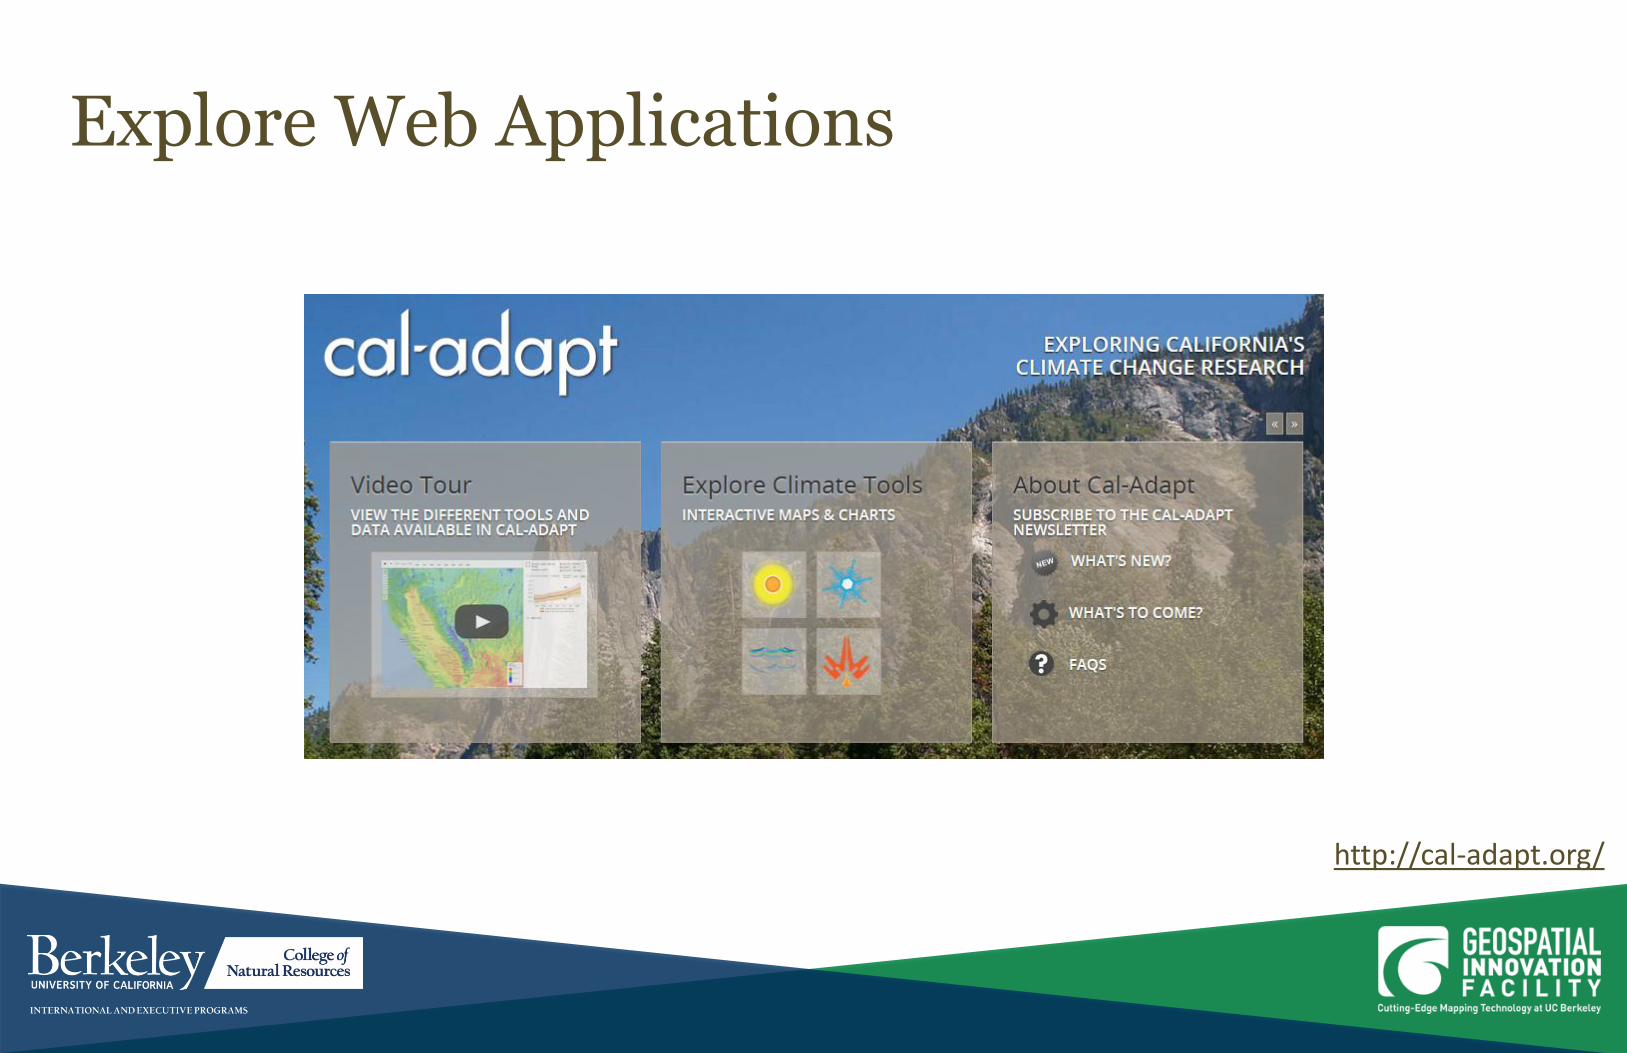
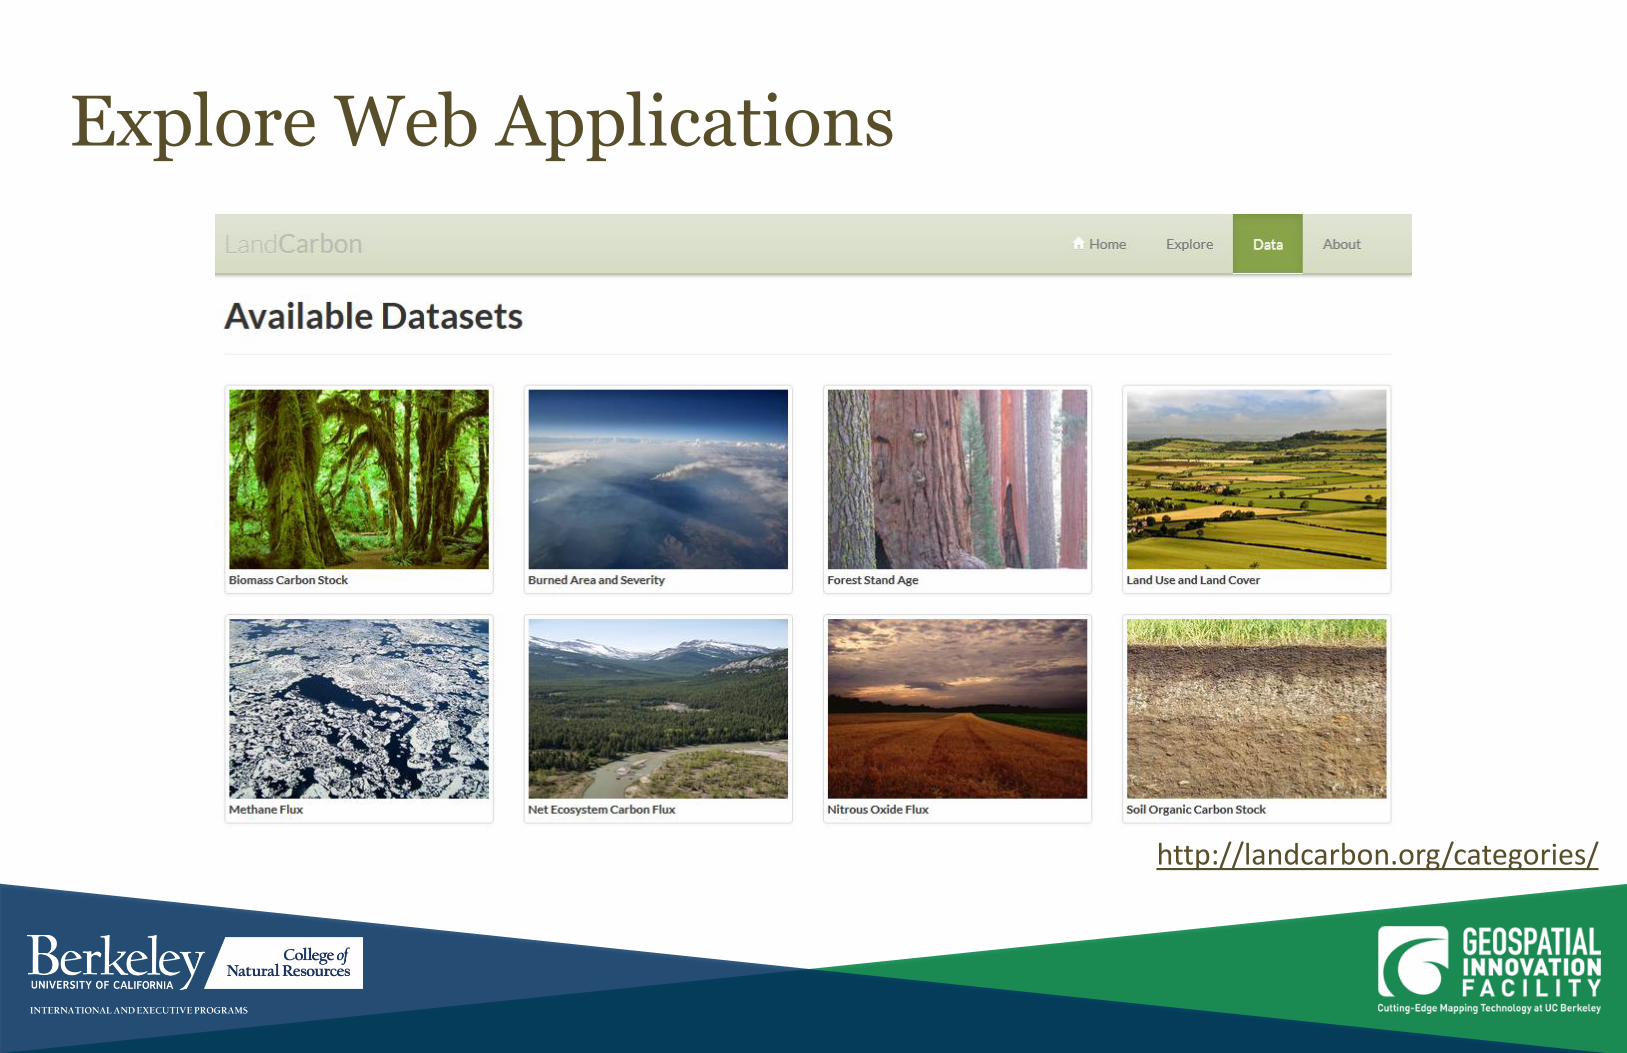
Explore Web Applications
http://cal-adapt.org/


Discussion
How might spatial patterns play a role in your area of interest?
What kinds of spatial analysis would be useful to explore spatial patterns in your area of interest?
Based on the web applications you explored, what ideas do you have for sharing datasets and maps?
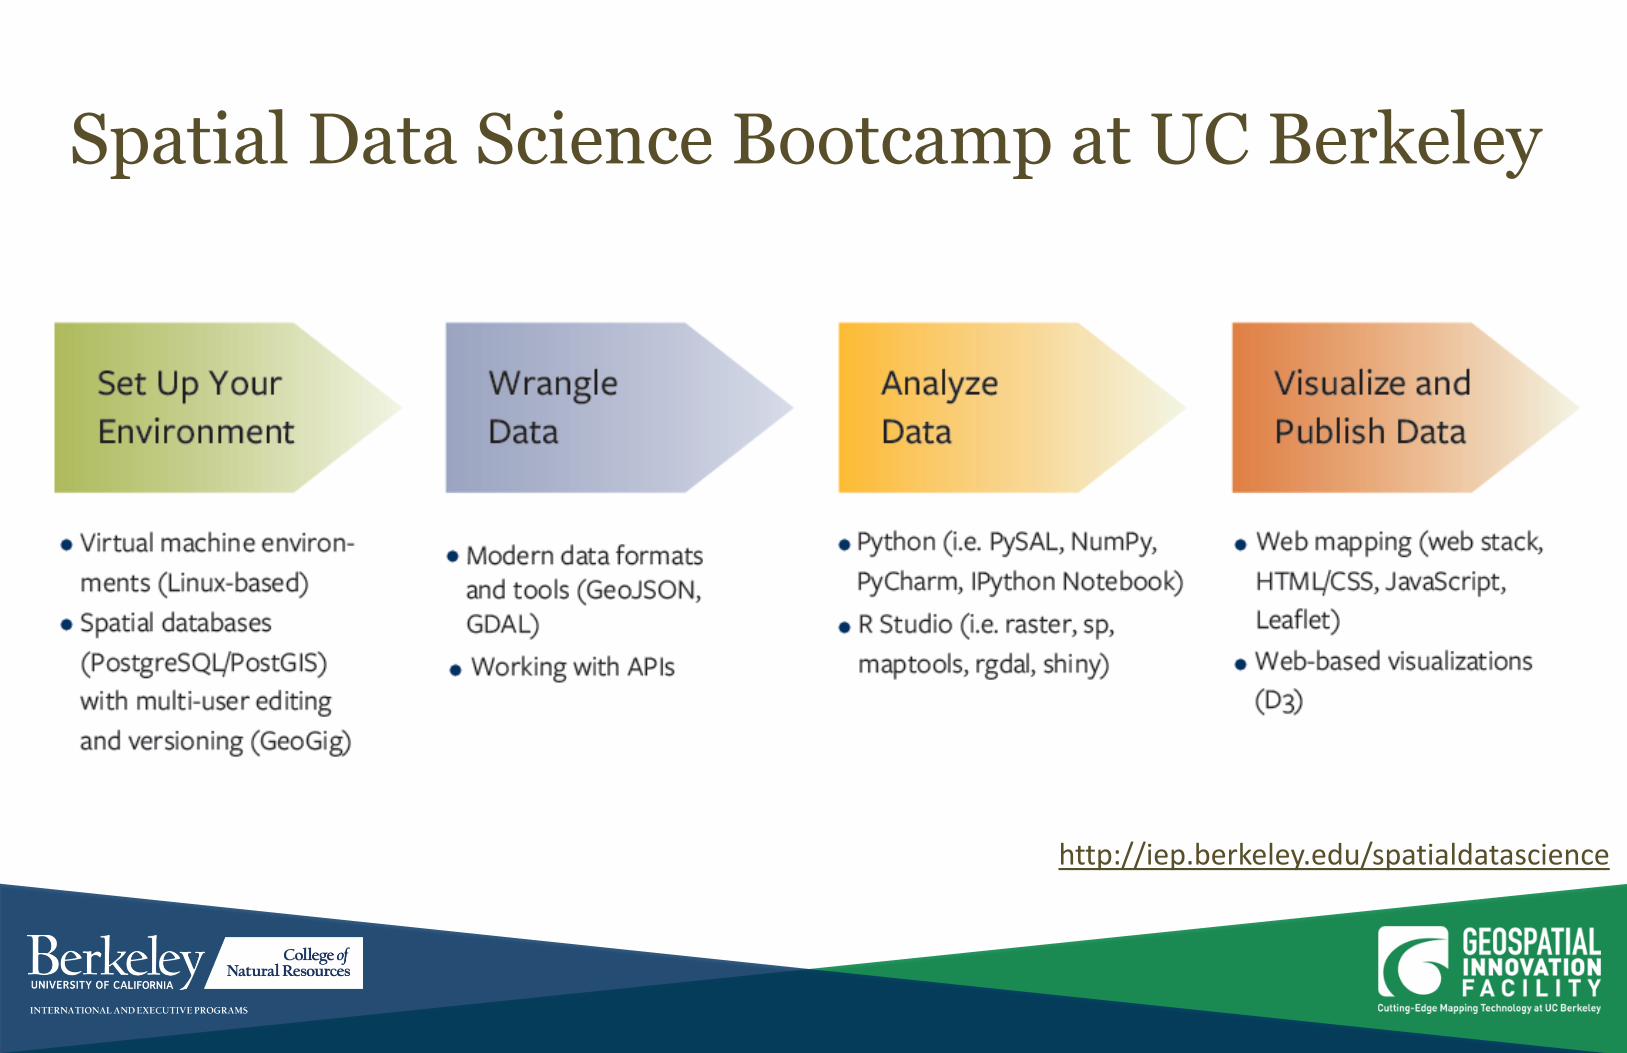
Spatial Data Science Bootcamp at UC Berkeley
http://iep.berkeley.edu/spatialdatascience