introduction to data stephanie o’malley visualization ... · tableau public raw. visual weight...
TRANSCRIPT

Introduction to Data Visualization
Marci BrandenburgJustin Joque
Stephanie O’Malley

Outline❖ Visualization Landscape❖ Design Principles❖ Interpretation❖ Campus Resources


What is Visualization?
“The action or fact of visualizing; the power or process of forming a mental picture or vision
of something not actually present to the sight; a picture thus formed.”
-Oxford English Dictionary
"visualization, n." OED Online. Oxford University Press, June 2016. Web. 27 June 2016.
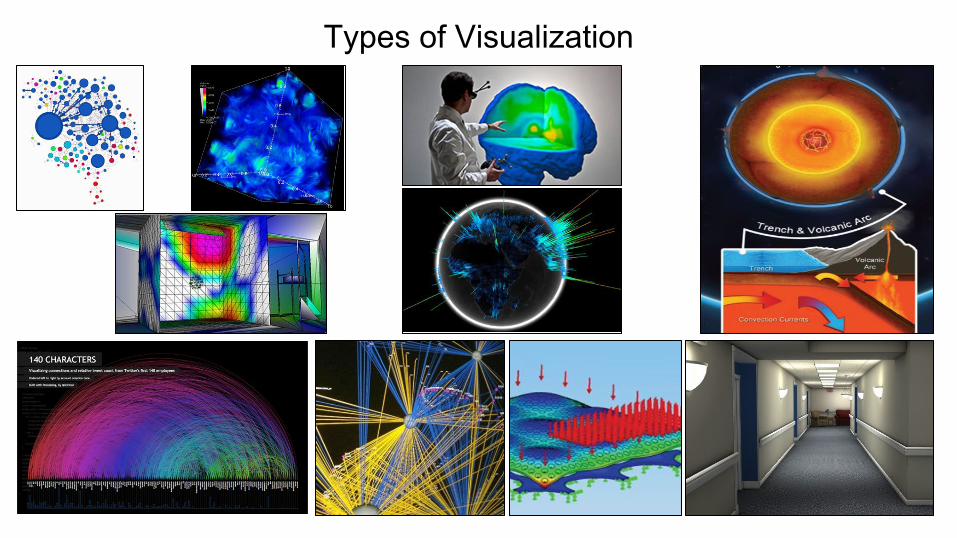
Types of Visualization

Anatomage. Web. 28 July 2016. <http://medical.anatomage.com/medical-applications/medical-studies>

Map based example -
CholeraOutbreak
By John Snow
(not Gameof Thrones)
Snow, J. Snow on Cholera being a Reprint of Two Papers. London: Oxford University Press, 1936. Print.

http://www.albany.edu/museum/wwwmuseum/work/lombardi/images/lombardi1.jpg
“Mark Lombardi (1951-2000) draws on the major political and financial scandals of the day to create large-scale linear diagrams that at first glance look like celestial maps….”
-University Art Museum. University of Albany, State
University of New York.

Viégas F., Wattenberg, M. Hint.fm. Cambridge, Massachusetts. 2014. Web. 10 March 2014. <http://hint.fm/wind>

2D vs. 3D Visualization3D can untangle a graph: entire new dimension to place nodes.Need to think about if our visualization would really benefit from 3D.❖ Does it overcomplicate the visualization?
❖ Does the 3D graph provide more information to the viewer, or does it just look different?

Just because we can...
Andy Kirk. Data visualization: a successful design process. Birmingham: United Kingdom, 2012. eBook.
Data VisualizationData visualization deals with communicating information about an existing data set through a visual medium.
Goals
❖ Take advantage of the brain’s ability to efficiently process visuals. A high volume of information can often be easily understood through an image.
❖ Want the viewer to learn something about the data that could not be easily understood by reading the raw data.
❖ Visual is presented in a simple manner. Don’t overload the viewer with many unnecessary details.

Reasons for Visualization❖ Discovery❖ Hypothesis generation❖ Analysis❖ Representation of data for publication or presentation - communication

Common Software/Tools❖ Scripting Languages
➢ Python ➢ R➢ Javascript➢ PHP
❖ Network Visualization➢ Cytoscape➢ Gephi➢ Pajek
❖ Combination Packages➢ VisIt➢ Paraview
❖ Other➢ GIS➢ MatLab➢ NVivo➢ Omeka➢ D3 ➢ Three.js➢ Circos➢ Tableau Public➢ RAW


Visual WeightGuiding the Eye
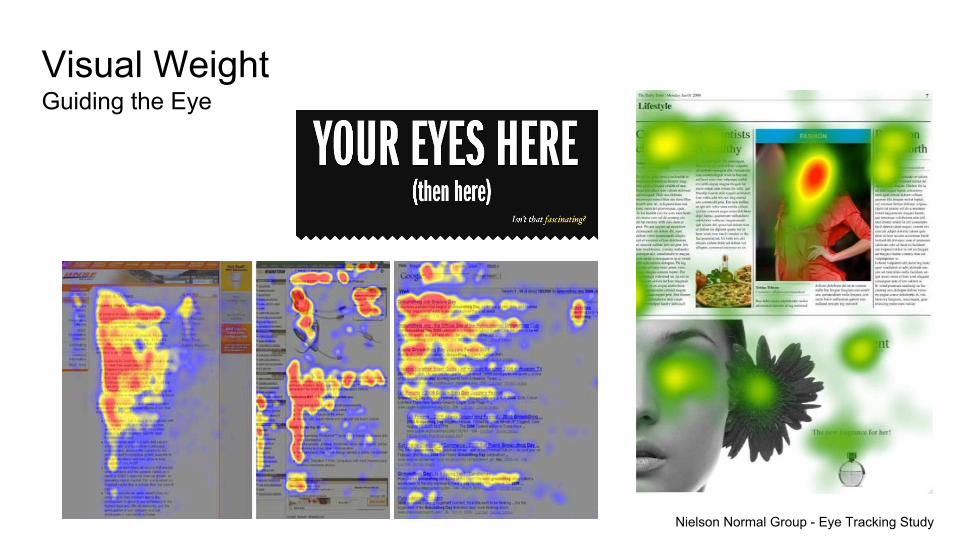
Nielson Normal Group - Eye Tracking Study
Visual WeightGuiding the Eye

Visual WeightGuiding the Eye - Size & Shape

Visual WeightGuiding the Eye - Size & Shape

ColorValue & Hue

ColorContrast


Visual Assumptions

Visual Assumptions

ColorColor Schemes


Show me the Data

Anscombe’s Quartet
https://en.wikipedia.org/wiki/Anscombe%27s_quartet

Query using Facebook API• Node-link diagram
Kandel, Heer, Plaisant, et al. (2011)http://dx.doi.org/10.1177/1473871611415994

Kandel, Heer, Plaisant, et al. (2011)http://dx.doi.org/10.1177/1473871611415994
Query using Facebook API• Node-link diagram• Matrix display,
API return order
5000-item result limitSilent failure


Reasons for Visualization (Redux)❖ Discovery❖ Hypothesis generation❖ Analysis❖ Representation of data for publication or presentation - communication

Danger, Will Robinson
Vigen T. Spurious Correlations. Cambridge, Massachusetts. 2015. Web. 10 March 2014. <http://www.tylervigen.com/view_correlation?id=1703>


Library
❖ Taubman Health Sciences Library➢ Anatomage Table➢ Cytoscape➢ Health-related visualization
❖ Clark Library (Hatcher Library)➢ Maps, government information, and spatial and numeric data services➢ Manipulation of diverse types of data
❖ UM3D Lab (Duderstadt Center)➢ 3-D visualization via a variety of methods
❖ Library Data Visualization Webpage: http://www.lib.umich.edu/data-visualization
❖ Library Data Visualization E-Mail Group: [email protected]

Campus
❖ Advanced Research Computing (ARC)➢ Computational science, data science, technology services, statistics consultation➢ High performance computing
❖ Michigan Multimedia (M3)➢ Build websites➢ Specialize in web strategy and graphic design
❖ 3D Imaging Laboratory (Department of Radiology)➢ Provide clinically relevant visualization and analysis of medical imaging data
❖ Microscopy & Image Analysis Laboratory (part of BRCF)➢ Equipment for microscopic imaging, including fluorescence microscopy, & scanning and
transmission electron microscopy