introduction to data science · introduction to data science john p dickerson lecture #11...
TRANSCRIPT

INTRODUCTION TODATA SCIENCEJOHN P DICKERSON
Lecture #11 – 10/1/2019
CMSC320Tuesdays & Thursdays5:00pm – 6:15pm

ANNOUNCEMENTS
2
Mini-Project #2 is out!• It is linked to from ELMS; also available at:
https://github.com/cmsc320/fall2019/tree/master/project2
• Deliverable is a .ipynb file submitted to ELMS
• Due Wednesday, October 16th

ANNOUNCEMENTS
Please use this time to think about the final tutorial!• Short refresher on the coming slides
• You’re welcome to come to the lecture hall, meet potential groupmates, brainstorm potential ideas, etc.
• Also, make use of Piazza!
3
NO FORMAL LECTURE THIS THURSDAY(I will be at the Simons Institute for the Theory of Computing)
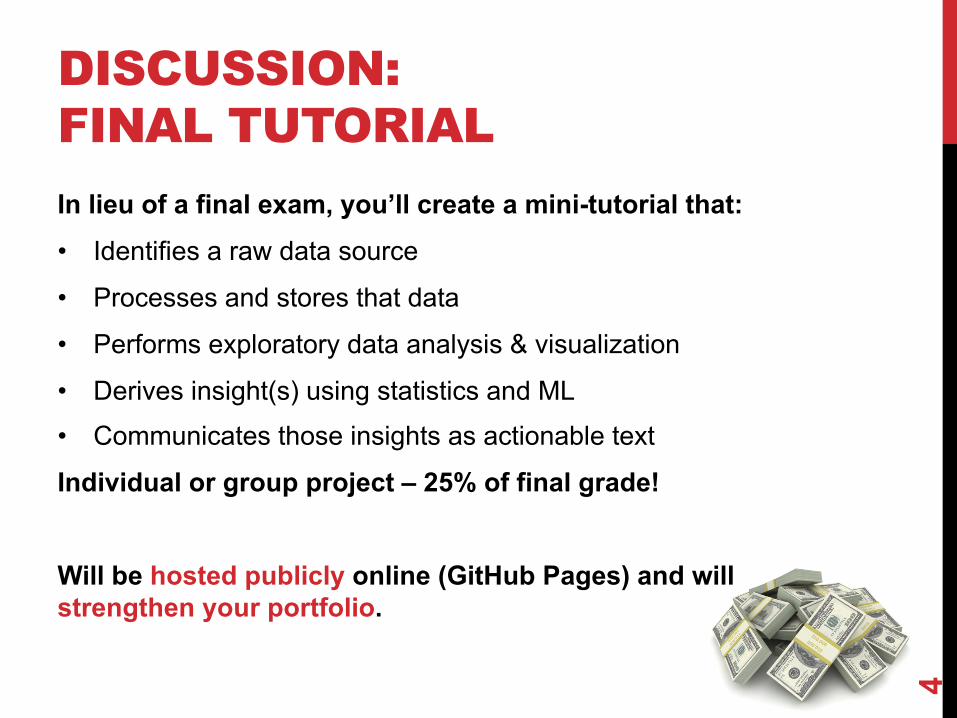
DISCUSSION: FINAL TUTORIALIn lieu of a final exam, you’ll create a mini-tutorial that:• Identifies a raw data source
• Processes and stores that data
• Performs exploratory data analysis & visualization
• Derives insight(s) using statistics and ML• Communicates those insights as actionable text
Individual or group project – 25% of final grade!
Will be hosted publicly online (GitHub Pages) and will strengthen your portfolio.
4
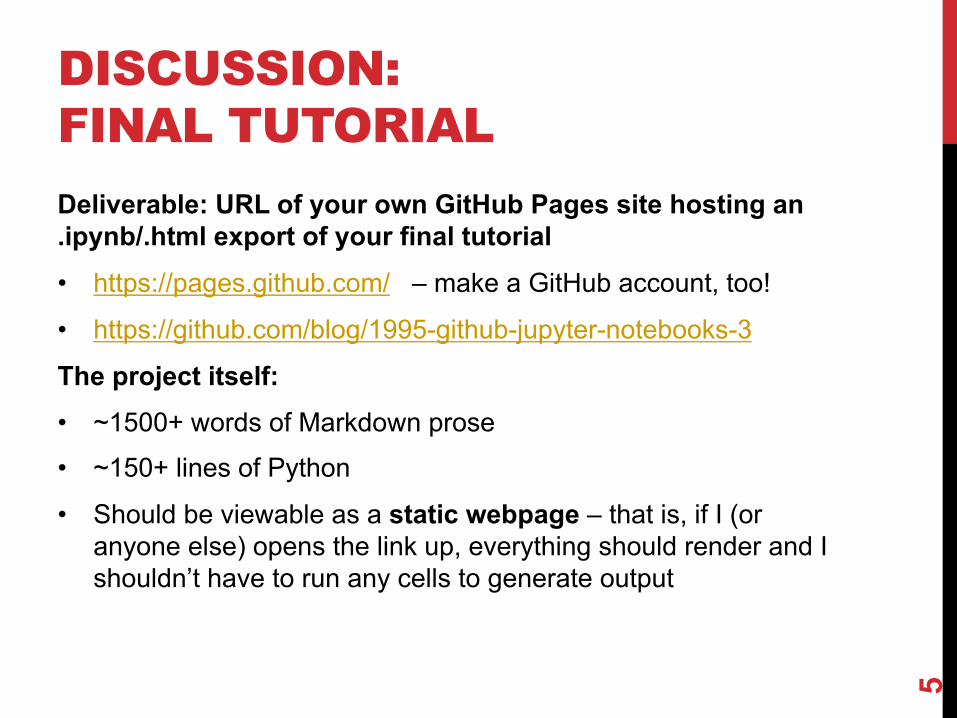
DISCUSSION:FINAL TUTORIALDeliverable: URL of your own GitHub Pages site hosting an .ipynb/.html export of your final tutorial• https://pages.github.com/ – make a GitHub account, too!
• https://github.com/blog/1995-github-jupyter-notebooks-3
The project itself:• ~1500+ words of Markdown prose• ~150+ lines of Python
• Should be viewable as a static webpage – that is, if I (or anyone else) opens the link up, everything should render and I shouldn’t have to run any cells to generate output
5

AND NOW!Graph Processing• Representing graphs
• Centrality measures
• Community detection
Natural Language Processing• Bag of Words, TF-IDF, N-grams
• (If we get to this today …)
Thank you to: Sukumar Ghosh (Iowa), Lei Tang (Yahoo!), Huan Liu (ASU), Zico Kolter (CMU)
6
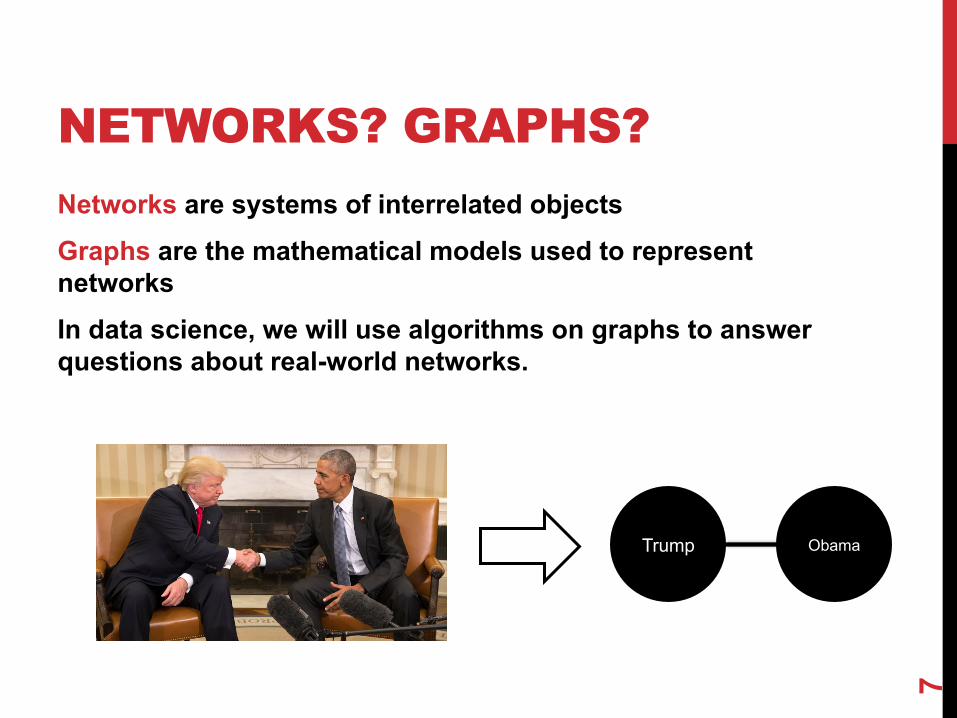
NETWORKS? GRAPHS?Networks are systems of interrelated objectsGraphs are the mathematical models used to represent networksIn data science, we will use algorithms on graphs to answer questions about real-world networks.
7
Trump Obama

GRAPHSA graph G = (V,E) is a set of vertices V and edges EEdges can be undirected or directed
8
C
B D
A
V = {A, B, C, D}E = {(A,B), (B,C), (C,D), (A,C)}
C
B D
A
V = {A, B, C, D}E = {(A,C), (C,A), (B,C), (B,D)}
Examples of directed vs undirected graphs ????????????
Nodes = VerticesEdges = Arcs
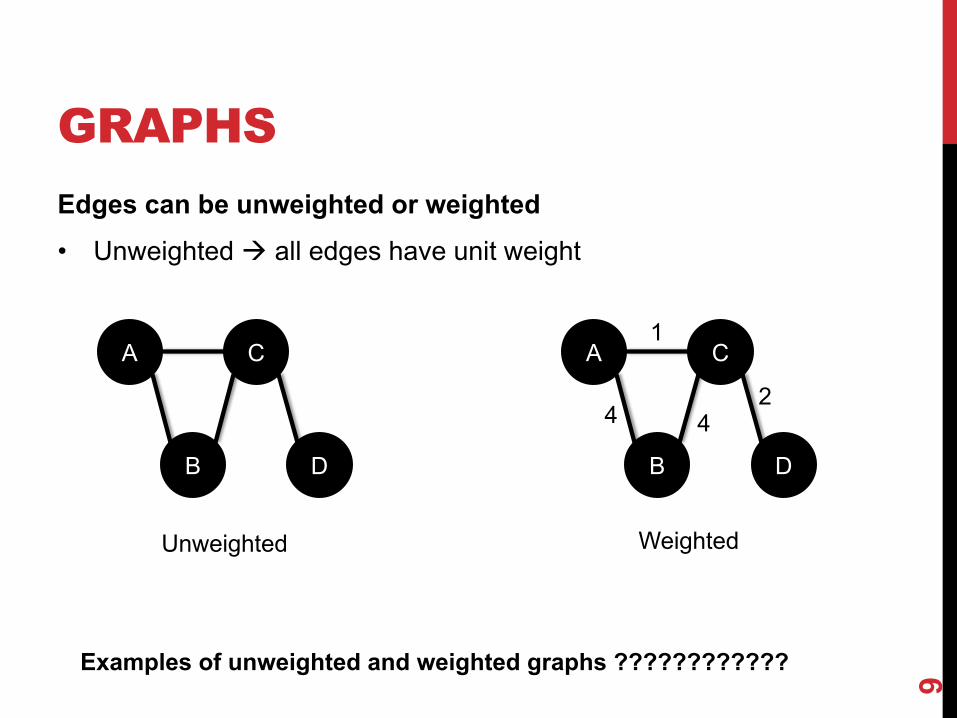
GRAPHSEdges can be unweighted or weighted• Unweighted à all edges have unit weight
9
C
B D
A C
B D
A
Unweighted Weighted
1
244
Examples of unweighted and weighted graphs ????????????
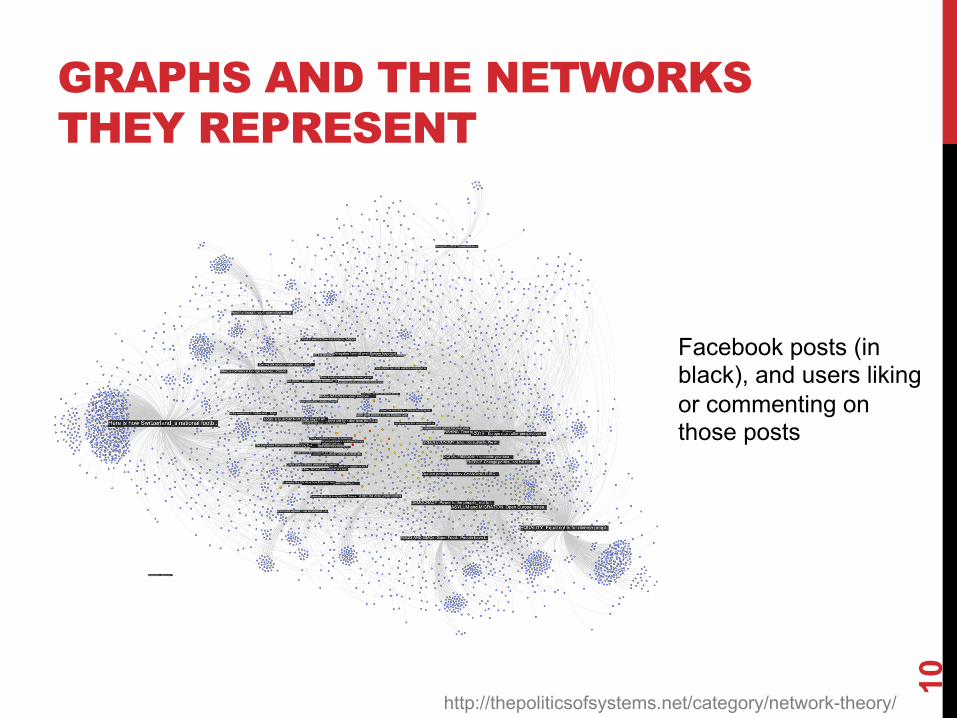
GRAPHS AND THE NETWORKS THEY REPRESENT
10
http://thepoliticsofsystems.net/category/network-theory/
Facebook posts (in black), and users liking or commenting on those posts
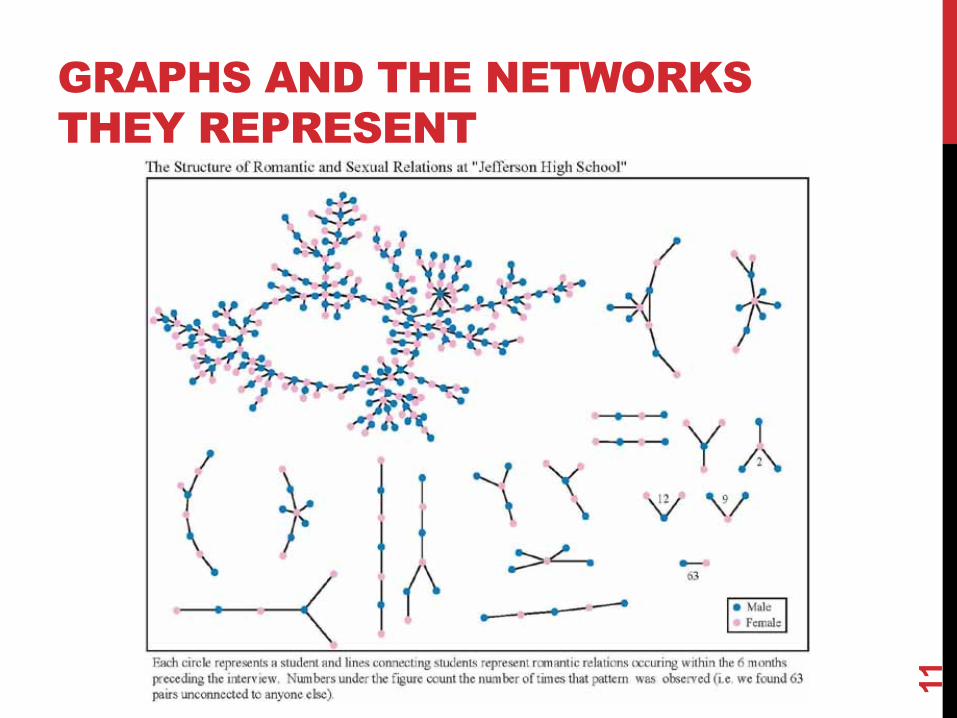
GRAPHS AND THE NETWORKS THEY REPRESENT
11
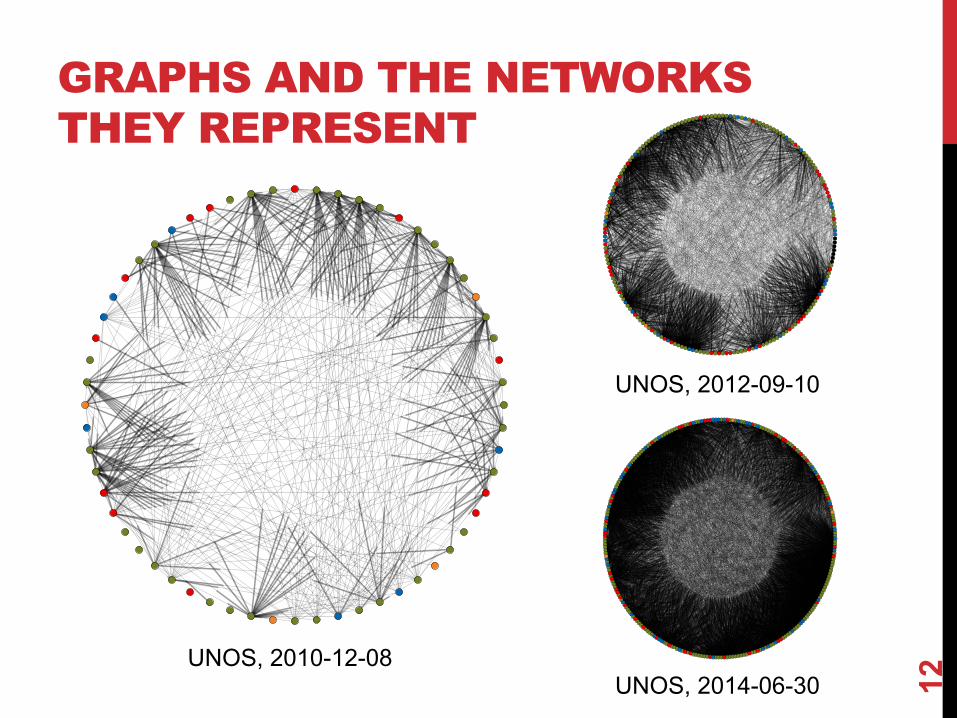
GRAPHS AND THE NETWORKS THEY REPRESENT
12
UNOS, 2010-12-08
UNOS, 2012-09-10
UNOS, 2014-06-30

NETWORKXNetworkX is a Python library for storing, manipulating, and analyzing (small- and medium-sized) graphs• Uses Matplotlib for rendering
• https://networkx.github.io/
• conda install -c anaconda networkx
13
import networkx as nx
G=nx.Graph()G.add_node("spam”)G.add_edge(1,2)
print(list(G.nodes()))print(list(G.edges())) [(1, 2)
[1, 2, ‘spam’][(1,2)]

STORING A GRAPHThree main ways to represent a graph in memory:• Adjacency lists• Adjacency dictionaries• Adjacency matrix
The storage decision should be made based on the expected use case of your graph:• Static analysis only?• Frequent updates to the structure?• Frequent updates to semantic information?
14
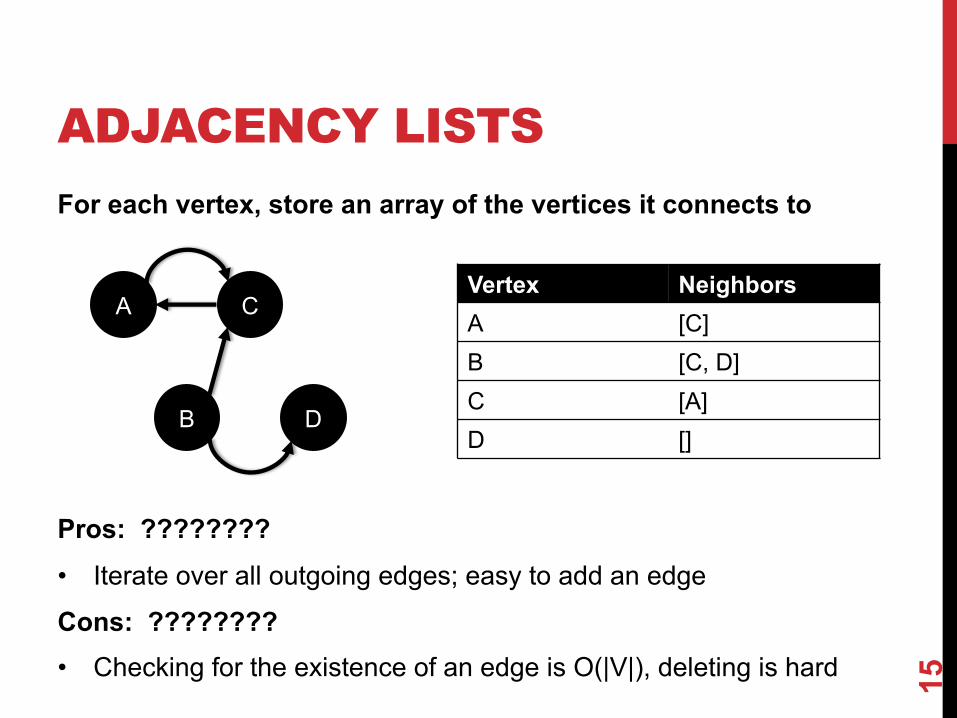
ADJACENCY LISTSFor each vertex, store an array of the vertices it connects to
Pros: ????????• Iterate over all outgoing edges; easy to add an edge
Cons: ????????• Checking for the existence of an edge is O(|V|), deleting is hard 15
C
B D
AVertex NeighborsA [C]B [C, D]C [A]D []
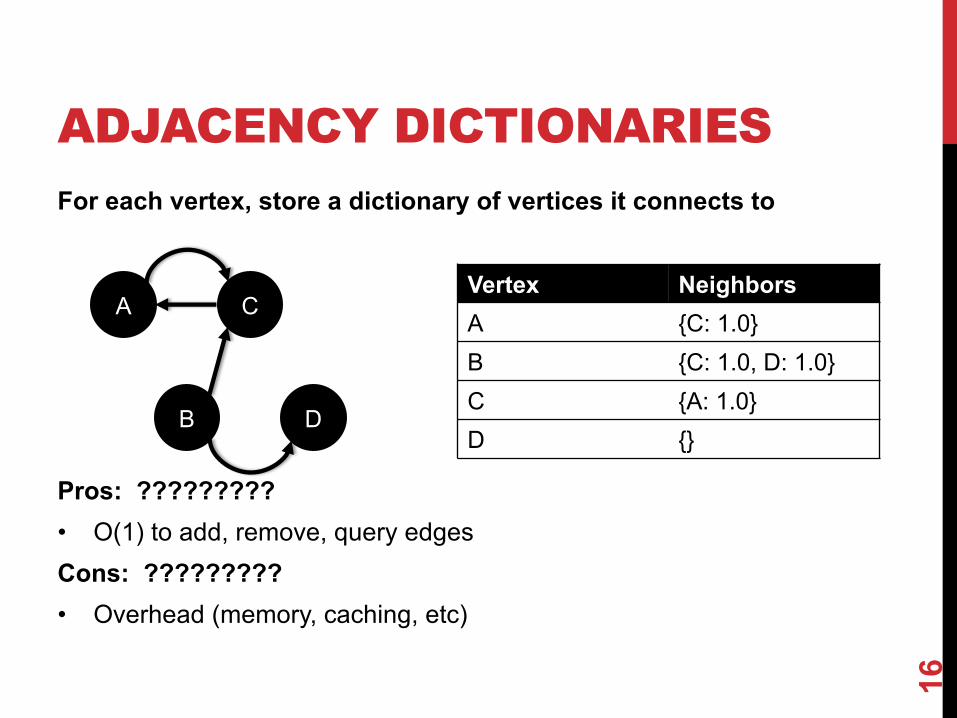
ADJACENCY DICTIONARIESFor each vertex, store a dictionary of vertices it connects to
Pros: ?????????• O(1) to add, remove, query edges Cons: ?????????• Overhead (memory, caching, etc)
16
C
B D
AVertex NeighborsA {C: 1.0}B {C: 1.0, D: 1.0}C {A: 1.0}D {}
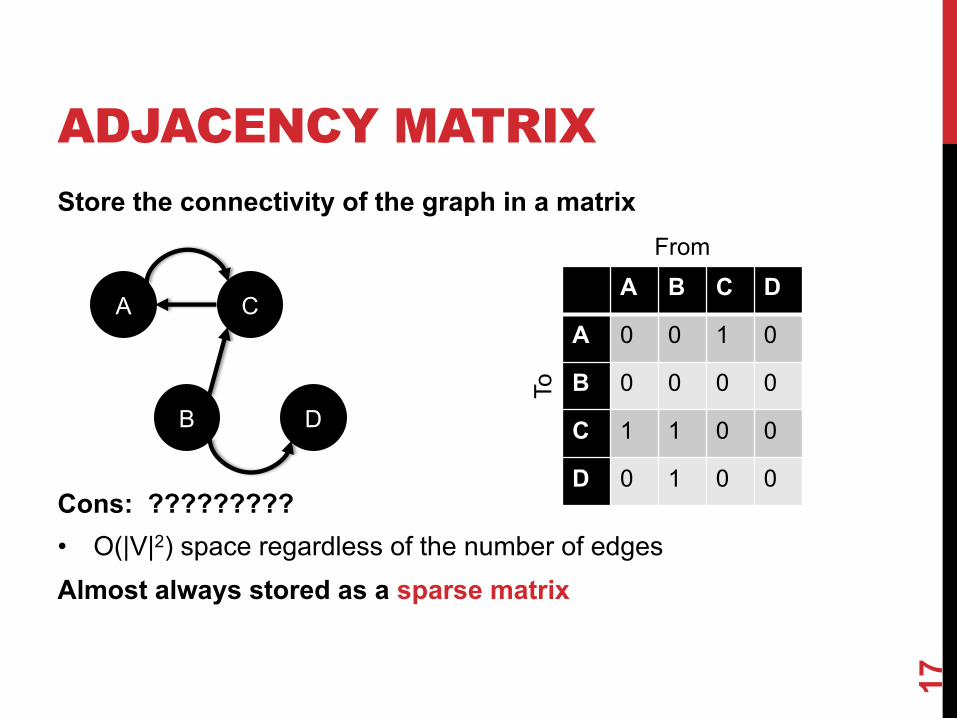
ADJACENCY MATRIXStore the connectivity of the graph in a matrix
Cons: ?????????• O(|V|2) space regardless of the number of edgesAlmost always stored as a sparse matrix
17
C
B D
AA B C D
A 0 0 1 0
B 0 0 0 0
C 1 1 0 0
D 0 1 0 0
From
To
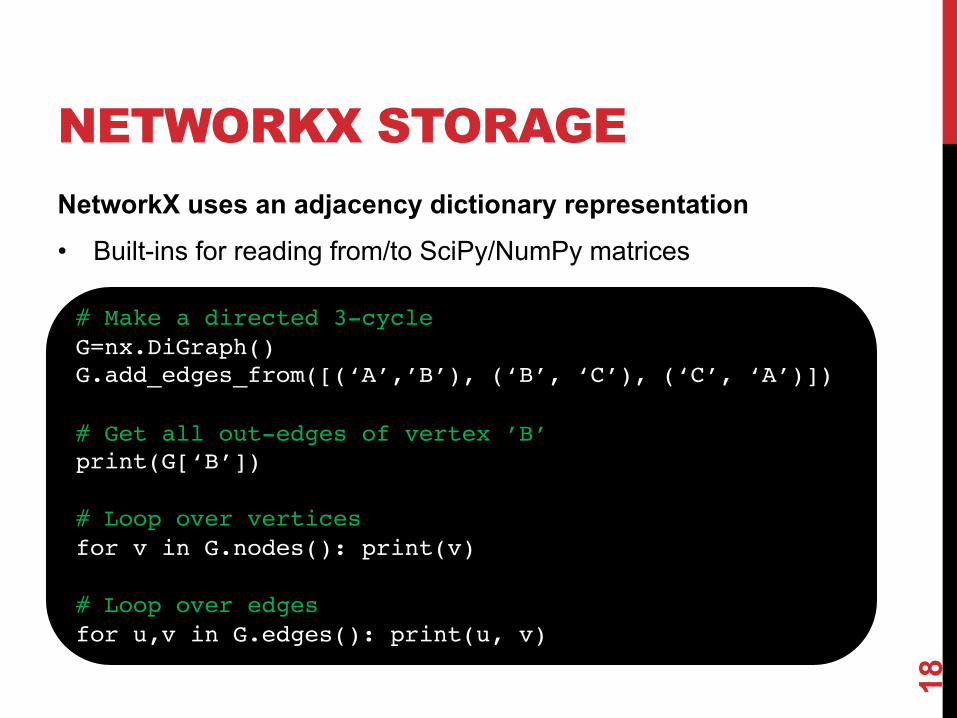
NETWORKX STORAGENetworkX uses an adjacency dictionary representation• Built-ins for reading from/to SciPy/NumPy matrices
18
# Make a directed 3-cycleG=nx.DiGraph()G.add_edges_from([(‘A’,’B’), (‘B’, ‘C’), (‘C’, ‘A’)])
# Get all out-edges of vertex ’B’print(G[‘B’])
# Loop over verticesfor v in G.nodes(): print(v)
# Loop over edgesfor u,v in G.edges(): print(u, v)

ASIDE: GRAPH DATABASESTraditional relational databases store relations between entities directly in the data (e.g., foreign keys)• Queries search data, JOIN over relations
Graph databases directly relate data in the storage system using edges (relations) with attached semantic properties
19Image thanks to Wikipedia
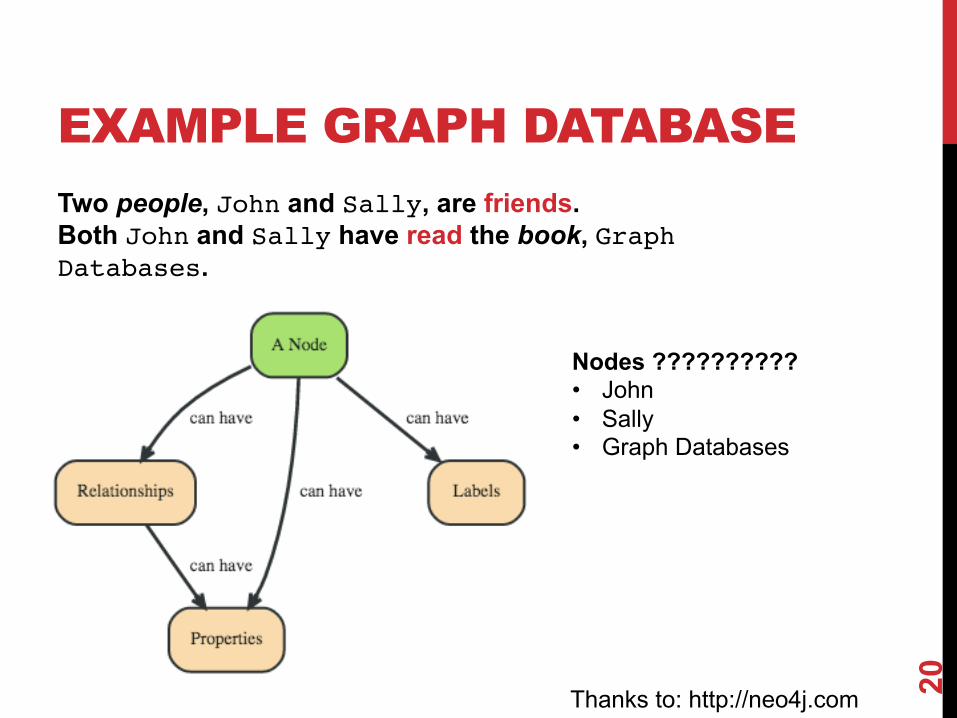
EXAMPLE GRAPH DATABASETwo people, John and Sally, are friends. Both John and Sally have read the book, Graph Databases.
20Thanks to: http://neo4j.com
Nodes ??????????• John• Sally• Graph Databases
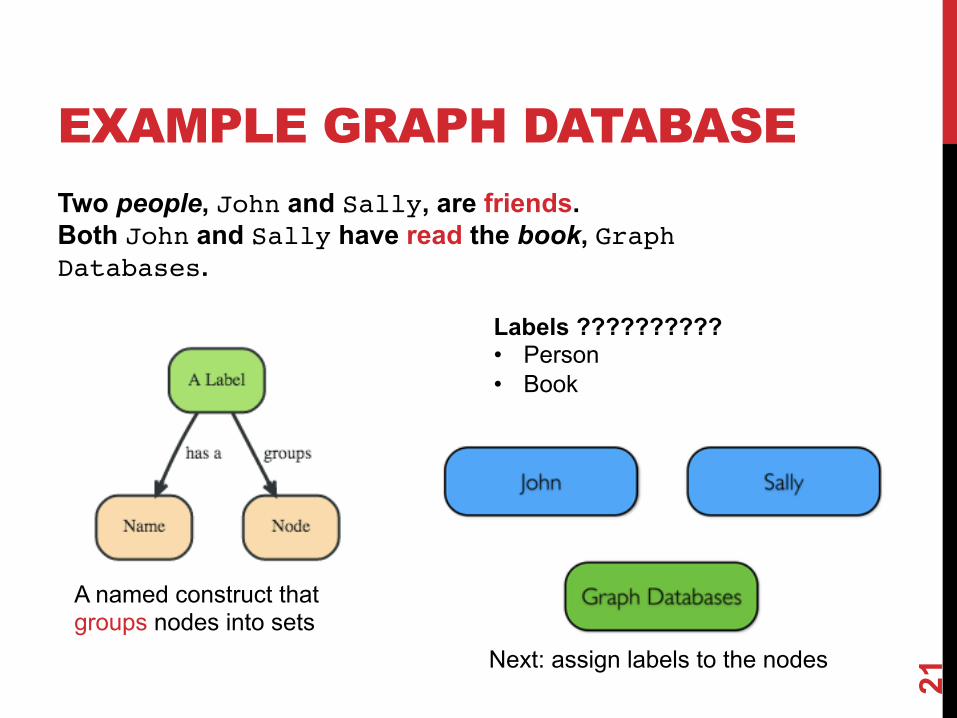
EXAMPLE GRAPH DATABASETwo people, John and Sally, are friends. Both John and Sally have read the book, Graph Databases.
21
Labels ??????????• Person• Book
A named construct that groups nodes into sets
Next: assign labels to the nodes
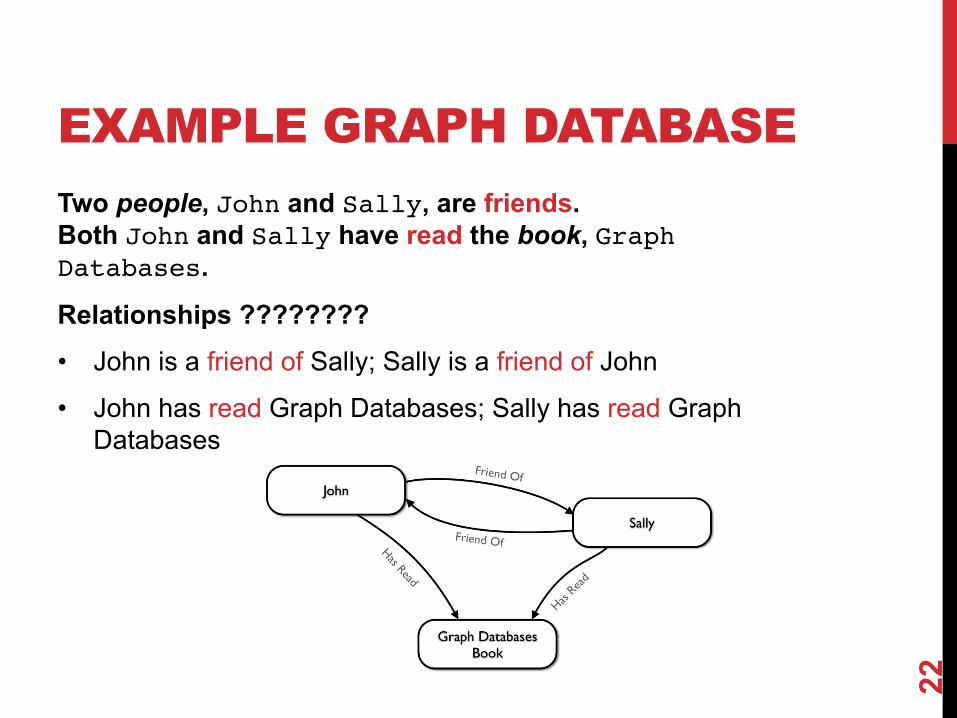
EXAMPLE GRAPH DATABASETwo people, John and Sally, are friends. Both John and Sally have read the book, Graph Databases.
Relationships ????????• John is a friend of Sally; Sally is a friend of John
• John has read Graph Databases; Sally has read Graph Databases
22
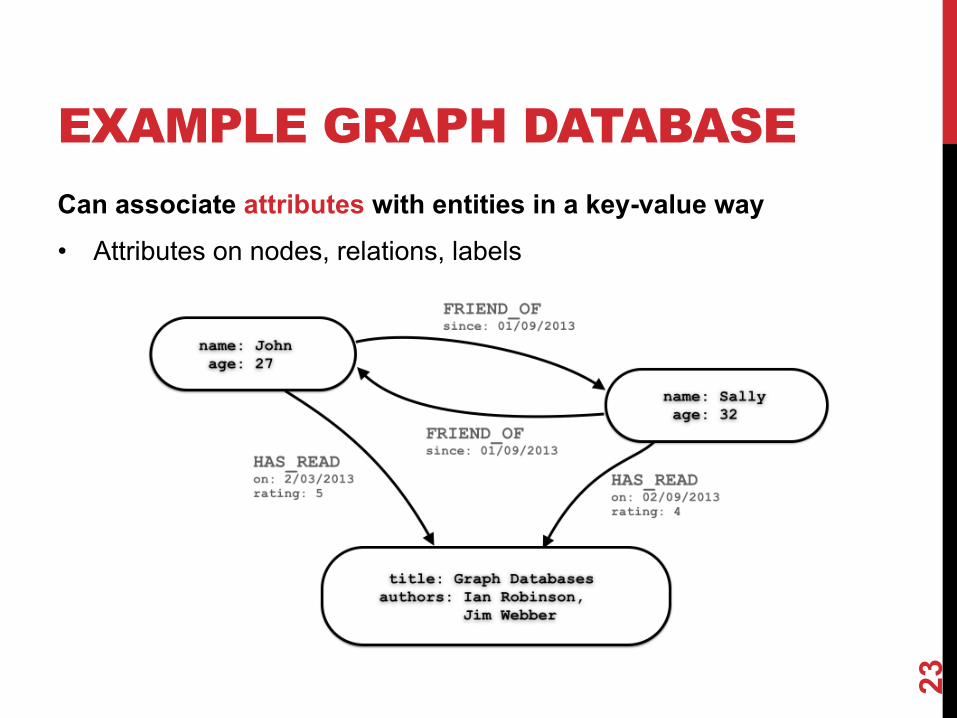
EXAMPLE GRAPH DATABASECan associate attributes with entities in a key-value way• Attributes on nodes, relations, labels
23
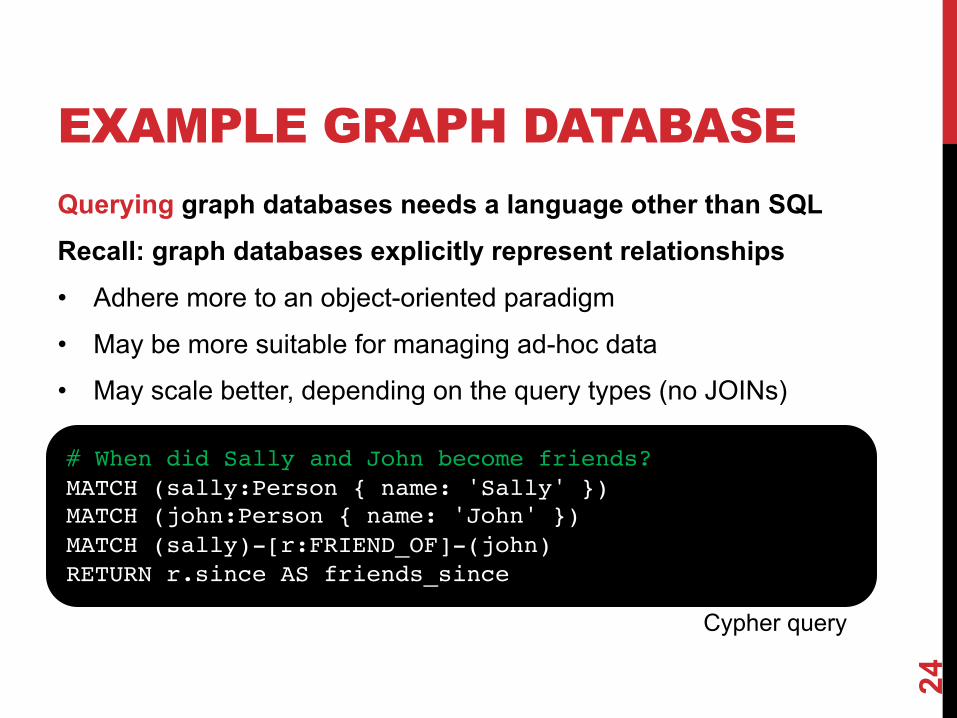
EXAMPLE GRAPH DATABASEQuerying graph databases needs a language other than SQLRecall: graph databases explicitly represent relationships• Adhere more to an object-oriented paradigm
• May be more suitable for managing ad-hoc data
• May scale better, depending on the query types (no JOINs)
24
# When did Sally and John become friends?MATCH (sally:Person { name: 'Sally' })MATCH (john:Person { name: 'John' })MATCH (sally)-[r:FRIEND_OF]-(john)RETURN r.since AS friends_since
Cypher query

BULBFLOWMany graph databases out there:• List found here: https://en.wikipedia.org/wiki/Graph_database
neo4j and Titan are popular, easy-to-use solutions• https://neo4j.com/
• http://titan.thinkaurelius.com/Bulbflow is a Python framework that connects to several backing graph-database servers like neo4j• http://bulbflow.com/
• https://github.com/espeed/bulbs
25

26
THE VALUE OF A VERTEX

IMPORTANCE OF VERTICESNot all vertices are equally importantCentrality Analysis: • Find out the most important node(s) in one network
• Used as a feature in classification, for visualization, etc …
Commonly-used Measures• Degree Centrality
• Closeness Centrality
• Betweenness Centrality
• Eigenvector Centrality
27
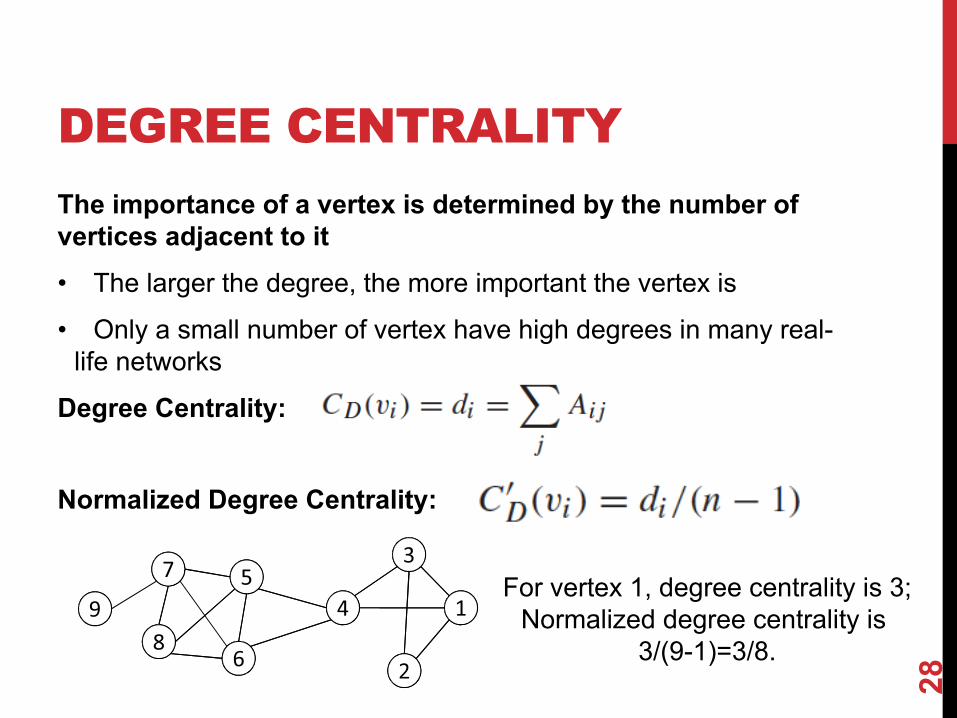
DEGREE CENTRALITYThe importance of a vertex is determined by the number of vertices adjacent to it• The larger the degree, the more important the vertex is
• Only a small number of vertex have high degrees in many real-life networks
Degree Centrality:
Normalized Degree Centrality:
28
For vertex 1, degree centrality is 3;Normalized degree centrality is
3/(9-1)=3/8.

CLOSENESS CENTRALITY“Central” vertices are important, as they can reach the whole network more quickly than non-central verticesImportance measured by how close a vertex is to other vertices
Average Distance:
Closeness Centrality:
29

CLOSENESS CENTRALITY
30Vertex 4 is more central than vertex 3
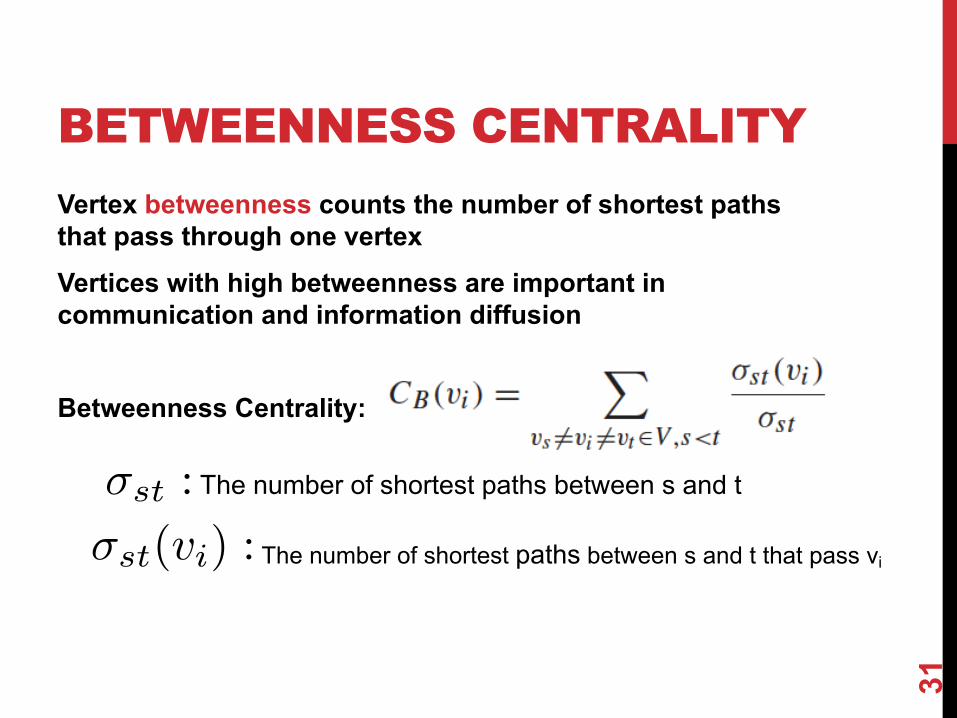
BETWEENNESS CENTRALITYVertex betweenness counts the number of shortest paths that pass through one vertexVertices with high betweenness are important in communication and information diffusion
Betweenness Centrality:
31
The number of shortest paths between s and t�st :
�st(vi) : The number of shortest paths between s and t that pass vi

BETWEENNESS CENTRALITY
32
The number of shortest paths between s and t�st :�st(vi) : The number of shortest paths between s and t that pass vi
What is the betweenness centrality for node 4 ?????????

EIGENVECTOR CENTRALITYA vertex’s importance is determined by the importance of the friends of that vertexIf one has many important friends, he should be important as well.
The centrality corresponds to the top eigenvector of the adjacency matrix A. A variant of this eigenvector centrality is the PageRank score.
33
NETWORKX: CENTRALITYMany other centrality measures implemented for you!• https://networkx.github.io/documentation/development/referenc
e/algorithms.centrality.html
Degree, in-degree, out-degreeClosenessBetweenness• Applied to both edges and vertices; hard to compute
Load: similar to betweennessEigenvector, Katz (provides additional weight to close neighbors)
34

STRENGTH OF RELATIONSHIPS
35
WEAK AND STRONG TIESIn practice, connections are not of the same strengthInterpersonal social networks are composed of strong ties (close friends) and weak ties (acquaintances).Strong ties and weak ties play different roles for community formation and information diffusionStrength of Weak Ties [Granovetter 1973]
• Occasional encounters with distant acquaintances can provide important information about new opportunities for job search
36
CONNECTIONS IN SOCIAL MEDIASocial media allows users to connect to each other more easily than ever.• One user might have thousands of friends online• Who are the most important ones among your 300 Facebook friends?
Imperative to estimate the strengths of ties for advanced analysis • Analyze network topology• Learn from User Profiles and Attributes• Learn from User Activities
37
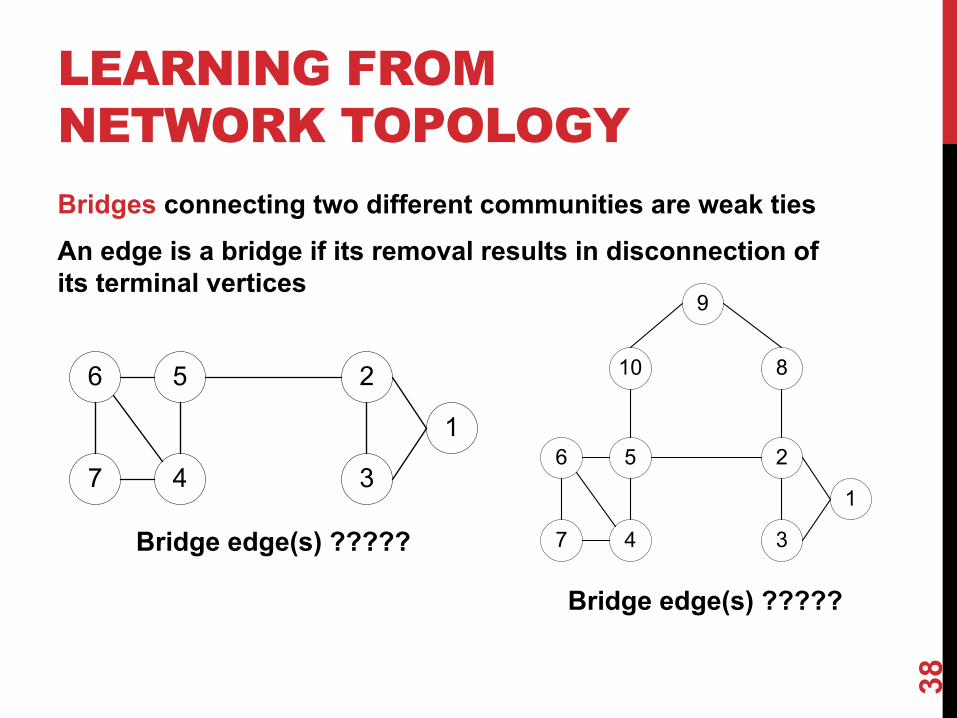
LEARNING FROM NETWORK TOPOLOGYBridges connecting two different communities are weak tiesAn edge is a bridge if its removal results in disconnection of its terminal vertices
38
Bridge edge(s) ?????
Bridge edge(s) ?????
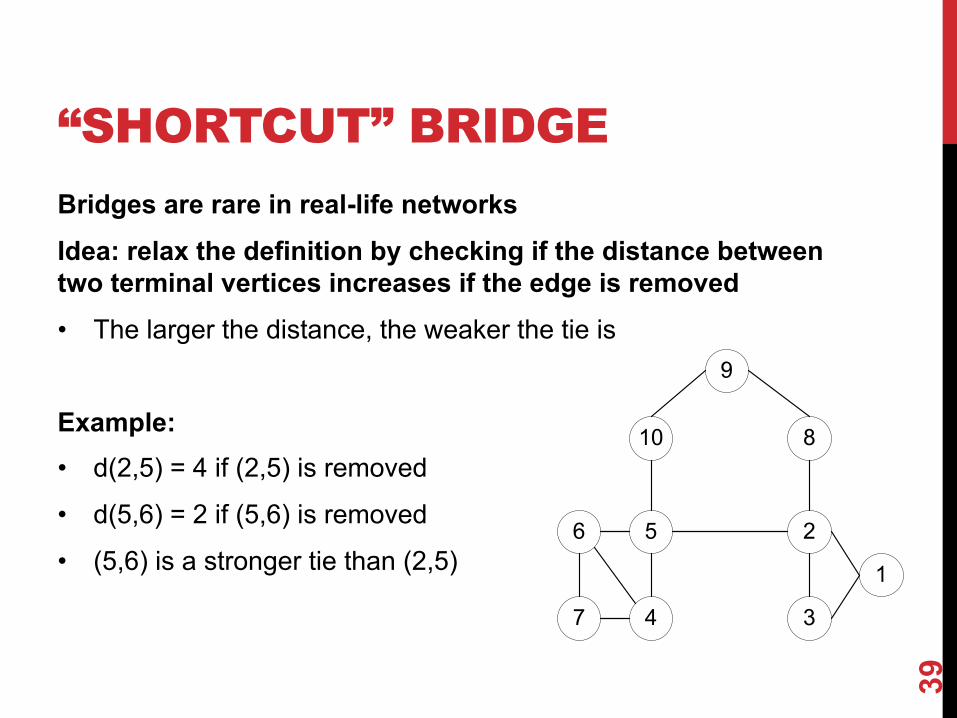
“SHORTCUT” BRIDGEBridges are rare in real-life networksIdea: relax the definition by checking if the distance between two terminal vertices increases if the edge is removed• The larger the distance, the weaker the tie is
Example:• d(2,5) = 4 if (2,5) is removed
• d(5,6) = 2 if (5,6) is removed
• (5,6) is a stronger tie than (2,5)
39
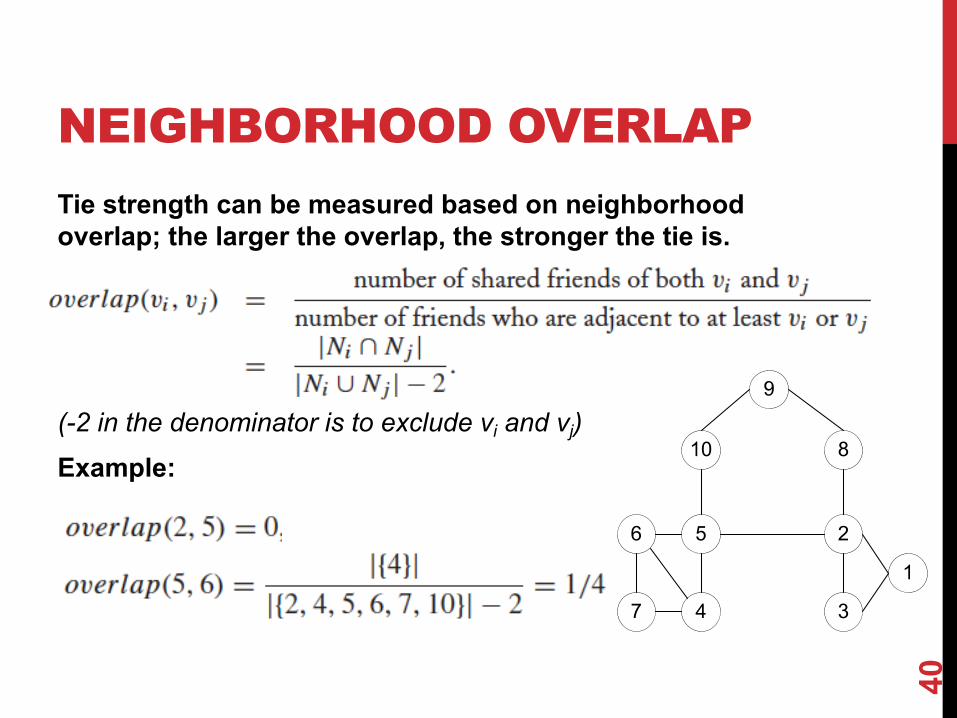
NEIGHBORHOOD OVERLAPTie strength can be measured based on neighborhood overlap; the larger the overlap, the stronger the tie is.
(-2 in the denominator is to exclude vi and vj)
Example:
40
LEARNING FROM PROFILES AND INTERACTIONSTwitter: one can follow others without followee’s confirmation• The real friendship network is determined by the frequency two users talk
to each other, rather than the follower-followee network
• The real friendship network is more influential in driving Twitter usageStrengths of ties can be predicted accurately based on various information from Facebook• Friend-initiated posts, message exchanged in wall post, number of mutual
friends, etc.
Learning numeric link strength by maximum likelihood estimation• User profile similarity determines the strength
• Link strength in turn determines user interaction• Maximize the likelihood based on observed profiles and interactions
41
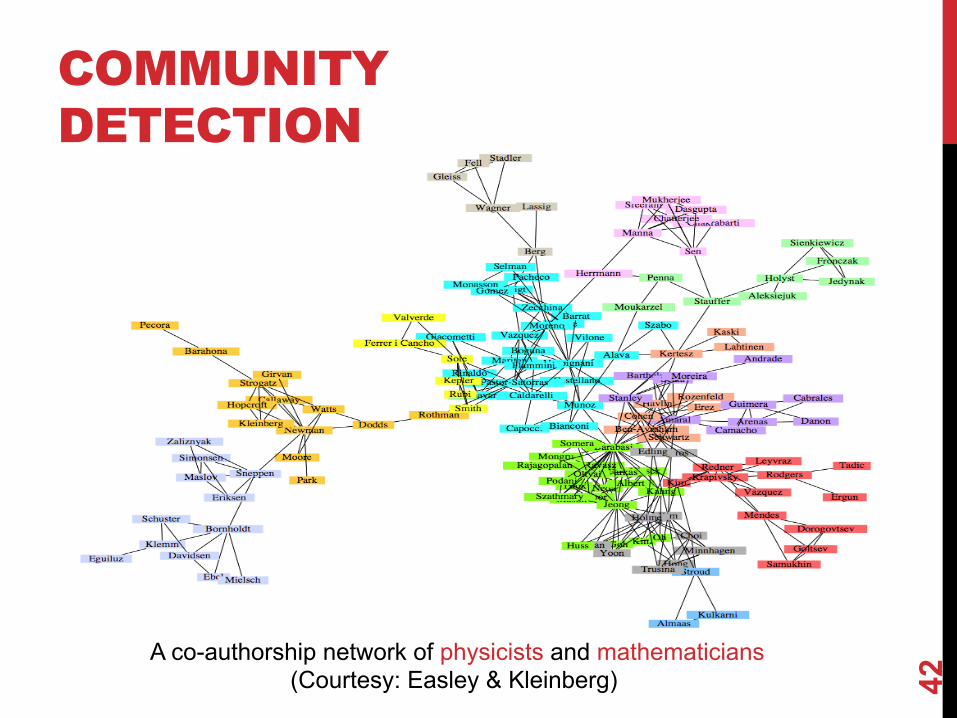
COMMUNITY DETECTION
A co-authorship network of physicists and mathematicians(Courtesy: Easley & Kleinberg) 42
WHAT IS A COMMUNITY?Informally: “tightly-knit region” of the network.• How do we identify this region?• How do we separate tightly-knit regions from each other?It depends on the definition of tightly knit.• Regions can be nested• Examples ?????????
• How do bridges fit into this ?????????
43

WHAT IS A COMMUNITY?
(Courtesy: Easley & Kleinberg) An example of a nested structure of the communities
bridges
Removal of a bridge separates the graph into disjoint components
44
COMMUNITY DETECTIONGirvan-Newman Method• Remove the edges of highest betweenness first.
• Repeat the same step with the remainder graph.
• Continue this until the graph breaks down into individual nodes.
As the graph breaks down into pieces, the tightly knit community structure is exposed.Results in a hierarchical partitioning of the graph
45

GIRVAN-NEWMAN METHOD
Betweenness(7-8)= 7*7 = 49
Betweenness(3-7) = Betweenness(6-7) =Betweenness(8-9) = Betweenness(8-12) = 3*11= 33
Betweenness(1-3) = 1*12 = 12
46
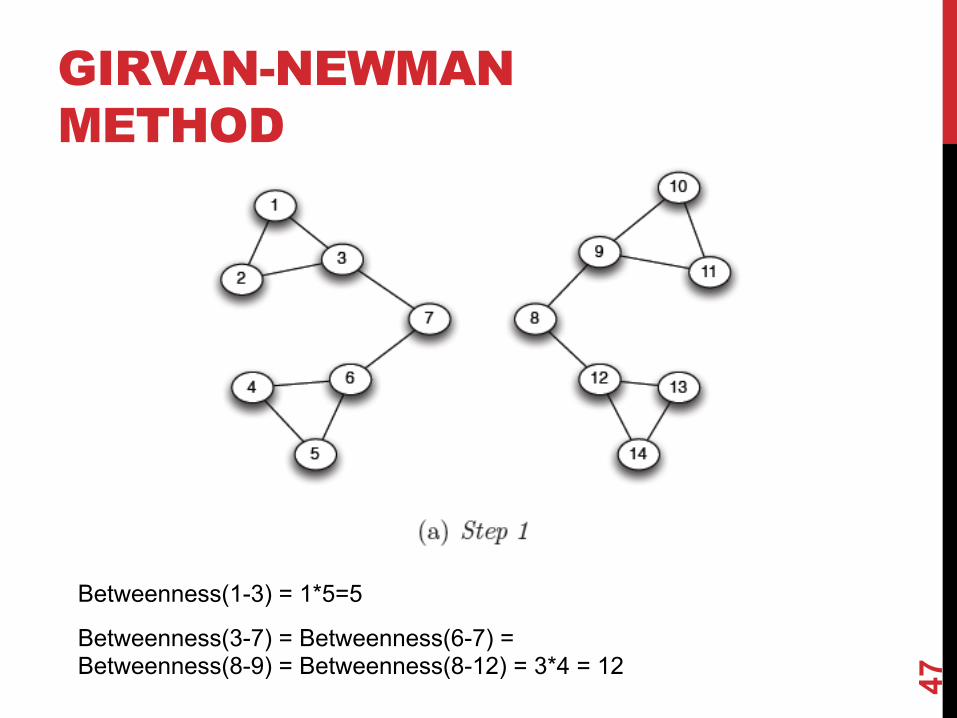
GIRVAN-NEWMAN METHOD
Betweenness(3-7) = Betweenness(6-7) = Betweenness(8-9) = Betweenness(8-12) = 3*4 = 12
Betweenness(1-3) = 1*5=5
47
GIRVAN-NEWMAN METHOD
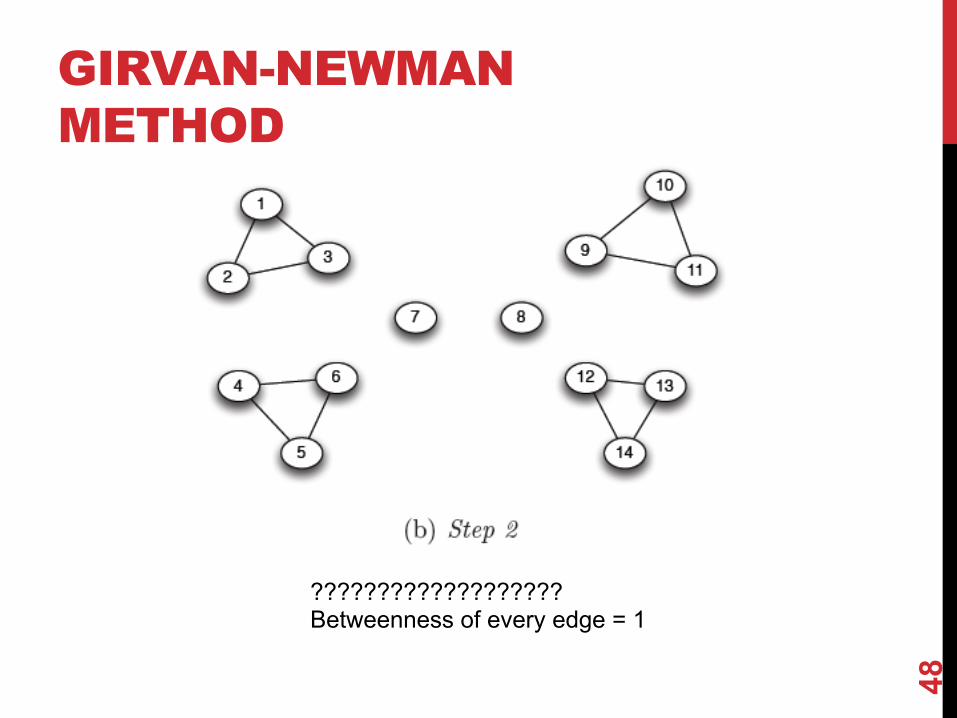
???????????????????Betweenness of every edge = 1
48
GIRVAN-NEWMAN METHOD
49
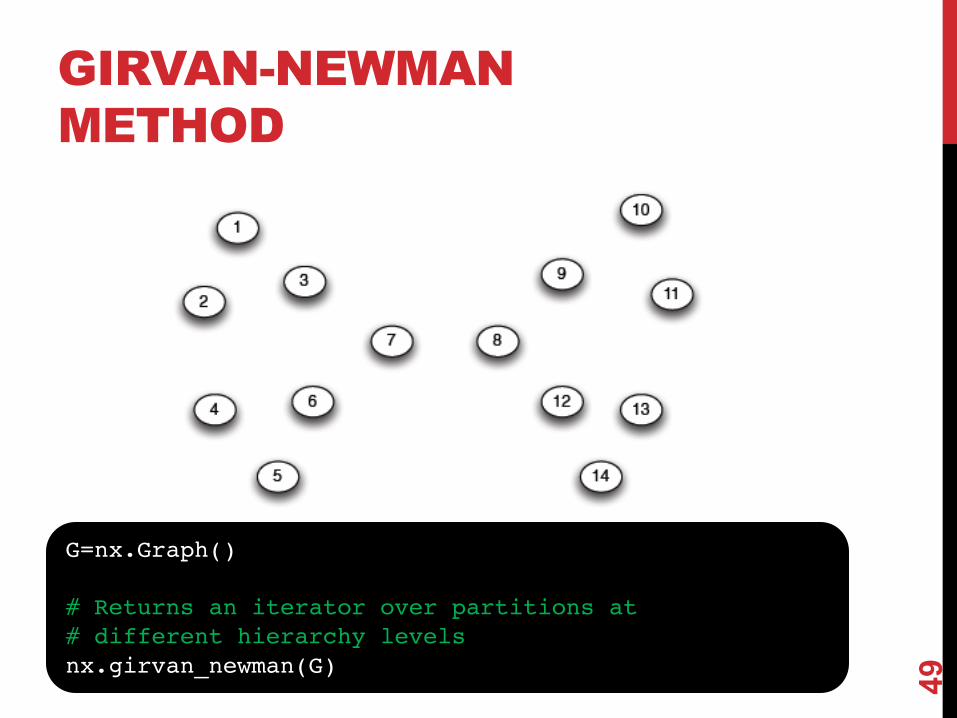
G=nx.Graph()
# Returns an iterator over partitions at # different hierarchy levelsnx.girvan_newman(G)
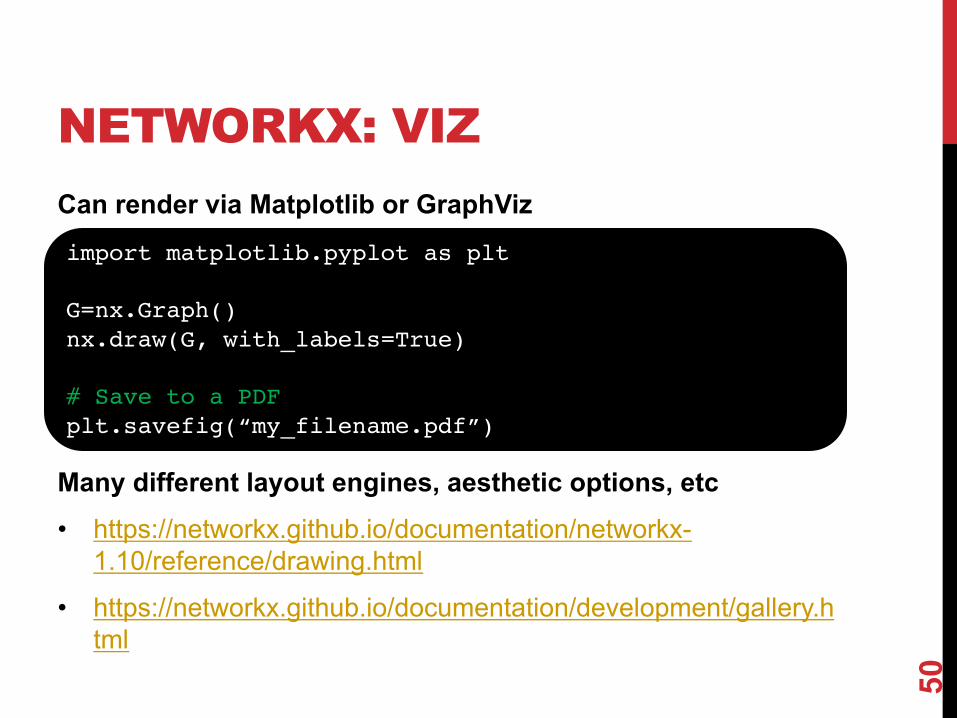
NETWORKX: VIZCan render via Matplotlib or GraphViz
Many different layout engines, aesthetic options, etc• https://networkx.github.io/documentation/networkx-
1.10/reference/drawing.html
• https://networkx.github.io/documentation/development/gallery.html
50
import matplotlib.pyplot as plt
G=nx.Graph()nx.draw(G, with_labels=True)
# Save to a PDFplt.savefig(“my_filename.pdf”)
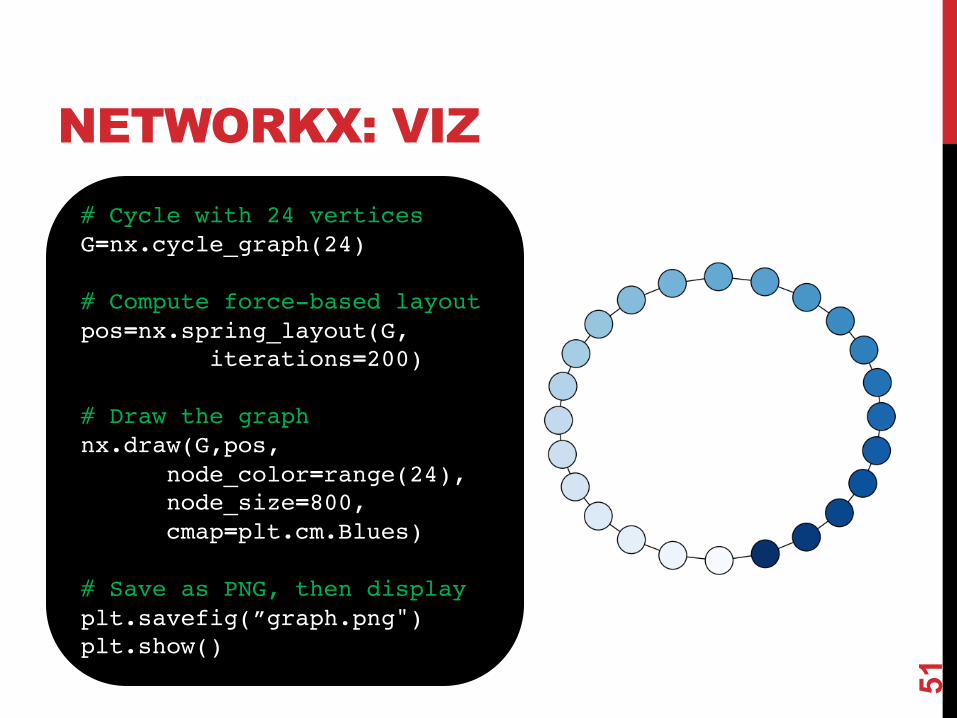
NETWORKX: VIZ
51
# Cycle with 24 verticesG=nx.cycle_graph(24)
# Compute force-based layoutpos=nx.spring_layout(G,
iterations=200)
# Draw the graph nx.draw(G,pos,
node_color=range(24),node_size=800,cmap=plt.cm.Blues)
# Save as PNG, then displayplt.savefig(”graph.png")plt.show()

NETWORKX: VIZ
52
# Branch factor 3, depth 5G = nx.balanced_tree(3, 5)
# Circular layoutpos = graphviz_layout(G,
prog='twopi', args='')
# Draw 8x8 figure plt.figure(figsize=(8, 8)) nx.draw(G, pos,
node_size=20,alpha=0.5,node_color="blue",with_labels=False)
plt.axis('equal') plt.show()

REMINDER!!!
Please use this time to think about the final tutorial!• Short refresher on the coming slides
• You’re welcome to come to the lecture hall, meet potential groupmates, brainstorm potential ideas, etc.
• Also, make use of Piazza!
53
NO FORMAL LECTURE THIS THURSDAY(I will be at the Simons Institute for the Theory of Computing)