introduction to d3saldohuk/ivproject/files/introduction to d3.pdfd3.js is good at •providing a way...
TRANSCRIPT

Shamal AL-Dohuki

Overview
• Data visualization is the presentation of data in a pictorial
or graphical format.

Overview Cont.
• Reasons to use:
• helps people see things that were not obvious to them before;
• patterns can be spotted quickly and easily;
• conveys information in a universal manner;
• answer questions like “What would happen if we made an
adjustment to that area?”.

What is d3.js
A JavaScript library which:
• Draws charts
• Visualizes data
• Doesn’t provide pre-defined charts
• Can be used to develop the real time dashboards
• Can’t be used to draw the 3-D charts

What is d3.js Cont.
• D3 - Data-Driven Documents
•Data: Provided by you
•Driven: d3 connects data to documents
•Documents: web-based documents

Architecture
D3 - Data-Driven Documents

D3.js is good at
• Providing a way to map data to documents.
• Being a general purpose visualization library
• Handling data transformation
• Providing basic math & layout algorithms

D3.js alternatives
• Cytoscape.js
• C3.js
• Canvas.js
• Datacopia
• Panxpan
• See more: alternativeto.net

Before We Start
Before we start, we need the following components:
• D3.js library
• Editor
•Web browser
•Web server

Prerequisites
• HTML
• CSS
• Scalable Vector Graphics (SVG)
• Document Object Model (DOM)
• Some knowledge of JavaScript
• jQuery is a bonus

Scalable Vector Graphics (SVG)
• There are two main ways to represent graphics on the
Web:
• Bitmapped Graphics - storing the RGB values of each pixel
in the image.
• Vector Graphics - storing the coordinates of each vectors
and the colors in which they are rendered.

(SVG) Cont.
•Vector and raster graphics
Vector graphics
Circle(
Center=xy,
Radius=80,
Color=red,
Width=20,
Fill=white)
red
Raster graphics
redred
white
white
white

(SVG) Cont.
• SVG is a way to render images on the webpage.
• SVG is not a direct image, but is just a way to create images
using text.
• It is a Scalable Vector. It scales itself according to the size of
the browser, so resizing your browser will not distort the
image.

(SVG) Cont.

Document Object Model (DOM)
• The Document Object Model (DOM) is
a cross-platform and language-
independent application programming
interface that treats an HTML, XHTML,
or XML document as a tree structure
wherein each node is an object
representing a part of the document.
Example of DOM hierarchy in an HTML document

DOM Example

Hello HTML

Hello SVG

Hello SVG Cont.<svg width="400" height="200">
<circle cx="100" cy="100" r="10"></circle>
<circle cx="200" cy="100" r="30" fill="orange"></circle>
<circle cx="300" cy="100" r="20" fill="olivedrab"></circle>
</svg>

How D3 Works

How D3 Works Cont.

Core D3 ideas: Selecting elements
• Selecting elements: d3.select() and d3.selectAll() can be
used to access DOM elements by name, class, id, or many
other css selectors.
• d3.select() selects only the first element that matches the
css selectors while d3.selectAll() selects all matched
elements.

Selecting Elements
• A selection is an array of elements pulled from the current document.
• After selecting elements, you apply operators to them to do stuff.
• These operators can get or set attributes, styles, properties, HTML
and text content.
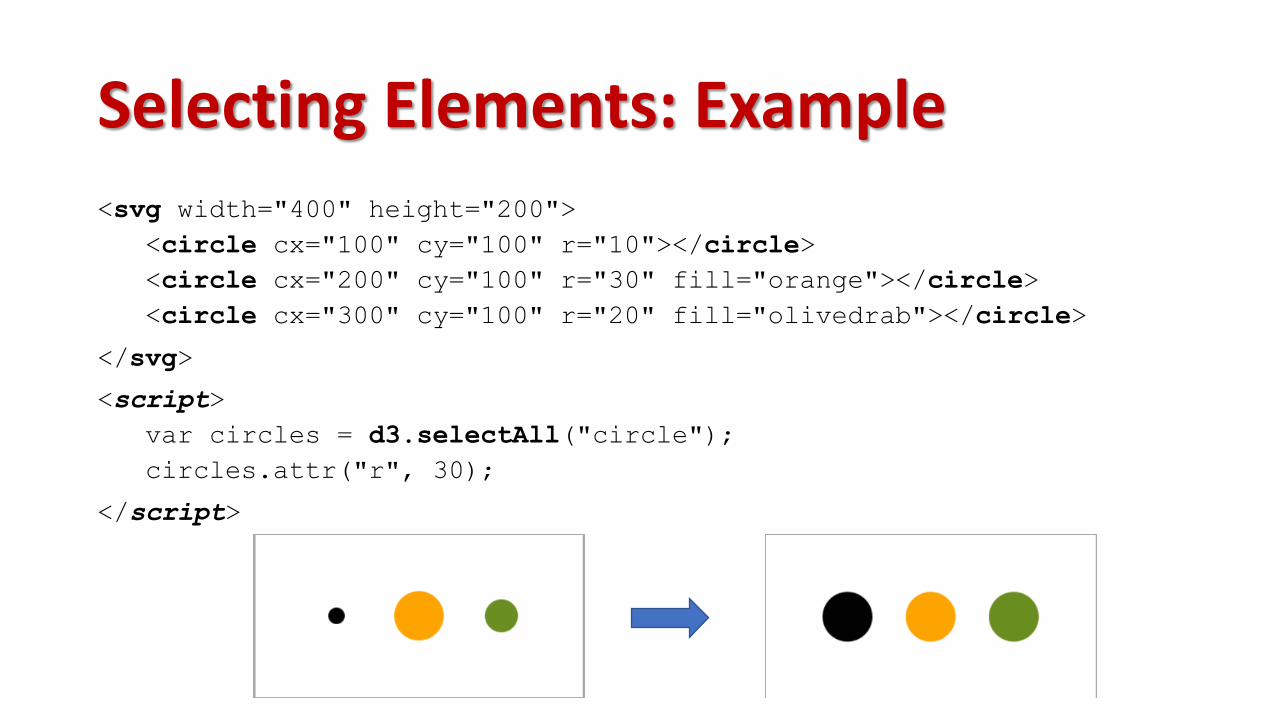
Selecting Elements: Example<svg width="400" height="200">
<circle cx="100" cy="100" r="10"></circle>
<circle cx="200" cy="100" r="30" fill="orange"></circle>
<circle cx="300" cy="100" r="20" fill="olivedrab"></circle>
</svg>
<script>
var circles = d3.selectAll("circle");
circles.attr("r", 30);
</script>

Selecting Elements: Example Cont.<script>
var circles = d3.selectAll("circle");
circles
.attr("r", 30)
.attr("stroke", "black")
.attr("stroke-width", 1.5);
</script>

Select with jQuery
<script>
var circles = $("circle");
circles
.attr("r", 30)
.attr("stroke", "black")
.attr("stroke-width", 1.5);
</script>

Core D3 ideas: Data Binding
• Data Binding: We can use the data() function to bind data
to a selection.
•We can also use data() or datum() to access the data that
belong to a selection.

Data Binding: Example
<script>
var circles = d3.selectAll("circle");
var sizes = [10, 25, 60];
circles
.data(sizes)
.attr("r", function(size)
{ return size / 2; });
</script>

External data files
• d3.csv - request a comma-separated values (CSV) file.
• d3.html - request an HTML document fragment.
• d3.json - request a JSON blob.
• d3.text - request a text file.
• d3.tsv - request a tab-separated values (TSV) file.
• d3.xhr - request a resource using XMLHttpRequest.
• d3.xml - request an XML document fragment.
Example
Titanic Passengers

Example: Dataset

Example: Visualization

Example: Getting Started
• index.html
• We can start by defining a simple
web page, which has a header (h1)
and an svg element that will hold
our visualization. In the style tags,
we can add CSS styling for both
elements defined in the HTML.

Example: Adding Elements
• Manually specifying elements
• We can manually add elements to the DOM, and specify properties such as
the x and y position, and the title (which appears as a tooltip on hover).

Example: Adding Elements Cont.
• Positioning Elements
• Keep in mind that the origin for positioning
elements is the upper left corner.

Example: Selections
• Selecting elements
• d3.select() and d3.selectAll() can be used to access DOM elements by
name, class, id, or many other css selectors. d3.select() selects only the
first element that matches the css selectors while d3.selectAll() selects all
matched elements.

Example: Selections Cont.

Example: Selections Cont.
• Modifying selected elements
• You can use access and modify the properties of
selections with attr(), text(), style(), and other
operators. Most D3 selection methods return the
selection, allowing us to chain the operator calls.

Example: Selections Cont.
• Appending elements
• Through append(), we can add new elements anywhere in the DOM.
• We can then use operators or CSS to set the properties of the element.
• We can also get rid of elements with remove().
• Finally, we can store selections in variables for future use.

Example: Selections Cont.

Example: Data Binding
• Binding
• We can use the data() function to bind data to a selection.
• We can also use data() or datum() to access the data that belong to a
selection.

Example: Data Binding Cont.

Example: Data Binding Cont.
selectAll().data().enter().append()
1. Select all of our circles (currently we don’t have any).
2. Bind our data (in this case, 5 rows worth)
3. Enter each new datum from our selection.
4. Append a new DOM element. There are now 5 new
elements, each with their own unique data.
5. Append titles to the new elements.
6. Merge our new elements into our original selections.
7. Set attributes with operators, using anonymous
functions.

Example: Scales
• Specifying scales
• To position the dots, we can manually specify the x and y position
attributes, but this process can be tedious and error prone for complex
attributes:

Example: Scales Cont.
• Specifying scales
• Scales are functions that map from a domain to a range.
• Anonymous functions can be used to parameterize the element's attributes
using the element's data. Anonymous functions can have two parameters d
(our bound datum) and i (the index of our datum).

Example: Scales Cont.
• Specifying scales
• Given a value from the domain, returns the corresponding value from the
range.

Example: Scales Cont.

Example: Scales Cont.
• More scale types
• d3.scaleLinear create a linear mapping. You can also have d3.scaleLog, d3.scaleSqrt, and
so on.
• You can also specify ordinal (which include nominal data types) and temporal scales.
• Note that the range() does not have to be a set of numbers; it can also be colors or
strings.

Example: Scales Cont.

Example: Axes & Legends
• Creating axes
• Axes can be generated based on the scales in your visualization. Axes are
defined based on their position using d3.axisTop, d3.axisBottom,
d3.axisRight, or d3.axisLeft.
• Note: each of these constructors is a function; to create our axis, we create
or select the element where we want to place it, and then use call() to
apply the function to it.

Example: Axes & Legends Cont.

Example: Axes & Legends Cont.
• Labeling axes
• Labels can be added to your visualization by adding text marks. As with any
other mark, you can programmatically specify both HTML attributes and
CSS styles.

Example: Axes & Legends Cont.
• Legends
• Legends can be constructed just like the
other elements of your visualization: by
creating a new set of marks and using
scales to style the attributes.
• In addition to the rect for the legend
mark, we can append text to create the
legend labels.

Example: Events & Transitions
• Reacting to events
• Event listeners can be added to marks to react to events on the underlying
selection using the on() method. The on() method takes the event name
and a callback function that is triggered every time the specified event
happens.
• An anonymous function can be used as the callback for the event listener.
The input to the function d represents the underlying data of the mark. The
scope, this, corresponds to the DOM element.

Example: Events & Transitions Cont.
Example: Loading Files
• Loading data from external files
• Data can be loaded from many types of external files using commands such
as d3.csv, d3.json, d3.tsv.
• The D3 functions additionally support callback functions for dealing with
the resulting data or error cases.

Example: Loading Files Cont.

Example: Enter/Update/Exit
• Rebinding
• Three things can happen when we call data():
• Update: We want to change the elements we already have.
• Enter: We have new data.
• Exit: We have data that is no longer bound.

Example: Enter/Update/Exit Cont.

Example: Enter/Update/Exit Cont.
1. Update
• Things I want to happen to all of our data, whenever the function is
called. Potentially overwritten by later steps.

Example: Enter/Update/Exit Cont.
2. Enter
• Things I want to happen to
all new data
• Can use append() to make
new elements for new data.

Example: Enter/Update/Exit Cont.
3. Enter+Update
• Things I want to set initially. Can use transitions to have attributes
fade in after creation.

Example: Enter/Update/Exit Cont.
4. Exit
• Things I want to happen to old data
• Can use transitions to make old data fade away
• Can use remove() to keep only elements that are bound to our
current data.

Example: Enter/Update/Exit Cont.
Key binding
• With only one argument, binding will only keep track of the amount of data we
have.
• If we always have the same amount of data, then nothing will “exit.”
• Can use a argument to specify unique identifiers for data, to define whether data
should enter or exit.
• Here, our key is the index (row number) of the data in our original csv. Passenger
name is not unique, and so would not make a good key.

Example: Enter/Update/Exit Cont.