introduction of aim/energy snapshot tool (ess) the united nations commission on sustainable...
TRANSCRIPT

1
The United Nations Commission on Sustainable Development30 April – 11 May, 2007
Ms. Ms. MahoMaho Miyashita (Miyashita (TakimiTakimi) ) Mizuho Information & Research InstituteMizuho Information & Research InstituteProf. P.R. Prof. P.R. ShuklaShukla Indian Institute of ManagementIndian Institute of ManagementDr. Dr. MikikoMikiko KainumaKainuma National Institute for Environmental StudiesNational Institute for Environmental Studies
Introduction of Introduction of AIM/Energy Snapshot Tool AIM/Energy Snapshot Tool
(ESS)(ESS)
The United Nations Commission on Sustainable Development30 April – 11 May, 2007
Introduction of AIM/Energy Snapshot Tool
2
Back GroundBack Ground
Structures & FlowsStructures & Flows
Operation Operation
Enduse SectorEnduse Sector
Transformation SectorTransformation Sector
AnalysisAnalysis
Contents
JapanLow C arbonSociety 2050
Asia Pacific Integrated Model (AIM)Japan Low-Carbon Society Project
Contents
• Background• Structures & Flows• Operation
– Demand Settings (Residential Sector)– Transformation Sector (Electricity, Other)– Analysis

2
The United Nations Commission on Sustainable Development30 April – 11 May, 2007
Introduction of AIM/Energy Snapshot Tool
3
Back GroundBack Ground
Structures & FlowsStructures & Flows
Operation Operation
Enduse SectorEnduse Sector
Transformation SectorTransformation Sector
AnalysisAnalysis
Contents
JapanLow C arbonSociety 2050
Asia Pacific Integrated Model (AIM)Japan Low-Carbon Society Project
Background
Back Ground
The United Nations Commission on Sustainable Development30 April – 11 May, 2007
Introduction of AIM/Energy Snapshot Tool
4
Back GroundBack Ground
Structures & FlowsStructures & Flows
Operation Operation
Enduse SectorEnduse Sector
Transformation SectorTransformation Sector
AnalysisAnalysis
Contents
JapanLow C arbonSociety 2050
Asia Pacific Integrated Model (AIM)Japan Low-Carbon Society Project
Background of development• In scenario developing processes, a tool
with following feature would be useful– Clear assumptions & calculation processes – Easy interpretation of the results– Easy sensitivity analysis– Keep energy balance
• Tools for describe future energy balance table in a spreadsheet: Energy Snapshot Tool (ESS)
Back Ground

3
The United Nations Commission on Sustainable Development30 April – 11 May, 2007
Introduction of AIM/Energy Snapshot Tool
5
Back GroundBack Ground
Structures & FlowsStructures & Flows
Operation Operation
Enduse SectorEnduse Sector
Transformation SectorTransformation Sector
AnalysisAnalysis
Contents
JapanLow C arbonSociety 2050
Asia Pacific Integrated Model (AIM)Japan Low-Carbon Society Project
AIM/Energy Snapshot Tool• Excel format• Based on energy balance table• Step by step approach• The tool can be used for;
– Developing and designing future scenarios– “What if” analysis– Check the consistency among the sectors– Analyze the impacts of countermeasures– Communication among stakeholders
Back Ground
The United Nations Commission on Sustainable Development30 April – 11 May, 2007
Introduction of AIM/Energy Snapshot Tool
6
Back GroundBack Ground
Structures & FlowsStructures & Flows
Operation Operation
Enduse SectorEnduse Sector
Transformation SectorTransformation Sector
AnalysisAnalysis
Contents
JapanLow C arbonSociety 2050
Asia Pacific Integrated Model (AIM)Japan Low-Carbon Society Project
Structure & Flow
Structure & Flow

4
The United Nations Commission on Sustainable Development30 April – 11 May, 2007
Introduction of AIM/Energy Snapshot Tool
7
Back GroundBack Ground
Structures & FlowsStructures & Flows
Operation Operation
Enduse SectorEnduse Sector
Transformation SectorTransformation Sector
AnalysisAnalysis
Contents
JapanLow C arbonSociety 2050
Asia Pacific Integrated Model (AIM)Japan Low-Carbon Society Project
Calculation processesBase Year
target Year
Primary Energy
Final Energy
Services
CO2 emission
Primary Energy
Final Energy
Services
CO2 emissionStructure & Flow
The United Nations Commission on Sustainable Development30 April – 11 May, 2007
Introduction of AIM/Energy Snapshot Tool
8
Back GroundBack Ground
Structures & FlowsStructures & Flows
Operation Operation
Enduse SectorEnduse Sector
Transformation SectorTransformation Sector
AnalysisAnalysis
Contents
JapanLow C arbonSociety 2050
Asia Pacific Integrated Model (AIM)Japan Low-Carbon Society Project
Calculation processesBase Year
Target Year
Primary Energy
Secondary
Services
CO2 emission
Primary Energy
Final Energy
Services
CO2 emission
EBT
1. Obtain energy balance table from national statistics etc. (Base Year)
1. Obtain energy balance table from national statistics etc. (Base Year)
Transformation efficiency
Structure & Flow
energy balance
table
5
The United Nations Commission on Sustainable Development30 April – 11 May, 2007
Introduction of AIM/Energy Snapshot Tool
9
Back GroundBack Ground
Structures & FlowsStructures & Flows
Operation Operation
Enduse SectorEnduse Sector
Transformation SectorTransformation Sector
AnalysisAnalysis
Contents
JapanLow C arbonSociety 2050
Asia Pacific Integrated Model (AIM)Japan Low-Carbon Society Project
Calculation processesBase Year
Primary Energy
Final Energy
Services
CO2 emission
Primary Energy
Final Energy
Services
CO2 emission
Energy use efficiency
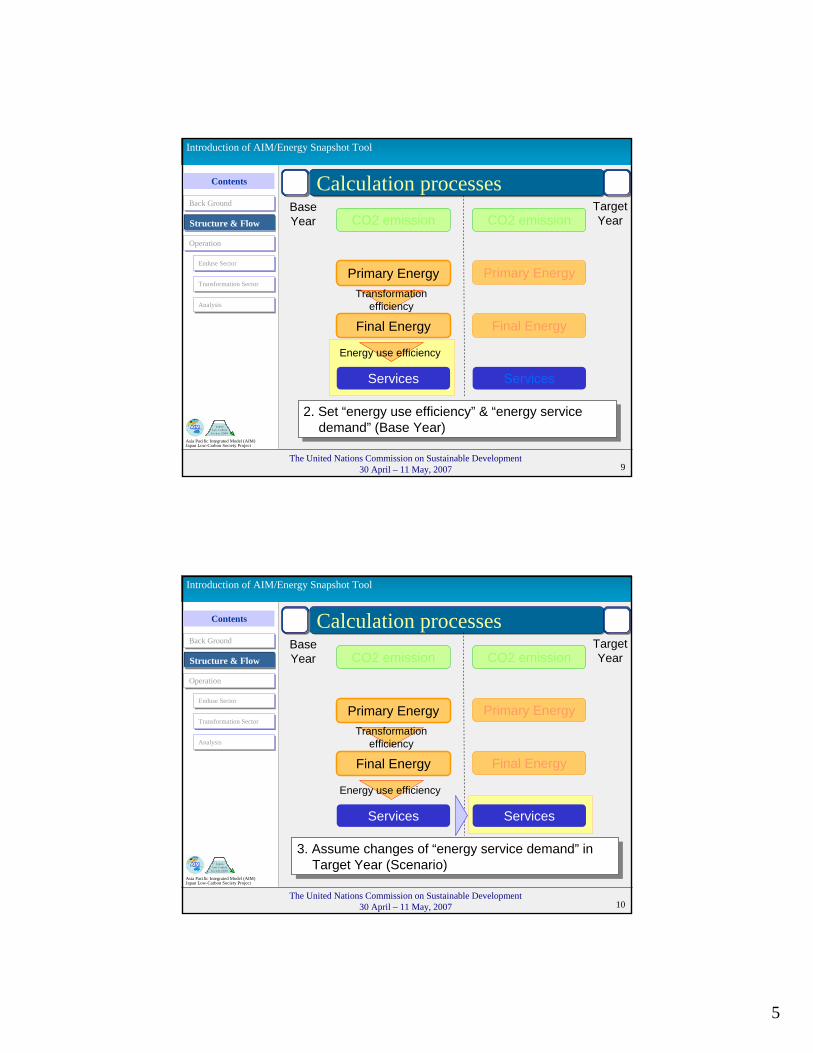
2. Set “energy use efficiency” & “energy service demand” (Base Year)
2. Set “energy use efficiency” & “energy service demand” (Base Year)
Transformation efficiency
Target YearStructure & Flow
The United Nations Commission on Sustainable Development30 April – 11 May, 2007
Introduction of AIM/Energy Snapshot Tool
10
Back GroundBack Ground
Structures & FlowsStructures & Flows
Operation Operation
Enduse SectorEnduse Sector
Transformation SectorTransformation Sector
AnalysisAnalysis
Contents
JapanLow C arbonSociety 2050
Asia Pacific Integrated Model (AIM)Japan Low-Carbon Society Project
Calculation processesBase Year
Primary Energy
Final Energy
Services
CO2 emission
Primary Energy
Final Energy
Services
CO2 emission
3. Assume changes of “energy service demand” in Target Year (Scenario)
3. Assume changes of “energy service demand” in Target Year (Scenario)
Energy use efficiency
Transformation efficiency
Target YearStructure & Flow

6
The United Nations Commission on Sustainable Development30 April – 11 May, 2007
Introduction of AIM/Energy Snapshot Tool
11
Back GroundBack Ground
Structures & FlowsStructures & Flows
Operation Operation
Enduse SectorEnduse Sector
Transformation SectorTransformation Sector
AnalysisAnalysis
Contents
JapanLow C arbonSociety 2050
Asia Pacific Integrated Model (AIM)Japan Low-Carbon Society Project
Calculation processesBase Year
Primary Energy
Final Energy
Services
CO2 emission
Primary Energy
Final Energy
Services
CO2 emission
4. Assume changes of “energy use efficiency”, “transformation efficiency” in Target Year (Scenario)
4. Assume changes of “energy use efficiency”, “transformation efficiency” in Target Year (Scenario)
Energy use efficiency
Transformation efficiency
Energy use efficiency
Transformation efficiency
Target YearStructure & Flow
The United Nations Commission on Sustainable Development30 April – 11 May, 2007
Introduction of AIM/Energy Snapshot Tool
12
Back GroundBack Ground
Structures & FlowsStructures & Flows
Operation Operation
Enduse SectorEnduse Sector
Transformation SectorTransformation Sector
AnalysisAnalysis
Contents
JapanLow C arbonSociety 2050
Asia Pacific Integrated Model (AIM)Japan Low-Carbon Society Project
Calculation processesBase Year
Primary Energy
Final Energy
Services
CO2 emission
Primary Energy
Final Energy
Services
CO2 emission
5. Calculate primary energy and final energy in Target Year
5. Calculate primary energy and final energy in Target Year
Energy use efficiency
Transformation efficiency
Energy use efficiency
Transformation efficiency
Target YearStructure & Flow
7
The United Nations Commission on Sustainable Development30 April – 11 May, 2007
Introduction of AIM/Energy Snapshot Tool
13
Back GroundBack Ground
Structures & FlowsStructures & Flows
Operation Operation
Enduse SectorEnduse Sector
Transformation SectorTransformation Sector
AnalysisAnalysis
Contents
JapanLow C arbonSociety 2050
Asia Pacific Integrated Model (AIM)Japan Low-Carbon Society Project
Calculation processesBase Year
Primary Energy
Final Energy
Services
CO2 emission
Primary Energy
Final Energy
Services
CO2 emission
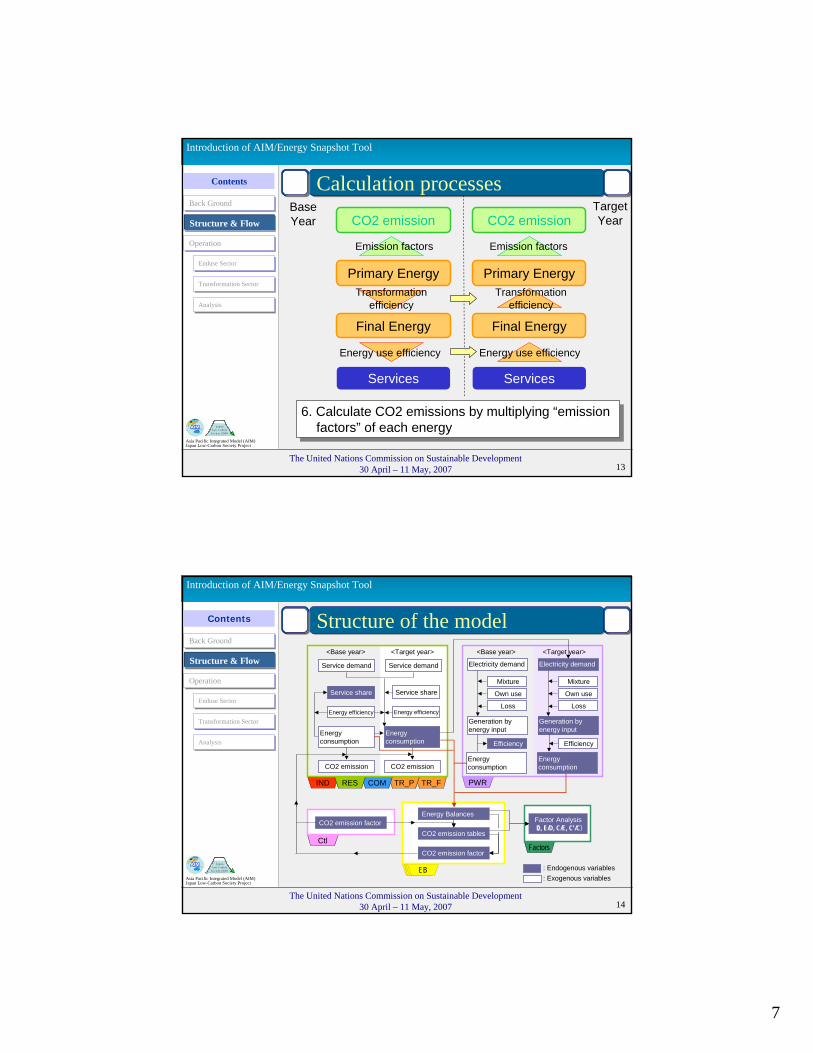
6. Calculate CO2 emissions by multiplying “emission factors” of each energy
6. Calculate CO2 emissions by multiplying “emission factors” of each energy
Emission factors Emission factors
Energy use efficiency
Transformation efficiency
Energy use efficiency
Transformation efficiency
Target YearStructure & Flow
The United Nations Commission on Sustainable Development30 April – 11 May, 2007
Introduction of AIM/Energy Snapshot Tool
14
Back GroundBack Ground
Structures & FlowsStructures & Flows
Operation Operation
Enduse SectorEnduse Sector
Transformation SectorTransformation Sector
AnalysisAnalysis
Contents
JapanLow C arbonSociety 2050
Asia Pacific Integrated Model (AIM)Japan Low-Carbon Society Project
Structure of the model Contents
EBEBEBEB
CtlFactors
PWRTR_FTR_PCOMIND RES
Factor Analysis(D, E/D, C/E, C’/C)
Energy efficiency
Energy Balances
Energy consumption
Service share
Service demand Service demand
Energy efficiency
Service share
CO2 emission CO2 emission
Mixture
Own use
Loss
Electricity demand
Generation byenergy input
Efficiency
Mixture
Own use
Loss
Electricity demand
Generation byenergy input
Efficiency
Energy consumption
CO2 emission tablesCO2 emission factor
CO2 emission factor
Energy consumption
Energy consumption
: Endogenous variables: Exogenous variables
<Base year> <Target year> <Base year> <Target year>Structure & Flow
8
The United Nations Commission on Sustainable Development30 April – 11 May, 2007
Introduction of AIM/Energy Snapshot Tool
15
Back GroundBack Ground
Structures & FlowsStructures & Flows
Operation Operation
Enduse SectorEnduse Sector
Transformation SectorTransformation Sector
AnalysisAnalysis
Contents
JapanLow C arbonSociety 2050
Asia Pacific Integrated Model (AIM)Japan Low-Carbon Society Project
Operation
Operation
The United Nations Commission on Sustainable Development30 April – 11 May, 2007
Introduction of AIM/Energy Snapshot Tool
16
Back GroundBack Ground
Structures & FlowsStructures & Flows
Operation Operation
Enduse SectorEnduse Sector
Transformation SectorTransformation Sector
AnalysisAnalysis
Contents
JapanLow C arbonSociety 2050
Asia Pacific Integrated Model (AIM)Japan Low-Carbon Society Project
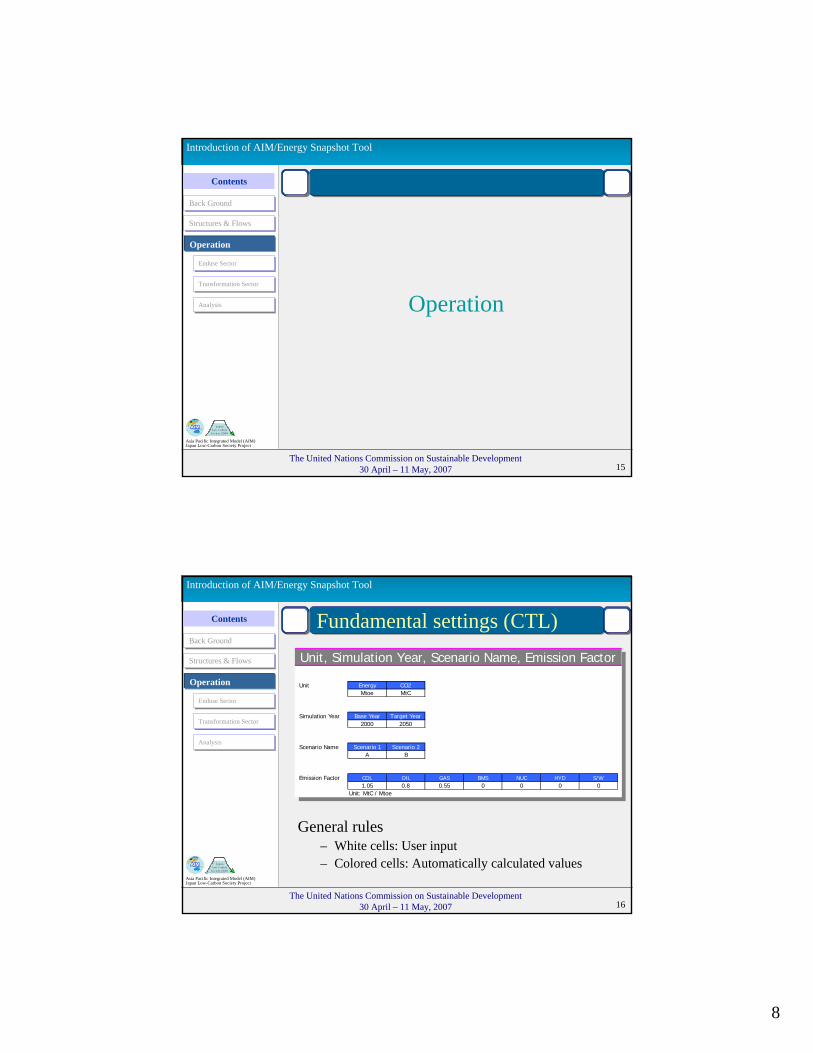
Fundamental settings (CTL)Unit, Simulation Year, Scenario Name, Emission Factor
Unit Energy CO2Mtoe MtC
Simulation Year Base Year Target Year2000 2050
Scenario Name Scenario 1 Scenario 2A B
Emission Factor COL OIL GAS BMS NUC HYD S/W1.05 0.8 0.55 0 0 0 0
Unit: MtC / Mtoe
General rules– White cells: User input – Colored cells: Automatically calculated values
Operation

9
The United Nations Commission on Sustainable Development30 April – 11 May, 2007
Introduction of AIM/Energy Snapshot Tool
17
Back GroundBack Ground
Structures & FlowsStructures & Flows
Operation Operation
Enduse SectorEnduse Sector
Transformation SectorTransformation Sector
AnalysisAnalysis
Contents
JapanLow C arbonSociety 2050
Asia Pacific Integrated Model (AIM)Japan Low-Carbon Society Project
Enduse sector
Enduse Sector
The United Nations Commission on Sustainable Development30 April – 11 May, 2007
Introduction of AIM/Energy Snapshot Tool
18
Back GroundBack Ground
Structures & FlowsStructures & Flows
Operation Operation
Enduse SectorEnduse Sector
Transformation SectorTransformation Sector
AnalysisAnalysis
Contents
JapanLow C arbonSociety 2050
Asia Pacific Integrated Model (AIM)Japan Low-Carbon Society Project
Enduse sector (IND, RES, COM, TR_P, TR_F)
1 4-6COL OIL GAS BMS S/W
45 13 5 213 0A B A B A B 53 12 38 86 0
Cool Mtoe 4 4 4 4 4 90% 100% 45 13 5 214 0Warm Mtoe 81 81 81 65 81 80% 100% 1.05 0.80 0.55 0.00 0.00Hot Water Mtoe 55 55 55 55 55 100% 100% 1.05 0.80 0.55 0.00 0.00Cooking Mtoe 60 60 60 30 60 50% 100% 1.05 0.80 0.55 0.00 0.00Others Mtoe 5 5 5 5 5 100% 100% 47 10 3 0 0
Mtoe 0 0 56 10 21 0 0Mtoe 0 0 47 10 3 0 0Mtoe 0 0Mtoe 0 0
0 0 REF = Reference case0 0 CM = Countermeasure case
2
COL OIL GAS BMS S/W Heat H2 ELE Total COL OIL GAS BMS S/W Heat H2 ELE Total COL OIL GAS BMS S/WCool - 0% 0% 0% 0% 0% 0% 0% 100% 100% 0% 0% 0% 0% 0% 0% 0% 100% 100% 0% 0 0 0% 0%Warm - 23% 8% 2% 48% 0% 3% 0% 16% 100% 61% 8% 2% 10% 0% 3% 0% 16% 100% 23% 8% 2% 48% 0%Hot Water - 14% 4% 1% 71% 0% 5% 0% 4% 100% 0% 6% 50% 30% 0% 10% 0% 4% 100% 14% 4% 1% 71% 0%Cooking - 7% 0% 1% 92% 0% 0% 0% 0% 100% 7% 0% 1% 92% 0% 0% 0% 0% 100% 7% 0% 1% 92% 0%Others - 0% 0% 0% 0% 0% 0% 0% 100% 100% 0% 0% 0% 0% 0% 0% 0% 100% 100% 0% 0% 0% 0% 0%
- 0% 0% 0% 0% 0% 0% 0% 0% 0% 0% 0% 0% 0% 0% 0% 0% 0% 0% 0% 0 0 0% 0%- 0% 0% 0% 0% 0% 0% 0% 0% 0% 0% 0% 0% 0% 0% 0% 0% 0% 0% 0% 0 0 0 0- 0% 0% 0% 0% 0% 0% 0% 0% 0% 0% 0% 0% 0% 0% 0% 0% 0% 0% 0% 0 0 0 0- 0% 0% 0% 0% 0% 0% 0% 0% 0% 0% 0% 0% 0% 0% 0% 0% 0% 0% 0% 0 0 0 0- 0% 0% 0% 0% 0% 0% 0% 0% 0% 0% 0% 0% 0% 0% 0% 0% 0% 0% 0% 0 0 0 0- 0% 0% 0% 0% 0% 0% 0% 0% 0% 0% 0% 0% 0% 0% 0% 0% 0% 0% 0% 0 0 0 0
MtC2050 A (CM)2050 B (CM)
MtC/Mtoe2050 A (CM)2050 B (CM)
Energy service demand
6 CO2 Emission 2000
Factor2000
Residential sector
Unit4 Energy 2000
5 Emission
Energy consumption / CO2 Emission
Service Share
Mtoe
2000
Consumption 2050 A (CM)2050 B (CM)
2050 A (CM)
Unit 20002050
REF CM CM/REF
Unit2050 B (C
ResidentialResidential
CommercialCommercial
Transportation_PTransportation_P
Transportation_FTransportation_FIndustryIndustry
Enduse Sector

10
The United Nations Commission on Sustainable Development30 April – 11 May, 2007
Introduction of AIM/Energy Snapshot Tool
19
Back GroundBack Ground
Structures & FlowsStructures & Flows
Operation Operation
Enduse SectorEnduse Sector
Transformation SectorTransformation Sector
AnalysisAnalysis
Contents
JapanLow C arbonSociety 2050
Asia Pacific Integrated Model (AIM)Japan Low-Carbon Society Project
Base Year
Primary Energy
CO2 emission
Primary Energy
Final Energy
Services
CO2 emission
Energy use efficiency
Target Year
Enduse Sector
Secondary
Services
Enduse sector (IND, RES, COM, TR_P, TR_F)
The United Nations Commission on Sustainable Development30 April – 11 May, 2007
Introduction of AIM/Energy Snapshot Tool
20
Back GroundBack Ground
Structures & FlowsStructures & Flows
Operation Operation
Enduse SectorEnduse Sector
Transformation SectorTransformation Sector
AnalysisAnalysis
Contents
JapanLow C arbonSociety 2050
Asia Pacific Integrated Model (AIM)Japan Low-Carbon Society Project
0. Classification of service demand• Set classification of energy service demand & its
unit in residential sector• Scenario name, base year and target year set in CTL
sheet will shown in each table
A B A B A BCool Mtoe 12 12 12 12 12 100% 100%Warm Mtoe 72 72 72 72 72 100% 100%Hot Water Mtoe 34 34 34 34 34 100% 100%Cooking Mtoe 2 2 2 2 2 100% 100%Others Mtoe 11 11 11 11 11 100% 100%
0 00 00 00 00 00 0
CM CM/REFUnit 20002050
REF
Enduse Sector

11
The United Nations Commission on Sustainable Development30 April – 11 May, 2007
Introduction of AIM/Energy Snapshot Tool
21
Back GroundBack Ground
Structures & FlowsStructures & Flows
Operation Operation
Enduse SectorEnduse Sector
Transformation SectorTransformation Sector
AnalysisAnalysis
Contents
JapanLow C arbonSociety 2050
Asia Pacific Integrated Model (AIM)Japan Low-Carbon Society Project
1. Energy Cons. in base year
COL OIL GAS BMS S/W Heat H2 ELE TotalCool Mtoe 0.0 0.0 0.0 0.0 0.0 0.0 0.0 2.0 2.0Warm Mtoe 30.0 10.0 3.0 50.0 0.0 3.0 0.0 5.0 101.0Hot Water Mtoe 10.0 3.0 1.0 50.0 0.0 3.0 0.0 2.0 69.0Cooking Mtoe 5.0 0.0 1.0 113.0 0.0 0.0 0.0 0.0 119.0Others Mtoe 0.0 0.0 0.0 0.0 0.0 0.0 0.0 5.0 5.0
Mtoe 0.0 0.0 0.0 0.0 0.0 0.0 0.0 0.0 0.0Mtoe 0.0 0.0 0.0 0.0 0.0 0.0 0.0 0.0 0.0Mtoe 0.0 0.0 0.0 0.0 0.0 0.0 0.0 0.0 0.0Mtoe 0.0 0.0 0.0 0.0 0.0 0.0 0.0 0.0 0.0Mtoe 0.0 0.0 0.0 0.0 0.0 0.0 0.0 0.0 0.0Mtoe 0.0 0.0 0.0 0.0 0.0 0.0 0.0 0.0 0.0
Generation Mtoe 0.0Cogeneration Mtoe 0.0
Mtoe 0.0Total Mtoe 45 13 5 213 0 6 0 14 296
2000
• Past record of energy use in residential sector• If the appropriate data is not available, use
data of EBT (one sector), or make a guess!!Enduse Sector
The United Nations Commission on Sustainable Development30 April – 11 May, 2007
Introduction of AIM/Energy Snapshot Tool
22
Back GroundBack Ground
Structures & FlowsStructures & Flows
Operation Operation
Enduse SectorEnduse Sector
Transformation SectorTransformation Sector
AnalysisAnalysis
Contents
JapanLow C arbonSociety 2050
Asia Pacific Integrated Model (AIM)Japan Low-Carbon Society Project
2. Energy use eff. in base year• Set energy efficiency of each energy use
– Energy use efficiency: Ratio between the consumption of energy to service demand
– Keep consistency– The value can be relative value (Base Year=1.00)
COL OIL GAS BMS S/W Heat H2 ELE TotalCool toe/toe 2.00 -Warm toe/toe 0.70 0.70 0.70 0.90 1.00 3.00 -Hot Water toe/toe 0.80 0.80 0.80 0.80 1.00 1.00 1.00 -Cooking toe/toe 0.80 0.50 0.45 0.45 0.70 -Others toe/toe 1.00 -
toe/toe -toe/toe -toe/toe -toe/toe -
--
Unit2000
Enduse Sector
12
The United Nations Commission on Sustainable Development30 April – 11 May, 2007
Introduction of AIM/Energy Snapshot Tool
23
Back GroundBack Ground
Structures & FlowsStructures & Flows
Operation Operation
Enduse SectorEnduse Sector
Transformation SectorTransformation Sector
AnalysisAnalysis
Contents
JapanLow C arbonSociety 2050
Asia Pacific Integrated Model (AIM)Japan Low-Carbon Society Project
Base Year
Primary Energy
Final Energy
Services
CO2 emission
Primary Energy
Final Energy
Services
CO2 emission
Energy use efficiency
Target Year
Enduse Sector
Enduse sector (IND, RES, COM, TR_P, TR_F)
The United Nations Commission on Sustainable Development30 April – 11 May, 2007
Introduction of AIM/Energy Snapshot Tool
24
Back GroundBack Ground
Structures & FlowsStructures & Flows
Operation Operation
Enduse SectorEnduse Sector
Transformation SectorTransformation Sector
AnalysisAnalysis
Contents
JapanLow C arbonSociety 2050
Asia Pacific Integrated Model (AIM)Japan Low-Carbon Society Project
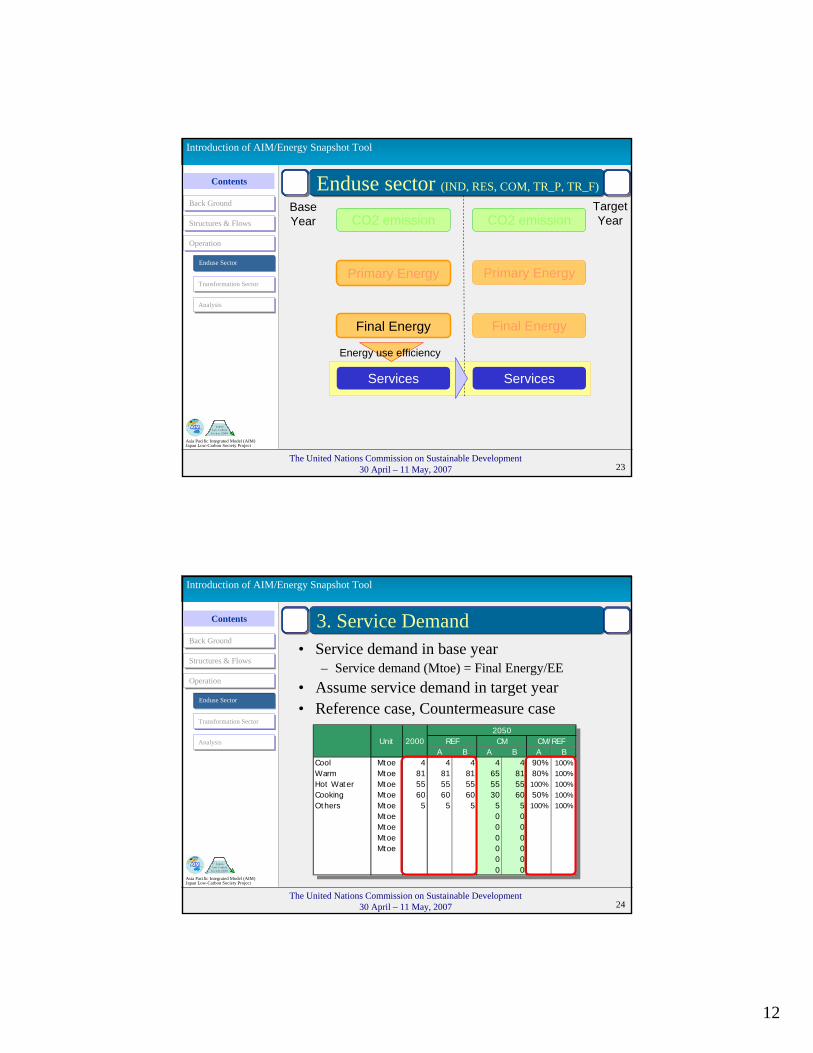
3. Service Demand
A B A B A BCool Mtoe 4 4 4 4 4 90% 100%Warm Mtoe 81 81 81 65 81 80% 100%Hot Water Mtoe 55 55 55 55 55 100% 100%Cooking Mtoe 60 60 60 30 60 50% 100%Others Mtoe 5 5 5 5 5 100% 100%
Mtoe 0 0Mtoe 0 0Mtoe 0 0Mtoe 0 0
0 00 0
Unit 20002050
REF CM CM/REF
• Service demand in base year– Service demand (Mtoe) = Final Energy/EE
• Assume service demand in target year• Reference case, Countermeasure case
Enduse Sector
13
The United Nations Commission on Sustainable Development30 April – 11 May, 2007
Introduction of AIM/Energy Snapshot Tool
25
Back GroundBack Ground
Structures & FlowsStructures & Flows
Operation Operation
Enduse SectorEnduse Sector
Transformation SectorTransformation Sector
AnalysisAnalysis
Contents
JapanLow C arbonSociety 2050
Asia Pacific Integrated Model (AIM)Japan Low-Carbon Society Project
Base Year
Primary Energy
Final Energy
Services
CO2 emission
Primary Energy
Final Energy
Services
CO2 emission
Energy use efficiency
Target Year
Energy use efficiency
Enduse Sector
Enduse sector (IND, RES, COM, TR_P, TR_F)
The United Nations Commission on Sustainable Development30 April – 11 May, 2007
Introduction of AIM/Energy Snapshot Tool
26
Back GroundBack Ground
Structures & FlowsStructures & Flows
Operation Operation
Enduse SectorEnduse Sector
Transformation SectorTransformation Sector
AnalysisAnalysis
Contents
JapanLow C arbonSociety 2050
Asia Pacific Integrated Model (AIM)Japan Low-Carbon Society Project
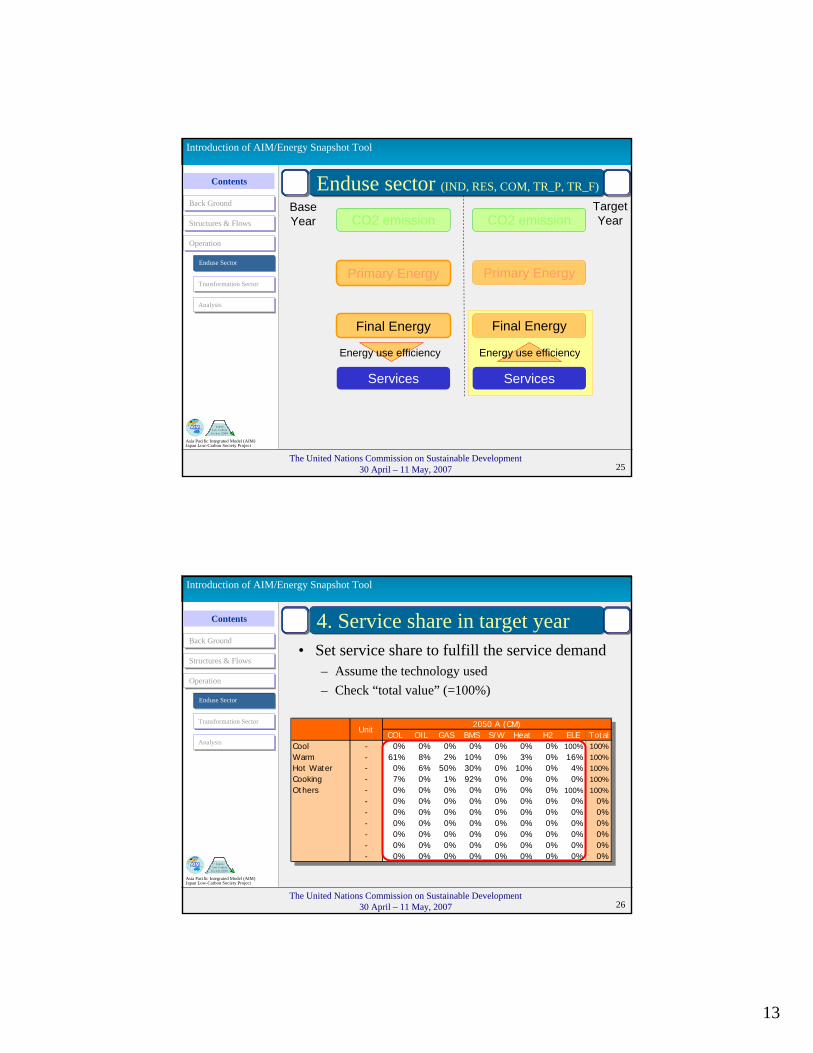
4. Service share in target year• Set service share to fulfill the service demand
– Assume the technology used– Check “total value” (=100%)
COL OIL GAS BMS S/W Heat H2 ELE TotalCool - 0% 0% 0% 0% 0% 0% 0% 100% 100%Warm - 61% 8% 2% 10% 0% 3% 0% 16% 100%Hot Water - 0% 6% 50% 30% 0% 10% 0% 4% 100%Cooking - 7% 0% 1% 92% 0% 0% 0% 0% 100%Others - 0% 0% 0% 0% 0% 0% 0% 100% 100%
- 0% 0% 0% 0% 0% 0% 0% 0% 0%- 0% 0% 0% 0% 0% 0% 0% 0% 0%- 0% 0% 0% 0% 0% 0% 0% 0% 0%- 0% 0% 0% 0% 0% 0% 0% 0% 0%- 0% 0% 0% 0% 0% 0% 0% 0% 0%- 0% 0% 0% 0% 0% 0% 0% 0% 0%
2050 A (CM)Unit
Enduse Sector

14
The United Nations Commission on Sustainable Development30 April – 11 May, 2007
Introduction of AIM/Energy Snapshot Tool
27
Back GroundBack Ground
Structures & FlowsStructures & Flows
Operation Operation
Enduse SectorEnduse Sector
Transformation SectorTransformation Sector
AnalysisAnalysis
Contents
JapanLow C arbonSociety 2050
Asia Pacific Integrated Model (AIM)Japan Low-Carbon Society Project
5. Energy use eff. in target year
COL OIL GAS BMS S/W Heat H2 ELE TotalCool toe/toe 2.00 -Warm toe/toe 0.90 0.70 0.70 0.90 1.00 3.00 -Hot Water toe/toe 0.80 0.80 0.80 0.80 1.00 1.00 1.00 -Cooking toe/toe 0.80 0.50 0.45 0.45 0.70 -Others toe/toe 1.00 -
toe/toe -toe/toe -toe/toe -toe/toe -
--
Unit2050 A (CM)
• Set energy efficiency of each energy use in Target Year– Keep consistency– The value can be relative value (Base Year=1.00)Enduse Sector
The United Nations Commission on Sustainable Development30 April – 11 May, 2007
Introduction of AIM/Energy Snapshot Tool
28
Back GroundBack Ground
Structures & FlowsStructures & Flows
Operation Operation
Enduse SectorEnduse Sector
Transformation SectorTransformation Sector
AnalysisAnalysis
Contents
JapanLow C arbonSociety 2050
Asia Pacific Integrated Model (AIM)Japan Low-Carbon Society Project
6. Energy Cons. in Target year• Calculated automatically• Additional Input
– Generation: PV etc.– CHP: Fuel cells, Gas engine etc.
COL OIL GAS BMS S/W Heat H2 ELE TotalCool Mtoe 0.0 0.0 0.0 0.0 0.0 0.0 0.0 1.8 1.8Warm Mtoe 50.6 8.0 2.4 8.3 0.0 2.4 0.0 4.0 75.7Hot Water Mtoe 0.0 4.2 35.0 21.0 0.0 5.6 0.0 2.0 67.8Cooking Mtoe 2.5 0.0 0.5 57.0 0.0 0.0 0.0 0.0 60.0Others Mtoe 0.0 0.0 0.0 0.0 0.0 0.0 0.0 5.0 5.0
Mtoe 0.0 0.0 0.0 0.0 0.0 0.0 0.0 0.0 0.0Mtoe 0.0 0.0 0.0 0.0 0.0 0.0 0.0 0.0 0.0Mtoe 0.0 0.0 0.0 0.0 0.0 0.0 0.0 0.0 0.0Mtoe 0.0 0.0 0.0 0.0 0.0 0.0 0.0 0.0 0.0Mtoe 0.0 0.0 0.0 0.0 0.0 0.0 0.0 0.0 0.0Mtoe 0.0 0.0 0.0 0.0 0.0 0.0 0.0 0.0 0.0
Generation Mtoe 0.0Cogeneration Mtoe 0.0
Mtoe 0.0Total Mtoe 53 12 38 86 0 8 0 13 210
2050 A (CM)
Enduse Sector

15
The United Nations Commission on Sustainable Development30 April – 11 May, 2007
Introduction of AIM/Energy Snapshot Tool
29
Back GroundBack Ground
Structures & FlowsStructures & Flows
Operation Operation
Enduse SectorEnduse Sector
Transformation SectorTransformation Sector
AnalysisAnalysis
Contents
JapanLow C arbonSociety 2050
Asia Pacific Integrated Model (AIM)Japan Low-Carbon Society Project
7. Check the results
- 50 100 150 200 250 300 350
- 20 40 60 80 100 120
2000
2050 A (CM)
2050 B (CM)
COL OIL GAS BMS S/W Heat H2 ELE
2000
2050 A (CM)
2050 B (CM)
COL OIL GAS BMS S/W Heat H2 ELE
- 50 100 150 200 250 300 350
Energy Consumption
CO2 Emission
Note: Before implement CO2 analysis, assumption of energy transformation needed to be made
Note: Before implement CO2 analysis, assumption of energy transformation needed to be made
Enduse Sector
The United Nations Commission on Sustainable Development30 April – 11 May, 2007
Introduction of AIM/Energy Snapshot Tool
30
Back GroundBack Ground
Structures & FlowsStructures & Flows
Operation Operation
Enduse SectorEnduse Sector
Transformation SectorTransformation Sector
AnalysisAnalysis
Contents
JapanLow C arbonSociety 2050
Asia Pacific Integrated Model (AIM)Japan Low-Carbon Society Project
Transformation SectorTransformation Sector

16
The United Nations Commission on Sustainable Development30 April – 11 May, 2007
Introduction of AIM/Energy Snapshot Tool
31
Back GroundBack Ground
Structures & FlowsStructures & Flows
Operation Operation
Enduse SectorEnduse Sector
Transformation SectorTransformation Sector
AnalysisAnalysis
Contents
JapanLow C arbonSociety 2050
Asia Pacific Integrated Model (AIM)Japan Low-Carbon Society Project
Transformation SectorBase Year
Primary Energy
Final Energy
Services
CO2 emission
Primary Energy
Final Energy
Services
CO2 emission
Emission factors Emission factors
Energy use efficiency
Transformation efficiency
Energy use efficiency
Transformation efficiency
Target Year
Transformation Sector
The United Nations Commission on Sustainable Development30 April – 11 May, 2007
Introduction of AIM/Energy Snapshot Tool
32
Back GroundBack Ground
Structures & FlowsStructures & Flows
Operation Operation
Enduse SectorEnduse Sector
Transformation SectorTransformation Sector
AnalysisAnalysis
Contents
JapanLow C arbonSociety 2050
Asia Pacific Integrated Model (AIM)Japan Low-Carbon Society Project
Electricity Generation (PWR)
A B A B A B A B
1. Electricity demand at receiver endMtoe 98 88 86 88 86 98 98 98 98
2. Difference between demand and supplyMtoe 12.16 0.00 0.00 0.00 0.00 0.00 0.00 0.00 0.00
3. Electricity supply at receiver endMtoe 103 88 86 88 86 98 98 98 98
Transmission Loss 6.84% 5.31% 5.31% 5.3% 5.3% 5.3% 5.3% 5.3% 5.3%
4. Electricity supply before tranmissionMtoe 111 93 91 93 91 104 104 104 104
Mtoe 0 1 1 0 0 1 1 0 0100.0% 100.0% 100.0% 100.0% 100.0% 100.0% 100.0% 100.0% 100.0%
Mtoe 0 1 1 0 0 1 1 0 0
Mtoe 6 4 4 5 5 5 4 6 6
COL 6.0% 6.0% 6.0% 6.0% 6.0% 6.0% 6.0% 6.0% 6.0%GAS 4.0% 4.0% 4.0% 4.0% 4.0% 4.0% 4.0% 4.0% 4.0%OIL 5.0% 5.0% 5.0% 5.0% 5.0% 5.0% 5.0% 5.0% 5.0%NUC 4.4% 4.4% 4.4% 4.4% 4.4% 4.4% 4.4% 4.4% 4.4%HYD 0.5% 0.5% 0.5% 0.5% 0.5% 0.5% 0.5% 0.5% 0.5%HYD(P) 0.5% 0.5% 0.5% 0.5% 0.5% 0.5% 0.5% 0.5% 0.5%GEO 8.0% 8.0% 8.0% 8.0% 8.0% 8.0% 8.0% 8.0% 8.0%
Own use in plantOwn use rate
Power generation sector
2000 No 2050
Supply & Demand Only Demand Only Supply
Electricity supply
Electricity supplyPumped storage (PS)
Ele. demand of PSEfficiencyGeneration of PS
Own use
Solver
PS
• Goal: Primary energy consumed for electricity generation in target year.
Transformation Sector

17
The United Nations Commission on Sustainable Development30 April – 11 May, 2007
Introduction of AIM/Energy Snapshot Tool
33
Back GroundBack Ground
Structures & FlowsStructures & Flows
Operation Operation
Enduse SectorEnduse Sector
Transformation SectorTransformation Sector
AnalysisAnalysis
Contents
JapanLow C arbonSociety 2050
Asia Pacific Integrated Model (AIM)Japan Low-Carbon Society Project
Electricity Generation (PWR)
Generation EndGeneration End
Own use
Pumped storage
Transmission losses
Receiver EndReceiver End
Transformation losses
Primary Energy
Transformation Sector
The United Nations Commission on Sustainable Development30 April – 11 May, 2007
Introduction of AIM/Energy Snapshot Tool
34
Back GroundBack Ground
Structures & FlowsStructures & Flows
Operation Operation
Enduse SectorEnduse Sector
Transformation SectorTransformation Sector
AnalysisAnalysis
Contents
JapanLow C arbonSociety 2050
Asia Pacific Integrated Model (AIM)Japan Low-Carbon Society Project
Electricity Generation (PWR)• Data setting for reference year
– Electricity demand at receivers end– Electricity transmission losses– Efficiency of pumped storage (Def: ratio
between consumed energy while pumping and generated energy)
– Own use rate of electricity plant– Electricity supply at generation end– Primary Energy Consumption
Transformation Sector

18
The United Nations Commission on Sustainable Development30 April – 11 May, 2007
Introduction of AIM/Energy Snapshot Tool
35
Back GroundBack Ground
Structures & FlowsStructures & Flows
Operation Operation
Enduse SectorEnduse Sector
Transformation SectorTransformation Sector
AnalysisAnalysis
Contents
JapanLow C arbonSociety 2050
Asia Pacific Integrated Model (AIM)Japan Low-Carbon Society Project
Electricity Generation (PWR)• Data setting for target year (scenario)
– Electricity transmission losses– Efficiencies of pumped storage– Own use rate– Mixture of energy– Thermal efficiency
• Click “Solver”!!– “Electricity supply at generation end” is
calculated automatically so that the electricity demand of the end-user would be fulfilled
– Primary energy supply for electricity generation is calculated
Transformation Sector
The United Nations Commission on Sustainable Development30 April – 11 May, 2007
Introduction of AIM/Energy Snapshot Tool
36
Back GroundBack Ground
Structures & FlowsStructures & Flows
Operation Operation
Enduse SectorEnduse Sector
Transformation SectorTransformation Sector
AnalysisAnalysis
Contents
JapanLow C arbonSociety 2050
Asia Pacific Integrated Model (AIM)Japan Low-Carbon Society Project
2050 A (CM)COL OIL GAS BMS NUC HYD S/W Heat H2 ELE Total '90=100
Energy BalancesPower Gnr. 15 0 41 0 92 8 1 -66 90CCS 3 3Heat 0Coal/Oil/Gas 2 2Hydrogen 12 13 -14 11Industrial 23 39 45 5 0 0 0 29 140Residential 0 1 1 0 8 0 4 14 27Commercial 0 1 1 0 3 0 5 18 28Trans. Prv. 0 4 0 2 0 0 3 2 11Trans. Frg. 0 3 0 9 0 0 3 1 17Enduse 23 48 47 16 11 0 14 64 223Total 38 50 100 16 92 8 25 0 0 -0 330Feedstock in total 14
Emission Factor (MtC/Mtoe) 1.05 0.80 0.55 0.00 0.00 0.00 0.00 (0.00) (0.47) (0.00)CO2 Gnr. (MtC) 40 29 55 0 0 0 0 - - - 124 43.6CO2 CCS (MtC) -16 -23 - - - -39
00
CO2 Ems. (MtC) 24 28.6 33 0 0 0 0 - - - 85 30.0
Other energy transformation (EB_SD)(a) Energy use for CCS(b) Amount of carbon captured(c) Heat supply(d) Feedstock(e) Losses of Coal/Oil/Gas during refining processes
(a)
(b)
(c)
(d)
(e)
Transformation Sector

19
The United Nations Commission on Sustainable Development30 April – 11 May, 2007
Introduction of AIM/Energy Snapshot Tool
37
Back GroundBack Ground
Structures & FlowsStructures & Flows
Operation Operation
Enduse SectorEnduse Sector
Transformation SectorTransformation Sector
AnalysisAnalysis
Contents
JapanLow C arbonSociety 2050
Asia Pacific Integrated Model (AIM)Japan Low-Carbon Society Project
AnalysisAnalysis
The United Nations Commission on Sustainable Development30 April – 11 May, 2007
Introduction of AIM/Energy Snapshot Tool
38
Back GroundBack Ground
Structures & FlowsStructures & Flows
Operation Operation
Enduse SectorEnduse Sector
Transformation SectorTransformation Sector
AnalysisAnalysis
Contents
JapanLow C arbonSociety 2050
Asia Pacific Integrated Model (AIM)Japan Low-Carbon Society Project
Factor analysis (Factors)• Extended Kaya Identity
termCross)/()/(
)/()/(
)/()/(
+′′Δ
+′′Δ
+Δ
+Δ
=Δ
CCCC
ECEC
DEDE
DD
CC
CC
EC
DEDC
′×′
××=
C: CO2 emissionD: Driving forces (service demand) E: Energy ConsumptionC’: CO2 emission without measures in transformation sector
E/D: Energy IntensityC’/E: CO2 intensity in end-use sectorC/C’: CO2 intensity in transformation sector
C: CO2 emissionD: Driving forces (service demand) E: Energy ConsumptionC’: CO2 emission without measures in transformation sector
E/D: Energy IntensityC’/E: CO2 intensity in end-use sectorC/C’: CO2 intensity in transformation sector
Analysis

20
The United Nations Commission on Sustainable Development30 April – 11 May, 2007
Introduction of AIM/Energy Snapshot Tool
39
Back GroundBack Ground
Structures & FlowsStructures & Flows
Operation Operation
Enduse SectorEnduse Sector
Transformation SectorTransformation Sector
AnalysisAnalysis
Contents
JapanLow C arbonSociety 2050
Asia Pacific Integrated Model (AIM)Japan Low-Carbon Society Project
Factor analysis (Factors)• Kaya Identity
termCross)/()/(
)/()/(
)/()/(
+′′Δ
+′′Δ
+Δ
+Δ
=Δ
CCCC
ECEC
DEDE
DD
CC
1%
-17%
-1%
-34%
-51%
1%
-26%
-12%
-36%
-73%-80%
-70%
-60%
-50%
-40%
-30%
-20%
-10%
0%
10%
D E/D
C/E
C'/C
Tota
l
vs 2
000'
s
2050 A 2050 B
Factors
Analysis
Application of AIM/Energy Application of AIM/Energy Snapshot Tool to JapanSnapshot Tool to Japan
-- Japan Low Carbon Society Scenario Japan Low Carbon Society Scenario --
The United Nations Commission on Sustainable Development30 April – 11 May, 2007
Ms. Ms. MahoMaho MIYASHITA (TAKIMI) MIYASHITA (TAKIMI) Mizuho Information & Research InstituteMizuho Information & Research InstituteProf. P.R. Prof. P.R. ShuklaShukla Indian Institute of ManagementIndian Institute of ManagementDr. Dr. MikikoMikiko KAINUMA KAINUMA National Institute for Environmental StudiesNational Institute for Environmental Studies

21
The United Nations Commission on Sustainable Development30 April – 11 May, 2007
Introduction of AIM/Energy Snapshot Tool
41
Back GroundBack Ground
Structures & FlowsStructures & Flows
Operation Operation
Enduse SectorEnduse Sector
Transformation SectorTransformation Sector
AnalysisAnalysis
Contents
JapanLow C arbonSociety 2050
Asia Pacific Integrated Model (AIM)Japan Low-Carbon Society Project
Contents
• Why do we need Low Carbon Society?• Overview of Japan LCS project• Approach to develop Japan LCS scenario
– Visions of 2050– Narrative description of scenarios– Quantification of scenarios
• 70% CO2 emission reduction by 2050
The United Nations Commission on Sustainable Development30 April – 11 May, 2007
Introduction of AIM/Energy Snapshot Tool
42
Back GroundBack Ground
Structures & FlowsStructures & Flows
Operation Operation
Enduse SectorEnduse Sector
Transformation SectorTransformation Sector
AnalysisAnalysis
Contents
JapanLow C arbonSociety 2050
Asia Pacific Integrated Model (AIM)Japan Low-Carbon Society Project
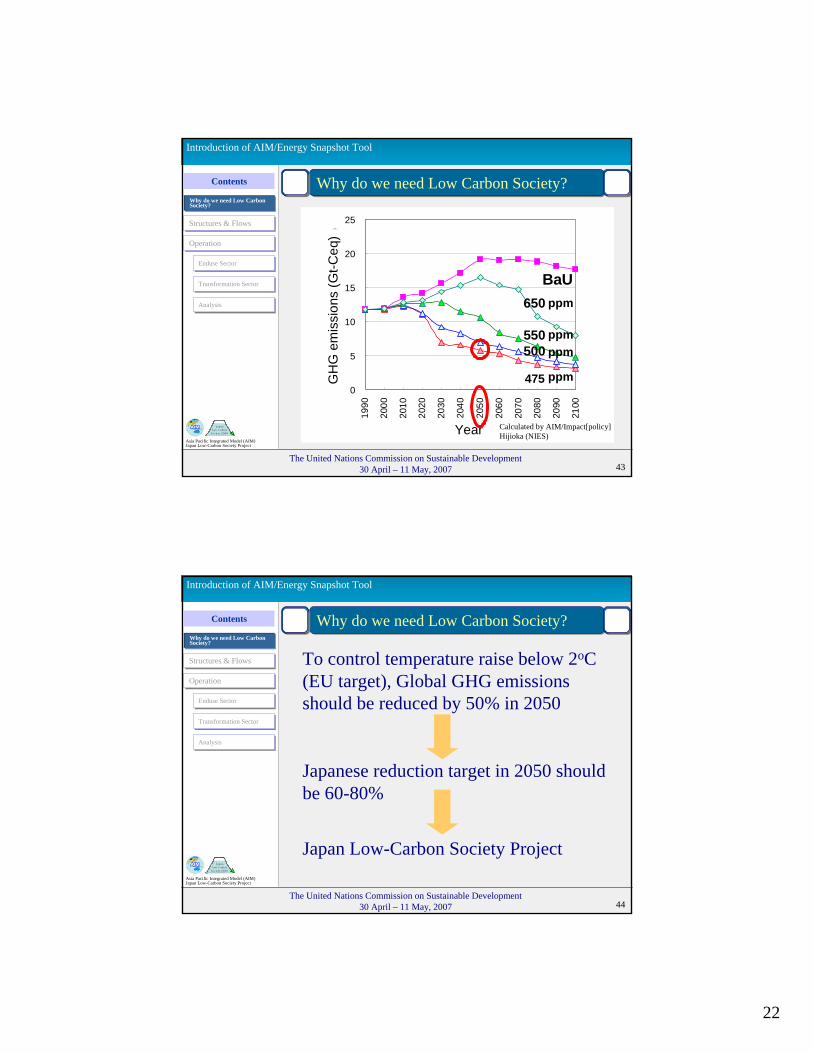
Why do we need Low Carbon Society?
0.0
1.0
2.0
3.0
4.0
5.0
1990
2000
2010
2020
2030
2040
2050
2060
2070
2080
2090
2100
2110
2120
2130
2140
2150
年
気温
上昇
(199
0年=0
.6℃
)Te
mpe
ratu
re ra
ise
(abo
ve th
e pr
e-in
dust
rial l
evel
)
Year
475
650550500
BaU
Calculated by AIM model
Calculated by AIM/Impact[policy] Hijioka (NIES)
Why do we need Low Carbon Society?
ppmppmppm
ppm
22
The United Nations Commission on Sustainable Development30 April – 11 May, 2007
Introduction of AIM/Energy Snapshot Tool
43
Back GroundBack Ground
Structures & FlowsStructures & Flows
Operation Operation
Enduse SectorEnduse Sector
Transformation SectorTransformation Sector
AnalysisAnalysis
Contents
JapanLow C arbonSociety 2050
Asia Pacific Integrated Model (AIM)Japan Low-Carbon Society Project
0
5
10
15
20
25
1990
2000
2010
2020
2030
2040
2050
2060
2070
2080
2090
2100
年
温室効果
ガス排出量
(二酸化炭
素換
算:G
tC/年
)
650
550500
BaU
GH
G e
mis
sion
s (G
t-Ceq
)
Year Calculated by AIM/Impact[policy] Hijioka (NIES)
Why do we need Low Carbon Society?Why do we need Low Carbon Society?
ppm
ppmppm
ppm475
The United Nations Commission on Sustainable Development30 April – 11 May, 2007
Introduction of AIM/Energy Snapshot Tool
44
Back GroundBack Ground
Structures & FlowsStructures & Flows
Operation Operation
Enduse SectorEnduse Sector
Transformation SectorTransformation Sector
AnalysisAnalysis
Contents
JapanLow C arbonSociety 2050
Asia Pacific Integrated Model (AIM)Japan Low-Carbon Society Project
Japan Low-Carbon Society Project
To control temperature raise below 2oC (EU target), Global GHG emissions should be reduced by 50% in 2050
Japanese reduction target in 2050 should be 60-80%
Why do we need Low Carbon Society?Why do we need Low Carbon Society?

23
The United Nations Commission on Sustainable Development30 April – 11 May, 2007
Introduction of AIM/Energy Snapshot Tool
45
Back GroundBack Ground
Structures & FlowsStructures & Flows
Operation Operation
Enduse SectorEnduse Sector
Transformation SectorTransformation Sector
AnalysisAnalysis
Contents
JapanLow C arbonSociety 2050
Asia Pacific Integrated Model (AIM)Japan Low-Carbon Society Project
Overview of Japan LCS projectJapan Low Carbon Society Scenarios toward 2050
FY2004-2006 (PhaseI),2007-2008 (Phase II)Global Environmental Research Program, MOEJ
Green buildingsSelf-sustained city
Decentralized services
Eco awarenessEffective
communicationDematerializa
tion
1990
2000
2020
2050
2010
BaU scenario
Interventionscenario
EE improvement
New energy
Energy saving
Structure change
Life-stylechange
Tech. innovation
Urban structure IT-society
Techno-Socio Innovation Study
GHG reduction target(eg. 60-80% reduction by 1990 level)
Evaluate feasibility of GHG reduction target
Long-termScenario
DevelopmentStudy
Development of socio-economic scenarios, evaluating counter-measures with social-economic-technology models GH
G em
issi
on
DecoplingEco modernizationHigh value industry
Middle-termTarget year
Loge-termTarget year
-1135
Valid
Equity
Suitable
Effective
ReductionTarget study
Study environmental options toward low carbon society in Japan Advisory board:advice to project
5 teams60 Researchers
Propose options of long-term global warming policy
Next generation vehiclesEfficient transportation
systemAdvanced logisticsTransportation
system
Industrial structure
Japan Low Carbon Society Scenarios toward 2050FY2004-2006 (PhaseI),2007-2008 (Phase II)
Global Environmental Research Program, MOEJ
Green buildingsSelf-sustained city
Decentralized services
Eco awarenessEffective
communicationDematerializa
tion
1990
2000
2020
2050
2010
BaU scenario
Interventionscenario
EE improvement
New energy
Energy saving
Structure change
Life-stylechange
Tech. innovation
Urban structure IT-society
Techno-Socio Innovation Study
GHG reduction target(eg. 60-80% reduction by 1990 level)
Evaluate feasibility of GHG reduction target
Long-termScenario
DevelopmentStudy
Development of socio-economic scenarios, evaluating counter-measures with social-economic-technology models GH
G em
issi
on
DecoplingEco modernizationHigh value industry
Middle-termTarget year
Loge-termTarget year
-1135
Valid
Equity
Suitable
Effective -1135
Valid
Equity
Suitable
Effective
ReductionTarget study
Study environmental options toward low carbon society in Japan Advisory board:advice to project
5 teams60 Researchers
Propose options of long-term global warming policy
Next generation vehiclesEfficient transportation
systemAdvanced logisticsTransportation
system
Industrial structure
Junichi Fujino
Overview of Japan LCS project
The United Nations Commission on Sustainable Development30 April – 11 May, 2007
Introduction of AIM/Energy Snapshot Tool
46
Back GroundBack Ground
Structures & FlowsStructures & Flows
Operation Operation
Enduse SectorEnduse Sector
Transformation SectorTransformation Sector
AnalysisAnalysis
Contents
JapanLow C arbonSociety 2050
Asia Pacific Integrated Model (AIM)Japan Low-Carbon Society Project
2020 20502000
Long-term target year
Release of A
IM result
Technology development,socio-economic change projected by historically trend
Forecasting
Back-casting
Normative target world
Reference future world
Service demand change
by changing social behavior, lifestyles
and institutions
Mitigation Technology
developmentRequiredPolicy
intervention and Investment
required intervention policy and measures
Envi
ronm
enta
l pre
ssur
e
Checkingyear(2015)
Checkingyear(2025)
Requ
ired
int
erve
ntion
3. We need“Trend Breaks”
to realize visions
2. We need“Visions”
1.Target may be tough
50% reductionsIn the world
Approach to develop Japan LCS scenario
Junichi Fujino
Approach to develop Japan LCS scenario

24
The United Nations Commission on Sustainable Development30 April – 11 May, 2007
Introduction of AIM/Energy Snapshot Tool
47
Back GroundBack Ground
Structures & FlowsStructures & Flows
Operation Operation
Enduse SectorEnduse Sector
Transformation SectorTransformation Sector
AnalysisAnalysis
Contents
JapanLow C arbonSociety 2050
Asia Pacific Integrated Model (AIM)Japan Low-Carbon Society Project
Visions of 2050
Social and Cultural ValuesComfortable and Convenient
Self-sufficientProduce locally, consume locally
Technology breakthroughCentralized production /recycle
Decentralized/CommunityUrban/Personal
Slow, Natural-orientedVivid, Technology-driven
Vision B “Satsuki and Mei”Vision A “Doraemon”
Akemi Imagawa
Visions of 2050
The United Nations Commission on Sustainable Development30 April – 11 May, 2007
Introduction of AIM/Energy Snapshot Tool
48
Back GroundBack Ground
Structures & FlowsStructures & Flows
Operation Operation
Enduse SectorEnduse Sector
Transformation SectorTransformation Sector
AnalysisAnalysis
Contents
JapanLow C arbonSociety 2050
Asia Pacific Integrated Model (AIM)Japan Low-Carbon Society Project
Doraemon is a Japanese comic series created by Fujiko F. Fujio. The series is about a robotic cat named Doraemon, who travels back in time from the 22nd century. He has a pocket, which connects to the fourth dimension and acts like a wormhole.
Satsuki and Mei’s House reproduced in the 2005 World Expo. Satsuki and Mei are daughters in the film "My Neighbor Totoro". They lived an old house in rural Japan, near which many curious and magical creatures inhabited.
Visions of 2050
Visions of 2050

25
The United Nations Commission on Sustainable Development30 April – 11 May, 2007
Introduction of AIM/Energy Snapshot Tool
49
Back GroundBack Ground
Structures & FlowsStructures & Flows
Operation Operation
Enduse SectorEnduse Sector
Transformation SectorTransformation Sector
AnalysisAnalysis
Contents
JapanLow C arbonSociety 2050
Asia Pacific Integrated Model (AIM)Japan Low-Carbon Society Project
Narrative description of scenarios
Technical progresses in the industrial sectors are considerably high because of vigorous R&D investments by the government and business sectors. The economic activities as a whole are so dynamic that average annual per capita GDP growth rate is kept at the level of 2%. The other reasons for such high economic growth are high rates of consumption in both business and household sectors.
The employment system has been drastically changed from that in 2000 and equal opportunities for the employment have been achieved. Since workers are employed based on their abilities or talents regardless of their sex, nationality and age, the motivation of the worker is quite high in general.
As many women work outside, the average time spent for housekeeping has decreased. Most of the household works are replaced by housekeeping robots or services provided by private companies. Instead, the time used for personal career development has increased.
The new technologies, products, services are positively accepted in the society. Therefore, purchasing power of the consumer is strong and upgrade cycles of the commodities are short.
Household size becomes smaller and the number of single-member households has increased. Multi-dwellings are preferred over detached houses, and the urban lifestyle is more popular than the lifestyle of countryside.
Scenario A
Narrative description of scenarios
The United Nations Commission on Sustainable Development30 April – 11 May, 2007
Introduction of AIM/Energy Snapshot Tool
50
Back GroundBack Ground
Structures & FlowsStructures & Flows
Operation Operation
Enduse SectorEnduse Sector
Transformation SectorTransformation Sector
AnalysisAnalysis
Contents
JapanLow C arbonSociety 2050
Asia Pacific Integrated Model (AIM)Japan Low-Carbon Society Project
Although average annual growth rate of per capita GDP is approximately 1%,people can receive adequate social services no matter where they live. Volunteer works or community based mutual aid activities are the main provider of the services. Since the levels of medical and educational service in the countryside have drastically improved, continuous migration of population from city to countryside has been observed.
The number of family who own detached dwellings has increased. The trend is especially prominent in the countryside. The size of the houses and the floor area per houses has also increased with the increasing share of detached houses.
The ways people work have also changed. The practice that husbands work outside and wives work at home is not common anymore. In order to avoid the excessive work of the partner, the couples help each other and secure the income according to their life plan. Housework is shared mainly among family members, but free housekeeping services provided by local community or social activity organizations are also available. As a result of the changes in lifestyle, the time spent within family has increased. The time spent on hobby, sports, cultural activities, volunteer activities, agricultural works, and social activities has also increased.
Narrative description of scenariosScenario B
Narrative description of scenarios
26
The United Nations Commission on Sustainable Development30 April – 11 May, 2007
Introduction of AIM/Energy Snapshot Tool
51
Back GroundBack Ground
Structures & FlowsStructures & Flows
Operation Operation
Enduse SectorEnduse Sector
Transformation SectorTransformation Sector
AnalysisAnalysis
Contents
JapanLow C arbonSociety 2050
Asia Pacific Integrated Model (AIM)Japan Low-Carbon Society Project
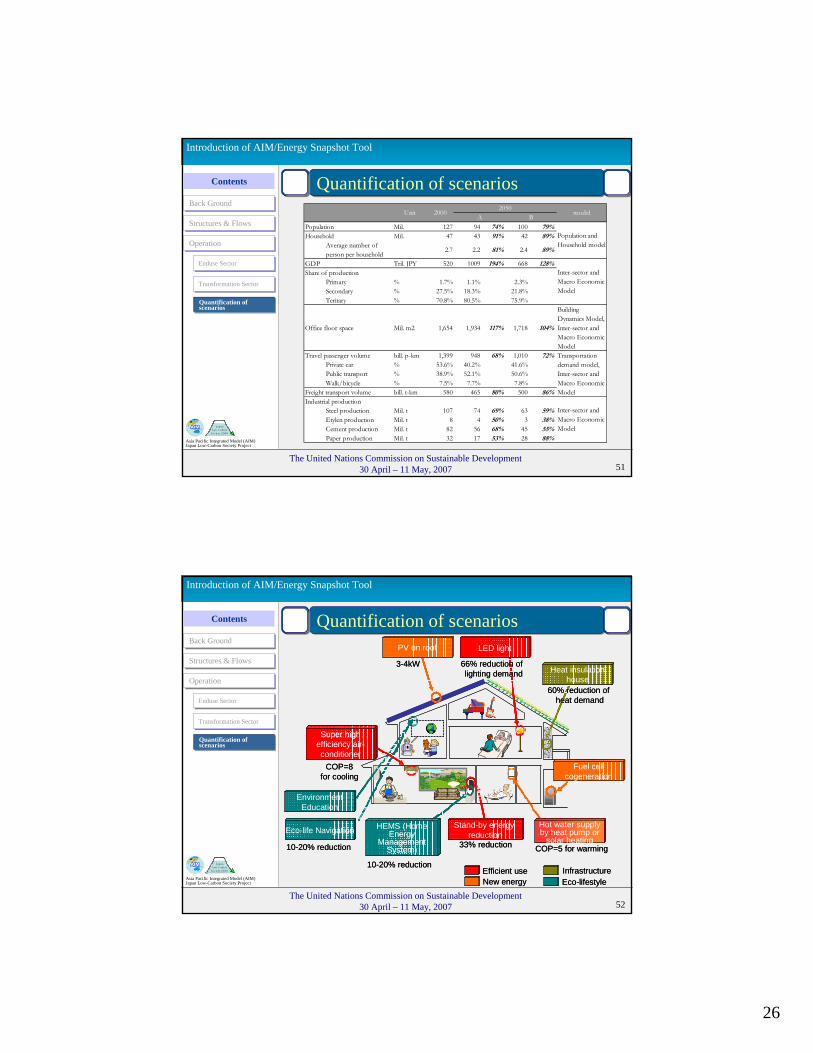
Quantification of scenarios
Quantification of scenarios
Population Mil. 127 94 74% 100 79%Household Mil. 47 43 91% 42 89%
Average number ofperson per household
2.7 2.2 81% 2.4 89%
GDP Tril. JPY 520 1009 194% 668 128%Share of production
Primary % 1.7% 1.1% 2.3%Secondary % 27.5% 18.3% 21.8%Teritary % 70.8% 80.5% 75.9%
Office floor space Mil. m2 1,654 1,934 117% 1,718 104%
BuildingDynamics Model,Inter-sector andMacro EconomicModel
Travel passenger volume bill. p-km 1,399 948 68% 1,010 72%Private car % 53.6% 40.2% 41.6%Public transport % 38.9% 52.1% 50.6%Walk/bicycle % 7.5% 7.7% 7.8%
Freight transport volume bill. t-km 580 465 80% 500 86%Industrial production
Steel production Mil. t 107 74 69% 63 59%Etylen production Mil. t 8 4 50% 3 38%Cement production Mil. t 82 56 68% 45 55%Paper production Mil. t 32 17 53% 28 88%
Inter-sector andMacro EconomicModel
model
Population andHousehold model
Inter-sector andMacro EconomicModel
Transportationdemand model,Inter-sector andMacro EconomicModel
2050A B
Unit 2000
The United Nations Commission on Sustainable Development30 April – 11 May, 2007
Introduction of AIM/Energy Snapshot Tool
52
Back GroundBack Ground
Structures & FlowsStructures & Flows
Operation Operation
Enduse SectorEnduse Sector
Transformation SectorTransformation Sector
AnalysisAnalysis
Contents
JapanLow C arbonSociety 2050
Asia Pacific Integrated Model (AIM)Japan Low-Carbon Society Project
Quantification of scenarios
Efficient useNew energy
InfrastructureEco-lifestyle
Super high efficiency air-conditioner
Stand-by energy reduction
LED lightPV on roof
Fuel cell cogeneration
Heat insulation house
Hot water supply by heat pump or
solar heating
HEMS (Home Energy
Management System)
Eco-life Navigation
COP=8for cooling
EnvironmentEducation
10-20% reduction
66% reduction oflighting demand
60% reduction of heat demand
33% reduction COP=5 for warming10-20% reduction
3-4kW
Quantification of scenarios

27
The United Nations Commission on Sustainable Development30 April – 11 May, 2007
Introduction of AIM/Energy Snapshot Tool
53
Back GroundBack Ground
Structures & FlowsStructures & Flows
Operation Operation
Enduse SectorEnduse Sector
Transformation SectorTransformation Sector
AnalysisAnalysis
Contents
JapanLow C arbonSociety 2050
Asia Pacific Integrated Model (AIM)Japan Low-Carbon Society Project
70% CO2 emission reduction by 2050
70% CO2 emission reduction by 2050
CO
2 em
issio
n in
20
50
2000年
CO2排
出量
Scenario A :2050Scenario A :2050
Activity26
CO2
emis
isio
nin
200
0
EE79
CI27
CI77
SD29
CCS39
(MtC)
20
9
19
30
510
30
13
77
39
Energy Intensity Imp.
Carbon Intensity Imp.
Reduction of servicedemands
• Efficient air-conditioner, Efficient water heater, Efficient lighting system
• Fuel cell system• Photovoltaic on the roof
• High economic growth• Decrease of population and number of households
• Energy efficient improvement of furnace and motor etc.
• Fuel switching from coal/oil to natural gas
• High insulation dwelling and building• Home/Building energy management system
• Intensive land-use, Concentrated urban function• Public transportation system
• Motor-driven mobiles: Electric battery vehicles, Fuel cellbattery vehicles
• Advanced fossil fueled plants + CCS• Hydrogen supply using fossil fuel + CCS
• Nuclear energy• Effective use of electricity in night time with storage• Hydrogen supply with low-carbon energy sources
Energy Intensity Imp.
Carbon Intensity Imp.
Reduction of servicedemands
Energy Intensity Imp.
Carbon Intensity Imp.
Carbon Intensity Imp.
CCS
Activity
[ Industrial ]
[ Transportation ]
[Energy transformation]
[ Residential and commercial ]
[ Society ]
2000年
CO2排
出量
CO
2 em
issio
n in
199
0
70%
redu
ctio
n
EE: Energy Efficiency Improvement, CI: Carbon Intensity Improvement, SD: Reduction of Service Demands
Main factors to reduce CO2 emissions
The United Nations Commission on Sustainable Development30 April – 11 May, 2007
Introduction of AIM/Energy Snapshot Tool
54
Back GroundBack Ground
Structures & FlowsStructures & Flows
Operation Operation
Enduse SectorEnduse Sector
Transformation SectorTransformation Sector
AnalysisAnalysis
Contents
JapanLow C arbonSociety 2050
Asia Pacific Integrated Model (AIM)Japan Low-Carbon Society Project
70% CO2 emission reduction by 2050
70% CO2 emission reduction by 2050
Energy Intensity Imp.
Carbon Intensity Imp.
Reduction of servicedemands
• Efficient air-conditioner, Efficient water heater, Efficientlighting system
• Photovoltaic on the roof• Expanding biomass energy use in home• Diffusion of solar water heating
• Reduction of final demand by material saturation• Reduction of raw material production• Decrease of population and number of households
• Energy efficient improvement of furnace and motor etc.
• Increase of Fuel switching from coal/oil to natural gas /biomass
• High insulation dwelling and building• Eco-life navigation system
• Shortening trip distances for commuting through intensive land use• Infrastructure for pedestrians and bicycle riders (sidewalk, bikeway, cycle parking)
• Biomass-hybrid engine vehicle
• Expanding share of both advanced gas combined cycle and biomass generation
Energy Intensity Imp.
Carbon Intensity Imp.
Energy Intensity Imp.
Carbon Intensity Imp.
Carbon Intensity Imp.
Activity
[ Industrial ]
[ Transportation ]
[Energy transformation ]
[ Residential and commercial ]
[ Society ]
CO2
emiss
ion
in 2
050
2000年
CO2排
出量
Activity4
2000年
CO2排
出量
SD27
EE52
CI74
CI74
918
18
20
30
9
22
25
74
2000年
CO2排
出量
CO
2 em
issio
n in
200
0
2000年
CO2排
出量
CO2
emiss
ion
in 1
990
70%
redu
ctio
n
(MtC)
Reduction of servicedemands
EE: Energy Efficiency Improvement, CI: Carbon Intensity Improvement, SD: Reduction of Service Demands
Scenario B :2050Scenario B :2050 Main factors to reduce CO2 emissions

28
The United Nations Commission on Sustainable Development30 April – 11 May, 2007
Introduction of AIM/Energy Snapshot Tool
55
Back GroundBack Ground
Structures & FlowsStructures & Flows
Operation Operation
Enduse SectorEnduse Sector
Transformation SectorTransformation Sector
AnalysisAnalysis
Contents
JapanLow C arbonSociety 2050
Asia Pacific Integrated Model (AIM)Japan Low-Carbon Society Project
Please see more details !!! !!!
at
http://2050.nies.go.jp/index.html
The United Nations Commission on Sustainable Development30 April – 11 May, 2007
Application of Application of AIM/Energy Snapshot Tool toAIM/Energy Snapshot Tool to
Asian CountriesAsian Countries
Prof. P.R. Prof. P.R. ShuklaShukla Indian Institute of ManagementIndian Institute of ManagementDr. Jiang Dr. Jiang KejunKejun China Energy Research InstituteChina Energy Research InstituteProf. Ram Prof. Ram ShresthaShrestha Asian Institute of TechnologyAsian Institute of TechnologyDr. Dr. MikikoMikiko KainumaKainuma National Institute for Environmental StudiesNational Institute for Environmental StudiesMs. Ms. MahoMaho Miyashita (Miyashita (TakimiTakimi) ) Mizuho Information & Research InstituteMizuho Information & Research Institute

29
The United Nations Commission on Sustainable Development30 April – 11 May, 2007
Introduction of AIM/Energy Snapshot Tool
57
Back GroundBack Ground
Structures & FlowsStructures & Flows
Operation Operation
Enduse SectorEnduse Sector
Transformation SectorTransformation Sector
AnalysisAnalysis
Contents
JapanLow C arbonSociety 2050
Asia Pacific Integrated Model (AIM)Japan Low-Carbon Society Project
Application to India- Introduction of Analysis of Residential
Sector -
Application to India
The United Nations Commission on Sustainable Development30 April – 11 May, 2007
Introduction of AIM/Energy Snapshot Tool
58
Back GroundBack Ground
Structures & FlowsStructures & Flows
Operation Operation
Enduse SectorEnduse Sector
Transformation SectorTransformation Sector
AnalysisAnalysis
Contents
JapanLow C arbonSociety 2050
Asia Pacific Integrated Model (AIM)Japan Low-Carbon Society Project
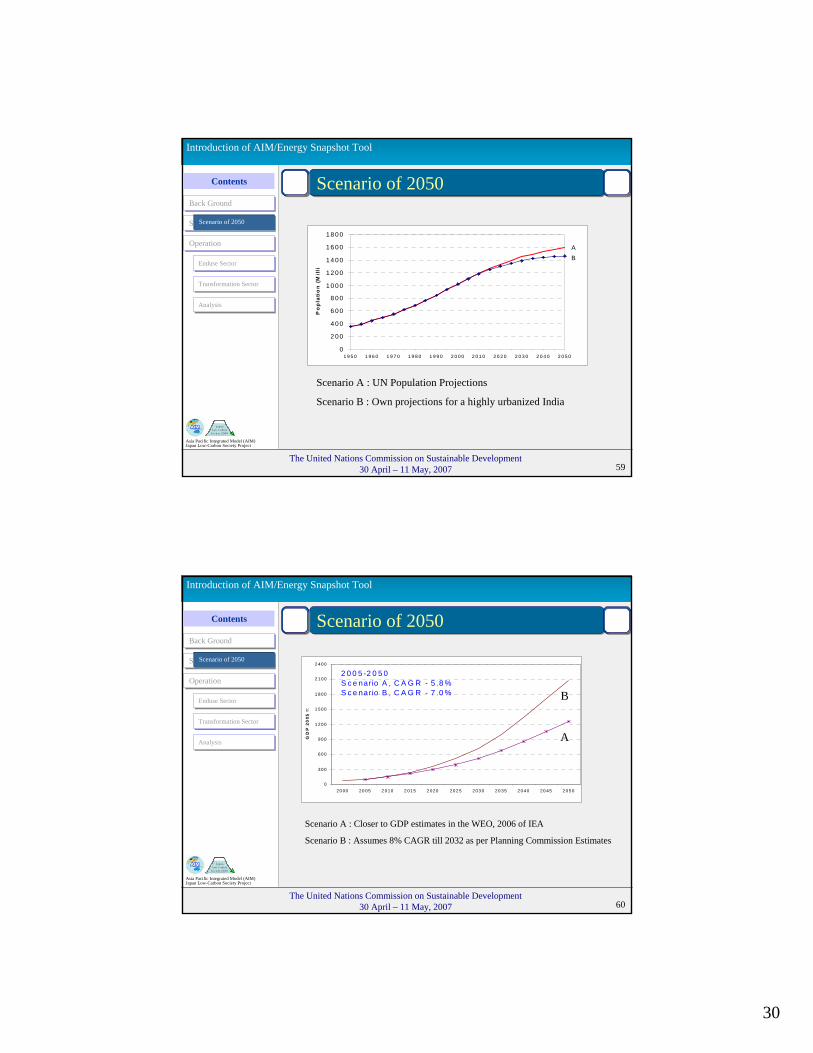
Scenario of 2050
Scenario of 2050
Policy makers are aspiring for characterized by high growth rates, rapidly improving demographic indicators, driven by economic reforms and high levels of social spending. Higher penetration of technologies takes place, aided by close cooperation with the developed countries in the east and west. Higher incomes also bring about enhanced environmental consciousness amongst people.
Scenario B
A large part still resides in villages though demographic indicators have changed but still a long improvement to go. The economy is dependent largely on the manufacturing sector.
Scenario A
30
The United Nations Commission on Sustainable Development30 April – 11 May, 2007
Introduction of AIM/Energy Snapshot Tool
59
Back GroundBack Ground
Structures & FlowsStructures & Flows
Operation Operation
Enduse SectorEnduse Sector
Transformation SectorTransformation Sector
AnalysisAnalysis
Contents
JapanLow C arbonSociety 2050
Asia Pacific Integrated Model (AIM)Japan Low-Carbon Society Project
Scenario of 2050
Scenario of 2050
0
2 0 0
4 0 0
6 0 0
8 0 0
1 0 0 0
1 2 0 0
1 4 0 0
1 6 0 0
1 8 0 0
1 9 5 0 1 9 6 0 1 9 7 0 1 9 8 0 1 9 9 0 2 0 0 0 2 0 1 0 2 0 2 0 2 0 3 0 2 0 4 0 2 0 5 0
Po
pla
tio
n (
Mil
li
BA
Scenario A : UN Population Projections
Scenario B : Own projections for a highly urbanized India
The United Nations Commission on Sustainable Development30 April – 11 May, 2007
Introduction of AIM/Energy Snapshot Tool
60
Back GroundBack Ground
Structures & FlowsStructures & Flows
Operation Operation
Enduse SectorEnduse Sector
Transformation SectorTransformation Sector
AnalysisAnalysis
Contents
JapanLow C arbonSociety 2050
Asia Pacific Integrated Model (AIM)Japan Low-Carbon Society Project
Scenario of 2050
Scenario of 2050
0
300
600
900
1 200
1 500
1 800
2 100
2 400
20 00 20 05 2 010 2 015 2 020 202 5 203 0 20 35 20 40 20 45 20 50
GD
P 2
005
=1
2 0 0 5 -2 0 5 0S c e nario A , C A G R - 5 .8 %S c e nario B , C A G R - 7 .0 %
Scenario A : Closer to GDP estimates in the WEO, 2006 of IEA
Scenario B : Assumes 8% CAGR till 2032 as per Planning Commission Estimates
A
B

31
The United Nations Commission on Sustainable Development30 April – 11 May, 2007
Introduction of AIM/Energy Snapshot Tool
61
Back GroundBack Ground
Structures & FlowsStructures & Flows
Operation Operation
Enduse SectorEnduse Sector
Transformation SectorTransformation Sector
AnalysisAnalysis
Contents
JapanLow C arbonSociety 2050
Asia Pacific Integrated Model (AIM)Japan Low-Carbon Society Project
Scenario of 2050
Scenario of 2050
19.242.3Appliance16.733.3ICT3.13.4Lighting3.03.5Cooking (Elect)1.61.5Cooking (Stove)
12.921.6Cooling (AC + Cooler)2050 B2050 AService
2000=1
Assumption of Service DemandAssumption of Service Demand
The United Nations Commission on Sustainable Development30 April – 11 May, 2007
Introduction of AIM/Energy Snapshot Tool
62
Back GroundBack Ground
Structures & FlowsStructures & Flows
Operation Operation
Enduse SectorEnduse Sector
Transformation SectorTransformation Sector
AnalysisAnalysis
Contents
JapanLow C arbonSociety 2050
Asia Pacific Integrated Model (AIM)Japan Low-Carbon Society Project
Scenario of 2050
Scenario of 2050
2.001.00ICT
1.501.00Refrigerator
1.501.00Lighting
1.111.00Cooking (Elect)
0.700.500.500.650.650.500.100.600.60Cooking (Stove)
4.002.90Cool
ElectS/WBmassGasOil ElectS/WBmassGasOil
20502000Service
Assumption of Energy EfficiencyAssumption of Energy Efficiency

32
The United Nations Commission on Sustainable Development30 April – 11 May, 2007
Introduction of AIM/Energy Snapshot Tool
63
Back GroundBack Ground
Structures & FlowsStructures & Flows
Operation Operation
Enduse SectorEnduse Sector
Transformation SectorTransformation Sector
AnalysisAnalysis
Contents
JapanLow C arbonSociety 2050
Asia Pacific Integrated Model (AIM)Japan Low-Carbon Society Project
Simulation Results
Simulation Results
408%
-186%
132%
-324%
31%
226%
-113%
90%
-194%
8%
-400%
-300%
-200%
-100%
0%
100%
200%
300%
400%
500%
D E/D
C/E
C'/C
Tota
l
vs 2
000's
2050 A 2050 B
Factor AnalysisFactor Analysis
The United Nations Commission on Sustainable Development30 April – 11 May, 2007
Introduction of AIM/Energy Snapshot Tool
64
Back GroundBack Ground
Structures & FlowsStructures & Flows
Operation Operation
Enduse SectorEnduse Sector
Transformation SectorTransformation Sector
AnalysisAnalysis
Contents
JapanLow C arbonSociety 2050
Asia Pacific Integrated Model (AIM)Japan Low-Carbon Society Project
Application to Thailand- Introduction of Analysis of
Transportation Sector -
Application to Thailand

33
The United Nations Commission on Sustainable Development30 April – 11 May, 2007
Introduction of AIM/Energy Snapshot Tool
65
Back GroundBack Ground
Structures & FlowsStructures & Flows
Operation Operation
Enduse SectorEnduse Sector
Transformation SectorTransformation Sector
AnalysisAnalysis
Contents
JapanLow C arbonSociety 2050
Asia Pacific Integrated Model (AIM)Japan Low-Carbon Society Project
Scenario of 2050
Scenario of 2050
This scenario is characterized by Thailand being more and more integrated into global markets. Market forces are predicted to lead to high economic growth and there would be a faster transition towards industry and commerce based economy. The GDP is assumed to increase by 6% per year during the first thirty years (2000-2030) and by 5% per year in the remaining twenty years (2030-2050) reflecting the possible slowdown of the economic growth
Scenario B
This scenario is characterized by a Thai economy concentrated onindustries that have a comparative advantage in the world market. In this scenario, Thailand follows closely the national development plans and policies. The economic growth is moderate at 5% per year during 2000-2030 and then slows down to 4% per year for the remaining twentyyears of the time period considered.
Scenario A
The United Nations Commission on Sustainable Development30 April – 11 May, 2007
Introduction of AIM/Energy Snapshot Tool
66
Back GroundBack Ground
Structures & FlowsStructures & Flows
Operation Operation
Enduse SectorEnduse Sector
Transformation SectorTransformation Sector
AnalysisAnalysis
Contents
JapanLow C arbonSociety 2050
Asia Pacific Integrated Model (AIM)Japan Low-Carbon Society Project
Scenario of 2050
• Energy efficiency projection:• Efficiency of oil, gas and electricity based
vehicles doubles by 2050
• Fuel mix projection• In road transport, by 2050 hydrogen
substitutes 20% of the oil and CNG substitutes 25% of the oil. In rail transport, electricity substitutes 50% of the oil by 2050.
Scenario of 2050

34
The United Nations Commission on Sustainable Development30 April – 11 May, 2007
Introduction of AIM/Energy Snapshot Tool
67
Back GroundBack Ground
Structures & FlowsStructures & Flows
Operation Operation
Enduse SectorEnduse Sector
Transformation SectorTransformation Sector
AnalysisAnalysis
Contents
JapanLow C arbonSociety 2050
Asia Pacific Integrated Model (AIM)Japan Low-Carbon Society Project
Simulation Results
Simulation Results
- 5,000 10,000 15,000 20,000 25,000 30,000 35,000
2000
2050 A (CM)
2050 B (CM)
OIL GAS H2 ELE
Energy ConsumptionEnergy Consumption
The United Nations Commission on Sustainable Development30 April – 11 May, 2007
Introduction of AIM/Energy Snapshot Tool
68
Back GroundBack Ground
Structures & FlowsStructures & Flows
Operation Operation
Enduse SectorEnduse Sector
Transformation SectorTransformation Sector
AnalysisAnalysis
Contents
JapanLow C arbonSociety 2050
Asia Pacific Integrated Model (AIM)Japan Low-Carbon Society Project
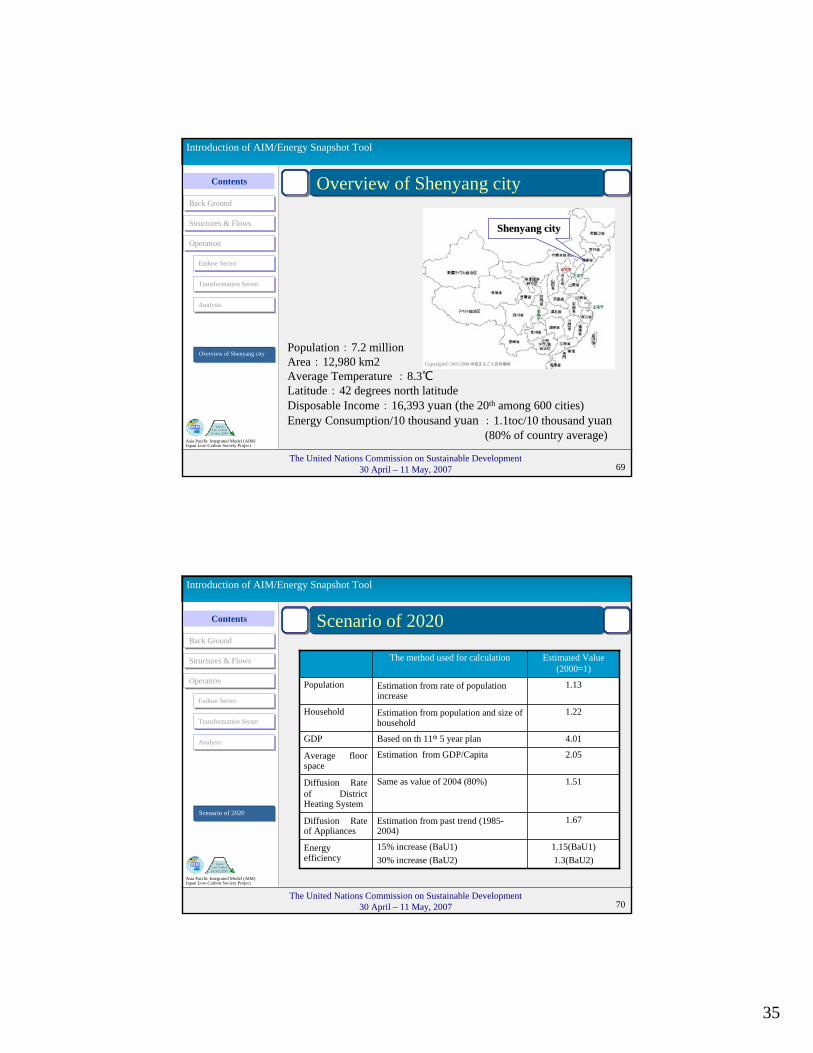
Application to China- Introduction of Analysis of Residential
Sector in Shenyang City -Application to China
35
The United Nations Commission on Sustainable Development30 April – 11 May, 2007
Introduction of AIM/Energy Snapshot Tool
69
Back GroundBack Ground
Structures & FlowsStructures & Flows
Operation Operation
Enduse SectorEnduse Sector
Transformation SectorTransformation Sector
AnalysisAnalysis
Contents
JapanLow C arbonSociety 2050
Asia Pacific Integrated Model (AIM)Japan Low-Carbon Society Project
Overview of Shenyang city
Population:7.2 millionArea:12,980 km2Average Temperature :8.3℃Latitude:42 degrees north latitudeDisposable Income:16,393 yuan (the 20th among 600 cities)Energy Consumption/10 thousand yuan :1.1toc/10 thousand yuan
(80% of country average)
Shenyang cityShenyang city
Overview of Shenyang city
The United Nations Commission on Sustainable Development30 April – 11 May, 2007
Introduction of AIM/Energy Snapshot Tool
70
Back GroundBack Ground
Structures & FlowsStructures & Flows
Operation Operation
Enduse SectorEnduse Sector
Transformation SectorTransformation Sector
AnalysisAnalysis
Contents
JapanLow C arbonSociety 2050
Asia Pacific Integrated Model (AIM)Japan Low-Carbon Society Project
Scenario of 2020
1.51Same as value of 2004 (80%)Diffusion Rate of District Heating System
1.15(BaU1)1.3(BaU2)
15% increase (BaU1)30% increase (BaU2)
Energy efficiency
1.67Estimation from past trend (1985-2004)
Diffusion Rate of Appliances
2.05Estimation from GDP/CapitaAverage floor space
4.01Based on th 11th 5 year planGDP
1.22Estimation from population and size of household
Household
1.13Estimation from rate of population increase
Population
Estimated Value(2000=1)
The method used for calculation
Scenario of 2020

36
The United Nations Commission on Sustainable Development30 April – 11 May, 2007
Introduction of AIM/Energy Snapshot Tool
71
Back GroundBack Ground
Structures & FlowsStructures & Flows
Operation Operation
Enduse SectorEnduse Sector
Transformation SectorTransformation Sector
AnalysisAnalysis
Contents
JapanLow C arbonSociety 2050
Asia Pacific Integrated Model (AIM)Japan Low-Carbon Society Project
Scenario of 2020
1.22*1.67Number of households*Diffusion rate of appliances
Lighting/Appliances
1.22*1Number of households*IntensityCooking
1.22*1Number of households*IntensityHot water
2.05*1Average floor space *Energy service demand / floor space
Warming
Estimated Value(2000=1)
The method used for calculation
Scenario of 2020
The United Nations Commission on Sustainable Development30 April – 11 May, 2007
Introduction of AIM/Energy Snapshot Tool
72
Back GroundBack Ground
Structures & FlowsStructures & Flows
Operation Operation
Enduse SectorEnduse Sector
Transformation SectorTransformation Sector
AnalysisAnalysis
Contents
JapanLow C arbonSociety 2050
Asia Pacific Integrated Model (AIM)Japan Low-Carbon Society Project
Scenario of 2020
BaU1+Introduction of heat pump (50%)
BaU1+Introduction of energy saving house (50%)
Energy efficiency: 30% increase
Energy efficiency: 15% increase
CM2CM1BaU2BaU1
Scenario of 2020

37
The United Nations Commission on Sustainable Development30 April – 11 May, 2007
Introduction of AIM/Energy Snapshot Tool
73
Back GroundBack Ground
Structures & FlowsStructures & Flows
Operation Operation
Enduse SectorEnduse Sector
Transformation SectorTransformation Sector
AnalysisAnalysis
Contents
JapanLow C arbonSociety 2050
Asia Pacific Integrated Model (AIM)Japan Low-Carbon Society Project
Simulation results
WarmingWarming Hot waterHot water CookingCooking LightingLightingAppliancesAppliances
TotalTotal
Energy consumption in 2020 (Mtoe)
Simulation results