introduction - concord consortium
TRANSCRIPT

Introduction Welcome to the Engineering Energy Efficiency Project! Your design challenge in this project is to build a model house that uses very little energy to keep warm and takes advantage of solar radiation to cut down its energy use even more. Through repeated testing and modifications, you can make your model better and better. In your final report, you will present how well your house performs and what you have learned about energy-efficient design. Although what you build will just be a model made of paper, clear plastic, and cardboard, and heated by a light bulb, the science and engineering principles are the same as in a real house. The tests of your model would work on a real building. So this project is about a real-world situation and a real-world problem. A substantial portion of home energy use in the United States is devoted to heating and cooling. The value of improving the energy efficiency of buildings is enormous. Outdated or negligent design and building practices waste vast quantities of fossil fuel that contribute carbon dioxide to the atmosphere. This is unsustainable in the long run. It is also quite unnecessary. We can construct and renovate buildings that are much better! Your generation has the task of making energy efficiency be something that everyone knows and cares about. Some of you will also be the engineers who participate in that transformation. This is a Concord Consortium research project, but it's also a chance for you to apply your creative energies to an exciting and challenging task, work with your hands, build and test real structures, and have a good time. We look forward to seeing your designs, which we know will be diverse, beautiful, and energy efficient! Ed Hazzard

This work is licensed under a
Creative Commons Attribution-NonCommercial 3.0 United States License.

Chapter 1: Build and Test a Standard House 1
Building instructions •
Keep the house warm •
Solar heating test •
Chapter 2: Heat Transfer 25
Heat storage 27
Power and energy 33
Conduction 37
Convection 51
Radiation 63
Energy from the Sun 69
Energy Detective 77
Table of Contents

Chapter 3: Design and Build Your Own House 81
Design•
Construction •
House heating test •
Solar heating test •
Chapter 4: Modify Your House 109
Explore convection 110•
Conductivity of the walls 117 •
Sunspace addition 121 •
Chapter 5: Final Report 131

Standard House 1
IntroductionThe overall goal of this engineering project is to design and construct an energy-efficient house that is able to keep a steady inside temperature and can be heated by the sun. You will be working with a model rather than a full-sized house, but the principles are the same. By the end of this project, you will understand the heat transfer basics and design principles that you would need to design an energy-efficient house.
Before you start on your own house design, you will build and test a pre-designed “standard house” to familiarize yourselves with the materi-als, building methods, and measurements you will use to evaluate your design.
This is called a standard house because everyone will start by building the same one. Also, it will be the standard against which you can com-pare the performance of your own design later in this project.
The standard house meets the same criteria that you will follow when you build your own design. Your teacher will provide a cutout, which you can trace onto card stock, cut out, fold, and tape together. The win-dows can be made out of clear acetate.
This project uses a standard procedure for measuring the thermal per-formance of a house. For the house to lose heat, there must be a tem-perature difference. The interior of the house must be warmer than the outside. Since you can’t cool down your classroom to 0 °C, you will warm up your house to 10 °C above room temperature. This is done with a heater light bulb inside the standard house.
As with a real house, what matters is how long the furnace must be on to keep the house warm. The more it’s on, the more energy is used per day and the greater your heating bill. To imitate this situation, you will record what percentage of time the heater light bulb must be on to keep the house at 10° C above room temperature.
Finally, you will perform the same test, but with a bright light shining on the house, imitating sunshine. You can then tell how much your energy bill is reduced by “solar heating.”
Build a model house and measure how much energy is needed to keep it warm.
Chapter 1: Build and Test aStandard House

Tools & materials
• Computer
• LoggerLite
• Onetemperaturesensor
USB Flash drive•
Full-scale cutout of stan-•dard house and base for tracing
• Metalruler(cm)
• Scissors
• Safetyutilitycutter
• Pencils
• Cardstocksheet,56x71cm(22x28in)
• Cardboardsurfacetocuton
• Acetatesheetsforwindows
• Cleartape
• One40Wheaterlightbulbin a socket with an inline switch, covered with aluminum foil
• Onesunlightbulbinagooseneckfixture
Standard House Description
The standard house has a floor area of 400 cm• 2 (16 x 24 cm) .
The window is on the south side that faces the sun, and its area is •120 cm2.
There is enough room inside for the light bulb (15 cm high) and •its base. There is a 12 cm diameter hole in the floor for the heater light bulb.
Materials for the initial design are limited to cardstock, clear ac-•etate, and tape.
The house sits on a base, larger than the house. The base is labeled •with the directions north, south, east, and west for testing purpos-es, so that you can picture the house with a real orientation with respect to the sun*.
One sensor is inserted through the wall of the house.•
* Note that this workbook is written for a climate at about 40° north latitude that has warm summers and cold winters. Other climates may have quite different design issues, and the sun’s path changes in other latitudes.
2 Standard House

Trace the two pieces of the standard house on a piece of card-1. stock, using the full-scale template provided by the teacher. Note how they must be arranged to fit on one sheet. Be sure to mark the locations for the sensor as shown on the template.
Cut out the two pieces, using scissors. 2.
Use a sharp pencil to make a hole for putting a temperature sen-3. sor in a pre-marked spot. The hole is 10 cm above the floor.
Cut out the window and tape a piece of acetate over it on the side 4. of the cardstock that will be inside the house.
Cut a circle out of the bottom of the house, as in the template, so 5. that the heater light bulb can fit in. (The circle happens to be the same size as a CD.)
Fold the cardboard along the dashed lines. Use the edge of a table 6. to make straight folds.
Standard House 3
Building Instructions

7. Tape the edges together.
8. The teacher will supply a piece for the base of the house (1/4 of a cardstock sheet, about 28 x 35.5 cm).
9. Label the base with directions: North, South, East, West.
10. Place the bulb with foil on the base.
11. Feed the power cord of the bulb through one corner of the house, as in the picture below. Then tape the joints closed around it.
4 Standard House

Standard House 5
Note the power cord coming out of one corner of the house.
12. Place your house and bulb on the base so that the window faces south and the bulb fits through the hole in the base of the house.
13. Write your team name on the house.
14. Your house will look similar to the house pictured below.

6 Standard House
Power and energyEnergy is a special quality in science and engineering. It has many forms – thermal, kinetic, potential, chemical, electrical, nuclear, and radiation. It can change form, but the total amount of energy remains the same. In other words, energy is not created or destroyed; it just changes form. This principle, called the Conservation of Energy, is central to understanding heat flow.
In simple terms, energy is how much, and power is how fast you use it. A carhasacertainamountofenergywhengoing60mph,regardlessofhowquicklyit reached that speed. A more powerful engine can get up to that speed more quickly.Energy(Q)ismeasuredinjoules.Power(P)determineshowfasttheheat flows or changes. It is measured in watts, which is the same as joules/sec-ond.
Watts (W) = joules (J) / seconds (s)
Wecanalsosaythattheamountofheatenergyisthepowermultipliedbythe time.
Joules (J) = watts (W) * seconds (s)
Forexample,thepoweroutputofa40Wlightbulbis40watts.Ifthebulbisonforoneminuteitproduces2400Joulesofenergy.
2400 J = (40 J / s) (60 s)
Ineverydaypractice,electricalenergyisexpressedinkilowatt-hoursratherthanjoules.
1 J (1 W-s/J) (1 hr/3600 s) (1 kW/1000 W) = 27.8 x 10⁻⁶ kWh
1 J = 27.8 x 10⁻⁶ kWh1 kWh = 3,600,000 J
Asthisshows,kilowatt-hoursareamoreconvenientunitbecauseJoulesaresosmall. Also, it’s easier to work with hours than with seconds.
€
P = Q /t
€
Q = Pt

Heat Transfer 7
What is the power output of a 100 W incandescent bulb?
How much energy does a 100 W bulb use in 24 hr?
How much energy (in kilowatt-hours = 1000 watt-hours) would the bulb use if left on for a year?
How much energy would you save if you replaced the bulb with a 20 W fluorescent, which has about the same light output but uses less energy? (Fluorescent bulbs are more efficient. For the same power input, they produce more light and less heat than incandescent bulbs.)
How much money would you save if electricity costs $0.15/kWh?

8 Standard House
Forexample,supposetheroomtemperatureis20°C.Thetargettem-peratureforthewarmed-uphousewillbe10°Chigher.WhatwillthesetemperaturesbeasmeasuredontheFahrenheitscale?FillinTable2.
Thelastcalculationistoshowthatourexperimentalconditionshavethesametemperaturedifferenceasahousekeptat20°Cwhentheoutdoortemperatureis10°C(50°F).It’sacoldday,butnotfreezing.
Celsius vs. Fahrenheit
Temperature in °C Temperature in °F
Water freezes
Water boils
Room temperature 20
A hot day 100
Experimental conditions
Temperature in °C Temperature in °F
Room temperature 20
Target house temperature 20 + 10 = 30
Outdoor temperature if it were 10 °C below room temperature
20 – 10 = 10
Celsius vs. Fahrenheit (optional)Note to American students: You will use the Celsius scale for these measurements,sohere’saquickexercisetoremindyouaboutCelsiusvs.Fahrenheit. Fill in Table 1.
or
€
C = 5 /9(F − 32)
€
F = (9 /5)C + 32

Standard House 9
Keep the house warmWhat is the power requirement to keep a house warm on a cold day?
Tools & materials
• Standardhouse
• Onetemperaturesensor
• Computer
• USBFlashdrive
• LoggerLiteforplottingtemperature
• One40Wheaterlightbulbin a socket with an inline switch, covered with foil
IntroductionYour goal is to warm up your house to 10 °C greater than the air around it. To do this, you will raise the house to the target temperature using the heater light bulb.
As you perform the following steps you will look at the graph generated byVernierLoggerLite,whichwillrecordthetimeandtemperatureautomatically and represent them graphically.
This project uses a standard procedure for measuring the thermal per-formance of a house. For the house to lose heat, there must be a tem-perature difference. The interior of the house must be warmer than the outside. Since you can’t cool down your classroom to 0 °C, you will warm up your house to 10 °C above room temperature. This is done with a heater light bulb inside the standard house.
As with a real house, what matters is how long the furnace must be on to keep the house warm. The more it’s on, the more energy is used per day and the greater your heating bill. To imitate this situation, you will record what percentage of time the heater light bulb is on.
Your goal is to measure how much power it takes to keep your house 10 °C warmer than the air around it. To do this, you will:
Turn the heater on and off so that the temperature stays within •0.2°Cofthetargettemperature.
Record the times when the heater is turned on and off.•
Calculate what percentage of time the heater has to be on to keep •the house warm.
Multiplythatpercentagebytheheaterpower(40Watts)togetthe•average power supplied to the house.

10 Standard House
Quick Start for Logger Lite
Open the Logger Lite file (.gmbl) that goes with the experiment. (Note: the file name always ends with .gmbl.) It will recognize the sensors that are attached to the computer. It will have the right settings, but you can change them under “Experiment/data collection.”
Use the “collect” button to collect data.
If you have two sensors, touch one very briefly to find out which is which.
Use the “scale” icon to set the size of the graph to match the data.
Drag the axes up and down to expand or shrink the scale.
If the graph stops because the time ends, you can continue by choos-ing “append to latest” rather than “erase and continue” when you try to collect.
To save a dataset and add another one to the same graph, click on the “store” icon and then start collecting. The previous dataset will change to a thin line.
Use the “examine” button to scan the graph for specific values, which are shown in the data table to the left.
When you save your file, it will be saved as the file you opened. If you want to save another dataset, save it with a different name.

Procedure
Cut a 3x3 cm square of cardstock and tape the sensor to the cen-1. ter of it 3 cm from its tip. Fold the sensor 90° so that it is perpen-dicular to the card and is 3 cm long.
Insert the temperature sensor in the hole you made in the middle 2. of the wall of the standard house. The sensor must be pushed through the wall so that it is perpendicular to the wall. Make sure it is not touching the wall. Tape the card to the outside of the house to keep the sensor in place.
Standard House 11

12 Standard House
Collect data
Connect one temperature sensor to your computer. 1.
Open the Logger Lite file that goes with this experiment: 2. std house keep warm.gmbl. It will open Logger Lite with the proper settings for this experiment.
Touch the end of the sensor to make sure it works. You should see 3. the graph go up.
Measure the room temperature and record it in the table below. 4. We will assume it stays reasonably constant throughout the experiment.
Calculate your target temperature: about 10 °C above room 5. temperature (round it up to a whole number). Record the target temperature in the table below.
Turn the heater on. 6.
Start collecting data when the sensor is a few degrees below the 7. target temperature.
Refer to the sample graph above, which should look roughly like 8. yours. When the sensor reaches 0.2 °C above the target temperature, switch the heater OFF and record the time in the table below (A). Note that the data table in Logger Lite makes it easy to note the current time while data is being collected. Note: the temperature may continue to rise for a time. That’s OK.

Standard House 13
When the sensor drops to 0.2 °C below the target temperature, 9. switch the heater ON and record the time in the table below (B). Note: the temperature may continue to fall for a time. That’s OK.
When the sensor again reaches 0.2 °C above the target 10. temperature, switch the heater OFF and record the time in the table below (C).
Stop collecting data.11.
Click the “scale” icon to fit the graph to your data.12.
Save the Logger Lite file.13.
Calculate the average power requirement to keep the house warm 14. by filling out the rest of the table below.
House heating test
Room temperature: _____°C
Target temperature: _____°C
Upper limit (target temperature + 0.2): _____°C
Lower limit (target temperature - 0.2): _____°C
Event Time (from data table)
A. Turn heater OFF at upper limit (point A)
B. Turn heater ON at lower limit (point B)
C. Turn heater OFF at upper limit (point C)
D. Total cycle time (C - A)
E. Total time ON (C - B)
F. proportion of time the heater is on(C - B) / (C - A)
G. Average power requirement (40 W * proportion of time heater is on) _______ W

How to calculate the power requirement (Row G)
You used the energy provided by the heater to heat up your house and maintain it at your target temperature. The bulb you used as a heater has a power of 40W. This means that it releases 40 joules of energy per second. But since it wasn’t on all the time, the house used less than 40 W to stay warm. The average power requirement of your house is:
Power requirement = 40 W * time on / total time
Note that the total time should be a full cycle, from OFF to ON to OFF again.
The steps of the calculation are set out in the table above.
14 Standard House

Standard House 15
Analysis
In your own words, explain the difference between energy and power.
Which did you measure in this experiment, power or energy?
What are the units for energy? What are the units for power?
The light bulb in this test house is supposed to model the furnace or boiler in your house. Describe how turning the light bulb on and off is similar to a thermostat in your house.
How do you think you could reduce the power needed to maintain the house temperature in this model? Explain what you would do and how it would help.

Connection to buildings (optional)
The light bulb in the standard house is like the furnace or boiler in your house.Ithasafixedoutputandisonpartofthetime.Heatingunitsaresized so that they would be on all of the time only on the coldest days, when there would be the greatest temperature differences between inside and outside, and hence the greatest rate of heat loss. If you improved the energy efficiency of your house, the heater would be on less time and use less total energy over the year.
Yourhousehasathermostat,whichdoesexactlywhatyoudidbyhandintheexperiment:itturnstheheateronwhenthehousetemperatureisbelow the set temperature, and off when the temperature rises above the set temperature. If you graphed the temperature in your house, it would beawavylinelikethegraphinthisexperiment.
In a real house, the yearly energy requirement would be calculated by lookingattheenergybill(forexample,400gallonsofoilmultipliedby130,000BTU/gallon=52millionBTU=15,200kWh).
Note:intheUSA,bothkilowatt-hours(kWh)andBritishThermalUnits(BTU)areincommonuseasheatingenergyunits.Ifyouwanttointer-pret your energy bill and compare electrical energy to oil or gas energy, you will need to convert from one to the other.
1 kWh = 3412 BTU
16 Standard House
BackgroundHomework
(pages 16-17)

Standard House 17
Look up your actual heating energy use, following the steps below.
Figure out the amount of energy you use for heating. You probably use electricity, oil, or natural gas.
yearly oil (gal)
yearly gas (therms)
yearly electric (kWh)
Make use of the following approximate conversion factors:
1 kWh = 3400 BTU
For oil, 1 gallon = 120,000 BTU (allowing for a boiler effiency of 85%)
For natural gas, 1 Therm = 100,000 BTU
Your annual heating energy use in kWh:
If your boiler heats domestic hot water as well as the house, subtract the average monthly summer use from each winter month (about six months in all) to obtain just the heating energy. If heating and hot water are separate, you can skip this step.
Your average monthly hot water energy use in kWh:
Your hot water energy use for 12 months in kWh:
Your heating energy use (annual heating energy minus annual hot water energy) in kWh:
18 Standard House
How does energy provided by the sun reduce the house heating require-ment?
IntroductionDuring the last session you built your house and heated it using a heater light bulb. That situation mirrors the nighttime when there is no sunlight.
Nowyouwilladdaverybrightlightbulb(300W)outsideasthe“sun.”Itsposition will be roughly that of the sun at noon in winter in the northern UnitedStates(40°N).Youwilluseasingletemperaturesensortomeasurethe house temperature.
You will turn the heater on and off, but leave the sun on all the time. This willsimulateasunnydaywithlightfromthe300Wbulbproviding“solarenergy.”
Solar Heating Test

Standard House 19
Set up the sensor
Insert the temperature sensor in the hole at the middle of your 1. house.
Connect the temperature sensor to your computer. 2.
Open the Logger Lite file that goes with this experiment: 3. std house solar heating.gmbl
Use the room temperature from the previous experiment. It will be 4. approximately the same.
Calculate the target temperature (room temperature + 10) and 5. enter it in the table below.
Set up the gooseneck lamp with a sun light bulb in it, due south of 6. the building.
Place the sun angle template so the corner is in the center of the 7. window.
Aim the tip of the light bulb along the “winter test angle” line on 8. the template (see figure below).
Tools & materials
• Standardhouse
• Onetemperaturesensor
• Computer
LoggerLite•
USB Flash drive•
• One40Wheaterlightbulb
• One300Wsunlightbulbin a gooseneck desk lamp
• Templateformeasuring“sun’s” angle

Procedure - Collect data
Switch on the heater light bulb AND the sun light bulb. 1. NOTE: The 300 W bulb is very hot. Be careful not to touch it, and wait until it cools down to move or store it. Turn it off except while doing the experiment.
Start collecting data when the sensor is a few degrees below the 2. target temperature.
When the sensor reaches 0.2 °C above the target temperature, 3. switch the heater OFF and record the time in the table below (A). Leave the sun on throughout the test.
When the sensor reaches 0.2 °C below the target temperature, turn 4. the heater ON. Record the time in the table below (B).
When the sensor again reaches 0.2 °C above the target 5. temperature, switch the heater OFF and record the time in the table below (C).
Stop collecting data.6.
Click the “scale” icon to fit the graph to your data.7.
Save the Logger Lite file.8.
Calculate the power requirement to keep the house warm by filling 9. out the rest of the table below.
20 Standard House

Standard House 21
Solar heating test
Note: Sun is ON for the whole experiment.
Room temperature: _____°C
Target temperature: _____°C
Upper limit (target temperature + 0.2): _____°C
Lower limit (target temperature – 0.2): _____°C
Event Time in seconds (from data table)
A. Turn heater OFF at upper limit
B. Turn heater ON at lower limit
C. Turn heater OFF at upper limit
D. Total cycle time (C - A)
E. Total time ON (C - B)
F. proportion of time the heater is on(C - B) / (C - A)
G. Power requirement (40 W * proportion of time heater is on) _______W
H. Average power requirement without the sun (from previous experiment) _______W
I. Power supplied by the sun_______W

Results
Report your results. What is the solar contribution to house heating, in watts and as a percentage of the power requirement?
Analysis
In a real situation, there might be strong sunshine for six hours a day, on average, out of twenty-four. On the other hand, the light would be much more intense than a 300 W light bulb. What might the solar contribution be in that case?
22 Standard House

Standard House 23
1. Claim: Describe a design change that could increase the house’s ability to take advantage of energy from the sun.
2. Evidence: Use data, results or descriptions of your experiments or model-based activities to show how solar radiation affects the energy usage for the house.
3. Reasoning: Use your answer to Question 2 to explain the claim you made in Question 1.

24 Standard House
Connection to buildings (optional)
Think about your own house and the possibility of using sunshine for heating it.
a. How many south-facing windows does your house have? Measure the area of each and add them up.
south-facing glass m2
b. How good is your south-facing exposure? Are there trees or other buildings that cast shade for part of the day?
c. Could you add more south-facing windows?
d. What would you do to increase heat gain during sunny periods, but minimize heat loss at night?
Explore
Homework

Heat Transfer 25
IntroductionAswarm-bloodedanimals,weallcareaboutheatandtemperature!Oursurvival, not to mention comfort, depends on keeping our bodies at a constant temperature, despite huge changes in the environment. The focus here is on buildings, but the same principles apply to our bodies. Everyday,weexperienceconduction(heattransferthroughclothes),convection(movingairorwater),andradiation(especiallysunshine),which are the basic ways that heat is transferred.
In buildings, temperature is a key part of comfort. The more efficiently it can be kept at a comfortable temperature, the better, since a signifi-cant part of the nation’s energy budget is devoted to the heating and cooling of buildings.
Heattransferisanimportantaspectofgreenbuilding.Heattransfersfrom warmer to cooler things. This equalizing of temperature occurs in three ways:
Conduction:thetransferofheatthroughasolidmaterial.Heatistrans-ferreddirectlyinandthroughthesubstance.Lossofheatthroughblan-kets or transfer of heat through the handle of a hot frying pan to your handareexamplesofconduction.
Convection: the transfer of heat by the movement of fluids such as air or water.Hotairrisingupachimneyorhotwatercirculatinginapotonthestoveareexamplesofconvection.
Radiation: energy that travels directly through space as electromagnetic waves.Itdoesnotrequirematterfortransmission.Mostradiationassoci-ated with heat is either visible light or infrared radiation, which is not visible. The warmth from a fire is mostly infrared.
Inthisunityouwillexploreeachmeansofheattransferandapplythisknowledge to energy efficient house design.
Chapter 2: Heat Transfer
What is heat? How is it stored?

26 Heat Transfer
Thermal energy is the total kinetic energy of the molecules of a substance. It is the energy needed to raise the temperature of the substance from ab-solutezero,whichis-273degreesCelsiusor0Kelvintoitsactualtempera-ture.ItismeasuredinJoules,kilojoules,orotherunitsofenergy.
Heat(Q)isthethermalenergythatcanbetransferredbetweentwosystems by virtue of a temperature difference. It is much smaller than the total thermal energy because normal temperature differences are small. Forexample,whenahotdrinkcoolsdown,itlosesthermalenergyorheattothesurroundingsduetoadifferenceintemperature.Whentheliquidreaches room temperature it still has lots of thermal energy, but no more heat is transferred because there is no temperature difference.
Temperature measures the average kinetic energy of the molecules of a substance.Kineticenergyincludesalloftheirmotion:vibration,translation,androtation.Moleculesarealwaysmovingexceptatabsolutezero,whichis defined as the temperature at which all motion stops.
Heatflowsfromahottertoacolderbodyuntilthetwoareinequilibriumat the same temperature. The total amount of heat remains the same, unless heat is lost or gained from the system.
Heat transfer and thermal equilibrium
Heat Transfer 27
The heat stored in a material, called its heat capacity or thermal mass, is
Q = heat (kJ)c
p = specific heat (kJ/kg K)
m = mass (kg) ∆T = change in temperature of the material (degrees Kelvin - K, or degrees Celsius - °C)
Expressedinwords,thisequationsaysthattheheatstoredinamaterialdependsonitsheatcapacityperunitmass(differentfordifferentmateri-als),itsmass(howmuchofitthereis),andthechangeintemperatureoftheobject.Thesymbol(∆T)means“changeintemperature.”Itcouldalsobewrittenas(T2 – T1).
Note the units for cp(kJ/kgK).ItistheamountofenergythatittakestoraiseonekilogramofamaterialonedegreeKelvin(whichisthesameasonedegreeCelsius).
Notethatheatcapacityorthermalmass(cpm)isthetotalheatperde-gree of temperature change stored in an object.
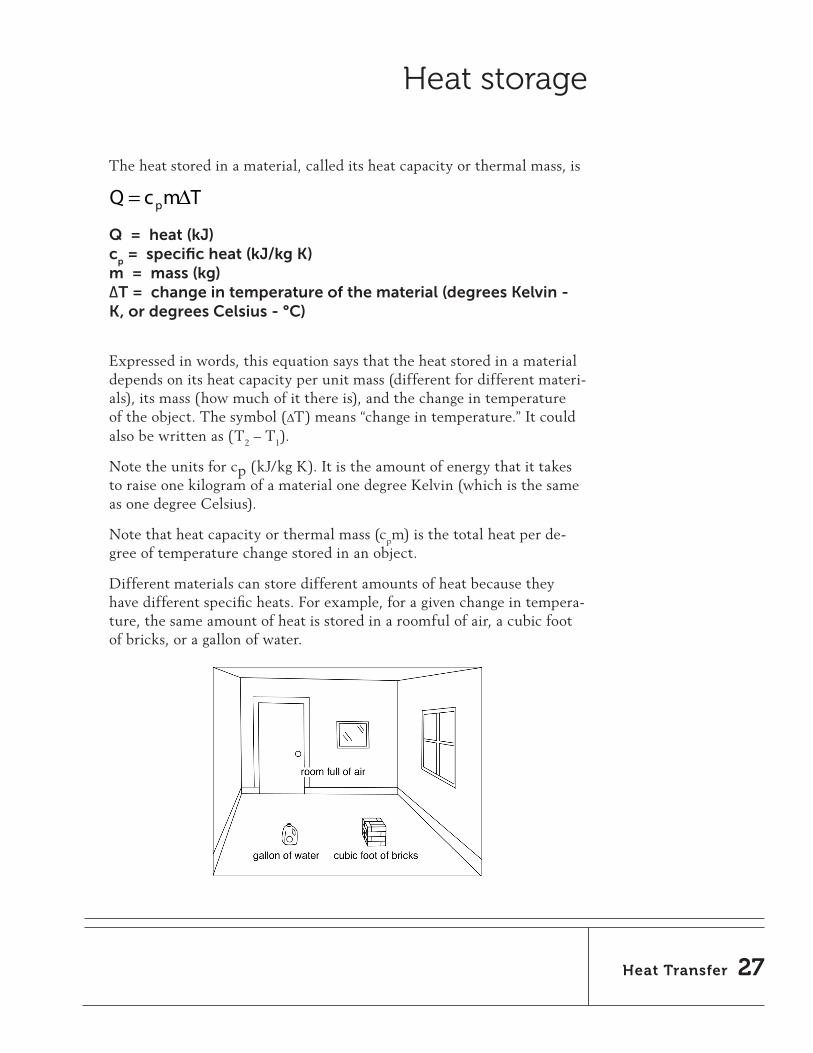
Different materials can store different amounts of heat because they havedifferentspecificheats.Forexample,foragivenchangeintempera-ture, the same amount of heat is stored in a roomful of air, a cubic foot of bricks, or a gallon of water.
Heat storage
€
Q = cpm∆T

28 Heat Transfer
Air doesn’t hold much heat, and most heat storage in buildings is in the solid materials – plaster walls, concrete floors, etc. Very little of it is in the air, which is quick to heat up, and quick to cool down.
Waterhasaveryhighheatcapacity,thatis,ittakesalotofenergytochange the temperature of water a small amount, compared to many other materials. This is very significant in both natural and man-made systems. Forexample,muchmoreheatisstoredintheworld’soceansthaninitsatmosphere, which is important when thinking about climate change. As anotherexample,amuchsmallervolumeofwaterisneededthanairtotransport heat from one place to another – say from the furnace to the rooms of a house.

Heat Transfer 29
Investigating heat storage
Heatflowsfromahottertoacolderbodyuntilthetwoareinthermalequilibrium at the same temperature. The total amount of heat remains the same, unless heat is lost from the system or gained from the outside. This is the principle of Conservation of Energy.
This principle can be used to measure the amount of heat stored in a material. If heat is allowed to flow between two objects at different tem-peratures,theheatgainedbyoneobject(A)isequaltotheheatlostbytheotherone(B).
Thefollowingsetofmodelsallowsyoutousethisprincipletoexplorethe factors that affect heat storage.€
(cpm∆T )A + (cpm∆T )B = 0(cpm∆T )A = −(cpm∆T )B
1A: Measuring heat storage
The first model you can try has two identical rectangular objects that are in contact. They have different initial temperatures that can be adjusted. Open Model 1A and follow the instructions, then answer the following questions.
When you run the model, what happens?
Why do the two thermometers reach the same temperature?

30 Heat Transfer
Results from Model 1A
Initial temperature of left object Initial temperature of right object Final temperature
In Model 1A, what rule can be used to determine the final temperature of the two objects if the objects are identical?
Why does a warm object feel warm when you touch it?
Record the results of at least three different setups of initial temperature differences.

Heat Transfer 31
1B: Heat storage depends on specific heat
Substances vary greatly in their ability to store thermal energy. The specific heat is a property of a substance that tells how much the temperature goes up when a given amount of energy is added. A large specific heat means you have to put a lot of energy into it each each degree increase in temperature.
In this model the specific heat cp of each object is different, as shown by the labels in the boxes. Note that the mass of the two ob-jects in the model is the same. The temperature difference is fixed. But the specific heats can be adjusted. Open Model 1B and follow the instructions, then answer the following questions.
Predict the final temperature under each circumstance using the equation:
Write your predicted results and the measured results of your three experiments below.
Results from Model 1B
Left-hand cp Left-hand initial temperature
Right-hand cp Right-hand initial temperature
Final temperature
1000 40 2000 10
€
(cpm∆T )left
= −(cpm∆T )right
Make a general claim. For two materials with different heat capacities, how will the equilibrium temperature be affected?

32 Heat Transfer
1C: Heat storage depends on size
In this model the specific heat of each rectangular object is different, as shown in the label below them. The size of an object is a stand-in for mass in the equation, that is, how much material there is. Accord-ing to the rule of conservation of energy, the amount of heat flowing in or out from the left rectangle must be equal to the amount of heat flowing out or in from the right rectangle.
where Aleft is the size (area) of the left object and Aright is the size (area) of the right object
Open Model 1C and follow the instructions, then answer the following questions.
Record the results of your experiments below. Note that these should all be results where the final temperature is close to 25 °C (within 1 °C).
Why does it take longer to heat up a bigger house?
€
(cpA∆T )left
= −(cpA∆T )right
Results from Model 1C
Left-hand cp Left-hand area Right-hand cp Right-hand area
1000 2000
1000 500
Use the following equation to explain your results.
€
(cpA∆T )left
= −(cpA∆T )right

Heat Transfer 33
Hereisaquickreviewofthedifferencebetweenenergy(howmuch)andpower(howfast).
Takeanoil-firedboilerasanexample.Theyareratedbytheirpowerout-put(BTU/hrorenergy/time),whichcanalsobeexpressedasgallonsperminuteofoilused.Howfasttheoilisusedisapowerrating.Howmanygallons of oil you use is an energy rating.
Here’s a very common conversion problem. The energy in a gallon of oil is about 120,000 BTU, and a kWh of energy is about 3400 BTU. If oil is $3.00/gal and electricity is $0.15/kWh, which form of energy is more expensive? Show your results.
Power and energy

34 Heat Transfer
2A: Regulating temperature
This model compares the rate of temperature rise when the heat capacities of the boxes are different but the power inputs are the same. This is an exaggerated version of a masonry house (large heat capacity) compared to a wood-frame house (small heat capacity). Open Model 2A and follow the instructions, then answer the follow-ing questions.
Which box heated up more quickly? Why?
After you turn the heater on and off, describe the graphs. Which curve was steadier and which was more variable? What was the range of temperature variation in each?
In the model, the power input is the same for both boxes. Why does the temperature change more for one than the other?

Heat Transfer 35
Connection to buildings
How would a building with a high heat capacity (masonry) behave differently from a building with a low heat capacity (wood frame)?
When and where is it useful to store heat? Think about different con-texts, such as houses, food, cooking, or water and give at least three examples.
Explore

36 Heat Transfer

IntroductionConduction is the transfer of heat through solid materials. Thermal conductivity is the measure of how fast a material conducts heat. The oppositeofconductivityisresistivity,orinsulatingvalue.Metals,likealuminum or iron, conduct very well, that is, they are good conductors andpoorinsulators.Materialswithairtrappedinthem,likewool, bedding, or Styrofoam, conduct very slowly; they are good insulators. Mostsolidmaterials,likewood,plastic,orstone,aresomewherein between.
Factors that affect heat conduction
The rate of heat transfer by conduction depends on the conductivity, the thickness, and the area of the material. It is also directly proportional to thetemperaturedifferenceacrossthematerial.Mathematically,itlookslike this:
€
∆Q /∆t = −kA(∆T /L )
= the rate of heat conduction (kJ/s) = temperature difference across the material = thickness of the layer (m) = area of the material (m2) = thermal conductivity of the material per unit thickness
(kJ/m/s/°C)
The symbol
€
∆ (delta)means“changein.”Itcouldalsobewrittenas follows:
Note that is the rate of heat flow by conduction, that is, how fast it flows through the material. The amount of heat flow is .
Heat Transfer Conduction
Heat Transfer 37 Conduction
How does heat flow through solids?
€
(∆Q /∆t)
€
∆T
€
A
€
k
€
∆Q /∆t = (Q2 −Q1) /(t2 − t1)
€
∆T = (T2 − T1)
€
∆Q /∆t
€
∆Q
€
L

38 Heat Transfer Conduction
Factors that affect heat conduction through a solid material.
Heat Transfer 39Conduction
3A: Heat conduction through materials
Here is a model comparing four common building materials – metal (steel or aluminum), stone (or other masonry, such as concrete or brick), fiberglass, and wood. Open Model 3A and follow the instruc-tions, then answer the following questions.
List the four materials in order of rate of heat transfer.

40 Heat Transfer Conduction
3B: The effect of thermal conductivity
When you cook with a frying pan, you may notice that a rubber handle stays cooler than a metal handle.
In this model you will explore the role of thermal conductivity (k) on heat flow. Open Model 3B and follow the instructions, then answer the following questions.
Which material has a greater conductivity, the upper or lower material? What is your evidence from the model?
Describe an everyday situation where you have directly experienced the difference in conductivity between two different materials.
A. metal handle B. rubber handle

Heat Transfer 41Conduction
3C: The effect of wall thickness
You may notice that your hand feels hotter if you hold the handle of a frying pan in the middle as opposed to the end.
In this model you can explore the effect of thickness L on heat flow. This is a two-dimensional model, so the thickness is represented by the distance between the heat sources – a left-to-right measurement. Open Model 3C and follow the instructions, then answer the following question.
Compare the two cases. How does wall thickness affect heat flow?
Look back at the equation on page 37. How does wall area (A) affect heat flow?
A. hand farther up the handle B. hand closer to the pan

42 Heat Transfer Conduction
3D: The effect of temperature difference
If the fire below a frying pan is more intense, your hand will feel hotter.
In this model you can explore how the amount of heat conducted through an object depends on the temperature of the heater. Open Model 3D and follow the instructions, then answer the following questions. Note that the right-hand thermometer starts at 0 °C.
Does a hotter object lose heat more quickly than a colder object?
Results from Model 3D
Temperature of heater Temperature of thermometer at half hour (model time)
50
A. more intense heat source B. less intense heat source

Heat Transfer 43Conduction
1. Claim: What part(s) of a house lose(s) the most heat by conduction?
2. Evidence: Use data, results or descriptions of your experiments or model-based ac-tivities to show how thermal conductivity, area, thickness and properties of different materials conduct heat.
3. Reasoning: Use your answer to Question 2 to explain the claim you made in Question 1.

44 Heat Transfer Conduction
Conductivity and heat capacity combined (optional)
It’seasytoconfuseheatcapacity(thermalmass)withinsulatingvalue.Heatcapacityistheabilitytostore heat. An object with more heat capacity takes longer to heat up or cool down because more heat is required to change its temperature.
Conductivity is how easily heat will flow from one place to another. A more insulated object takes longer to heat up or cool down because the heat flows more slowly into it or out of it.
Insulatingmaterialsgenerallyhavelowheatcapacity(becausetheyaremostlyair)andlowconductivity.Ittakesverylittleheattowarmthemup, but getting the heat into and out of them is slow. So the heat flow looks like this:
Masonrymaterialsgenerallyhavehighheatcapacityandfairlyhighcon-ductivity. It may take a lot of heat to warm them up, but once they are “full”, the heat will flow through them quickly. The heat flow looks like this:
low conductivity = small flowlow heat capacity = small storage
moderate conductivity = medium flowhigh heat capacity = large storage

Heat Transfer 45Conduction
very high conductivity = large flowlow heat capacity = small storage
Metalshavealowheatcapacityandveryhighconductivity.Theyareeasytoheat up, and heat flows through them easily. The heat flow looks like this:
Would you insulate a masonry house on the outside or the inside? Describe the difference in terms of heat conductivity and heat capacity of the masonry wall.

46 Heat Transfer Conduction
3E: Combine thermal conductivity and heat capacity (optional)
This model shows the combined effects of heat capacity and conductivity. Open Model 3E and follow the instructions, then answer the following questions.
Describe what happens in the three cases. Refer to both the “thermal energy” view and the “temperature” view. What role does heat capacity play in the process of heat transfer?
Which material is the best insulator?

Heat Transfer 47Conduction
Connection to buildings
Inthebuildingtrades,therateofheatlossiscalledconductivity(U),whichisthe same as k, seen on page 31. The most common measure of conductivity is its inverse: resistance to heat flow, called R or R-value.
R (thermal resistivity) = 1 / U (thermal conductivity)
The greater the value of R, the more slowly heat is lost. Doubling R-value means the rate of heat loss is cut in half.
The American building trades don’t use metric units. For instance, heat flow is measuredinBritishThermalUnits(BTU)perhour,insteadofkilojoulespersecond. Temperatures are in Fahrenheit rather than Celsius. Thickness is in inches, and area is in feet instead of meters.
To do real calculations on a building, you must get used to doing lots of con-versions of units! This project will focus on the relative behavior of different materials,ratherthanexactcalculations.
Rcanbegivenperinchofmaterialorforthewholeassembly.Forexample,manycommoninsulatingmaterialshaveanR-valueof3to5perinch,instan-dardAmericanunits.Fiberglassina5½”woodframewalladdsuptoaboutR-20.Insulationinceilingsandroofs,wherethere’smoreroomforinsulation,iscommonlyR-30toR-40.
WindowstypicallyhavethelowestR-valueinthebuildingenvelope:R-1forsingleglazed,R-2fordoubleglazed,andR-3or4fortripleorspeciallytreatedglazing. So the typical wall is five to ten times as insulating as the typical win-dow. But there is five to ten times as much wall area as window area, so the two elements contribute equally to the total heat loss, roughly speaking.
Background
Homework
(pages 47-49)

48 Heat Transfer Conduction
Note that the true insulating value of a wall or ceiling depends very much on the quality of workmanship. Gaps and voids can radically reduce the nominal R-value.
Masonryissurprising.Ithasahighthermalheatcapacity,butitsR-valueislow.Thatis,itstoresalotofheat,butitalsoconductsheatwell.An8”masonryorconcrete wall has only as much R-value as a double-glazed window (aboutR=2)!
Material Approximate R-value in US units
2x4 wall with insulation 12
2x6 wall with insulation 20
12” of attic insulation 45
12” masonry or concrete foundation wall 2
Single sheet of glass 1
Insulated glass 2
High-performance insulated glass 3
Insulated door 5

Heat Transfer 49Conduction
Connection to buildings
Describe the advantages of a well-insulated house.
Recall that heat loss is proportional to both the thermal conductivity and the area of a surface such as a wall. If a house had ten times as much wall area as it had window area, and the wall was ten times as insulating, what would be the relative heat loss from wall and win-dow?
Explore

50 Heat Transfer Conduction50 Heat Transfer

Heat Transfer 51Convection
IntroductionConvectionisdefinedasthecirculationoffluids(liquidsorgases),eithernaturalorforced.Hotorcoldfluidscanaddorremoveheat.Naturalconvectioniscausedbydensitydifferences.Hotairrisesbecauseitisless dense than cold air, so air will rise above a heater and sink near a cold window. Forced convection refers to fluids being pushed around by outside forces. A fan or a pump are forms of forced convection, which is very useful for moving heat from one place to another.
In this section you will investigate the effects of convection in a house.
Natural convection Hotairrises,becauseit’slessdensethancoldair.Warmairinaroomquickly rises upward, and cold air sinks downward, even if the tempera-ture differences are quite small.
Heat Transfer Convection
How do fluids carry heat from one place to another?
Can air carry heat into and out of a house?

52 Heat Transfer Convection
4A: Natural convection
What would it be like if there were no natural convection, that is, if air didn’t move around when heated or cooled? This model compares the two situations: convection by air that is free to move and conduction through a solid with the same conductivity as air. Each is placed above a hot plate. Open Model 4A and follow the instructions, then answer the following questions.
Measure top temperatures at half an hour for different bottom tem-peratures. Record the results of your experiments below.
Based on the model, explain the difference between convection and conduction. Which is faster?
Results from Model 4A
Bottom temperature Top temperature above air Top temperature above solid

Heat Transfer 53Convection
4B: Slow down convection
Suppose you could interrup convection flow with one or more barriers. This is essentially what insulation does. Most insulation consists of tiny pockets of air separated by thin walls or fibers that stop large-scale convection. Open Model 4B and follow the instructions, then answer the following questions.
How can convection in air be reduced?
Try other arrangements the slow down convection. Fill in the following chart.
Condition Temperature
no barrier
barrier
other (describe)

54 Heat Transfer Convection
1. Claim: Give an example where heat is transferred by convection in a house.
2. Evidence: Use data, results or descriptions of your experiments or model-based ac-tivities to explain how heat is transferred by convection.
3. Reasoning: Use your answer to Question 2 to explain the claim you made in Question 1.

Heat Transfer 55Convection
Forced convection refers to motion of a fluid that is not caused by differ-encesindensitybetweenwarmandcold(“hotairrises”).Afan(air)orapump(water)isanexampleofforcedconvection.Itisaveryusefulwaytomoveheataround.Forexample,hot-airheatingandairconditioningsystems use large ducts to transport warm or cold air around a building.
Watercanalsocarryheatfromoneplacetoanotherbybeingpumpedthrough pipes, that is, by forced convection. The great advantage of water is itsenormousspecificheat.Largeamountsofheatcanbetransportedfromthe boiler to all corners of the building. It is then transferred to the air in various ways.
Windchilldescribesthecoolingeffectofmovingairacrossawarmsurface,such as our skin. The cause of wind chill is simple, and it depends on the difference between conduction and convection. Air is a very good insulator, ifitdoesn’tmove.Mostgoodinsulators–wool,foam,fiberglass–trapairintinypocketssothatitcan’tcirculate.Heatconductsveryslowlyacrosseach little air pocket.
Ontheotherhand,airmovesveryeasilyinlargerspaces,drivenbyeventheslightesttemperaturedifferences.Whenitmoves,warmaircarriesheatfromoneplacetoanother.Largeairspacesinwallsarenotgoodinsulationbecause the air moves freely and carries heat from one side to the other.
Pictureahotsurface(suchasyourskin)withcoldairaboveit.Rightnextto the surface is a thin layer of still air that provides some insulating value because it is not moving. Imagine what happens when you turn on a fan. Your skin cools off because the still air layer is stripped away, and the skin surfaceisdirectlyexposedtothecoldair.
Forced convection

56 Heat Transfer Convection
4C: Forced convection
Here’s a model that explores forced convection, the effect of wind blowing across a hot surface. Open Model 4C and follow the instructions, then answer the following questions.
Record the temperatures of the upper and lower sensors after running the model for 0.4 model hours as shown on the graph (not real time) under three wind conditions. The model will stop automatically.
Results from Model 4C
Wind speed Temperature at upper sensor Temperature at lower sensor
Low
Medium
High
Explain why the two circles have different temperatures.
Think of other examples of the wind chill effect and how it is minimized.

Heat Transfer 57Convection
IntroductionInfiltration refers to outside air leaking into a house. This implies that inside airisalsoleakingout(exfiltration),soinfiltrationislooselyusedtodescribetheexchangeofairbetweeninsideandoutside.Iftheinsideairiswarmand the outside air is cold, lots of heat can be lost, the energy bill will increase, and the house will be drafty and uncomfortable.
Infiltrationcanbedrivenbytwoforces:a)the“stackeffect”orthe“chim-ney effect,” where rising hot air pushes outward at the top of a building andcoldairisdrawninwardatthebottom;b)wind,whichcreatesgreaterpressure on one side of a building than the other, and pushes air through any cracks in the building.
YouwillexploreinfiltrationfurtherwhenyoutestyouownmodelhouseinChapter4.
Infiltration

58 Heat Transfer Convection
4D: Stack effect
Here is a model that demonstrates the stack effect. Open Model 4D and follow the instructions, then answer the following questions.
Draw the convection pattern as shown in your model after you changed the size and location of leaks in each room. Describe or use arrows to show the motion of the air.
What causes more loss of energy, a leak near the ceiling, or a leak near the floor? Why?
Heat Transfer 59Convection
4E: Blowing wind (optional)
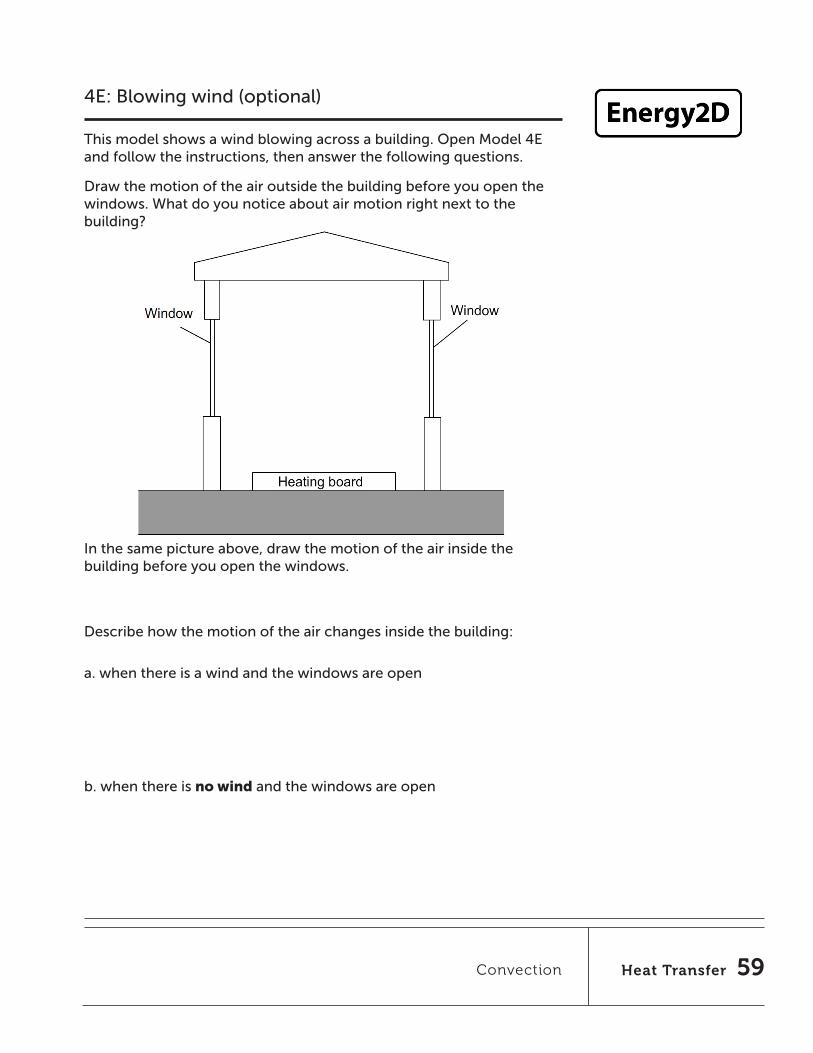
This model shows a wind blowing across a building. Open Model 4E and follow the instructions, then answer the following questions.
Draw the motion of the air outside the building before you open the windows. What do you notice about air motion right next to the building?
In the same picture above, draw the motion of the air inside the building before you open the windows.
Describe how the motion of the air changes inside the building:
a. when there is a wind and the windows are open
b. when there is no wind and the windows are open
60 Heat Transfer Convection
Connection to buildings
There are two ways convection might cause a building to lose heat:
1. Hot air leaks out through holes in the building (infiltration driven by the stack effect).
2. Moving air lowers the surface temperature of the building (wind chill effect) and increases the heat loss from the walls and windows. It also enters the building through cracks and holes (infiltration).
Suggest how you might cut down on these forms of heat loss in a real house.
Have you noticed differences in temperature between different rooms or levels in your house, or between the ceiling and the floor? Explain why in terms of conduction and convection.
Explore

Heat Transfer 61Convection
Summary
Here is a cross-section of your standard house. There is a leaky joint near the ceiling and another one near the floor. Suppose the average temperature is 40 °C inside and 20 °C outside.
• Drawwhatyouthinktheheatdistributionmightbeinthehousebywriting temperature values in five different locations.
• Drawarrowstoshowwhatyouthinkthemotionoftheairmightbe due to convection.
Now suppose the leaks were sealed up. How would it be different?
• Drawwhatyouthinkthedistributionmightbeinthehousebywriting temperature values in five locations.
• Drawarrowstoshowwhatyouthinkthemotionoftheairmightbe due to convection.

62 Heat Transfer

Heat Transfer 63Radiation
Heat Transfer Radiation
Do objects at room temperature give off radiation?
Introduction
Inthisactivityyouwillexploreinfraredradiation,whichyoucan’tseebut can feel as heat.
Radiation is the common name for electromagnetic energy traveling throughspace.Itgoesveryfast(tentimesaroundtheearthinonesec-ond)andcanpassthroughavacuum.Itdoesn’tneedmaterialtotravelin.Ithasmanyforms,includingvisiblelight,infrared(IR),ultraviolet(UV),X-rays,microwaves,andradiowaves.Theseareallthesameform of energy, just with different frequencies and amounts of energy. Different frequencies of radiation interact with matter differently, which makes them seem more different to us than they really are.
Wikimedia Commons, EM spectrum.svg, Creative Commons Attribution ShareAlike 3.0
Radiation is not heat. Radiation and heat are two different forms of en-ergy. But one is often transformed into the other in everyday situations. Thermal energy is often transferred by radiation, mostly in the infrared (IR)andvisiblerange.Allmaterialsthatarewarmerthanabsolutezero(-273°C)giveoffradiationduetothefactthattheiratomsarevibrat-ing. The amount of radiation is proportional to the fourth power of the temperature(T4),measuredfromabsolutezero.So,thehotteranobject,the more radiation it emits.

Alsomostsurfacesabsorbradiationandtransformitintoheat.Whitesurfaces reflect visible light, but absorb infrared. Black surfaces absorb both visible light and infrared.Shiny surfaces reflect both of them.
The fact that all objects give off radiation energy is a little surprising. Weusuallyimaginethatonly“redhot”materialsradiate,becausewecan’tseeotherwavelengthsthataren’tvisiblelight.Thisexperimentwillexploreradiationfromobjectsatordinarytemperatures.Thisradiationismostlyintheinfraredrange,whichisrightnexttovisiblelightbutwith longer wavelengths. Note the infrared range on the chart above.
64 Heat Transfer Radiation

Heat Transfer 65Radiation
5A: Radiation energy depends on temperature
This model shows two objects at different temperatures that are giving off electromagnetic radiation. Open Model 5A and follow the instructions, then answer the following questions.
Describe the effect of temperature on the intensity of radiation, and hence its heating effect on objects that absorb it.
Think of a real-world situation where you have felt radiation from something hot and something cold even though they were not visibly hot or cold.

66 Heat Transfer Radiation
1. Claim: Explain why it is uncomfortable to sit near windows on a cold night even if they are tightly sealed and don’t let cold air in.
2. Evidence: Use data, results or descriptions of your experiments or model-based activities to describe what your experiments showed about radiation energy?
3. Reasoning: Use your answer to Question 2 to explain the claim you made in Question 1.

Heat Transfer 67Radiation
Connection to buildings
Passivesolarheatingconsistsoflettinginsunlightenergy(mostlyvisiblelight)andstoppingheatloss,someofwhichisIRradiationoutwardfromthewarmbuilding.There’satrade-offbetweenthetwoprocesses.Largerwindows gain more sunlight, but they also lose much more heat than walls. There have been considerable technical advances over the years to makewindowsthataretransparent(letlightin),butalsohaveahighinsu-latingvalue(keepheatin).
Forexample:
twolayersofglass(threelayersinnorthernclimates),withanairspace•between
argon gas in the air space, which is less conducting than regular air•
“low-emissivity” coatings on the glass surfaces, which reduces the •emission of radiation from the glass itself. If you coated the jar of hot water in this way, the radiation meter would not show a temperature rise when it faced the jar.
Picture a room with large windows on one wall and a steam radiator on the opposite wall. Steam radiators are large cast-iron objects that get very hot — almost too hot to touch. At night, or when the sun is not shining, show all of the ways that the heat from the steam radiator becomes distributed throughout the room.
BackgroundHomework

68 Heat Transfer

Heat Transfer 69Sun’s Energy
IntroductionThesunrisesintheeastandsetsinthewest,butitsexactpathchangesover the course of the year, which causes the seasons. In order to use the sun’s energy in a building, we need to know where it is in the sky at dif-ferent times of the year.
Therearetwowaystothinkaboutthesun’spathinthesky.Onewayis to study the tilted Earth traveling around the sun viewed from outer space and figure out where the sun would appear in the sky at your lati-tude at different times of the day and year. If you have time, give this a try with your class.
Walkaroundalightsource,realorimagined,withaglobethat’stiltedattherightangle.Turntheglobeatdifferentpositions(timesoftheyear).Try to picture the length of the day and the angle of the sun.
Heat Transfer Energy from the Sun
The other way is to stand on the Earth and plot the path of the sun from your point of view on the ground. This is easier to apply to a building, although, of course, the two ways give the same results.
Wewillusetheearth-centeredapproachinthisworkbook.

70 Heat Transfer Sun’s Energy
Hereisadiagramofthesun’spathintheskyatdifferenttimesoftheyear.Itisroughlycorrectforanorthernlatitudeof40°.Notethethreelinesshowingthesun’spath.Oneisthesummersolstice,oneisthespringandfallequi-noxes,andoneisthewintersolstice.
Oneisthesummersolstice(June21),oneisthespringandfallequinoxes(March20andSeptember23),andoneisthewintersolstice(December21).Theexactdateschangealittlebitfromyeartoyear.

Heat Transfer 71Sun’s Energy
Learn the basic facts about the sun’s path at your latitude. Use the above diagram, your background knowledge, and class discussion to fill out the fol-lowing table. Here are some hints.
a) At the equinox at noon, the angle of the sun above the horizon is (90° minus the latitude). For example, at the equator this is 90°; at the pole this
is 0°.
b) At the two solstices, the angular height of the sun at noon either increases
or decreases by 23.5°– the tilt of the earth’s axis – compared to the equinox.
c) For the length of the day, do some Internet research. Many sites give the
times of sunrise and sunset. (For 40°N, daylight is about 3 extra hours in summer and 3 fewer hours in winter.)
Sun’s path throughout the year
Your latitude:
Event Date Length of day Height of sun at noon Sun rises in what direction?
Sun sets in what direction?
Winter solstice
Spring equinox
Summer solstice
Fall equinox
Homework

72 Heat Transfer Sun’s Energy
Beforeyoucontinue,theteacherwillleadadiscussionontheSun’sPathCalisthenicssothatthisdia-gram makes more sense.

Heat Transfer 73Sun’s Energy
6A: The sun’s path at your latitude
This model shows a house in a field with the sun moving overhead. When the model is run (the green arrow), the sun moves around the earth and appears as it would from the house. Click on the pole with the shadow (upper left) to display the shadow of the house.
The yellow grid shows the possible range of the sun’s position over the year for that latitude on the earth. You can change time of day, time of year, and latitude so that you can find the sun’s path in the sky anywhere on earth.
Open Model 6A and follow the instructions. Set the latitude to your latitude. Use the “Date,” “Time,” and “Latitude” buttons on the tool bar to change time of day, time of year, and latitude. Examine, qualitatively, each of the facts that you wrote in your previous table. Then answer the following questions.
Why does the length of the day change from summer to winter?
Is the length of daylight exactly 12 hours for every latitude at the time of the equinox?
At what times of year and times of day is there sunlight on the north face of the house?

74 Heat Transfer Sun’s Energy
6B: The sun’s path at different latitudes
Use the model to explore the sun’s path at other latitudes. Open Model 6B and follow the instructions, then answer the following questions.
Describe what is special about the sun’s path and the length of day at the equator.
Describe what is special about the sun’s path and the length of day near the North or South Pole.
The sun always travels at the same speed across the sky (15° per hour). If that’s true, why does the length of the day change from summer to winter?
Based on your sun’s path diagram, explain why it’s warmer in summer than in winter when you are not near the equator.
Heat Transfer 75Sun’s Energy
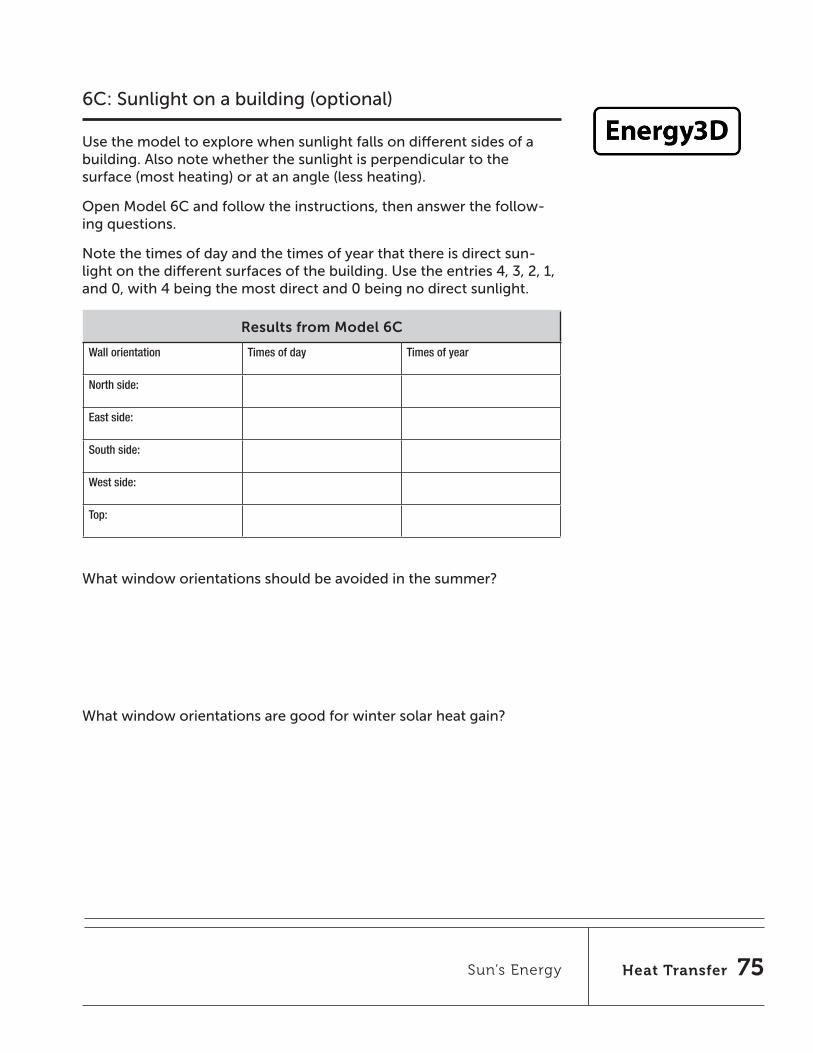
6C: Sunlight on a building (optional)
Use the model to explore when sunlight falls on different sides of a building. Also note whether the sunlight is perpendicular to the surface (most heating) or at an angle (less heating).
Open Model 6C and follow the instructions, then answer the follow-ing questions.
Note the times of day and the times of year that there is direct sun-light on the different surfaces of the building. Use the entries 4, 3, 2, 1, and 0, with 4 being the most direct and 0 being no direct sunlight.
Results from Model 6C
Wall orientation Times of day Times of year
North side:
East side:
South side:
West side:
Top:
What window orientations should be avoided in the summer?
What window orientations are good for winter solar heat gain?

76 Heat Transfer

Heat Transfer 77Energy Detective
Heat Transfer Energy Detective (optional)
IntroductionAsawrap-up,usethemodeltoexploreheatflowinawholehouse model. You can move temperature sensors around, just as you would with real temperature sensors in the standard house model. The advantage of a computer model is that you can change features and make measurements very quickly. And you can also add as many sensors as youwant.Ontheotherhand,amodelisneverjustliketherealworld.
7A: A well-insulated house vs. a poorly insulated house
Use the model to investigate the quality of construction of the two houses. Open Model 7A and follow the instructions. Then answer the following questions.
Which house required more power to keep warm, A or B? Explain how you figured this out.
Go back to the model and do more tests to answer these two ques-tions. Recall that the rate of heat loss is proportional to the difference between inside and outside temperatures.
1. How much more power, roughly, does the less energy-efficient house require (for example, 1 ½ times, 2 times, 3 times, 4 times as much power)? Note: remember you calculated power requirement for your standard house. See page 16.
2. What is the ratio of high heater power to low heater power?

78 Heat Transfer Energy Detective
7B: Where does this house lose heat the most?
Use the model to investigate the quality of construction of different parts of the model house. Open Model 7B and follow the instructions. Then answer the following questions.
Describe the method and measurements you used to find the poorly insulated places.
Fill out the following table with results from Model 7B.
Results from Model 7B
Building section Insulating quality (great, good, fair, poor)
Evidence (measurements)
A
B
C
D
W
R
G

Heat Transfer 79Energy Detective
7C: Discover a vertical temperature gradient
You have probably noticed that houses are often warmer near the ceiling than near the floor, and warmer upstairs than downstairs. This model shows the effect of natural convection in a house. Open Model 7C and follow the instructions. Then answer the following questions.
Results from Model 7C
Thermometer Temperature with ceiling Temperature without ceiling
T1
T2
T3
Describe the effect of removing the ceiling.
Many modern houses have living rooms in two-story spaces, so that the ceiling is 12 or more feet high. Explain why this kind of space is difficult to heat, and what you could do about it.

80 Heat Transfer
Summary
Think about a house you’d like to design. What directions and slopes (vertical, sloped, horizontal) would you choose for large windows? What directions and slopes would you choose for smaller windows? Why?
Chapter Summary
Explain the difference between conduction, convection, and radiation. Give an example of each process.

Own House 81
Chapter 3: Design and Build Your Own House
IntroductionNowthatyouhavesomebackgroundaboutheattransferandsomeexpe-rience with taking measurements, it’s time to design and build your own energy-efficient house.
Your success will be measured using the same tests that you did with your standard house:
keepingthehousewarmwithaheaterlightbulb(the“nosunshine” •condition)
reducing the heating requirement using sunshine from a low angle •(the“wintersunshine”condition)
The setting is the temperate climate of the northern United States: hot summers and cold winters, with moderate spring and fall seasons. There is a fair amount of sunshine all year, but of course the angle of the sun and the length of the day change significantly from season to season.
Asyouhaveseenwithyourstandardhouseexperiments,thetwobasicstrategies are to cut down on heat loss and to gain some heating from the sun during cold months. You are limited to passive solar strategies. Designs that depend on collectors, pumps, and fans are called active solar collectors and they are not available in this project.
The initial materials will be the same as for the standard house: card-stock, clear acetate, and tape. You must write down a design rationale before you start building and testing. After you test it, you can start tryingothermaterialsandmodificationstomakeitperformbetter.(SeeChapter4).
You will be using a computer program, Energy3D, to design and build your house. The process has three steps:
1.Designthehouseonthecomputer,usingEnergy3D.Makethree different designs.
2.Reviewthethreedesignsandchoosethebestoneforbuildingandtesting.
3.Printthechosendesignandassemblethehouse.
4.Testthehouseforenergyefficiency.
Design a model house that uses as little energy as possible to keep it warm.

82 Own House
The design of the house is up to you, but there are specific goals that you should address:
• Thehousehasfeaturesthatyouthinkwillmakeitenergyefficient.• Theinteriorwouldbecomfortabletobeinonasunnydayoracold
night.• Thehouseshouldbeattractiveandhave“curbappeal.”
In addition there are geometric limitations:
• Thehouseshouldnotbelargerthanthe28x36cmplatformprovidedin the software.
• Tomakeroomfortheheaterlightbulb,thewallsmustbeatleast20cm high and there is room to cut a 12 cm diameter hole in the center of the floor.
• Thehousemustbebuildable–thatis,nottoocomplexandnottoomany pieces.
• Theminimumwindowareais50cm2.
Note: In your initial design, you are limited to cardstock and clear acetate as basic building materials.
Design goals

Own House 83
Before you begin designing your house on the computer, brainstorm with your team about the goals and how you will address each one. Then answer the following questions.
What shape of the building will contribute to the house’s energy efficiency?
What roof shape will contribute to the house’s energy efficiency?
How will you orient the building to take advantage of sunlight? What window sizes and placement will be good for solar gain?
Design rationale

84 Own House
Describe the other features that you would like your house to have in order to meet the design goals.
What evidence from your experiments in Chapter 2 are you using to determine these features?

Own House 85
Design procedure
1. Watch the Energy3D movie (Getting Started with Energy3D) that is on your USB stick.
2. Open Energy3D and construct your house on the computer. Pay attention to the directions, especially which way is south. This should affect many of your decisions.
3. Your house may not look like the example, but it shows a proce-dure you can follow. It’s OK to experiment with different shapes and start over several times if you want to. Keep the house rela-tively simple. Remember, what you design you must build out of paper!
4. The program will open with a 28 x 36 cm platform. You house must fit within this.
Design instructions
Tools & materials
• Scissors
• Pencils
• Metalruler(cm)
• Protractor
• Safetyutilitycutter
• Cardstock(one20x30insheet)
• Acetatesheetsforwindows
• Maskingtapeand/orcleartape
• Temperaturesensor
• Computer
• One40Wheaterlightbulbin a socket, covered with foil
• One300Wsunlightbulbin a gooseneck desk lamp
• Pre-cut28x36cm platform

86 Own House
5. Build all of the walls first, one at a time. They should be at least 20 cm high to make room for the heater light bulb.
6. Lock the ends of the walls together and make a complete enclosure.

Own House 87
7. Create a floor inside the house. This will help you assemble it.
8. Add the roof last, after you have made the basic shape and size of the house.

88 Own House
9. After the roof is added, you can change it from a hip roof (above) to a gable roof (below) if you wish.
10. The walls must be at least 20 cm high. You can resize them all at once. You can also resize the house in other directions if you need to.

Own House 89
11. Add windows. Pay attention to which direction they face.
12. Save your design as “design-1A-teamname” on your USB stick.

90 Own House
1. Open the Heliodon tool. Set it to your latitude. Turn on the Shadows tool right next to it.
2. Study how sunlight enters your house at different times of day and different times of year. Do you think your windows are effective passive solar collectors? Explain.
3. Zoom inside your house. Study the path of sunlight from your various windows. Do you think this would be a comfortable room on a sunny day? Explain.
Evaluation of Design #1

Own House 91
4. Now step back and consider as a team how well Design #1 meets your goals. Here is a checklist.
The house has features that you think will make it energy efficient.•The house is attractive and has “curb appeal”. •The interior would be comfortable to be in on a sunny day or a cold •night.The house is not larger than the 28 x 36 cm platform provided in the •software.To make room for the heater light bulb, the walls must be at least 20 •cm high and you can cut a 12 cm diameter hole in the center of the floor. The house is buildable – that is, not too complex and not too many •pieces.The minimum window area is 50 cm• 2.
Describe how Design #1 successfully met these goals.
Describe how Design #1 was not successful.
5. Based on your review, modify your design and save it again as a new file, “design-1B-teamname” on your USB stick.

92 Own House
1. Now that you have some experience with Energy3D, try another altogether different design. Give another member of your team a turn running the computer.
2. Close and re-open Energy3D. Design a new house from scratch.
3. Save your design as “design-2A-teamname” on your USB stick.
Design #2

Own House 93
1. Open the Heliodon tool. Set it to your latitude. Turn on the Shadows tool.
2. Study how sunlight enters your house at different times of day and different times of year. Examine the house both from the outside and the inside.
3. Step back and consider how well Design #2 meets your goals. Refer back to your checklist.
Describe how Design #2 successfully met these goals.
Describe how Design #2 was not successful.
4. Based on your review, modify your design and save it again as a new file “design-2B-teamname” on your USB stick.
Evaluation of Design #2
94 Own House
1. Try to come up with one more altogether different design. Give another member of your team a turn running the computer.
2. Close and re-open Energy3D. Design a new house from scratch.
3. Save your design as “design-3A-teamname” on your USB stick.
Design #3

Own House 95
1. Open the Heliodon tool. Set it to your latitude. Turn on the Shadows tool.
2. Study how sunlight enters your house at different times of day and dif-ferent times of year. Examine the house both from the outside and the inside.
3. Step back and consider how well Design #3 meets your goals. Refer back to your checklist.
Describe how Design #3 successfully met these goals.
Describe how Design #3 was not successful.
4. Based on your review, modify your design and save it again as a new file“design-3B-teamname” on your USB stick.
Evaluation of Design #3

96 Own House
You now have three designs to choose from. Each one may have features that you like or dislike. Review the design goals and select one of them for building and testing. To help you choose, fill out the rating chart below. 3=excellent, 2=good, 1=fair, 0=bad
Which design will you select?
Explain why you selected the design that you did.
Select your best design
Results
Goal House #1 (version B)
House #2(version B)
House #3(version B)
Energy efficiency
Ease of building
Attractiveness
Shape
Simplicity
Size
Comfort

Own House 97
Results
Goal House #1 (version B)
House #2(version B)
House #3(version B)
Energy efficiency
Ease of building
Attractiveness
Shape
Simplicity
Size
Comfort
Print your design
1. View the print preview, which displays the house and all of its pieces as they will be printed on regular-size paper. Make sure you have included a floor.
2. You can zoom into a sheet and see the dimensions of each piece.
3. Print all of the pieces on 13” x 19” heavy paper. They will be printed full scale.

98 Own House
Construction
1. Cut out the pieces with scissors.
2. Cut out the window openings with scissors or a utility knife and tape pieces of acetate over them on the inside.
3. Cut a circle in the floor (12 cm diameter, the size of a CD) for the heater light bulb.
4. Tape the house pieces together. Use the 3D house view in “print view” as a guide. Note that the pieces are numbered. It works well to follow these steps:
a) tape the wall pieces together
b) tape the roof pieces together
c) tape the roof to walls
d) tape the floor to walls
5. Write your team name and your team member names on the house.
6. Make a hole in one wall for the temperature sensor 10 cm above the floor. Pick the wall that is farthest from the heater light bulb. The sensor will go 3 cm into the house and it must be at least 5 cm from the heater light bulb.
7. Calculate the total floor area and window area of your house. Also calculate the window area that faces south. Your measurements can be rounded to the nearest centimeter. Fill out the table below. The mea-surements for the standard house are included for comparison.
Standard house Your house
Floor area (cm2) 16x24=384
Window area (cm2) 10x12=120
Window/floor ratio 120/384 = .31
South-facing window area (cm2) 120
South window/floor ratio .31

Own House 99
Your goal in testing your house is to measure how much power it takes to keep your house 10 °C warmer than the air around it. This is the same test you used with the standard house.
House heating test
Collect data
1. Connect the temperature sensor to your computer. Use one temperature sensor.
2. Open the Logger Lite file that goes with this experiment: own house keep warm.gmbl
3. Measure the room temperature. We will assume it stays reasonably constant throughout the experiment. Record temperature in the table below.
4. Calculate your target temperature: 10 °C above room temperature. Record your room and target temperature in the table below.
5. Insert the temperature sensor in the hole you made in the house. It must be pushed through the wall, so that it is 3 cm from the wall. Use the same 3x3 cm cardstock sensor holder you used in Chapter 1.
6. Turn the heater on.
7. Start collecting data when the sensor is a few degrees below the target temperature.
8. When the sensor reaches 0.2 °C above the target temperature, switch the heater OFF and record the time in the table below (A).
9. When the sensor drops to 0.2 °C below the target temperature, switch the heater ON and record the time in the table below (B).
10. When the sensor again reaches 0.2 °C above the target temperature, switch the heater OFF and record the time in the table below (C).
11. Stop collecting data.
12. Click the “scale” icon to fit the graph to your data.
13. Save the LoggerLite data file.
14. Calculate the average power requirement to keep the house warm by filling out the rest of the table below.

100 Own House
House heating test
Room temperature: _____°C
Target temperature: _____°C
Upper limit (target temperature + 0.2): _____°C
Lower limit (target temperature – 0.2): _____°C
Event Time (from data table)
A. Turn heater OFF at upper limit
B. Turn heater ON at lower limit
C. Turn heater OFF at upper limit
D. Total cycle time (C - A)
E. Total time ON (C - B)
F. proportion of time the heater is on(C - B) / (C - A)
G. Average power requirement(40 watts * the proportion of time the heater is on)
_______W
ResultsHow did this house perform compared to your standard house?

Own House 101
Your teacher will make a summary chart of the performance of each team’s house. How did your house perform compared to other teams?
What did you learn from other teams’ designs that could help you improve your house?

102 Own House
Feature: What specific features of your design contributed to or detracted from the en-ergy performance of the house?
Results: What evidence do you have from the test to support your claim?
Modification: Based on your results what design changes would you propose to improve the performance of these design features?

Own House 103
Collect data
Connect the temperature sensor to your computer. 1.
Open the Logger Lite file that goes with this experiment: 2. own house solar heating.gmbl
Assume that room temperature has not changed. Calculate the 3. target temperature (room temp + 10 °C) and enter it in the table below.
Set up the gooseneck lamp with a 300 W bulb in it, due south of 4. the building. The tip of the bulb should be 20 cm from the house window and aimed downward at about a 35° angle, as if it were noon in winter. Use the template provided by the teacher to posi-tion the sun.
Switch the heater light bulb and the sun light bulb on. 5. NOTE: The bulb is very hot. Be careful not to touch it, and wait un-til it cools down to move or store it. Turn it off except while doing the experiment.
Solar heating test

104 Own House
Start collecting data when the sensor is a few degrees below the 6. target temperature.
When the upper sensor reaches 0.2 °C above the target tempera-7. ture, switch the heater OFF and record the time in the table below (A). Leave the sun on.
When the upper sensor reaches 0.2 °C below the target tempera-8. ture, turn the heater ON. Record the time in the table below (B).
When the sensor again reaches 0.2 °C above the target tempera-9. ture, switch the heater OFF and record the time in the table below (C).
Stop collecting data.10.
Click the “scale” icon to fit the graph to your data.11.
Save the LoggerLite data file. 12.
Print your LoggerLite graph and make a copy for each team mem-13. ber to put in their workbook.
Calculate the average power requirement to keep the house warm 14. by filling out the rest of the table.

Own House 105
Solar heating test
Room temperature: _____°C
Target temperature: _____°C
Upper limit (target temperature + 0.2): _____°C
Lower limit (target temperature – 0.2): _____°C
Event Time (from data table)
A. Turn heater OFF at upper limit
B. Turn heater ON at lower limit
C. Turn heater OFF at upper limit
D. Total cycle time (C - A)
E. Total time ON (C - B)
F. Proportion of time the heater is on(C - B) / (C - A)
G. Average power requirement (40 watts * proportion of time heater is on) _______W
H. Power requirement without sun _______W
I. Solar contribution _______W

106 Own House
Results
How did this solar-heated house perform compared to the house without sunlight?
How did your house performance compare to other teams?

Own House 107
Feature: What specific features of your design contributed to or detracted from its performance as a passive solar house?
Results: What evidence do you have from the test to support your claim?
Modification: Based on your results what design changes would you make to improve its performance?
108 Own House
1. Claim: What are the advantages and disadvantages of having large south-facing windows?
2. Evidence: Use data, results or descriptions of your experiments or model-based activities to explain the role of passive solar heating on a house. (You can include results from Chapter 2.)
3. Reasoning: Use your answer to Question 2 to explain the claim you made in Question 1.

Modify 109
Chapter 4: Modify Your House
IntroductionNow that you have tested your own energy-efficient house design, it’s time to modify it and make it work better. A cycle of design, testing, redesign and retesting is an essential part of engineering.
Your success will be measured using the same tests as before:
keepingthehousewarmwithaheaterlightbulb(the“nosun” •condition)
reducing the heating requirement using sunshine from a low angle •(the“wintersunshine”condition)
You can add other materials from what’s available, and also change the design — whatever you think would improve the performance of the house. You can also add “additions” on the outside if you think they will help—solargreenhouses,forexample.
Every change must have a design rationale, including your theory for why itwillhelp,basedonthescientificideasfromtheHeatTransferchapter.
To make your engineering process more systematic, you will be asked to tackle one improvement at a time and measure the effect of that improvement. You will also be asked to do some specific investigations before making your design changes.
How much can you improve the energy performance of your house?

110 Modify Convection
Tools & materials
Two temperature sensors•
Computer•
Small square of cardboard •(5x5cm)
Tape•
One40Wheaterlightbulb•
Metalruler•
LoggerLite•
Your house•
Procedure & data collection
1. Tape one sensor into the hole in your house house at 10 cm. This will be your fixed monitoring temperature sensor.
2. Make a series of holes in the end wall opposite the monitoring sensor every 5 cm above the bottom of the house. Use a sharp pen or pencil. The holes should be just large enough so that the movable temperature sensor can be inserted into the house. (The top hole can be through the roof, if your house has a hipped roof.)
3. Tape the other sensor to a small piece of cardboard (about 5x5 cm) with a bend in the wire so that the end sticks up about 3 cm. This will be your movable temperature sensor.
Explore convectionOften the most valuable first step in making a house energy efficient is to stop air from leaking in and out. Cold air entering and hot air escaping is a large source of heat loss, in both older and newer con-struction.
You will conduct a series of experiments to explore convection (the motion of air) in your house and then see how much you can improve its performance.

Modify 111Convection
4. Open the Logger Lite file that goes with this experiment: house convection.gmbl
5. Start collecting data. Record the initial temperature in the table below.
6. Turn the heater on. Let the temperature of the fixed sensor rise until the inside is 10 °C above the initial temperature.
7. Have one team member take responsibility for keeping the reading of the fixed sensor within 0.2 °C or less of the target temperature. Turn the heater off and on to maintain a constant temperature for the fixed sensor.
8. Have another team member measure the temperature at each height by inserting the movable sensor into each hole in turn, from 5 cm to 25 cm, and then back down again.
9. You must wait in each position long enough for the temperature to approach a settled value – about 30 seconds. It’s OK not to wait for the exact settled value. The graph will look something like this:

112 Modify Convection
Temperature at different heights
Initial temperature: _____°C Target inside temperature: _____°C (Initial + 10 °C )
Height (cm) Temperature (going up) Temperature (going down) Average of two temperatures
5
10
15
20
25
10. Record the temperature values at the different heights in the table below.
11. Calculate the average temperature for each height.

Modify 113Convection
Results
What is the maximum temperature difference from bottom to top?
What is the difference between the fixed monitoring sensor and the highest temperature?
Analysis
If the fixed sensor shows a constant temperature, explain what creates the observed temperature pattern seen in the graph of the moveable sensor.

114 Modify Convection
Collect data
Connect the temperature sensor to your computer. Use one tem-1. perature sensor.
Open the Logger Lite file: 2. own house with ceiling.gmbl
Measure the room temperature. Record it in the table below.3.
Calculate your target temperature, 10 °C above room temperature, 4. and record it in the table.
Install the sensor in the standard monitoring position, through a 5. hole in the wall 10 cm up and 3 cm into the house.
Turn the heater on. 6.
When the sensor reaches 0.2 °C above the target temperature, 7. switch the heater OFF and record the time in the table below (A).
When the sensor drops to 0.2 °C below the target temperature, 8. switch the heater ON and record the time in the table below (B).
When the sensor again reaches 0.2 °C above the target tempera-9. ture, switch the heater OFF and record the time in the table below (C).
Stop collecting data.10.
House heating test with a ceiling added
Now test the improvement in overall performance when you add a ceiling. Use the same tests as before to measure how much power it takes to keep your house 10 °C warmer than the air around it.
Construction
Trace the floor of the house on a piece of cardstock.1.
Cut this piece out to make a ceiling for the house.2.
Bend the piece a bit so that it can be pushed through the hole in 3. the bottom of the house. Push it up to make a “ceiling” at the tops of the walls, which should be 20 cm high. It should stay roughly in place without tape, but you can add a few small pieces of tape if necessary.
Tools & materials
Two temperature sensors•
Computer•
Cardstock of file folder •card the size of the house (16x24cm)
Small square of foamcore •orcardboard(5x5cm)
Tape•
One40Wheaterlightbulb•
Scissors•
Your house•

Modify 115Convection
House heating test with ceiling
Room temperature: _____°C Target temperature (room temperature + 10): _____°C
Upper limit (target temperature + 0.2): _____°C
Lower limit (target temperature – 0.2): _____°C
Event Time (from data table)
A. Turn heater OFF at upper limit
B. Turn heater ON at lower limit
C. Turn heater OFF at upper limit
D. Total cycle time (C - A)
E. Total time ON (C - B)
F. proportion of time the heater is on(C - B) / (C - A)
G. Average power requirement (40 watts * proportion of time heater is on)
_______W
Summary of results
Condition Power requirement
Standard house (ch. 1)
Your model house (ch. 3)
Ceiling added
Compare your current house performance with previous experiments.
Click the “scale” icon to fit the graph to your data.11.
Save the LoggerLite data file. 12.
Calculate the average power requirement to keep the house warm by 13. filling out the rest of the table below.

116 Modify Convection
Analysis
Your teacher will make a summary chart of the performance of each team’s house. Consider your house performance compared to other teams. Why do you think it did better or worse than other designs? Be specific and give scientific explanations.
1. Claim: How do ceilings change the natural convection patterns in a house?
2. Evidence: Use data, results or descriptions of your experiments or model-based activities to ex-plain natural convection patterns in a house? (You can include results from Chapter 2 and this chap-ter.)
3. Reasoning: Use your answer to Question 2 to explain the claim you made in Question 1.

Modify 117Conduction
Conductivity of the walls
Energy efficient houses are always very well insulated. Often some parts of the building envelope are insulated more than other parts
Here’s a typical well-insulated wall. Each layer has a purpose. The vapor barrier stops moisture from migrating outward. The insulation slows heat flow. The continuous insulation blocks air circulation and thermal bridg-ing through the wood, which is less insulating that the insulation around it. The outside air barrier stops infiltration.
Air spaces inside walls may or may not add insulating value. If they are wider than about 2 cm, convection loops form and heat is easily trans-ferred across them. If they are narrower than that, convective loops do not form and they provide insulating value.

118 Modify Conduction
Collect data
Connect the temperature sensor to your computer. Use one tem-1. perature sensor.
Open the Logger Lite file: 2. insulated house keep warm.gmbl
Measure the room temperature. Record it in the table below.3.
Calculate your target temperature, 10 °C above room temperature, 4. and record it in the table below.
Install the sensor in the standard monitoring position, through a 5. hole in the wall 10 cm up and 3 cm into the house.
Turn the heater on. 6.
When the sensor reaches 0.2 °C above the target temperature, 7. switch the heater OFF and record the time in the table (A).
When the sensor drops to 0.2 °C below the target temperature, 8. switch the heater ON and record the time in the table (B).
Reduce heat loss with insulation
Decide how you will insulate the walls of your house. You may draw from the following materials:
1 sheet card stock•
1 sheet foamcore•
2 sheets acetate•
Here are the rules:
Only use materials that are equally available to all of the teams, unless your teacher decides otherwise.
When possible, apply insulation to the outside of the existing house, so that the interior volume remains about the same.
Do not place any material closer than 5 cm from the heater light bulb.
After you have insulated your house, test its performance.

Modify 119Conduction
When the sensor again reaches 0.2 °C above the target 9. temperature, switch the heater OFF and record the time in the table (C).
Stop collecting data.10.
Click the “scale” icon to fit the graph to your data. Enter the 11. data in the “without sun” column below.
Save the LoggerLite data file. 12.
Now, open the Logger Lite file: 13. insulated house solar heating.gmbl
Set up the sun light bulb at the winter test angle, turn it on, 14. repeat this experiment. Enter the data in the “with sun” column below. Save the data file.
Calculate the average power requirement to keep the house 15. warm, with and without the sun, by filling out both columns in the table below.
House heating test
Room temperature: _____°C Target temperature (room temperature + 10): _____°C
Upper limit (target temperature + 0.2): _____°C
Lower limit (target temperature – 0.2): _____°C
Without sun With sun
Event Time (from data table)
A. Turn heater OFF at upper limit
B. Turn heater ON at lower limit
C. Turn heater OFF at upper limit
D. Total cycle time (C - A)
E. Total time ON (C - B)
F. proportion of time the heater is on(C - B) / (C - A)
G. Average power requirement (40 watts * proportion of time heater is on) _______W _______W

120 Modify Conduction
Feature: Describe how the wall materials affect the heat flow of the house?
Results: What evidence do you have from the test to support your claim?
Modification: Based on your results, what design changes in wall construction would you propose to improve performance even more?

Modify 121Sunspace
Sunspace addition
Sunspace, sunrooms, or greenhouses can be used to collect sunshine for heating. They are also pleasant spaces in the winter, although they have drawbacks as well. Build a sunspace addition to your house. Explore the temperatures in it and how it affects your house heating requirement.
Construction
Build a sunspace addition, following these guidelines:
You can use acetate, cardstock, and tape.•
The house should form one wall of the sunspace. That is, the •sunspace should be against the house.
The sunspace can be on any side of the house, but remember that •your goal is for it to gain solar heating in the winter.
The sunspace floor area should be • one-half the area of the house or smaller.
What are the temperatures in a sunspace?
Can a sunspace contribute heating energy to a house?

122 Modify Sunspace
Collect data
Place one sensor in the house at the standard monitoring position, 1. 10 cm up and 3 cm in.
Slip the other sensor into the sunspace about 10 cm up and near 2. the wall of the house.
Tape a piece of paper on the outside of the sunspace so that it 3. casts a shadow on the sunspace sensor. This will make sure the sensor measures the air temperature and is not heated directly by radiation.
Open the Logger Lite file that goes with this experiment: 4. sunspace test.gmbl
Record the room temperature in the table below.5.
Calculate your target temperature, 10 °C above room temperature, 6. and record it in the table below.
Turn on both the heater light bulb and the sun light bulb. Start 7. collecting data
When the monitor sensor reaches 0.2 °C above the target 8. temperature, switch the heater OFF and record the time in the table below (A).
When the monitor sensor drops to 0.2 °C below the target 9. temperature, switch the heater ON and record the time in the table below (B).
When the monitor sensor again reaches 0.2 °C above the target 10. temperature, switch the heater OFF and record the time in the table below (C).
Stop collecting data.11.
Click the “scale” icon to fit the graph to your data.12.
Save the LoggerLite data file. 13.
Calculate the average power requirement to keep the house warm 14. by filling out the rest of the table below.

Modify 123Sunspace
Start collecting data. Turn on both the heater light bulb and the sun 15. light bulb. Heat up the house to about 10 °C above room temperature. This will be your house target temperature.
Keep the house within 0.2 °C of the target temperature by turning 16. both the heating bulb and the sun bulb on and off. Observe at least two on-off cycles.
Scale the data with the “scale” button. 17.
Save your data. 18.
House heating test with sunspace #1
Room temperature: _____°C Target temperature (room temperature + 10): _____°C
Upper limit (target temperature + 0.2): _____°C
Lower limit (target temperature – 0.2): _____°C
Event Time (from data table)
A. Turn heater OFF at upper limit
B. Turn heater ON at lower limit
C. Turn heater OFF at upper limit
D. Total cycle time (C - A)
E. Total time ON (C - B)
F. proportion of time the heater is on(C - B) / (C - A)
G. Average power requirement (40 watts * proportion of time heater is on) _______W
H. Previous requirement without sun _______W
I. Sunspace contribution (G-H)_______W

124 Modify Sunspace
Results
Compare the graphs of the two sensors – inside the house and inside the sunspace. How are they the same and different?
Analysis
How could you explain the differences?

Modify 125Sunspace
Improve the solar heating contribution from the sunspace (optional)
See if you can improve the construction of the sunspace.
Your design must accomplish two things:
The sun light bulb must heat up the sunspace.•
The heat must be transported into the house.•
Repeat the test each time as as you refine the sunspace. Note that two tables have been provided. Describe your experimental conditions in each case. Try at least two improvements and take data for each. For example:
Connect the sunspace to the house with cutout openings, so the •heat can flow from the sunspace to the house.
Add black paper inside the sunspace to increase solar absorption.•

126 Modify Sunspace
House heating test with sunspace #2
Room temperature: _____°C Target temperature (room temperature + 10): _____°C
Upper limit (target temperature + 0.2): _____°C
Lower limit (target temperature – 0.2): _____°C
Event Time (from data table)
A. Turn heater OFF at upper limit
B. Turn heater ON at lower limit
C. Turn heater OFF at upper limit
D. Total cycle time (C - A)
E. Total time ON (C - B)
F. proportion of time the heater is on(C - B) / (C - A)
G. Average power requirement (40 watts * proportion of time heater is on) _______W

Modify 127Sunspace
Summary of results
Description of experiment Power requirement
Before sunspace is added – no sun
Sunspace added
Improvement:
Improvement:
House heating test with sunspace #3
Room temperature: _____°C Target temperature (room temperature + 10): _____°C
Upper limit (target temperature + 0.2): _____°C
Lower limit (target temperature – 0.2): _____°C
Event Time (from data table)
A. Turn heater OFF at upper limit
B. Turn heater ON at lower limit
C. Turn heater OFF at upper limit
D. Total cycle time (C - A)
E. Total time ON (C - B)
F. proportion of time the heater is on(C - B) / (C - A)
G. Average power requirement (40 watts * proportion of time heater is on) _______W

128 Modify Sunspace
1. Claim: What is a key design feature of a sunspace that helps it contribute to heating a home?
2. Evidence: Use data, results or descriptions of your experiments or model-based activities to show how a sunspace contributes to the heating of a house.
3. Reasoning: Use your answer to Question 2 to explain the claim you made in Question 1.

Modify 129Sunspace
Connection to buildings
What lessons or guidelines did you learn from these two tests that would apply to real buildings?
Explore

130 Modify Sunspace

Final Report 131
IntroductionA new energy-efficient housing development is looking for a project engineer. The project engineer will be responsible for all design and construction decisions related to heating and cooling energy use. The project involves a variety of house designs that all need to be energy efficient.
This final report will be used to persuade a review committee that you have the understanding and inventiveness to apply what you have learned to the entire housing project.
Your project was a preliminary study to identify the most important fea-tures of an energy-efficient house. The committee will be looking at the energy performance of your model house as one indication of your skill. It will also look at the design ideas and materials you used to accomplish this. Equally important, however, you must demonstrate that you under-stand the science behind the energy-efficient designs and would be able to make further improvements and develop other designs.
Complete all of the sections below. If you write this on a computer, save your work on a USB memory stick.
Hereistheoutlineofyourreport:
Summary
Houseperformance:experimentaldata
Explanationofhouseperformanceanddesignchoices
Heatflowanalysis
Conclusion
Chapter 5: Final Report

Energy-Efficient House Project: Final Report
Name:
Name of team:
Names of team members:
House dimensions
Floor area (cm2):
Total window area (cm2):
Total surface area (cm2):
SUMMARY
Write a summary paragraph describing the house you designed, its special energy-efficent features, and what makes it a great energy-efficient house for this climate.
132 Final Report

Final Report 133
SUMMARY (cont.)

134 Final Report
HOUSE PERFORMANCE: EXPERIMENTAL DATA
Gather the results of your experimental data in the table below.
Summary of experimental data
Winter heating Power requirement (W) Percentage of power requirement compared to the standard house*
Page reference
Standard house, no sun condition (page 13)
= 100%
Standard house, winter sun condition (page 21)
Own house, no sun condition (page 100)
Own house, winter suncondition (page 105)
Own house, with all modifications, no sun condition (page 119)
Own house, with all modifications, winter sun condition (page 119)
Own house, sunspace added (page 127)
* For example, if the standard house requires 20 W and “own house, no sun condition“
requires 15 W, the percentage is 15/20 = 75%.
Did your modifications give you the improvement you expected?
Under what conditions did your house perform the best?

Final Report 135
EXPLANATION OF HOUSE PERFORMANCE AND DESIGN CHOICES
House design
Describe the major features of your design (for example, the shape of the house, placement of windows, material choices). In each case, describe the feature, how it functions, and your evidence that it works that way. Use scientific explanations from the Heat Transfer unit to explain how each of these features affects energy efficiency. Refer to your experimen-tal data to support your claims.
Modifications
What did you learn from your experiments that guided your design choices? Explain what features were added after initial experiments, what features were modified, and how they affected the energy performance of the house. Include evidence from your experiments.

136 Final Report
HEAT FLOW ANALYSIS
Describe where and how heat is lost from your house and how differ-ent modifcations changed the rate of heat loss. Use evidence from the Heat Transfer Basic units to describe the process.
Draw a picture of your house in vertical cross section, which is a slice through the center in the North-South direction. Label the wall, win-dow, and roof materials. Label North and South.
On your drawing show your best guess for the temperature distri-bution throughout the house. Write down what you think are likely values of temperatures in various locations, assuming the outside temperature is 5 °C, the heater temperature is 40 °C, and the average temperature in the house is about 25 °C.
Draw arrows to show how you think heat flows around inside your house as well as in and out of your house.

Final Report 137
CONCLUSION
Given what you know now, if you were starting again from scratch and could make a completely different design, what materials and design features would you choose for your house? Why?

138