introduction chapter 1 the ocean basins. outline early times middle ages voyages of discovery earth...
Post on 20-Dec-2015
215 views
TRANSCRIPT

Introduction
Chapter 1The Ocean Basins

Outline
• Early Times• Middle Ages• Voyages of Discovery• Earth Science• Charts and Navigation• Ocean Science• Challenger Expedition• Oceanography

Scientific Method
• Process of science• Hypothesis• Theory


• People are known to have sought food from the seas as early as the Paleolithic period• barbed spears or harpoons were developed
• About 10,000 B.C. (Neolithic), bone fishhooks were developed. • Some time later during the Neolithic fish nets
were first used.

• The first recorded sea voyage - Pharaoh Snefru about 3200 B.C.
• The first recorded voyage of exploration - Hannu in 2750 B.C. • Sailed from Egypt to the southern edge of the Arabian
Peninsula and the Red Sea.
• Extensive migration throughout the southwestern Pacific Ocean begun by 2500 B.C.

• Most accomplished open ocean sailors around 1500–500 B.C., were the Polynesians• The Polynesians colonized the Hawaiian Islands
between A.D. 450 and 600.
• By the eighth century A.D. they had colonized every habitable island in a triangular region roughly twice the size of the United States from Hawaii to New Zealand in the southwest and Easter Island in the east.


Middle Ages
• Important Concept 2.• During the Middle Ages, relatively
little new knowledge was added to our understanding of the oceans. Despite this, however, advances continued to be made in shipbuilding, navigation, and piloting

• Practical problems related to the sea continued to be addressed during this time and there were significant improvements in: • a. ship design and building, • b. navigation, and
c. cartography (the design and making of maps).

• The Vikings are credited with extensive voyages throughout the North Atlantic during the time from 793–1066. • These voyages were aided by a period of global
warming that reduced the hazards of drifting ice in the North Atlantic.


• Charts during this time still lacked accurate lines of latitude and longitude.
• Most charts were of near coastal waters, locating ports and noting distances between them. • These charts were called “portolanos.”
• These charts included a mileage scale and notes on hazards to navigation but they did not have latitude and longitude.

• In the 13th century: • magnetic compass directions were added to
maps


Voyages of Discovery
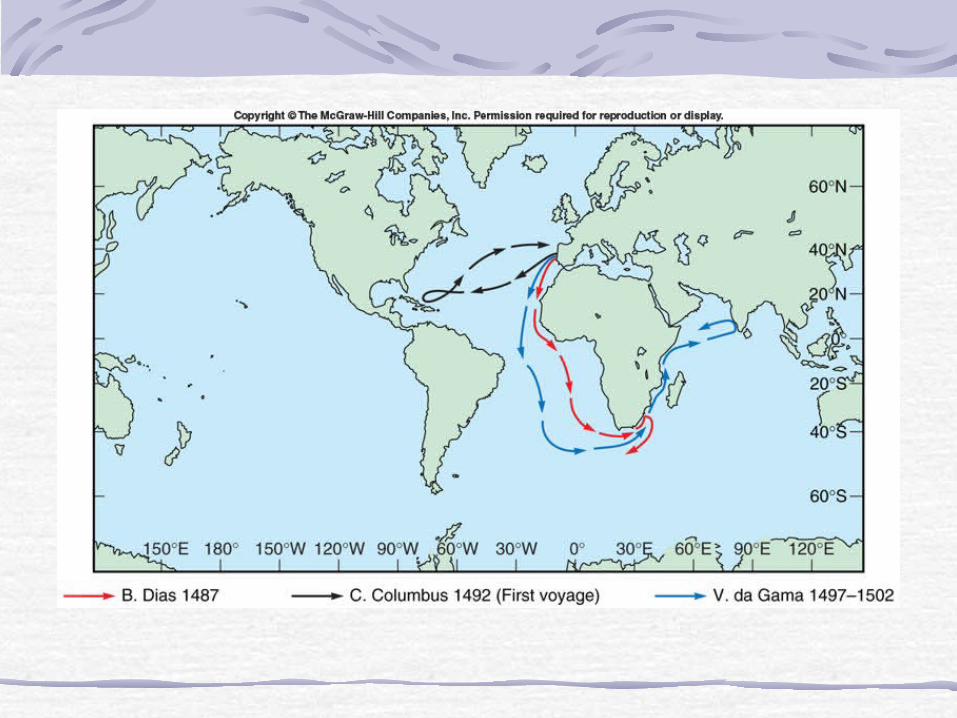
• Important Concept 3.• The 15th and 16th centuries were
times of great global voyages of discovery. These voyages were conducted primarily by northern Europeans • Initial ones by the Chinese• Conducted primarily by northern
Europeans

• The first voyages of discovery in the early 15th century were conducted by the Chinese. • In seven voyages over 300 ships explored the Indian
and Pacific oceans.
• The last of these voyages was in 1433, after which the Chinese concluded that other civilizations were not advanced enough to offer them anything and they voluntarily entered a period of isolation that would last 400 years.


Beginnings of Earth Science
• Important Concept 4• Scientists in the 17th century were
beginning to show an interest in the basics of Earth science.• Scientists wrote papers and formed societies to
discuss their findings.

• Johannes Kepler (1571–1630) studied planetary motion.
• Galileo Galilei (1564–1642) studied mass, weight, and acceleration
• Sir Isaac Newton (1642–1727) wrote his Principia in 1687 in which he presented his law of gravity and the forces creating the tides were explained.

• Edmund Halley (1656–1742): • made a voyage in 1698 to study longitude and
the variation of the compass, and • suggested that the age of the oceans could be
calculated by measuring the rate at which rivers carry salt to the sea.
• His 1701 map shows the shape of the Atlantic ocean basin

Charts and Navigation
• Important Concept 5.• The successful exploitation of the
oceans for transportation and economical trade required the development of accurate navigational methods and detailed charts of landmasses, prevailing winds, and surface currents.

• Following the great voyages of discovery, there were new trade routes to be used routinely and distant colonies established. • This required the construction of accurate
charts and the improvement of navigational techniques
• The science of the mapping of oceans and other large bodies of water for the purpose of improving navigation is called “hydrography.”

• Latitude is determined easily at sea • by astronomical means• What kind of instrument is often used?
• Determining longitude accurately was a major problem for early navigators. • An accurate clock was required• Why is this?

• Important milestones for Longitude:• 1530, Flemish astronomer Gemma Frisius saw
the relationship of longitude to time. • 1598, King Philip III of Spain offered a reward
of 100,000 crowns to for a clock that would keep accurate time at sea. • Why would a monarch be interested?

• 1714, Queen Anne of England offered a public reward and the British Parliament offered a reward of 20,000 pounds for a clock that would keep accurate time at sea.

• John Harrison made four chronometers from 1735 to 1761.
• The fourth version in 1761 met the British Parliament's requirements for accuracy• lost only 51 seconds during an 81 day voyage


• The first chart of the Gulf Stream was made by Benjamin Franklin with help from his cousin Timothy Folger in 1769.• So, is this chart important just because Franklin
made it?


• The United States established a naval hydrographic office in 1830.• This office was then called the U.S. Naval
Hydrographic Office, but now it is the U.S. Naval Oceanographic Office.

• Matthew Maury was placed in charge of the U.S. Naval Hydrographic Office and began a career compiling data on the seas, including• the founding of the Naval Depot of Charts, • publication of the first wind and currents charts
of the North Atlantic in 1847, • construction of the first bathymetric chart of
the North Atlantic with contours at 6000 ft intervals, and

• Major Concept 8.• In the 19th century scientists
began exploring the oceans in earnest. Scientific exploration was facilitated by accurate charts and ships’ crews skilled in navigation

• One of the earliest scientific voyages was aboard the HMS Beagle (1831-1836) with Charles Darwin as the ship naturalist.• What are some of the important results of this
voyage?

• Darwin collected a variety of marine organisms for study and proposed an explanation for the progressive evolution of coral reefs into atolls.
• He later wrote On the Origin of Species based largely on samples and observations collected during the voyage


• Major Concept 9• It was also in the 19th century that
one of the greatest scientific oceanographic expeditions was mounted, the Challenger expedition

• The Challenger expedition was organized by the British Royal Society and the British Admiralty and sailed under the direction of Charles Wyville Thompson • Thompson’s assistant was a young geologist
named John Murray (1841–1914).
• The expedition lasted from December 21, 1872 until May 24, 1876• nearly three and one half years.
• The Challenger logged 110,840 km (68,890 mi).

Challenger Voyage
© The McGraw-Hill Companies, Inc. Permission required for reproduction or display.

• Ocean depth measurements were taken at 361 locations• a maximum depth of 26,850 feet was
discovered in the Marianas Trench in the western Pacific Ocean
• How do you think depth measurements were made?

• Water samples were taken at various depths and analyzed for temperature and chemistry• It was shown that the relative abundance of the
major component ions of seawater remains constant regardless of where the sample is taken

• Biological discoveries were numerous.• 4717 new species of marine organisms were identified
• Physical processes were investigated • deep water currents were studied
• Scientists worked for 20 years after the conclusion of the expedition cataloguing and analyzing all of the information that was collected.


• John Murray edited and wrote many of the Challenger reports after Thompson’s death.• Murray is considered the first geological
oceanographer
2.4 Location Systems
• Latitude and Longitude• Measuring Latitude• Longitude and Time• Chart Projections

Major Concept (IX)
• In order to locate ourselves on the surface of a sphere we need a reference (or location) system.

• Think of a piece of graph paper.• A grid of reference lines on the earth’s
surface allows us to accurately determine our position relative to these lines.
• These reference lines define two numbers called latitude and longitude that uniquely specify a given point.

• Lines of latitude are termed parallels because they are parallel to the equator and to each other.
• Latitude is an angular measure of how far a point is either north or south of the equator.

• Parallels form circles of decreasing radius with increasing distance from the equator (see fig. 2.8).

Fig. 2.8a

Fig. 2.8b

• Lines of longitude are called meridians and are formed by constructing great circles around the globe that pass through both poles and are perpendicular to the equator (see fig. 2.9).
• Longitude is an angular measure of how far a point is either east or west of the zero degree meridian that passes through Greenwich, England (known as the prime meridian).

Fig. 2.9a

Fig. 2.9b

• The international date line roughly corresponds with the 180 degree longitude meridian.

Major Concept (X)
• Charts and maps are used to show the earth’s three‑dimensional surface on a flat, or two‑dimensional, surface.

• Any chart or map results in some amount of distortion of the earth’s true surface.
• The trick is to choose the type of map that gives the least distortion for the specific purpose you have in mind.

• Maps are made by projecting the features of the earth onto some type of surface, generally either a cylinder, a cone, or a plane tangent to the surface of the earth at some point.
• You can see each of these cases in figure 2.11.

Map Projections
© The McGraw-Hill Companies, Inc. Permission required for reproduction or display.

Major Concept XII
• Modern navigational techniques use electronic aids that include radar, radio broadcast, and satellite methods. • These allow us to determine position
in any kind of weather and at any time of day with tremendous accuracy.

• There are three principal systems used in modern navigation:• radar : “radio detecting and ranging,” • loran : “long-range navigation,” and• satellite navigation : GPS or “Global
Positioning System”
• All of these require accurate timing of signals

• Radar emits bursts of radio frequency energy• The bursts travel outward and then
reflect off distant objects. • By carefully measuring the travel time of
the reflected energy you can determine distance quite accurately.
• Radar needs a line of sight directly to the object• Can’t see behind a mountain or over the
horizon

• Loran systems utilized fixed stations that transmit radio waves at specific frequencies.
• A loran receiver on board a ship can detect these transmissions. • The difference in arrival time of the signals from
pairs of stations is a measure of distance from the stations.
• Unlike radar, loran can be used far from land as long as the vessel is within receiving distance of loran stations.
• Loran units can be interfaced with computers to automatically calculate latitude and longitude and to determine the ship's course to some pre-determined location

• The most accurate location system is the U.S. Navstar Global Positioning System (GPS). • A series of satellites broadcast radio signals that
will allow GPS receivers to be located in three dimensions within a few meters using commercial receivers and a few centimeters using military receivers (fig. 2.17).
• GPS navigation permits the determination of accurate location in any kind of weather and any time of day.

Fig. 2.17a

Depth Measurement

• Maps that show lines of equal elevation or depth are referred to as contour maps.
• Contour maps of the ocean floor are bathymetric maps, while contour maps of land regions are topographic maps.

Bathymetric Chart
© The McGraw-Hill Companies, Inc. Permission required for reproduction or display.

Seafloor Mapping
• Our ability to accurately map the features of the sea floor has been acquired only recently and continues to improve with advancing technology.

Early Measurements
• Early mariners, and even scientists, had no idea how deep the oceans are or how rugged their bathymetry is.
• In about 85 b.c. Posidonius, a Greek geographer, used a large rock tied to a rope to measure a depth of 2 km (1.2 mi) in the Mediterranean Sea.

Early Measurements
• Soundings, or measures of the depth of the water, continued to rely on weighted lines or ropes for centuries after Posidonius’s first measurement.
• Wax or tallow on the weight would capture samples of the sediment on the bottom and prove that it had reached the sea floor.

Accuracy?
• Sounding lines were marked in fathoms. • 1 fathom = 6 feet.
• At extreme depths, this was very time‑consuming and the weight of the rope made it difficult to sense when the lead hit the bottom • (think of the weight of 8 miles of rope!)• The measurements were not very accurate

Modern Methods
• Today - very accurate measurements of depth using sound.• Timing the passage of sound waves sent out by
the ship, reflect off the bottom and return to ship
• These instruments are called echo sounders or precision depth recorders (PDR’s).
• Their accuracy is due to the nearly constant velocity of sound in seawater and the ease of obtaining very precise timing.


Ocean Bathymetry
• The German research vessel Meteor was the first to use an echo sounder extensively on a long voyage in the Atlantic Ocean.
• It was during this voyage in 1925 that the Mid‑Atlantic Ridge was first detected

Modern Techniques
• We can map bathymetry at scales ranging from centimeters to kilometers with great accuracy using a variety of techniques• Detailed surveys of small areas are conducted
with manned submersibles or remotely operated vehicles (ROVs)
• Multibeam sonar systems towed by research vessels are used to map large areas
• In shallow regions airborne laser systems can map large regions rapidly.

ABE


Multibeam sonar


Sun-illuminated bathymetry

Color-ramped bathymetry

Bottom classification


Bathymetry from Space• We can even measure the height of
the sea surface over large areas using satellites.
• These changes are related to variations in gravity• Caused by major features on the sea
floor such as trenches, ridges, and seamounts.
• Surface up to 25–30 m (80–100 ft) lower over trenches and 5–10 m (16–33 ft) higher over seamounts and ridges.


Sea Floor Topography
• The land below the sea is as rugged as the land above it. In fact, undersea mountains are longer, the valley floors are wider and flatter, and the canyons are often deeper than those found on land.

Topographic Profiles

Underwater Geology
• Prior to 1930, virtually no knowledge of the nature and composition of sediment and crust underlying the oceans
• Things began to change around the time of WW II

• The 1960s were a period of time where there was a lot of development of new equipment and application of technology to oceanography. In this time:• Research ships and submersibles were built for
use by the federal government and universities• Deep Sea Drilling Program (DSDP) began to
core and retrieve sea floor sediment and rock in 1968 using the drill ship Glomar Challenger.
• Widespread use of electronics technology from the space program and computers on board research vessels.


Joides Resolution

