introduction - preventionweb.netcdpguide.pdf · ecological profile, ldis, maps physical planning...
TRANSCRIPT

INTRODUCTION
1
INTRODUCTION
General Planning and Development Model
In an ideal scenario, a particular local government unit (LGU) manages its own growth and change through a body of plans with varying scope and time frame. The term “ideal”, however, does not imply a utopian, unrealistic or unattainable dream. It simply means a scenario that does not exist as yet. Nevertheless, it is the scenario that the Local Government Code (LGC) of 1991 (RA 7160) wants every LGU to achieve. With the aid of various plans, LGUs are expected to more effectively manage their own local development.Section 20 of the LGC mandates LGUs to prepare a comprehensive land use plan (CLUP) enacted through a zoning ordinance, while Sections 106 and 109 of the same Code mandate the LGUs to prepare comprehensive multi-sectoral development plans (CDP) and public investment programs.
It is clear from the above-cited provisions of the Code that LGUs are required to prepare two plans: the CLUP and the CDP.
These plans influence public and private sector investments which have the cumulative effects of making available goods and services whose quality has been improved, and making them more accessible to the people, thereby raising the level of their well-being. Any change in the level of welfare of the population, on one hand is expected to create corresponding changes in the character and configuration of the land and other physical resources of the locality. On the other hand, it may be noted that any improvement in the level of social and economic well-being of the local population will almost always entail deterioration in the quality or quantity of the physical environment. How to achieve development objectives without necessarily sacrificing the environment poses a major challenge to local development planning and management.
As the LGU gains longer experience in managing its own growth and change, especially when the Sanggunian is ever alert for possibilities to formulate regulatory policies and to further support the implementation of plans, programs and projects with needed development regulations, its institutional capacity will be enhanced considerably. (See Figure 1 - A Local Planning and Development Model)
The Relationship between the Comprehensive Development Plan (CDP) and the Comprehensive Land Use Plan (CLUP)
The Comprehensive Land Use Plan (CLUP) and the CDP are distinct and separate. The term “comprehensive” in the CLUP is understood in its geographical, territorial sense, while the term “comprehensive” in the CDP has to be understood in the sense of “multi-sectoral” development.
On one hand, the CLUP can well be regarded as the plan for the long-term management of the local territory. As the skeletal-circulatory framework of the territory’s physical development, it identifies areas where development can and cannot be located and directs public and private investments accordingly. The CDP, on the other hand, is the action plan utilized by every local administration to develop and implement the proper sectoral and cross-sectoral programs and projects in the proper location to put flesh on the skeleton as it were, gradually and incrementally, until the desired shape or form of development is eventually attained over the long term. This is consistent with the definition of planning as “public control of the pattern of development”.

INTRODUCTION
2
Figure 1 - A LOCAL PLANNING AND DEVELOPMENT MODEL
IMPLEMENTATION INSTRUMENTS
TERM – BASED AGENDA
MULTI-YEAR, MULTI-SECTORAL DEVELOPMENT PLAN
LONG – TERM FRAMEWORK PLAN
IMPLEMENTATION INSTRUMENTS
• IMPROVED PUBLIC SERVICES• NEW OR IMPROVED PUBLIC FACILITIES/ INFRASTRUCTURE• INCREASED PUBLIC AWARENESS & PARTICIPATION
• CHANGE IN SOCIAL & ECONOMIC WELL-BEING OF RESIDENTS• CHANGE IN CONFIGURATION & QUALITY OF THE PHYSICAL ENVIRONMENT• CHANGE IN LOCAL INSTITUTIONAL CAPACITIES
COMPREHENSIVE LAND USE PLAN (CLUP)
SETTLEMENT POLICIES
PROTECTION LAND POLICIES
PRODUCTION LAND POLICIES
INFRASTRUCTURE POLICIES
ZONING ORDINANCE
COMPREHENSIVE DEVELOPMENT PLANSOCIAL ECONOMIC INFRA ENVI. MGT. INSTITUTIONAL
EXECUTIVE & LEGISLATIVE AGENDA (ELA)
LEGISLATIVE SUPPORT MEASURES
LOCAL DEVELOPMENT INVESTMENT PROGRAM
ANNUAL INVESTMENT PROGRAM
ANNUAL BUDGET
OTHER REGULATORY MEASURES
OUTPUTS
OUTCOMES
• INCREASED PRIVATE SECTOR INVESTMENT IN LOCAL ECONOMIC & SOCIAL DEVELOPMENT
IMPLEMENTATION INSTRUMENTS
Chart designed by Prof. Ernesto M. Serote
A common concern often raised by local planners is how to keep the long-term plan from being thrown away with every change in administration. The permanent answer to this concern lies precisely in having a separate CLUP from a CDP. The CLUP, once enacted into a zoning ordinance (Sec. 20, c), becomes a law. It remains in effect even after the incumbent officials have been replaced. Being a law, the CLUP-turned Zoning Ordinance cannot be simply “thrown away” without going through the proper legislative procedures for repealing or amending an ordinance. The truth of the matter is, the long-term CLUP, once in place, can no longer be claimed by, nor attributed to a particular administration. Rather, the CLUP belongs to the people. It is the “people’s plan”.
One thing that bolsters the interpretation that the CLUP and CDP are distinct and separate isthe fact that the responsibility for each plan is given to separate bodies in the LGU. The CLUP is assigned to the Sanggunian as provided for in Sections 447, 458 and 468 (Powers, Duties, Functions and Compensation of the Sangguniang Bayan, Panlungsod and Panlalawigan, respectively) of the Local Government Code; whereas the CDP is the responsibility of the LDC as provided for under Sections 106 (Local Development Councils) and 109 (Functions of Local Development Councils) of RA 7160. The Code has correctly assigned responsibility for the CLUP to the Sanggunian considering that most if not all of the instruments for implementing the CLUP involve regulating the use of lands that are mainly privately held and this requires the exercise of the political powers of the LGU through legislative action by the Sanggunian.
With the CLUP separated from the CDP, the review process by the Provincial Land Use Committee (PLUC) will be immensely simplified. The Code requires a review by the provincial government of the CLUP, not the CDP, of component cities and municipalities.

INTRODUCTION
3
It is highly desirable that the CLUP be completed ahead of the CDP. This is to ensure that the location policies in the CLUP will guide the identification screening and prioritization of programs and projects in the CDP (see Figure 2 - Simplified Planning Process). Considering that some public investments, especially of the “hard project” type, have a powerful impact on the long-term structuring of the built environment and on land use change in general, such projects should be properly screened to ensure that they are in consonance with, if not actually supportive of the preferred spatial strategy for the community.
VISION
ELEMENT DESCRIP TORS
SUCCESS INDICATORS
CURRENT REALITY
ECOLOGICAL PROFILE, LDIS,
MAPS
PHYSICAL PLANNING
GOALS
VISION –REALITY
GAP
SECTORAL GOALS
SECTORAL OBJECTIVES/
TARGETS
SPATIAL STRATEGIES
DEVELOPMENT
• P OLICIES
• STRATEGIES
• P ROGRAMS
• P ROJECTS
• LEGISLAT-IONSWhat it takes
to c losethe gap
What can bereasonably
done In 3 years
CLUP
CDP
ELABORATION OF ENDS SPECIFICATION OF MEANS
Figure 2 - Simplified Planning Process
The CLUP is in itself a rich source of programs, projects and ideas for legislation. The programs and projects identified in the CLUP however, invariably take a long time to carry out. On the other hand, the CDP has a relatively short timeframe. This, however, should not be used as a reason for ignoring the long-term programs of the CLUP and implementing instead other projects with shorter timeframes. Rather, the short time frame of the CDP should be used to carry out the long-term CLUP programs in phases. This way, local development will appear less disjointed, arbitrary, or random but will acquire stability, continuity and rationality.
The CDP can be regarded as an action plan and an implementing instrument of the CLUP.By having a CLUP which serves as a long-term guide for the physical development of the locality and the CDP that is multi-year, but serves as the basis for crafting an Executive and Legislative Agenda (ELA) which is co-terminus with the term of local elective officials, there is an assurance of continuity, rationality and stability of local development efforts.
It is the CDP or rather, the CDP-based ELA that is associated with a particular administration.The CLUP and the CDP may be prepared in an iterative way. For simplicity, the preparation of the CLUP and CDP can be divided into four (4) modules consistent with the capability building approach (Figure 3 - CLUP-CDP Process Flow).

INTRODUCTION
4
Each module is described briefly as follows:
1. Module 1 – Formulation of new goals or revalidating and/or revising the existing vision statement. The outputs of this module are as follows:a. Revalidated/ revised vision statementb. Vision elements and their respective descriptors and success indicatorsc. Vision – reality gap which will eventually be transformed into sectoral goals
Figure 3- CLUP – CDP Process Flow
MODULE 1
VISION –REALITY GAP
ANALYSIS
MODULE 2
REVIEW/ ASSESSMENT/ IMPACT M & E
INITIAL CHARACTERIZATION BY AREA, BY SECTOR
VALIDATION OF DATA
INTER- INTRA AREA ANALYSIS
FURTHER RESEARCH & MAP OVERLAY
ANALYSIS
PUBLIC CONSULTATION
NO. 1
DEMAND – SUPPLY BALANCING OF LAND
RESOURCES
SIEVE MAPPING
PUBLIC CONSULTATION NO. 2
DETAILED LAND USE PLAN
POLICY FORMULATION
PUBLIC CONSULTATION
NO. 3
MODULE 3
SECTORAL DEVELOPMENT PLANS
MODULE 4
DEVELOPMENT REGULATIONS
INVESTMENT PROGRAMMING & BUDGETING
STATISTICAL COMPENDIUM
EXISTING DATA & MAPS
DATA GAPS
NEW ECOLOGICAL
PROFILE
DECISION ZONES
POLICY OPTIONS
VISION & ASPIRATIONS FOR THE LGU
REFINED VISION & GOAL STATEMENTS
DEVELOPMENT POTENTIALS &
PROBLEMS
PREFERRED SPATIAL STRATEGY OF DESIRED
URBAN FORM
ALTERNATIVE SPATIAL STRATGEIES
GENERAL LAND USE PLAN & URBAN LAND
USE PLAN
DRAFT ZONING
ORDI-NANCE
SECTORAL DEVELOPMENT OBJECTIVES &
TARGETS
SECTORAL PROGRAMS, PROJECTS & ACTIVITIES
OTHER LOCAL LEGISLATIONS
ANNUAL GENERAL FUND
BUDGET
LEGEND:
A PROCESS OR ACTIVITY INPUT TO, OR OUTPUT FROM A PROCESS OR ACTIVITY
OVERLAP WITH THE NEXT MODULE
2. Module 2 – Generation of the planning database consisting of statistics and maps and analytical tools and techniques to derive various indicators of development or underdevelopment, of problems and constraints as well as opportunities and challenges for development. The outputs of this module are as follows:
a. Updated ecological profile of the planning areab. Matrix of Local Development Indicators (Statistical Compendium)c. Accomplished “Problem – Solution Matrix”
3. Module 3 – Formulation of the Provincial Physical Framework Plan (PPFP) in the case of the province and the CLUP in the case of cities and municipalities. This involves undertaking the following activities:

INTRODUCTION
5
a. Generation of alternative spatial strategies taking into account the regional and provincial spatial strategy and choosing the most desirable alternative for the province or city/municipality, as the case may be.
b. Formulation of policies on settlements, production, infrastructure and protection areas consistent with the preferred strategy.
c. Formulation of implementation tools, e.g., zoning ordinance
The outputs of activities under this module are as follows:
a. Draft Provincial Physical Framework Plan and / or City/Municipal CLUPb. Policy maps printed at suitable scalec. Draft Zoning Ordinance
4. Module 4 – Preparation of the Multi-Year Provincial/City/Municipal CDP. The main activities under this module are as follows:
a. Formulation of sectoral goals, objectives and targetsb. Prioritization of sectoral programs, projects and activitiesc. Preparation of the Local Development Investment Program (LDIP)d. Identification of new legislations needed to carry out the sectoral planse. Preparation of the capacity development program
Integrating NGA Requirements and Cross-Sectoral Concerns into the CDP
One dimension of rationalized planning is the reduction of the number of plans that LGUs must prepare and the integration of cross-sectoral concerns in the planning process. This implies that national government agencies (NGAs) advocating or requiring LGUs to prepare certain sectoral, area, thematic or systems plan must integrate these requirements into either the CLUP or the CDP, as the case may be, and allow the local planning structure and processes to respond to these requirements.
There are over twenty (20) different plans required by NGAs of LGUs over and above the two (2) Code-mandated plans – the CLUP and CDP. To rationalize the practice to the extent of integrating NGA requirements substantively and procedurally into local planning, at least two (2) pre-conditions must be satisfied:
1. The local planning structure, that is, the Local Development Council (LDC) and its sectoral and functional committees, are in place.
a. NGAs need not go to the extent of creating a new planning body or structure to produce their desired plan outputs. If there is an existing NGA office operating in the LGU, its officers and staff should be invited to join the relevant sectoral or functional committee.
2. The local plans are truly comprehensive, meaning, the CLUP covers the entire LGU territorial jurisdiction, both land and water; and the CDP embraces all development sectors and sub-sectors, including the concerns of each.
In this connection, NGAs requiring LGUs to produce certain planning outputs ought to learn to utilize the planning structures and processes that are already in place in the LGUs.
If the LDC is already existing and properly functioning, there will always be a planning body that will respond to any conceivable requirement of the national government.

INTRODUCTION
6
The NGA-mandated plans listed below need not be prepared by planning bodies created outside of the LDC and/or its sectoral or functional committees. In fact these plans already fall within the concerns of existing sectoral committees. In the case of area, thematic or systems plan that involves several sectors, functional committees could be formed drawing membership from the sectoral committees themselves.
1. Action Plan for the Council for the Protection of Children
2. Annual Culture and Arts Plan
3. Agriculture and Fisheries Management Plan
4. Coconut Development Plan
5. Local Entrepreneurship Development Plan
6. Local Tourism Development Plan
7. Small and Medium Enterprise Development Plan
Some development issues can be confined within the conceptual boundaries of a particular sector. Issues of this nature are better handled by specific sectors. Other issues however, are common to two or more sectors and such issues can be addressed jointly by the sectors concerned through inter-sectoral consultations, round-robin fashion (see Figure 4 - Inter-sectoral Consultations and Table 1- Sample Issues Common to Sectoral Plans). Complex development issues such as that of poverty, disaster risk management, gender and development, to name a few, need to be addressed either by a multi-sectoral functional committee or by the LDC acting as a committee of the whole.
Figure 4 - Inter-sectoral Consultations
1
2
3
4
5
67
8
910
SOCIAL
ECONOMIC
INSTITUTIONALINFRASTRUCTURE
& LAND USE
ENVIRONMENTAL
If the CDP is truly comprehensive, then every possible subject of planning and development can be subsumed under a particular sector or a combination of sectors in the CDP.

INTRODUCTION
7
Some of the plans that require inter-sectoral functional committees are the following:
1. Disaster Management Plan2. Local Poverty Reduction Plan3. Gender and Development Plan4. Sustainable Development Plan5. Food Security Plan6. Integrated Area Community Peace and Order and Public Safety Plan
Table 1 - Sample Issues Common to Sectoral Plans
SECTORS ISSUES
Social - Economic Household income and expenditure Labor force participation rate Employment, unemployment, underemployment Job-related health risks
Economic - Institutional Private investment incentives and regulations (local ordinances) Budget allocation for economic development (% of total budget) Economic performance of public enterprises
Land Use/Infrastructure- Institutional Land use planning and regulation Budget allocation for roads and bridges, drainage and sewerage, water and power supply Space and buildings for the administration of justice, police and fire stations, jails an detention
cells, etc.
Environmental – Land Use/Infrastructure Infrastructure vulnerable to environmental hazards Infrastructure to mitigate or prevent environmental disasters Sustainability in land use patterns
Social – Environmental Domestic waste generation disposal Air pollution by source Population to land ratio
Social - Institutional Social development budget as percent of total budget for socialized housing, livelihood services, health, welfare, education, protective services, etc.
Mechanisms for promoting people participation in local governance Mechanisms to ensure accountability and transparency in public office
Social – Land Use/Infrastructure Infrastructure to ensure social access (public transport service area, access ramps for disabled, traffic-related accident rate)
Infrastructure to ensure public safety and convenience (pedestrian friendly street furniture); for public recreation (outdoors and indoors)
Impact of infrastructure on land use and population distribution
Economic - Environmental Sustainability in resource use Economic activities vulnerable to environmental hazards Effluent generation and disposal
Environmental - Institutional Local policy (regulation) on environmental regulation Local budget allocation as percent of total budget on environmental and natural resources
management Local programs on environmental rehabilitation
Economic – Land Use/ Infrastructure Economic support infrastructure (appropriateness and adequacy) Land use pattern that promotes economic efficiency

INTRODUCTION
8
It would certainly make a difference if the different sectoral and functional committees at the city or municipal level were involved in the preparation of these thematic or systems plans.
The outputs of each sectoral plan or inter-sectoral consultation may be grouped into two types: programs and projects and new policies, or new legislations. The first type of outputs will serve as the source of inputs to the local development investment program. The second type of outputs will be included in the legislative agenda of the Sanggunian.
Synchronization and Harmonization of Planning, Investment Programming, Revenue Administration, Budgeting and Expenditure Management at the Local Level
On March 8, 2007, four national agencies, namely the DILG, National Economic Development Authority (NEDA), Department of Budget and Management (DBM) and the Department of Finance (DOF), collectively known as the Oversight Agencies (OAs), approved and issued Joint Memorandum Circular (JMC) No. 001 series of 2007. The fundamental intent of this JMC is to harmonize the guidebooks and manuals prepared by the Oversight Agencies; define the individual and joint roles and functions of the Oversight Agencies in relation to planning, investment programming, revenue administration, budgeting and expenditure management in order to facilitate the crafting of a plan-based budget at the local level, using tools and instruments and adopting strategies and approaches that harness multi-stakeholder participation; establish and strengthen vertical and horizontal linkages among the network of plans, investment programs and budgets at all levels of the administrative hierarchy; and capitalize on the Local Government Code-mandated structure – the Local Development Council (LDC) as the principal vehicle for planning and investment programming activities.
In the ambit of this JMC, local planning at the city and municipal level focuses on the preparation of the comprehensive multi-sectoral development plan, which springs from a process that, at a certain point also yields a CLUP as a separate and distinct document.
Among the significant features of the JMC involves the following:
1. providing opportunities for interface between national government agencies (NGAs) and local government units (LGUs), and
2. strengthening the complementation between provinces and their component cities and municipalities.
The first is to emphasize the role of the local government units (LGUs) as partners of the national government in national development and as collaborators and cooperators in local development. The second is to establish the significant role of the province in formulating development plans, policies and strategies that are built on the development concerns, thrusts and programs of it component cities and municipalities, while ensuring that local development goals and objectives are attuned with regional and national priorities.
The Relationship between the Province and its Component LGUs in the Plan Formulation Process
In the entire gamut of establishing a rationalized local planning system and the capability building activities that it entails, the province is viewed as the most critical point of entry of interventions. Sectoral planning experts found or trained at the provincial level can serve as mentors to their municipal counterparts. And since provincial assistance to component LGUs actually forms part of the regular functions of provincial government
Being at the apex of the 3-tier local government system, the province could be the most effective channel for effecting the integration of plans and planning processes at the local level.

INTRODUCTION
9
officers, their extension services could be availed of at any time. Establishing a pool of technical experts among provincial government functionaries is a more cost-effective approach to technology transfer than engaging the services of planning consultants.
In terms of vertical integration of plans, the Provincial Governor serves as the vital link of LGUs to the national government by virtue of his/her membership in the Regional Development Council. At the lower level, the power of automatic review of all policies and actions of component LGUs by the Sangguniang Panlalawigan can be utilized to effect reconciliation and integration between the plans of component LGUs and those of the provincial government. The provincial government can utilize its review and oversight powers to resolves issues between adjoining municipalities.
Interface between NGAs and LGUs in Local Planning
NGAs are enjoined to utilize the existing local planning structure, the LDC and avoid creating new ones in the process of preparing sectoral, thematic or systems plans. They are alsoencouraged to learn to integrate their planning methodologies and analytical techniques into the regular planning process. In this connection, all NGA officers operating in the LGU are encouraged to join relevant sectoral and functional committees in the LDC.
NGAs can serve as coach or mentor on technical matters of their expertise in the followingplanning tasks, such as:
1. Building and maintaining the sectoral database by generating sectoral data for the updating of the ecological profile, processing of data to generate development indicators for inclusion in the Local Development Indicators System, and assisting in the conduct of impact monitoring and evaluation.
2. Teaching and applying analytical and planning tools and techniques peculiar to the sector to their local counterparts for the latter to be able to produce their own sectoral plan. This sectoral plan may incorporate the particular thematic or system plan required by the NGA.
3. Participating in public consultations to provide information on applicable national goals, laws and policies and programs and to help reconcile local goals and policies with those of the national.
4. Engaging in budget advocacy to encourage the LGU to give priority to local sectoral programs and projects that will supplement or complement the effects of on-going or proposed national programs.
The Synchronized Local Planning and Budgeting Calendar (SLPBC)
An important adjunct to the JMC is a Synchronized Local Planning and Budgeting Calendar (SLPBC). A unique element in the SLPBC is its scope, which covers a 3 – year period. The calendar specifies activities that are undertaken only during an election year, when incumbent local government officials end their tenure of office and new or re-elected ones begin theirs. It also provides a guide for participation by the key actors in the planning, investment programming, revenue administration, budgeting, and expenditure management.
Under the current devolution policy, LGUs are no longer to be treated as subordinates to, but as partners of the national government in the attainment of national goals (Sec. 2 ([a], RA
7160).

INTRODUCTION
10
1. As an Instrument for Synchronization
The SLPBC lists down the deadlines and milestone dates for budgeting activities as mandated by law. Then, planning, investment programming and revenue administration activities are “fitted’ into or synchronized with the budget calendar to allow them to catch up with the budgeting process. This is particularly important so that programs, projects and activities identified to carry the LGU towards the attainment of its vision, goals and objectives are prioritized in the 3-year local development investment program (LDIP), the annual investment program (AIP), and in the local annual or supplemental budget. The calendar also suggests the timelines during which the province and its component LGUsmay conduct activities jointly or independently but simultaneously, and the period when outputs of such independently-conducted activities should be completed and consolidated at the provincial level.
2. As an Instrument that Provides Opportunities for Complementation between the Province and its Component Cities and Municipalities
The calendar suggests the periods when complementation between the province and its component cities and/ or municipalities can take place. It sets the stage for:
a. Establishing proper coordination between the province and its component LGUs to ensure that their vision, strategic directions, goals and objectives as embodied in their respective development plans are consistent and supportive of one another;
b. Soliciting and consolidating support for programs, projects and activities are facilitated to redound to the mutual and/or common benefit of all LGUs within the territorial jurisdiction of the province; and
c. The higher LGU to take cognizance of the priorities and needs of the lower LGU, and vice versa.
3. As an Instrument that Provides Opportunities for Interface between the National Government Agencies and Local Government Units
The SLPBC provides avenues and suggests periods where and when NGAs and LGUs can engage each other, especially in the matter of technical assistance, funding support, inclusion of LGU priorities in NGA programs and projects and vice versa, as well as in the determination of legislative actions on the part of the LGU to support NGA programs that will impact on the LGU.
Cross Referencing of Guidebooks and Manuals
The sets of manuals and guidebooks that the Oversight Agencies have developed to serve as reference materials for local planning, investment programming, revenue administration,and budgeting and expenditure management are intended to build the capacity of LGUs in formulating their plans, investment programs, budgets and revenue administration measures. The tools and techniques being offered in one manual or guidebook may also be found in another. This may construed as an iteration of the desirability or applicability of such tools and/or techniques for a particular phase or step in the planning, investment programming, revenue administration, budgeting, and expenditure management process. To some LGUs, going through all these manuals volume by volume, or chapter by chapter with or without coaching assistance from the agency concerned may be an easy task. But to the many others, such endeavor may prove to be tedious and daunting. To address this concern, a cross-referencing guide has been developed. Part I of the guide lists downvarious tools, techniques and methodology that may be adopted in the various steps of the planning, investment programming, budgeting and revenue administration process, and

INTRODUCTION
11
indicating in what specific guidebook and manual can they be found; and Part II describes or annotates each of these tools, techniques and methodology.
This Guide is one of the suggested reference documents.
Approaches to CDP Preparation: Inclusive, Participatory, and Consultative
The LDC is one of the two more important components of the planning structure; the Sanggunian being the other one. They are the bodies that lay down policy guidelines and take decisions regarding the direction, character and objectives of local development. Together with the Congressman’s representative, they comprise the political component of the local planning structure.
The most ample avenue for multi-stakeholder participation in local planning and development is the allocation to non-governmental organizations of one-fourth of the totalmembership of the LDC. The Code explicitly directs LGUs to promote the establishment and operation of people’s and non-governmental organizations (POs and NGOs) as active partners in the pursuit of local autonomy (Section 34, RA 7160).
The technical component of the local planning structure is composed of non-elective officials of the LGU, particularly the LPDO, LGU department heads, local special bodies, sectoral and/or functional committees of the LDC, chiefs of national government agencies in the LGU and private sector representatives. It is in the sectoral of functional committees and/or other local special bodies where other stakeholders who did not gain accreditation as members of the LDC can get to participate in the planning process.
The steps in the planning process where multi-stakeholder participation can be harnessed are listed below.
Stage 1: Generating the Planning Data Base
Technical inputs in the areas of data generation, analysis and presentation are mainly the responsibility of the technical component of the planning structure. The interpretation of the data and the explanations and implications of information derived from the data, however, should be undertaken through a broad consultative and participatory processes involving both political and technical component of the planning structure and the general public.
Stage 2: Vision and Goal Setting / Re-validation/Revision
This should be done with the political component and the general public. The technical component only facilitates the proceedings.
Stage 3: Preparation of the Multi-Year Comprehensive Development Plan
This is the responsibility of the Local Development Council with inputs from its sectoral and functional committees.
The approach to preparing the CDP and even the format in presenting the output may be sectoral. The different components may be printed and bound separately so that they are easier to handle and more convenient to use. The usual practice of presenting the CDP in one thick volume appears to be intimidating and unattractive to untrained readers.
Stage 4: Preparation of the Local Development Investment Program
The Code also encourages LGUs to provide assistance, financial or otherwise, to POs and NGOs that seek to undertake projects that are economic, socially-oriented, environmental or cultural in character (Section 36, RA 7160).

INTRODUCTION
12
Stage 5: Plan Implementation
Where POs and NGOs are able to marshal adequate resources of their own, LGUs are enjoined to enter into joint ventures and similar cooperative arrangements with them. Such joint undertakings may be for the delivery of basic services, capability building and livelihood projects. These joint ventures may also include the development of local enterprises designed to improve the productivity and incomes, diversify agriculture, spur rural industrialization, promote ecological balance, and promote the economic and social well-being of the people (Section 35, RA 7160).
Scope of the Guide
Sectoral
To be truly comprehensive, the CDP includes all the five (5) development sectors and sub –sectors, namely:
1. Social
a. Educationb. Health and Nutritionc. Social Welfare and Developmentd. Sheltere. Public Order and Safetyf. Sports, Recreation, Arts and Culture
2. Economic
a. Primaryi. Agricultural Cropsii. Livestockiii. Fisheries (Inland, marine, brackish)iv. Forestry
b. Secondaryi. Mining and quarryingii. Manufacturingiii. Constructioniv. Electricity, water, gas, utilities
c. Tertiaryi. Wholesale and retail tradeii. Transportation and communicationiii. Finance, insurance and related services
3. Infrastructure
a. Economic Supporti. Irrigation systemsii. Power generation (mini-hydro)iii. Roads, bridges, portsiv. Flood control and drainagev. Waterworks and sewerage systemsvi. Telecommunications

INTRODUCTION
13
b. Social Supporti. Hospitalsii. Schoolsiii. Public socialized housingiv. Facilities for the aged, infirm, disadvantaged sectors
c. Public Administrative Supporti. Government buildingsii. Jailsiii. Freedom parks and Public assembly areas
4. Environment and Natural Resources
a. Landsi. Lands of the Public domainii. Private and alienable and disposable landsiii. Ancestral domain
b. Forest Landsi. Protection forestsii. Production forests
c. Mineral Landsi. Metallic mineral landsii. Non-metallic mineral lands
d. Parks, wildlife and other reservations
e. Water resourcesi. Freshwater (ground, surface)ii. Marine waters
f. Air Quality
g. Waste Managementi. Solid wasteii. Liquid wasteiii. Toxic and hazardous
5. Institutional
a. Organization and Managementb. Fiscal Managementc. Legislative Outputd. LGU-Civil Society Organizations – Private Sector Linkages
Planning Period
The timeframe of the CDP may be multi-year – from a minimum of three years for the short-term to six years for the medium-term. It could even be longer, but preferably in multiples of three (3) years. The short-term slice equivalent to three (3) years may be taken off to coincide with the term of the elective local officials so that it can serve as the basis for their Executive and Legislative Agenda (ELA). Its timeframe is co-terminus with the term of the elected officials so that after their term ends there is no need for the incoming officials to “throw away” a plan that had expired. All that the new administration needs to do is formulate its own 3-year ELA making sure that the successor plan is consistent with the CLUP policies

INTRODUCTION
14
and will contribute to the realization of the multi-year development plan of the area as embodied in the CDP.
Contents of the CDP
The formal and substantive elements of the Comprehensive Development Plan include, but are not limited to the following:
1. Preliminary Pagesa. Resolution adopting the CDPb. Forewordc. Acknowledgementd. Table of Contentse. List of Tablesf. List of Figuresg. List of Boxes
2. Quick Facts about the LGU (Brief and preferably in bullet form only)a. Brief Historical Backgroundb. Geo-physical Characteristics
Location and Total Land Area Topography Climate
c. Population and Demographic Profile Total population – male and female; urban – rural; school-age population by level, by sex;
dependent population, male and female; labor force, male and female Population density
Ethnicity Religion Languages/dialects Poverty incidence
d. Social Services Number of schools, hospitals, daycare centers
e. Economy Major economic activities Number of business establishments by industry sectors
f. Infrastructure Transport and Utilities (major circulation network, sources of water and power supply and
communication facilities) Administrative infrastructures (number of national government offices situated and
operating in the LGU
g. Environment Solid waste management General air quality General water quality
h. Institutional Machinery Political subdivisions (Number of Districts, Barangays)
Organizational Structure
3. Matrix of Local Development Indicators

INTRODUCTION
15
4. Comprehensive Development Plan
1. Vision
2. Vision – Reality Gap Analysis
3. Cross-Sectoral / Special Issues and Concerns
4. Sectoral Development Plans
a. Social Development Plan – This is a compendium of proposed activities designed to deal with the identified issues and concerns relative to improving the state of well-being of the local population and upgrading the quality of social services such as health, education, welfare, housing and the like. Questions of equity and social justice and gender sensitivity are also addressed by this sectoral plan. Many programs and projects in this sector are of the “soft” non-capital type but they are as important as the capital investment or “hard” projects.
b. Economic Development Plan – This embodies what the local government intends to do to create a favorable climate for private investments through a combination of policies and public investments to flourish and, ultimately, assure the residents of steady supply of goods and services and of jobs and household income. A very significant component of this sectoral plan is the LGU’s support to agriculture and other food production activities and the promotion of tourism programs.
c. Infrastructure and Physical Development Plan – This deals with the infrastructure building program and the land acquisition required as right-of-way or easements of public facilities. The physical development plan may include redevelopment schemes, opening up new settlement areas or development of new growth centers in conformity with the chosen spatial strategy.
d. Environmental Management Plan – This consolidates the environmental implications of all development proposals within the municipality and provides mitigating and preventive measures for their anticipated impacts. It embodies programs for maintaining cleanliness of air, water and land resources and rehabilitating or preserving the quality of natural resources to enable them to support the requirements of economic development and ecological balance across generations. A major component of this sectoral plan will also include measures to minimize the vulnerability of the local residents to natural hazards and disasters.
e. Institutional Development Plan – This focuses on strengthening the capability of the local government bureaucracy as well as elected officials to plan and manage the development of the municipality. Manpower development, fiscal management and program/project management are the vital components of this sectoral plan. This sectoral plan likewise promotes the involvement of voluntary groups or civil society organizations in the preparation, implementation, monitoring and evaluation of the different sectoral programs, projects and activities.
The outputs of each sectoral plan will serve as an input to the local development investment program and to the legislative agenda of the Sangguniang Bayan.

INTRODUCTION
16
Each sectoral development plan contains the following:
a. Introduction
b. Goals
c. Objectives and Targets
d. Strategies
e. Programs and Projects
f. Proposed Legislations
g. Project Ideas of Project Briefs/Profiles
5. Local Development Investment Program
6. Glossary of Terms

PRELIMINARY PAGES
i
PRELIMINARY PAGES
Foreword
The Department of Interior and Local Government (DILG), pursuant to Section 5 (e) of Republic Act No. 6975, is directed to vigorously pursue of its mandate “to establish and formulate plans, policies and programs to strengthen the technical, fiscal and administrative capabilities of local governments”. This is congruent to Paragraph k, Article 182 of the Implementing Rules and Regulations of RA 7160 (the Local Governmnt Code of 1991, hereinafter known as LGC or the Code) which states that, “[T]he DILG shall, in coordination and consultation with the NEDA and the leagues of LGUs, formulate the operational guidelines of the local development planning process”.
To implement these, the DILG and NEDA formulated a 4-volume Guide for the Preparation of Comprehensive Development Plans to help LGUs in the plan formulation process and facilitate their compliance with _____________________ issued by then President Joseph Ejercito Estrada. A total of ___________ LGUs yielded some ________ plans using this Guide.
A collaborative effort has also been forged with the Local Governance Support Program (LGSP) under the auspices of the Canadian International Development Agency (CIDA), to simplify the development planning process to yield a plan document called an Executive and Legislative Agenda whose period of implementation coincides with the term of office ofelective local government officials.
Subsequently, DILG caused the development of and launched the Rationalized Local Planning System to implement the full implications of the Code pertinent to local planning. It then became necessary to develop a reference document to put into operations the concepts and processes enunciated in the RPS. Thus, the formulation of this Guide has become a matter of course.
The completion of this Guide became even more urgent to fulfill the commitment of DILG where together with NEDA, DBM and DOF it signed Joint Memorandum Circular No. 1 on March 8, 2007 to synchronize and harmonize planning, investment programming, revenue administration, and budgeting and expenditure management at the local level. This JMC points not only to the synchronization and harmonization of these operations at the local level, but also for the cross-referencing of guidebooks and manuals developed by the respective agencies.
It must be emphasized, however, that the Guide is neither dogmatic nor prescriptive. While it offers some procedures, tools and techniques along each step of the comprehensive development planning process, it also allows the user to adopt other methodologies and instruments to make the plan formulation exercise participatory, inclusive and non-intimidating. Even as it focuses on local planning, it also takes into consideration the other special and cross-sectoral concerns of various national government agencies that seek fulfillment at the local government level.
It is the hope of DILG that this Guide will further simplify the comprehensive development planning process at the local level.
RONALDO V. PUNO Secretary

PRELIMINARY PAGES
ii
Acknowledgment

PRELIMINARY PAGES
iii
Acronyms
AIP Annual Investment Program
BESF Budget of Expenditure and Sources of Financing
BFAR Bureau of Fisheries and Aquatic Resources
BOMB Budget Operations Manual for Barangays
BOT Build-Operate-Transfer
BSWM Bureau of Soils and Water Management
CAPDEV Capacity Development
CBMS Community-Based Monitoring System
CDP Comprehensive Development Program
CENRO Community Environment and Natural Resources Officer
CIDA Canadian International Development Agency
CLPI Core Local Poverty Indicator
CLUP Comprehensive Land Use Program
CO Capital Outlay
CPDO City Planning and Development Office
CSO Civil Society Organizations
DBM Department of Budget and Management
DENR Department of Environment and Natural Resources
DILG Department of Interior and Local Government
DOF Department of Finance
DRM Disaster Risk Management
DTI Department of Trade and Industry
ELA Executive and Legislative Agenda
EP Ecological Profil
GAM Goal Achievement Matrix
GSIS Government Service Insurance System
HLURB Housing and Land Use Regulatory Board
HRD Human Resource Development
HRDO Human Resource Development Office
IRA Internal Revenue Allotment
IRR Implementing Rules and Regulations
JMC Joint Memorandum Circular
LA Legislative Agenda
LCE Local Chief Executive
LDC Local Development Council

PRELIMINARY PAGES
iv
LDI Local Development Indicator
LDIP Local Development Investment Program
LDIS Local Development Indicator System
LEP Local Expenditure Program
LFC Local Finance Committee
LGC Local Government Code
LG-ENRO Local Government Environment and Natural Resources Officer
LGOO Local Government Operations Officer
LGPMS Local Governance Performance Management System
LGSP Local Government Support Program
LGU Local Government Unit
LMB Land Management Bureau
LPDC Local Planning and Development Coordinator
LPDO Local Planning and Development Office
LQ Location Quotient
M & E Monitoring and Evaluation
MDG Millennium Development Goals
MGB Mines and Geosciences Bureau
MHO Municipal Health Office
MOOE Maintenance and Other Operating Expenses
MPDO Municipal Planning and Development Office
MTPDP Medium-term Philippine Development Plan
NAMRIA National Mapping and Resource Information Authority
NEDA National Economic and Development Authority
NGA National Government Agency
NGO Non-government Organizations
NIPAS National Integrated Protected Areas System
NPFP National Physical Framework Plan
NSO National Statistics Office
ODA Official Development Assistance
OFW Overseas Filipino Worker
OPW Orientation – Planning - Workshop
OTW Orientation – Training – Workshop
PA 21 Philippine Agenda 21
PAWB Protected Areas and Wildlife Bureau
PCUP Philippine Commission on the Urban Poor
PDP Provincial Development Plan
PDPFP Provincial Development and Physical Framework Plan

PRELIMINARY PAGES
v
PENRO Provincial Environment and Natural Resources Officer
PESO Public Employment Services Office
PHILVOCS Philippine Institute of Volcanology and Seismology
PLUC Provincial Land Use Committee
PMC Project Monitoring Committee
PO People’s Organizations
POSO Public Order and Safety Office
PPA Program/Project/Activity
PPDC Provincial Planning and Development Coordinator
PPDO Provincial Planning and Development Office
PPFP Provincial Physical Framework Plan
PS Personal Services
PTA Parent-Teacher Association
RA Republic Act
RDP Regional Development Plan
RHU Rural Health Unit
RLA Regional Line Agency
RPFP Regional Physical Framework Plan
RPS Rationalized Local Planning System
RPT Real Property Tax
SB/P Sangguniang Bayan/ Panlungsod
SCALOG System on Competency Assessment for Local Governments
SEP Socio-Economic Profile
SEPP Socio-Economic and Physical Profile
SLGR State of Local Governance Report
SSS Social Security System
SWDO Social Welfare and Development Office
TWG Technical Working Group
UBOM Updated Budget Operations Manual for Local Government Units
UNDP United National Development program
ZO Zoning Ordinance

PRELIMINARY PAGES
vi
About the Guide
The Guide to Comprehensive Development Plan (CDP) Preparation is an enhanced version of the _____________________________ previously issued by DILG and NEDA in ____. This is derived from the Rationalized Local Planning System Sourcebook which was launched by DILG to assist the readers in understanding why and how to implement the full implications of the Local Government Code of 1991 (Republic Act 7160) pertaining to local planning. This Guide may be viewed as the translation of the RPS Sourcebook into a question-and-answer reference document in order to assist local government units in preparing their CDPs in accordance with the tenets articulated in the Sourcebook.
This Guide consists of four (4) parts:
Part I – Getting Started
This section sets the stage for the Plan Formulation Proper – from the organization to training of the Planning Team, and the subsequent orientation for the local chief executive and members of the Sanggunian. It also contains selection criteria for planning team members, definition of roles and functions of key actors in the plan formulation process, including those of national government agencies and civil society organizations in order to make the plan formulation process truly inclusive and participatory.
Part II – Preparing the Plan
This part consists not only of the “how –to’s” for every step of the sectoral planning process, but it also provides answers to questions like “what is it?”, “why is it important?” and “who is responsible?” This emphasizes the need to re-focus attention from merely producing the plan document alone to making planning as an integral part of governance by making the LGUs understand why they ought to plan and who should be involved. The easy-to-use-and-follow tools and techniques are presented in a way that makes them more user-friendly andtheir “technical” or “technocratic” character are tamed without diminishing their value and effectiveness as instructional devices, especially for those who are not technically trained.
Part III – Implementing the Plan
This provides the basic elements of the three principal instruments in implementing the CDP, namely, the Local Development Investment Program (LDIP), the Legislative Agenda (LA) and the Capacity Development Program (CapDev). Just like in Part I, this section of the Guide not only offers the procedural steps for yielding these outputs, but also the concept inputs to allow the users to have a better appreciation of what, why and who are responsible for the exercise.
Part IV – Plan Monitoring and Evaluation
This section highlights the importance of Plan Monitoring and Evaluation (M & E) as the link between two planning cycles and thereby reinforces the cyclical nature of the planning process. It suggests the periods when and who may conduct what type of M & E.
It must be emphasized that the tools, techniques, strategies and methodologies suggested in this Guide are not prescriptive. Rather, they can complement or supplement those that have been developed or being offered by other agencies to facilitate the preparation of local comprehensive development plans.

PRELIMINARY PAGES
vii
TABLE OF CONTENTS
Page
FOREWORD …………………………………………………………………………………...…… i
ACKNOWLEDGEMENT …………………………………………………………………………… ii
ACRONYMS ……………………………………………………………………………................... iii
ABOUT THE GUIDE ………………………………………………………………………………... vi
MEMORANDUM-CIRCULAR ……………………………………………………………………… vii
INTRODUCTION ……………………………………………………………………………………. 1
General Planning and Development Model ……………………………………………………….. 1
The Relationship between the Comprehensive Land Use Plan (CLUP) and the Comprehensive Development Plan (CDP) ………………………………………………………… 1
Integrating NGA Requirements and Cross-Sectoral Concerns in the CDP................................. 5
Synchronization and Harmonization of Planning, Investment Programming, Revenue Administration, Budgeting and Expenditure Management at the Local Level …………………. 8
The Relationship between the Province and its Component Local Government Units in the Planning Process …………………………………………………………………………………….. 8
Interface between National Government Agencies and Local Government Units in Local Planning ……………………………………………………………………………………………….. 9
The Synchronized Local Planning and Budgeting Calendar ……………………………………. 9
Cross-Referencing of Guidebooks and Manuals …………………………………………………. 10
Approaches to CDP Preparation ……………………………………………………………………. 11
Scope of the Guide …………………………………………………………………………………… 12o Sectoral ……………………………………………………………………………………... 12o Planning Period ……………………………………………………………………………. 13
Contents of the CDP …………………………………………………………………………………. 14
PART I – GETTING STARTED ………………………………………………………………………………...
17
Chapter 1 – Organizing and Mobilizing the Planning Structure ………….……………………… 17
PART II – PREPARING THE PLAN ……………………………………………………………… 36
Chapter 1 – Setting the Vision ………………………………………………………………………. 36
Chapter 2 – Preparing the Ecological Profile and Constructing the Local Development Indicators Matrix ……………………………………………………………………………………… 42
Chapter 3 – Analyzing the LGU Situation ………………………………………………………….. 89
Chapter 4 – Setting Sectoral Goals, Objectives and Targets …………………………………… 113
Chapter 5 – Transforming Goals into Actions ……………………………………………………... 123
PART III – IMPLEMENTING THE PLAN ………………………………………………………… 128
Chapter 1 – Local Development Investment Programming ……………………………………… 128
Chapter 2 – Preparing a Capacity Development Program ………………………………………. 158
Chapter 3 – Preparing a Legislative Agenda ……………………………………………………… 163
PART IV – PLAN MONITORING AND EVALUATION ………………………………………….. 166

PRELIMINARY PAGES
viii
LIST OF FIGURES
Figure No.
1 Local Planning and Development Model2 Simplified Planning Process3 CLUP – CDP Process Flow4 Inter-sectoral Consultations5 Organization of a Planning Team6 Status of Existing CLUP and ZO7 Status of Existing CDP (1)8 Status of Existing CDP (2)9 Structure of the Local Economy
10 Problem – Finding and Solution – Finding Analyses11 Time Relationship between a Birth and Future Service Requirements12 Myrdal’s Concept of Cumulative Causation: An Example of Industrial Expansion in the Area13 Fishbone Analysis14 Sample Problem Tree Transformed into a Policy Tree15 Gaps to Goals: A Logical Framework16 Issue – Driven Sectoral Planning Process17 Sample Objective Tree of a Deteriorating Forest Condition18 Hierarchy of Actions19 Upgrading a “Non-Project” into a Project20 Sample Objective Tree21 Local Funds for Development Investment22 LDIP Process as a Link between Development Planning and Budgeting23 Financial Growth Scenarios24 1st Round Matching of Funding Requirements and Funds Available 25 Financing approaches26 Options under the Conservative and Development approach27 LGU Financing Options28 Link between CDP Legislative Requirements and the 3 – Year Legislative Agenda29 Identifying Legislations
LIST OF TABLES
Table No.
1 Sample Issues Common to Sectoral Plans2 Sphere of Influence and Potential Contributions3 Synchronized Local Planning and Budgeting Calendar4 Indicative Schedule of Activities5 Sample Vision Elements and Descriptors6 Examples of Descriptors for the General Welfare Goals7 Selected Maps Held by Agencies8 Suggested Sources of Data9 Data / Information Requirements by Sector / Sub-sector
10 Data Requirements for Cross-Sectoral and Special Concerns11 Local Development Indicators, by Type, Sector, Sub-sector and Core Concerns12 Sample Output of Problem – Solution finding Analysis13 Annual Food Requirements per Capita14 Illustrative Example of Structural Shift in the Local Economy15 Illustration of Area Income Growth16 Ecosystems and Sub-systems17 Sample of Finding the Development Sector for Success Indicators18 Current Reality Rating Scale19 Sample Matrix: Vision – Reality Gap Analysis20 Advantages and Disadvantages of Methodologies for Participatory Goal Formulation Process21 Programs / Projects versus “Non-Projects” / Services22 Sample Strategy, Programs, Projects / Services and Legislations

PRELIMINARY PAGES
ix
Table No.
LIST OF TABLES
23 Distinguishing Projects from “Non-Projects” and Legislations: An Example24 National Government Functions Devolved to Local Government Units (Section 17, LGC)25 Criteria for Determining Level of Urgency26 Sample Goal Achievement Matrix with Inputs from One societal Sector27 Example of Summary of Societal Sectors Ratings (Dagupan City CDP)28 Example of Ranked List of Projects with Cost Estimates29 AIP Summary Form30 Sample Format of a Capacity Development Plan31 Sample Table of Legislative Requirements32 Monitoring versus Evaluation33 Monitoring and Evaluation Points in a 3-Year Term of Office34 Sample Annual / End-of-Term Accomplishment Report35 Sample Monitoring and Evaluation Strategy
LIST OF BOXES
Box No.
1 Suggested Composition of Sectoral Committees2 Suggested Training Session Flow3 Example of a Vision Statement Crafted Based on the Vision Elements and Descriptors4 How to Undertake Problem Analysis5 Examples of Goods and Services by Age Group6 Money Flows in the Local Economy7 Criteria for Assessing Infrastructures8 General Welfare Goals9 Contents of a Project Brief
10 Sample Project Brief11 Computing Investment Financial Capacity of an LGU12 Some Tips in Capacity Development Planning13 Project Monitoring and Evaluation

PART I – GETTING STARTEDChapter 1 – Organizing and Mobilizing the Planning Team
17
PART I – GETTING STARTED
Chapter 1- Organizing and Mobilizing the Planning Structure
The Local Development Council (LDC) is the body mandated by the Local Government Code of 1991 (LGC) to prepare the multi – sectoral development plan of a local government unit (LGU). It is therefore critical to ensure that the LDC as well as its functional and sectoral committees, as providers of technical support and assistance are constituted and activated.
Sectoral committee members are drawn from various sectors of the community – the academe, religious, business, government, non-government organizations, people’s organizations and other civil society organizations. The suggested composition of the Sectoral Committees is shown in Box 1.
Functional committees should likewise be multi-sectoral. However, the life of functional committees depends on the need for its continued existence.
In preparing the Comprehensive Development Plan (CDP), a planning team may be drawnfrom the sectoral committees and organized as a functional committee for the duration of the CDP formulation. Said functional committee should be de-mobilized or de-commissioned once the CDP has been completed, endorsed by the LDC and approved by the Sanggunian Bayan or Sangguniang Panlungsod (SB/P). It may, however, be re – activated as a support machinery of the LDC for plan monitoring and evaluation every year or after a 3 – year period.
1.1 What is the minimum composition of the planning team?
The Local Chief Executive (LCE)as Chiar of the LDC is in the best position to determine the size and composition of the planning team. The minimum composition of the core technical working group is suggested below:
a. Local Chief Executive or Mayor as the Chairperson and the Vice – Mayor as Co -Chairperson
b. Local Planning Development Coordinator (LPDC) or representative from the Local Planning Development Office (LPDO)
c. Department Heads and Sanggunian Committee Chairpersons of major sectors d. Representatives of the majority and minority blocs of the SB/Pe. Representatives of the private sector and civil society organizations (CSOs)
1.2 What are the factors for consideration in selecting planning team members?
The following criteria should be considered in the selection of the planning team members:
a. Membership in formal and legally recognized LGU structures for planning such as the:
i. LDC, which is the main body responsible for local development planning, including its functional committees;
The LDC is considered the “mother of all planning bodies.”

PART I – GETTING STARTEDChapter 1 – Organizing and Mobilizing the Planning Team
18ii. SB/P, which has the mandate to approve local development plans and budgets,
including its sectoral committees;
iii. Key departments/ units within the LGU involved in program/project implementation;
Box 1. SUGGESTED SECTORAL COMMITTEE COMPOSITION
Sectoral CommitteeCore Technical Working Group
(“Must be There”)
Expanded Technical Working Group
(“Nice to Have Around”)
Full-Blown Sectoral Committee
(“The More the Merrier”)
1. SOCIAL DEVELOPMENT
MPDO/CPDO Staff SWDO MHO POSO LDC Representative (Brgy.) LDC Representatice (CSO) District Supervisor PTA Federation Sanggunian Representative
Police Chief Fire Marshall Local Civil Registrar Population Officer PCUP or its local counterpart Nutrition Officer Housing Board Rep NSO Manager GSIS/SSS
Sports Organizations Religious Leaders Labor Groups Senior Citizens Media Representatives YMCA/YWCA Inner Wheel Club School Principals Charitable Organizations
2. ECONOMIC DEVELOPMENT
PESO Agriculturist Tourism Officer Coop Devt Officer MPDO Staff LDC Representative (Brgy.) LDC Representative (CSO) Sanggunian Representative
DTI Representative Chambers of Commerce &
Industry Trade Unions Bank Managers Market Vendors Sidewalk Vendors Cooperatives Transport Organizations
Lions Club Jaycees Rotary Club Academe Other interested groups and
individuals
3. PHYSICAL / LAND USE DEVELOPMENT
Municipal Engineer Zoning Officer MPDO Staff LDC Representative (Brgy.) LDC Representative (CSO) Sanggunian Representative Municipal Architect
Electric Coop Representative Water District Representative Real Estate Developers Professional organizations Telecommunications
companies Academe
Other interested groups and individuals
4. ENVIRONMENTAL MANAGEMENT
MPDO Staff LDC Representative (Brgy.) LDC Representative (CSO) General Services Head LG-ENRO Sanggunian Representative
Sanitary Inspector CENRO PENRO FARMC Representatives BFAR Representative Heads of private hospitals Academe
Environmental Advocates Other interested groups and
individuals
5. INSTITUTIONAL DEVELOPMENT
MPDO Staff LDC Representative (Brgy.) LDC Representative (CSO) LGOO Local Administrator Sanggunian Representative
HRDO Treasurer Budget Officer Assessor Academe
Religious groups Good Governance advocates Other interested groups and
individuals
CORE TECHNICAL WORKING GROUP – composed of Local Government officials and functionaries whose tasks and responsibilities address the concerns of the particular sector directly or indirectly.
EXPANDED TECHNICAL WORKING GROUP (“NICE TO HAVE AROUND” – other LGU officials, national government agencies operating in the locality, and important non-government organizations with functions and advocacies touching on the concerns of the particular sector. When added to the core TWG the resulting body becomes the Expanded TWG.
FULL-BLOWN SECTORAL COMMITTEE (“THE MORE THE MERRIER”) – other groups and individuals, mainly from non-government sectors, who have a stake in local development in whatever capacity, enrich and enliven the full-blown committee’s deliberations with their varied views, agendas, and advocacies.

PART I – GETTING STARTEDChapter 1 – Organizing and Mobilizing the Planning Team
19
iv. Local Government Operations Officer (LGOO) for technical assistance; and
v. LPDO for secretariat support and overall coordination of all related planning efforts of the LGU.
b. Equitable representation from various stakeholder groups external to the LGU, and other civil society organizations.
c. Gender sensitivity – This will not only promote and ensure the understanding of issues affecting women, men and other subgroups in the locality but also manifest the LGU’s adherence to and support for Gender and Development (GAD) mainstreaming efforts in the bureaucracy.
d. Commitment and sustainability of participation – Plan preparation can be tedious and pressure laden. Consideration for the existing assignments of the prospective member should be made to avoid conflict in workload and schedules particularly in the light of the ELA timeframe.
This set of criteria can be looked upon as basic considerations for planning team selection. LGUs can, of course, add or substitute other criteria as they deem fit given their respective situations and priorities.
An additional tool for the selection of planning team members is a Sphere of Influence and Potential Contribution Analysis (see Table 2 below). Putting scores and weights for eventual ranking will certainly help but is not necessary. What is essential is that the results can be inputted to checking the preparedness of the LGU to undertake the plan formulation activity.
1.3 What are the suggested qualities and qualifications of the planning team members?
To be able to effectively respond to the challenges and demands of the CDP formulation process, the members of the team should possess:
Table 1- SPHERE OF INFLUENCE AND POTENTIAL CONTRIBUTION
Prospective Planning Team Members
Sphere of Influence Potential Contributions
Sphere of Influence - indicates the individuals, groups or sectors which a prospective planning team member can influence or catalyze towards a productive or, even, an affirmative response to an issue or an undertaking.
Potential Contributions – the expertise or resources which prospective members can share towards the completion, approval and adoption of the Plan.

PART I – GETTING STARTEDChapter 1 – Organizing and Mobilizing the Planning Team
20
a. knowledge of the following:
i. planning process; andii. development and governance concepts and principles.
b. skills in:
i. planning, ii. problem analysis, iii. technical writing, andiv. communications, and networking
c. knowledge, understanding of and sensitivity to critical development themes which LGUs are mandated to incorporate in their local plans such as:
i. poverty, ii. environment, iii. gender, andiv. peace
d. talent and proficiency in consultation processes; and
e. willingness to work with others
1.4 How will the planning team be organized?
The planning team may be organized according to the structure as shown in Figure 5 below:
Figure 5ORGANIZATION OF THE PLANNING TEAM
LOCAL SANGGUNIAN
LOCAL CHIEF EXECUTIVE
LOCAL DEVELOPMENT COUNCIL
OTHER LGU DEPARTMENTS
LOCAL PLANNING AND DEVELOPMENT OFFICE
SOCIAL DEVELOPMENT
COMMITTE
ECONOMIC DEVELOPMENT
COMMITTEE
ENVIRONMENTAL MANAGEMENT
COMMITTEE
PHYSICAL & INFRASTRUCTURE
DEVELOPMENT COMMITTE
INSTITUTIONAL DEVELOPMENT
COMMITTEE
SECTORAL COMMITTEES
LEGEND: DIRECT CONTROL & SUPERVISION ADVISORY & CONSULTATIVE

PART I – GETTING STARTEDChapter 1 – Organizing and Mobilizing the Planning Team
21
1.5 Who will set directions for the planning team?
The LDC shall set the course for the planning team. The LCE as chair of the LDC necessarily takes the lead and guide the plan formulation effort. He/she may however, designate a focal person, like the LPDC, to act like an operations or executive officer who can take charge of the team’s day-to-day operations until the plan is completed and approved by the SB/P. The SB/P, for its part may also designate a counterpart from among its own members or from its sectoral committees.
1.6 What is the role and function of the Chair/ Co-Chair?
a. Set and clarify directions for planning, setting development thrusts, strategy formulation, and programs and projects prioritization;
b. Approve the Work Plan and Budget;
c. Designate the members of the planning team and define their functions and assignments/tasks;
d. Monitor and oversee the conduct of team activities;
e. Resolve issues elevated by team;
f. Present the Draft CDP to the SB/P and to other stakeholders;
g. Ensure adherence to the work plan; and
h. Motivate the team.
1.7 What are the role and functions of the Secretariat?
a. Prepare the materials in connection with the presentation of the Work Plan and Budget to the LCE and the SB/P;
b. Monitor the implementation of the approved work plan and budget;
c. Provide the LCE/LDC Chairperson and Co-Chairperson recommendations necessary for the effective management of the Planning Team and its activities;
d. Elevate to the Chair/Vice Chair the unresolved problems and issues encountered by the Planning Team; and
e. Ensure the proper documentation and management of the Planning Team’s activities, working papers and outputs.
1.8 What are the roles and functions of the other planning team members?
a. Prepare the Work Plan and Budget of their respective sectoral committees;
b. Gather and review available plans and other secondary data sources required in the development of the CDP;

PART I – GETTING STARTEDChapter 1 – Organizing and Mobilizing the Planning Team
22c. Plan, coordinate and facilitate the conduct of various multi-stakeholder
consultation/validation workshops;
d. Assist the LCE in public hearings and other consultation sessions with the various LGU stakeholders and affected sectors like the LGU offices, LDC, Sanggunian and other sectoral organizations;
e. Assist the LCE and the LDC in drafting and finalizing the CDP to include the 3-Year LDIP, the current year AIP and the ELA;
f. Draft, package and finalize the CDP;
g. Prepare presentation materials for various audiences of the CDP;
h. Assist the LCE in his presentation of the Plan to various stakeholders;
i. Assist in organizing other planning sub-committees that may be required to carry out other planning activities such as communicating/popularizing the Plan, mobilizing resources, monitoring and evaluation; and
j. Perform such other functions as may be required by the LCE towards the completion, adoption, popularizing, implementing and monitoring the CDP.
1.9 What is the Role of the SB/P in the plan formulation process?
The CDP embodies the policies of the LGU. As the highest policy - making body in the LGU, the Sanggunian needs to be involved more substantially in the planning process. The SB/Pis also expected to:
a. Issue a Sanggunian resolution supporting the planning process;
b. Review and approve the CDP;
c. Identify and enact legislative measures to support and facilitate the implementation of the plan.
d. Review, prioritize and approve budget allocation for plan-based PPAs.
Their involvement in the CDP will also result in the following benefits:
a. Firmer grasp of local development thrusts and priorities;
b. Better understanding of their role in steering the LGU into realizing its vision through appropriate legislative actions;
b. Harmonization of executive and legislative actions towards a unified set of goals and objectives for the LGU; and
c. Attainment of a shared responsibility and accountability for the CDP.

PART I – GETTING STARTEDChapter 1 – Organizing and Mobilizing the Planning Team
23
1.10 What is the role of civil society organizations (CSOs)?
CSOs have very strong potentials for supplementing or augmenting LGU efforts in plan preparation process. They can:
a. bridge information gaps during plan preparation;
b. serve as monitors for CDP implementation and provide LGU decision – makers unfiltered information;
c. assist the LGU efforts in communicating and disseminating information on the CDP;
d. rally support for CDP implementation especially on programs which are heavily dependent on citizen participation and cooperation;
e. augment the various resources and expertise required in CDP preparation/ revision and implementation; and
f. link the CDP implementation with various resource organizations.
1.11 What is the role of the LGOO?
The Local Government Operations Officer (LGOO) of the Department of Interior and Local Government (DILG) plays a critical role. He shall:
a. Initiate the reconstitution of the LDC after every election.
b. Conduct a seminar on the functions of the LDC, particularly the political component of the local planning structure. This means that the newly elected members of the Sanggunian should be invited to this seminar. This is when Sanggunian members choose the sectoral committees they wish to join.
c. Coordinate with other relevant national agencies in conducting a joint seminar -workshop for the technical component of the local planning structure on the functions and responsibilities of the sectoral committees.
d. Ensure that the sectoral committees and other bodies created by virtue of existing national laws and administrative issuances shall be made standing committees of the LDC.
e. Make certain that functional committees and other ad hoc bodies which may be formed from time to time shall, to the extent possible, be drawn from the membership of the sectoral committees.
d. Emphasize the important role of the executive departments in planning by requiring each department head or any key officer thereof to join at least one sectoral or functional committee.
e. Lead or organize a core team of workshop facilitators from the staff of the Human Resource Development Office (HRDO), LPDO or from selected key departments of the LGU to be trained on techniques and approaches to participatory planning facilitation. This team shall take charge of conducting all future planning workshops.

PART I – GETTING STARTEDChapter 1 – Organizing and Mobilizing the Planning Team
24f. Facilitate, when necessary, the formulation of the new Executive and Legislative Agenda
(ELA) in order to provide a venue for imbibing the concept of joint responsibility for planning.
1.12 What is the role of national government agencies?
a. Relevant national government agencies shall teach their counterpart sectoral committees on the sectoral planning process, including but not limited to:
i. general and analysis of sectoral data sets,
ii. sectoral plans required by law through the mediation of the NGA concerned,
iii. formulation of sectoral goals, objectives and targets,
iv. identification of appropriate sectoral strategies, programs and projects, and
v. monitoring and evaluation of plan, program and project implementation.
This hands–on capability building exercise should lead to the preparation of sectoral/ sub-sectoral/ thematic/ systems plans which will eventually be integrated into the CDP and the LDIP.
Planning Scenarios
When the LDC and its sectoral and functional committees shall have been mobilized for the purpose of preparing or revising the LGU’s medium– or short–term Comprehensive Development Plan (CDP), the next step is to determine the status of current plan documents. Two sets of scenarios, one on the Comprehensive Land Use Plan (CLUP) preparation and another on the Comprehensive Development Plan (CDP) formulation, indicate the current state of planning in individual LGUs and suggest the range of possible interventions needed to improve the situation.
If the plan exists, however, the intervention could be determined by whether the existing plan is compliant in form and content. The appropriate interventions are indicated in Figures 6 to 8.
1.13 When is a CLUP and zoning ordinance deemed compliant?
A CLUP and ZO are deemed compliant when it covers the entire territorial jurisdiction of the LGU, (emphasis supplied) including its waters. The Local Government Code of 1991 (RA 7160) explicitly states that, “the local government units shall, in conformity with existing laws, continue to prepare their respective land use plans enacted through zoning ordinances(underscoring supplied) which shall be the primary and dominant bases for the future use of land resources…” (Sec. 20 (c), RA 7160). The zoning ordinance, therefore, shall cover not only the urban or urbanizable area of an LGU but the CLUP in its entirety, shall likewise comprise a part and parcel of the said zoning ordinance.
Where no CLUP exists in the LGU concerned and for that matter the CDP also, the proper action is to prepare these plans in their entirety.

PART I – GETTING STARTEDChapter 1 – Organizing and Mobilizing the Planning Team
25
Figure 6 - Status of Existing CLUP and Zoning Ordinance
Figure 7 - Status of Existing CDP (1)
Figure 8 - Status of Existing CDP (2)
CLUP
EXISTENT?
YES NO
COMPLIANT?
PREPARE CLUP & ZO
NOREVISE
W ITH ZO?
YES
NOPREPARE ZO
YESZO COMPLIANT?
NOREVISE
MONITOR &EVALUATE
YES
STATUS INTERVENTION
WITH CDP
WITHOUTELA
WITH ELA WITH AIPWITH LDIP/
AIPWITH NGA-
MANDATED PLANS
PREPARE ELAW/IN CDP/LDIP
PROCESS
M & EITERATE INTO
CDP / LDIP
M & EMAKE LDIP
ITERATE INTO LDIP
M & EITERATE INTO CDP PROCESS
STATUS INTERVENTION
W IT H O U T C D P
W IT H A IP O N L Y W IT H E A / E L AW IT H O U T
E L A
P R E P A R E C D P & L D IP
M & EP R E P A R E C D P & L D IP
IT E R A T E A IP
M & EIT E R A T E IN T O C D P /
L D IP
P R E P A R E E L A W IT H INC D P / L D IPP R O C E S S
S T A T U S IN T E R V E N T IO N

PART I – GETTING STARTEDChapter 1 – Organizing and Mobilizing the Planning Team
26
1.14 When is a CDP deemed compliant?
A CDP is deemed compliant if it includes all the development sectors – social, economic, environment, physical and land use, and institutional; and when it also embraces other cross – sectoral concerns like gender and development, disaster risk management, poverty reduction, etc.
1.15 What is the role of the LGOO under any of the planning scenarios?
As a facilitator of comprehensive planning, the LGOO in collaboration with the LPDC shall assess the level of readiness of the planning structure and quality of existing plans in the LGU.
In the assessment of the CLUP, the LGOO may coordinate with the Housing and land Use Regulatory Board (HLURB) in the case of highly urbanized cities and LGUs within metro Manila; and with the provincial land use committee (PLUC) in the case of component cities and municipalities.
In the assessment of the CDP and LDIP, the assistance of the League of Local Planning and Development Coordinators and its regional and provincial chapters will be indispensable.
Orienting the Local Chief Executive and the Sanggunian
Developing the CDP is a challenging task and this cannot be done without the support of elective officials. The following steps are necessary to help ensure a more collaborative effort between the executive and legislative departments in the LGU as well as provide impetus for the active participation of different stakeholders in the LGU.
1.16 Who will conduct the Orientation?
The orientation activity may be conducted jointly by the Local Government Operations Officer (LGOO) and the Local Planning and Development Coordinator (LPDC).
1.17 What will the Orientation cover?
The orientation will cover the following:
a. Overview of the Rationalized Local Planning System, focusing on the Local Planning Structure, the Local Planning Process, and the types of plans that LGUs are mandated to prepare; and the Joint Memorandum Circular No. 001 series 2007 (Synchronization of Planning, Investment Programming, Revenue Administration, Budgeting and Expenditure Management at the Local Level)
b. Preparedness Check to assist the LCE and the SB/P assess the LGU’s capacity and capability in preparing the CDP in terms of the availability of the following:
i. manpower with appropriate skills;
ii. financial resources;

PART I – GETTING STARTEDChapter 1 – Organizing and Mobilizing the Planning Team
27iii. time to be devoted to the exercise; and
iv. data and other reference documents.
1.18 How long will the Orientation take?
A maximum of four (4) hours should be enough to cover the salient points that the LCE and the SB/P should know about the CDP formulation process.
1.19 When should the Orientation take place?
The CDP preparation or revision should be anchored on the local budget cycle so that the programs, projects and activities (PPAs) that are listed in the plan can be included in the Local Development Investment Plan (LDIP), the Annual Investment Program (AIP), the Local Expenditure Program (LEP) and the Budget of Expenditures and Sources of Financing (BESF) and eventually, into the Local Budget or Appropriations Ordinance (AO). This is also consistent with the updated Local Budget Operations Manual recently issued by the DBM that emphasizes the link between the plan and the budget. (See Table 3 - Synchronized Local Planning and Budgeting Calendar)
The short – term or 3 – year CDP or ELA rides on the term of the LCE and other elective local government officials. Therefore, the orientation on the preparation or revision of the 3-Year CDP or ELA should take place immediately after the
LCE is sworn into office, preferably not later than the third quarter of the year of his/her election. This is because planning should be harmonized with the Local Budget Cycle, so that the budgetary requirements for the implementation of the plan can be incorporated into the AIP and the Appropriations Ordinance (AO).
Training the Planning Team
Whether the planning team members have had previous experience or not, training should be undertaken prior to the start of plan preparation.
1.17 Why is there a need for training?
For an LGU which will be doing a CDP for the first time, the training will enable the members to:
a. have an appreciation and clearer understanding of the simplified sectoral planning process, as well as the requirements for and implications of the plan preparation exercise; and
b. learn from some of the experiences in the past plan formulation exercises, so that they can adopt the good practices and avoid the pitfalls that others experienced.
For an LGU which had previously undertaken the CDP, the training is an opportunity for both old and new members to be introduced to the simplified sectoral planning process.
The Synchronized Local Planning and Budgeting Calendar (SLPBC), which
is a significant feature of the JMC No. 001, suggests planning activities to
be undertaken within the first semester of an election year.

PART I – GETTING STARTEDChapter 1 – Organizing and Mobilizing the Planning Team
28There are two possible approaches in training the Planning Team, the choice of which will depend on whether the team has undergone a previous CDP formulation exercise or not. The session flow for the training incorporating said approaches are contained in Figure 1.2.
Table 3 - SYNCHRONIZED LOCAL PLANNING AND BUDGETING CALENDAR
PERIOD COVERED ACTIVITY OUTPUT/S ACTOR/S
1ST Week of January PPDC sets guidelines for data gathering
Guidelines for Data Gathering Provincial Planning and Development Coordinators (PPDCs)
January to March Updating of planning and budgeting database (socioeconomic, physical resources, time series revenue and expenditure data, project profiles/status, among others)
Updated Planning, Budgeting and Financial Database
Local Planning and Development Coordinators (LPDCs), Budget Officers, Treasurers, Department Heads, National Government Agencies (NGAs), Regional Line Agencies (RLAs)
April to May
Analysis of the planning environment for plan preparation/ review/ updating
Draft situational analysis and assessment of plan implementation
LPDCs, NGAs, RLAs
Updating of appropriate Annual Investment Plan (AIP) in the Local Development Investment Program (LDIP) as input to budgeting
Indicative AIP (the 1st year of the LDIP in the case of election year)
Local Development Councils (LDCs), LPDCs
June 1 - 15 Preparation of the AIP using the AIP Summary Form (Annex A) for the Budget year
AIP Summary Form LPDCs, Local Budget Officers
Not later than the 1st
Week of AugustApproval of the AIP AIP for the Budget Year Local Sanggunians
1st Week of July during Election Year
PDPFP / CDP PREPARATION
Reconstitution of the LDCs Timetable and tasking for plan preparation / updating
Local Chief Executives (LCEs)
Whole month of July Formulation of development
vision, goals, strategies, objectives/targets and identification of Programs, Projects and Activities (PPAs)
Vision, Goals, Strategies, Objectives/Targets and PPAs
LDCs, LPDCs, Department heads, NGAs, RLAs
Whole month of July Harmonization and complementation of development vision, goals and strategic direction between and among province and component cities/ municipalities
Harmonized vision, goals and strategic direction
Jointly by the Province and its component local government units (LGUs)

PART I – GETTING STARTEDChapter 1 – Organizing and Mobilizing the Planning Team
29Table 3 - SYNCHRONIZED LOCAL PLANNING AND BUDGETING CALENDAR
(Cont’d.)
Approval of the Provincial Development and Physical Framework Plan (PDPFP) / Comprehensive Development Plan (CDP)
PDPFP / CDP Sanggunians
June 1 – July 31 during Election Year
LDIP PREPARATION
Identification of areas for complementation of PPAs between and among provinces and their component cities/ municipalities
Joint programs / projects Provinces and their component cities and municipalities
June 1 – July 31 during Election Year
Prioritization of PPAs Prioritized PPAs LDCs, Local Finance Committees (LFCs), NGAs/ RLAs
Matching of PPAs with available financing resources and determination of additional revenue sources to finance the PPAs
LDIP, revenue generation measures
LDCs, LFCs, NGAs/ RLAs
Approval of the LDIP Approved LDIP Sanggunian
June 16 – 30 or 1st
Week of July during election year
BUDGET PREPARATION
Issuance of Budget Call Budget Call LCEs of Provinces, Cities and Municipalities
July 1 - 15 Submission to LCE of detailed 3 –year Statement of Income and Expenditures
Certified Statement of Income and Expenditures
Local Treasurers (Provinces, Cities and Municipalities)
July 16 – August 31 Conduct of budget technical budget hearings on budget proposals submitted by Department Heads
Reviewed Budget Proposals Local Department Heads
On or before September 15
Submission to the Punong Barangay of the Estimated Income and Expenditure for the ensuing fiscal year
Certified Statement of Income and Expenditure
Barangay Treasurer
On or before September 15
Preparation and submission of budget proposals
Budget proposals Local Department heads
September 16 - 30 Consolidation of Budget proposal into the Local Expenditure Program (LEP) and Preparation of the Budget of Expenditures and Sources of Financing (BESF)
LEP and BESF LFCs

PART I – GETTING STARTEDChapter 1 – Organizing and Mobilizing the Planning Team
30Table 3 - SYNCHRONIZED LOCAL PLANNING AND BUDGETING CALENDAR
(Cont’d.)
Not later than October 16
Preparation of the Budget Message and submission of Executive Budget to the Sanggunian
Budget Message and Executive Budget
LCEs (Provinces, Cities and Municipalities)
October 17 - Onwards Enactment of the Annual Budget of the ensuing fiscal year by the Sanggunian concerned
Enacted Annual Budget Sanggunian (Provinces, Cities, Municipalities and Barangays)
Within three (3) days from the approval of the LCE of the Annual
or Supplemental budget
Submission of the Annual or Supplemental Budgets of provinces, Cities and Municipalities to appropriate reviewing authority
Annual or Supplemental Budget submitted for Review
Secretary to the Sanggunian
Within ten (10) days from the approval by
the Punng barangay of the Annual or
Supplemental Budgets of Barangays
Submission of the Annual or Supplemental Budgets submitted for review
Annual or Supplemental Budget submitted for Review
Sanngunian
Within sixty (60) days from the receipt of the
submitted Annual or Supplemental Budgets
of barangays for review
Review of the Annual or Supplemental Budgets of Barangays
Reviewed Annual or Supplemental Budgets of Barangays
Sangguniang Panglungsod, Sangguniang Bayan, City or Municipal budget Officers
Within ninety (90) days from the receipt of submitted Annual or Supplemental Budgets for review of provinces, cities and municipalities
Review of the Annual or Supplemental Budgets of provinces, Cities and Municipalities
Reviewed Annual or Supplemental Budgets of provinces, Cities and Municipalities
Department of Budget and Management Regional Offices, Sangguniang Panlalawigan
January 1 to December 31
Implementation / Execution of the Annual or Supplemental Budgets
Supplemental Budgets LCEs of Provinces, Cities, Municipalities and Barangays
NOTE: Detailed activities will be provided through subsequent guidelines, including cross-referencing to the technical guides/ manuals such as the Rationalized Planning System (RPS) – Comprehensive Development Plan (CDP) / Executive and Legislative Agenda (ELA), Provincial/Local Planning and Expenditure Management (PLPEM), Updated Budget Operations Manual (UBOM) and Revenue Administration.
The indicative content of the Orientation Training Workshop (OTW) for the Planning Team is shown in Box 1.2.
This is for first-time users. For subsequent exercises, the contents of the modules will vary slightly, especially in the conduct of visioning and the determination of current reality. This will be discussed in subsequent chapters.

PART I – GETTING STARTEDChapter 1 – Organizing and Mobilizing the Planning Team
31
Figure ___ - Suggested Training Session Flow
Sample Work Plan
The entire CDP preparation is estimated to take at least four (4) months, assuming that the planning process is targeted to also yield a CLUP. The timing of each task is shown in Table 4 – Indicative Schedule of Activities. Should the LGU decide to focus on the CDP formulation alone, this may be adjusted according to the pace of work of the planning team and the sectoral committees.
LEVELING OF EXPECTATIONS
TEA M WITH PREV IOUS
C DP EXPER IENC E?
REVIEW OF PAST PLAN FORMULATION
EXPERIENCE
UNDERSTAND THE SIMPLIFIED CDP
PROCESS
PREPARE WORK PLAN
LCE / SANGGUNIAN HOUR
CLOSING PROGRAM
Box ___ INDICATIVE CONTENT OF THE ORIENTATION-TRAINING- WORKSHOP
The participants will be oriented on the CDP and the ELA formulation process and trained on how to use various tools and instruments, as well as the methodology for each step of the process. The training program will contain five modules, listed as follows:
Module 1: Introduction
Session 1: Surfacing and Leveling of ExpectationsSession 2: The Rationalized Local Planning System Session 3: Understanding the Planning Team’s Structure and
Functions Session 4: Revisiting Past Planning Experiences
Module 2: The Comprehensive Development Plan
Session 5: Overview of the CDP ProcessSession 6: Visioning Process, Session 7: Situational Analysis and Determination of Vision – Current
Reality Gap; Goal and Objective Formulation and Target Setting
Session 6: Identifying Solutions: Developing Strategies, Programs, Projects and Activities
Session 7: Sifting of Projects (Projects versus “Non – Projects”; By Ownership)
Module 3: Tools for Implementing the Plan
Session 8: The Local Development Investment Programming (LDIP) Process
Session 9: The Capacity Development ProgramSession 10: The Legislative Agenda
Module 4: Plan Monitoring and Evaluation
The culminating activity of the training program is the conduct of an LCE – Sanggunian Hour where major potential problems that may be encountered during the planning exercise not identified earlier can be discussed and addressed.

PART I – GETTING STARTEDChapter 1 – Organizing and Mobilizing the Planning Team
32
A. Pre – Plan Formulation Phase
1. Mobilization
The Planning Team will start mobilizing the members and prepare them to begin work within two weeks upon approval of the LCE to proceed with the plan formulation process. During this period, the Consultant will start with kick-off meetings with the various sectoral committees.
During the kick-off meetings, the Planning Team Leader will review the work plan, address other issues that might surface at this stage, and introduce changes if necessary. The composition of the Sectoral Committees will be firmed up and the necessary office orders issued by the LCE.
The mobilization period will likewise be devoted to the setting up of the various project support and coordinating systems, like venue for workshops and public consultations, project finance accounting and procedures, counterpart financing from the various departments, if available or previously agreed upon, additional staff support, etc.
2. Preliminary Assessments
During this period, the Planning Team shall conduct a preliminary assessment of the current database of the LGU. Data available in the LGU that are kept in national, regional, and provincial level agencies including additional thematic maps will also be collected.
B. Plan Formulation Proper (Assumes that this involves the preparation of both the CLUP and the CDP)
1. Orientation, Organization, and Tasking
This will be a one day affair. This activity shall be held to give the participants an orientation on the planning process, concepts, and approaches, and the LGU’s planning responsibilities as mandated by the LGC of 1991. This activity shall be a venue in which the participants can seek clarifications on basic issues affecting their LGU. This activity shall also orient the participants on updating their respective databases. Assignment of tasks for project participants will be made in this orientation.
2. Preparation of Statistical Compendium and Thematic Maps
The database available in the municipality will be reviewed and updated if necessary in order to come up with the Statistical Compendium or Local Development Indicators Matrix. Thematic maps available shall be also evaluated and additional maps shall be secured from relevant agencies as needed.
3. Module 1 – Seminar-Workshop
This 3-day activity involves the use of the Statistical Compendium or LDIs to make meaningful observations about the condition of the LGU. The participants will be introduced to the techniques of sectoral and inter- and intra-area analysis, and to work out the Problem-Policy Matrix. This will enable the participants to know their area more intensely and thoroughly.

PART I – GETTING STARTEDChapter 1 – Organizing and Mobilizing the Planning Team
334. Module 2 – Seminar-Workshop
This 3-day seminar workshop shall require the attendance of the widest range of representation among the stakeholders in the municipality. The most important output of this workshop will be a new or revised vision-statement of the municipality. Associated outputs will include the sectoral goals and objectives derived from the vision-reality gap analysis.
5. Module 3 – Seminar-Workshop (To be conducted if the plan formulation process includes the preparation of the CLUP)
This activity shall be conducted to select the preferred spatial strategy; to detail and refine the preferred spatial strategy; and to formulate policies and implementation tools including the draft zoning ordinance. This will be a 3-day intensive activity. Attendance of all members of the SB is a must.
6. Finalization of Draft CLUP and Draft Zoning Ordinance (To be conducted if the plan formulation process includes the preparation of the CLUP)
The Consultant shall take full responsibility for the finalization of these documents including writing, text editing, and organization and enrichment of the contents. The final outputs will be prepared in hard copy and digital format (CD).
7. Module 4 – Comprehensive Development Planning and Local Development Investment Programming
This module aims to enhance the capability of the Local Development Council to include the sectoral committee in preparing sectoral programs, projects, and activities that the LGU will implement during the 6 – or 3 – year scope of the CDP. The participants will be assisted to identify project ideas from the CLUP and from the CDP. The project ideas will be presented in a standard project brief format. The project briefs are collected, screened, prioritized, and cost and are used as inputs to the LDIP.
The members of the Local Finance Committee will also be required to conduct and demonstrate the analysis of time-series financial statements. This will be the basis for projecting funds available for development projects over the planned period.
A one-day workshop on prioritization of programs and projects and the matching of investment funds available with fund requirements shall be conducted among the full membership of the MDC and the LFC.
The LDIP will now be put in final form.

PART I – GETTING STARTEDChapter 1 – Organizing and Mobilizing the Planning Team
34
Table 4 – INDICATIVE SCHEDULE OF ACTIVITIES
ACTIVITIES / TASKSWEEKS
1 2 3 4 5 6 7 8 9 10 11 12 13 14 15 16 17 18A. MOBILIZATION
1. Orientation, organization and tasking2. Preliminary Assessments
B. CHARACTERIZATION AND ANALYSIS1. Module 1 Seminar workshop2. Data collection, review and validation3. Maps and graphics preparation4. Inter- and intra- area analysis
a. Population, Settlements and Social Servicesb. Area Economyc. Infrastructured. Land Use and Environmente. Institutional Capability
5. Module 2 Seminar - Workshop6. Cross-sectoral integration
a. Summary of LGU potentials and problems6. Public consultation No. 1
C. COMPREHENSIVE LAND USE PLANNING1. Vision Setting2. Goal Formulation3. Alternative Strategies Generation4. Evaluation of Alternative Spatial Strategies5. Public Consultation No. 2: Selection of Preferred Spatial Strategy6. Detailing the Preferred Spatial Strategy7. Preparation of the CLUP8. Drafting of the Zoning Ordinance9. Public Consultation No. 3: presentation of the CLUP and Zoning Ordinance
D. MEDIUM-TERM COMPREHENSIVE DEVELOPMENT PLANNING1. Social Development Plan2. Economic Development Plan3. Environmental Management Plan4. Infrastructure and Physical Development Plan5. Institutional Development Plan6. Local Development Investment Programming7. Public Consultation No. 4: Presentation of the CDP

PART I – GETTING STARTEDChapter 1 – Organizing and Mobilizing the Planning Team
35
SCHEDULE OF ACTIVITIES
ACTIVITIES / TASKSWEEKS
1 2 3 4 5 6 7 8 9 10 11 12 13 14 15 16 17 18E. FINALIZATION OF PLANS
1. Finalize CLUP2. Finalize Zoning Ordinance3. Finalize CDP4. Finalize LDIP
F. PLAN ADOPTION AND APPROVAL1. Submission to LDC for Endorsement to Local Sanggunian2. CDP and LDIP Approval by the Sanggunian3. Submission of the CLUP to the Provincial Land Use Committee for Review4. Approval of the CLUP by the PLUC

CHAPTER 1 – SETTING THE VISION
36
PART 2 – PREPARING THE COMPREHENSIVE DEVELOPMENT PLAN
Chapter 1 – Setting the Vision
1.1 What is a Vision?
A vision is a desired state or scenario of the LGU and its people. It is the stakeholders’ shared image of the LGU’s future. It describes what the LGU wants to become or where it wants to go; it serves as an inspiration and a guide to action; it keeps the LGU in its course despite changing demands of constituents and shifting political and economic forces. It answers the question: How do you see your LGU in the future?
1.2 Why is it important for an LGU to have a vision?
It is important for an LGU to set its vision because its serves as:
a. an end toward which all future actions specified in the plan are directed;
b. criteria for evaluating alternative strategies, approaches and policies; and
c. standard against which success of each action is measured.
1.3 What is a good vision for an LGU?
A good LGU vision should not deviate from, but rather, be a local variation of the very aspiration of the national government that LGUs, as political and territorial subdivisions, attain their fullest development as self-reliant communities and become effective partners in the attainment of national goals (Sec. 2, a. RA 7160)
A good LGU vision, therefore, must have two major components to reflect its dual function as a political subdivision of the national government and as a corporate entity:
a. Desired role of the LGU or the best contribution it can make to the development of the nation. This “outward-looking” component:
i. identifies the wider region to which the LGU relates or makes a unique or substantial contribution; and
ii. defines the LGU’s role in that region both at present and in the future.
b. Desired state of the LGU as an environment for its inhabitants to live and where they can make a living. This “inward-looking” component defines the condition of the following:
i. Local population (social sector)
ii. Local economy (economic sector)
iii. Natural environment (environment sector)
iv. Built form (infrastructure sector)
v. Local leadership/ governance (institutional sector)
A vision should be as vivid as possible, so that it can serve as
an inspiration as well as a challenge for all stakeholders.

CHAPTER 1 – SETTING THE VISION
37
A good vision statement should possess the following characteristics:
a. Achievable. Though a vision is ambitious, it certainly must be achievable or well grounded on reality.
b. Inspiring. It should encourage commitment and inspire enthusiasm. It should be powerful and compelling so that the people concerned can relate to it and work hard to achieve it. It should be a driving force even at trying times. It should capture the imagination, engage the spirit and inspire performance.
c. Easily understood. It should be well articulated using simple language.
d. Distinctive. It should build on the distinct character of the LGU, i.e., Marikina City as a river city should highlight in its vision its river resource.
e. Complementarity. Neighboring LGUs should have complementary not competing visions, i.e., municipalities along the same zone do not all have to serve as ports.
1.4 Who is responsible for setting the vision?
Everyone in the community has a stake in setting the vision. The visioning exercise should be a highly participatory process because it entails determining the desired state or condition of the place where the people live and make a living. The LDC and its sectoral and functional committees shall be at the forefront of the visioning exercise. The technical and administrative aspects of the activity, however, shall be the responsibility of the LPDO.
1.5 When is a vision developed?
A vision must cover a fairly long time horizon. Therefore, the proper occasion for drafting one is in connection with the preparation of the Comprehensive Land Use Plan (CLUP). The CDP and other short – term plans must NOT have another vision statement. They should simply adopt the vision in the CLUP and must contribute towards its eventual realization.
But if the vision is crafted during the CDP preparation process, the Synchronized Local Planning and Budgeting Calendar suggests that the LGU vision may be formulated or re-visited within the month of July during an election year.
1.6 How is a vision developed?
There is no hard and fast rule in determining the process for developing a vision statement. It may be done through one or a combination of the following: household surveys, barangay consultations, seminar – workshops, and interviews.
If the city or municipality is crafting its vision for the first time, a series of workshops or focus group discussions involving various stakeholders representing the different development sectors and sub-sectors (social, economic, infrastructure, environment and institutional), and as many societal sectors (women, indigenous peoples, youth, business, academe, civil society organizations, religious, farmers, etc. as possible, may be conducted following the process suggested below:

CHAPTER 1 – SETTING THE VISION
38
a. Begin by explaining the meaning, importance and the characteristics of a good LGU Vision.
b. Elicit from the participants ideas on what they would like their city or municipality to be say, 12 to 30 years from now by posing trigger questions, such as the following:
To capture the “outward – looking” component of the vision –
i. What role do you like your city/ municipality to perform in relation to the “outside world”, i.e., the province, the region and/or the country in general?
To capture the “inward – looking” component of the vision –
i. What do you want your people to be? What are your aspirations as a people?
ii. What do you desire to be the state of your local economy?
iii. What do you dream to be the condition of your city’s/ municipality’s natural and built environment?
iv. What do you desire from your local government?
c. Then, ask the participants to characterize the following “elements” of a vision by using “descriptors” or adjectives:
i. Qualities of the people as society;
ii. Nature of the local economy
iii. State of the natural environment
iv. Condition of the built environment
v. Capacity and qualities of the local leadership
d. Match the descriptors with the vision elements, as shown in the example below:
Table 5 – Sample Vision Elements and Descriptors
VISION ELEMENTS DESCRIPTORS
People as a Society and as Individuals o God – loving, well – informed, healthy, self-reliant, empowered, vigilant
Local Economy o Competitive, diversified, environment - friendly
State of the Natural Environment o Clean, safe, restored
Condition of the Built Environment o Balanced, planned, attractive
Capacity and Quality of the Local Leadership/ Governance
o Firm, decent, progressive
TIP: A technical working group may prepare the groundwork for consensus taking from culling out from existing higher – level plans, laws, administrative issuances and related documents what role or
function these “outsiders” have envisioned for the city / municipality to play in the wider region.
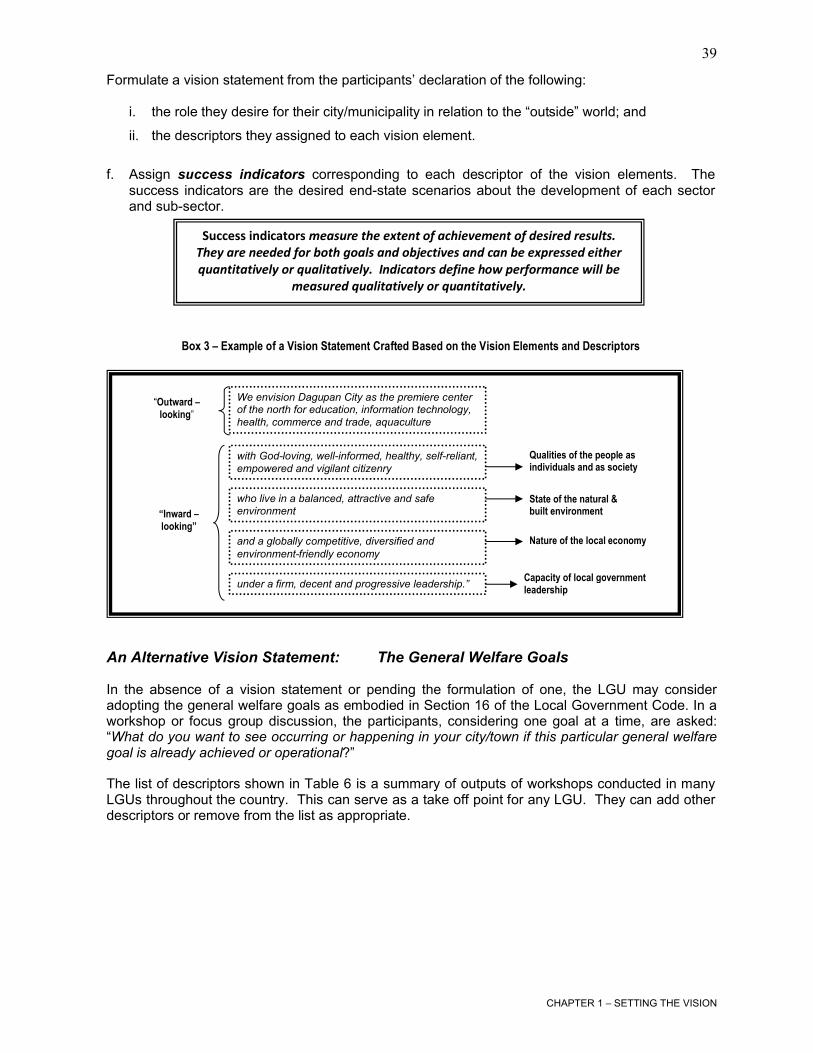
CHAPTER 1 – SETTING THE VISION
39
Formulate a vision statement from the participants’ declaration of the following:
i. the role they desire for their city/municipality in relation to the “outside” world; and
ii. the descriptors they assigned to each vision element.
f. Assign success indicators corresponding to each descriptor of the vision elements. The success indicators are the desired end-state scenarios about the development of each sector and sub-sector.
Box 3 – Example of a Vision Statement Crafted Based on the Vision Elements and Descriptors
An Alternative Vision Statement: The General Welfare Goals
In the absence of a vision statement or pending the formulation of one, the LGU may consider adopting the general welfare goals as embodied in Section 16 of the Local Government Code. In a workshop or focus group discussion, the participants, considering one goal at a time, are asked: “What do you want to see occurring or happening in your city/town if this particular general welfare goal is already achieved or operational?”
The list of descriptors shown in Table 6 is a summary of outputs of workshops conducted in many LGUs throughout the country. This can serve as a take off point for any LGU. They can add other descriptors or remove from the list as appropriate.
under a firm, decent and progressive leadership.”
We envision Dagupan City as the premiere center of the north for education, information technology, health, commerce and trade, aquaculture
“Outward –looking”
“Inward –looking”
with God-loving, well-informed, healthy, self-reliant, empowered and vigilant citizenry
Qualities of the people as individuals and as society
who live in a balanced, attractive and safe environment
State of the natural & built environment
and a globally competitive, diversified and environment-friendly economy
Nature of the local economy
Capacity of local government leadership
Success indicators measure the extent of achievement of desired results. They are needed for both goals and objectives and can be expressed either quantitatively or qualitatively. Indicators define how performance will be
measured qualitatively or quantitatively.

CHAPTER 1 – SETTING THE VISION
40
Table 6 – Examples of Descriptors for the General Welfare GoalsGENERAL WELFARE GOAL DESCRIPTORS
1. Preservation and enrichment of culture
1.1. Public library/museum and archives well maintained1.2. Historical/heritage sites preserved1.3. Adequate school facilities for pre-school, elementary and high school levels per municipality1.4. Public parks well patronized by the community1.5. Local language and literature promoted1.6. Local festivals observed1.7. Citizens literate in at least one language other than their native tongue1.8. Local and foreign tourism vigorously promoted
2. Promotion of health and safety
2.1. Health center in every barangay2.2. RHU/puericulture center/general hospital in every municipality2.3. Pedestrian sidewalks/crossings or traffic signals provided in busy streets2.4. Well-lighted streets2.5. Drugstores or pharmacies in every barangay2.6. Fire station and fire-fighting equipment in every municipality2.7. Flood control and drainage structures functional2.8. Widest possible coverage of level III water supply2.9. Facilities to rehabilitate the mentally ill and drug users available2.10. Health insurance coverage for all2.11. Institutional ability to respond to disasters2.12. No users/pushers of dangerous drugs2.13. Physical fitness exercises well attended2.14. Low incidence of mental illness
3. Enhancement of people’s right to a balanced ecology
3.1. Acceptable ratio of built form to open space3.2. Clean air monitoring and enforcement effective3.3. Plenty of greeneries in public and private places3.4. Acceptable waste management systems (liquid and solid) in place3.5. Wildlife preservation areas well protected3.6. Tree parks and green belts in abundance3.7. Built up surfaces not completely impervious
4. Encouragement and support for appropriate self-reliant technology
4.1. Technical/vocational schools established4.2. Complete coverage/adequate supply of electric power4.3. Technology research and dissemination program for the use of indigenous resources and the
reuse of recovered waste materials consistently pursued4.4. Research and development programs for new products and processes4.5. Indigenous property rights protected4.6. Native ingenuity recognized4.7. Regulated use of biotechnology4.8. Linkages between academe and industry established
5. Improvement of public morals
5.1. Churches and other religious organizations actively involved in community affairs5.2. Community reading centers well equipped and widely used5.3. Freedom parks established5.4. Bulletin/billboards in public places5.5. Properly located and regulated gaming and amusement activities5.6. Transparency in government transactions an established practice5.7. Venues for airing complaints and grievances available5.8. Public awareness of safe sex at a high level

CHAPTER 1 – SETTING THE VISION
41
GENERAL WELFARE GOAL DESCRIPTORS
6. Enhancement of economic prosperity and social justice
6.1. Adequate infrastructure support for production activities- Irrigation systems- Farm to market roads- Commercial/industrial zones- Agricultural supply stores
6.2. Adequate infrastructure support for distribution/consumption- Grain drying- Agricultural product processing plants- Public markets
6.3. Modern communication systems in place6.4. Banks and other financial institutions available6.5. Well distributed farm lands6.6. Cooperativism widely accepted6.7. Rural industries proliferate6.8. Reduced insurgency and labor militancy6.9. Increased number of small entrepreneurs6.10. Increased local government revenues and receipts6.11. Full participation of the poor, the underprivileged, homeless, and landless citizens in
opportunities to better their lives and livelihood.
7. Promotion of full employment
7.1. Optimally utilized farm lands7.2. Fisherfolk given territorial use rights in municipal waters7.3. Availability of non-farm jobs7.4. Support facilities for informal businesses and small enterprises provided7.5. Opportunities for self-employment assured7.6. Investment information and job placement services available
8. Maintenance of peace and order
8.1. Adequate facilities for police services (police headquarters and police outposts)8.2. Well-appointed courts8.3. Well-maintained jails and detention cells8.4. Facilities to prevent drug abuse available8.5. Rehabilitation centers for vagrants, beggars, street children, juvenile delinquents, and victims of
drug abuse in place8.6. Legal assistance to paupers offered8.7. Sports promotion and development consistently pursued
9. Preservation of comfort and convenience
9.1. Well provided access facilities for the handicapped and elderly in public places and buildings9.2. Clean functional public latrines9.3. Public toilets well maintained9.4. One-stop shops provided9.5. Modern telecommunications systems available and accessible
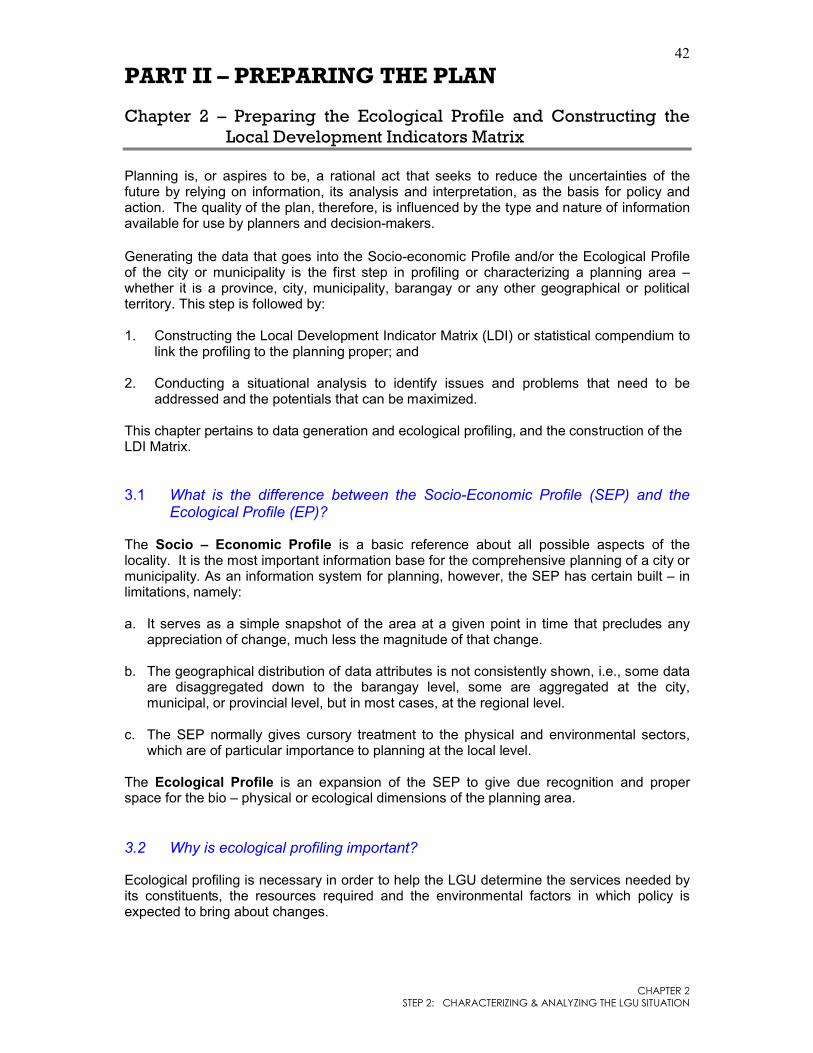
CHAPTER 2STEP 2: CHARACTERIZING & ANALYZING THE LGU SITUATION
42
PART II – PREPARING THE PLAN
Chapter 2 – Preparing the Ecological Profile and Constructing the Local Development Indicators Matrix
Planning is, or aspires to be, a rational act that seeks to reduce the uncertainties of the future by relying on information, its analysis and interpretation, as the basis for policy and action. The quality of the plan, therefore, is influenced by the type and nature of information available for use by planners and decision-makers.
Generating the data that goes into the Socio-economic Profile and/or the Ecological Profile of the city or municipality is the first step in profiling or characterizing a planning area –whether it is a province, city, municipality, barangay or any other geographical or political territory. This step is followed by:
1. Constructing the Local Development Indicator Matrix (LDI) or statistical compendium to link the profiling to the planning proper; and
2. Conducting a situational analysis to identify issues and problems that need to be addressed and the potentials that can be maximized.
This chapter pertains to data generation and ecological profiling, and the construction of the LDI Matrix.
3.1 What is the difference between the Socio-Economic Profile (SEP) and the Ecological Profile (EP)?
The Socio – Economic Profile is a basic reference about all possible aspects of the locality. It is the most important information base for the comprehensive planning of a city ormunicipality. As an information system for planning, however, the SEP has certain built – in limitations, namely:
a. It serves as a simple snapshot of the area at a given point in time that precludes any appreciation of change, much less the magnitude of that change.
b. The geographical distribution of data attributes is not consistently shown, i.e., some data are disaggregated down to the barangay level, some are aggregated at the city, municipal, or provincial level, but in most cases, at the regional level.
c. The SEP normally gives cursory treatment to the physical and environmental sectors, which are of particular importance to planning at the local level.
The Ecological Profile is an expansion of the SEP to give due recognition and proper space for the bio – physical or ecological dimensions of the planning area.
3.2 Why is ecological profiling important?
Ecological profiling is necessary in order to help the LGU determine the services needed by its constituents, the resources required and the environmental factors in which policy is expected to bring about changes.

CHAPTER 2STEP 2: CHARACTERIZING & ANALYZING THE LGU SITUATION
43
It is also important in identifying and prioritizing problem situations affecting the target population or specific segments of the population.
3.3 Who are responsible for ecological profiling?
By virtue of its functions under the Local Government Code, the Local Planning and Development Coordinator (LPDC) is responsible for preparing the LGU Profile and spearheading the analysis of data gathered. He/she, however, shall harness the support of all LGU departments/ offices/ units, including national government agencies operating within the locality, and the sectoral or functional committees in providing data, information and statistics pertaining to their respective sectors. The planning team, when organized, need not generate the information it requires to perform its functions. Rather, it should take offfrom the wealth of information maintained in the Local Planning and Development Office (LPDO).
3.4 What is the role of the province in ecological profiling and situational analysis of its component LGU?
a. The Province can provide common sources, methodology, format or templates for data gathering to facilitate comparative data analysis, interpretation & presentation.
b. The Province could be the most effective channel for cascading information and technology from the region to all levels of local government.
c. Provincial resources can be used to acquire modern technology, such as computer software which could be shared with component LGUs.
3.5 How can national government agencies be involved in ecological profiling andsituational analysis of an LGU?
National government agencies operating in the LGU can:
a. Provide assistance/guidance in identifying data needs, concerns, and indicators, and in setting/using data gathering tools and techniques;
b. Provide tools and analytical guides and techniques for gathering and analyzing data;
c. Conduct training on the use of analytical tools, guides and techniques;
d. Copy furnish LGUs with data/ maps generated by their field offices;
e. Provide LGUs with the results of their routine as well as project monitoring and evaluation activities;
f. Provide guides/tools in developing indicators specific to various development/ sectoral issues and concerns and updating/developing Local Development Indicators (LDIs);
g. Provide guides/tools in developing indicators specific to various development/ sectoral issues and concerns;

CHAPTER 2STEP 2: CHARACTERIZING & ANALYZING THE LGU SITUATION
44
h. Provide assistance/guidance in assessing specific sectoral performance, issue/sector specific performance;
i. Provide tools and conduct training on the review of programs and activities particularly their responsiveness to specific issues and concerns; and
j. Assist in validating results of the vision-reality gap analysis.
3.6 What are the minimum contents of an Ecological Profile?
The Ecological profile should have, as its minimum content the five development sectors, namely:
a. Population and Social Services (Social Sector),
b. Local Economy (Economic Sector),
c. Bio-Physical Base (Environment Sector),
d. Infrastructure Sector and
e. Institutional Capacity of the LGU (Institutional Sector)
3.6.1 Population and Social Services – These should depict the behavior of the population as a whole as well as that of its component part.
a. Population size
i. Obtain the latest figure given by the National Statistics Office (NSO).
ii. To draw a sharper picture of the population size, compare it to that of the larger areas of which the city/municipality is a part, like the district, province or region, it has to be compared.
iii. Show also population size and relative share of each barangay to the total city/municipal population in table form.
iv. Whenever available, show the urban and rural population shares to total city/municipal population.
v. If estimates about the population in a particular year other than the census year are desired, use any suitable calculation methods.
b. Age – Sex distribution – This population characteristic is very important especially in the planning of specific social services and facilities.
Other variables related to the age – sex structure of the population are as follows:
i. Sex composition – Population breakdown by sex
No. of MalesSEX RATIO = ______________ X 100
No. of Females

CHAPTER 2STEP 2: CHARACTERIZING & ANALYZING THE LGU SITUATION
45
ii. Age Composition – Age distribution is usually depicted in a table that groups the population into clusters of 5 – year intervals. For example, the percentage share of those who belong to the 5 – 9 year old bracket is computed as follows:
iii. Age Dependency Ratio – Age dependency ratios are expressed variously as:
c. Household and Family – The NSO differentiates a “household” from a family by the following definitions:
i. Family – consists of a group of persons living in the same household related by blood, marriage or adoption. The different types of families are as follows:
o Nuclear family, with the following variations:
Father, mother or one spouse only Father and mother Father, mother and unmarried children One spouse and unmarried children
o Extended family, i.e. in addition to nuclear family
Horizontal (same generation, e.g., cousin, brother) Vertical , e.g., father or mother of either spouse Horizontal – vertical, e.g., father and brother of either spouse
ii. Household – consists of a person living alone or a group of persons who sleep in the same housing unit and have a common arrangement for the preparation and consumption of food. The different types of households are as follows:
Population 5 – 9 years old____________________________ X 100Total city/ municipal population
Population <15 years + Population 65 years & >Total Dependency Ratio = _______________________________________ X 100
Population 15 – 64 years old
Population below 15 yearsYoung Dependency Ratio
= ______________________ X 100
Population 15 – 64 years
Population 65 years & aboveElderly Dependency Ratio
= _________________________ X 100
Population 15 – 64 years old

CHAPTER 2STEP 2: CHARACTERIZING & ANALYZING THE LGU SITUATION
46
o One-person householdo Nuclear family householdo Horizontally extended family householdo Vertically extended family householdo Horizontally and vertically extended householdo Household of related personso Household of unrelated persons
d. Population growth – this is the change in the population size between two points in time. It is the effect of events that tend to add, or take away members from the population such as births, deaths and migration.
Migration is made up of in-migration and out-migration. The two bring aboutcontrasting results.
e. Population Distribution and Urbanization – The pattern of population distribution over the city/municipal territory has great implications on planning. Indicators of population distribution are as follows:
i. Population density –Gross Population density is expressed as the number of persons per unit of land area, usually in hectares or square kilometers.
The net population density is the ratio of population to the total area of arable land. An arable land, for convenience, is defined as the total land area of lands classified as “alienable and disposable”.
ii. Extent of Urbanization – The National Statistics Office defines an urban area as follows:
o In its entirety, all cities and municipalities having a population density of at least 1,000 persons per square kilometer.
o Poblaciones or central districts of municipalities or cities which have a population density of at least 500 persons per square kilometer.
o Poblaciones or central districts (not included in i and ii above, regardless of their population size if they have the following:
Street pattern, i.e network of streets in either parallel or right angle orientation;
At least six (6) establishments such as commercial, manufacturing, recreation and/or personal services;
Determining gross population density may not be very meaningful because there are portions of the LGU territory which are not habitable.
A simple way of determining the rate of migration is to assume that the difference between the actual growth rate in the local area for a particular time period and the national growth rate for
the same period is due to migration alone.

CHAPTER 2STEP 2: CHARACTERIZING & ANALYZING THE LGU SITUATION
47 At least three of the following:
Town hall, church or chapel with religious services at least once a month;
Public plaza, park or cemetery; Market place or building where trading activities are carried on at
least once a week; A public building like school, hospital, puericulture and health
center or library.
Barangays having at least 1,000 inhabitants which meet the conditions above and where the occupation of inhabitants is predominantly non-agricultural.
f. Population Projections – Estimates of the size of the population is an essential information in the planning exercise because it indicates, among other things, the amount of goods and services that must be provided as well as the resources that will have to be utilized or maintained or reach a certain level of acceptablehuman well – being.
There are three basic methods for projecting the future level of population:
i. Mathematical method which is done using formulae such as the geometric rate, exponential growth rate and the participation or proportion method; and
ii. Economic method which considers the relationship between the changing economic circumstances and population growth. This method depends on projections on future employment opportunities or job-population ratios in the future.
iii. Component or cohort-survival method, which projects the future population by various demographic components such as age and sex, using information on births, deaths and migration.
To simplify the population projection exercise, however, only the mathematical method will be used in this guide.
MEASURES OF POPULATION DISTRIBUTION & URBANIZATION
Combined population of urban barangays
Level of urbanization (urbanity) in percent = __________________________ X 100Total city/municipal population
Tempo of urbanization in percentage points = Population growth rate(urban) –Population growth rate (rural)
Total urban population______________________________
Total area of urban barangays

CHAPTER 2STEP 2: CHARACTERIZING & ANALYZING THE LGU SITUATION
48
Geometric rate: The National Statistics Office (NSO) uses this method. This assumes that the population grows in a manner analogous to the growth of money deposited in the bank, where the annual interest on a principal is capable of yielding additional interest in the following year.
Mathematically, this is expressed as:
Pn = Po (1 + r)t
Where:Po = base population of the area
Pn = population of the area t years laters
t = Length of time interval in calendar years, and fraction thereof, between Po
and Pn
r = Rate of growth of the population per unit
To compute for r (rate of growth), rewrite the above formula using logarithm as follows:
Pn
logr = antilog PO - 1
t
For example: Compute the population growth rate for Municipality A from 1990 to 1995:
Given:
Pn = 1995 Population = 211,879
Po = 1990 Population = 184,970t = 1995 – 1990 = 5 years
Using a scientific calculator, follow the steps below:
i. Set calculator to “ÖN” then press ÄC (all clear) key to erase previous entries.
ii. Enter Pn which is 211,879, then press / which is the division sign
iii. Enter PO which is 184,970, then press = which is the equals signiv. Press log which is the natural logarithm keyv. Press / again, then press “5” which is the equivalent of t or the number of
yearsvi. Press =, then Press “ÏNV” which is the inverse sign keyvii. Press log, then press – which is the minus signviii. Enter constant integer 1, then press =ix. Press x which is the multiplication sign, then enter 100x. Press = sign. The answer, which is the population growth rate over a 5-
year period is 2.75%

CHAPTER 2STEP 2: CHARACTERIZING & ANALYZING THE LGU SITUATION
49
Exponential Growth Rate: This is similar to geometric growth rate, except that the interest or growth in population occurs continuously rather than annually. The exponential formula for the growth rate is expressed as follows:
Pn = POert
Where: Po = base population of the area Pn = population of the area + years later e = constant 2.7183, which is the base of natural log t = time interval in calendar years and a fraction thereof
between Po and Pn r = exponential growth rate
Given:Pn = 1995 population = 211,879Po = 1990 population = 184,970
t = 1995 – 1990 = 5 years
To compute for r, rewrite the formula using the logarithm as shown below:
PnIn Po
r = X 100
t
Using a scientific calculator, follow the steps below:
i. Set calculator to “ÖN” then press ÄC (all clear) key to erase previous entries.
ii. Enter Pn or the 1995 population which is 211,879, then press / which is the division sign.
iii. Enter Po or the 1990 population which is 184,970, then press =.iv. Press In key, then press / again.v. Enter “5”, which represents t or the number of years between 1990 and
1995, then press =.vi. Press x, which is the multiplication sign then enter 100.vii. Press = and the answer in percent, 2.72, will be shown.
g. Social Clustering of Population – This is the way special groups cluster themselves into more or less homogeneous areas. Some of the bases for social clustering are as follows:
i. Household income – by this criterion, it is possible to delineate areas which can be roughly be designated as marginal, low, medium and high income; and
ii. Ethnicity, cultural or regional origins of the area’s inhabitants

CHAPTER 2STEP 2: CHARACTERIZING & ANALYZING THE LGU SITUATION
50
Primary
Secondary
Tertiary
h. Status of Well-being of the Population
i. Inventory of the social support infrastructure, facilities and services.o Number of hospitalso Number of schoolso Number of hospital beds
ii. Morbidity rates
iii. Malnutrition rates
iv. Maternal and infant mortality rates
v. Literacy rates
vi. Participation rates
3.6.2 The Local Economy
The government takes an active interest in the state of health of the economy because on its largely depends the level of income and employment and, hence, the level of well – being of the residents.
a. The Structure of the Local Economy
The local economy consists of three sectors: primary, secondary and tertiary. The size of each sector represents the relative share of that sector to the total economic structure. It is illustrated as a pie divided into three parts in Figure 9 (Structure of the Local Economy).
Figure 9 - Structure of the Local Economy
The average household income is a good catch – all or proxy indicator of well – being because its shows whether or not a family can afford the goods and services that the members need.

CHAPTER 2STEP 2: CHARACTERIZING & ANALYZING THE LGU SITUATION
51
The Philippine Standard Industry Classification lists the following activities under each sector.
i. Primary Sector
o Agriculture, livestock, fishery and forestry
ii. Secondary Sector
o Mining and quarryingo Manufacturingo Electricity, gas and watero Construction
iii. Tertiary Sector
o Wholesale and retail tradeo Transportation, storage and communication,o Finance, insurance, real estate and business serviceso Community, social and personal services
3.6.3 The Physical and Spatial Base (Infrastructure Sector)
a. Inventory of Land and Land Use
i. Map Inventory – The proper start of physical / spatial analysis is an inventory of maps that are available or accessible. At the same time, a base map should be prepared at the appropriate scale (ranging from 1:10,000 to 1:50,000 depending on the size of the LGU). The base map should be reproduced in several copies. This base map should be used in the preparation of thematic maps to ensure consistency of map scale.
Shown in Table 7 are the key agencies and the type of maps available in their possession. However, there is a need to validate and reconcile all available maps because of differences in terms of the dates in which the data were captured, the scale of the maps, terminologies used, and delineation of boundaries, to name a few incongruities between and among agencies’ data holdings.
b. Preparation of Thematic Maps – From the maps that can be obtained from the different agencies, the following city/municipal level thematic maps can be prepared:
i. Political Boundaries – validation may be necessary due to possible recent changes. In case of doubt, seek clarification from the Land Management Bureau (LMB), DENR
ii. Land Classification – while validation is no longer needed, map scales will have to be made uniform.
iii. Slope – can be derived from the topographic map and should conform with the standard slope ranges prescribed by the National Land Use Committee as follows:
o 0 – 3% - Flat or level lando 3% - 8% - Level to undulatingo 8% – 18% - Undulating to rolling

CHAPTER 2STEP 2: CHARACTERIZING & ANALYZING THE LGU SITUATION
52o 18% - 30% - Rolling to moderately steep hillso 30% - 50% - Moderately to steeply mountainouso Above 50% - Very steeply mountainous
iv. Elevation – can be derived from the topographic map. Unless more refined elevation categories are desired, only those elevation ranges necessary to understanding the differences in ecological characteristics may be delineated such as the following:
o Below 500 m - Warm lowlando 500 m – 1,000 m - Warm – cool uplando Above 1,000 m - Cool highland
Table 7 - SELECTED MAPS HELD BY AGENCIES
AGENCY MAP TITLE AND SCALE DATA/ INFORMATION OBTAINBALE
NAMRIA
Topographic Map (1:50,000; 1:250,000)
Point elevations Major road network Built-up areas Water bodies Other surface features
Land Classification Map (Varying scales) Alienable and disposable lands Timberlands Unclassified public forests
Land Cover map Extent of vegetative cover by type, other land uses (extensive and intensive)
DENR Legal Status Map (1:50,000; 1:250,000) Reservations covered by proclamations, DENR projects, other protected areas
BSWM
Slope Map (1:50,000) Standardized slope categories and area in hectares covered by each slope category
Present Land Use and Vegetation Map (1:50,000; 1;250,000)
Land uses, mainly agricultural and forest, generalized built-up areas, major roads and stream networks
Protected Areas for Agriculture Map (1:50,000)
Highly restricted, moderately restricted, conditionally restricted areas from conversion, areas marginal to agriculture
Key Production Area Map (1;50,000; 1:250,000)
Areas suitable to agriculture and the recommended crops or activities for each area
Geographic Flow of Commodity Map (1;250,000)
Production and market areas for major agricultural crops
DEO, DPWH Road Network Map (1:10,000) Existing and proposed road network by administrative responsibility and surface type
MGB - DENR Geological Map (1:250,000) Sub-soil structure, fault lines, rock types
PHILVOCS Seismic Hazard Map (1:1,000,000 or smaller)
Areas prone to hazards associated with ground shaking (earthquake, volcanic eruptions, etc.), danger zones of varying degrees

CHAPTER 2STEP 2: CHARACTERIZING & ANALYZING THE LGU SITUATION
53Table 7 - SELECTED MAPS HELD BY AGENCIES (Cont’d.)
HLURB; LGU
Existing Land Use Map (1:10,000) City or municipality-wide distribution of major categories of land uses
General Land Use Plan (1:10,000) Proposed Land Uses for the entire city/municipality
Zoning Map (1:10,000 or larger) Proposed land uses for the urban and potentially buildable areas
v. Physical Constraints – a composite of several environmental hazards derived from different map sources extrapolated to the extent relevant to the municipal level, such as:
o Flood prone areas – derived from topographic mapo Areas vulnerable to tsunamis – NEDA Regional Office maps used in the Regional
Physical Framework Plan (RPFP)o Severe erosion areas – BSWMo Areas threatened by ground shaking – PHILVOCS, MGBo Areas threatened by volcanic hazards – PHILVOCSo Areas threatened by saltwater intrusion – BSWM
vi. Present Land Use – should be prepared at two levels: general land use for the entire city/municipal area and urban land use for the poblacion or urban area
o General Land Use – derived from BSWM, HLURB, DENR and NAMRIA maps; with reconciliation needed
o Urban Land Use – generated by the LGU updating and validating through detailed foot survey or other suitable survey methods including aerial photo or satellite image interpretation.
vii. Road network and Infrastructures – derived from the District Engineering Office, DPWH, BSWM and other utility agencies
viii. Protected Areas for Agriculture - from BSWM
ix. Protected Areas under the NIPAS – from PAWB, DENR
c. Inventory of Existing Infrastructure Support
i. Economic Support Infrastructure, such aso Irrigation systemso Power generation, e.g. mini-hydroo Roads, bridges, portso Flood control and drainageo telecommunications
ii. Social Support Infrastructure, likeo Schools, all levelso Hospitals, all typeso Waterworks and sewerageo Public socialized housing

CHAPTER 2STEP 2: CHARACTERIZING & ANALYZING THE LGU SITUATION
54
o Facilities for socially disadvantaged groupso Cultural and sports facilities
iii. Public Administrative Support, such as
o Local government support, e.g., city/municipal/barangay hallso Facilities for justice administrationo Facilities for public safety and protection, e.g. police stations and sub-stations,
fire stations and sub-stations
3.6.4 Environment and Natural Resources
LGUs are now empowered to share responsibility with the national government in the management of natural resources and maintenance of ecological balance within their territorial jurisdiction.
a. Natural Resources Inventory
i. Coordinate with the nearest offices of the DENR. Collect and collate data for such sectors as forests, lands, mines, protected areas and wildlife.
ii. Standard inventory data include existing / remaining stock in terms of commercial value/ volume by latest reckoning, the rate of flow or exploitation, the products and services derived from a particular source, and the protection and conservation measures that are in place.
iii. Sources of data include maps, aerial photographs and satellite images.
iv. The inventory should also include pertinent laws, administrative issuance and other relevant policies.
b. Inventory of existing mitigation, rehabilitation, protection and conservation measures that to ensure the sustainable use and serviceability of the ecosystem.
c. Human pressures, threats – human and natural, to the very survival of the ecosystem
3.6.5 Institutional Sector
a. Organizational Structure of the LGUb. Staffing of LGU Offices / Departmentsc. Fiscal Position of the LGUd. Inventory of Outputs of the Sanggunian (e.g., ordinances, resolutions), by Sectore. Local Special Bodiesf. Civil society Participationg. National Government Agencies operating in the LGU

CHAPTER 2STEP 2: CHARACTERIZING & ANALYZING THE LGU SITUATION
55
What are the sources of data?
Table 8 - SUGGESTED SOURCES OF DATA
SOURCE TYPE OF DATA
Local Planning & Development Office (LPDO) Practically all sorts of information about the city/ municipality
Mayor’s Permits and Licenses Office Number of establishments operating in the city/ municipality Amount of capitalization per establishment Number of employees per business entity Location of business, by barangay
Assessor’s Office Real property tax Physical profile of the city/municipality
o Area coverage of specific land uses and their boundaries Ownership of properties Assessed and fair market values of specific parcls
Treasurer’s Office Barangay and municipal/city level datao Income, receipts and revenueso Running summaries of collection and disbursement records
Rural Health Unit (RHU) Data on the following, with barangay disaggregationo Infant mortality rateo Extent of malnutrition by age groupo Households with/without sanitary toiletso Proportion of households served by safe drinking watero Crude birth and death rates
Department of Education (District Supervisor) School enrolment by place of residence of pupils School participation rate by age groups
City / Municipal Census Officer / Civil Registrar
Authoritative information on population such as demography and migration; registered births, deaths and marriages
Survey of establishments
The City / Provincial Engineer Inventory and condition of roads and bridges Extent of service of potable water systems in rural areas
Utility Companies Extent of service of electric power supply Extent of service of telecommunications systems Extent of coverage of domestic water supply
The Local Government Operations Officer, DILG
Information on barangay political activities Monitoring of barangay projects
Local Election Registrar Precinct – level voting – age population Registered voters by barangay (not only by precint)
Municipal/ City Accountant Financial Statements
Police Office Incidences of various crimes
Non – government Organizations Micro – level information for a wide range of specific purposes

CHAPTER 2STEP 2: CHARACTERIZING & ANALYZING THE LGU SITUATION
56
What are other sources of data?
a. The Community – based Monitoring System (CBMS) is a good source of databecause it was designed to address existing data gaps for diagnosing the extent of poverty at the local level, formulating appropriate responses to problems, identifying eligible beneficiaries for anti – poverty programs and requirements for development planning and monitoring that are disaggregated at the household level.
While the CBMS is poverty – focused, its results can yield such data / information as:
Table 9 –Data / Information by Sector / Sub-sector
SECTOR / SUB – SECTOR DATA / INFORMATION
POPULATION AND SOCIAL SERVICES
Total population, by sex and sex ratio, by barangay Total number of households, by barangay Average household size, total municipality, by barangay Number of households with income below the poverty threshold (municipal and provincial average) Number of household below the food threshold (municipal and provincial average) Number of households who experienced food shortage (municipal and provincial average) Members of the labor force who are unemployed (municipal and provincial average) Migration rate in purok, barangay, municipality/city and province. Total population, by sex and sex ratio, by barangay Total number of households, by barangay Average household size, total municipality, by barangay Number of households with income below the poverty threshold (municipal and provincial average) Number of household below the food threshold (municipal and provincial average) Number of households who experienced food shortage (municipal and provincial average) Members of the labor force who are unemployed (municipal and provincial average) Number of OFWs
a. Health Magnitude and proportion of malnourished children 0 – 5 years old vs. total children 0 – 5 years, by sex, by barangay
Number of malnourished children 0 – 5 years old (municipal and provincial average) Magnitude and proportion of children 0 – 5 years old who died vs. total number of children 0 – 5
years, by sex, by barangay Number of children 0 – 5 years old who died (municipal and provincial average) Total number of child births (less than 1 year old) Magnitude and proportion of women who died due to pregnancy related causes vs. total pregnant
women Number of women who died due to pregnancy related causes (municipal and provincial average) Magnitude and proportion of households without access to safe drinking water vs. total number of
households Magnitude and proportion of households without access to safe water vs. total number of
households Number of households without access to safe water (municipal and provincial average) Magnitude and proportion of households vs. total number of households, by source of drinking
water Magnitude and proportion of households with access to sanitary toilet facility vs. total number of
households, by barangay Magnitude and proportion of households, by type of toilet facility vs. total number of households Number of households without access to sanitary toilet facilities (municipal and provincial average)

CHAPTER 2STEP 2: CHARACTERIZING & ANALYZING THE LGU SITUATION
57Table 9 –Data / Information by Sector / Sub-sector
(Cont’d.)
SECTOR / SUB – SECTOR DATA / INFORMATION
a. Health (cont’d.) Number and proportion of households that access health facilities, by type of health facilities Number and proportion of couples that practice family planning methods, by type of family planning
methods Number and proportion of households with access to:
o Supplemental Feedingo Health assistance program including Philhealth
Number of persons who died, by sex, by cause of death
b. Education Magnitude and proportion of children 6 – 12 years old not attending elementary school, by sex, by barangay vs. total number of children 6 – 12 years old, by sex, by barangay,
Number of children 6 – 12 years old not attending elementary school (municipal and provincial average)
Magnitude and proportion of children 13 – 16 years old, by sex, by barangay who are not attending high school vs. total number of children 13 – 16 who are not attending high school, by sex, by barangay
Number of children 13 – 16 years old not attending high school, (municipal and provincial average) Number of households with access to Education /scholarship program
c. Social Welfare and Development
Number of persons with disability, by type of disability Number of senior citizens (60 years old and above), with and without identification cards
d. Housing Magnitude and proportion of households by tenure status vs. total number of households Magnitude and proportion of households living in makeshift housing vs. total number of households,
by barangay Number of households living I makeshift housing (municipal and provincial average) Magnitude and proportion of households who are informal settlers vs. total number of households,
by barangay Number of households who are informal settlers (municipal and provincial average) Number of households with access to Housing program Number of households with electrical connections Average monthly electrical consumption Types of materials used for walls and roofs dwelling units
e. Public order and Safety Magnitude and proportion of households with victims of crime, by sex, by barangay vs. total number of persons, by sex, by barangay
Number of persons victimized by crime (municipal and provincial average) Number of persons victimized by crime by type of crime, by sex
ECONOMIC Number and proportion of households with access to programso Comprehensive Land Reform Programo Skills or livelihood training programo Credit program
Number of persons employed by sector (primary, secondary, tertiary)Sources of income Net household income from various sources
ENVIRONMENT Solid waste disposal system, by type (municipal/city garbage collection, composting, burning, waste segregation, etc.)
Frequency of garbage collection

CHAPTER 2STEP 2: CHARACTERIZING & ANALYZING THE LGU SITUATION
58Table 9 –Data / Information by Sector / Sub-sector
(Cont’d.)
SECTOR / SUB – SECTOR DATA / INFORMATION
INSTITUTIONAL Number and proportion of persons with membership in community organization, by type of community organization
Number and proportion of registered voters vs. total population Number and proportion of registered voters who voted in the last elections vs. total number of
registered voters
A rider questionnaire is appended to the CBMS instrument. This is intended to yield data on reproductive health and gender and development issues such as the following:
i. Type of person (doctor, nurse, midwife, hilot, friend/relative, others) who assisted in the delivery during childbirth
ii. Place (home, public hospital, public health center, private hospital, private clinic, others) where pregnant women give birth
iii. Perceptions regarding HIV/AIDS
iv. Cases of domestic violence (insulting spouse/partner, slapping, beating kicking, punching spouse/partner, withholding financial support, forced sex)
What other data should be generated for some specific purposes?
To make planning truly comprehensive, the most extensive array of data should be generated to help in analyzing the LGU situation and in formulating appropriate goals and strategies, and developing suitable programs and projects to address all sectoral and cross – sectoral concerns.
Listed in the Table 10 are the data requirements for cross – sectoral and special concerns.

CHAPTER 2STEP 2: CHARACTERIZING & ANALYZING THE LGU SITUATION
59Table 10 - Data Requirements for Cross-Sectoral and Special Concerns
CROSS – SECTORAL CONCERNS POSSIBLE HOST SECTOR
DATA REQUIREMENTS
A. Disaster Risk Management
1. Hazard Assessment Environment o Hazard mapo Hazards or threats which may damage the locality or
communityo Footprint mapo Disaster history , including causes of disaster incidents, areas
affected by various disasters in the pasto Forces that can damage the locality, e.g. wind for typhoon and
tornado; water (heavy rain, flood, river overflow, giant waves,), land (slide erosion, mudflow, lahar), seismic (ground shaking, ground rupture, liquefaction, tsunami, industrial / technological (pollution, radioactive leaks)
o Rapidity of arrival of hazard and its impact (e.g., very slow: 3 –4 months in the case of drought; 3 – 4 days in the case of cyclone; very rapid for earthquake)
o Frequency of the occurrence of the hazard – seasonally, yearly, once in 10 years, once in a lifetime
o Particular time of the year when hazards occur – wet or dry season?
o Length of time the hazard is felt (e.g., days, weeks, months that an area is flooded etc.)
o Air, water, soil quality, forestry, erosion, waste management
Social o Presence of armed conflict (war, terrorism) o Length of period of military operationso Proportion of households living in sub – standard housingo Percentage of poor people having access to social protection
and safety nets
Economic o Financial sector involvement in insurance and other risk spreading instruments
Institutional o Current measures being undertaken, if any, for various hazards
Infrastructure o Percentage of construction or building projects in hazard prone areas
o Building classes by structural or construction type / wall material of building
o Lifelines (main roads network, bridges, tunnels, waterways and railways network, ports and airports, drinking water, electricity, telephone and data networks.
o Essential networks ( location of and number of hospitals, clinics, ambulance, fire brigade stations, police stations, government offices, schools, community centers, religious centers, covered courts, sports centers, sports fields, public green spaces, vacant lands, non – built up areas

CHAPTER 2STEP 2: CHARACTERIZING & ANALYZING THE LGU SITUATION
60Table 10 - Data Requirements for Cross-Sectoral and Special Concerns (Cont’d.)
CROSS – SECTORAL CONCERN POSSIBLE HOST SECTOR
DATA REQUIREMENTS
A. Disaster Risk Management
2. Capacity and Vulnerability Assessment1
a. Physical / Material Infrastructure o Location and type of building materials
o Roads, transportation, communicationo Health facilities
Economic o Economic activities
b. Social / organizational Population and Social Services
o Population in urban areaso Population growth rateso Poverty incidenceo Literacy rateo Mortality rateo Family structureso Human capital : population, mortality, nutritional status,
literacy, poverty levelso Divisions and conflicts: ethnic, class, religion, ideology,
language groups, isolation and connectednesso Access to basic services: housing and land tenure distribution,
proportion of slums, water, sanitation, electricityo Number of persons per hospital bedo Number of persons per health personnelo Vulnerable groups and degree of vulnerability
Economic o LGU product per capitao GDP per capitao Unemployment rateo Informal employment rate
Institutional o Structure of governanceo Legislations dealing with disaster management and risk
reductiono Proportion of local government budget allocated for disaster
management and risk reduction activitieso Administrative structure and arrangements for disaster
managemento Decision – making structureso Participation levelso Political groups and structures for mediating conflictso Degree of justice, equality and access to political processo Community organizations: formal and informal; traditional,
governmental, non – governmentalo Ratio of fire services per persono Risk reduction strategies, if ny, for hazard prone areas
1 Vulnerability refers to the implications of the disasters on physical, environmental, social and economic aspcts. Disaster
mitigation work focuses on reducing vulnerability.

CHAPTER 2STEP 2: CHARACTERIZING & ANALYZING THE LGU SITUATION
61
Table 10 - Data Requirements for Cross-Sectoral and Special Concerns (Cont’d.)
CROSS – SECTORAL CONCERN POSSIBLE HOST SECTOR
DATA REQUIREMENTS
B. Poverty Reduction and Millennium Development Goals
Environment o Location of hazard prone urban areas,
MDG No. 1 (Eradicate extreme poverty and hunger)
Social / Economic o Proportion of households with income less than the poverty threshold
o Proportion of households with income less than the food threshold
o Proportion of persons aged 15 years old and above who are not working but are actively seeking work
o Proportion of children 0 – 5 years old who are moderately and severely underweight (below normal – low and below normal very – low)
o Proportion of households who eat less than three full meals a day
o Proportion of household members victimized by crime
MDG No. 2 (Achieve universal primary education)
Social o Proportion of children 6 – 12 years old who are not in elementary school
o Proportion of children 13 – 16 years old, male/female who are not in high school vs. total number of children 13 – 16 years old
MDG No. 3 (Promote gender equality)
(May be derived from above)
MDG No. 4 (Reduce child mortality
Social o Proportion of children under five years of age who died
MDG No. 5 (Improved Women’s Reproductive health)
Social o Maternal mortality rate
MDG No. 6 (Combat HIV/AIDS, Malaria and Other Diseases
Social o Proportion of households without access to safe watero Proportion of households without sanitary toiletso Proportion of persons afflicted with HIV/AIDS, malaria and
other diseases
MDG No. 7 (Ensure environmental sustainability)
Environment o Proportion of households with makeshift housing

CHAPTER 2STEP 2: CHARACTERIZING & ANALYZING THE LGU SITUATION
62
C. Gender Responsiveness2 Population / Demographic Profile
o Population size, age – sex composition, spatial distribution (urban – rural)
o Population 15 years and over, by sex and educational attainment
o Percent of male/ female headed households by marital status
o Percentage of women in managerial/supervisory and technical positions
o Annual population growth rateo Population distribution, by barangay, urban – rural,
migrant and non – migrant classificationo Number, age – sex composition and highest educational
attainment of working age population (15 – 64 years old)o Number of employed persons by age, sex, spatial
distribution and occupationo Labor force participation rate or activity rate by age, sex,
type of occupation and geographic locationo Average family income by sex of household heado Number of households by income bracketo Population size, age – sex composition and geographic
locationo Number of persons entering the labor force (15 years
old), by sex, highest educational attainment and geographical location
o Number of Overseas Filipino Workers by sex, age group, place of work and major occupational group
o Percent of elementary, secondary, college and higher education graduates by sex
o Share Employment, underemployment, unemployment rates, of women to total employment by major occupation group and class
o Sex – specific dependency burdeno Sex – specific in – and out – migration rates
Social o Traditional beliefs and practices of the people pertinent to health
o Percent of infants with low birth weight by sexo Nutritional status by sex and age group
o Nutritional status of pregnant women (incidence of malnutrition)
o Percent of population with iron, iodine and vitamin A deficiencies by sex and age group
2 As listed in Annex 1 - Gender Responsive Population and Development Planning Guide

CHAPTER 2STEP 2: CHARACTERIZING & ANALYZING THE LGU SITUATION
63
C. Gender Responsiveness3
C. Gender Responsiveness
a. Health o Sex – specific mortality rate by age group and leading causes
o Sex – specific morbidity rate by age group and leading causes
o Sex – specific crude birth rateo Sex – specific crude death rateo Total fertility rateo Maternal mortality rateo Life expectancy by sexo Contraceptive prevalence rate by type of contraceptive
method usedo Incidence of teenage pregnancyo Number of health facilities, urban – ruralo Hospital bed – population ratioo Number of health personnel by sexo Doctor – population ratioo Health facilities – population ratio, by typeo Percentage of births attended by health personnel by
type of health personnel
b. Education o School – age population, age – sex composition by geographic area
o School – age participation rates by sexo Enrolment rates, drop – out rates by sexo Elementary and secondary completion rates by sexo Simple and functional literacy rates by sexo Number of schools by level (elementary, high school,
etc.), type (public or private), locationo Classroom – pupil ratioo Teacher – pupil ratioo Elementary and secondary cohort survival rates
c. Social Welfare and Development
o Number of differently–abled persons by sex and type of disability
o Percentage distribution of social welfare development clientele served by type and sex
d. Public Order and Safety
o Crime rates by type and sex and age group of victimo Percentage of abusers of minors by sex of abusero Population – firefighter ratioo Incidence of human rights violations
e. Housing o Percent distribution of households by type of housing unit occupied and sex of household head
o Percent distribution of households by main source of water supply and sex of household head
o Percent distribution of households by type of toilet facilities used and sex of household head
o Percent distribution of households by type of garbage disposal and sex of household head
o Characteristics of existing housing units by sex of household head (construction materials used; house and lot tenure)
o Number of households without own housing units by sex of household head
3 As listed in Annex 1 - Gender Responsive Population and Development Planning Guide

CHAPTER 2STEP 2: CHARACTERIZING & ANALYZING THE LGU SITUATION
64
Economic o Level of investments, by sector and geographic location (e.g., urban – rural)
o Jobs generated by investments classified whether technology used is labor – intensive or capital – intensive
o Wage rates by sexo Average time spent doing household chores and unpaid
work by employed men and womeno Level and type of investment in educationo Prices of food productso Volume of agricultural products by type of producto Volume and value of food importso Average household expenditure on foodo Number of households by income bracket and sex of
household aheado Average family income by sex of household heado Prices of environmental products
Infrastructure
a. Social Services Support
o Average distance of health facilities to population centers
b. Transportation & Circulation Network
o Existing modes of transportation and transportation facilities
o Length of local government roads by surface type
Environment o Percentage of forest covero Rate of deforestation / reforestationo Attitude of people towards environmental protection and
conservationo Consumption patters of population (e.g., high us of
disposable products like Styrofoam, plastics, disposable diapers, etc. that are usually thrown in the environment)
o Availability of technology that are environment - friendly
Institutional o Public policies affecting educationo Prices of land/ real estate in a given areao Level of government investments in the area like
infrastructure (e.g., roads, bridges, government facilities, water supply, etc.)
o Level of knowledge of population on environmental issueso Percentage of women candidates and share in local
elective positionso Leadership / membership in labor unions, cooperatives
and peasant organizations by sexo Percentage distribution of local government
expenditures by specific activitieso
The Local Development Indicators
The Ecological Profile (EP), for all its usefulness as a general reference material on practically every aspect of local development, is not readily usable for planning purposes. Being a snapshot of the conditions of the locality at a particular point in time, the EP hardly indicates change over time. To indicate change, two or more editions of the EP are needed. This implies that the EP should be consistently maintained and regularly updated using the same sectoral headings and capturing the same data sets in every edition.

CHAPTER 2STEP 2: CHARACTERIZING & ANALYZING THE LGU SITUATION
65For purposes of building a database for planning, an intermediate analytical tool is needed. It is called the Local Development Indicators System (LDIS).
What is the Local Development Indicator System (LDIS)?
The Local Development Indicator System (LDIS) is a table that portrays information in three (3) dimensions: sectoral, temporal and geographical or spatial. It is an attempt to consolidate the various indicators that are relevant to local planning but it is by no means exhaustive. In fact the different indicators which national government agencies are requiring LGUs to consider through the various programs such as the core local poverty indicators of the National Anti-Poverty Commission (NAPC), the Millennium Development Goals (MDGs), or the localization of Philippine Agenda 21, can be entered completely into this LDI matrix.
The LDIS has three dimensions:
1. Sectoral dimension – This presents the database according to the five identified sectors and their respective sub – sectors namely: Social, Economic, Environment, Physical/ Infrastructure, and Institutional.
2. Temporal dimension – This shows the comparison between the latest and earlier data to describe the change over time. Analysis can be done by looking into the growth trend for a number of years and the average rate of change for a specific period of time.
3. Spatial dimension - This seeks to compare one LGU with higher – level LGUs in the same region on one hand, and with lower – level units such as barangays on the other.
Interconnection among and between issues and concerns may be presented using different models (e.g., streams analysis, problem tree, etc.) and matrices (problem-solution finding matrix, technical findings, issues-opportunities-implication-policy option matrix, etc.).
What are the uses of the LDIS?
1. For cognition – to know what the situation is2. For analysis – to understand the factors determining the situation3. For policy making – to design interventions4. For M & E – to assess the effectiveness of policy interventions &
whether the situation is changing
What is the difference between ecological profile and the LDIS?
The LDIS goes beyond profiling. It means that the sectoral-temporal presentation of data allows an in-depth characterization of the planning area by enabling the analyst to appreciate changes in certain attributes over time. The sectoral-spatial data display moreover, allows the analyst to appreciate the differences between with respect to a given set of characteristics: on one hand, between the planning area and larger areas within which it is nested, and between smaller component parts and the planning are, on the other. Also, the portrayal of data in three dimensions enables the analyst to make more meaningful observations and thereby identify problem situations more systematically and formulate solutions which are place or area specific.
The LDI format generally adopts the same thematic or sectoral headings used in the SEP or the Ecological Profile. These headings include the following:

CHAPTER 2STEP 2: CHARACTERIZING & ANALYZING THE LGU SITUATION
66
1. Population and Social Services, 2. Local Economy, 3. Environment and Natural resources, 4. Physical Infrastructures and 5. Local Institutional Capabilities.
Processing of Data Entries
The most readily available source of data is the Ecological Profile. But to generate entries in the LDI Table in accordance with the suggested format, some amount of processing of raw data will have to be done. This is needed to transform raw data into standardized measures or indicators such as ratio, proportion, percentage, average, per capita share and the like, to ensure compatibility across time and across space.
The indicators that will be generated will show, among other things, the following:
a. level of development or underdevelopment of the area;b. potential and problems of each sector or sub-sectorc. success indicators for each descriptor of the different elements of the vision statement;
and thed. indicators that national agencies are pushing.
SECTORAL – TEMPORAL presentation of data allows an in – depth characterization of the planning area that shows changes in certain attributes over time.
SECTORAL – SPATIAL presentation of data allows an appreciation of the differences between the planning area and larger area within which it is nested, e.g. city/municipality and the province; and between the planning area, e.g. city/ municipality and its smaller component parts, e.g., barangays

CHAPTER 2STEP 2: CHARACTERIZING & ANALYZING THE LGU SITUATION
67
Table 11 - LOCAL DEVELOPMENT INDICATORS, BY TYPE, SECTOR, SUB-SECTOR, AND CORE CONCERNS
SECTOR SUB-SECTORCORE
CONCERNSTYPE OF INDICATORS LARGER
SPATIAL UNIT
SMALLER SPATIAL UNITS
INPUT OUTPUT OUTCOME1 2 3 …
n
SOCIAL Demography Population Size
Population Growth Rate
Growth rate, urban and rural, short-term, medium-term, long-term (if with intervention)
Population Distribution
Gross population density, 2 reference years (if with intervention)
Population Distribution
Net population density, 2 reference years (if with intervention)
Population Distribution
Percent of urban population, 2 reference years (if with intervention)
Population Distribution
Urban population density, 2 reference years
Education Access to Education
Proportion of 6-12 year old children who are not in elementary school, by sex, latest
Access to Education
Proportion of 13-16 year old who are not in secondary school, by sex

CHAPTER 2STEP 2: CHARACTERIZING & ANALYZING THE LGU SITUATION
68
SECTOR SUB-SECTORCORE
CONCERNSTYPE OF INDICATORS LARGER
SPATIAL UNIT
SMALLER SPATIAL UNITS
INPUT OUTPUT OUTCOME1 2 3 …
n
Education Social Justice(Gender Equality)
Ratio of girls to boys in elementary, secondary and tertiary school, latest
SOCIAL Health Access to Health Services
Percent of households without sanitary toilets, latest
Access to Health Services
Proportion of children 0-5 years old who are below normal weight for their age
Access to Health Services
Proportion of children under 5 years old who died of illness, 2 reference years
Access to Health Services
Proportion of women who died due to pregnancy, 2 reference years
Access to Health Services
Proportion of births attended by skilled health personnel, latestPrevalence rates of HIV/AIDS, malaria, tuberculosis, and other diseases, latest
Access to Health Services
Death rates of HIV/AIDS, malaria, tuberculosis, and other diseases, latest

CHAPTER 2STEP 2: CHARACTERIZING & ANALYZING THE LGU SITUATION
69
SECTOR SUB-SECTORCORE
CONCERNSTYPE OF INDICATORS LARGER
SPATIAL UNIT
SMALLER SPATIAL UNITS
INPUT OUTPUT OUTCOME1 2 3 …
n
SOCIAL Shelter Social JusticeSecurity
Proportion of households who are informal settlers, 2 reference years
Shelter Social Justice (Security)
Proportion of households with dwelling structures unable to protect them from the elements, 2 reference years
ECONOMIC Social Justice: (Poverty)
Proportion of households whose members eat less than 3 full meals a day, 2 reference years
Social Justice Poverty
Proportion of population with incomes below poverty line
Social JusticeGender Equality
Share of women in non-agricultural wage employment
Labor & Employment
Percent of labor force employed, by sex, 2 reference years

CHAPTER 2STEP 2: CHARACTERIZING & ANALYZING THE LGU SITUATION
70
SECTOR SUB-SECTORCORE
CONCERNSTYPE OF INDICATORS LARGER
SPATIAL UNIT
SMALLER SPATIAL UNITS
INPUT OUTPUT OUTCOME1 2 3 …
n
Labor & Employment
Dependency ratio, 2 reference years
ECONOMIC Labor & Employment
Proportion of persons 15 years old and above who are not working but actively seeking work
Proportion of children below 15 years old who are employed to the total members of employed persons
Agriculture Agricultural Land Utilization
Ratio of area of land in agricultural establishment, in EEU, 2 reference years
Agricultural Land Utilization
Volume/value or agricultural crop production by major crop, 2 reference years
Agricultural Land Utilization
Volume/value of fish production inland & marine, 2 reference years
Food Self-sufficiency
Food self-sufficiency index by food groups, latest

CHAPTER 2STEP 2: CHARACTERIZING & ANALYZING THE LGU SITUATION
71
SECTOR SUB-SECTORCORE
CONCERNSTYPE OF INDICATORS LARGER
SPATIAL UNIT
SMALLER SPATIAL UNITS
INPUT OUTPUT OUTCOME1 2 3 …
n
Forestry Per capita value of production
Labor & Employment: Agriculture
Forestry Employment contribution in percent of total employment
ECONOMIC Agriculture Fishery Per capita fish consumption (m.t./year)
Fishery Ratio of commercial fishing production versus municipal fishing production
Fishing HH/Total HH
IndustryRatio of electrical energy consumption in industry & commerce to total consumption
Rate of change in industrial land use (ha/year)
Volume/value or mining/quarrying production, 2 reference years

CHAPTER 2STEP 2: CHARACTERIZING & ANALYZING THE LGU SITUATION
72
SECTOR SUB-SECTORCORE
CONCERNSTYPE OF INDICATORS LARGER
SPATIAL UNIT
SMALLER SPATIAL UNITS
INPUT OUTPUT OUTCOME1 2 3 …
n
Services Percentage of households with one main source of income only to total number of households
Percentage of households with secondary/tertiary source of income
ECONOMIC Services Total number of commercial establishments, in Establishment Equivalent Unit, 2 reference years
Ratio of residential electrical energy consumption or average household consumption of electrical energy
Tourism receipts per year
ENVIRONMENT & NATURAL RESOURCES
Forest Ecosystem Resource Base & Land Use
Change in stock of forestry resources: dipterocarp, tree plantation, mangroves, pine, rattan (ha/year)
Resource Base & Land Use
Soil erosion in upland areas (mm/year)

CHAPTER 2STEP 2: CHARACTERIZING & ANALYZING THE LGU SITUATION
73
SECTOR SUB-SECTORCORE
CONCERNSTYPE OF INDICATORS LARGER
SPATIAL UNIT
SMALLER SPATIAL UNITS
INPUT OUTPUT OUTCOME1 2 3 …
n
Resource Base & Land Use
Forest land classification ratios (in %)
Resource Base & Land Use
Ratio of forest cover to timberland population (in %)
ENVIRONMENT& NATURAL RESOURCES
Forest Ecosystem Resource Base & Land Use
Ratio of population to certified A&D areas (in persons/hectaret)
Resource Base & Land Use
Percentage of timberland proclaimed as forest reserve or protection forest
Tenure Management
Area covered by leases and permits per lessee/permittee
Tenure Management
Area covered by CBFMA as percent of total forest area
Tenure Management
Area covered by community forest stewardship agreements as percent of total forest area

CHAPTER 2STEP 2: CHARACTERIZING & ANALYZING THE LGU SITUATION
74
SECTOR SUB-SECTORCORE
CONCERNSTYPE OF INDICATORS LARGER
SPATIAL UNIT
SMALLER SPATIAL UNITS
INPUT OUTPUT OUTCOME1 2 3 …
n
Tenure Management Ratio of families benefiting from
community-based projects to total number of families
Tenure Management
Growth rate of upland population (per annum)
Lowland/ Agricultural Ecosystem
Land Use and Land Productivity
Extent of area devoted to agriculture in percent of A&D
ENVIRONMENT & NATURAL RESOURCES
Lowland/ Agricultural Ecosystem
Land Use and Land Productivity
Land use changes (ha/year)
Land Use and Land Productivity
Land productivity (m.t./ha) per crop
Land Use and Land Productivity
Ratio of upland devoted to agriculture over total upland area (in percent)
Land Use and Land Productivity
Areas under Integrated Pest Mgt. relative to total cropland (in percent)

CHAPTER 2STEP 2: CHARACTERIZING & ANALYZING THE LGU SITUATION
75
SECTOR SUB-SECTORCORE
CONCERNSTYPE OF INDICATORS LARGER
SPATIAL UNIT
SMALLER SPATIAL UNITS
INPUT OUTPUT OUTCOME1 2 3 …
n
Other Agricultural Areas
Cropland per agricultural worker (ha)
Other Agricultural Areas
Agricultural workers per tractor (in %)
Other Agricultural Areas
Agricultural workers per harvester/ thresher (in percent)
INPUT OUTPUT OUTCOME1 2 3 …
n
ENVIRONMENT & NATURAL RESOURCES
Lowland/ Agricultural Ecosystem
Other Agricultural Areas
Percentage of irrigable, irrigated, rainfed, non-irrigated and prime lands converted to non-agricultural uses
Soil Degradation
Extent of problem soils (hectarage) as percent of total land area
Soil Degradation
Erosion rates by land use (mm/year)

CHAPTER 2STEP 2: CHARACTERIZING & ANALYZING THE LGU SITUATION
76
SECTOR SUB-SECTORCORE
CONCERNSTYPE OF INDICATORS LARGER
SPATIAL UNIT
SMALLER SPATIAL UNITS
INPUT OUTPUT OUTCOME1 2 3 …
n
Soil Degradation
Area distribution of erosion/degradation classes as percent of total land area
Soil Degradation
Extent of soil conservation (area coverage) as percent of eroded/degraded soils
Fertilizer and Pesticides Use
Nitrogen use per unit of agricultural output (kg/m.t.)
Fertilizer and Pesticides Use
Pesticide use per unit of agricultural output (kg/m.t.)
ENVIRONMENT & NATURAL RESOURCES
Lowland/ Agricultural Ecosystem
Fertilizer and Pesticides Use
Inorganic fertilizer used per unit area (kg/ha)
Fertilizer and Pesticides Use
Organic fertilizer used per unit area (kg/ha)
Fertilizer and Pesticides Use
Ratio of organic to inorganic fertilizer used

CHAPTER 2STEP 2: CHARACTERIZING & ANALYZING THE LGU SITUATION
77
SECTOR SUB-SECTORCORE
CONCERNSTYPE OF INDICATORS LARGER
SPATIAL UNIT
SMALLER SPATIAL UNITS
INPUT OUTPUT OUTCOME1 2 3 …
n
ENVIRONMENT & NATURAL RESOURCES
Tenure Area by tenure of farm per household (in has.)
Area by tenure of farm per household (if with intervention)
Urban Ecosystem Air Quality Concentration of air pollutants at selected sites: number of violations of standards in a year per site
Air Quality Emission levels of different pollutants per source, latest generated
Solid Waste Mgt.
Solid waste per capita in m.t. or cu.m.
Urban Ecosystem Solid Waste Mgt.
Non-biodegradable waste per capita (m.t. or cu.m.)
Water Quality Waste generated per capita per year (in m.t. or cu.m.)
Water Quality Effluents by source (various units)
Water Quality Concentration of water pollutants selected water (various units)

CHAPTER 2STEP 2: CHARACTERIZING & ANALYZING THE LGU SITUATION
78
SECTOR SUB-SECTORCORE
CONCERNSTYPE OF INDICATORS LARGER
SPATIAL UNIT
SMALLER SPATIAL UNITS
INPUT OUTPUT OUTCOME1 2 3 …
n
ENVIRONMENT & NATURAL RESOURCES
Land Use Informal settler density (squatter population/total population)
Land Use % of total land area occupied by squatters
Coastal Marine Ecosystem
Resource Base
Mangrove area: annual rate of depletion (ha/year)
Resource Base
Seagrass beds: number of species
Resource Base
Seagrass beds: status or condition
Coastal Marine Ecosystem
Resource Base
Coral reef and coral cover: percent of live coral/hectare
Resource Base
Marine protected areas as percent of total area of municipal waters
Threats Concentration of key pollutants in selected sites

CHAPTER 2STEP 2: CHARACTERIZING & ANALYZING THE LGU SITUATION
79
SECTOR SUB-SECTORCORE
CONCERNSTYPE OF INDICATORS LARGER
SPATIAL UNIT
SMALLER SPATIAL UNITS
INPUT OUTPUT OUTCOME1 2 3 …
n
ENVIRONMENT & NATURAL RESOURCES
Threats Concentration of coliform in selected beaches
Threats Oil spills: number and magnitude
ThreatsRate of sedimentation on selected bays
Fresh -water Ecosystem
Surface and Ground Water Quality
Physical quality indicators (results of lab tests)
Fresh -water Ecosystem
Surface and Ground Water Quality
Chemical quality indicators (results of lab tests
Fresh -water Ecosystem
Surface and Ground Water Quality
Biological quality indicators (results of lab tests)
Fresh -water Ecosystem
Surface and Ground Water Quality
Nitrate content of selected rivers

CHAPTER 2STEP 2: CHARACTERIZING & ANALYZING THE LGU SITUATION
80
SECTOR SUB-SECTORCORE
CONCERNSTYPE OF INDICATORS LARGER
SPATIAL UNIT
SMALLER SPATIAL UNITS
INPUT OUTPUT OUTCOME1 2 3 …
n
Quality of Major Freshwater Bodies
Rating of the general condition of freshwater body, latest
Quality of Major Freshwater Bodies
Number of times standards are exceeded
Quality of Major Freshwater Bodies
Number of licensed abstractors and volume of abstraction in mcm per annum
Quality of Major Freshwater Bodies
Area of fishpens as percent of area of freshwater bodies
Ratio of mining claims to total land area
Critical ResourcesMinerals and Mines
Incidence of illness due to mining operations

CHAPTER 2STEP 2: CHARACTERIZING & ANALYZING THE LGU SITUATION
81
SECTOR SUB-SECTORCORE
CONCERNSTYPE OF INDICATORS LARGER
SPATIAL UNIT
SMALLER SPATIAL UNITS
INPUT OUTPUT OUTCOME1 2 3 …
n
ENVIRONMENT & NATURAL RESOURCES
Critical ResourcesMinerals and Mines
Hectarage disturbed by mining
Ecosystem Diversity
Proportion of ecosystem area highly threatened due to existing infrastructure
Species Diversity
Number of threatened species over total number of known species
Number of threatened species over total number of known species (if with intervention)
Species Diversity
Number of sites identified for migratory birds per 100 hectares
Species Diversity
Number of exotic species introduced over total number of species
Conservation Efforts Proportion of protected areas
with illegal settlements to total protected areas
Conservation Efforts
Critical habitat/areas restored in ha/year
Conservation Efforts
Number of conservation programs implemented per five year

CHAPTER 2STEP 2: CHARACTERIZING & ANALYZING THE LGU SITUATION
82
SECTOR SUB-SECTORCORE
CONCERNSTYPE OF INDICATORS LARGER
SPATIAL UNIT
SMALLER SPATIAL UNITS
INPUT OUTPUT OUTCOME1 2 3 …
n
ENVIRONMENT & NATURAL RESOURCES
Critical ResourcesBio-diversity
Conservation Efforts
Habitat size restored/rehabilitated per year
Critical ResourcesBio-diversity
Conservation Efforts
Number of visitors in protected areas per hectare
Critical ResourcesBio-diversity
Conservation Efforts
Percent of protected areas converted to other uses
Critical ResourcesBio-diversity
Conservation Efforts
Share of Number of household/family over protected area (in hectare /HH)
PHYSICAL/ INFRA-
STRUCTURE
Power Utilities Percent of HH served by electric power
Utilities: Water: Ratio of HH served by piped water supply to total urban HH
Facilities Social Support::Health Facilities
No. of hospital beds per 1000 population
Education Classroom-to-pupil ratio in elementary schools; in secondary schools
Classroom-to-pupil ratio in elementary schools; in secondary schools (re-planning stage)

CHAPTER 2STEP 2: CHARACTERIZING & ANALYZING THE LGU SITUATION
83
SECTOR SUB-SECTORCORE
CONCERNSTYPE OF INDICATORS LARGER
SPATIAL UNIT
SMALLER SPATIAL UNITS
INPUT OUTPUT OUTCOME1 2 3 …
n
PHYSICAL / INFRA-
STRUCTURE
Utilities: Communications
No. of land-based telephones/1000 urban HH
No. of telephones/1000 urban HH (if with intervention)
Private messengerial/ forwarding companies operating
Circulation Network
Road density (area covered by roads to total land area)
Utilities: Communications
Ratio of postal employees to total HH population
Circulation Network
Total length of roads in km/total land area of A&D land
Circulation Network
Kilometer of road per 1000 population
Circulation Network
Density of farm to market roads (km/100 ha of farmlands)
Circulation Network
Percent of permanent bridges
Administrative Support
Total office floor per municipal employee

CHAPTER 2STEP 2: CHARACTERIZING & ANALYZING THE LGU SITUATION
84
SECTOR SUB-SECTORCORE
CONCERNSTYPE OF INDICATORS LARGER
SPATIAL UNIT
SMALLER SPATIAL UNITS
INPUT OUTPUT OUTCOME1 2 3 …
n
PHYSICAL / INFRA-STRUCTURE
Administrative Support
Public Safety No. of fire trucks per capita
Administrative Support
No. of police outposts/1000 population
Administrative Support
No. of prisoners/detention cell/ 1,000 population
INSTITUTIONAL Municipal Enterprise
Percent occupancy of municipal cemetery
Open Space Open SpaceTotal area of public open space per 1000 inhabitants
Open Space Ratio of covered courts/number of barangays
Presence of a comprehensive revenue generation plan
Local Fiscal Management
Revenue Performance
Total revenue per capita, 2 reference years
Cost collection ratio
Local Fiscal Management
Revenue Performance
Self-reliance index, 2 reference years (average last 3 years)

CHAPTER 2STEP 2: CHARACTERIZING & ANALYZING THE LGU SITUATION
85
SECTOR SUB-SECTORCORE
CONCERNSTYPE OF INDICATORS LARGER
SPATIAL UNIT
SMALLER SPATIAL UNITS
INPUT OUTPUT OUTCOME1 2 3 …
n
INSTITUTIONAL Local Fiscal Management
Revenue Performance
Proportion of delinquencies to total RPT collected, 2 reference years
Revenue Performance
Ratio of proceeds from special levies to total revenues, 2 reference years in previous and present administrations
Revenue Performance
Ratio of financial grants or donations to total LGU income, 2 reference years in previous and present administrations
Proportion of delinquent RPT payers to total listed taxpayers
Expenditure Total public expenditure on capital outlay per capita, 2 reference years
Expenditure Ratio of municipal government employees to total no. of local taxpayers
Real Property Tax
No. of big taxpayers who account for 80% of tax revenues

CHAPTER 2STEP 2: CHARACTERIZING & ANALYZING THE LGU SITUATION
86
SECTOR SUB-SECTORCORE
CONCERNSTYPE OF INDICATORS LARGER
SPATIAL UNIT
SMALLER SPATIAL UNITS
INPUT OUTPUT OUTCOME1 2 3
…n
INSTITUTIONAL Real Property Tax
Total revenue collected as percent of annual collection target, 2 reference years
Real Property Tax
Percent RPT collected to total potentially collectible
Real Property Tax
Amount of tax arrears recovered over total tax arrears at the beginning of budget year
Municipal Enterprise
Proportion of receipts from municipal enterprises to total local revenues
Organization and Management
Proportion of vacancies to total plantilla positions, previous and present administrations
Organization and Management
Ratio of casual employees, previous and present administrations
Organization and Management
Ratio of employees to total no. of personnel by type, 2 reference yearso Managerialo Technical
Administrative

CHAPTER 2STEP 2: CHARACTERIZING & ANALYZING THE LGU SITUATION
87
SECTOR SUB-SECTORCORE
CONCERNSTYPE OF INDICATORS LARGER
SPATIAL UNIT
SMALLER SPATIAL UNITS
INPUT OUTPUT OUTCOME1 2 3 …
n
INSTITUTIONAL Organization and Management
Ratio of confidential positions to total plantilla positions, previous and present administrations
Participation Ratio of LDC-member NGOs and Pos per capita, past and present administrations
Ration of non-LDC member NGOs and POs to total CSOs operating in the locality
Presence of local govt assigned desks or other support mechanism for CSO, NGO or PO or PS concerned
Presence of feedback mechanism to generate citizens’ views on the reach & quality of services & devt thrusts
Transparency Presence of a public info office or desk

CHAPTER 2STEP 2: CHARACTERIZING & ANALYZING THE LGU SITUATION
88
SECTOR SUB-SECTORCORE
CONCERNSTYPE OF INDICATORS LARGER
SPATIAL UNIT
SMALLER SPATIAL UNITS
INPUT OUTPUT OUTCOME1 2 3 …
n
Development Orientation
Legislative Output
Proportion of “development” legislation to total sanggunian output, last and current administrations
INSTITUTIONAL Credit Financing
Total public debt incurred by the LGU per capita, past and present administrations

CHAPTER 4 – ANALYZING THE DEVELOPMENT SECTORS
89
PART II – PREPARING THE COMPREHENSIVE DEVELOPMENT PLAN
Chapter 3 – Analyzing the LGU Situation
Analyzing the LGU Situation Using the Local Development Indicator System
The LDIS, if properly constructed is most useful in the diagnosis of development issues. This process is known as problem – finding analysis. The problem finding analysisinvolves a 3 – step process:
1. Information Generation - This means making meaningful observations or making sense out of the data displayed in the LDI table. It asks the question, “What do the figures mean”? There are three useful clues to making observations:
a. Compare data indicators in two points or periods of time and note whether there has been an increase, decrease or no change in the figures over time.
b. Compare data/ indicators across two spatial or geographical units and note whether the figure for one unit is higher, lower, or the same as the other.
c. Compare the data/indicator for your study area with any known national standard or with a selected benchmark.
2. Extracting Intelligence – This entails probing into the causes or explanations behind the observed conditions. It asks the question, “Why?” This provides the clue to finding more fundamental solutions by attacking the causes rather than the symptoms of the problems.
3. Further exploration of the implications of the observed condition if no significant intervention is exerted by anyone anywhere to change the situation. It asks the question, “So what?”
The logic of the problem-finding and solution-finding analysis using the LDIS as the basic source of information can be summarized in the scheme shown as Table 11 (Sample Output of Problem – Solution Finding Analysis).
The analysis can be extended further into determining appropriate policy interventions. This part of the analysis can be called simply the solution-finding phase. Policy interventions need not be limited to targeting the negative implications of observed conditions. Positive implications need to be maintained and strengthened through policies that seek to sustain the beneficent effects.
Implications may be positive of negative.
If negative implications predominate, then the observed condition can be regarded as a problem.
If positive implications predominate, then the observed condition may be regarded as a potential.

CHAPTER 4 – ANALYZING THE DEVELOPMENT SECTORS
90
Table 11 - SAMPLE OUTPUT OF PROBLEM-SOLUTION FINDING ANALYSIS
LAND AND WATERObserved Conditions Explanations (Causes) Implications When Unresolved Policy Options
Land Classification Area of alienable &
disposable (A & D) land is very small
Over 84% of total land area is forestland with some areas probably misclassified
Small area devoted to agriculture & other crops
Small taxable areas (low income for the municipality)
Occupants of untitled landsare considered informal settlers & have no security of tenure
Investors hesitate to develop untitled lands
Work for release of some forestlands into A & D
Accelerate cadastral survey & titling of A & D lands
Water is a common means of transport among Barangay residents
Absence of roads and bridges connecting to far flung barangays
Dangerous especially during sough seas
Slow and poor mobility Canot be relied upon during
emergencies Limited capacity for large
volumes of goods and products to be transported
Embark on massive road and bridge building
Maintain a municipal-government operated ferry service that is multi-purpose
Construct a pier for safe, reliable docking
Figure 10 - Problem-Finding and Solution-Finding Analyses
The problem-finding and solution-finding analyses can be subjected to highly participatory processes such as seminar – workshops and focused group discussions.
Problem analysis is a useful tool in further analyzing the issues and problems that need to be addressed in the locality. It utilizes the information derived from the database and the local development indicators (LDI) that have been aptly organized for planning purposes. A list of issues and concerns are identified and from these, key issues can be generated that are to be addressed in the CDP. The output of the problem analysis provides the basis in determining relevant programs, projects, policies or legislations that will respond to the identified key issues and concerns.
L OCAL DEVELOPMEN T I NDI CATORS SYSTEM
OBESRVED CON DI TI ONS(Generati ng Inform ation)
EXPL AN ATI ONS OR CA USATIVE F ACTOR S
(Extracting I ntell igenc e)
IMPL ICATION S WHEN NO INTERVEN TI ON IS INTRODU CED (Further ex ploration of
the observ ed conditi ons: So what?
POL ICY OPTIONS

CHAPTER 4 – ANALYZING THE DEVELOPMENT SECTORS
91Issues can be clustered according to sectors in the CDP namely social, economic, physical infrastructure, environment and development administration.
As partners of the national government the LGUs are expected to address poverty as a central concern and other cross-cutting concerns such as gender and environment. (See Box 4 - How to Undertake Problem Analysis)
The Problem Tree is a visual representation of how problems are linked and interrelated in a situation. It defines which appear to be causes and effects of an identified core problem and the other problems that appear to result therefrom. This, however, depends on the availability of data and information.
The series of “problem trees” summarizes the issues and concerns, problems and constraints identified in the sectoral and inter-sectoral workshops. The problems are organized into cause-effect relationships with the lower boxes representing the causes (“roots”) and the boxes above are effects (“foliage”). All problems and issues are presented from the perspective of the local government (institutional sector) the easier for it to identify the appropriate intervention measures.
Box 4 - HOW TO UNDERTAKE PROBLEM ANALYSIS
STEP 1. Identify the problems
Using “metacards,” list all the problems. One card per problem. Formulate each problem as a negative condition.
Example: Frequent flooding; Erosion of vast tracts of land
STEP 2. Establish the cause – effect relationship among the problems identified
From among the listed problems try and agree on which is the cause and which is the effect. Differentiate between an immediate cause and a remote cause.
Example: damaged crops is caused by deteriorating forest condition
STEP 3. Establish a convergence point (or points)
The convergence point for all the problems identified is referred to as the “core problem” and becomes the over-riding concernthat will have to be addressed
STEP 4. Review the diagram as a whole.
Verify the cause and effect relationship and agree on the soundness and completeness of the problem tree.
Using LGPMS in Situational Analysis
In conducting a situational analysis, LGPMS offers techniques for identifying priority performance and service areas and determining “areas for action”. The State of Local Governance Report (SLGR), as a consolidation of LGPMS findings on the performance of the LGU, for example, can serve as a useful reference for surfacing issues.
Using CBMS in Situational Analysis
The CBMS, backed up by disaggregated and geographically-defined data, on the other hand provides tools for diagnosing and analyzing poverty-related issues. This is most helpful in determining the gap between the vision and the actual situation (vision-reality gap). CBMS not only depicts the extent of poverty in an area, but it also establishes the causes ofpoverty.

CHAPTER 4 – ANALYZING THE DEVELOPMENT SECTORS
92
Using Population Data in Analyzing the LGU Situation
1. Population is the basis for determining whether the level of public services like schools, health centers, recreational facilities, power and water supply, is adequate/inadequate or accessible/inaccessible.
2. Population projections – Estimates of the total size or of the components of the population which indicate the magnitude of demand for certain goods or services are necessary when preparing sectoral development plans and programs. (See Box 5)
For example, present and projected population size serves as an important input to assessing housing adequacy and calculating future housing demand.
3. Age – Sex distribution is very important especially in the planning of specific social services and facilities, since they cater to specific segments of the population.
4. Sex Composition affects the incidence of births, deaths and marriages. It can be used as a basis for looking at its implications on the following:
a. Spatial mobility; and
b. Work participation and occupational structure
5. Age Composition
a. “Young” and “Old” population – The population is said to be:
i. Expansive – where large numbers of the population are in the younger ages;
ii. Constructive – where a smaller number are in the younger ages; or
iii. Stationary – where roughly equal numbers of people are found in all age groups
with slight tapering off in the older ages.
b. Age Dependency Ratio – This indicates the extent to which those who are too young or too old to earn a living depend for support on those who work.
In the Philippines, those who are below 15 years old are considered too young, and those 65 years old and above too old, too work.
6. Population Growth is the effect of events that tend to add, or take away members from the population such as births, deaths and migration.
Box 5 – Examples of Goods and Services by Age GroupFor example:
Dependent Age (0 – 14 and 65 and above) would require specialized health services and facilities
School Age Groups (3 – 6, pre-school; 7 – 12, elementary; 13 – 16, secondary) would require school facilities
Labor Force (15 – 64) will have to be provided with jobs

CHAPTER 4 – ANALYZING THE DEVELOPMENT SECTORS
93
a. Births and deaths cancel each other out. When the general state of health is good and survival rates of infants and life expectancy at birth are high because of advanced medical care available and accessible to the people, the population is bound to achieve a net positive balance between births and deaths resulting in net population increase.
b. Migration is indicative of the relative attractiveness of an area as a place of employment, and corollarily, as a residential area. A positive change is the effect of in-migrants outnumbering out-migrants.
For a better appreciation of the behavior of the population of the LGU, its growth trend must be shown and compared with those in other cities/municipalities in the province or the region.
7. Population density indicates the pattern of population distribution. It can serve as an indicator of urbanization. It is assumed that the urban population is concentrated in a relatively small area whereas the rural population is dispersed over a wide area.
According to the definition set by the National Statistics Office, an area is considered urban when its population density is at least 1,000 persons per square kilometer, or when the poblacion or central district of a city or municipality has a population density of at least 500 persons per square kilometer.
Analyzing the Social Sector: Status of Well – being of the Population
The social development sector is concerned with changes in the area or community relative to the following:
1. Social characteristics of the area population;
2. Overall quality of life;
3. Availability and access to social services; and
4. Social justice
Overall quality of life
Quality of life, status of well-being, and general welfare are synonymous terms. But these concepts cannot be measured directly. In measuring the quality of life, the usual practice is to use a composite of indicators covering specific sectors or dimensions of welfare which more easily lend themselves to measurement. These are embodied in the Local Development Indicators System.
One way of assessing the welfare status of the population is through the following steps:
1. Take an inventory of the social support infrastructure, facilities and services.
2. Apply the allocation standards developed and used by the agencies that provide these services to determine whether the study area is adequately served or whether backlog exists.
3. Use output or outcome indicators, such as morbidity rates, malnutrition rates rather than input indicators such as number of hospitals, number of schools in the area. This is due to the fact that, the mere presence or absence of a service is not a reliable indicator of the state of well-being of the people in the area.

CHAPTER 4 – ANALYZING THE DEVELOPMENT SECTORS
94
Morbidity rates, malnutrition rates, maternal mortality rates and the like are better indicators of health status rather than the number of hospital beds; literacy rates, educational attainment, participation rate, rather than the number of school houses, etc. are more meaningful measures of well – being.
Income / Poverty Line as a Measure of Well-being
One may also use individual and family income as a welfare indicator although normally it is treated as an economic indicator. It is because income determines the ability of the individual or the family to procure the goods and services he/she/they need that are available in the market. This is also the reason behind the use of the poverty line (a concept that has a very strong income connotation) as a benchmark for measuring the level of well-being.
Availability and Access to Social Services
The physical availability of social services does not automatically mean that the citizens are well served. Some social services are not for free and therefore access is determined by affordability. It is the concern of the social sector to guarantee access to social services by the target population either by providing adequate social services or by removing the different types of barriers to access to these facilities and services.
It is therefore important to determine whether or not social welfare services and facilities are physically available and are located not too far away from the target clientele. And if they physically exist, ascertain if they tend to discriminate wittingly or unwittingly against certain groups on account of their social status or affiliations.
It is a fact that the need for certain goods and services does not occur uniformly throughout the lifetime of individuals and certain groups of the population. At certain stages in their lives people require more of certain types of services than they do others. The graph as show in Figure 11 - Time Relationship between a Birth and Future Service Requirements) illustrates this fact and should aid in formulating appropriate sectoral policies and programs of intervention.
Social Justice
The principle of social justice requires that the distribution of income, wealth, and command over society’s resources should be such that the:
1. needs of the population within the territory are adequately met;
2. inter-territorial multiplier effects are maximized; and
3. extra resources are allocated to overcome special difficulties stemming from the physical and social environment.
Similarly, the mechanisms for the allocation and distribution of society’s resources (institutional, organizational, political and economic) must be such that the opportunities of the least advantaged groups and areas are as great as they possibly can. Find out if this is true in the LGU.
The average household income is a good catch – all or proxy indicator of well – being because its shows whether or not a family can afford the goods and services that the members need.

CHAPTER 4 – ANALYZING THE DEVELOPMENT SECTORS
95
Preferential treatment for the “least advantaged groups and areas” is how the Constitution defines social justice. Article XIII calls for the “enactment of measures that protect and enhance the right of all the people to human dignity, reduce social, economic, and political inequalities, and remove cultural inequities by equitably diffusing wealth and political power…” (Sec. 1, Philippine Constitution).
Thus, it is crucial to find out if the preferred priority laws and policies that need to be enacted are those that:
1. recognize the right of labor to its just share in the fruits of production and of enterprises to reasonable returns on investment (Sec. 3, Philippine Constitution);
2. encourage the just distribution of agricultural lands and at the same time respect of the rights of small landowners (Sec. 4, Philippine Constitution);
3. protect the rights of subsistence fisherfolk, landless farmers, and indigenous people to preferential use of lands, waters and other natural resources (Secs. 5-7, Philippine Constitution);
4. make available affordable decent housing and basic services to underprivileged and homeless citizens (Sec. 9, Philippine Constitution);
5. give priority to the health needs of the underprivileged sick, disabled, women, and children as well as free medical care to paupers (Sec. 11, Philippine Constitution);
6. protect working women (Sec. 14, Philippine Constitution); and
7. respect the right of the people to free and independent association and guarantee participation of people’s organizations at all levels of decision making (Sec. 15 and16, Philippine Constitution).
Figure 11- Time Relationship between a Birth and Future Service Requirements
Source: __________________________________________________

CHAPTER 4 – ANALYZING THE DEVELOPMENT SECTORS
96Analyzing the Local Economy
There are three (3) General Welfare Goals that pertain to local economic development: to encourage and support the development of appropriate and self-reliant scientific and technological capabilities, enhance economic prosperity, and promote full employment among the local residents.
Development of self-reliant scientific and technological capabilities
The development of scientific know-how and technological capabilities among the residents is a necessary condition to attaining higher levels and faster rate of economic growth. But the LGU must first ask the following questions:
1. Are the constituents prepared in adopting new technologies?
2. Fr example, has the LGU switched to the use of computers? If so, is the supply of electric power reliable, or is the use of the old manual typewriter still more appropriate?
3. Does the LGU benefit from the optimum capacity of technology?Most imported technology incorporates in their design programmed obsolescence so that the user has to continually upgrade hardware and purchase new software. For the sake of self-reliance, does the LGU still use homegrown technologies and indigenous knowledge? If so, have they been discarded, or have they been developed and improved?
Enhancement of economic prosperity
Enhancement of economic prosperity is the principal concern of the economic sector. But the other half of this goal is the promotion of social justice. This is to ensure that the benefits of prosperity do not concentrate in the hands of the few privileged sectors of society.
Examine if:
1. the benefits of prosperity are not concentrated in the hands of the few privileged sectors of society;
2. there are programs, projects and legislative measures that seek to promote full employment as the principal redistributive mechanism;
3. there are mechanisms available for direct transfer payments such as unemployment insurance or substantial non-wage benefits like subsidized health, education, housing and other social services.
Promotion of full employment
Assess the desirability of the LGU as a good place to do business in. Is the climate in the LGU hospitable to private investments? If not, why?
Determine if there are measures to indirectly create jobs by making the locality an attractive place for private investments.
Are there incentives to private investors in the form of fiscal measures such as tax breaks and exemptions from certain fees and charges?

CHAPTER 4 – ANALYZING THE DEVELOPMENT SECTORS
97
Food self-sufficiency or security
The economic sector is also concerned with making available in sufficient quantities the food requirements of the local residents. Taking off from the existing level of self-sufficiency in various food commodities as determined in the profile, the economic sector planners shall decide on what level of sufficiency will be targeted. This will in turn determine how much will be produced locally and how much will be procured from outside. The Food and Nutrition Research Institute (FNRI) provides the per capita requirement per year of the following food commodities:
Table 12 - ANNUAL FOOD REQUIREMENT PER CAPITA
COMMODITY PER CAPITA / YEAR REQUIREMENT (In Metric Tons)Grains (rice and corn) 0.11434Sugar 0.021Assorted vegetables and legumes 0.01265Root crops 0.0073Fish 0.03065Meat & eggs 0.03313
Further, in order for the local government to effectively facilitate the market to accelerate local economic development, local officials and the public must have a basic understanding of how the local economy works. Local officials in particular must be familiar with relevant and applicable techniques of analysis that can help in identifying points of entry or areas of intervention. Some of these are as follows:
1. Determining the relative size of each sector – The relative size of each sector can be determined by using some of the measuring units as follows:
a. Number of persons employed (or engaged)
b. Volume or value of output
c. Total amount of investment
d. Number of establishments
e. Gross value added
2. Determination level of urbanization using employment as a measuring unit – A place may be considered urban or rural by simply taking the ratio of the combined employment in secondary and tertiary sectors to total employment, expressed in percent using the formula below.
E (Secondary) + E (Tertiary)
X 100Level of Urbanization = E (Primary + Secondary + Tertiary)
Local government intervention in the economy serves to facilitate market transactions by:
a. eliminating identified bottlenecks, andb. strengthening the area’s competitive advantage.

CHAPTER 4 – ANALYZING THE DEVELOPMENT SECTORS
98
a. A ratio below 50% indicates that the place is still predominantly rural;
b. A ratio above 50% shows that the place is considered urban.
By comparing two ratios between two census years, the direction of change is indicated, whether:
a. the area is growing more or less urbanized, or
b. it is in a steady state.
Decisions can then be taken whether to speed up, slow down or maintain the pace of urbanization depending on the development vision of the local leadership and the residents.
3. Determining Structural shift in the local economy – Structural shift in the local economy is shown by changes in the relative share of each sector to the total economy over time.
For example: The increasing share of secondary and/or tertiary sectors and a corresponding decrease in the share of the primary sector indicate a trend towards urbanization.
This concept is illustrated in the table below:
Table 13 - Illustrative Example of Structural Shift in the Local Economy
SECTOR EMPLOYMENT SHARE SHIFT % POINTS1980 % Share 1990 % Share
Primary 40 53.3 33 41.25 -12.05Secondary 16 21.3 22 27.5 +6.20Tertiary 19 25.3 25 31.25 +5.95All Sectors 75 99.9 80 100.00
4. Determining the Town’s Specialization
A simple measure of an area’s specialization is the location quotient (LQ). The LQ is an indicator of the relative importance of an area in terms of selected industry types or sectors. Any measurement unit or variable can be used as the specialization variable and the reference variable.
For the purpose of the LQ analysis, the comparison must be shown between a smaller area and a bigger area to which the smaller unit is a component pert, e.g. a town and its mother province of which it is a part. The formula for determining LQ is as follows:
The principal question that the LQ seeks to answer is: To what extent are certain activities or characteristics of the area economy associated
with other selected activities or characteristics; and how does this association compare with those of the larger area as a whole?

CHAPTER 4 – ANALYZING THE DEVELOPMENT SECTORS
99
Area specialization variableLocation Quotient = Area reference variable
Larger area specialization variableLarger area reference variable
Note: The LQ is a ratio of ratios so the answer is an absolute number
For example:
a. Measuring unit is “employment”b. Areas being compared are Town A and its mother province, Province B.c. The LQ for a particular sector (or activity), say, agriculture is computed as
follows:
No. of persons engaged in agriculture in Town ALocation Quotient = No. of persons engaged in all sectors in Town A
No. of persons engaged in agriculture in Province BNo. of persons engaged in all sectors in province B
The same computation may be repeated for each sector or activity and interpret the results as follows:
Knowledge of the town’s specialization is a vital input to decision – making. Depending on the LGU vision and objectives of local development, appropriate policies can be developed. For example, policies to accelerate economic growth can be formulated by reinforcing the town’s specialization in certain activities or sectors.
5. Identifying Linked Activities – The data on specialization can also be used to identify other activities which might be promoted in the locality. This is to diversify the economy by promoting businesses that have various forms of linkages with the specialized activity.
The common types of economic linkages are as follows:
a. Backward – an activity or industry that provides input materials and services to, say, agriculture, e.g. farm implements, fertilizers, pesticides, certified seeds.
b. Forward – an activity that uses the output of a particular activity, say, sugar milling, e.g. candies, soft drinks, confectionery, is linked in a forward manner.
If the LQ is greater than 1.0, the town is more specialized than the province as a whole in that type of economic activity.
If the LQ is less than 1.0, the town is less specialized in that activity or sector than the province as a whole.
If the LQ is equal to 1.0, the activity is equally important in both the town and the province.
Too much specialization makes an LGU very dependent on other areas. Concentrating on one product and one market makes an area highly vulnerable to external market failures
and uncertainties.

CHAPTER 4 – ANALYZING THE DEVELOPMENT SECTORS
100c. Vertical – where two or more firms produce components of a final output, e.g. parts of
a car
d. Horizontal – where two or more firms produce complete products that are complementary in use, e.g. several furniture shops each specializing in one type of furniture like chairs, tables, cabinets, etc.
e. Diagonal – where a service cuts across different types of firms, e.g. security services, insurance, messengerial or forwarding services.
f. Residentiary – where services to the employees or managerial staff are provided by the firm or households, e.g. housing, recreation, food catering.
Backward and forward linkages are known as production linkages. The others may be referred to as distribution or as trade and services linkages.
Information gathered about production linkages may be used as basis for a more detailed investigation into the feasibility of attracting new firms that have either a backward or a forward linkage with the local industry to locate in the area.
The advantages of additional industries locating in the area over the short – term and in the long run are described in the model shown in Figure 12 based on the theory of cumulative causation or “spread effects” formulated by Gunnar Myrdal.
6. Money Flow Theory – Another way of understanding the local economy is to assume the following:
a. the geographical / territorial unit is a closed spatial system similar to a water tank that has an inlet pipe and an outlet pipe;
b. both inlet and outlet valves are open at the same time.
LOCATION OF NEW INDUSTRY
Expa nsion of local employment and popula tion
Incr ease in loc al pool of trained industr ial labor
Attr action of capital and enterprise to exploit
expanding demands for locally produced goods
and services
Development of external economies for former ’s
pr oductionProvision of better
infr astructure for population and industrial development –
roads, fac tory sites, public utilities, health and
educ ational services, etc.
Expansion of local government funds through
incr eased local tax yield
Expans ion of general wealth of the community
Expansion of service industr ies and others servic ing local market
Development of ancillary industry to support former
with inputs, etc.
Figure 12 - Myrdal’s Concept of Cumulative Causation: An Example of Industrial Expansion in an Area

CHAPTER 4 – ANALYZING THE DEVELOPMENT SECTORS
101
The amount of water that is stored in the tank at any time is the net of the inflow and outflow. There is net storage when the inflow is greater than the outflow; no storage is possible when the outflow is equal to or greater than the inflow.
Similarly, there are transactions that lead to either an inflow of money into or an outflow of money from the local economy.
Calculate the magnitude of each flow on a yearly basis and determine whether there is net storage of money in the local area. At least one of two scenarios will emerge:
Scenario 1: There is hardly any storage
Scenario 2: Storage is sizeable
Under Scenario 1, the direct implication is that there is no possibility for the economy to grow. The intervention can be any one or a combination of the following policies:
a. Increase the rate and magnitude of inflow;
b. Decrease the magnitude and rate of outflow; or
c. Adopt both measures at the same time.
Box 7 – Scenarios When There is Net Storage
M oney F lows in the Local Econ omy
INFL OW T RANSA CTIO NS
• IRA
• Salaries of NG A perso nn el in the lo cality
• OF W Rem itta nces
• Expo rt sales o f lo cal pro duc ts
• Receip ts f rom tou rism / services to ot hers
• Inb ou nd invest men ts
OU TFL OW TRANS ACT ION S
• M un. sh are to Provin ce
• O u tside purch ases o f g overn men t & HHs
• Sch oo l expen ses o f lo cals s tud ying elsew h ere
• Pro fits o f i nvesto rs rem itt ed elsew h ere
• Im po rts o f lo cal bu siness
• Sala rie s p aid to w o rkers in the lo cality w h o live e lsew here
Box 6
MAGNITUDE OF STORAGE
HARDLY ANY STORAGE STORAGE IS SIZEABLESCENARIOS
IMPLICATION N O POSSIBILITY FOR THE ECONOMY TO GROW
NOT A GUARANTEE THAT THE LOCAL ECONOMY WILL GROW*
POSSIBLE INTERVENTIONS
• Increase the magnitude & rate of inflow
• Decrease the magnitude & rate of outflow
• Adopt both measures at the same time
• Encourage local savings
• Promote investments by local savers in the area either in the product ion of goods & services, in distribution & facilitation of consumption & even in financial markets.
* Money that is “stored” does not grow. For it to grow, it must circulate. Money acquires added value every time it changes hands.

CHAPTER 4 – ANALYZING THE DEVELOPMENT SECTORS
102
Under Scenario 2, a sizeable storage of money in the area is not a guarantee that the local economy will grow. Money that is simply “stored” does not grow. For it to grow, it must circulate. Money acquires added value every time it changes hands.
The process of area income multiplication is illustrated in the example shown in Table 14 from A. Bendavid-Val. It assumes an inflow of One Hundred Pesos (Php 100.00) and a forty percent (40%) rate of leakage or outflow. When circulated seven (7) times in the area economy, the original inflow is multiplied two and a half times.
Table 14 – ILLUSTRATION OF AREA INCOME GROWTH
ROUND OF SPENDING
AMOUNT SPENT AMOUNT THAT LEAKS OUT (40%)
AREA INCOME GENERATED
Initial Inflow Php 100.001ST Php 100.00 Php 40.00 Php 60.002ND Php 60.00 Php 24.00 Php 36.003RD Php 36.00 Php 14.00 Php 22.004TH Php 22.00 Php 9.00 Php 13.005TH Php 13.00 Php 5.00 Php 8.006TH Php 8.00 Php 3.00 Php 5.007TH Php 5.00 Php 2.00 Php 3.00
TOTAL Php 250.00 Php 100.00 Php 250.00
Analyzing the Physical and Spatial Base: Infrastructure Sector
The land use/infrastructure sector is concerned primarily with providing adequate physical base for social and economic development.
Because almost all programs and projects that this sector will identify and propose will impact strongly on the use of land and other natural resources, this sector should:
1. be utilized as the organizing concept for locating infrastructure projects the desired urban form or the preferred spatial strategy; and
2. see to it that land and water use zoning shall take into consideration not only the social and economic functions of intended uses but also the potential hazards posed by the environment upon future uses.
In identifying local infrastructure needs, this sector should consider infrastructure support for, among other things:
1. The preferred spatial strategy or urban form. Ask the following questions:
a. Are the roads and circulation networks properly designed?b. Are there land development or redevelopment schemes? c. Is infrastructure development consistent with the preferred urban form?
Public intervention is necessary in investment decisions of private owners of capital lest they concentrate in areas where the perceived return is greatest, i.e., where the “return period” is shortest… The role of the State to effect switches from one form of investment to another is
critical. This can be done by means of fiscal policies and other facilitation measures.

CHAPTER 4 – ANALYZING THE DEVELOPMENT SECTORS
103
d. Is infrastructure development used to influence the location of future population and economic activities in the desired locations?
2. The projected levels of food self-sufficiency and production targets.
a. Are there production support infrastructures such as irrigation systems and farm to market roads, as well as post production support facilities like grain drying, cold storage, and public market facilities to help attain economic objectives?
3. Eliminating current backlogs in the provision of social services. Assess existing school, health, welfare, police and fire protection, recreation, and housing stocks against present demand to determine the shortfall in the provision of these services. Perhaps the filling of these service gaps may be given higher priority than the establishment of new facilities.
4. Upgrading the quality of services and facilities to desired standards. Another dimension of shortfalls is the standard of quality of existing services and facilities. Determine ifexisting roads are not only adequate in terms of total length in relation to the total land area but also if the road surfacing is such that certain sections are rendered impassable during the rainy season. In they are not, there is a serious deficit indeed. Bringing up the quality of existing facilities to desired, if not prescribed, standards is also a matter of priority concern.
5. Reducing vulnerability of the local population to environmental risks and disasters. Some environmental disasters are unpredictable but the severity of their impact depends on the vulnerability of the affected population. Are there ways to reduce vulnerability of thepopulation to environmental risks, e.g. structural measures? Are human settlements located in areas that are out of harm’s way?
6. Maintaining the integrity of the environment.
a. Are civil works properly designed and located to minimize the adverse impact and degradation and to help preserve the integrity of the environment? For example, are there water impoundments, river bank stabilization and similar structures to help modulate the fury of nature and protect it from itself?
Section 17 of the Local Government Code provides a comprehensive list of infrastructure facilities that should be provided by barangays, municipal, city and provincial LGUs. The infrastructure sector shall use this as a template to ascertain the completeness of coverage of the sector and the appropriateness of the programs and projects that they will propose.
Using Map Overlay Analysis in Analyzing the Physical and Spatial Base
Map overlay or sieve analysis is the process of putting two or more thematic maps on top of each other. Use this to:
1. determine areas of convergence of certain features of land contributing to the suitability of the area to a particular purpose, and
2. eliminate or screen out areas that are not suitable for that purpose.
Problem areas or “decision zones” can surface and they should be brought up for resolution by the proper authorities either within the framework of the CLUP or outside of it. This type of analysis can also determine the direction of growth of the built up areas of the locality.

CHAPTER 4 – ANALYZING THE DEVELOPMENT SECTORS
104
Measuring Area Coverage
The supply of land in terms of quantity and quality needs to be assessed because this will indicate to what extent land and other natural resources are an opportunity or a constraint to future development.
To measure land area, the dot grid or planimeter may be used, whichever is available. The use of computers will be an advantage. If there are inconsistencies in land areas, especially pertaining to territorial boundaries of the municipality and the barangays, these should be noted by the political authorities of disputant LGUs, with the aid of cadastral surveys or through inter – agency consultations. Only political authorities and the courts have the power to settle boundary disputes.
Analysis of the Existing Infrastructure Support
1. Assess and evaluate existing systems in relation to the intended population to be served to providing indicators to decision – makers about what alternative actions to be taken with respect to a facility or service such as whether or not to:
a. Freeze the expansion of existing facilitiesb. Extend or expand the existing servicec. Put up new needed facilities
2. Assess the effects and side effects (pre- and post – evaluation of impacts) of infrastructure development. Examples of impact assessment include:
a. Impact on human values and social satisfactionb. Impact on employmentc. Impact on environmental integrityd. Impact on public financial resourcese. Impact on private sector investments
Box 7 CRITERIA FOR ASSESSING EXISTING INFRASTRUCTURES
1. Appropriateness – This can be determined by matching the type of infrastructure available with the level of settlement in which it is located and with the service area and population the facility is intended to serve.
2. Adequacy – This has to do with the capacity and quality of the infrastructure in relation to demand for its use.
3. Level of utility – This refers to the extent to which the facility is put to use.
4. Accessibility – This may be understood in either of these:
a. Physical terms – This refers to either distance or travel time, including travel cost from the user’s point of origin
b. Design and quality of construction of the facility – Flashy and stylish designs and sophisticated equipment are normally associated with high income and high social class clientele and may screen off the low income groups from availing of such services and amenities.

CHAPTER 4 – ANALYZING THE DEVELOPMENT SECTORS
105E. Analyzing the Environment Sector
1. Conduct an Environmental Assessment
Environmental assessment follows the Pressure – State – Response (P-S-R) logic of presentation.
Pressure pertains to the different demands by human society on a given ecosystem for their survival and well – being.
State refers to the existing conditions of the ecosystem as a result of the application of human pressures as well as threats, human and natural, to the very survival of the ecosystem itself.
Response includes existing mitigation, rehabilitation, protection and conservation measures that human society has so far devised to ensure the sustainable use and serviceability of the ecosystem.
Shown in Table 15 are the different ecosystems adopted under the Philippine Agenda for Sustainable Development in the 21st Century (PA 21).
The bulk of functions regarding the environment and natural resources devolved to LGUs have to do with implementation and enforcement of national policies and laws. The main concern of the environment sector therefore is to ensure that the proper measures to safeguard and conserve land, minerals, marine, forest and other resources are enacted by the Sanggunian and enforced by the LCE. For every issue identified in each ecosystem as surfaced in the environmental assessment in connection with the preparation of the Ecological Profile or the Local Development Indicators, there should be an assessment of existing policies or legislations that had been developed to address the issue. The fishbone analysis may be used for this purpose. (Figure 13)
Determine if the LGU:
1. Has existing measures that declare, prevent or abate any nuisance.
2. Requires that buildings and the premises thereof and any land within the LGU territory be kept and maintained in sanitary condition.
3. Regulates the disposal of clinical and other wastes from hospitals, clinics and other similar establishments.
4. Provides for the establishment, maintenance, protection and conservation of communal forests and watersheds, tree parks, greenbelts, mangroves and other forest development projects.
5. Regulates the consumption, use and wastage of water.
6. Regulates the construction, repair, and maintenance of public drains, sewers, cesspools, tunnels and similar structures; construction and use of private water closets, privies, and other similar structures in buildings and homes.
When undertaking environmental assessment, the ecosystem approach,
rather than sectoral, is preferable.

CHAPTER 4 – ANALYZING THE DEVELOPMENT SECTORS
106
7. Provides for an efficient and effective system of solid waste and garbage collection and disposal, and prohibit littering and the placing or throwing of garbage, refuse and other filth and wastes. (Refer to Sections 447, 458 and 468, RA 7160.)
One more concern of the environment sector is to ensure adequate representation of the LGU in the review of environmental impact assessments of proposed projects to be sited in the locality. What are the mechanisms to ensure that this is done?
Another question to ask is if the environmental sector committee able to field the proper experts to sit on behalf of the LGU in the tripartite monitoring teams organized to enforce the conditionalities of the environmental compliance certificates (ECC) issued to environmentally critical projects located in the LGU territory.
Analyzing the Institutional Sector
The Institutional Sector, like the calyx to the flower, coordinates, integrates and supports the other sectors through various mechanisms and arrangements. The principal concern of the sector is to see that the local government officialdom and bureaucracy are properly tooled upand primed up to manage local growth and change.
The analysis focuses on the planning function as an important aspect of governance. The result of this assessment should provide a basis for the formulation of the Institutional Development component of the Comprehensive Development Plan. This assessment will center on the following:
a. Structure and functions of the Local Development Council (LDC);
b. Technical capability of the Local Planning and Development Office (LPDO) to carry out its mandated functions and responsibilities;
Figure 13 - IDENTIFYING LEGISLATIONS
LEGISLATIONNEEDED
NOT EXISTENT ENACT ORDIN ANCE
DEFICIENT IMPLEMENTATION
IMPLEMENTED PROPER LY
NOT IMPLEMENTED
AT ALL
EXISTENT DEFECTIVE
STILL SOUND
INADEQUATE
REPEAL
AMEND
REPLACE
STRENGTHEN IMPLEMENTING
AGENCY
INCREASE SANCTIONS FOR
VIOLATORS
STRENGTHEN IMPLEMENTING
AGENCY
REPLACE

CHAPTER 4 – ANALYZING THE DEVELOPMENT SECTORS
107
Table 15 - Ecosystems and Subsystems
FOREST ECOSYSTEM LOWLAND/ AGRICULTURAL
ECOSYSTEM
URBAN ECOSYSTEM FRESHWATER ECOSYSTEM
COASTAL ECOSYSTEM
MINERALS / MINING BIODIVERSITY
1. Protected Foresta. Primary growth,
closed canopy, virgin
b. Second growth with <50% slope or >1,000 elevation
1. Croplandsa. Cereals (food
and feed crops)b. Other food cropsc. Industrial or
cash crops
1. Built – up Areasa. Residentialb. Commercialc. Industriald. Institutionale. Utilities and
infrastructures
1. Surface watersa. Riversb. Lakesc. Reservoirsd. Other
impoundments
1. Mangroves2. Marshes, swamps
and wetlands3. Sand dunes4. Seagrass beds5. Small islands, atolls6. Coral reefs
1. Metallic mineralsa. Base metalsb. Precious metals
2. Non – metallic mineralsa. Sand and gravelb. Rock quarryc. Marble quarryd. Coal mininge. Guano
1. Wild flora2. Wild fauna
a. Endimicityb. Rarityc. Threatenedd. Endangered
2. Production forestc. Residual
dipterocarpd. Rangelands or
grazing landse. Integrated forest
management areas
f. Community –based forest management areas
g. Multiple use zones and buffer zones in NIPAS areas
2. Livestocka. Beef, cattle and
dairyb. Poultry and
piggery
3. Fisheriesa. Fishpondsb. Fishpensc. Catch fisheries
2. Urban Wastesa. Solidb. Liquidc. Hazardous
3. Air Pollutiona. Mobile sourcesb. Stationary
sources
2. Groundwater

CHAPTER 4 – ANALYZING THE DEVELOPMENT SECTORS
108
c. Fiscal management capability of the LGU;
d. Development orientation of the Sanggunian as evidenced by their legislative output;
e. Extent of representation and participation in local governance of non – government sectors; and
f. Vertical and horizontal linkages of the LGU with other government agencies.
Guide Questions for Characterizing the Institutional Sector
1. On the Organizational Structure and Functions of the LDC
a. Is the organization of the LDC in accordance with the provisions of Sections 106 –108 of the Local Government Code (LGC)?
b. Are the functions of the LDC being exercised by the Council as mandated in Section 109 of the LGC?
c. Is there an Executive Committee created according to Section 111?
d. Are there Sectoral or Functional Committees as called for in Section 112?
e. Are all these bodies functioning properly?
f. Are there any deviations from the mandated structure and functions?
2. On the Functions of the LPDO
a. Are the functions and responsibilities of the office clearly defined and delineated so that overlaps with other offices are avoided or minimized?
b. Are there other functions performed by the LPDO which are outside of its mandate?
c. Whether mandated or not, are these functions consistent with the traditional functions expected of a local planning office, vis-à-vis long – and short – term planning, land use control and regulation, research and planning data base management, project impact monitoring and public information?
3. On the Organizational Structure and Staffing of the LPDO
a. What is the position of the LPDO within the organizational framework of the LGU? Does it reflect the value and importance of planning among local government functions? Draw an organizational chart of the LGU.
b. How accessible is the LPDO to the political authorities and the communities?
c. How large is the LPDO personnel complement according to the plantilla? Does the size permit an internal structure with differentiated functions?
d. If there is already an organizational structure, what is the basis of dividing the office into sub – units? Does the structure adequately cover the functions of the office? Draw an organizational chart of the LPDO.
e. Are the plantilla positions filled with personnel with the appropriate qualifications? If not, why? What critical vacancies exist?

CHAPTER 4 – ANALYZING THE DEVELOPMENT SECTORS
109
4. On the LPDO’s Relationships
a. Does the LPDO enjoy the confidence of the mayor or administrator? If not, what are the possible reasons?
b. Is the LPDO able to provide technical support to the LCE in certain aspects of decision – making?
c. How effectively is the LPDO providing technical and secretariat support to the LDC?
d. In what ways does the LPDO provide support to the local legislative council?
e. How does the LPDO interact with the heads of line departments of the LGU?
f. Describe the LGU’s relationship with non-government organizations, the private sector, and other people’s organizations.
5. On the Fiscal Management Capability of the LGU
a. What is the fiscal balance of the LGU for the last three years? Is the LGU operating on a balanced budget or on deficit spending?
b. What is the level of self- reliance of the LGU? Does it show an upward or downward trend for the last three years?
c. What are the top sources of local revenues? Are these sources being tapped optimally?
d. What is the pattern of local expenditures? Does the LGU keep within the limits prescribed by law?
e. What is the record of the LGU in terms of debt servicing? Does it incur arrearages?
f. What part of the budget goes into development investment?
g. Is there a private investment incentive ordinance in the LGU?
6. On the Development Orientation of the Sanggunian
a. What is the total output of the Sanggunian since the start of its term? Of this body of legislative output how many are ordinances and how many are resolutions?
b. Of these resolutions and ordinances, how many are (or what is the proportion of) intended to maximize utilization of local resources? How many are purely for “socializing” purposes? How many deal with regulating certain activities and land use? A tabular presentation will be helpful.
c. Does the Sanggunian consult the plan or the planning bodies when crafting legislation? Do the Sanggunian members make an effort to join sectoral and functional committees of the LDC?
d. Are the Sanggunian sessions open to the public? Are the views of ordinary citizens sought actively as inputs to the legislative process? How?

CHAPTER 4 – ANALYZING THE DEVELOPMENT SECTORS
110
7. On Non-Government Sector Participation
a. Is the mandatory representation of non-government sectors in the LDC properlycomplied with?
b. Is there an effective accreditation process of NGOs/POs represented in local special bodies?
c. Are there opportunities for participation in local governance of non – government sectors whether accredited or not, whether organized or not?
d. Is there a working definition of the private sector, NGOs and Pos? Is the definition accepted by all? Are the distinctions important?
8. On Inter-Government Relations
a. Are national agencies operating locally coordinating with the LGU in the implementation of their programs and projects? Do they comply with the Codal provision on mandatory consultation?
b. Are the barangays effectively involved in all aspects of local governance?
c. Is there effective coordination by the LPDO of all sectors, LGU departments, andnational agencies in planning, programming, budgeting, implementation, and monitoring and evaluation?
What other tools can be used to characterize and analyze the Institutional Sector?
1. The Community-Based Monitoring System (CBMS)
a. Disaggregated data on poverty at individual and household levels – The CBMS as a system has the ability to generate information on poverty at smallest geopolitical unit. It can provide socio-economic information at the individual and household levels that are disaggregated by barangay, municipality and province. This can be useful in the comparative analysis of data between one planning unit vis-à-vis another, i.e.,municipality with higher and/or lower level LGU, allowing an appreciation of the differences between these areas with respect to certain indicators or attributes.
b. Input to social clustering of population – The CBMS is useful in describing the poverty situation at the individual and household level. The indicators related to income for example can contribute to the clustering of the population based on household income. The implication of such clustering may be viewed as a potential cause of extreme polarization of the local space and society if left unaddressed.
c. Status of well-being of the population. The CBMS adopts either output or outcome indicators such as child morbidity rates, malnutrition rates, educational attainment and participation rate. These indicators can provide a direct, more accurate and meaningful measure of well-being. In addition, the household income has been added as a good catch-all indicator of well-being because it shows whether or not a family can afford the goods and services that the members need for sustaining a good quality of life. The information generated and analysis derived using CBMS does not only regard the community population as a whole, but more importantly it can mirror the status of well being of its members. CBMS-generated data can guide the LGUs in their decisions to address poverty by developing specific interventionsfor identifiable target beneficiaries in particular locations.

CHAPTER 4 – ANALYZING THE DEVELOPMENT SECTORS
111
2. The Local Governance Performance Management System (LGPMS) – It enables provincial, city and municipal governments to determine their capabilities and limitations in the delivery of essential public services. (LGPMS User’s Guide, p.1) The output of LGPMS is called the State of Local Governance Report or SLGR. The SLGR, which is prepared annually, is a narrative account of all the findings of the study based on the input and output indicators identified in the five service areas considered, namely: Social Services, Economic Services, Environmental Protection Services, Legislative Services and Governance & Administrative Services.
By using the Display Data Utility of the LGPMS Reports Generation Module, the actual status of an LGU, as well as the level of its performance pertaining to that indicator against national standards given a particular indicator, is determined. The LGU may therefore use relevant LGPMS data to add qualitative dimension to the statistical data in the ecological profile. As a direct input to the LDI System, LGPMS-generated information also allows the process of making further observations and exploring the implications of these observations.
For example, under the Health and Nutrition service area of the Social Services performance area one of the outcome indicators is the percentage of malnourished children. This is defined as the “percentage of moderately or severely underweight children aged 0-5”, represented by the formula:
10050_____
50___ln__x
agedchildrenofnumberTotal
agedchildrenourishedmaofNumber
Also, by using the Display Data utility of the LGPMS Reports generation module, the raw data (number of malnourished children and total number of children aged 0-5) and the result (actual percentage of malnourished children) can be seen. In addition, though, LGPMS assigns the LGU a performance level value based on the computed percentage vis-à-vis certain defined standards, to wit: 5 (very high) – 0-1%; 4 (high) – 2-4%; 3 (medium) – 5-10%; 2 (low) – 11-15%; and 1 (very low) – 16-100%1.
Thus, the LGU is able to see not only the raw data and result for a given indicator, but is able to gauge its level of performance pertaining to that indicator as against national standards. For instance, while a five percent malnutrition rate may seem acceptably good for some LGU planners and policy-makers, the LGPMS performance level value associated with that figure (3 or medium) would indicate that the said figure is still not that high by national standards.
The LGU may also use an indicator’s performance level value to compare itself with other LGUs (vis-à-vis the provincial or regional average, for instance) to see its own relative standing
The advantage of deriving issues from LGPMS results is that the issues surfaced are based on largely verifiable data that relate to the general welfare mandate of LGUs, rather than being mainly based on perceptions that may be subjective and highly “political”.
1 The LGPMS rating schemes for the different indicators can be found in the LGPMS technical notes.
The LGPMS has the ability to add qualitative dimension to statistical quantities generated in the system.

CHAPTER 4 – ANALYZING THE DEVELOPMENT SECTORS
112
3. The System for competency Assessment for Local Government (SCALOG) – It is a self-assessment tool to promote continuous improvements in local government units through the identification of organizational strengths and areas for development that can be addressed through capacity building efforts.(Manual of Administration of SCALOG, p.3) .
The SCALOG Tool measures the organizational competencies of an LGU using a 5-point rating scale of the various performance indicators of the fourteen (14) service areas spread over the five (5) LGPMS performance areas. (LGPMS Users Manual)

CHAPTER 2 – SETTING SECTORAL GOALS
113
PART II – PREPARING THE COMPREHENSIVE DEVELOPMENT PLAN
CHAPTER 4 – SETTING SECTORAL GOALS, OBJECTIVES AND TARGETS
Goal formulation or the process of determining what the people want their city or municipality to become is often considered the most important step in the planning process. A badly conceived goal cannot lead to a good plan. Worse, without goals, any move that people make is at best only an aimless rambling, a directionless locomotion.
2.1 What are goals?
Goals are the translation of an organization’s vision into more concrete and measurable terms. They are simply clearer statements of visions that specify the actual accomplishments that need to be achieved if the vision is to become a reality. They are the end toward which design or action tends.
2.2 What are sectoral goals?
Sectoral goals are the desired end – results that are the same, or derived from, the particular element of the vision statement that pertains to a specific sector. Such consistency is necessary to ensure that every policy and action (programs, projects, activities, legislative and other regulatory measures) formulated in the CDP will contribute to the realization of the vision.
2.3 What is the importance of goals in planning?
Goals serve at least three (3) purposes in the planning process:
1. As an end toward which all future actions specified in the plan are directed.2. As a set of criteria for evaluating alternative strategies and approaches3. As a standard against which the success or failure of each action is measured.
2.4 What are the sources of development goals?
1. Universal concept of Public Interest - This is a broad concept that can be broken down into smaller components such as the following:
a. Public health and safety – This can be promoted in at least two ways in the plan:
i. Regulations, or prevention of conditions injurious or hazardous to the physical well – being of the community;
ii. Developmental measures or provision of services and facilities for the promotion of improved health and safety by planning for and building them into the physical environment.
b. Convenience – This is a function of the circulatory system, i.e. the proper positional arrangements and relationships between and among different land uses, and varying intensities of land development so that the movement of goods and people that they generate and attract is on the whole, efficient.
IF YOU KNOW WHERE YOU’RE GOING, YOU WOULD KNOW HOPE BEST TO GET THERE, AND HOW NEAR OF FAR YOU ARE TO THAT DESTINATION AT ANY POINT IN TIME

CHAPTER 2 – SETTING SECTORAL GOALS
114c. Economy – This is related to convenience in the sense that while convenience
pertains to physical ease of movements, economy translates physical ease to efficiency or the least costly way of carrying out one’s activities.
d. Environmental amenity – This pertains to the pleasantness of the environment as a place in which to live, work and to spend one’s leisure time. It refers to the perceptual aspects of the surroundings, their aesthetic appeal to the eye and the other senses.
2. The General Welfare Goals – Section 16 of the Local Government Code (RA 7160) mandates LGUs to promote the general welfare, which it defines in a manner that represents an expanded version of the public interest.
There is, however, no direct fit between the nine (9) general welfare goals and the five development sectors. Success indicators for each general welfare goal can be the concern of more than one development sector.
For example:
For General Welfare Goal No. 4 – “Encouragement and support of appropriate self –reliant technology”, the success indicators identified can be distributed to the different development sectors as shown in Table 16:
Table 16 - Sample of Finding the Development Sector for Success Indicators
Success Indicators Development Sectora. Technical / vocational schools established Economic Support Infrastructureb. Complete coverage /adequate supply of electric power Infrastructure – Urban Utilitiesc. Technology research and dissemination program for the use of indigenous
resources and the reuse of recovered waste materials consistently pursued.Economic and social sectors
d. Research and development programs for new products and processes Economic Developmente. Indigenous property rights protected Social Developmentf. Native ingenuity recognized Social Developmentg. Regulated use of biotechnology Environmental Sectorh. Linkages between academe and industry established Economic Sector
Box 8GENERAL WELFARE GOALS (Section 16, RA 7160)
1. Preservation and enrichment of culture
2. Promotion of health and safety
3. Enhancement of the right of the people to a balanced ecology
4. encouraging and supporting the development of appropriate and
self – reliant scientific and technological capabilities
5. Improvement of public morals
6. Enhancement of economic prosperity and social justice
7. Promotion of full employment
8. Maintenance of peace and order
9. Preservation of comfort and convenience

CHAPTER 2 – SETTING SECTORAL GOALS
115
General Welfare Goals Most Relevant to the Social Sector:
a. preservation and enrichment of culture,
b. promotion of health and safety, and
c. maintenance of peace and order.
General Welfare Goals Most Relevant to the Economic Sector:
a. encourage and support the development of appropriate and self-reliant scientific and technological capabilities,
b. enhance economic prosperity, and
c. promote full employment among the local residents.
General Welfare Goal Most Relevant to the Environment Sector:
a. enhance the people’s right to a balanced ecology.
General Welfare Goal Most Relevant to the Land Use/ Infrastructure Sector, include but not limited to:
a. Enhancement of economic prosperity
b. Promotion of health and safety
c. Preservation of comfort and convenience among the residents
3. Regional Physical Framework Plans (RPFP) – These are another source of long – term goals. The general goal of each RPFP is to “achieve such a spatial arrangement and location of land use activities that would:
a. effect rational distribution of the population;
b. guarantee access by the population to basic services;
c. ensure optimum sustainable utilization of resources, and
d. protect the integrity of the environment.”
These are very general and timeless goals that probably are acceptable to the widest spectrum of society. But they should be restated in terms more appropriate to the local area.
4. National Policies - The following NFPP goals or vision and principles may be adopted by local areas but they must be rephrased to reflect the conditions and circumstances at local levels.
a. NFPP (2001 – 2030) Vision: National development anchored on sustainable development and growth with social equity.
b. NFPP Principles

CHAPTER 2 – SETTING SECTORAL GOALS
116i. Food security. Provision of sufficient and affordable food products to all
Filipinos through local production and/or importation.
ii. Environmental stability or ecological integrity. Observance of appropriate standards in natural resource management and balancing the demands of production with the need for preservation of ecosystems.
iii. Rational urban development. Encouraging the sustainable growth of cities and large towns and complementing the growth of rural areas by adopting alternative urban development approaches.
iv. Spatial integration. Linking consumption and production areas to achieve physical and economic integration through appropriate infrastructure systems.
v. Equitable access to physical and natural resources. Providing just distribution of, and equal access to opportunities by all Filipinos in the use and acquisition of land and other resources.
vi. Public-private sector partnership. Encouraging shared responsibility between government and the private sector in the development and management of the country’s physical resources.
vii. People empowerment. Establishing pragmatic, appropriate, flexible and dynamic structures or mechanisms that involve the participation of key stakeholders.
viii. Recognition of the rights of indigenous people. Ensuring the indigenous people’s rights to develop, control and use lands within their ancestral domain.
ix. Market orientation. Adopting the interplay of market forces within the framework of ecological and intergenerational factors as a basic parameter in the allocation or use of land and physical resources.
5. Local Communities – The ultimate source of development goals for local communities should be the local residents themselves. These goals are derived by means of participatory processes. Although the final form in which these goals will be stated is for planners to determine, planners should be careful not to substitute their own values and perceptions for those articulated by the people
2.5 When are goals formulated?
For all intents and purposes the formulation of sectoral goals starts with the visioning workshop where the different groups (corresponding to the development sectors) generated descriptors for their assigned vision element and success indicators for each descriptor generated
2.6 How are goals formulated?
There are various approaches to goal formulation:
a. The planner’s or the technocrat’s goal technically derived proceeds from a thoroughanalysis of the problems and issues using the following formula:

CHAPTER 2 – SETTING SECTORAL GOALS
117
Problem = Goal + Impediments to achieve the Goal
Therefore: Goal = Problem – Impediments
This approach to goal formulation is often branded as “table planning”. In application, it is similar to the practice of deciding to produce a certain product on the basis of solely market trends and forecasts, without considering consumer taste and preferences.
b. Another form of technocrat’s goal follows the dictum that a “Goal is the inverse of a problem”. It is uses the following formula:
Looking back to the vision – reality gap, treat the gaps as problems. Then, invert or negate the problems to become goals as illustrated in Figure 14.
Figure 14 – Sample Problem Tree Transformed into Policy Tree
Squatting continues to
exist
Some settlements still exposed to
environmental hazards
Children/ youth play in the streets
High dependence on paid indoor recreation
Corruption prevalent
Incidence of drug abuse
Ad hoc approach to housing concerns
Indigent families not adequately
served
No scholarships for indigent students
Low –level appreciation for local culture & arts
Loss of cultural artifacts
Absence of permanent
housing body
Existence of many private hospitals
Most pre-schools & all colleges are privately-owned
Limited space for public recreation
Weak promotion of culture & arts
Weak moral values
SOCIAL ISSUES NOT ADEQUATELY ADDRESSED
Squatting stopped
Settlements located in hazard-free areas
Playgrounds provided for children/youth
Reduced dependence on paid indoor recreation
Corruption stopped or minimized
Drug abuse eliminated
Housing concerns addressed regularly
Indigent families adequately served
Scholarships offered to indigent students
Heightened appreciation for local culture & arts
Cultural artifactspreserved
Permanent housing body created
Existence of public & private hospitals
Public & private pre-schools & colleges established
Ample space for public recreation
Sustained promotion of culture & arts
Strong moral values
SOCIAL ISSUES ADEQUATELY ADDRESSED
1GOAL = Problem

CHAPTER 2 – SETTING SECTORAL GOALS
118
VISION – REALITY GAP ANALYSIS
GAPS IDENTIFIED / CONDITIONS OBSERVED
EXPLANATIONS OR CAUSES
IMPLICATIONS WHEN UNRESOLVED
POLICY OPTIONS
Figure 15GAPS TO GOALS: LOGICAL FRAMEWORK
c. Goal formulation may also be undertaken using the long method, where the Issue-Driven Planning Process (Figure 16) is used as a framework following these steps:
i. Determine the vision-reality gap. Consider the gaps as issues or “observed conditions”
ii. “Extract” intelligence
iii. Formulate policy options
iv. State policy options in the form of goal statements
• Sectoral Profiles/ Studies
Development Indicators
Issues/ Observations (Creating New Information)
Extracting Intelligence
ExplanationsImplications
Strategy Options
Directed to Cause
Directed to Positive Effects
Directed to Negative Effects
Sectoral Goals
Sectoral Goals
Sectoral Objectives/ Targets
Policy Responses
Programs/ Projects
Non-Projects/ Services
Legislations
National Local
Figure 16 - ISSUE-DRIVEN SECTORAL PLANNING PROCESS
National
Local
Private Sector
NGAS
LDIP
LDC/ SANGGU

CHAPTER 2 – SETTING SECTORAL GOALS
119
2.7 What is the vision – reality gap?
The vision-reality gap is the “space” or “distance” between the desired state of the area by sector, and the current situation of the sector/s. Once you know exactly where and what the gaps are, you can identify the necessary actions to close the gap. Gap analysis gives policy makers in the LGU the information they need to make better informed decisions when identifying priority areas for intervention.
2.8 How is a vision – reality gap determined?
A vision – reality gap is determined by conducting a vision – reality gap analysis. This type of analysis shows:
a. how large the difference is between the vision or ideal state of the LGU and the existing situation; or
b. how near the current situation in the city or municipality is to the vision as defined by the constituents and the LGU.
It takes off from the results of the visioning exercise and the data generated in the ecological profile and the Local Development Indicators.
The vision – reality gap may be expressed qualitatively or quantitatively. Ratings, as shown in the Current Reality Rating Scale (Table 17) can be assigned to describe the degree of attainment or non-attainment of a particular vision element vis-à-vis the success indicators assigned to each descriptor by vision element.
Table 17 - Current Reality Rating Scale
Rating Interpretation
0 Absolutely nothing has been done about the goal
1234
Something is already being done to achieve the goal but the level of attainment is still on the low side
5 The goal is half accomplished
6789
Goal is more than half-fulfilled but still short of full attainment
10 The goal is completely attained
N No data available
From the vision desciptors and success indicators identified in the visioning exercise, ratings can be assigned to describe the degree of attainment or non-attainment of a particular vision element
For example:VISION ELEMENT DESCRIPTORS SUCCESS INDICATORS
Local Governance Decent Competent and professional local officials and personnel Effective and efficient bureaucracy Morally upright government workers

CHAPTER 2 – SETTING SECTORAL GOALS
120If sectoral studies on the Institutional Sector show that there is an inequitable distribution of LGU manpower because some offices are overstaffed while others are understaffed; and that graft and corrupt practices are still prevalent, a rating of “1” may be given for the success indicator “Competent and professional local officials and personnel”. It shows that the vision – reality gap is that wide – 9 points in a 10 – point scale. This means that very little, if at all, has been achieved of the vision of a decent local bureaucracy.
Table 18 - SAMPLE MATRIX: VISION-REALITY GAP ANALYSIS
A. Social Goals
Descriptor Success Indicator Rating Interpretation
Healthy Child mortality rate 0 Child mortality rate is increasing during a six year period
Maternal mortality rate 5 50% reduction in maternal mortality rate
B. Economic Goals
Descriptor Success Indicator Rating Interpretation
Vibrant economy
Number of new investments 8 New investments have more than doubled
Another way of determining the gap is to deduct the current rating from the desired rating.For example, the LGU envisions a 100% reduction in malnutrition rate. If the current situation shows that the malnutrition rate is, say, 40%, then the LGU still has to exert more efforts to totally wipe out malnutrition.
2.9 How can other stakeholders participate in the goal formulation process?
There are various ways of eliciting people participation in the goal formulation process. Each has its positive and negative points as shown in the table below:
Table 19 - Advantages and Disadvantages of Methodologies for Participatory Goal Formulation Process
METHODOLOGY ADVANTAGE DISADVANTAGE
Household survey Can reach people directly Requires more manpower and logistics to undertake; can elicit narrow and parochial concerns from respondents.
Barangay consultations More efficient because they involve only representatives of people and sectoral groups; few contiguous barangays can be batched together; allow participants to join in discussions of issues
Can elicit narrow and parochial concerns from participants
Seminar - workshops More systematic and purposive; more selective in terms of participation; have better quality of outputs
Lack of direct participation of the community

CHAPTER 2 – SETTING SECTORAL GOALS
121
2.10 What are objectives and targets?
Objectives and Targets are more specific statements of a short or medium-range desired outcome or result. They are definite about the point to be reached or target to be achieved given the constraints of resources and time.
Objectives and targets should be specific, measurable, attainable, realistic, and time-bound (S-M-A-R-T).
For example:
For the goal, “To develop a competent and professional LGU officialdom and personnel as shown by an effective and efficient bureaucracy and morally upright government workers..”, perhaps what can be done in the next 3 years is limited to reforming the bureaucracy to increase its effectiveness and efficiency. In addition, recruitment of new staff may be improved. The goal of having morally upright elective officials however, cannot be achieved in 3 years because it entails not only electoral reforms but also social and moral reforms among the electorate.
Using the illustration above, some of the examples of objectives/targets are listed below:
1. To conduct an organizational and management review of the entire local government bureaucracy during the first year of the current administration.
2. To restructure the organization of key offices on the last quarter of the first year based on the findings of the O&M study.
3. To improve the recruitment policy to put emphasis on the moral uprightness of potential appointees during the first quarter of the second year.
4. To conduct moral recovery seminars among LGU employees at least once every quarter.
The sectoral objectives and targets, when properly formulated will themselves suggest the appropriate programs and projects needed to carry them out.
2.10 What is the function of Community – Based Monitoring System (CBMS) in goal and objective setting?
The analysis of CBMS results makes way for the identification of goals that are more aligned with the general welfare provisions of the LGC, setting of more focused objectives and sector-specific and spatially oriented targets.
2.11 What is the function of Local Governance Performance Monitoring System (LGPMS) in goal and objective setting?
The LGPMS contains 107 indicators that correspond to the performance and service areas. Classified into input, output and outcome indicators, they can serve as convenient and practical ways of measuring the desired results based on the goals and objectives set. The annual “movements” of these indicators can serve as an objective basis for setting or adjusting annual targets to make them responsive and realistic. The “rating schemes” under this system can also be used as a reference for defining goals, objectives and setting targets. These are quite useful as it sets definitive quantitative and qualitative parameters that relate to certain national standards, thereby helping make targets more meaningful and relevant.

CHAPTER 2 – SETTING SECTORAL GOALS
122For example, the LGU may have pinpointed “poor infant and child health conditions” as one of the priority issues/problems to be addressed in its CDP. Thus, one of the CDP objectives under the Social Development sector would probably be “Improvement of infant and child health conditions.” If the particular manifestations of the problem situation include, for instance, high infant mortality rate, high malnutrition rate among 0-5 age group, and low child immunization rate, the targets for the objective would relate to these specific concerns.
2.12 What other tool can be used in the development of goals and objectives?
A specific tool that can be used in the development of goals and objectives is the objectives analysis. Objectives analysis is a tool in which the hierarchy of problems is transformed into a hierarchy of objectives. It utilizes a diagram called objectives tree that identifies means-ends relationships between and among the objectives. The objectives tree describes the scenario after solving the problems. (See sample in Figure ____)
Figure ___ Sample Objective Tree of Deteriorating Forest Condition
FOREST COMMUNITIESORGANIZED
LIVELIHOOD PROJECTS PROVIDED
KAINGIN PRACTICES PREVENTED
CONTROL OF SMALL SCALE MINING
REDUCED DAMAGE TO CROPS
REDUCED FLOODING
REDUCED SILTATION
REDUCED OVERFLOW OF RIVERS
MINIMIZED SOIL EROSION
IMPROVED FOREST CONDITION
CONTROL OF SMALL SCALE
MINING
KAINGIN PRACTICES PREVENTED
FORST COMMUNITIES ORGANIZED
LIVELIHOOD PROJECTS PROVIDED
END
SM
EAN
S
CORE OBJECTIVE

123
PART II – PREPARING THE COMPREHENSIVE DEVELOPMENT PLAN
Chapter 5 – Transforming Goals into Actions
Once the sectoral objective and targets are formulated, the identification of policy responses will also be clear – cut and uncomplicated. It is the next step in the planning process where the means by which the desired results are achieved will be identified.
3.1 What are policies?
Policies are guide to actions to carry out the objectives or achieve the targets. Policies can take the form of:
a. regulatory measures (legislation) or b. programs, projects, activities and c. services
Programs and projects, complemented by appropriate regulatory measures complete the array of government interventions that effect or affect development in the LGU.
3.2 What are regulatory measures?
Regulatory measures may take the form of resolutions or ordinances enacted by the Sanggunian or executive and administrative orders issued by the Local Chief Executive. They should be taken in both their positive and negative dimension.
a. Positive regulation involves giving encouragement and rewards for acts that are socially desirable and those that help promote the general welfare.
Example: Private investments Taxation - positive to the general populace to whom the benefits of improved
services accrue
b. Negative regulation entails prohibiting and penalizing some acts deemed inimical to public interest.
Example: Taxation – negative to those whom the assessment falls due.
3.3 What are programs and projects?
A program is a cluster of projects. It comprises the operational components of a long-term plan. It defines a particular clientele and their priority needs and breaks down the strategic decisions in a plan into different components or projects which are tactical or short-term in nature. (See Figure 11 - Hierarchy of Actions) sometimes synonymous with project, it may cover a period of three (3) to six (6) years.
A project is a cluster of activities. It is a specific but complex effort consisting of interrelated activities performed by various functional units and specialists. Sometimes synonymous with program, a project has a well-defined objective, a definite schedule, and a set budget. It may cover a period of one (1) to three (3) years.

124
Figure 11 - HIERARCHY OF ACTIONS
PLAN
PROGRAM 2PROGRAM 1 PROGRAM 3
PROJECT 1 PROJECT 2 PROJECT 4 PROJECT 5PROJECT 3
ACTIVITY 3ACTIVITY 2ACTIVITY 1 ACTIVITY 4 ACTIVITY 5
TASK 3TASK 2TASK 1 TASK 4 TASK 5
An activity is a cluster of tasks. It is a very short-term effort performed by one or several members of a project team or of an office or organization.
Some activities must be completed before the project can move on; other activities can either be done simultaneously or lie in wait as other tasks go on.
An activity may last from one week to one year.
Programs and projects are the bases for determining the level of public investments needed to be appropriated for in the LGU’s annual budget.
The outputs and outcomes of implemented programs and projects will:
1. Improve the quantity and quality of public services.2. Increase the stock of physical infrastructures.3. Directly or indirectly, attract or leverage desired private investments.
A task is a purposive combination of psychomotor actions or motions leading to the accomplishment of an activity. A task may take a few minutes to a few months to complete.
What is a service or “non-project”?
Services or “non – projects” are interventions that can be included among the regular functions of a given office to be performed by the regular stag of that office using its existing facilities and budget. These interventions need not be included in the LDIP but are carried out through the maintenance and other operating expenditures (MOEE) of the relevant offices or departments.
There are, however, possibilities under which a service or “non – project” may be upgraded into a project as shown in the figure below:

125
Figure 12 – Upgrading a Non-Project” into a Project
Table 20 shows the conceptual difference between programs/projects and service /”non –projects”.
Table 20 - PROGRAMS / PROJECTS VS. SERVICES / NON-PROJECTS
PROGRAMS / PROJECTS NON-PROJECTS / SERVICES1. Specific life cycle. 1. Continuous life from year to year.2. Definite start and completion points, with calendar
dates.2. No specific event tied to calendar dates other than
fiscal year budgets.3. Can be abruptly terminated if goals are not met, always
terminated when program/ project is completed.3. Assurance of continued function, even in a major
reorganization.4. Often unique, not done before, not repeated when
completed.4. Usually involves performance of well-established
functions and tasks are only slightly different from past efforts.
5. Total effort must be completed within fixed budget and schedule.
5. Maximum work is performed within the annual budget ceiling.
6. Prediction of ultimate time and cost is difficult. 6. Prediction of annual expenditures is relatively simple.7. Involves multi-disciplinary skills from different
departments or organizations which may change from one life cycle to the next.
7. Involves one or a few closely-related skills and disciplines within one well-defined and stable organization.
8. Rate and type of expenditures constantly changing. 8. Relatively constant rate and type of expenditure.9. Basically dynamic in nature. 9. Basically steady-state in nature.
3.4 Where can programs/ projects, services and legislations be derived?
One good source of programs / projects/ services and legislation is an objective or policy tree that had been transformed from a problem tree. (See Figure13)
In this example, which addresses the Millennium Development Goal 1 (Eradicate extreme poverty and hunger), it is obvious that once households, particularly farming households, have adequate incomes, effects like higher educational attainment, reduction in malnutrition, access to safe water and sanitation will be assured. But how to increase household incomes is the subject of program / project intervention.
Is there a definite output to be produced?
Is time of the essence in producing the
output?
Is the activity likely to be repeated in the next 3 years?
YES YES YES UPGRADE
NO NO YESRETAIN AS REGULAR SERVICE
YES YES NO UPGRADE
Break down into activities
Match with available office MOOE

126
Figure ___SAMPLE OBJECTIVE TREE
Note that there are at least three approaches or strategies to increasing farming household incomes:
1. increasing farm yields;
2. ensuring better prices of farm produce; and
3. providing alternative livelihood services.
Each strategy has its own set of program components and for each program any number of project and services components can be identified. (See table below.)
Table 21 – Sample Strategy, Program/Projects, Services and Legislations
Strategy Program Projects/Services
1. Increased farm yield 1.1 Put up post-harvest facilities1.1.1 Construct mechanical dryers1.1.2 Install solar dryers1.1.3 Put up storage facilities1.1.4 Encourage investments in processing plants
1.2 Install irrigation systems1.2.1 Gravity irrigation1.2.2 Communal irrigation1.2.3 Improve market infrastructure
2. Better prices of farm produce
2.1 Competitive pricing by traders2.1.1 Encourage competition2.1.2 Regulate prices2.1.3 Improve market infrastructure
3. Alternative livelihood services available
3.1 Higher educational attainment3.1.1 Offer short courses on entrepreneurship3.1.2 Skills training on non-farm trades and crafts3.1.3 Adult education project
3.2 Attract investors into the local area
3.2.1 Encourage formation of cooperatives3.2.2 Offer local tax breaks3.2.3 Improve transport and communication
facilitiesNote: Items in italics are either services/non-projects or require regulatory measures.
Educational attainment raised
Malnutrition reduced Access to safe water assured
HHs equipped with sanitary toilets
ADEQUATE HH INCOME
Increased farm yield Better prices of produce
Alternative livelihood services available
Post-harvest facilities put up
Irrigation system cionstructed
Competitive pricing of traders
Investors attracted

127
3.5 What other tools can be used for identifying policies, programs and projects?
The CBMS and LGPMS-generated analysis of the community and LGU’s situation can provide the bases for identifying programs, projects, policies and strategies for development.
CBMS-suggested tools in diagnosing and locating poverty may be used in identifying appropriate interventions to address certain poverty issues in specific areas for specific target beneficiaries.
The data generated from CBMS can also be used in developing evidence-based policy and similar interventions. Programs and projects as well as legislative measures can constitute a significant component of the CDP or the ELA of the LGU.
The LGPMS information are useful in guiding the incumbent elective local officials and other stakeholders in the process of prioritizing programs and projects including legislative measures, and in getting their commitment to support the implementation of these priorities. The results from the latest cycle of the LGPMS, for example, can be used as a point of reference in the prioritization of issues, formulation of objectives, firming up of targets.
1
001 1 00 10 10 10 11 01 0 001 0 100 1 011
Tab le 22 - DISTINGUISHING PROJECT FROM NON-PROJECTS AND LEGISLATIONS: An Example
Projects/Services/Legislation PROJECT SERVICE LEGISLATION
1.1.1 Develop gravity irrigation
1.1.2 Install communal pump irrigation
1.1.3 Increase water yield of aquifer
1.1.4 Promote use of certified seeds
1.2.1 Construct mechanical dryers
1.2.2 Regulate use of streets as solar dryers
1.2.3 Put up storage facilities
1.2.4 Encourage investments in processing plants
2.1.1 Encourage competition
2.1.2 Regulate prices
2.1.3 Improve market infrastructure
2.2.1 Install internet-based access to commodities market

CHAPTER 3LOCAL DEVELOPMENT INVESTMENT PROGRAMMING
128
PART III – IMPLEMENTING THE PLAN
Chapter 1 - Local Development Investment Programming
1.1 What is the Local Development Investment Program (LDIP) and the Annual Investment Program (AIP)?
The Local Development Investment Program (LDIP) is the principal instrument for implementing the Comprehensive Development Plan. It is a document that translates the CDP into programs and projects and selects those that will be picked up by the LGU for funding in the annual general fund budget or through special fund generation schemes.
As provided for under Joint memorandum Circular No. 001 series of 2007, issued by the DILG, NEDA, DBM and DOF, the Annual Investment Program (AIP) is defined according to purpose:
1. For planning and investment programming purposes, it is the annual slice of the LDIP, referring to the indicative yearly expenditure requirements of the LGU’s programs, projects and activities (PPAs) to be integrated into the annual budget.
2. For budgeting purposes, it constitutes the total resource requirements for the budget year, including the detailed annual allocation for each PPA in the annual slice of the LDIP and the regular operational budget items broken down into Personal Services, Maintenance and Other Operating Expenses and Capital Outlay.
The LDIP should have a time frame of three (3) years.
1.2 What is meant by “local development”?
Local development pertains to the mandates and responsibilities of LGUs as defined in Sections 16 and 17 of the Local Development Code (RA 7160). The local development component of the LDIP, therefore, consists of the following:
1. projects that are in pursuance of the LGU’s exercise of its powers and discharge of its duties and functions necessary for effective governance and essential for the promotion of the general welfare;
2. projects that are in pursuance of functions traditionally performed by national government agencies but which have already been devolved to LGUs; and
3. projects that are necessary, appropriate or incidental to the effective and efficient provision of the basic services and facilities enumerated in Section 17 of RA 7150.
1.3 What is meant by “investment program”?
Investment program in public finance is a program for utilizing the investible portion of the local development fund.
(The investment program) serves as the link between the plan and the budget, thus putting into effect the directive of the Local Government Code that says: “local budgets shall operationalize approved local
development plans” (Sec. 305i, RA 7160)

CHAPTER 3LOCAL DEVELOPMENT INVESTMENT PROGRAMMING
129
The investible portion of the local development fund is that component of the development fund which will be earmarked for financing the priority programs and projects in the AIP; while the remaining portion will go into financing the costs of functions and services of thedifferent LGU offices and departments.
The local development fund is that portion of the local budget that is “plowed back” to the people in the form of programs, projects and services. It consists of the following:
1. 20% of the IRA
2. Non-office maintenance and other operating expenses
3. Non-office capital outlay
The local development fund DOES NOT INCLUDE that portion of the local budget which is consumed by the local government machinery for salaries, wages and other personnel costs, office maintenance and other operating expenditures, and office capital outlay.
The local development fund is conceptually illustrated in the following pie chart.
1.4 What comprises “investment” in LGU finance?
Investment in LGU finance is what remains after deducting all expenses necessary to:
1. run government machinery,
2. satisfy claims of creditors, and
3. comply with statutory reserves
Figure 14 - LOCAL FUNDS FOR DEVELOPMENT INVESTMENT
PERSONEL SERVICES
STATUTORY OBLIGATIONS
OFFICE MOOE
Non-Office CAPITAL OUTLAY
LEGEND
Available for Investment
Not Available
The 20% of IRA share is NOT the only source of development funds. It is intended to b the floor, not the ceiling, when it comes to determining the LGU’s development fund.

CHAPTER 3LOCAL DEVELOPMENT INVESTMENT PROGRAMMING
130
It is a regular outlay that has to be funded whether or not excess over operations (savings) is realized.
1.5 What is investment programming?
Investment programming in the context of the LGU’s planning and development function involves generating the programs and projects derived from the detailed elaboration of the CLUP and the CDP. Specifically, this form of public spending will modify, guide, direct, control or otherwise elicited the desired private sector response in order to accelerate local economic development, raise the level of socio-cultural well-being, improve the standard of public services, utilities and infrastructures, and, on the whole, attain the desired urban form in the CLUP and the general welfare goals of the CDP.
Investment programs must be spatially, rather than merely sectorally focused. The projects must therefore be selected not only for their potential to satisfy sectoral requirements but also for their impact on the direction and intensity of urban growth geared toward the realization of the desired urban form. Some examples of investment projects are listed below:
a. Investment projects that encourage growth
“anchor” facilities like a university, hospital, public market
Interchanges, bus terminals, transit stops
b. Investment projects that discourage development in the vicinity
Waste disposal site
Sewage treatment plan
Prison or mental hospital
c. Investments that limit growth in the urban fringe
Land reservation or acquisition for conservation
Utility extension limits
Low-density institutional uses such as military camps, university campuses, research/science parks
Reservations for open space and outdoor recreation areas
1.6 How is the LDIP prepared?
Pre-LDIP Activities:
Before the actual preparation of the LDIP, certain activities have to be undertaken first:
Step 1: Using the suggested form (Form 1) below call for and compile project ideas or proposals taken from any or all of the following sources:
a. CLUP or CDP
b. Sectoral and functional committees

CHAPTER 3LOCAL DEVELOPMENT INVESTMENT PROGRAMMING
131
c. LGU departments/offices
d. National government agencies
e. Private sector and civil society organizations
Step 2: Consolidate project ideas or proposals by sector. At the sectoral committee level:
a. Distinguish projects from “non-projects” and legislations (Please refer back to Part II, Chapter 4)
b. Determine project “ownership”. Distinction is important to allow the LGU to isolate those programs and projects for which it is solely responsible based on Section 17 of the LGC (Please see Table 23 National Government Functions Devolved to LGUs Pursuant to Section 17 of the Local Government Code.) These local projects will become an input to the LDIP. For other projects that are not the responsibility of the LGU but which are deemed essential to local development, the LGU can use all forms of persuasion and lobbying before the agencies and officials concerned.
Step 3: Conduct initial screening of programs and projects by consolidating repetitive or redundant proposals.
a. Go through all the files of the individual projects and check for identical or similar project descriptions, objectives, intended beneficiaries, location, etc.
b. Consolidate projects with identical or near-identical descriptions, objectives, intended beneficiaries, location, etc. but retain the names of the proponents.
c. Remove from the list project proposals that are obviously impractical or undesirable, e.g., and international airport in a remote and rural area.
d. As a general rule, a project idea that is be considered “obviously impractical or undesirable” should also be removed if there are reasonable doubts on whether it really is.
FORM 1– RANDOM LIST OF PROJECTS
PROJECT NO. BRIEF DESCRIPTION PROPONENT ESTIMATED COST

CHAPTER 3LOCAL DEVELOPMENT INVESTMENT PROGRAMMING
132
e. Delete from the list proposed projects which are identical to, or are in fact projects to be funded by other sources e.g. central or regional offices of government line agencies.

CHAPTER 3LOCAL DEVELOPMENT INVESTMENT PROGRAMMING
133
Table 23 - NATIONAL GOVERNMENT FUNCTIONS DEVOLVED TO LOCAL GOVERNMENT UNITS PURSUANT TO SECTION 17 OF THE LOCAL GOVERNMENT CODE OF 1991
FUNCTIONAL AREA BARANGAY MUNICIPALITY PROVINCE CITY
AGRICULTURE Agricultural support services, e.g. Planting materials distribution, farm produce collection, buying station
Extension & on-site research for agriculture, fishery, livestock & poultry (mainly seed production &
distribution) Quality control of copra Improvement & development of
local distribution channels, e.g. cooperatives
Inter-barangay irrigation systems Soil & water use and conservation Enforcement of fishery laws in municipal waters Conservation of mangroves
Extension & on-site services & facilities including control of pests & diseases
Dairy farms, livestock markets, animal breeding & artificial insemination centers
Assistance to farmers & fishermen organizations
Transfer of appropriate technology
Same as those of provinces & municipalities
PUBLIC BUILDINGS & OPEN SPACES
Multi-purpose hall, multi-purpose pavement, sports center, plaza, etc
Municipal buildings, cultural centers, public parks, playgrounds, sports facilities & equipment
Public cemetery
Provincial building, freedom parks & similar public assembly areas
Same as those of provinces & municipalities
TRANSPORT & COMMUNICATIONS
Inter-municipal telecommunications services
Adequate communication & transportation facilities
HOUSING Low cost & other mass dwelling projects
Same as those of province

CHAPTER 3LOCAL DEVELOPMENT INVESTMENT PROGRAMMING
134
Table 23 - NATIONAL GOVERNMENT FUNCTIONS DEVOLVED TO LOCAL GOVERNMENT UNITS UNDER THE LOCAL GOVERNMENT CODE OF 1991 (Sec. 17)
FUNCTIONAL AREA BARANGAY MUNICIPALITY PROVINCE CITY
HEALTH Maintenance of barangay health center & day care center Services & facilities on general hygiene & beautification Solid waste collection
Maternal & child care Control of communicable & non-
communicable diseases Access to secondary & tertiary
health services Purchase of medicines, medical
supplies & necessary equipment Solid waste disposal system Services & facilities related to
general hygiene & sanitation
Hospitals & other tertiary health services & facilities
Same as those of provinces & municipalities
INFRASTRUCTURES Maintenance of barangay roads & bridges & water supply system
Municipal roads & bridges School buildings & facilities for
elementary & secondary levels Clinics, health centers, etc. Communal irrigation, simple water
impounding projects, etc. Fish ports Artesian wells, spring development,
rain water collection systems, etc. Seawalls, dikes, drainage &
sewerage & flood control Traffic signals & road signs
Provincial roads & bridges Inter-municipal waterworks,
drainage, sewerage, flood control & irrigation projects
Reclamation projects
Same as those of provinces & municipalities
PUBLIC ENTERPRISES Public markets, slaughterhouses & other municipal enterprise
Same as those of the municipality

CHAPTER 3LOCAL DEVELOPMENT INVESTMENT PROGRAMMING
135
Table 23 - NATIONAL GOVERNMENT FUNCTIONS DEVOLVED TO LOCAL GOVERNMENT UNITS UNDER THE LOCAL GOVERNMENT CODE OF 1991 (Sec. 17)
FUNCTIONAL AREA BARANGAY MUNICIPALITY PROVINCE CITY
TOURISM Tourism facilities & other tourist attractions including acquisition of equipment
Regulation & supervision of business concessions
Security services for tourism facilities
Tourism development & promotion program
Same as those of provinces & municipalities
WELFARE Program on child & youth welfare, family & community welfare, welfare of elderly & disabled persons
Community-based rehabilitation programs for beggars, street children, scavengers, juvenile delinquents, & victims of drug abuse
Livelihood & other pro-poor projects
Nutrition services Family planning services
Welfare services for rebel returnees and evacuees
Relief operations Population development services
Same as those of provinces & municipalities
JUSTICE & PROTECTIVE SERVICES
Maintenance of Katarungang Pambarangay
Sites for police & fire stations & substations
Municipal jail
Provincial jails Same as those of provinces & municipalities

CHAPTER 3LOCAL DEVELOPMENT INVESTMENT PROGRAMMING
136
Table 23 - NATIONAL GOVERNMENT FUNCTIONS DEVOLVED TO LOCAL GOVERNMENT UNITS UNDERTHE LOCAL GOVERNMENT CODE OF 1991 (Sec. 17)
FUNCTIONAL AREA BARANGAY MUNICIPALITY PROVINCE CITY
NATURAL RESOURCES & ENVIRONMENT
Community-based forestry projects Management & control of
communal forest Establishment of tree parks,
greenbelts, etc. Environmental management
system
Enforcement of community-based forestry laws, pollution control law, small-scale mining law & other laws on environmental protection
Establishment of mini-hydro electric projects for local purposes only
Same as those of provinces & municipalities
INFORMATION SERVICES Information & reading centers Maintenance of public library Information on investments & job
placements Tax & marketing information
systems
Upgrading & modernization of tax information & collection services Industrial research & development
services & technology transfer Investment support services
including access to credit financing
Same as those of provinces & municipalities

CHAPTER 3LOCAL DEVELOPMENT INVESTMENT PROGRAMMING
137
The completion of this Step 3 results in an initial list of projects (See Form 2, Column 3)
Step 4: Conduct screening for conflict, compatibility or complementarity of projects. Remove or reformulate conflicting projects. For this step, a Conflict – Compatibility – Complementarity Matrix is used (See Form 3). This matrix shows projects that complement, are compatible, or are in conflict with other projects. The relationship between projects is one of conflict where the:
a. Expected benefits of the project tend to nullify each other, or
b. Implementation of one obstructs the implementation of another
If the list is short, this step may take place simultaneously with the initial screening and then proceed to the next step.
The completion of the Conflict-Compatibility-Complementatiry Matrix results in a preliminary list (See Column 4, Form 2)
Step 5: Prioritize programs and projects according to level of urgency based on the criteria set below in the Table 24 (Criteria for Determining Level of Urgency)
Step 6: Prepare project briefs Projects which are classified as “Urgent” should be prepared in the format of a project brief and submitted to the LDC in plenary. (See Box 9 -Contents of a Project Brief) A sample Project Brief is shown in Box 10.
FORM 2 – PROJECTS INCLUDED IN THE RANDOM LIST, INITIAL LIST AND PRELIMINARY LIST
PROJECT FILE NO.
(1)
RANDOM LIST OF PROJECTS
(2)
INCLUDED IN INITIAL LIST
(3)
INCLUDED IN PRELIMINARY LIST(4)
INSTRUCTIONS:1. Column 1 – List the project file No. of all projects listed in Column 2 2. Column 2 – List all projects identified in Step 2, Stream 1.3. Column 3 – List all projects passing the initial screening. Projects excluded from the list are those found to be
repetitive or redundant, obviously impractical or undesirable, and those that are already funded by other offices, agencies or organizations.
4. Column 4 – Indicate whether a project is included in the preliminary list resulting from the use of Conflict-Compatibility-Complementarity Matrix (Form 3)

CHAPTER 3LOCAL DEVELOPMENT INVESTMENT PROGRAMMING
138
Table 24Criteria for Determining Level of Urgency
LEVEL OF URGENCY GENERAL CRITERIA
Urgent Projects that cannot be reasonably postponed Projects that would remedy conditions dangerous to public health, safety and
welfare Projects needed to maintain critically needed programs Projects needed to meet emergency situations
Essential Projects required to complete or make usable a major public improvement Projects required to maintain standards as part of an on-going program Desirable self-liquidating projects Projects for which external funding is available
Necessary Projects that should be carried out to meet clearly defined and anticipated needs Projects to replace obsolete or unsatisfactory facilities Repair or maintenance projects to prolong life of existing facilities
Desirable Projects needed for expansion of current programs Projects designed to initiate new programs considered appropriate for a progressive
community
Acceptable Projects that can be postponed without detriment to present operations if budget cuts are necessary.
Deferrable Projects recommended for postponement or elimination from immediate consideration in the current LDIP
Projects that are questionable in terms of over-all needs, adequate planning, or proper timing
FORM 3 – CONFLICT – COMPATIBILITY – COMPLEMENTARITY MATRIX
PROPOSED PROJECTS
PROJECT 1 PROJECT 2 PROJECT 3 PROJECT 4 PROJECT 5 PROJECT n..
PROJECT 1PROJECT 2PROJECT 3PROJECT 5PROJECT n..
INSTRUCTIONS:1. Indicate the relationships among the proposed projects.
a. If the relationship is one of conflict, mark the appropriate cell with “X”. The relationship is one of conflict where the expected benefits of the projects tend to nullify each other, or when the implementation of one obstructs the implementation of another.
b. If the relationship is one of complementarity, mark the appropriate cell with an “O”.c. If the relationship is one of compatibility, or if it is neutral, leave the cell blank.
2. Remove from the initial list projects which conflict with many or most of the other projects.3. Projects which conflict with some but are compatible or complementary with others may be reformulated to resolve the
conflict/s.

CHAPTER 3LOCAL DEVELOPMENT INVESTMENT PROGRAMMING
139
Box 10 - SAMPLE PROJECT BRIEF
Name of Program: Socialized Housing and Resettlement Program
Brief Description: This program involves the development of 3 hectares of the 20-hectare site in Bonuan Boquig into housing units for the homeless and the less privileged.
Program Components: Phase 11. Land Acquisition 6 months2. Plan Preparation 12 months Survey Documentation Detailed Architectural Engineering Community Organization Social Preparation
3. Program Implementation 18 months
Proponents: City Government -Task Force on Housing, CMO, CEO, CPDO, NHA in partnership with the Private Sector
Justification: The less privileged, particularly men and women living in danger zones such as river easements, railroad tracks, near open dump sites, etc. shall have the opportunity to safe and decent housing.
Intended Beneficiaries: Landless Dagupeño men and women, legitimate squatters, and government employees
Estimated Cost: Phase 1 Land Acquisition (10 hectares) P 58 Million Land Development /Plan Preparation 100 Million Cost of Construction (1,000 units/ha) 600 Million
Program Term: Phase 1: 3 Years
Target Output/ Success Indicators:
1. Increased number of families with housing2. Reduced number of squatters
Possible Risks: 1. Lack of funds 2. Opposition from affected stakeholders (i.e., landowners, squatters. Etc.)3. Lack of political will
Expected Private Sector Response: Their involvement is expected in program implementation
Box 9 - CONTENTS OF A PROJECT BRIEF
1. Name and type of project and activity components
2. Proponent of originator of the project idea
3. Justification for the project (derived from the CLUP or CDP)
4. Intended beneficiaries (population sectors or geographical areas)
5. Estimated cost or resource inputs by activity component
6. Target outputs or succeed indicators
7. Expected private sector response after this public investment is completed
8. Possible risks that may impede the success of the project.

CHAPTER 3LOCAL DEVELOPMENT INVESTMENT PROGRAMMING
140
LDIP Proper:
The process of preparing the LDIP consists of three (3) streams:
1. Stream 1 – This involves the preparation of a ranked list of programs and projects with their individual and cumulative cost estimates.
2. Stream 2 – This has to do with determining available funds for investment; and
3. Stream 3 – This necessitates matching the fund requirements with projected funds available and deciding on financing options should the funds available are insufficient.
The process flow is illustrated in the chart below:
Figure 15
Chart designed by: Prof. Ernesto M. Serote
LDIP PROCESS AS A LINK BETWEEN DEVELOPMENT PLANNING & BUDGETING

CHAPTER 3LOCAL DEVELOPMENT INVESTMENT PROGRAMMING
141
Stream 1: Preparing the ranked list of projects
The ranking of proposed projects included in the preliminary list resulting from the pre-LDIP activities allows for social and political considerations to be inputted into the project identification and prioritization process. It facilitates the trimming down and modification of the project list in subsequent streams of the LDIP process. For these purposes, a Goal Achievement Matrix (GAM) is utilized.
What is the Goal Achievement Matrix?
The Goal Achievement Matrix (GAM) is essentially a listing of the LGU’s social and political goals, weighed according to the local administration’s priorities and commitments and consensus – based sectoral goals set by the community. The extent to which proposed projects contribute to the attainment of these goals is then estimated.
The GAM method is highly participatory because it allows various sectors of the community to express their bias through the weighing of each goal according to their perception of its relative importance to their sector.
How is GAM used for ranking projects?
The rating of each project according to its perceived contribution to the achievement of each goal is quite simple.
Step 1: Call and organize a workshop with participants representing various societal sectors in the LGU, e.g. business, academe, farmers and fisherfolk, women, religious, government, indigenous peoples, youth, elderly, etc.
Step 2: Select any ten (10) or more projects as may be determined by the LDC from the preliminary list of projects submitted by the sectoral committees which are classified as “Urgent”.
a. Make sure your projects are really projects, not services, not legislation.
b. Make sure your projects are LGU-owned, or co-owned with the national government or private sectors.
Step 3: List the 10 or more projects corresponding to the numbers in the GAM Form. (See Table 25 - Sample GAM Form 1 and Table 26 - Sample GAM with Inputs from One Societal sector)
Step 4: Based on the perceived importance of each goal to the interests of the sector a group represents, assign weights to each goal. The numerical total of the weights should be 1 or 100%.
Step 5: Rate each proposed project using the following scale:
3 - Project contributes greatly to the fulfillment of the goal.
2 - Project contributes moderately to the fulfillment of the goal
1 - Project contributes slightly to the fulfillment of the goal.
0 - Project does not contribute to the fulfillment of the goal.
-1 - Project slightly inconsistent with the goal.
Each LGU, trhough its LDC, should formulate its own GAM according to
its development goals.

CHAPTER 3LOCAL DEVELOPMENT INVESTMENT PROGRAMMING
142
-2 - Project moderately inconsistent with the goal.
-3 - Project greatly contradicts the goal.
Table 25- Sample GAM with Inputs from One Societal Sector
Step 6: Multiply the rating you gave by the corresponding weight of the goal and enter the product (score) in the appropriate cell. Add the scores for each project proposal. Then add all sectoral group scores as presented in the summary of GAM scores. (See Sample GAM Form 2 and Table 25 - Example of Summary of Societal Ratings)
Step 7: Finally, arrange projects according to their total scores. The project with the highest total score is ranked as number one, the next number two, and so on. Two columns for estimated costs are displayed. One column shows the individual cost of each project and the other reflects the cumulative or running total.
Step 8: Estimate project cost. The cost of each project must first be estimated before the list of proposed projects can be matched with the estimated available funds (Stream 2). For some projects, cost estimates may already be available as may be shown in their project briefs. In this case, the LPDO only needs to validate or refine
GOAL WEIGHT PROJECT NUMBER
1 2 3 4 5 6 7 8 9 10 11 12 13 14 16 17 18 20 21 22 23 24 25 26 27
1 0.12 0.24 0.12 0.24 0.00 0.36 0.24 0.24 0.24 0.24 0.12 0.36 0.24 0.12 0.36 0.24 0.00 0.36 0.12 0.12 0.36 0.24 0.24 0.12 0.24 0.24
2 0.12 0.24 0.36 0.24 0.24 0.24 0.24 0.24 0.36 0.24 0.12 0.36 0.24 0.24 0.36 0.24 0.24 0.24 0.24 0.24 0.24 0.24 0.24 0.24 0.24 0.24
3 0.11 0.22 0.22 0.11 0.11 0.22 0.22 0.22 0.22 0.22 0.11 0.22 0.33 0.22 0.11 0.22 0.22 0.22 0.11 0.22 0.11 0.22 0.22 0.22 0.22 0.11
4 0.10 0.10 0.10 0.10 0.20 0.20 0.20 0.10 0.10 0.20 0.10 0.10 0.20 0.10 0.10 0.20 0.10 0.30 0.11 0.00 0.10 0.10 0.10 0.20 0.10 0.10
5 0.11 0.33 0.11 0.00 0.00 0.11 0.11 0.22 0.33 0.11 0.11 0.11 0.22 0.00 0.33 0.11 0.00 0.11 0.00 0.11 0.33 0.00 0.11 0.11 0.11 0.22
6 0.11 0.22 0.11 0.22 0.22 0.33 0.22 0.22 0.22 0.33 0.22 0.22 0.22 0.33 0.22 0.33 0.11 0.11 0.22 0.00 0.22 0.22 0.22 0.11 0.11 0.22
7 0.11 0.11 0.11 0.11 0.22 0.22 0.11 0.22 0.22 0.22 0.22 0.22 0.22 0.22 0.22 0.33 0.22 0.11 -0.11 0.00 0.11 0.11 0.22 0.11 0.22 0.11
8 0.12 0.12 0.00 0.12 0.12 0.12 0.22 0.24 0.36 0.24 0.12 0.24 0.24 0.24 0.24 0.12 0.12 0.24 0.12 0.24 0.24 0.12 0.12 0.00 0.00 0.12
9 0.10 0.10 0.20 0.20 0.20 0.20 0.20 0.20 0.20 0.20 0.10 0.20 0.30 0.20 0.10 0.20 0.20 0.10 0.00 0.20 0.20 0.20 0.20 0.20 0.20 0.10
Total 1.00 1.68 1.33 1.34 1.31 2 1.76 1.9 2.25 2 1.22 2.03 2.21 1.67 2.04 1.99 1.21 1.79 0.81 1.13 1.91 1.45 1.67 1.31 1.44 1.46
SAMPLE GAM FORM 1SECTOR: Women
GENERAL WELFARE GOALSSECTOR –ASSIGNED
WEIGHTPROJECTS
1 2 3 4 5 6 7 8 9 101. Preservation & enrichment of culture2. Promote health and safety3. Enhance the right of the people to a
balanced ecology4. Encourage & support the development of
appropriate & self-reliant scientific & technological capabilities
5. Improve public morals6. Enhance economic prosperity & social
justice7. Promote full employment among their
residents8. Maintain peace & order9. Preserve the comfort & convenience of
the inhabitants TOTAL (1) or 100

CHAPTER 3LOCAL DEVELOPMENT INVESTMENT PROGRAMMING
143
the estimates. A ranked list of proposed projects with cost estimates and other information may be shown using Form 4.
Table 26- Example of Summary of Societal Sectors’ Ratings (Dagupan City CDP)Ratings by Societal Groups
No. PROJECT 1 2 3 4 5 6 7 8 9Total Score
Rank
1Bulilit Ko Pan-Aralen Ko: A Pre-School Education Access Program
1.68 1.77 2.73 0.8 0.8 1.57 1.36 0.75 0.5812.04
23
2 Dagupan City Ecological Waste Management Plan 1.33 2.71 2.49 1.91 1.2 1.55 1.36 1.63 1.49 15.69 93 Upgrading of Water Transport Facilities 1.34 .15 2 1.51 1.62 1.72 1.09 1.96 1.13 12.37 204 Modern Slaughterhouse 1.31 1.31 1.65 1.13 1.03 1.48 1.66 1.01 1.46 11.98 22
5Panangidaungay Bangus (Dagupan City Wholesale Fish Trading Center)
2 1.42 2.49 1.22 1.51 1.69 1.74 1.83 1.315.2
12
6Information and Education Campaign on the CLUP/Zoning Ordinance
1.76 1.66 1.8 2.3 1.56 1.38 1.24 2.22 1.3615.18
13
7 Redevelopment of Tondaligan People's Park 1.9 1.11 2.22 1.24 0.89 1.97 1.79 2.05 2.01 15.18 138 Droga Ed Pantal Agko Gabay 2.25 2.33 1.84 1.64 1.29 1.78 1.57 1.1 1.64 15.44 119 MIS for Zoning and Tax Mapping Project 2 1.17 1.53 1.31 1.27 0.96 1.38 0.44 0.93 10.76 25
10Skills Training for Trading, Services and Livelihood Opportunities
1.22 1.54 1.58 1.58 1.24 1.74 1.85 1.61 1.4713.63
17
11Malimgas Tan Marakep Ya Ilog (Pantal Riverside Redevelopment)
2.03 1.86 2.44 2.28 1.33 1.66 1.5 1.65 1.4916.24
7
12Transportation and Traffic Management Plan for Dagupan City
2.21 2.36 2.48 1.88 1.43 1.44 2.37 2.19 1.7317.39
5
13 Market Expansion Project 1.67 1.21 1.81 1.48 1.13 1.2 1.98 1.53 1.11 13.12 1914 merged with 1515 Katipunan Kakasilan Na Too Ed Dagupan 2.04 2.96 2.62 2.22 0.85 3 1.56 2.15 1.71 19.11 216 Dagupan Bangus Processing Plant 1.99 1.77 3 1.68 1.35 2.2 2.2 1.8 1.5 17.49 3
17Construction and Rehabilitation of Drainage System along Don Jose Calimlim Street, Pogo Chico
1.21 1.16 3 1.23 0.43 1.28 1.39 1.07 1.4612.23
21
18Dagupan City Tourism Master Development Plan and Promotion
1.79 2.07 2.58 1.4 1.37 2.36 1.87 1.88 2.1217.44
4
19 merged with 10 0
20Development of an Information System on Establishments
0.81 1 2.13 1.68 0.63 1.42 1.55 1.07 1.311.59
24
21 CBD Sidewalk Recovery and Improvement 1.13 1.37 2.4 1.69 0.43 1.33 2.24 1.56 1.5 13.65 1622 Moral Renewal & Capability Building Program 1.91 1.55 2.67 2.02 2.49 1.45 1.13 1.22 1.22 15.66 10
23Comprehensive Urban Disaster Preparedness and Management Plan
1.45 1.84 2.18 1.89 1.26 1.34 1.85 1.62 1.5114.94
15
24 River Study Project 1.67 1.95 2.82 2.12 1.26 1.4 2 2.18 1.28 16.68 625 Water Quality Monitoring and Assessment 1.31 1.55 2.13 1.86 1.26 1.5 1.73 0.78 1.28 13.4 18
26Urban Green Space Enhancement & Rehabilitation of Dagupan City
1.44 2.12 2.42 2.55 1.26 1.66 1.66 1.28 1.4115.8
8
27Abong Ko Lusek Ko (My Home, My Pillar): A Comprehensive Concrete Values Training Program
1.46 2.96 1.95 2.19 0.85 1.59 2 0.84 1.2315.07
14
28 Socialized Housing and Resettlement Program 2 2.38 2 1.9 2.3 2.07 2 2.42 2.37 19.44 1
Table 25 - SAMPLE GAM FORM 2SUMMARY OF SOCIETAL SECTOR SCORES
PROPOSED PROJECTS
SECTORSTOTAL SCORE
RANKA(Women)
B(Business)
C(Fisherfolk)
D(Elderly)
E(Agriculture)
F(Government)
Project 1Project 2Project 3Project 4Project 5Project nINSTRUCTIONS:
1. List all sector scores for each project.2. Sum the scores for each project and list the total score in the column provided.3. List the rank of each project based on the total scores in the last column.
Interpretation: The resulting ranking represents the collective evaluation of the project proposals by the LDC.

CHAPTER 3LOCAL DEVELOPMENT INVESTMENT PROGRAMMING
144
Table 27 - Example of Ranked List of Projects with Cost Estimates
Stream 2: Determining Investible Funds
1.6 Who is in charge of determining investible funds?
The Local Finance Committee, composed of the LPDC, the Budget officer and the Treasurer, is charged with the setting of the level of the annual expenditures and the ceilings of spending for economic, social and general services based on the approved local development plans. (Sec. 316 (c), RA 7160).
1.7 How is the level of investible funds determined?
The process of determining the level of investible funds must be done in a transparent manner with all the assumptions and considerations clearly defined.
Rank Project Title Type SectorCost Estimate (Pesos)
Individual Cumulative1 Socialized Housing and Resettlement Program Hard Social 758,000,000 758,000,000
2 Katipunan Kakasilan Na Too Ed Dagupan Soft Social 5,900,000 763,900,000
3 Dagupan Bangus Processing Plant Hard Economic 150,000,000 913,900,000
4Dagupan City Tourism Master Development Plan and Promotion
Soft Economic 4,000,000 917,900,000
5Transportation and Traffic Management Plan for Dagupan City
Soft Land Use & Infrastructure
940,000 918,840,000
6 River Study Project Hard Environment 2,000,000 920,840,000
7Malimgas Tan Marakep Ya Ilog (Pantal Riverside Redevelopment)
Hard Land Use & Infrastructure
8,606,000 929,446,000
8Urban Green Space Enhancement & Rehabilitation of Dagupan City
Hard Environment 5,300,000 934,746,000
9Dagupan City Ecological Waste Management Plan
Soft Environment 26,700,000 961,446,000
10 Moral Renewal and Capability Building Program Soft Institutional 1,620,000 963,066,000
11 Droga Ed Pantal Agko Gabay Soft Social 393,000 963,459,000
12Panangidaungay Bangus (Dagupan City Wholesale Fish Trading Center)
Hard Land Use & Infrastructure
104,580,000 1,068,039,000
FORM 4 (Stream 1) – RANKED LIST OF PROPOSED PROJECTS FOR INVESTMENT PROGRAMMING
RANK PROPOSED PROJECT/ FILE NO. LOCATION / SECTORCOST ESTIMATEINDIVIDUAL CUMULATIVE
12345678910
The LDC, in close coordination with the LPDC, should undertake
the required financial plan development for consideration
and approval of the Sanggunian.

CHAPTER 3LOCAL DEVELOPMENT INVESTMENT PROGRAMMING
145
The number of public projects that an LGU can finance depends on the following:
1. Revenue level of the LGU2. Level of recurring local government operating expenditures3. Current public debt level4. Statutory debt ceiling5. Potential sources of additional revenue available for investment project financing
Step 1: Collect appropriate revenue data and determine historical trends
1. Collect data on revenue and expenditures for the past 3 – 5 years.
2. Analyze the historical trends in terms of the average annual growth rate.
In more specific terms, historical analyses need to be done on the following revenue items using the suggested forms.
1. Recurring Revenue Sources:
a. Real Property Taxes (Form 5: Sample RPT Data Collection and Historical Growth Trend Analyses Table)
b. Business Fees and Licenses (Form 6: Time Series Record of Revenues Other Than Property Tax
c. Other taxes (Form 6)
d. Service and Operations Income (Form 6)
e. Internal Revenue Allotment (Form 6)
Revenue is defined as any inflow of funds to the LGU regardless of whether the source is repayable or not.
FORM 5: TIME SERIES RCORD OF PROPERTY TAX REVENUE
YEAR
(1)ASSESSED VALUATION
(2)TAX RATE
(3)TAX LEVY
(4)COLLECTION AS % OF LEVY
(5)TOTAL REVENUE FROM PROPERTY TAXATION
(a)Amount
(b)% Change
(a)General
(b)SEF
(c)Total
(a)Amount
(b)% Change
(a)Amount
(b)% Change
12345(Note: The exercise will require 3 – 5 years of historical data to be used as the basis for a 3 – year projection)
INSTRUCTIONS:
1. Enter Assessed Valuation in Column 1a and the property tax Revenue Collected in column 5a.2. Enter the Tax rates in Column 2a and 2b and enter the total in Column 2c.3. Multiply the Assessed Valuation (Column 1a) by the Total Tax Rate (Column 2c)4. Compute the Tax Collections as % of Levy (Column 4), by dividing the Total Property Tax Revenue (Column 5a) by the
Tax Levy (Column 3a).5. Compute the % change over the preceding year and enter the results in the appropriate columns.

CHAPTER 3LOCAL DEVELOPMENT INVESTMENT PROGRAMMING
146
2. Non – recurring revenue sources (Form 6)
a. Grants – in – aid from local and foreign sources
b. Special appropriations or transfers from Congress or other units of government
c. Inter – fund transfers
d. Inter – local government transfers
Step 2: Collect appropriate operating expenditure data including existing debt service and determine historical trends.
a. Operating expenditures include the following:
i. Personal Services, including social charges (PS)
ii.Maintenance and other operating expenses (MOOE), such as office supplies, utilities (power, water, telecommunications), office equipment and miscellaneous expenses.
b. Historical analyses need to be done on the following expenditure items using the suggested form. (Form 7).
i. General Public Services
ii. Social Services
iii. Economic Services
iv. All Others
FORM 6: TIME SERIES RECORD OF REVENUE OTHER THAN PROPERTY TAX
YEAR
(1)BUSINESS FEES
& LICENSES
(2)OTHER TAXES
(3)SERVICES & OPERATIONS
(4)TOTAL LOCAL
REVENUE
(5)IRA
(6)ALL OTHERS
(7)GRAND TOTAL
(a)Amount
(b)%
Change
(a)Amount
(b)%
Change
(a)Amount
(b)%
Change
(a)Amount
(b)%
Change
(a)Amount
(b)%
Change
(a)Amount
(b)%
Change
(a)Amount
(b)%
Change
12345
(Note: The exercise will require 3 – 5 years of historical data to be used as the basis for a 3 – year projection.)
INSTRUCTIONS:1. Enter the amount of revenue from each source in the appropriate column.
a. Operating and service income covers public markets, slaughterhouses and other LGU economic enterprises.b. IRA refers to the Internal Revenue Allotment.c. All others include Other Grants, and inter-government and inter-fund transfers.
2. Compute the % change over the preceding year and enter the results in the appropriate columns.

CHAPTER 3LOCAL DEVELOPMENT INVESTMENT PROGRAMMING
147
c. The amount of debt service payments for existing and other anticipated LGU obligations must be established and compared to the relevant, if any, statutory debt service ceilings. The suggested form (Form 8) may be used for this purpose.
In the case of expenditures, election years result I abnormally high expenditure levels. Usually, such “abnormal” years need to be taken out of the projection exercise.
Step 3: Establish structural relationships of revenue and expenditure items to population and economic development.
Among the key factors that must be considered in assessing structural relationships between revenue and expenditure items are the following:
a. Overall national and regional economic picture, including development trends;
b. Demographic shifts; and
c. Changes in the local market, particularly in the local labor market.
FORM 8 – OBLIGATED DEBT SERVICE EXPENDITURE
YEAR(1)
PRINCIPAL(2)
INTEREST(3)
TOTAL (1+2)
12345
(NOTE: This exhibit presents existing debt service requirements and, therefore, involves no projections.)
INSTRUCTIONS:1. Simply compile the total debt service requirements for local general debt obligation for each of the 3 – year
projection period for all LGU obligations from existing accounting records.2. Enter these amounts in the appropriate columns.
FORM 7 – TIME SERIES RECORD OF LGU OPERATING EXPENDITURES
YEAR
(1)GENERAL PUBLIC
SERVICES
(2)SOCIAL SERVICES
(3)ECONOMIC SERVICES
(4)ALL OTHERS
(7)GRAND TOTAL
(a)Amount
(b)% Change
(a)Amount
(b)% Change
(a)Amount
(b)% Change
(a)Amount
(b)% Change
(a)Amount
(b)% Change
12345
(Note: The exercise will require 3 – 5 years of historical data to be used as the basis for a 3 – year projection.)
INSTRUCTIONS: For each year,

CHAPTER 3LOCAL DEVELOPMENT INVESTMENT PROGRAMMING
148
Step 4: Project future recurring revenue and operating expenditure levels
a. RPT collection should be projected separately because of its large contribution to LGU revenue sources; and because real properties will be the main beneficiary of LGU investments in terms of increased values. (See Form 9 for Sample Projection Form)
Future recurring levels can be projected based on a careful assessment of all probable factors that affect each revenue source.
TIPS AND NOTES FOR CONDUCTING HISTORICAL TRENDS ANALYSES
1. Distinguish between recurring revenue sources and non-recurring ones. The LDIP needs a stable source of financial resources that depend on revenue sources which are assured of being collected every year.
2. Distinguish between the impact on revenue volume of the:a. Changes in the tax base, such as increases in the number of taxable structures or
business; andb. Changes in tax rates
3. Take into consideration an unusually large increase in particular revenue source for a particular year which may be attributed to:a. Change in rates,b. New system of billing and collection, or c. Other procedural and systems improvements, e.g., granting of tax amnesty, enactment
of new tax laws and ordinances
Increases attributed to the above cannot be expected to continue in the future. Therefore, their impact must be segregated in the analyses.
FORM 9 – PROJECTION OF PROPERTY TAX REVENUE
YEAR (1)PROJECTED ASSESSED VALUATION
(2)TENTATIVELY
PROJECTED TAX RATE
(3)PROJECTED
TOTAL TAX LEVY
(4)COLLECTION AS
% OF LEVY
(5)PROJECTED TOTAL
REVENUE FROM PROPERTY TAXATION
(a)General
(b)SEF
(c)Total
12345
INSTRUCTIONS:1. Enter the Projected Assessed Valuation in Column 1 and the estimated Collection as % of Levy in Column 4.2. Enter the tentatively Projected Tax Rates in Columns 2a and 2b and enter the total in Column 2c.3. Multiply the Projected Assessed Valuation indicated under Column 1 by the Total Tax Rate Column in column 2c to obtain the Total Tax Levy and enter the
result in Column 3.4. Multiply Column 3 by the Collection as % of Levy as shown in Column 4 and enter the result in the Total Property Tax Revenue in Column 5.
Note: In developing this revenue base for preliminary testing, different assumptions may be used regarding the projected tax rate. For example:
1. The current tax rate can be used for the entire projection period; or2. Some change in the tax rate can be assumed over the projection period depending on the adopted LDIP financing package.

CHAPTER 3LOCAL DEVELOPMENT INVESTMENT PROGRAMMING
149
b. Business fees and licenses, other taxes, services and operations, and all others can be projected using either the historical growth rates (with or without adjustments) or using computed elasticities and assumed per capita income growth rates. (See Form 10 for Sample Projection form for these revenue items)
The IRA projections should already consider the increases provided for in RA 7160.
c. Future normal recurring expenses can be projected using either of the following techniques:
i. the historical 3 to 5 – year annual average expenditure increase; or
ii. the historical average expenditure per unit of output in the case of LGU business enterprises. (See Form 11 for the Sample Projection Table)
In using either of the two techniques, factor into the projections the effects of political and organizational developments within the LGU on the future growth of various departments.
FORM 11 – PROJECTION OF LGU OPERATING EXPENDITURE
YEAR(1)
GENERAL PUBLIC SERVICES
(2)SOCIAL SERVICES
(3)ECONOMIC SERVICES
(4)ALL OTHERS
(5)GRAND TOTAL
INSTRUCTIONS:1. Project business fees and licenses, other taxes, services and operations, and all others using either the
historical growth rates (with or without adjustments) or using computed elasticities and assumed per capita income growth rates.
2. Get the RPT projection from Form 10.3. Enter the sums of Columns 1 -4 and enter the result in Column 5.
FORM 10 – PROJECTION OF TOTAL REVENUEYEAR (1)
PROJECTED RAL PROPERTY
TAX
(2)BUSINESS FEES
& LICENSES
(3)OTHER TAXES
(4)SERVICES & OPERATIONS
(5)IRA
(6)ALL OTHERS
(5)PROJECTED
TOTAL REVENUE
12345
INSTRUCTIONS:
1. Get the RPT projection from Form 9.2. Project business fees and licenses, other taxes, services and operations, and all others using either the historical growth rates
(with or without adjustments) or using computed elasticities and assumed per capita income growth rates.3. For the IRA projections, consider the increases provided for in RA 7160.4. Enter the sums of Columns 1 to 6 to get the result for Column 5.

CHAPTER 3LOCAL DEVELOPMENT INVESTMENT PROGRAMMING
150
Four alternative growth scenarios can be used by the LGU in coming up with the required financial projects. (See Figure 16)
Figure 16 - Financial Growth Scenarios
Step 5: Compute the financial surplus available for the financing of new investments.
The following computational procedure can be used to establish the new investment financing capacity of the LGU. (See Form 12 for the Sample Projection of New Investment Financing Potential Table)
After determining the future revenue inflows and the corresponding revenue outflows, the new investment financing capacity of an LGU can be established.
NO CHANGE
CHANGE BY CONSTANT AMOUNTS
CHANGE AT CONSTANT RATE
CORRELATION WITH DEMOGRAPHIC OR
ECONOMIC VARIABLE
• Assumes that the present level of financial variable will continue to the foreseeable future.
• Uses a constant absolute amount based on a recent year or on theaverage over a certain number of years.
• May be used if the historical trend analysis indicates little or no change, and if there is no reason to expect change in this pattern.
• May also be used to provide a conservative estimate on an uncertain revenue source such as grants and aids.
• Assumes yearly changes based on constant amounts.
• Assumes yearly changes at a constant amounts based on the historical annual average percentage change estimate.
• Percentage change estimate is multiplied by the current year value to derive the amount that should be added to the current year value to arrive at the next year’s value.
• Assumes a constant relationship between the financial variable and a demographic or economic variable.
GROWTH SCENARIOS
Box 10COMPUTING NEW INVESTMENT FINANCIAL CAPACITY
OF AN LGU
Projected Revenues
Less: Projected Operating ExpensesLess: Existing Debt Service RequirementsEquals: Amount available for new investment financing

CHAPTER 3LOCAL DEVELOPMENT INVESTMENT PROGRAMMING
151
Stream 3: Formulating the Financing Plan
A 3 – year planning horizon shall be adopted to coincide with the tenure of local officials.
Step 1: 1st Round Matching – The purpose of this matching is to determine:
a. how many of the approved projects can be funded from regular sources for the 3 – year period; and
b. how many may have to be financed from other sources.
The procedure in undertaking this exercise is illustrated in Figure 17:
FORM 12 – PROJECTION OF NEW INVESTMENT FINANCING POTENTIAL
ITEM NO. ITEM YEAR1 Projected Revenue 1 2 3 4 5
2 Less: Projected Operating Expenditures
3 Sub – Total (Item 1 minus Item 2)
4 Less: Obligated Debt Service
5 New Investment Potential (Item 3 minus Item 4)
INSTRUCTIONS:
1. Item No. is to be taken from Form 10.2. Item No. 2 is to be taken from Form 11.3. Item No. 4 is to be taken from Form 8.
RANKED LISTOF PROJECTS
Take the cumulative total o f project costs from the top of the list
downwards.
Stop a t the project tha t gives the cumulat ive tota l equ al or nearly equa l to the estimated available
funds fo r the next 3 yea rs..
Take th e to tal cost of the rema in ing project s that cannot be funded out
of the recurring sources.
Transmit t o the LFC the to tal cost of the remaining projects that cannot
be funded out of the recurring sources.
FIGURE 17

CHAPTER 3LOCAL DEVELOPMENT INVESTMENT PROGRAMMING
152
Step 2: LDC approves the ranked list of projects - The LDC, through a vote or resolution approves the ranked list of projects with their individual and aggregate cost estimates.
Step 3: The LDC deliberates on and decides what financing approach to take.
Three financing approaches are available to LGUs (Figure 18.) These include the following:
a. The Conservative Approachb. The Developmental Approachc. The Pragmatic Approach
If the LDC chooses the Conservative Approach, this will involve the following actions:
a. The LDC further trims down the project list.
i. The trimming process starts with the grouping of projects following the ranked list and taking a running total of the cost.
ii. When the total cost equals or nearly equals the available funds for the 1st
year, the corresponding group of projects comprises the 1st year capital investment program.
iii. The same procedure is repeated for the 2nd and 3rd year investment programs.
iv. The LDC approves the final list of projects when a proper match is attained between total project cost and available funds on a year-by-year basis through a vote or consensus.
b. The final project list is to be formally adopted by the Sanggunian through an appropriate resolution.
c. The LPDO prepares the investment program.
.
FIN AN C IN G APP ROACH ES
C ON SERVATIV E APP ROA CH
O nly p ro je ct s tha t ca n b e fu nded fr o m r egula r
sour ce s w il l b e imple me nte d .
D EVE L OPM EN T AL APPROACH
The sho r t l is t of p ro je ct s is ta ke n as
fina l a nd ir re d uc ib le . The LG U w il l then ta p
a ll s ou r c es pos s ib le to ra ise t he ne ede d f u nds
to im p lem e n t the pr o jec t pac ka ge .
PRAGM ATIC APPROAC H
This is a com b in ation of th e t w o op t io ns .
F IGU RE 18

CHAPTER 3LOCAL DEVELOPMENT INVESTMENT PROGRAMMING
153
If the LDC chooses the Development Approach, the following strategies may be investigated to determine their impact on savings for the next two to three years.
a. Improve fiscal management by:
i. Increasing the collection efficiency;
ii. Curbing some expenditures which may not be absolutely necessary e.g. freeze on hiring of new personnel, stopping the allocation of district funds for Sanggunian members, or reducing the number of official travels;
iii. Imposing betterment levy (Sections 240 – 245 of RA 7160);
iv. Imposing tax on idle lands (Sections 236 – 239, RA 7160).
v. Incurring public debt or financing using any of the following modalities allowed by the Local Government Code:
b. Contracting for loans, credits and other forms of indebtedness with any government or domestic private bank and similar lending institutions (Sec. 297, RA 7160) - Title IV of the Local Government Code provides the legal basis for the LGUs to create indebtedness and avail of credit facilities with any government or domestic private bank and other lending institutions to finance infrastructure and other socio-economic development projects in accordance with the approved local development plan and public investment program.
i. Deferred payment and similar financial schemes for land acquisition, among others (Sec. 298, Sec. RA 7160)
ii. Issuance of bonds, debentures, securities, collaterals, notes and other obligations, to finance the LGU’s self-liquidating, income producing development or livelihood projects pursuant to the priorities established in the approved local development plan and subject to the rules and regulations set by the Central Bank and Securities and Exchange Commission. (Sec. 299, RA 7160)
iii. Contracting for loans, credits and other obligations with other LGUs (Sec. 300, RA 7160)
Concerned LGUs may extend loans, grants or other subsidies to other LGUs under such terms and conditions as may be agreed upon by the contracting parties. These may be agreed upon by provinces, cities and municipalities, upon the approval of the majority of the local sanggunian concerned in amount not exceeding their surplus funds.
A compilation of information on non-traditional sources of funds may be found in the Resource Finder, a publication of the DILG with assistance from the Local Government Support Program (LGSP).
iv. Borrowing from the national government through its re-lending institutions using funds secured from foreign sources (Sec. 301, RA 7160).
v. Pre – financing by the private sector through the build – operate – transfer (BOT) scheme (Sec. 302, RA 7160 and RA 6957).

CHAPTER 3LOCAL DEVELOPMENT INVESTMENT PROGRAMMING
154
vi. Accessing Official Development Assistance
Official development assistance (ODA) is defined as those flows to developing countries which are provided by official agencies, including state and local governments, or by their executive agencies. It can be bilateral or multilateral technical assistance and loans.
Bilateral transactions are those undertaken by a donor country directly with an aid recipient. Multilateral contributions are those made to a recipient institution which is an international agency, institution or organisation whose members are governments, or a fund managed autonomously by such an agency.
The ODA is administered with the promotion of the economic development and welfare of developing countries as its main objective. ODA flows are either loan or grant. ODA loans are concessional in character (low inerest rate if loans) and sometimes, contain a grant element of at least 25%.
After assessing the amount of project financing that could be generated from each of the above modes the actions listed below follow:
NO
CONSERVATIV E APPROACH
LDC further trims down the Project List
Funds ava ilable for al l
Pro jects?
LDC approves final list of projects
LPDO prepares the 3-year Investment Program
& submits to LCE
LCE endorses 3-year Investment program to
Sanggunian
Sanggunian deliberates & adopts the LDIP
DEVELOP MENT APPROACH
YES
NO
LFC may recommend to LCE measures to improve fiscal management or incur
public debt or credit financing
LCE directs LFC to conduct further studies
LCE endorses LFC recommendation to
Sanggunian
If credit financing or public debt, Sanggunian
authorizes LCE to contract for loans, credits, etc.
Figure 19

CHAPTER 3LOCAL DEVELOPMENT INVESTMENT PROGRAMMING
155
a. The LFC recommends one or two modes to the LCE;
b. The LCE endorses the LFC’s recommendation to the Sanggunian;
c. The Sanggunian may, by resolution, authorize the office of the LCE to enter into contracts for loans, credits and other forms of indebtedness;
d. The LPDO prepares the 3 – year investment program and submits the draft LDIP to the LCE;
e. The LCE endorses the draft LDIP for adoption;
f. The Sanggunian deliberates on the draft LDIP;
g. The Sanggunian, through a resolution adopts the 3 – year investment program or LDIP.
Figure 20LGU Financing Options
1.8 What is the role of the province in local development investment programming of its component LGUs?
a. Identify areas for complementation of PPAs between and among provinces and their component cities/municipalities
b. Exercise by the Sangguniang Panlalawigan of its power of automatic review of all policies and actions of the component LGUs d to effect reconciliation and integration of programs, projects and activities.
c. Province may develop and undertake joint programs or augment the financial resources of its component cities and municipalities in implementing programs and projects that have significant impacts on the province as a whole; and
d. The province may enjoin component cities and municipalities to provide counterpart resources to implement programs and projects initiated by the province that have significant impacts on the entire province.
BOTBond
Flotation
LGU FINANCING OPTIONS
Internal Revenue Allotment
(IRA)
Official Development Assistance
(ODA)
Local Revenues
through Taxes and User Fees
Private Financing
Multilaterals Direct Loans MDF Bilateral
Borrowing/ Credit Financing
Public Private

CHAPTER 3LOCAL DEVELOPMENT INVESTMENT PROGRAMMING
156
1.9 How can national government agencies participate in local development investment programming?
a. Provide guides on making LDIP responsive to specific issues and concerns;
b. Influence LDIP by resources leveraging, lobbying and other techniques for pushing their programs, concerns and advocacies;
c. Promote the participation of concerned sectoral groups in the preparation of AIP;
d. Pick-up relevant programs and projects for inclusion in NGA programs;
e. Offer definite resource inputs to augment LGU resources;
f. Lobby for the integration of NGA programs/projects/services addressing concerned development / sectoral issues in the AIP; and
g. Urge LGUs to give priority to local projects identified by or addressing the needs of marginalized and vulnerable groups and to those that are mandated by/ consistent with national laws and/or that will reinforce the effects of particular national programs
1.10 How is an AIP prepared?
In accordance with the provisions of JMC No. 001 series of 2007, the “LDC shall cull out the AIP from the current slice of the LDIP, which upon approval of the Sanggunian, shall serve as the basis for preparing the Executive Budget. The LDC shall endorse the AIP to the local budget officer for the budget preparation and in determining the annual budgetary allocations for PPA vis-à-vis allocations for other purposes as indicated in the AIP Summary Form. (see Table 28)

CHAPTER 3LOCAL DEVELOPMENT INVESTMENT PROGRAMMING
157
SUMMARY FORMTable 28
CY ____ Annual Investment Program (AIP)By Program/Project/Activity by Sector
As of ____________________Province/city/Municipality/Barangay___________________________________________
AIP REFERENCE CODE
(1)
PROGRAM/PROJECT/ACTIVITY DESCRIPTION
(2)
IMPLEMENTING OFFICE/
DEPARTMENT(3)
SCHEDULE OF IMPLEMENTATION
EXPECTED OUTPUTS
(6)
FUNDING SOURCE
(7)
AMOUNT (in thousand pesos)
STARTING DATE
(4)
COMPLETION DATE
(5)
Personal Services (PS)
(8)
Maintenance and other Operating
Expenses (MOOE)(9)
Capital Outlay
(10)
Total
(11)
General Public Services
(10)
Economic Services (80)
Social Services (30)
Prepared By: Attested by:
_________________________________________________ ________________________________________________ ____________________________________________________Local Planning and Development Officer Budget Office Local Chief ExecutiveDate: _______________ Date: _____________________ Date: __________________________
Instructions: this form shall be prepared by the Planning and Budget officers of the local government unit based on the approved Local Development Plan of the LGU as approved by the Sanggunian. The annual components of the Capital Expenditure (Capex) shall be inputted by the planning Officer and shall be integrated by the Budget Officer together with the Personal Services (PS), Maintenance and Other Operating Expenses (MOOE) and other Capital Outlay (CO) into the total resource Annual Investment Program as the basis for the preparation of the Annual Budget.
Column 1: Indicate the reference code for the sector/sub-sector as per UBOM in order to facilitate consolidation of requirements.Column 2: Describe briefly the program/project/activity to be implemented and accomplished by the LGU (i.e. infrastructure projects, programs or activities)Column 3: Identify the office/department that will implement the program/project/activity.Columns 4 & 5: Specify the targeted starting and completion date.Column 6: Describe the output or results in quantified term (e.g. 3 kilometers of concrete road, 200 cavans of palay per hectare, 10 hectares of forested area, 400 pupils functionally literate, 5% reductrion in infant
mortality rate.Column 7: Indicate the funding source of the program/project/activity. Specify is sourced locally from the General Fund or grant/loan from outside sourcing or subsidy from the national government.Column 8: Indicate the estimated amount of the program/project/activity broken down into PS, MOOE and CO.
This form has to be signed by the Local Planning and Development Officer and Budget Officer and attested by the Local Chief Executive or his duly authorized representative.

158
PART III – IMPLEMENTING THE PLAN
Chapter 2 – Preparing a Capacity Development Program
The CDP, to be implemented effectively, requires a set of competencies and institutional arrangements that should be present in the LGU. This set of competencies and institutional arrangements comprise an organization’s capacity.
2.1 What is capacity?
The CIDA-LGSP defines capacity as “the abilities, skills, understandings, attitudes, values, relationships, behaviors, motivations, resources and conditions that enable individuals, organizations, networks/sectors and broader social systems to carry out functions and achieve their development objectives over time1.”
This definition classifies capacity into three levels:
1. Individual capacity which refers to the knowledge, skills, attitudes and values of individual employees;
2. Institutional capacity which pertains to the organizational structure, systems and processes, motivation system, leadership, technologies, physical facilities and other organizational components that help make the system operate; and,
3. Systems/sector capacity which pertains to policies, societal values or attitudes, development frameworks, institutional arrangements and other elements that affect the enabling environment.
2.2 What is capacity development?
Further using CIDA definition, capacity development refers to “the approaches, strategies and methodologies used to improve performance at the individual, organizational, network/sector or broader system level.2” Among its key objectives are to:
1. enhance or more effectively utilize skills, abilities and resources;
2. strengthen understandings and relationships; and
3. address issues of values, attitudes, motivations and conditions in order to support development goals.
2.3 What is a capacity development program (CapDev Program)?
A capacity development program is a document that seeks to rationalize and strategically focus the capability building efforts of LGUs. It outlines the capability building interventions or programs that need to be undertaken to address an identified capability deficiency. The benefits derived from capacity development planning are not only confined to Plan implementation but they can also last even beyond the plan period.
The CapDev Program outlines the capacity development strategies, programs and initiatives that need to be undertaken to address identified organizational competency gaps, indicating the target groups, specific approaches that are recommended, resources required and the timeline. It requires that the implementation period of the program also covers the 3-year
1 CIDA-LGSP2 Ibid

159term of the local chief executive that also coincides with the term-based plan of the LGU, or the ELA, which should, in turn be the basis for setting the annual priorities of the LGU as articulated in the annual investment plan.
2.4 What is the difference between a CapDev Program and a Human Resource Development Plan?
If the capacity development plan focuses only on human resource development, then it isreferred to as Human Resource Development (HRD) Plan. The HRD plan is a component of the broader CapDev Program, the latter encompassing other elements comprising the organization.
At the individual level, or HRD, capability enhancement is not only confined to training. There are other modes to enhance the skills and knowledge of people in an organization. These include:
1. coaching,
2. mentoring,
3. exposure trips/exchange program, etc.
At the organizational level, capacity development interventions may include the following:
1. installation or mainstreaming of systems and structures,
2. improvement of work processes,
3. introduction of new technologies, and/ or
4. enforcement of rules.
2.5 What are the steps in formulating a capacity development plan?
There is no “one way” to capacity development planning. Nonetheless, following are some suggested steps:
1. Establish the organizational and individual competencies that are needed to implement the CDP.
a. What capacities should be present in the LGU to support the implementation of priority programs and projects?
2. Examine existing capacity vis-à-vis desired competencies.
a. Does the LGU have adequate leadership, management, technical skills, organization arrangement, motivation, technology and equipment, systems and procedures, regulations, ordinances, and funds to accomplish the goals of the CDP
3. Identify capacity gaps.
a. Where are gaps in capacities?
b. Which capacity areas need to be prioritized?
Available local government performance management systems such as the Local Governance Performance Monitoring System (LGPMS) should be able to provide useful information on the organizational capacity of the LGU.

160
4. Identify priority strategies or actions that need to be taken to improve capacities.
a. What should be done to improve or develop capacities?
5. Prepare a capacity development plan and budget.
a. How much time, effort and budget would be required to make improvements in the present capacity of the LGU and is it worth it?
6. Assign roles and responsibilities to achieve the goal and the capacity objectives.
7. Monitor the plan and make adjustments as required.
a. Should goals and objectives be adjusted given present capacity?
Table ___Sample Format of a Capacity Development Plan
Sectoral GoalPriority HRD/Capacity
Development InterventionTarget Office Staff Desired outcome Implementation Details
(timeframe, who are involved)
Example 1: Increased own-source revenue
Computerization of real property tax
Treasurer’s Office, Assessor’s Office
Revenue collection from RPT increased by ___%
1 year, treasury staff
Example 2:Improve access of the poor to quality primary health care services
Training of rural health workers
Rural health workers Upgraded knowledge and skills of rural health workers on primary health care
2 weeks, all rural health workers in the LGU
Box ___ Some Tips in Capacity Development Planning
Conduct a separate orientation on Capacity Development Planning - Proper grounding of the Planning Team, and other LGU department heads who will be closely involved in the activity on capacity development concepts and tools would be useful in implementing the activity.
By its very nature, capacity assessment may appear threatening to some LGU staff and constrain them from giving accurate information. It is therefore important that LGU department heads are thoroughly oriented on and understand the process as they are the key informants.
Generating accurate information on the LGU’s administrative and operational capacity – An LGU capacity profile is usually not readily available. It may require substantial data gathering work, and therefore, take sometime. The Planning Team may utilize a combination of techniques in generating the required information.
If necessary, engage the servives of an external facilitator/advisor to assist the Planning Team in assessing capacity and developing a Comprehensive Capacity Development or HRD Plan.

161
2.6 Is there a need to prepare a separate capacity development or human resource development plan?
While the preparation of capacity development or human resource development programmay require a separate process, the activities and budget related to making capacity improvements should be part of the goal and objectives under the Institutional Sector of the CDP. Key interventions to develop the required capacities for Plan implementation may either be integrated in the design and budget of sectoral programs and projects or be all placed under the Institutional Development cluster.
If capacity improvement measures are integrated in the design and budget of sectoral programs and projects, the budget and operational plan for capacity development, e.g. training, should be part of the overall plan, annual budget and the three-year investment plan for the particular program goal. This keeps all the program activities that need to be carried out, as well as the budgets, together and makes implementation and accountability clearer. This also reduces the vulnerability of capacity development or HRD budget from being totally slashed should there be budgetary constraints within the LGU.
At the same time, there may be good reasons for wanting to see capacity improvement interventions in one place. For example, many training interventions may be proposed, and rather than having them scattered and uncoordinated, it may be more efficient to bring them together under the responsibility of the HRD person or to integrate them into the LGU’s HRD plan or Development Administration/Institutional Development section of the CDP. This strategy however puts the plan at high risk of being the first to go, as has been the practice of many LGUs as it is given the least priority.
Box ___Example of Capacity Assessment for a Revenue Goal
The LCE together with other stakeholders sets a goal to double the amount of real property taxes collected over the next 3 years. In the process of setting the goal, several issues were identified:
There is no computer or software available in the LGU There are staff available but they lack computer skills The treasurer will retire at the end of this year The revenue code is out of date Many people are behind in their tax payments
Clearly, more detailed work will have to be done. There will be a need for budget estimates (cost of computer, software and training). Other information, e.g. how can we find out about better tax assessment methods? Why are people behind in paying their taxes? will be needed. One of the managers will have to be assigned responsibility for developing an operational plan over the coming months. Perhaps a small task force will be needed to gather more information and to follow up on this work.
In preparing the operational plan for this result area, the following issues may have to be addressed:
What professional and personal qualities a new treasurer should have? How should job descriptions of lower level staff be improved? What kind of staff skills and experience are necessary? Do we have the right kind of organizational arrangements? Are changes in existing procedures, regulations and ordinances needed? How are we going to maintain the equipment? How do we motivate citizens to pay taxes?

162
2.7 What other tools can be used in preparing a Capacity Development Program?
1. LGPMS – LGPMS results for input indicators (structures, policies, administrative systems, managerial and technical competencies, tools, facilities, equipment and financial resources of the LGU) provide a relatively comprehensive picture of the capacity level of LGUs. They can set a good starting point for gauging the capacity level and identifying the capacity needs of the LGU. Further examination of the sub-indicators assigned to particular indicator and the rating scheme can describe the nature of adeficiency if such exists, and how it might be addressed. The strategies and actions to address the deficiency/ies would form part of the LGU’s Capacity Development Program.
2. SCALOG – The use of SCALOG takes off from a strategic plan of an LGU such as a Comprehensive Development Plan (CDP) or an Executive and Legislative Agenda (ELA). It presupposes that any effort to improve LGU capacity should be geared towards contributing to the attainment of development objectives and goals outlined in these LGU plans. i Using SCALOG as a tool is to ensure that the Capacity Development Program will help define the necessary capacity requirements for effective and efficient implementation of the LGU’s priority programs and projects.
i Maria Concepcion Pabalan, et al. How to Formulate an Executive and Legislative Agenda for Local
Governance and Development: Facilitator’s Guide, Philippines-Canada Local Government Support Program,
2004, Manila, Philippines.

163
PART III – IMPLEMENTING THE PLANChapter 3 – The Executive and Legislative Agenda
3.1 What is an Executive and Legislative Agenda (ELA)?
The Executive-Legislative Agenda (ELA) was conceived to serve as a “powerful vehicle for effective local governance”. It may be defined as:
a. a planning document, covering a 3-year period corresponding to the term of local elective officials that is mutually developed and agreed upon by both the executive and legislative departments of an LGU;
b. an integrated plan that contains the major development thrusts and priorities of both the executive and legislative branches towards a common vision for the locality;
c. an instrument that will prioritize responses to multi-stakeholder needs, e.g., programs, projects, activities, legislations and capacity development programs, and put into action local development plans.
3.2 What are the characteristics and uses of an ELA?
An ELA has the following important uses:
a. Leads the executive and the legislative branches towards a unified vision, mission, goals and objectives;
b. Enables the executive and legislative branches to agree on priority problems and issues;
c. Helps the LGU focus on a set of interventions towards the attainment of a common set of objectives and goals;
d. Increases the chances for implementation of priority programs of the executive department, if the legislative branch formulates ordinances in support of the LCE program of government; and
e. Speeds up the implementation of priority projects.
As a planning and budgeting tool, an ELA:
a. provides a 3-year development roadmap for the LGU;b. helps identify results that will contribute to the LGU’s long-term vision;c. identifies priority programs and projects that will help accomplish these results within
the term of local elective officials; andd. organizes and allocates local resources expected to be generated or mobilized within
the 3-year term of the LCE and Sanggunian in a rational and results-oriented manner.
As a performance management tool, an ELA:
a. provides a basis for ensuring that 3-year LGU programs, projects and legislative measures are implemented and are producing the desired impact; and
b. helps various departments of the LGU set performance targets for a 3-year period, thus encouraging greater accountability for results.

164
As a communication tool, an ELA:
a. allows elected officials to present and articulate their political agenda;b. encourages closer interface between the executive and the legislative officials; andc. allows for elected officials to report back their accomplishments and achievements.
As a convergence tool, an ELA
a. encourages collaboration between the executive and legislative departments; andb. provides avenues for consensus among diverse stakeholders in pursuing a set of
unified actions designed to bring about the desired changes in the local communitywithin the short-term.
3.3 What is the relationship of ELA with the CLUP and the CDP?
It is important to bear in mind that the ELA does not replace or supplant the existing plans of the LGU (How to Formulate an Executive and Legislative Agenda for Local Governance and Development, page 10). Rather, it builds on existing plans which LGUs are mandated to prepare, i.e., the CLUP and the CDP. In fact, the ELA can be considered as an implementing instrument of the CDP and for that matter, the CLUP, considering that the CDP can also be considered as a tool for implementing the CLUP.
The relationship of the ELA with the CLUP and the CDP and with their respective principal tools for implementation is illustrated in Figure ___:
The CLUP is the plan for the long-term management of the local territory, which is a function of an LGU as a political body and partner of the national government. As earlier described, it is the skeletal-circulatory framework of the territory’s physical development that identifies areas where development can and cannot be located and directs public and private investments accordingly.
The CDP, on the other hand, is the 6-year (medium – term) action plan utilized by every local administration to develop and implement priority sectoral and cross-sectoral programs and projects in the proper locations to put flesh on the skeleton as it were, gradually and incrementally, until the desired shape or form of development is eventually attained over the
Figure ___ RELATIONSHIP OF THE ELA TO THE CLUP AND CDP
LONG-TERM PLANComprehensive Land Use
Plan (CLUP)
MEDIUM-TERM PLAN (6 Years)Comprehensive
Development Plan (CDP)
Zoning Ordinance
TERM-BASED PLAN (3-Years)Executive and Legislative
Agenda (ELA)
Local Development Investment Program
(LDIP)
Legislative Requirements
Capacity Deve lopment
Program
Annual Investment Program (AIP)
PLANSIMPLEMENTATION INSTRUMENTS

165
long term. The identification, screening, and prioritization of programs and projects in the CDP will be guided by the location policies in the CLUP.
The Executive and Legislative Agenda (ELA) is a 3-year program of action crafted based on the priorities and thrusts of newly or re-elected LCEs and Sanggunian members in the context of the vision, goals and objectives of the LGU. The preparation process adoptsmechanisms that facilitate convergent planning and decision-making processes between the executive and legislative departments of the LGU with technical support and inputs from the Local Development Council and its sectoral and functional committees.
The ELA is not meant to replace or duplicate existing planning systems in LGUs. Rather, itadds greater value to the CLUP and the CDP by moving them forward to getting implemented and monitored.
3.4 When is the ELA formulated?
It is highly desirable that ELA preparation commences within the first six (6) months from the assumption into office of the re-elected or newly-elected local officials, i.e., Mayors, Vice Mayors and members of the Sanggunian.
3.5 What are the considerations for preparing an ELA?
LGUs are advised to prepare an ELA even in the presence of a CDP or CLUP to guide the Local Chief Executives and members of Sanggunian in developing their localities for the duration of their three-year term of office. The preparation of the ELA will in fact be greatly facilitated when a medium-term CDP is already in place for the following reasons:
a. planning targets for the 3-year term of the LCE can be extracted from CDP; and
b. strategies of the ELA can be based on 6-year CDP, particularly those that can be realistically accomplished in three years.
In preparing the ELA LGUs are, however, enjoined to adhere to the following principles:
a. The planning process, which is participatory, consultative and inclusive, as suggested in the CDP, be adopted.
b. The scope and elements of the ELA or the term-based agenda covers ALL the development sectors.
c. That the elements of JMC No. 001 series of 2007, listed below among others, be integrated in the 3-year CDP or ELA, namely:
i. Interface between the LGUs and NGAs;
ii. Complementation between the Province and its component LGUs;
iii. Synchronized Local Planning and Budgeting Calendar
iv. Annual Investment Program as enunciated under the JMC

166
3.6 What are the contents of the ELA?
The substantive elements of the ELA are suggested below:
1. Preliminaries
Message of the Local Chief Executive Message of the Vice Mayor and Presiding Officer of the Sanggunian Sanggunian Resolution Adopting the ELA (Please see Box ___) Executive Summary Vision Statement derived from the CLUP or CDP
2. Sectoral Situationer
Local Development Indicators
Shown in 3-dimentional matrix, i.e., sectoral (type of indicator: input, output, outcome and impact indicators by sector), temporal (indicators for two periods) and spatial (between an LGU and its components, i.e., barangays in the case of a city or municipality and/or the higher LGU, i.e., province or region to which it belongs)
Inputs to the LDIs may be derived from the LGPMS and CBMS, where the latter is available and from other NGA-based sources when not found in either the LGPMS and the CBMS
Issues and Concerns by Sector
Derived from a review of the immediate past ELA or CDP and results of a vision –reality gap analysis (Chapter 4, Part II of this enhanced Guide to CDP Preparation)
3. Sectoral Goals and Objectives/Targets
Derived from problem – solution – finding analysis conducted and results of the review of the immediate past ELA or CDP (Please refer to Chapters 3 and 4, Part II of this Enhanced Guide to CDP Preparation)
4. 3 – Year Capacity Development Agenda
May contain new or continuing capacity development programs (Please refer to Chapter 2, Part III of this Enhanced Guide to CDP Preparation)
5. 3 – Year Legislative Agenda
May contain newly – crafted, amended or unfinished legislative actions (Please refer to Chapter 3, Part III of this Enhanced Guide to CDP Preparation)
6. Local Development Investment Program
For the suggested methodology in local development investment programming, please refer to Chapter 1, Part III of this Enhanced Guide to CDP Formulation

167
Box ___RESOLUTION NO. ___, Series of ____*
“ADOPTING THE EXECUTIVE-LEGISLATIVE AGENDA OF THE MUNICIPALITY/PROVINCE/CITY OF ____”
WHEREAS, the Executive-Legislative Agenda (ELA) sets the local government’s strategic directions for the next three years and provides an explicit expression of the present administration’s goals, objectives, strategic priorities and programs that are consistent with the LGU vision and mission;
WHEREAS, the formulation of the ELA involved the participation of various stakeholders in the community in its various stages, from needs identification to plan implementation, monitoring and evaluation;
WHEREAS, the ELA represents the collective aspiration, needs and priorities of the local community and therefore enjoys broad-based support;
WHEREAS, the ELA is this administration’s sincere invitation to all its constituents and resource institutions to be its pro-active partners in progress;
NOW THEREFORE, this body in session assembled,
RESOLVED, to adopt as it hereby adopts, the Executive-Legislative Agenda of the Municipality/ Province/City of ______.
CARRIED
(Date)
I hereby certify to the correctness of the foregoing resolution which was duly adopted by the Sanggunian Bayan/Panlalawigan/Panglungsod during its Regular Session on _______.
(Signed)__________________Secretary to the SB
ATTESTED:________________________
Presiding Officer
__________________ ____________________ _________________Sanggunian Member Sanggunian Member Sanggunian Member
__________________ _____________________ _________________Sanggunian Member Sanggunian Member Sanggunian Member
APPROVED:
____________________________ _______________________Mayor /Governor Secretary to the Sanggunian
* Adopted from the Manual on How to Prepare an Executive and Legislative Agenda

168
3.7 What are the scenarios under which the ELA may be formulated?
The preparation of an ELA may be undertaken under one of the following scenarios indicated below:
Scenario 1: The LGU has an updated and Code-compliant CDP and CLUP
a. Re-visit the long-term CLUP and/ or the medium-term CDP and review the extent to which the LGU vision/ mission has been achieved.
b. Re-visit of the Vision, Goals and Objectives/Targets
c. If necessary, re-formulate policies, strategies, goals and objectives/ targets indicated in the CDP to make them more responsive to the current reality and with due consideration given to the priorities of the LCE and the Sanggunian.
d. Identify and prioritize programs and projects for implementation within the term of the local elective officials and input to the Local Development Investment Program.
e. Review the immediate past 3-year Capacity Development (CapDev) Program. Identify new, additional and/or revise CapDev Program to make it consistent with the revised sectoral goals and objectives and thrusts and priorities of the LCE and the Sanggunian.
f. Review the immediate past legislative agenda. Identify new, additional and/or revise legislative requirements and actions to make them consistent with the revised sectoral goals and objectives and thrusts and priorities of the LCE and the Sanggunian.
g. Consolidate outputs of Steps “b” to “f” above and submit to LDC for approval. When approved, LCE submits the same to the Sanggunian for adoption.
h. Package the ELA (Please refer to 4.5 of this Chapter).
i. Prepare the Annual Investment Program (AIP) based on the LDIP contained in the ELA using AIP Summary Form provided under JMC No. 001 s. 2007.
Scenario 2: The LGU has a Code-compliant CDP but non-compliant CLUP
a. In the case of a non-compliant CLUP, coordinate with HLURB and enjoin the LGU to prepare a Code-compliant CLUP.
b. Proceed to Steps “a” to “i” under Scenario 1.
Scenario 3: The LGU has a Code-compliant CLUP but non-compliant CDP
a. In the case of a non-compliant CDP, prepare the LDIP, Capacity Development Program and Legislative Agenda following the suggested methodology in this Enhanced Guide to CDP.
b. Prepare the ELA. (Please refer to 4.5 of this Chapter)

169
c. Prepare the Annual Investment Program (AIP) based on the LDIP contained in the ELA using AIP Summary Form provided under JMC No. 001 s. 2007.
d. Iterate the ELA in a Code-compliant CDP prepared following this Enhanced Guide to CDP Preparation.
Scenario 4: The LGU has an ELA only – no CLUP OR CDP
a. This ELA may be used as a springboard for preparing a CDP.
b. Review and evaluate the current or latest ELA against actual implementation.
c. Using the results of the review and evaluation as well as the State of Local Development Report, proceed to the formulation of the CDP following the steps suggested in this Enhanced Guide to CDP Preparation.
3.8 How does the original 12 – step ELA formulation process fit into theprocess under this Enhanced Guide to CDP Preparation?
The table below shows where each of the 12 steps in the ELA Formulation process fits in the Enhanced Guide to CDP Preparation following the steps in the simplified sectoral planning process.
12- STEP ELA Formulation Process(Manual on How to Formulate an Executive
and Legislative Agenda)
Contents of the Enhanced Guide to CDP Preparation following the Simplified Sectoral
Planning Process
Step 1: Planning to Plan Getting Started (Part I)
Step 2: Prioritizing Issues Analyzing the Development Sectors (Chapter 3, Part II)
Step 3: Consulting with Stakeholders This is an integral part of each step in the CDP process and not taken separately or independent of all the other steps.
Step 4: Defining / Re-visiting the LGU Vision and Mission
Setting the Vision (Chapter 1, Part II)
Step 5: Formulating Goals and Objectives Setting Sectoral Goals (Chapter 4, Part II)
Step 6: Prioritizing Programs and Capacity Development Needs
o Transforming Goals into Actions (Chapter 5, Part II)
o Local Development Investment Programming (Chapter 1, Part II)
o Capacity Development Agenda (Chapter 2, Part III)
o Legislative Agenda (Chapter 3, Part III)
Step 7: Determining Legislative Requirements

170
Step 8: Building Commitment
In the CDP Process, this is not taken as a separate step. Commitment from the widest spectrum of stakeholders is secured and firmly rooted at the outset of the plan preparation process – from the mobilization and active involvement not only of the Local Development Council and its sectoral and functional committees, but also the mother province of an LGU as well as NGA representatives operating in the area, to plan implementation and up to plan monitoring and evaluation. (From Getting Started (Part I) to Plan Monitoring and Evaluation (Part IV).
Step 9: Securing endorsement and approval This chapter (Chapter 4, Part III – Implementing the Plan) of the Enhanced Guide.
Step 10: Moving the ELA into Action Steps 6, 7 and 10 are consolidated as discussed in Part III (Implementing the Plan) of the Enhanced Guide
Step 11: Popularizing the ELAJust like Step 3, Step 11 is an integral part of each step in the CDP process considering that it is participatory, inclusive and consultative. Establishing a sense of “ownership” of actions and outputs under each step is therefore an approach to “popularizing the ELA” not only as an end-product of an exercise, but as a guide towards fulfilling the goals and aspirations of all stakeholders as articulated by stakeholders during the plan formulation process.
Step 12: Managing and Sustaining ELA Implementation o Plan Monitoring and Evaluation (Part IV)
3.9 How long does it take to prepare an ELA?
The ELA preparation process may take three (3) to six (6) months depending on availability of data and information for consideration and basis for crafting the document, schedule and mutual acceptance of the LCE and Sanggunian of the draft ELA, as well as the capacities of the LGU in terms of resources and technical readiness for Plan preparation.
3.10 Who is responsible for preparing the ELA?
The Local Development Council is the planning structure mandated to formulate plans for the LGU, for approval of the Sanggunian. A functional committee under the LDC to be known as the ELA Planning Team, however, may be created to assist the LDC in preparing the ELA. To the extent possible, it should include not only heads or representatives of the various LGU offices or departments but also members of the standing committees of the Sanggunian and representatives from the private sector, non-government organizations and national government agencies operating in the locality.

171
PART III – IMPLEMENTING THE PLAN
Chapter 4 – Determining the Legislative Requirements
4.1 What are legislative requirements?
The legislative requirements of the CDP are the priority legislations that need to be enacted by the Sanggunian to support development priorities of the LGU in the medium – and long –term. These may include new legislation as well as amendments and updates to existing legislation.
For example, if the LGU is undertaking an Investment Promotion Program, there may be a need for a legislation to amend its existing Investment Code. An example of legislative requirements to support the goals and objectives, as well as the programs and projects are shown in Table __ (Sample Table of Legislative Requirements).
The needed legislative measures to support the implementation of programs and targets aimed at achieving the goals, objectives and targets set for the 3 – year term of the LCE and the Sanggunian members comprise the legislative agenda. This will be entered in the 3 –year CDP, or the Executive and Legislative Agenda (ELA).
Table ___. Sample Table of Legislative RequirementsSector Goal Objective Priority
Programs and Projects
Legislative Requirements
Timeframe Committee Responsible
Economic Improved local economy
Increased investments
Investment Promotion Program
Amendment of Investment Code
2007 Finance, Appropriations, Ways & Means
Institutional Improved capacity of LGU
Fiscal gap reduced
Revenue Enhancement Program
Updating the Revenue Code
2008
Environment Improved marine environment
Mangrove Rehabilitation Program
2008 Environment
Figure ___ shows the link between the CDP legislative requirements and the 3 – year legislative agenda which bears part of the Executive and legislative Agenda (ELA). The figure shows that only a portion of CDP legislative requirements can be picked-up by the Sanggunian for their three year LA that can also form part of the ELA priority legislative requirements.

172
4.2 When are legislative requirements determined?
Legislative requirements are determined after sectoral objectives and targets shall have been set, that is, during the development of policies, programs and projects that are aimed towards the attainment of the desired results that will ultimately attain the sectoral goals and objectives in the short – and medium term, and the LGU vision in the long term.
4.3 Who are responsible for determining legislative requirements?
The local sanggunian members, who are selected to be part of the planning team, are mainly responsible for determining legislative requirements. This does not however preclude other stakeholders to recommend legislations to support the development thrusts of the CDP.
4.4 How are legislative requirements developed?
In generating regulatory measures, it is advisable to first check whether:
a. a new legislation is really needed;
b. the intended legislation is within the limits of the prescribed powers of the LGU;
c. the intended legislation is necessarily implied from the prescribed powers of the LGU;
d. the intended legislation is really necessary, appropriate, or incidental for the LGU’s effective and effective governance;
e. the intended legislation is essential to the promotion of the general welfare.
CDP Legislative Requirements
Legislative Agenda
PRIORITIES FOR A 3- YEAR PERIOD
Figure ___: Link of CDP Legislative Requirements and the 3 – Year Legislative Agenda

173
To determine the appropriate action to take regarding local legislations, the fishbone analysis as shown in Figure ____ may be helpful.
Figure ___ IDENTIFYING LEGISLATIONS
LEGISLATIONNEEDED
NOT EXISTENT ENACT ORDINANCE
DEFICIENT IMPLEMENTATION
IMPLEMENTED PROPERLY
NOT IMPLEMENTED
AT ALL
EXISTENT DEFECTIVE
STILL SOUND
INADEQUATE
REPEAL
AMEND
REPLACE
STRENGTHEN IMPLEMENTING
AGENCY
INCREASE SANCTIONS FOR
VIOLATORS
STRENGTHEN IMPLEMENTING
AGENCY
REPLACE

CHAPTER 7PLAN MONITORING & EVALUATION
174
PART IV
PLAN MONITORING AND EVALUATION
Planning is regarded as a continuous or cyclical process. In the Philippines, however, it is often considered a project which has “time start” and “time finish” elements. The prevalent notion is that it is simply a process to produce a document.
For planning to be truly continuous, however, it must form part of the regular function of the LDC. One major activity that the LDC is mandated to perform is to “coordinate, monitor, evaluate the implementation of development programs and projects” (Section 109 (a) (5), RA 7160).
What is monitoring?
Monitoring is a continuous process of data collection and analysis to check whether a project is running according to plan and to make adjustments if required. It is an evaluative study directed to the short term.
What is evaluation?
Evaluation is a systematic process of collecting and analyzing information about activities and results of a project in order to determine the project’s relevance and/or to make decisions to improve the efficiency and effectiveness of a project.
Table ____ shows the salient features differentiating monitoring from evaluation.
What is the importance of monitoring and evaluation (M & E) in the planning process?
M & E are essential tools for management. Properly utilized, they are mutually reinforcing in that:
1. A well – functioning monitoring system can greatly reduce the need for in – depth evaluation as problems are revealed and resolved in a timely manner.
2. Monitoring can also indicate the need for in – depth evaluation of problems and issues.
3. In – depth evaluation may show the need for a new and improved monitoring system.
What is plan monitoring and evaluation?
Plan M & E is concerned not with mere project outputs per se, but with the:
1. effects of the utilization of the outputs produced (project outcomes);
2. contribution of the outputs to the realization of development goals (project impacts);
3. determination of impacts of public sector planning interventions (programs, projects, services and regulatory measures); and
Plan monitoring and evaluation must serve as the link between two planning cycles.

CHAPTER 7PLAN MONITORING & EVALUATION
175
4. impacts of private sector investments on the local area and population.
What is the importance of M & E in the cyclical planning process?
M & E serves as the link between one planning cycle to the next. The concerns of M & E for cyclical planning, therefore, are much broader and deeper than those of project M & E. Its critical important lies in the production of new information derived from the following:
TABLE ____Salient features of Monitoring and Evaluation
Differentiating Factors Between M & E Monitoring Evaluation
Meaning Systematic observation and documentation of information on the implementation of plan;
Continuous tracking/measurement of progress and performance against what was planned (time, outputs, resource use, cost);
In-depth analysis and comparison of planned versus actual achievements;
Systematic measurement of performance at the level of development goals and objectives (UNDP, 2002);
Systematic analysis of the relevance, efficiency, effectiveness, benefits, impact and sustainability of the plan;
Focus Programs, projects and activities Overall relevance, impact and sustainability
Importance Tracks progress (or lack thereof) of plan implementation and determines whether priority programs and projects outlined in the plan are actually implemented;
Ensures that programs and projects are implemented and managed efficiently and effectively;
Identifies problems in plan implementation in its early stage and allows decision and policy makers to address the problems or make appropriate adjustments;
Alerts managers to problems and provides options for corrective actions; and
Provides recommendations for remedial actions.
Generates information and provides lessons that would guide the LGU in updating the Local Development Plan;
Ensures informed decision-making
Identifies the extent to which the objectives of the Local Development Plan are achieved or whether the Local Development Plan addresses effectively the needs of the citizens; and
Ensures that resources are strategically managed and put to the best possible use.

CHAPTER 7PLAN MONITORING & EVALUATION
176
1. assessment of impacts of plans, programs and projects as implemented;
2. effects of regulatory measures as enforced; and
3. outcomes of developments in the area that had not come under the control or influence of the planning system.
M & E for cyclical comprehensive planning is concerned with determining the changes attributed to planned and unplanned developments. These changes manifest themselves in terms of a changed state of the following:
1. social and economic well – being of the inhabitants;
2. quantity and quality of the physical environment; and
3. institutional capabilities for local governance
What is M & E vis-à-vis Long – term Planning?
New and feedback information should be clustered around the five development sectors with specific responsibilities to describe and possibly measure changes in the area over the long - term as follows:
1. Social Sector – changes in the following:
a. Demographic composition, growth behavior and spatial distribution of the area’s population
b. Changes in the level of welfare of individuals and households;
c. Changes in the availability of and access to basic social goods and services; and
d. Advances made by society in the promotion of equity and social justice.
2. Economic Sector changes in the following:
a. General individual income levels and average household incomes;
b. Conditions in employment, unemployment and underemployment;
c. Level of self – sufficiency in the different food commodities; and
d. If possible, measurement of capital inflows (difference between inflows and outflows) into the area and the manner this capital is circulated in the local economy
3. Environment Sector – changes in the following:
a. Stock and quality of various natural resources as a result of domestic utilization and economic extraction;
The principal aim of M & E for cyclical planning is to build up the planning database for the successor plans. Cyclical planning in which an M & E system in place makes possible need not involve the preparation of new successor plans every time. Revision of certain features of the predecessor plan does not make the process any less cyclical or continuous.

CHAPTER 7PLAN MONITORING & EVALUATION
177
b. Size, direction and intensity of the built environment and corresponding conversion of agricultural, forest or wetlands;
c. Degree of success in the preservation of protected areas;
d. Sustainability through judicious consumption and avoidance of waste of water supply;
e. Overall quality of the environment resulting from waste management systems and nuisance abatement mechanisms that had been put in place during the last decade; and
f. Degree of success in the enforcement of national laws and local ordinances on the environment and natural resources.
4. Infrastructure Sector
a. Adequacy of social and physical capital build up to under gird economic prosperity, public health, safety, comfort and convenience;
b. Appropriateness of infrastructure to support the realization of the chosen spatial strategy;
c. Status in the backlogs in the provision of basic social services;
d. Changes in the quality of services and facilities resulting in changes in the generalwelfare of the residents;
e. Changes in the level of vulnerability of the residents as a result of facilities to rduce environmental risks and disasters; and
f. Changes in the environmental quality owing to the integrity of the protective structures and civil works
5. Institutional Sector
a. Institutionalization of local structures and processes for planning, program and project development and management, and monitoring and evaluation of the outputs, outcomes and impacts of plans, programs, services, regulatory measures and other forms of public intervention;
b. Efficiency and effectiveness with which the local government bureaucracy utilizes resources to deliver services demanded by its various publics;
c. Changes towards ensuring participation in governance processes, transparency in LGU transactions and accountability of public officers; and
d. Indication of responsiveness of successive administrators to the needs of their constituents as can be inferred from the accumulated legislative output during the last decade.

CHAPTER 7PLAN MONITORING & EVALUATION
178
Using the new set of data – The new set of data derived from monitoring and evaluating the status of development after a lapse of one decade may not be used to prepare another plan altogether. It may well be that the long-term vision and goals are still sound and valid. But the new characterization of the current reality might warrant a revision of the current reality rating and a corresponding change in the vision-reality gap. A new appreciation of the gap should result in new sectoral goals, objectives and targets to recalibrate the indicators originally formulated which are not yet fully attained.
Another feature of the CLUP that needs reviewing at the onset of new M & E data is the chosen spatial strategy or urban form. The new data might indicate variance in the direction, intensity or size of the built environment from the chosen spatial form. This may be due to unrealistic assumptions in making growth forecasts or to certain shortfalls in the needed interventions. Either way the needed adjustment may not entail a complete change of the plan.
What is M & E vis-à-vis the sectoral planning process?
In the simplified planning process, the role of M & E is to determine the changes in the current reality after a lapse of time so as to make new estimate of the vision – reality gap and thereby formulate new sectoral goals, objectives and targets, identify new programs, projects or activities, etc.
This entails updating the database for planning, such as the ecological profile, but more importantly, the LDIs.
What is M & E vis-à-vis the AIP / Budget cycle?
The shortest planning cycle where M & E finds useful application is the annual investment programming as an integral part of the annual budgeting process. The investment programming process takes place prior to the start of the budget preparation to ensure that priority programs and projects get the proper budgetary allocation, and are implemented in the ensuing fiscal year.
In making up the priority list in any the successor AIP, not only the LGU’s financial performance in implementing the programs, projects and services but also feedback information regarding the effects of the previous year’s programs and projects should be used. The only practical feedback information from M & E that could be used in preparing the succeeding year’s budget are the monitored outputs of the previous year’s interventions and possibly the monitored financial performance in the implementation of the current year’s budget up to the third quarter.
To inject rationality in the budgeting process and ensure transparency and accountability in public expenditure management, the scope and purposes of the M & E should be expanded to include an assessment of the following:
1. efficiency in utilization of inputs to realize outputs;
2. effectiveness of outputs in realizing desired outcomes; and
3. extent to which public expenditure contributed to the attainment of broader social and economic goals.

CHAPTER 7PLAN MONITORING & EVALUATION
179
What is M & E vis-à-vis the 3 – Year CDP or ELA?
The preparation of the successor CDP or ELA will require feedback information on outcomes and impacts. This is because the effects of intervention do not manifest themselves until after two or three years from the completion of the intervention.
Who should do the M & E?
1. Local Development Council (LDC) – Section 109 (a) (5) of the Local Government Code “coordinate, monitor, evaluate the implementation of development programs and projects”.
2. Sectoral and Functional Committees of the LDCs – M & E is a built – in function of the sectoral or functional committees (Rule Xxiii, Art. 182, (g) (3) vi, IRR of RA 7160), which directs them “to provide the LDC with data and information essential to the formulation of plans, projects and activities”. These planning information are derived from baseline surveys, in – depth studies, as well as from M & E.
3. Local Planning and Development Office(LPDO) – Through the sectoral committees, the LPDO performs its M & E functions as provided for under the Sec. 476 (b) (4), RA 7160) stated as follows: “To monitor and evaluate the implementation of the different programs, projects and activities in the local government unit concerned in accordance with the approved development plan”.
4. Planning Information Management Division – The M & E function is embedded in thisdivision of a full – blown LPDO.
5. Functional Committee – In the case of lower – income LGUs the M & E function could be devolved to a functional committee consisting of a representative of each of the sectoral committees coordinated by the head of any staff of the LPDO.
6. Implementing office or agency – For short – term M & E or project implementation.Project monitoring results may be discussed during executive meetings of the LGU.
7. The Project Monitoring Committee (PMC) – The Project Monitoring Committee (PMC) at the provincial, city and municipal levels are tasked to monitor government projects funded from foreign and national funds including development projects funded from the IRA and projects funded from locally-generated resources (EO 93, 1993).
The composition of the PMC is left to the discretion of the LDC subject to the inclusion of the following as mandatory members:
a. DILG representative or Local Government Operations Officer assigned in the area
b. One representative of NGO/PO
c. One representative of NGO members in the LDC
d. Four PMC members appointed by the LCE from among the nominees of the LDC
The Chair of the PMC will be appointed by the LCE from among three nominees nominated out of the seven PMC members.

CHAPTER 7PLAN MONITORING & EVALUATION
180
8. The Legislative Oversight Committee – Legislative oversight is an integral part of the legislative process. Legislative oversight refers to the legislature’s review and evaluation of activities of the executive branch. The sanggunian has a duty to ensure that plans, programs and projects are implemented and administered efficiently, effectively and in a manner consistent with legislative intent. Oversight is the focus of work of special committees but can be part of the hearings and work of standing committees in the sanggunian.
During committee hearings and meetings, the sanggunian may invite their counterparts in the executive department to brief its members on the status of a particular program that it wants to evaluate. To illustrate, the Committee on Trade and Industry may invite the members of the local tourism board to present a report on the implementation of its tourism program. Meetings of this type can be scheduled on a monthly or quarterly basis (Villaluz 2004).
How can other stakeholders be involved in M & E?
Participation of local constituents in monitoring should be encouraged. This can be achieved by including a CSO/private sector representative in the monitoring team. Another approach is to establish regular feedback mechanisms that can be either formal or informal. Among the feedback mechanisms that are now being used by some LGUs include the following:
1. Suggestion box
2. Sending short message service (SMS) or text to local officials
3. Report Card Survey
When is M & E conducted?
1. For the 3 – year CDP or ELA – The ideal time is during the usual hiatus following the last elections. Results of this assessment will find their way into the successor LDIP and ELA of the next administration. This ensures smooth transition and conveys a sense of continuity and stability between succeeding local administrations.
In a 4-year scenario which shows the two change-over points after each election, the following M & E schemes are recommended:
a. 2nd Quarter in the 6-week interval between the election and July 1 – M & E to assess the impacts of the previous administration’s 3-year LDIP or Executive-Legislative Agenda. This M & E will provide inputs to the preparation of the new 3-year LDIP/ ELA of the succeeding administration.
b. 4th Quarter of the second and third years of the incumbent leadership – M & E to assess the outputs and financial performance to provide inputs to the Year-end Report of the Local Chief Executive.
c. M & E to assess the outcomes of the completed budgets and AIPs of the last half year of the previous and the first year of the incumbent administration.
For clarity please refer to the scenario as shown in the following table.

CHAPTER 7PLAN MONITORING & EVALUATION
181
Table ___ M & E Points in a 3-Year Term of Office
YEARQUARTER
Q1 Q2 Q3 Q4
Year 1
IMPLEMENTATION OF LAST YEAR’S BUDGET & AIP OF PREVIOUS ADMINISTRATION
o ELECTION YEARo M & E (Impact of
Previous Administration’s LDIP/ELA)
End-of-Term Report
Inaugural of New Term
Preparation of LDIP/ELAPreparation of Yr 2 Budget and 1st AIP
Year 2IMPLEMENTATION OF YEAR 2 BUDGET & 1st AIP
Preparation of Yr 3 Budget and 2nd AIP
o M & E (Outputs and Financial Performance)
o End-of-Year Report
Year 3IMPLEMENTATION OF YEAR 3 BUDGET AND 2nd AIP
M & E (Outcome of 1st AIP) Preparation of Yr 4 Budget and 3rd AIP
o M & E (Outputs and Financial Performance)
o End-of-Year Report
Year 4IMPLEMENTATION OF YEAR 4 BUDGET AND 3rd AIP
o ELECTION YEARo M & E (Impact of
Outgoing Administration’s LDIP/ELA)
End-of-Term Report
Inaugural of New Term
2. For Long – term Planning – The feedback information required for the revision or reformulation of long – term plans such as the CLUP and the long – term CDP should be collected after a lapse of 9 – 10 years. This should be synchronized with the national census which has as interval of one decade. Data capture on socio-economic and physical indicators of change when it is done in the same year that an actual population count is held will allow analysts to relate actual growth with actual population change.

CHAPTER 7PLAN MONITORING & EVALUATION
182
Every census year therefore should be marked out for conducting comprehensive data collection to update ecological profiles, statistical compendiums, thematic maps, and other forms of information systems.
What tools can be used for M & E?
Various tools are already being used to monitor and evaluate the achievement of results at the local level. Some of these tools are discussed below:
1. Annual/End-of-Term Accomplishment Report - At the minimum, LCEs need to prepare an annual as well as an end-of-term accomplishment report. A simple yet informative form that shows accomplishments of the LGU vis-à-vis what was planned is shown in Table ____. It also shows who the beneficiaries are, the area coverage as well as the costs of the programs and projects implemented.
2. Community Based Monitoring System (CBMS) – The CBMS can be used in monitoring and tracking progress of LGUs towards the attainment of their goals including the MDGs. The Core Local Poverty Indicators (CLPIs) discussed in Chapter 2 contain indicators on human development and are recommended as the minimum set that the LGUs should use for assessing the extent of socio-economic development in their locality.
3. Local Governance Performance Management System (LGPMS) – The LGPMS is an LGU self-assessment tool that enables provincial, city and municipal governments to monitor and evaluate their performance at three levels of results: input, output and outcome levels. It looks at local government in five performance areas and 17 service areas using 107 indicators.
4. The M & E Strategy Template – One other tool that can be used is the M & E Template. The purpose of the tool is to develop an approach to M & E that will yield good information to be used in the next planning period and for other decision making purposes
The development of the M & E strategy should be seen as an integral component of the planning process and its development done during the planning phase.
The following are the key elements of an M & E Strategy:
a. Clear and expected results (goals, objectives, outputs);
b. Explicit targets per result;
c. Indicators to measure progress towards results;
d. Data source to assess performance;
e. Collection methods;
f. Frequency at which measurements will be made; and
g. Roles and responsibilities
An M & E Strategy template has also been devised to aid the Monitoring Team in its preparation (See Table ____ ).

CHAPTER 7PLAN MONITORING & EVALUATION
183
5. CBMS – CBMS – generated data are most useful for impact evaluation purposes and CBMS – monitored changes can be used as benchmarks for the next cycle of short-and medium- term development plans. The use of CBMS can also extend to setting and exacting standards of performance from concerned LGU offices or frontline service providers.
6. LGPMS - As a LGU performance management mechanism or specifically as a performance monitoring and management tool, LGPMS provides the process and results that indicate LGU’s effectiveness and progress in promoting the general welfare of its constituents along the 5 performance areas. Annually, the input and output dimensions of LGPMS indicators provide information as to the LGU’s efficiency in its utilization of inputs to realize the output, Corrective measures to address the causes of unsatisfactory performance can result from this type of monitoring.
The effectiveness of outputs in realizing the desired outcomes can be ascertained as LGPMS outcome indicators are reviewed and “rated” every three (3) years. By combining the use of LGPMS outcome indicator results with other appropriate tools, LGUs can meaningfully evaluate the extent to which public expenditures, through the LDIP & AIP processes, contributed to the attainment of broader social and economic goals that were identified in their respective CDP and ELA.

CHAPTER 7PLAN MONITORING & EVALUATION
184
Table ___CY __________ ANNUAL/END-OF-TERM ACCOMPLISHMENT REPORT
Province/City/Municipality of ______________________________________
Programs and Projects per Sector
Output Indicators Target Accomplishment Beneficiary Sector
Area Covered Estimated Project Cost (Php)
Actual Disbursement
1. Social Sector
Nutri-Health Program Number of barangays covered by micro-nutrient supplementation Number of
barangays covered by nutrition education
All barangays
All barangays
50% of barangays
20% of barangays
Women and Children
Women and children
50 % of barangays
50 % of barangays
2 Million
1.2 Million
Water Supply Project % of total number households covered
5% of all households
10% of all households
Urban Poor Barangay Poblacion
5 Million
2. Economic Sector
3. Infrastructure
4. Environment
5. Institutional

CHAPTER 7PLAN MONITORING & EVALUATION
185
Table ___M & E STRATEGY
RESULTS PERFORMANCE INDICATORS
TARGETS FOR INDICATORS
DATA SOURCE TO ASSESS PERFROMANCE(Individual beneficiaries, groups of beneficiaries, organizations, partners,
documents, etc)
COLLECTION METHODS
FREQUENCY RESPONSIBILITY CENTER
Goal/Impact (Long term)
o Reduce infant mortality (MDG no. 4)
Mortality Rate of children aged 1-5 (LGPMS outcome indicator)
Reduce children under-five mortality rate by two-thirds by 2015 (MDG Target no. 4)
LGU Health Office Document review Every three years and at the end of nine years
Monitoring Team
Objective/ Outcome (Medium term) Every three years Monitoring Team
Outputs/ Deliverables/Products and Services delivered (Short term)
Annual Monitoring Team
Activities (Ongoing) Every executive committee meeting
Department Heads
Inputs (Ongoing) Every executive committee meeting
Department Heads