introduction association between lean body mass and …
TRANSCRIPT

Non-Cognitive Predictors of Student Success:A Predictive Validity Comparison Between Domestic and International Students
ASSOCIATION BETWEEN LEAN BODY MASS AND MUSCLE THICKNESS WITH FRAILTY IN COMMUNITY DWELLING DUTCH OLDER ADULTS
Non-Cognitive Predictors of Student Success:A Predictive Validity Comparison Between Domestic and International Students
INTRODUCTION• Low muscle thickness is considered an
indicator of frailty in critically ill patients
• We studied the association between frailty and whole body lean body mass index (LBMI) and muscle thickness of the rectus femoris (RF) in community dwelling older adults aged ≥55y
METHODS• Frailty status was assessed with the
Groningen Frailty Indicator (GFI), using ≥4 as cut-off score for frailty
• LBMI (kg/m2) was estimated with BIA (Quadscan 4000©, Bodystat)
• Muscle thickness (mm) of the RF was measured with ultrasound, using the Bodymetrix© (Intelametrix)
• Univariate and multivariate binary logistic regression analyses were performed for the association between LBMI and RF thickness, and frailty
• Multivariate analysis corrected for age, sex, BMI, and handgrip strength
• Statistical significance at p<0.05
RESULTS• 93 participants were included
• In both the univariate and multivariate analysis, LBMI and RF thickness were not significantly associated with frailty
M. J. Sealy*, 1, E. Jonkers 1, 2, H. Hobbelen 1, H. Jager-Wittenaar 1, 3
1Research Group Healthy Ageing, Allied Health Care and Nursing, Hanze University of Applied Sciences Groningen, 2Department of Nutrition and Dietetics, School of Health Care, Hanze University of Applied Sciences Groningen, 3Department of Oral and Maxillofacial Surgery, University of Groningen, University Medical Center Groningen, Groningen, Netherlands
www.hanze.nl/lahcwww.faithresearch.nlwww.facebook.com/lahcwww.facebook.com/faithresearch.nl
Figure 1: Image of m Rectus Femoris with BodyMetrix
Table 2: Logistic regression analyses LBMI and RF thickness, and frailty (GFI ≥4)
P053
ConclusionIn this sample of older adults, LBMI and RF
thickness are not associated with frailty
IMPLICATIONSAs frail participants scored at cut-off or just above, measurements in a population with higher scores for frailty may provide further insight in the association between lean body mass and muscle thickness and frailty
Table 1: Characteristics of 93 oldercommunity dwelling Dutch adults
N=93 (frail n=18)mean±SD/ median (IQR)/ n(%)
Frailty (GFI≥4) 1 (0-3)Age (years) 65.2±7.7Female 54%LBMI (kg/m2) 17.2±2.6 m RF (mm) 14.6±4.4 BMI (kg/m2) 25.5±4.9Handgrip (kg) 33.6±11.7
Frailty yes/no Univariate analysis
P- value OR [95%CI]
LBMI (cm/m2) 0.082 0.82 [0.66-1.03]
m. RF (mm) 0.077 0.55 [0.28-1.07] Multivariate analysis
P- value OR [95%CI]
LBMI (cm/m2) 0.436 0.95 [0.84-1.08]
m. RF (mm) 0.796 1.02 [0.88-1.18]

Notes:1. Correct fonts won’t load until you open this in
PowerPoint (e.g., if you’re previewing this in your
browser it’ll look uglier than it actually is).
2. Generate QR codes here:https://www.qrcode-monkey.com/

The ‘hat’ icon.Fun, reinforces your finding, makes your poster memorable — and can be interpreted at-a-glance.
Example donated by @DStroumsaExample donated by @MCLaScience Example donated by @ElzaRechtman
Example donated by @mikemorrison Example donated by @akreutzer82

vvv
The on-theme background.Add fun and reinforce your study’s context, but make sure to keep a high contrast between your text and background!
Example donated by @hydrogawker
Mountain photo by @mnthydro
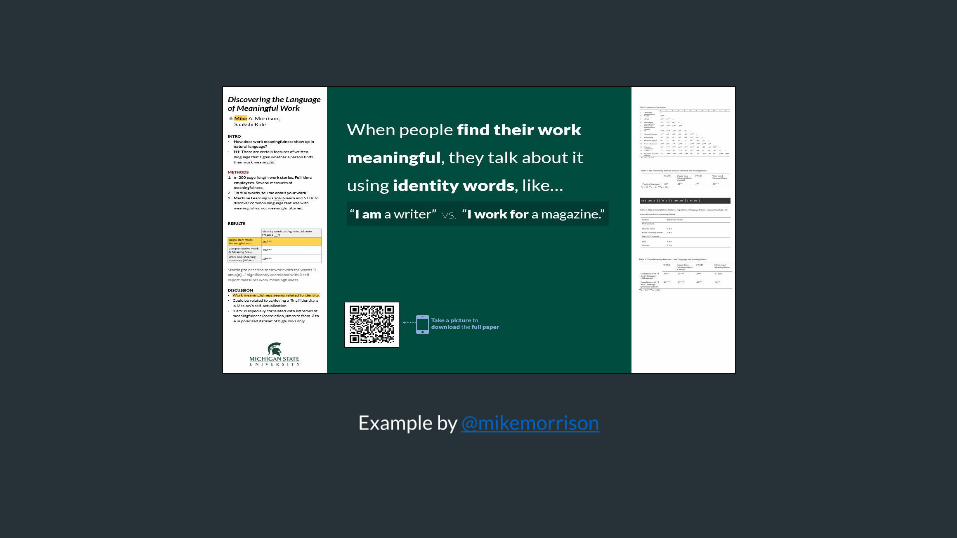
Example by @mikemorrison
Example donated by @brenden0walker
Example donated by @SarraceniaMason Example donated by @americoamorim
Example donated by @nasaman58
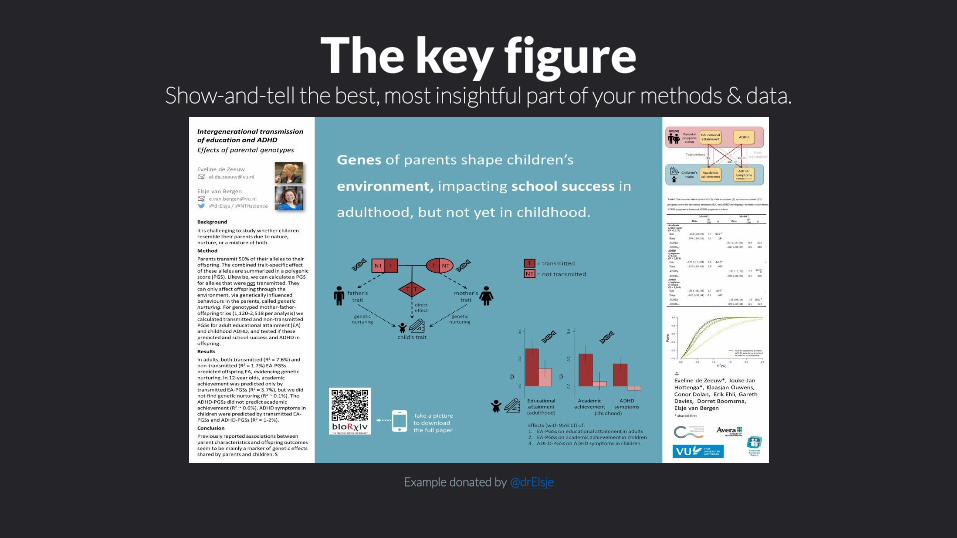
The key figureShow-and-tell the best, most insightful part of your methods & data.
Example donated by @drElsje

You can get icons from
TheNounProject.com
https://thenounproject.com
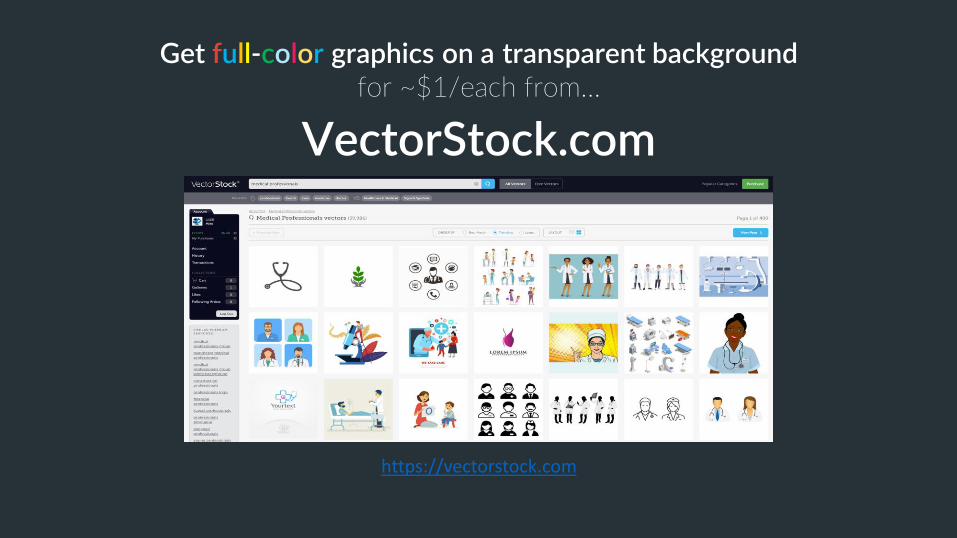
Get full-color graphics on a transparent backgroundfor ~$1/each from…
https://vectorstock.com
VectorStock.com

If your punchline is more than 2 lines, don’t center it. Centering makes your eyes do more work.
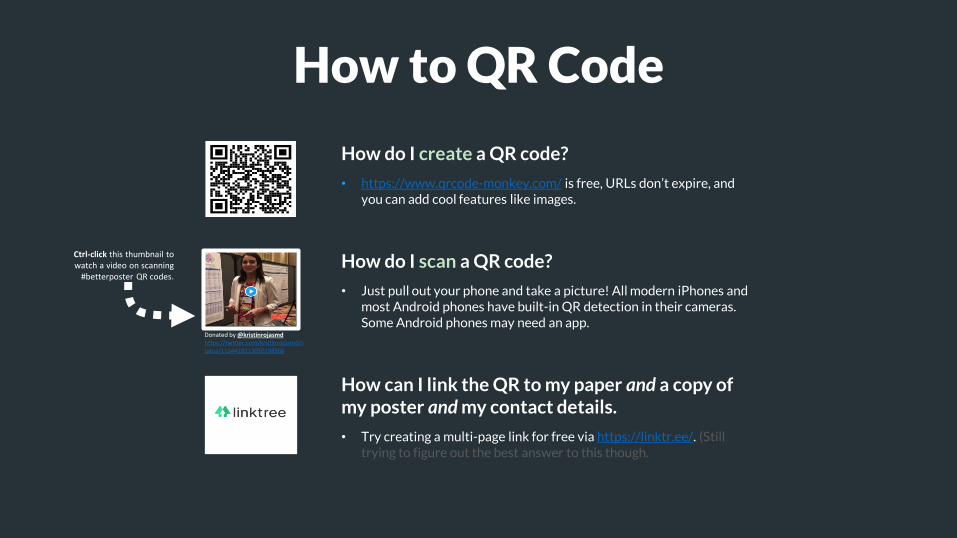
How to QR Code
How do I create a QR code?
• https://www.qrcode-monkey.com/ is free, URLs don’t expire, and you can add cool features like images.
How do I scan a QR code?
• Just pull out your phone and take a picture! All modern iPhones and most Android phones have built-in QR detection in their cameras. Some Android phones may need an app.
How can I link the QR to my paper and a copy of my poster and my contact details.
• Try creating a multi-page link for free via https://linktr.ee/. (Still trying to figure out the best answer to this though.
Ctrl-click this thumbnail to watch a video on scanning
#betterposter QR codes.
Donated by @kristinrojasmdhttps://twitter.com/kristinrojasmd/status/1124418213050298368

Layout F.A.Q.
What if my intro/methods/results doesn’t fit in the silent bar?
• If you’re trying to put so much into that bar that it doesn’t fit, they won’t have time to
read it anyway. First try moving stuff to the ammo bar. Next, cut cut cut.
• Instead of trying to fill space, you’re trying to conserve space.
What if I have a really important graph or picture?
• Move the QR Code to the Silent Presenter, then put your graph/image in the middle.

What research influenced this idea?a.k.a “I need some ammo to help persuade my faculty to try this.”
1. Need to know > Nice to knowhttps://www.nngroup.com/articles/inverted-pyramid
2. Plain language is interpreted faster.https://www.nngroup.com/videos/plain-language-for-experts/https://www.nngroup.com/articles/plain-language-experts/
3. Interaction cost.https://www.nngroup.com/articles/interaction-cost-definition/
4. Effective designs minimize cognitive loadhttps://www.nngroup.com/articles/minimize-cognitive-load/
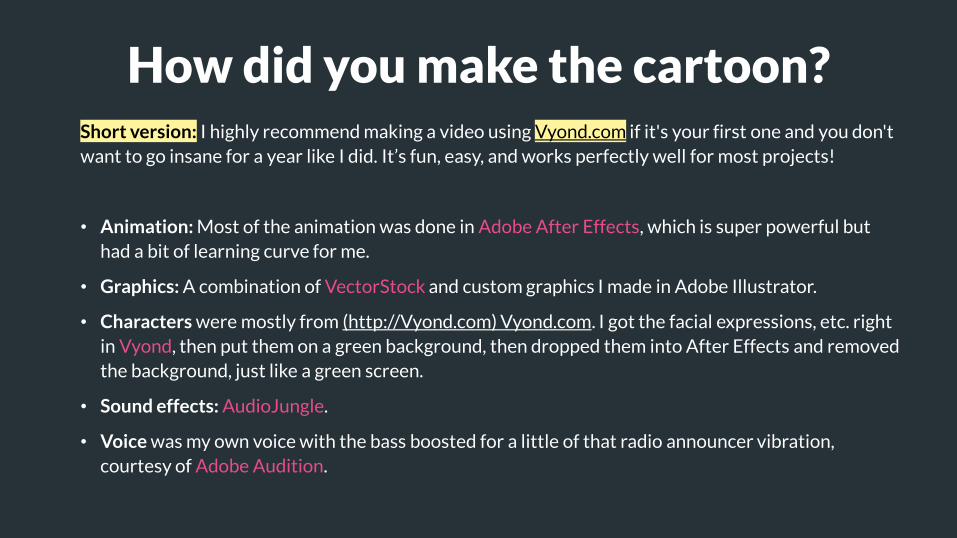
How did you make the cartoon?Short version: I highly recommend making a video using Vyond.com if it's your first one and you don't
want to go insane for a year like I did. It’s fun, easy, and works perfectly well for most projects!
• Animation: Most of the animation was done in Adobe After Effects, which is super powerful but
had a bit of learning curve for me.
• Graphics: A combination of VectorStock and custom graphics I made in Adobe Illustrator.
• Characters were mostly from (http://Vyond.com) Vyond.com. I got the facial expressions, etc. right
in Vyond, then put them on a green background, then dropped them into After Effects and removed
the background, just like a green screen.
• Sound effects: AudioJungle.
• Voice was my own voice with the bass boosted for a little of that radio announcer vibration,
courtesy of Adobe Audition.
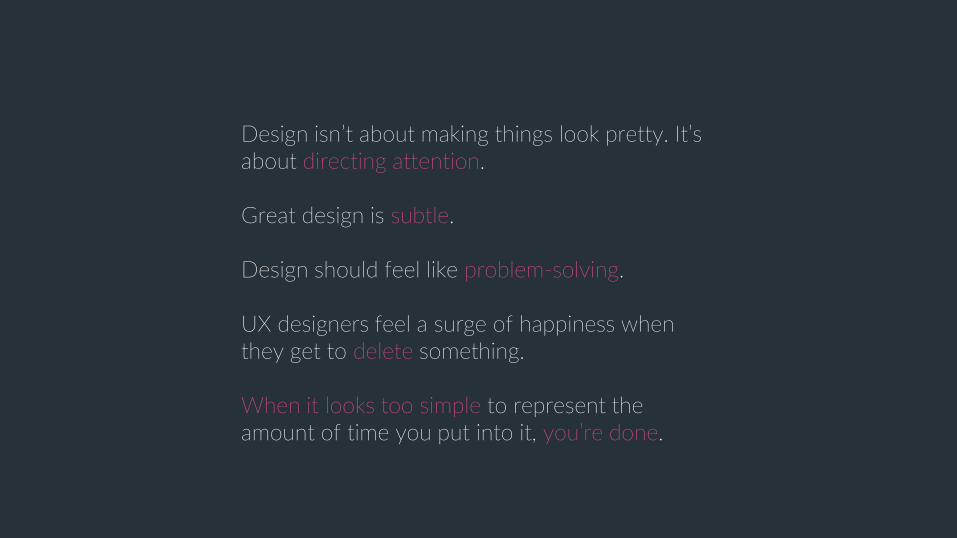
Design isn’t about making things look pretty. It’s about directing attention.
Great design is subtle.
Design should feel like problem-solving.
UX designers feel a surge of happiness when they get to delete something.
When it looks too simple to represent the amount of time you put into it, you’re done.