introduction 3 - mpc€¦ · malaysia and top 10 countries 8 competitiveness ... second among asean...
TRANSCRIPT

1

2
Introduction 3
WEF’s Assessment of Malaysia’s Competitiveness Performance 3
Measuring Competitiveness 4
Highlights: Malaysia’s Competitiveness Strengths and Areas for Improvement 6
Malaysia and Top 10 Countries 8
Competitiveness Performance in the Asia Pacific and ASEAN 9
Malaysia’s Performance in the Global Competitiveness Index 2013-2014 11
Institutional Strengths 12
Ensuring Integrated and Efficient Infrastructure 14
The Macroeconomic Environment 16
Keeping Healthcare and Primary Education in Perspective 17
Quality Workforce through Higher Education & Training 19
Promoting A Better Goods Market Through Efficiency 21
Competitive Labour Market 22
Financially Effective 24
Advancing Technological Readiness 25
Going for Global Markets 27
Bringing Sophistication to Business 28
Empowering Innovation 29
Evolution in Malaysia's Competitiveness Performance 31
Competitiveness Enhancement Initiatives 32
Committed to Transform the Nation 32
Appendices
1. Global Competitiveness Index 2013-2014 Rankings and 2012-2013 Comparisons 33
2. The Global Competitiveness Index 2013-2014 Rankings for the Asia Pacific and
ASEAN Countries 37
3. List of Countries/Economies at Each Stage of Development 38
4. ASEAN’s Competitiveness Landscape: A mixed picture with encouraging trends 39

3
PERFORMANCE OF MALAYSIA IN THE GLOBAL COMPETITIVENESS
REPORT 2013-2014
INTRODUCTION
Malaysia moved up one position and maintains its top position among countries in the
transition stage of development from an efficiency-driven to innovation-driven stage.
1. The Global Competitiveness Report 2013-2014 (GCR 2013-2014) by the World
Economic Forum (WEF) based in Geneva, Switzerland covers 148 countries (GCR 2012-
2013: 144 countries). In the Report which was released to the public on 4th
September 2013,
Malaysia ranked at 24th
position (GCR 2012-2013: ranked 25th) and is among the top 20%
of the most competitive economies globally.
2. Malaysia has sustained its position in the transition stage of development from an
efficiency-driven to innovation-driven stage with an increase in GDP per capita to
USD10,304 in 2012 from USD9,700 previously.
3. Malaysia advances one position to 24th. Second among ASEAN countries, behind
Singapore, Malaysia ranks no lower than 51st in any of the 12 pillars of the GCI and features in
the top of two of them. Its most notable advantages are its efficient and competitive
market for goods and services (10th
), its well-developed and sound financial markets
(6th
), and its business-friendly institutional framework (29th
).
Table 1: Sub-index Weights and Income Thresholds for Stages of Development
WEF’s Assessment of Malaysia’s Competitiveness Performance
Stages of Development
Stage 1: Transition from Stage 2: Transition from
stage 2 to stage 3
Stage 3:
Factor Driven stage 1 to stage 2 Efficiency-driven Innovation-driven
GDP per capita (US$) thresholds*
<2,000 2,000-2,999 3,000-8,999 9,000-17,000 >17,000
Weight for basic requirements sub-index
60% 40-60% 40% 20-40% 20%
Weight for efficiency enhancers sub-index
35% 35-50% 50% 50% 50%
Weight for innovation and sophistication factors sub-index 5% 5-10% 10% 10-30% 30%
Source: GCR 2013-2014, WEF

4
4. In a region plagued by corruption and red tape, Malaysia stands out as one of the
very few countries that have been relatively successful at tackling these two issues, as
part of its economic and government transformation programmes. The country, for
instance, ranks an impressive 8th
for the burden of government regulation, although the
score differential with the leader, Singapore, remains large. Malaysia ranks a satisfactory
33rd
in the ethics and corruption component of the Index, but room for improvement
remains. Furthermore, Malaysia ranks 15th
for the quality of its transport infrastructure,
a remarkable feat in this part of the world, where insufficient infrastructure and poor
connectivity are major obstacles to development for many countries.
5. Malaysia’s private sector is highly sophisticated (20th
) and already fairly
innovative (25th
). All this bodes well for a country that aims to become a high-income,
knowledge-based economy by the end of the decade. Amid this largely positive
assessment, the government budget deficit, (103rd
) at 4.3% of GDP in 2012; the low
level of female participation in the workforce (121st
); and the consistently low
technological readiness (51st
), stand out as some major weaknesses of Malaysia’s
competitiveness.
Measuring Competitiveness
6. The GCR 2013-2014 uses 30% statistical data (34 criteria) and 70% survey data
(80 criteria) from the Executive Opinion Survey. The report examines factors enabling
national economies to achieve sustained economic growth and long term prosperity
through its 12 pillars of competitiveness involving 114 indicators. The pillars are:
Institutions
Infrastructure
Macroeconomic Environment
Health & Primary Education
Higher Education & Training
Goods Market Efficiency
Labour Market Efficiency
Financial Market Development
Technological Readiness
Market Size
Business Sophistication
Innovation
5
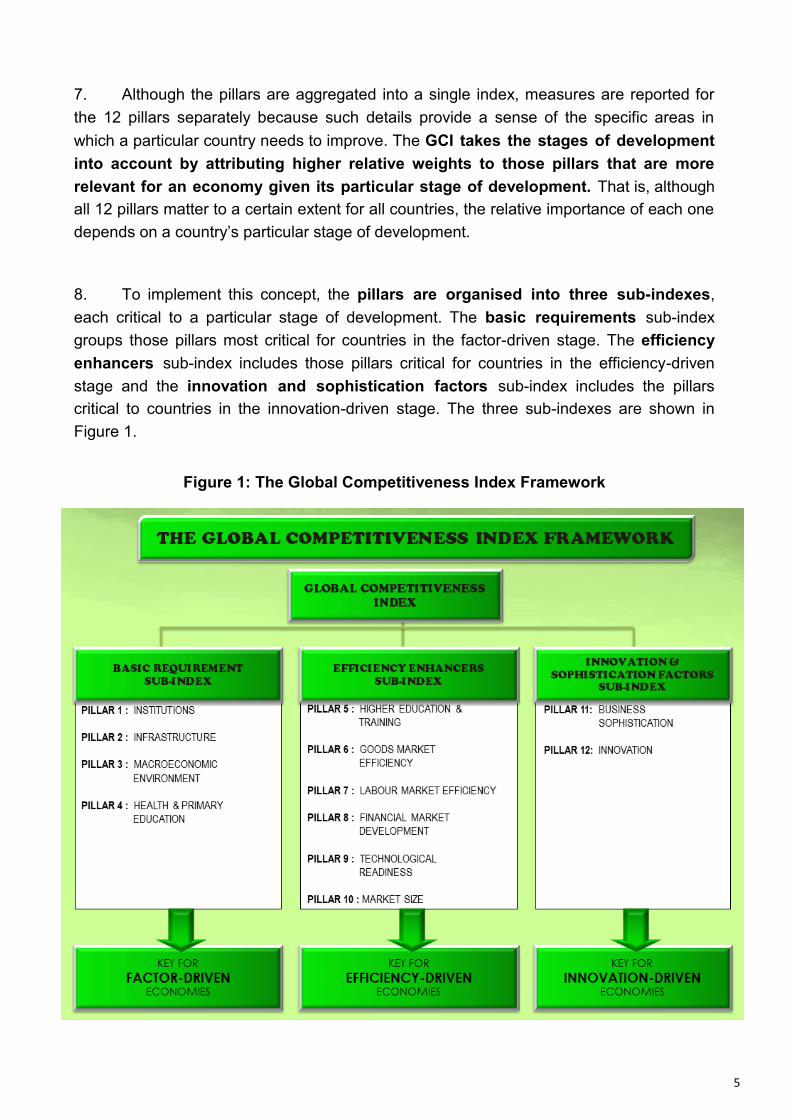
7. Although the pillars are aggregated into a single index, measures are reported for
the 12 pillars separately because such details provide a sense of the specific areas in
which a particular country needs to improve. The GCI takes the stages of development
into account by attributing higher relative weights to those pillars that are more
relevant for an economy given its particular stage of development. That is, although
all 12 pillars matter to a certain extent for all countries, the relative importance of each one
depends on a country’s particular stage of development.
8. To implement this concept, the pillars are organised into three sub-indexes,
each critical to a particular stage of development. The basic requirements sub-index
groups those pillars most critical for countries in the factor-driven stage. The efficiency
enhancers sub-index includes those pillars critical for countries in the efficiency-driven
stage and the innovation and sophistication factors sub-index includes the pillars
critical to countries in the innovation-driven stage. The three sub-indexes are shown in
Figure 1.
Figure 1: The Global Competitiveness Index Framework

6
Malaysia’s Competitiveness Strengths and Areas for Improvement
9. At 24th
, Malaysia maintains its position at the top 20% among 148 countries
ahead of Korea (25th), Brunei Darussalam (26
th), Israel (27
th), Ireland (28
th) and People’s
Republic of China (29th). Malaysia reaffirms once again its top position among 22
countries in the transition stage from an efficiency-driven to innovation-driven, with an
increase in GDP per capita from USD9,700 to USD10,304 in 2012. At this position,
Malaysia’s aspiration to become a high-income, knowledge-based economy by the end of
the decade is achievable.
10. Among the criteria which recorded top 10 positions include:
(i) Malaysia’s inflation rate at 1.7% placed the country in the first spot together with 43
other economies which recorded low inflation rates of between 0.5% - 2.9%. The
legal rights index which measures the extent of protection towards lenders and
borrowers also remained at 1st position;
(ii) Two perception-based criteria attained 2nd
position which are pay and productivity,
(GCR 2012-2013: 3rd
) and the agricultural policy costs (GCR 2012-2013: 4th);
(iii) The strength of investor protection and government procurement of advanced
technological products remained at 4th position;
(iv) Perception on ease of access to loans attained 5th position (GCR 2012-2013: 8
th);
(v) Perception on venture capital availability, ranked 7th (GCR 2012-2013: 11
th);
(vi) Perception on burden of government regulation maintained its 8th position;
(vii) Perception on financing through local equity market maintained its 9th position; and
(viii) Perception on the effect of taxation on incentives to work, ranked 10th.
MALAYSIA’S COMPETITIVENESS BASED ON
GLOBAL COMPETITIVENESS REPORT
2013-2014
HIGHLIGHTS

7
11. Among the criteria to be given continuous emphasis include:
(i) Ratio of women to men in labour force, ranked 121st (GCR 2012-2013: 119
th);
(ii) Redundancy costs which refers to the advance notice requirements, severance
payments and penalties due when terminating a redundant worker expressed as 23.9
salaried weeks, ranked at 110th position (GCR 2012-2013: 108
th);
(iii) Secondary education enrollment, ranked 105th
position (GCR 2012-2013: 103rd
);
(iv) General government debt as a percentage of GDP, ranked 105th
(GCR 2012-2013: 100th).
(v) Perception on the impact of business cost of terrorism, ranked 85th (GCR 2012-2013:
58th);
(vi) The number of mobile broadband subscription for every 100 population, ranked 79th
(GCR 2012-2013: 64th); and
(vii) Tuberculosis incidence per 100,000 population, ranked 90th (GCR 2012-2013: 86
th);
and
(viii) Business impact of tuberculosis, ranked 87th (GCR 2012-2013: 86
th).
12. Several criteria recorded improvements in ranking. Nevertheless continuous efforts
are necessary to improve the criteria further. They are :
(i) General government budget balance as a percentage of GDP, ranked 103rd
(GCR 2012-2013: 110th);
(ii) International internet bandwidth (kb/s) per internet user, ranked 77th (GCR 2012-
2013: 83rd
);
(iii) Malaria cases for every 100,000 population, ranked 96th (GCR 2012-2013: 97
th)
while business impact of malaria, ranked 96th (GCR 2012-2013: 99
th);
(iv) Perception on business impact of HIV/AIDS, ranked 88th (GCR 2012-2013: 91
st) and
HIV prevalence as a percentage of adults, ranked 78th
(GCR 2012-2013: 87th).
8
Malaysia and Top Ten Countries
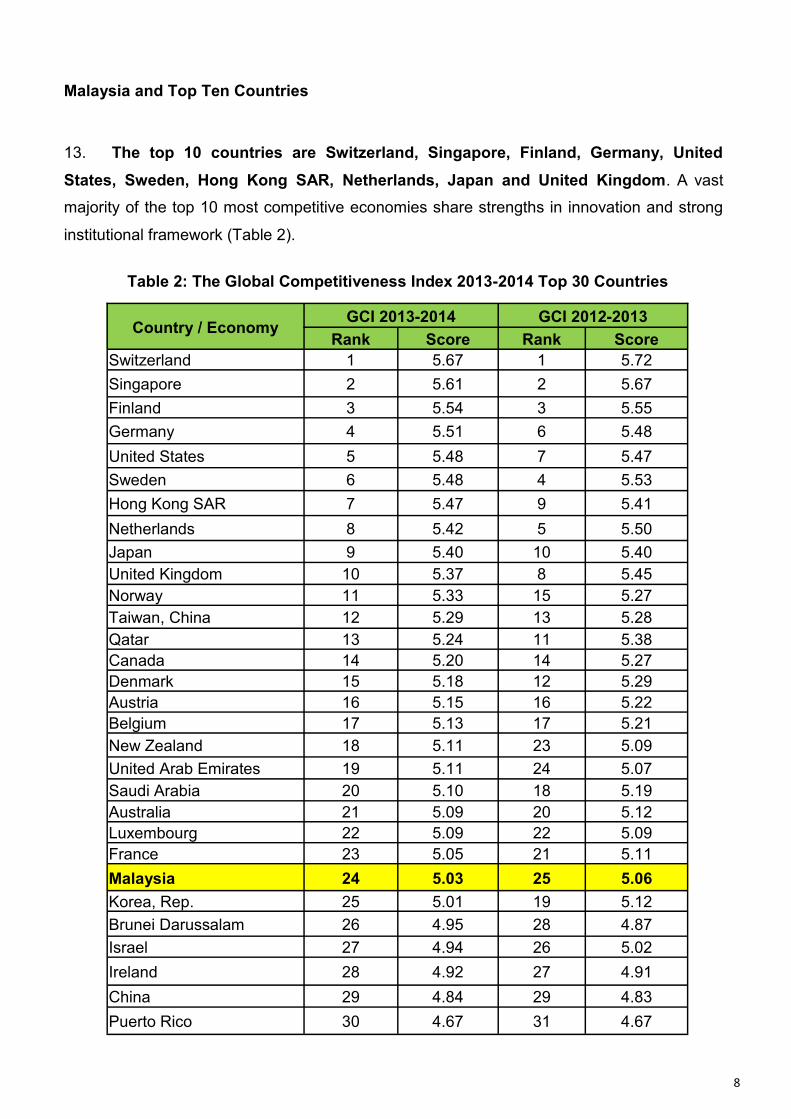
13. The top 10 countries are Switzerland, Singapore, Finland, Germany, United
States, Sweden, Hong Kong SAR, Netherlands, Japan and United Kingdom. A vast
majority of the top 10 most competitive economies share strengths in innovation and strong
institutional framework (Table 2).
Table 2: The Global Competitiveness Index 2013-2014 Top 30 Countries
Country / Economy GCI 2013-2014 GCI 2012-2013
Rank Score Rank Score
Switzerland 1 5.67 1 5.72
Singapore 2 5.61 2 5.67
Finland 3 5.54 3 5.55
Germany 4 5.51 6 5.48
United States 5 5.48 7 5.47
Sweden 6 5.48 4 5.53
Hong Kong SAR 7 5.47 9 5.41
Netherlands 8 5.42 5 5.50
Japan 9 5.40 10 5.40
United Kingdom 10 5.37 8 5.45
Norway 11 5.33 15 5.27
Taiwan, China 12 5.29 13 5.28
Qatar 13 5.24 11 5.38
Canada 14 5.20 14 5.27
Denmark 15 5.18 12 5.29
Austria 16 5.15 16 5.22
Belgium 17 5.13 17 5.21
New Zealand 18 5.11 23 5.09
United Arab Emirates 19 5.11 24 5.07
Saudi Arabia 20 5.10 18 5.19
Australia 21 5.09 20 5.12
Luxembourg 22 5.09 22 5.09
France 23 5.05 21 5.11
Malaysia 24 5.03 25 5.06
Korea, Rep. 25 5.01 19 5.12
Brunei Darussalam 26 4.95 28 4.87
Israel 27 4.94 26 5.02
Ireland 28 4.92 27 4.91
China 29 4.84 29 4.83
Puerto Rico 30 4.67 31 4.67

9
Competitiveness Performance in the Asia Pacific and ASEAN
14. Among 25 Asia Pacific countries, Malaysia improved to 7th
position from 8th in
2012 after Singapore, Hong Kong SAR, Japan, Taiwan, New Zealand and Australia.
Malaysia is ahead of Korea (8th), Brunei Darussalam (9
th), People’s Republic of China (10
th),
Thailand (11th), Indonesia (12
th), Philippines (13
th), India (14
th) and Sri Lanka (15
th).
15. Asia Pacific is home to some of the most competitive nations including three from
the top 10 countries namely Singapore, Hong Kong SAR, and Japan and is among the
dynamic and rapidly improving economies in terms of competitiveness such as Indonesia
and the Philippines. The Philippines (59th) moves up 6 places while Indonesia (38
th) made
significant strides moving up 12 places. Vietnam (70th) also moved up the ladder by 5
places however Cambodia (88th) dropped in ranking by 3 places.
16. The WEF news release reported that “Among the Asian economies, Indonesia jumps
to 38th, making it the most improved of the G20 economies since 2006, while Korea (25
th)
falls by six places. Behind Singapore, Hong Kong SAR, Japan, and Taiwan (China) all
remain in the top 20. Developing Asian nations display very mixed performances and
trends: Malaysia places 24th
while countries such as Nepal (117th), Pakistan (133
rd) and
Timor-Leste (138th) are near the bottom of the ranking. Bhutan (109
th), Lao PDR (81
st) and
Myanmar (139th) join the index for the first time”.
17. Among ASEAN countries, Malaysia remained at 2nd
position after Singapore and is
ahead of Brunei Darussalam (3rd
), Thailand (4th), Indonesia (5
th), Philippines (6
th),
Vietnam (7th), Lao PDR (8
th), Cambodia (9
th), and Myanmar (10
th) as shown in Figure 2.

10
Figure 2: Competitiveness Performance of Asia Pacific and ASEAN

11
Malaysia’s Performance in The Global Competitiveness Index
2013-2014
18. Malaysia’s performance in the 12 pillars is as shown in Table 3.
Table 3: Malaysia’s Performance in the 12 Pillars
OVERALL
Ranked 24th
/148 (GCR 2012-2013: 25th
/144)
Basic Requirements
Ranked 27th
(GCR 2012-2013: 27
th)
Efficiency Enhancers
Ranked 25th
(GCR 2012-2013: 23
rd)
Innovation Factors
Ranked 23rd
(GCR 2012-2013: 23
rd)
Pillar 1 Institutions
Ranked 29th
(GCR 2012-2013: 29th)
Pillar 5 Higher Education &
Training
Ranked 46th
(GCR 2012-2013: 39
th)
Pillar 11 Business
Sophistication
Ranked 20th
(GCR 2012-2013: 20
th)
Pillar 2 Infrastructure
Ranked 29th
(GCR 2012-2013: 32nd
)
Pillar 6 Goods Market
Efficiency
Ranked 10th
(GCR 2012-2013: 11
th)
Pillar 12 Innovation Ranked 25
th
(GCR 2012-2013: 25th)
Pillar 3
Macroeconomic Environment
Ranked 38th
(GCR 2012-2013: 35
th)
Pillar 7
Labour Market Efficiency
Ranked 25th
(GCR 2012-2013: 24
th)
Pillar 4
Health & Primary Education
Ranked 33rd
(GCR 2012-2013: 33rd
)
Pillar 8
Financial Market Development
Ranked 6th
(GCR 2012-2013: 6th)
Pillar 9 Technological Readiness
Ranked 51st
(GCR 2012-2013: 51
st)
Pillar 10 Market Size
Ranked 26th
(GCR 2012-2013: 28
th)

12
Institutional Strengths
19. Malaysia maintains its 29th
position in the
Institutions pillar in the GCR 2013-2014 report.
Among the notable indicators that have improved
in rankings are irregular payments and bribes,
ethical behavior of firms and strength of auditing
and reporting standards. The formation of 700
integrity units throughout various ministries and
agencies is expected to enhance the culture of
higher work quality and response in order to
improve public trust of government institutions and its
mandated duties.
20. To further strengthen public confidence in the
Government, new initiatives are being undertaken to
combat crime and restore public peace and
confidence. A new anti-crime legislation that is
being proposed would strengthen the capability of
Institutions
The institutional environment is determined by the legal and
administrative framework within which individuals, firms and
governments interact to generate wealth.

13
the police to act against serious and organised
crimes and will be tabled in Parliament to replace the
repealed Emergency Ordinance Act. More action is
also being undertaken which include the introduction
of Electronic Monitoring Device (EMD) to track the
organised and violent crime suspects to ensure they
would not commit other crimes while out on bail. The
Home Ministry is also making public the list of
illegal organisations linked to gangsterism in the
country. This move indicates the Government is
committed and serious in fighting crime and
safeguarding public safety.
21. Under the Government Transformation
Program (GTP) 1.0, Malaysia has succeeded in
reducing the number of corruption cases through
sustained efforts by the National Key Result Areas
(NKRA) which includes the establishment of 14
Special Corruption Courts, Corporate Integrity
Pledges and a Name and Shame Database. These
initiatives have helped to further improve public
perception on bribery and irregular payments within
government agencies and ministries. Subsequently,
GTP 2.0 has outlined Enforcement Agency,
Combating Grand Corruption, Government
Procurement and Education & Public Support as
its initiatives.
The criteria that have contributed to Institutions
pillar include:
Strength of investor protection at 4th position; and
Burden of government regulation at 8th position.
Among the areas for improvement under the
Institutions pillar include perception on:
Business costs of terrorism, ranked at 85th;
Business costs of crime and violence, ranked at
75th; and
Organised crime, ranked at 63rd
.
The formation of
700 integrity
units
throughout
various
ministries and
agencies is
expected to
enhance the
culture of higher
work quality.
14
Ensuring Integrated and Efficient
Infrastructure
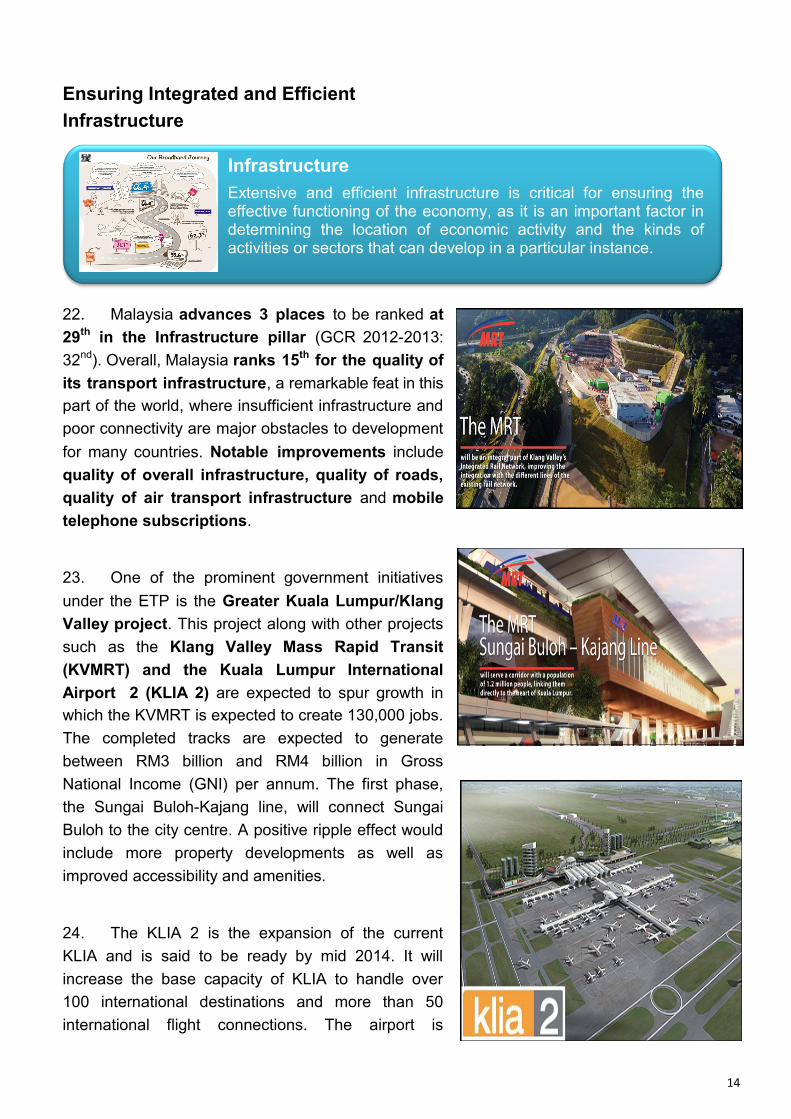
22. Malaysia advances 3 places to be ranked at
29th
in the Infrastructure pillar (GCR 2012-2013:
32nd
). Overall, Malaysia ranks 15th
for the quality of
its transport infrastructure, a remarkable feat in this
part of the world, where insufficient infrastructure and
poor connectivity are major obstacles to development
for many countries. Notable improvements include
quality of overall infrastructure, quality of roads,
quality of air transport infrastructure and mobile
telephone subscriptions.
23. One of the prominent government initiatives
under the ETP is the Greater Kuala Lumpur/Klang
Valley project. This project along with other projects
such as the Klang Valley Mass Rapid Transit
(KVMRT) and the Kuala Lumpur International
Airport 2 (KLIA 2) are expected to spur growth in
which the KVMRT is expected to create 130,000 jobs.
The completed tracks are expected to generate
between RM3 billion and RM4 billion in Gross
National Income (GNI) per annum. The first phase,
the Sungai Buloh-Kajang line, will connect Sungai
Buloh to the city centre. A positive ripple effect would
include more property developments as well as
improved accessibility and amenities.
24. The KLIA 2 is the expansion of the current
KLIA and is said to be ready by mid 2014. It will
increase the base capacity of KLIA to handle over
100 international destinations and more than 50
international flight connections. The airport is
Infrastructure
Extensive and efficient infrastructure is critical for ensuring the effective functioning of the economy, as it is an important factor in determining the location of economic activity and the kinds of activities or sectors that can develop in a particular instance.
15
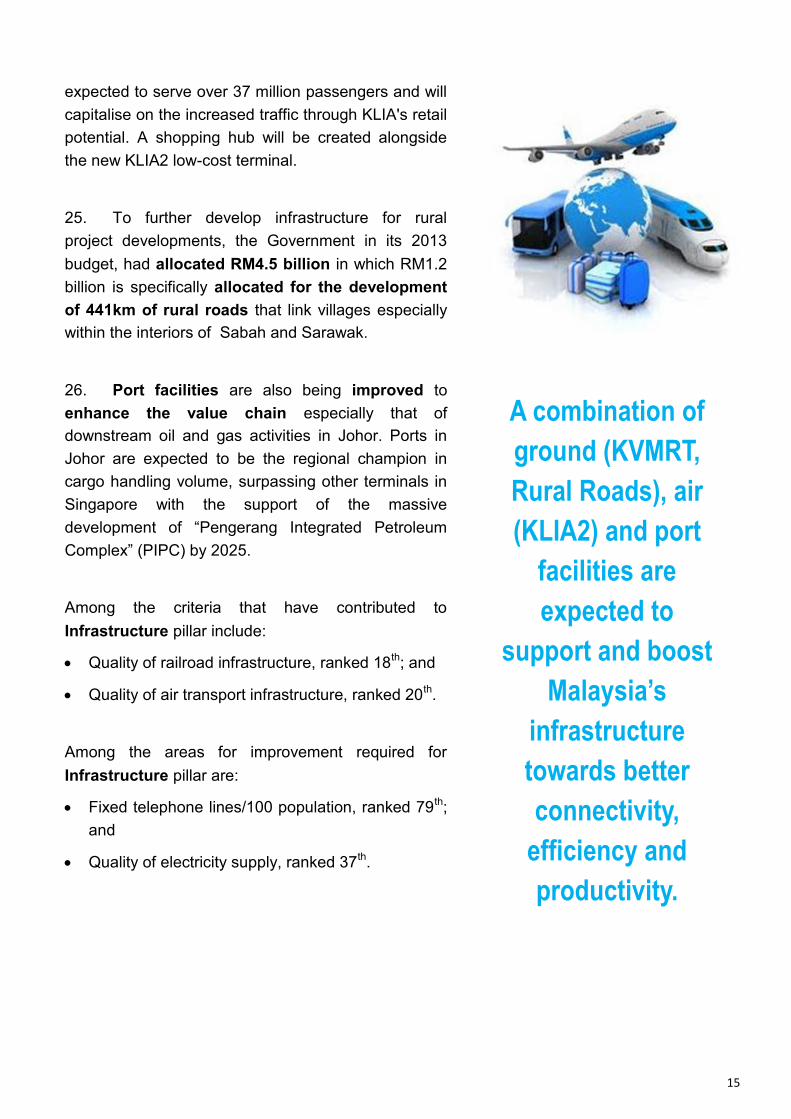
expected to serve over 37 million passengers and will
capitalise on the increased traffic through KLIA's retail
potential. A shopping hub will be created alongside
the new KLIA2 low-cost terminal.
25. To further develop infrastructure for rural
project developments, the Government in its 2013
budget, had allocated RM4.5 billion in which RM1.2
billion is specifically allocated for the development
of 441km of rural roads that link villages especially
within the interiors of Sabah and Sarawak.
26. Port facilities are also being improved to
enhance the value chain especially that of
downstream oil and gas activities in Johor. Ports in
Johor are expected to be the regional champion in
cargo handling volume, surpassing other terminals in
Singapore with the support of the massive
development of “Pengerang Integrated Petroleum
Complex” (PIPC) by 2025.
Among the criteria that have contributed to
Infrastructure pillar include:
Quality of railroad infrastructure, ranked 18th; and
Quality of air transport infrastructure, ranked 20th.
Among the areas for improvement required for
Infrastructure pillar are:
Fixed telephone lines/100 population, ranked 79th;
and
Quality of electricity supply, ranked 37th.
A combination of
ground (KVMRT,
Rural Roads), air
(KLIA2) and port
facilities are
expected to
support and boost
Malaysia’s
infrastructure
towards better
connectivity,
efficiency and
productivity.

16
The Macroeconomic Environment
27. Malaysia is ranked slightly lower by 3
places at 38th
(GCR 2012-2013:35th) for the
Macroeconomic Environment adversely affected
by the government budget balance and general
government debt. However, significant
improvement was recorded in the annual
percentage change for Inflation at 1.7% in 2012
resulting in a surge to 1st
position from 33rd
. In the
first five months of 2013, inflation remained low at
1.6%. While it is expected to rise in the
second half of the year due to domestic supply and
cost factors, it is projected to remain modest.
Malaysia’s monetary policy in 2013 focuses on
sustainable growth and addresses potential risk to
inflation.
28. Malaysia continues to recover from its deficit
as it sees the benefits of the Economic
Transformation Program (ETP). Within a year of
the ETP’s implementation, Malaysia experienced a
reduced deficit of 1.8% from 6.6% to 4.8%. The
trend of reduction continued in 2012 which saw a
reduction to 4.3% and is on track to hit the 4%
target in 2014 and the 3% target by 2015. Measures
such as subsidy rationalisation goods and services
tax and a review of the real property gains tax
(RPGT) are being considered.
29. General government debt as a percentage
of GDP improved by 7 positions. Even though the
performance improved, Bank Negara is taking
measures to curb excessive households debts and
reinforce responsible lending practices by key credit
providers.
“Our target is to
achieve a fiscal
deficit of 3% of GDP by
2015 and a balanced
budget by 2020”
- Datuk Seri Najib Tun Razak, PM
Macroeconomic environment
The stability of the macroeconomic environment is important for business and therefore is significant for the overall competitiveness of a country.
17
The areas under Macroeconomic Environment
pillar that need to be addressed are:
General government debt, % GDP, ranked 105th;
and
Government budget balance, % GDP, ranked
103rd
.
Keeping Healthcare and Primary
Education in Perspective
30. Malaysia retains the overall ranking of 33rd
in
the Health and Primary Education pillar. The
criteria that improved in this pillar includes the HIV
prevalence, up by 9 places to 78th
place (GCR 2012
-2013: 87th).
31. The healthcare industry has become a powerful
engine of economic growth. Malaysia's spending on
healthcare, at 5% of GDP, is above regional peers
and contributes RM15 billion in GNI. The
Government has also allocated RM19.3 billion for
healthcare management and development services in
the 2013 budget, an increase of 15% over the
previous year. The Government has also promoted
healthcare through its 1Malaysia Healthy
Community Programme which has seen 245 Klinik
1Malaysia established with another 70 expected by
the end of 2013.
32. The Government is also serious about tackling
AIDS. In view of this, Malaysia has launched the new
Human Immunodeficiency Virus (HIV) treatment
guidelines as recommended by the World Health
Health and primary education
A healthy workforce is vital to a country’s competitiveness and productivity while lack of basic education can become a constraint on business development, with firms finding it difficult to move up the value chain.

18
Organisation (WHO). With the offering of
anti-retroviral therapy (ART) at an earlier stage, 3
million deaths can be prevented and 3.5 million new
HIV infections between now and 2025 could be
averted. A survey by Bloomberg reported that
Malaysia is among the world’s top 20 countries
with the most efficient healthcare system, which
results in a longer life expectancy for its citizens.
According to the survey, Malaysia was ranked 18th,
placing it ahead of France, Thailand and the United
States.
33. The government is also relentless in pursuing
for a better national education system that enables
students to overcome and face challenges. In this
regard, the Malaysia Education Blueprint 2013-
2025, has been developed to transform the
education system. It is aimed at improving the
education system and encapsulating quality and
holistic empowerment of teachers, students and the
education system.
Among the areas that require improvement in Health
and Primary Education pillar include:
Business impact of malaria, ranked 96th;
Malaria cases/100,000 population, ranked, 96th;
Tuberculosis cases/100,000 population, ranked
90th.
Business impact of HIV/AIDS, ranked 88th;
Business impact of tuberculosis, ranked 87th; and
HIV prevalence, % adults aged, 15 to 49 years,
ranked 78th.
Malaysia Education
Blueprint 2013-2025, has
been developed to
transform the education
system. It is aimed at
improving the education
system and encapsulating
quality and holistic
empowerment of teachers,
students and the
education system.

19
Quality Workforce through Higher
Education and Training
34. Higher Education and Training pillar
declines 7 places to 46th
position in 2013 (GCR
2012-2013: 39th). The performance was largely
influenced by perception based indicators that
include the quality of management schools, quality
of math and science education and the quality of
education system.
35. In this regard, the Government is committed in
its quest to transform the education system towards
“a first class society in a first class nation” by
2020. Under the 2013 budget, RM11.1 billion has
been allocated to the social sector which includes
education and training. The Graduate Employability
Taskforce, set up under a RM200 million fund is
expected to enable students to develop soft skills and
Higher education and training
Quality higher education and training is particularly crucial for economies that want to move up the value chain beyond simple production processes and products.
20
improve their marketability. The vocational education
transformation implemented under the Malaysia
Education Blueprint 2013-2025 which also looks into
the higher education aspect, is giving emphasis
on vocational training and is expected to transform
traditional blue collar businesses into high-skill,
high-income industries. A total of 117,000
applications to enroll in vocational colleges for this
year’s intake had been received despite the fact that
only 21,000 placements were available.
36. The Government envisions the creation of a
regional hub for education excellence in
Malaysia where the best minds of the world
converge. As an education hub, Malaysia stands to
gain not only from the inflow of international students
but also from the establishment of top-notch
universities and international colleges. An example is
the Educity@Iskandar where globally recognised
institutions such as Newcastle University of Medicine
Malaysia, Netherlands Maritime Institute of
Technology, Raffles University Iskandar, University of
Southampton Malaysia and University of Reading
Malaysia have set up campuses, not only transform
education into a vibrant economic sector but will also
provide the required training to meet industry needs.
The criteria that require improvement in Higher
Education and Training pillar are:
Secondary education enrollment, gross %, ranked
105th; and
Tertiary education enrollment, gross %, ranked
62nd
.
The Government
is committed to
transform the
education
system towards
“a first class
society in a first
class nation” by
2020.

21
Promoting A Better Goods Market Through
Efficiency
37. Malaysia improves its ranking to be among the
top 10 (GCR 2012-2013: 11th) in the Goods Market
Efficiency pillar. Significant improvements were in
total tax rate (20th
), indicating a jump of 30 places;
number of procedures to start a business which
attained 10th
position; trade tariffs moving up 8
spots and prevalence of foreign ownership
improved 5 rungs.
38. Malaysia needs to further diversify its source of
income to reposition itself on track towards a stable
economic growth. Implementation of GST would help
the country to broaden its tax base and strengthen
public finances.
39. Among the efficiency improvements in starting
a business undertaken was the development of the
MyCoID Gateway System which enables services to
be transacted online. The Malaysian Corporate
Identity Number (MyCoID), a unique company
incorporation number for registering and dealing with
relevant government agencies to start a business
helps to save time, bureaucratic red tape and
improve efficiency of the process. MyCoID has
been expanded to Phase 3 to include other
government agencies and local authorities directly
involved in the ease of doing business.
Goods market efficiency
Countries with efficient goods markets are well positioned to produce the right mix of products and services given their particular supply-and-demand.
The criteria that supported
Goods Market Efficiency:
Agricultural policy
costs (2nd),
Buyer sophistication (11th),
Effect of taxation on
incentives to invest (12th),
and Business impact of
rules on FDI (14th) .

22
40. PEMUDAH — The Special Taskforce to
Facilitate Business continues to undertake initiatives
to improve the business environment. These include
business process re-engineering in various licensing
processes and procedures; implementation of
web-based e-payment facilities for online payments
nationwide; and fine tuning the one-stop center
approval processes.
The area that needs improvement in Goods Market
Efficiency pillar is:
Trade tariffs, % duty, ranked 68th.
Competitive Labour Market
41. Malaysia is ranked 25th
in the Labour Market
Efficiency pillar (GCR 2012-2013: 24th), indicating a
decline by 1 position. Perception on flexibility of wage
determination and cooperation in labor-employer
relations are among the criteria that contributed to the
decline in ranking. However, hiring and firing
practices went up 8 positions to 26th (GCR 2012-2013:
34th), while pay and productivity ranked among the top
10 criteria attaining 2nd
position.
42. With the implementation of Minimum Wage
Policy on 1st January 2013, it is envisaged that
inefficiencies in the labour market can be addressed
and overcome. The purpose of a minimum wage is to
improve the social wellbeing of low paid workers
and to incentivise firms to move up the value chain
thus transforming the economy into one with high
productivity and high income. The Productivity-
Labour market efficiency
The efficiency and flexibility of the labor market are critical for ensuring that workers are allocated to their most effective use in the economy and provided with incentives to give their
best effort in their jobs.
The
implementation
of minimum
wage will
address
inefficiencies in
the labour
market.

23
linked Wage System which links wage increases to
performance will complement the Minimum Wage
Policy.
43. To propel Malaysia into an innovation-driven
nation is to retain or attract high value talents in the
country. Through the Talent Corporation program,
Malaysia has seen positive results by succeeding to
attract 2,015 Malaysians back into Malaysia to serve
the country since 2001. A total of RM65 million has
been allocated to Talent Corp to develop attractive
programs to further attract and nurture interest among
talented Malaysians abroad to return as well as to
promote a greater diversity of job choices for fresh
graduates to explore.
44. The Government has committed several
initiatives to boost the representation of women
participation in an enabling environment. The
Women’s Directors program has a total of 500 women
who are being trained as board members. The
Government has also urged private and public
corporations to facilitate a childcare centre at the
workplace using federal incentives to
accommodate the female employee’s work life
balance. At present there are a total of 47.9% women
participating in the labour force.
The criteria that had contributed to the performance of
Labour Market Efficiency are:
Pay and productivity, ranks 2nd
; and
Effect of taxation on incentives to work, ranks 10th.
Among the criteria required for improving Labour
Market Efficiency are:
Women in labour force, ranked 121st; and
Redundancy costs, weeks of salary, ranked 110th.
The Government
has committed
several
initiatives to boost
the representation
of women
participation in an
enabling
environment. At
present there are a
total of 47.9%
women
participating in the
labour force.
24
Financially Effective
45. Malaysia maintains its position at 6th
in the
Financial Market Development pillar. This pillar is
one of Malaysia’s strongest and consistent
performers for the past few years. Among the criteria
that contributed to this pillar include ease of access
to loans at 5th
position and venture capital
availability at 7th
.
46. The International Monetary Fund’s (IMF)
Financial Sector Assessment Program (FSAP),
2013 articulates that Malaysia’s financial system
has weathered the recent global financial crisis
well, due to limited reliance of financial intermediaries
on cross-border funding, a well-developed
supervisory and regulatory regime, and a
well-capitalised banking system.
47. Malaysia’s second 10-year Financial Sector
Blueprint 2011-2020 will enhance the
competitiveness and dynamism of the financial
sector. The internationalisation of Islamic finance and
the development of Malaysia as an international
Islamic financial centre are also among the strategies
to be given emphasis.
The criteria that had contributed to the performance of
Financial Market Development pillar are:
Legal rights index at 1st position;
Ease of access to loans at 5th position;
Venture capital availability at 7th position;
Financial market development
An efficient financial sector allocates the resources saved by a nation’s citizens, as well as those entering the economy from abroad to their most productive uses.
Malaysia’s financial
system is resilient
and has managed
the financial crisis
well. Malaysia has
also been in the top
ten best performers
for the Financial
Market
Development pillar
since 2010.

25
Financing through local equity market at 9th
position; and
Affordability of financial services at 15th position.
Advancing Technological Readiness
48. Technological Readiness which focuses on
the availability and adoption of technology as well as
internet usage within the country maintains its
ranking at 51st
place, a comparatively low ranking
compared to Malaysia’s performance in the other 11
pillars. Under this pillar, international internet
bandwidth went up by 6 rungs to 77th
position.
49. 65.8% Malaysians were found to be
using the internet, with every 8 out of 100
population subscribing it through fixed broadband
services. The Government’s rebate program of
RM200 under the Youth Communication Package
to purchase smartphones is one of the initiatives to
access knowledge and information through the
internet.
50. To help promote greater adoption of ICT and
the usage of the internet for businesses, the
Government has launched the "Get Malaysia
Business Online" (GMBO) to encourage SMEs to
build their online presence. In the 2013 budget,
GMBO plans to assist 50,000 small entrepreneurs
particularly women to promote their business online
with a RM1,000 grant.
Technological readiness
The technological readiness pillar measures the agility with which an economy adopts existing technologies to enhance the productivity of its industries, with specific emphasis on its capacity to fully leverage information and communication technologies (ICT) in daily activities and production processes for increased efficiency and enabling innovation for competitiveness.
Get Malaysia
Business Online
(GMBO)
encourages SMEs
to build their
online presence.

26
51. The Digital Malaysia, a national programme
that is currently ongoing would advance Malaysia’s
digital economy as it creates an ecosystem that will
allow Malaysians to connect globally and interact
in real time, increase productivity, gross national
income and empower government, businesses
and citizens. To enable rural students to benefit from
ICT and the usage of the internet, the 1Malaysia
Internet Centre (PI1M), an initiative by the Malaysian
Communications and Multimedia Commission
(MCMC), has helped rural students to be literate in IT.
The criteria that had contributed to the performance of
Technological Readiness is FDI and technology
transfer, ranked 13th
.
Among the areas for improvement required for
Technological Readiness pillar are:
Mobile broadband subscriptions/100 population,
ranked 79th;
International internet bandwidth, kb/s per user,
ranked 77th; and
Fixed broadband internet subscriptions/100
population, ranked 66th.
The Digital
Malaysia
programme
aims to develop
and connect the
economy to a
digital business
age for all
Malaysians
digitally through
the internet by
2020.
27
Going for Global Markets
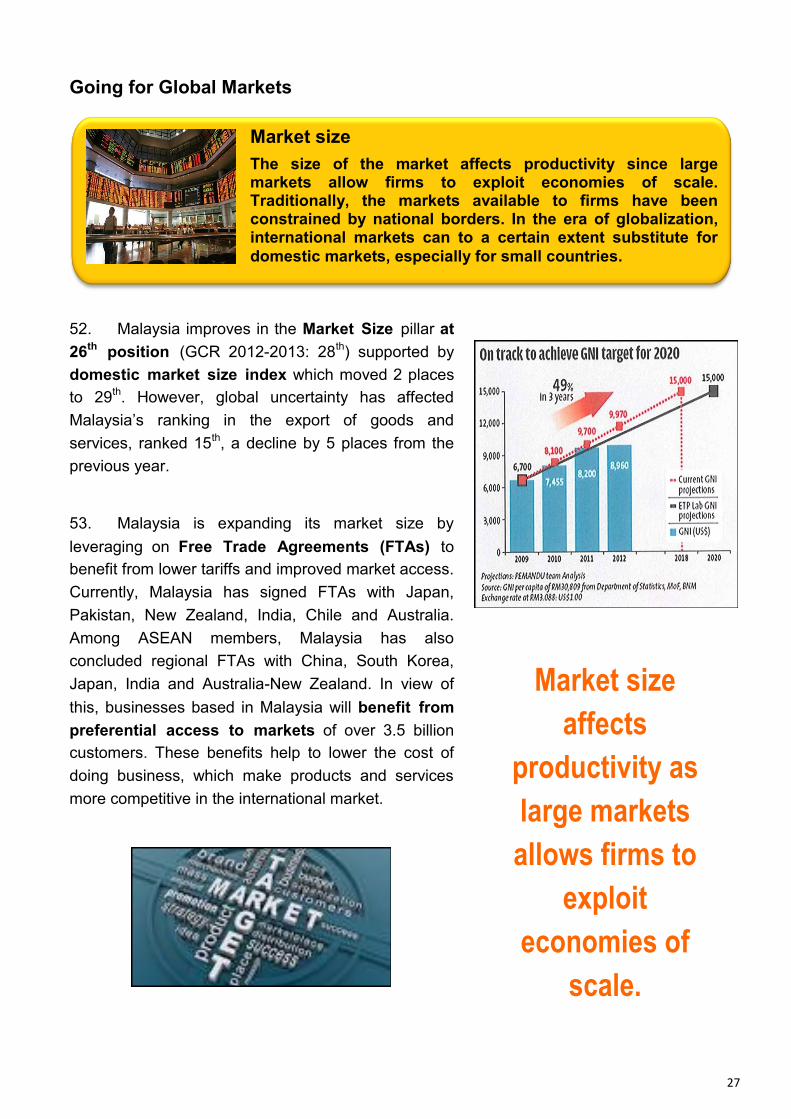
52. Malaysia improves in the Market Size pillar at
26th
position (GCR 2012-2013: 28th) supported by
domestic market size index which moved 2 places
to 29th. However, global uncertainty has affected
Malaysia’s ranking in the export of goods and
services, ranked 15th, a decline by 5 places from the
previous year.
53. Malaysia is expanding its market size by
leveraging on Free Trade Agreements (FTAs) to
benefit from lower tariffs and improved market access.
Currently, Malaysia has signed FTAs with Japan,
Pakistan, New Zealand, India, Chile and Australia.
Among ASEAN members, Malaysia has also
concluded regional FTAs with China, South Korea,
Japan, India and Australia-New Zealand. In view of
this, businesses based in Malaysia will benefit from
preferential access to markets of over 3.5 billion
customers. These benefits help to lower the cost of
doing business, which make products and services
more competitive in the international market.
Market size
The size of the market affects productivity since large markets allow firms to exploit economies of scale. Traditionally, the markets available to firms have been constrained by national borders. In the era of globalization, international markets can to a certain extent substitute for
domestic markets, especially for small countries.
Market size
affects
productivity as
large markets
allows firms to
exploit
economies of
scale.

28
Bringing Sophistication to Business
54. Malaysia retains its 20th
position in the
Business Sophistication pillar with improvement in
the indicator of value chain breadth in Malaysian
companies are broad, moving up to 17th
from 21st
position. This was further supported by control of
international distribution and marketing index
and willingness to delegate authority to
subordinates which increased by 1 position to 11th
and 13th respectively. It was also perceived that local
supplier quantity in Malaysia are extremely
numerous where Malaysia is ranked 17th
.
The criteria that had recorded favorable performance
in Business Sophistication pillar include:
Control of international distribution at 11th
position;
Willingness to delegate authority at 13th position;
and
State of cluster development at 14th position.
Business sophistication
There is no doubt that sophisticated business practices are conducive to higher efficiency in the production of goods and services. Business sophistication concerns two elements that are intricately linked: the quality of a country’s overall business networks and the quality of individual firms’ operations and strategies.

29
Empowering Innovation
55. The Innovation pillar maintains its rank at
25th
, with the criteria for both capacity for
innovation and university-industry collaboration in
R&D moving up 2 places to 15th
and 16th
respectively.
56. Malaysia continues to place innovation at the
centre of its transformation programmes through
various initiatives. Among them is the Innovation
Business Opportunities (IBO) programme, a
collaboration between the Performance
Management and Delivery Unit (PEMANDU) and the
Agensi Inovasi Malaysia (AIM) to provide a steady
pipeline of opportunities for the business community.
The programmes is already attracting “bids” from
interested companies to take new products and
services to market in fields such as agriculture,
education, the electronics and electrical sector and
financial services. As of May 2013, the 92 IBO
projects were already projected to contribute RM2
billion of gross national income. The 1 Malaysia
Biomass Strategy (1MBAS) is also expected to
contribute up to RM30 billion.
57. Patents are important as they help to secure a
form of economic wealth and branding for the various
businesses in Malaysia through licensing and royalty
incomes. Malaysia recorded an improvement for its
PCT patents per million population indicator to 31st
from 34th
previously. On-going initiatives in promot-
ing the use of patenting ideas and inventions are
being undertaken by the Intellectual Property
Corporation of Malaysia (MyIPO).
Innovation
Innovation can emerge from new technological and non-technological knowledge. Non-technological innovations are closely related to the know-how, skills, and working conditions that are embedded in organizations. In the long run, standards of living can be largely enhanced by technological innovation and technological breakthroughs.
Innovation is the
key towards
propelling
Malaysia towards
a high income
economy by 2020.

30
58. The Ministry of Science, Technology and
Innovation (MOSTI) has to conducted over 63
science awareness programmes with the help of the
private sector aimed at sharing scientific knowledge,
technology and innovation with the goal of aspiring the
future generations to look towards creating their own
innovations.
Among the criteria that had a positive impact on
Innovation include:
Government procurement of advanced
technological products at 4th position;
Capacity for innovation at 15th position;
University-industry collaboration in R&D at 16th
position;
Companies spending on R&D at 17th position; and
Availability of scientists and engineers at 19th
position.
Innovation
Business
Opportunities
(IBO)
programme
provides
opportunities
for the
business
community.

31
Evolution in Malaysia’s Competitiveness Performance
Figure 3 indicates the evolution of Malaysia’s competitiveness performance in the 12 pillars
from GCR 2010-2011 to GCR 2013-2014. To enhance national competitiveness and moving
Malaysia into the next stage of development, more emphasis is needed in the
Macroeconomic Environment (pillar 3), Higher Education & Training (pillar 5) and
Technological Readiness (pillar 9).
.
Best Average Worst
Figure 3: Evolution in Malaysia’s Competitiveness Performance by Rank
Evolution
in
Malaysia's
Rank
Glo
ba
l C
om
pe
titi
ve
ne
ss
Ind
ex
20
13
-20
14
1s
t p
illa
r: In
sti
tuti
on
s
2n
d p
illa
r: In
fra
str
uc
ture
3rd
pilla
r:
Ma
cro
ec
on
om
ic
En
vir
on
me
nt
4th
pilla
r: H
ea
lth
an
d
pri
ma
ry e
du
ca
tio
n
5th
pilla
r: H
igh
er
ed
uc
ati
on
an
d t
rain
ing
6th
pilla
r: G
oo
ds
ma
rke
t
eff
icie
nc
y
7th
pilla
r: L
ab
ou
r
ma
rke
t e
ffic
ien
cy
8th
pilla
r: F
ina
nc
ial
ma
rke
t d
ev
elo
pm
en
t
9th
pilla
r: T
ec
hn
olo
gic
al
rea
din
es
s
10
th p
illa
r: M
ark
et
siz
e
11
th p
illa
r: B
us
ine
ss
so
ph
isti
ca
tio
n
12
th p
illa
r: In
no
va
tio
n
GCI Edition
2013-2014
(n=148)24 29 29 38 33 46 10 25 6 51 26 20 25
2012-2013
(n=144)25 29 32 35 33 39 11 24 6 51 28 20 25
2011-2012
(n=142)21 30 26 29 33 38 15 20 3 44 29 20 24
2010-2011
(n=139)26 42 30 41 34 49 27 35 7 40 29 25 24
Rank

32
Competitiveness Enhancement Initiatives
To create enabling environment to foster innovation through collaboration and in
particular develop appropriate educational systems;
Continue efforts on structural reforms and critical investments required to ensure a
prosperous environment and employment for citizens and complement these with
transformation programmes that will drive further economic growth; and
Address perception issues among the business community and the public at large for a
better and more objective assessment of various information and facts on
competitiveness.
Committed to Transform the Nation
Despite the challenging external environment, Malaysia’s economic and financial
fundamentals remain sound, a reflection of our economic management, enhanced
productivity, emphasis on being more innovative, supported by strong transformation
initiatives. The Government is committed to building a resilient, dynamic and innovative
economy; enhancing security and public safety; strengthening women’s participation;
fighting corruption as well as enhancing good governance.

33
Appendix I
Global Competitiveness Index 2013-2014 Rankings and
2012-2013 Comparisons
Country / Economy GCI 2013-2014 GCI 2012-2013
Rank Score Rank Score
Switzerland 1 5.67 1 5.72
Singapore 2 5.61 2 5.67
Finland 3 5.54 3 5.55
Germany 4 5.51 6 5.48
United States 5 5.48 7 5.47
Sweden 6 5.48 4 5.53
Hong Kong SAR 7 5.47 9 5.41
Netherlands 8 5.42 5 5.50
Japan 9 5.40 10 5.40
United Kingdom 10 5.37 8 5.45
Norway 11 5.33 15 5.27
Taiwan, China 12 5.29 13 5.28
Qatar 13 5.24 11 5.38
Canada 14 5.20 14 5.27
Denmark 15 5.18 12 5.29
Austria 16 5.15 16 5.22
Belgium 17 5.13 17 5.21
New Zealand 18 5.11 23 5.09
United Arab Emirates 19 5.11 24 5.07
Saudi Arabia 20 5.10 18 5.19
Australia 21 5.09 20 5.12
Luxembourg 22 5.09 22 5.09
France 23 5.05 21 5.11
Malaysia 24 5.03 25 5.06
Korea, Rep. 25 5.01 19 5.12
Brunei Darussalam 26 4.95 28 4.87
Israel 27 4.94 26 5.02
Ireland 28 4.92 27 4.91
China 29 4.84 29 4.83
Puerto Rico 30 4.67 31 4.67
Iceland 31 4.66 30 4.74
Estonia 32 4.65 34 4.64
Oman 33 4.64 32 4.65
Chile 34 4.61 33 4.65
Spain 35 4.57 36 4.60
Kuwait 36 4.56 37 4.56
Thailand 37 4.54 38 4.52
Indonesia 38 4.53 50 4.40

34
Country / Economy GCI 2013-2014 GCI 2012-2013
Rank Score Rank Score
Azerbaijan 39 4.51 46 4.41
Panama 40 4.50 40 4.49
Malta 41 4.50 47 4.41
Poland 42 4.46 41 4.46
Bahrain 43 4.45 35 4.63
Turkey 44 4.45 43 4.45
Mauritius 45 4.45 54 4.35
Czech Republic 46 4.43 39 4.51
Barbados 47 4.42 44 4.42
Lithuania 48 4.41 45 4.41
Italy 49 4.41 42 4.46
Kazakhstan 50 4.41 51 4.38
Portugal 51 4.40 49 4.40
Latvia 52 4.40 55 4.35
South Africa 53 4.37 52 4.37
Costa Rica 54 4.35 57 4.34
Mexico 55 4.34 53 4.36
Brazil 56 4.33 48 4.40
Bulgaria 57 4.31 62 4.27
Cyprus 58 4.30 58 4.32
Philippines 59 4.29 65 4.23
India 60 4.28 59 4.32
Peru 61 4.25 61 4.28
Slovenia 62 4.25 56 4.34
Hungary 63 4.25 60 4.30
Russian Federation 64 4.25 67 4.20
Sri Lanka 65 4.22 68 4.19
Rwanda 66 4.21 63 4.24
Montenegro 67 4.20 72 4.14
Jordan 68 4.20 64 4.23
Colombia 69 4.19 69 4.18
Vietnam 70 4.18 75 4.11
Ecuador 71 4.18 86 3.94
Georgia 72 4.15 77 4.07
Macedonia, FYR 73 4.14 80 4.04
Botswana 74 4.13 79 4.06
Croatia 75 4.13 81 4.04
Romania 76 4.13 78 4.07
Morocco 77 4.11 70 4.15
Slovak Republic 78 4.10 71 4.14
Armenia 79 4.10 82 4.02
Seychelles 80 4.10 76 4.10
Lao PDR* 81 4.08 - -

35
Country / Economy GCI 2013-2014 GCI 2012-2013
Rank Score Rank Score
Iran, Islamic Republic 82 4.07 66 4.22
Tunisia* 83 4.06 - -
Ukraine 84 4.05 73 4.14
Uruguay 85 4.05 74 4.13
Guatemala 86 4.04 83 4.01
Bosnia and Herzegovina 87 4.02 88 3.93
Cambodia 88 4.01 85 4.01
Moldova 89 3.94 87 3.94
Namibia 90 3.93 92 3.88
Greece 91 3.93 96 3.86
Trinidad and Tobago 92 3.91 84 4.01
Zambia 93 3.86 102 3.80
Jamaica 94 3.86 97 3.84
Albania 95 3.85 89 3.91
Kenya 96 3.85 106 3.75
El Salvador 97 3.84 101 3.80
Bolivia 98 3.84 104 3.78
Nicaragua 99 3.84 108 3.73
Algeria 100 3.79 110 3.72
Serbia 101 3.77 95 3.87
Guyana 102 3.77 109 3.73
Lebanon 103 3.77 91 3.88
Argentina 104 3.76 94 3.87
Dominican Republic 105 3.76 105 3.77
Suriname 106 3.75 114 3.68
Mongolia 107 3.75 93 3.87
Libya 108 3.73 113 3.68
Bhutan* 109 3.73 - -
Bangladesh 110 3.71 118 3.65
Honduras 111 3.70 90 3.88
Gabon 112 3.70 99 3.82
Senegal 113 3.70 117 3.66
Ghana 114 3.69 103 3.79
Cameroon 115 3.68 112 3.69
Gambia, The 116 3.67 98 3.83
Nepal 117 3.66 125 3.49
Egypt 118 3.63 107 3.73
Paraguay 119 3.61 116 3.67
Nigeria 120 3.57 115 3.67
Kyrgyz Republic 121 3.57 127 3.44
Cape Verde 122 3.53 122 3.55
Lesotho 123 3.52 137 3.19

36
Country / Economy GCI 2013-2014 GCI 2012-2013
Rank Score Rank Score
Swaziland 124 3.52 135 3.28
Tanzania 125 3.50 120 3.60
Côte d’Ivoire 126 3.50 131 3.36
Ethiopia 127 3.50 121 3.55
Liberia 128 3.45 111 3.71
Uganda 129 3.45 123 3.53
Benin 130 3.45 119 3.61
Zimbabwe 131 3.44 132 3.34
Madagascar 132 3.42 130 3.38
Pakistan 133 3.41 124 3.52
Venezuela 134 3.35 126 3.46
Mali 135 3.33 128 3.43
Malawi 136 3.32 129 3.38
Mozambique 137 3.30 138 3.17
Timor-Leste 138 3.25 136 3.27
Myanmar* 139 3.23 - -
Burkina Faso 140 3.21 133 3.34
Mauritania 141 3.19 134 3.32
Angola* 142 3.15 - -
Haiti 143 3.11 142 2.90
Sierra Leone 144 3.01 143 2.82
Yemen 145 2.98 140 2.97
Burundi 146 2.92 144 2.78
Guinea 147 2.91 141 2.90
Chad 148 2.85 139 3.05
Note: *New entrants / Re-instated

37
Appendix 2
The Global Competitiveness Index 2013-2014 Rankings for
Asia Pacific Countries
The Global Competitiveness Index 2013-2014 Rankings for
ASEAN Countries
Country / Economy GCI 2013-2014
Rank Score
Singapore 1 5.61
Hong Kong SAR 2 5.47
Japan 3 5.40
Taiwan, China 4 5.29
New Zealand 5 5.11
Australia 6 5.09
Malaysia 7 5.03
Korea, Rep. 8 5.01
Brunei Darussalam 9 4.95
China 10 4.84
Thailand 11 4.54
Indonesia 12 4.53
Philippines 13 4.29
India 14 4.28
Sri Lanka 15 4.22
Vietnam 16 4.18
Lao PDR* 17 4.08
Cambodia 18 4.01
Mongolia 19 3.75
Bhutan* 20 3.73
Bangladesh 21 3.71
Nepal 22 3.66
Kyrgyz Republic 23 3.57
Pakistan 24 3.41
Myanmar* 25 3.23
Country / Economy GCI 2013-2014
Rank Score
Singapore 1 5.61
Malaysia 2 5.03
Brunei Darussalam 3 4.95
Thailand 4 4.54
Indonesia 5 4.53
Philippines 6 4.29
Vietnam 7 4.18
Lao PDR* 8 4.08
Cambodia 9 4.01
Myanmar* 10 3.23

38
Appendix 3
List of Countries/ Economies at Each Stage of Development
Stage 1 Transition from
1 to 2 Stage 2
Transition from
2 to 3 Stage 3
(38 economies) (20 economies) (31 economies) (22 economies) (37 economies)
Bangladesh Algeria Albania Argentina Australia
Benin Angola* Bosnia and
Herzegovina Barbados Austria
Burkina Faso Armenia Bulgaria Brazil Bahrain
Burundi Azerbaijan Cape Verde Chile Belgium
Cambodia Bhutan* China Costa Rica Canada
Cameroon Bolivia Colombia Croatia Cyprus
Chad Botswana Dominican
Republic Estonia Czech Republic
Côte d'Ivoire Brunei Darussalam Ecuador Hungary Denmark
Ethiopia Gabon Egypt Kazakhstan Finland
Gambia, The Honduras El Salvador Latvia France
Ghana Iran, Islamic Rep. Georgia Lebanon Germany
Guinea Kuwait Guatemala Lithuania Greece
Haiti Libya Guyana Malaysia Hong Kong SAR
India Moldova Indonesia Mexico Iceland
Kenya Mongolia Jamaica Oman Ireland
Kyrgyz Republic Morocco Jordan Panama Israel
Lao PDR* Philippines Macedonia, FYR Poland Italy
Lesotho Saudi Arabia Mauritius Russian Federation Japan
Liberia Sri Lanka Montenegro Seychelles Korea, Rep.
Madagascar Venezuela Namibia Slovak Republic Luxembourg
Malawi Paraguay Turkey Malta
Mali Peru Uruguay Netherlands
Mauritania Romania New Zealand
Mozambique Serbia Norway
Myanmar* South Africa Portugal
Nepal Suriname Puerto Rico
Nicaragua Swaziland Qatar
Nigeria Thailand Singapore
Pakistan Timor-Leste Slovenia
Rwanda Tunisia* Spain
Senegal Ukraine Sweden
Sierra Leone Switzerland
Tanzania Taiwan, China
Uganda Trinidad and Tobago
Vietnam United Arab
Emirates
Yemen United Kingdom
Zambia United States
Zimbabwe
Note: *New entrants / Re-instated

39
ASEAN’s Competitiveness Landscape:
A mixed picture with encouraging trends
To any observer of the region, the developmental gap within the Association of Southeast Asian
Nations (ASEAN) is striking. No other regional integration initiative has deeper disparities among
participating members. Founded in 1967 by Indonesia, Malaysia, Singapore, Thailand, and the
Philippines, the subsequent accession of Brunei Darussalam, Vietnam, Lao PDR, Myanmar, and
Cambodia have made ASEAN’s developmental landscape even more disparate. For example,
Singapore is 80 times richer than Myanmar, where infant mortality rate is 25 times higher.
Singapore’s population also lives 20 years longer than Cambodia’s.
Despite this diversity, ASEAN has embarked on an ambitious journey toward regional integration.
The ASEAN Economic Community (AEC) is one of the three pillars of this integration effort,
alongside the ASEAN Political-Security Community and the ASEAN Socio-Cultural Community.
The AEC vision is for ASEAN to become, by 2015, a single market and production base, a highly
competitive economic region, a region of equitable economic development, and a region fully
integrated into the global economy. Progress is real. By its own account, ASEAN has implemented
nearly 80 percent of the measures set out in the AEC Blueprint of 2007.
Although it remains to be seen whether the AEC vision will be fully realised by 2015, the
fast-approaching deadline should motivate ASEAN leaders, and boosting competitiveness should
be a priority. Competitiveness will foster economic development, which in turn will reduce
disparities and accelerate regional and global integration—the other goals of the AEC.
This year for the first time, with the inclusion of Lao PDR and Myanmar, the Global
Competitiveness Index (GCI) offers a complete picture of ASEAN’s competitiveness landscape,
and it is a landscape that demonstrates much greater contrast than exhibited in earlier GCI
editions. Lao PDR comes in 81st and Myanmar ranks 139th, some 50 places behind Cambodia,
which at 88th place is ranked second lowest in ASEAN. Table 1 allows for a more granular analysis
of the GCI results by reporting the rank achieved by ASEAN Member States in the overall GCI and
its 12 pillars. The different shadings allow for a ready identification of strengths and weaknesses
and of regional patterns.
Malaysia performs consistently well, although room for improvement remains. Myanmar is
ASEAN’s lowest ranked nation on all the pillars except market size. In technological readiness, it
even ranks last among the 148 economies studied. The table also reveals that the competitiveness
of most ASEAN countries is still impeded by poor transport, inadequate energy and communication
infrastructures, low enrollment rates and/or mediocre quality in education, and low levels of
technological readiness.
With the exception of Singapore and Myanmar, performance tends to be inconsistent across the
different pillars of the Index. Finally, the macroeconomic environment is rather sound in a majority
Appendix 4

40
of ASEAN countries, much more so than in many troubled advanced economies. In fact, Brunei
Darussalam—an oil-rich economy—tops this pillar. More prudent and sustainable macroeconomic
management is probably one of the positive consequences of the 1997 Asian financial crisis, which
created havoc across ASEAN nations and inspired reforms.
All in all, the assessment is very mixed. Much remains to be done for ASEAN to become a more
competitive, prosperous, and harmonious group. Although ASEAN economies have enjoyed brisk
economic growth over the past decade, the foundations remain relatively shaky for a number of
countries. Yet there is reason for optimism.
Since the 2006–2007 edition of the GCI, the competitiveness trends for ASEAN have been
overwhelmingly positive, as seen in Figure 1, which depicts the evolution in rank of selected
developing Asian countries within a constant sample of 118 economies. The seven ASEAN members
(identified by solid blue lines) covered since 2006 have either improved or maintained their standing
over the eight-year period to 2013. Cambodia has leapfrogged 23 ranks, the fourth largest gain within
the entire sample. Indonesia and the Philippines each progress 19 places. Indonesia posts the
biggest progression among the group of 20 major economies (G20). It is all the more encouraging
that these two nations are also the most populous in ASEAN, accounting for more than half of the
group’s population.
Furthermore, Singapore has improved steadily from 8th in 2006 to 2nd in 2011—behind
Switzerland—and has retained its rank since then. Malaysia and Thailand have slightly declined,
losing four and five places, respectively, but they have done so from a relatively high base and both
countries have progressed in the last year.
The fact that ASEAN membership spans the entire development ladder and includes competitiveness
champions can benefit the less competitive countries in the group. Indeed, there are many stories of
member countries successfully addressing key competitiveness issues in ways that could be
emulated by others. For instance, Singapore is a competitiveness champion. Its administration is one
of the world’s least corrupt and most efficient.
Malaysia has been tackling excessive regulation as part of its Government Transformation
Programme, and the Philippines—where a national competitiveness council was set up in 2006—has
made significant strides against corruption. Furthermore, a number of regional initiatives, launched in
the 1990s following the accession of less developed members and aimed at reducing the
developmental gap, have proven quite effective. These include the Initiative for ASEAN Integration
and the Master Plan on ASEAN connectivity. Although the responsibility for addressing the structural
issues described above lies primarily with national actors, regional cooperation is critical. Efforts at
the country and regional levels are complementary and reinforce each other. They enable Member
States to leverage growth opportunities and strengthen their respective competitive advantages to
move up the value chain, thus reducing the intra-ASEAN developmental gap.

41
Table 1: Performance of ASEAN members in the 2013 - 2014 GCI and the 12
composing pillars, rank out of 148 economies
Best Median Worst
Source: Extracted from the Global Competitiveness Report 2013-2014, World Economic Forum (WEF)

42
For further information on the
Global Competitiveness Report 2013-2014
(GCR 2013-2014), please contact:
Global Competitiveness Department (GCD)
Malaysia Productivity Corporation (MPC)
A-06-01 Tingkat 6, Blok A PJ8,
No.23 Jalan Barat,
Seksyen 8
46050 Petaling Jaya,
Selangor Darul Ehsan,
Malaysia.
Tel: 603-7960 0173
Fax: 603-7960 0206
Email: [email protected]
1800 88 1140
www.mpc.gov.my