intro lecture 2a - york university€¦ · riddles are like scientific method similarities &...
TRANSCRIPT

UNIT I(slides copyright D. McCann, 2006)
PSYCHOLOGY is ……

PSYCHOLOGY is ……
“the scientific study ofbehavior and mental
processes”
SCOPE OF THE SUBJECT
Blowfly
Wilder Penfield
Attitude change
Mob Violence (deindividuation)

GOALS OF SCIENCE
Describe
Explain
Predict
Control & change
SCIENTIFIC METHOD – topursue goals Research Theory Research reports
Replication Hypothesis testing
difficulties/examples (ONLY YES/NO QUESTIONS ALLOWED FOR
DATA)

-
(ONLY YES/NO QUESTIONS ALLOWED FORDATA)
-

-
-Answers - - -

Riddles are like Scientific Method similarities & characteristics
- - - - - - -

RESEARCH – complicated bysubtle biases Hypothesis: “York Brand” T.P. is the
best test U of T York Western

result: thus, “ other examples:
- -
-

RESEARCH APPROACHES – 5RESEARCH GOALS – 3 A,B,C
A: DESCRIBE 1. Naturalistic Observation
- “Deindividuation” –
2. Case Study clinical psychology, e.g., Freud
3. Survey Research -polls -representative sample

Second Goal (& 4th research approach)
B : PREDICTION 4) Correlational Research
is there an association between two variables variable is:
- -
correlation coefficient (is a statistic, a numberrepresenting the degree of association)
its characteristics: - -

PROBLEM: IT DOES NOT IMPLYCAUSATION!
EXAMPLE: measure variables A & B if A & B are correlated (are associated) then possible explanations are:

Example Correlation of + .70
As the number of storks in winter resting on roofs increases, thenumber of human births 9 months later increases
- -
-
- -

Both A & B increase (at the same time, so seemto be related) but neither causes the other, theyare caused (independently) by C
EXAMPLE: Height & weight + . 78
- - - -

If the correlation = 0.0 ?? - E.G.: - - -

Negative Correlations A (anxiety) & B (test performance)
-.65 Thus,
- Finally, correlation does not imply
causation

EXPERIMENTS if well done, allow for causal statements Hypothetical Example: Alcohol and
memory Hypothesis: Independent Variable –

Levels of the independent variable createexperimental“conditions” Levels: 0 beer, 1 beer, 8 beer
(thus, three conditions) Participants:
Dependent Variable
-here,

RESULTS: (numbers represent average recall of
participants in that condition) 0 Beer 1 Beer 8 Beer - (also called thecontrol condition)
CONCLUSIONS:-

Important Concepts Hypothesis Independent Variable Dependent Variable & Extraneous Variables
Example: Height and Reaction Time - - -

Perhaps…
You can be…

RT = Reaction time, speed ofreaction
Hypothesis: - RESULTS
- Interpretation:
- Comments:??
Important Concepts Hypothesis, Independent Variable, Dependent
Variable, & Extraneous Variables
-
Good Experiments: - - -

Explanations (some of them..)
could be or,
- - - -
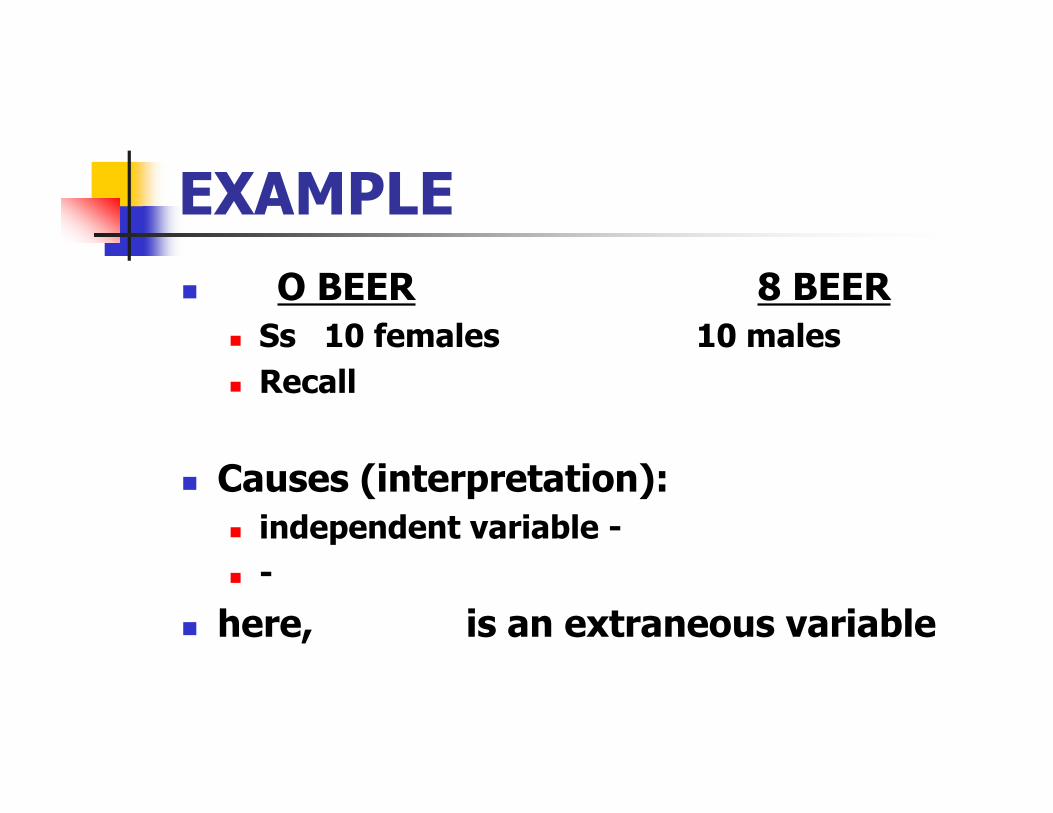
EXAMPLE O BEER 8 BEER
Ss 10 females 10 males Recall
Causes (interpretation): independent variable - -
here, is an extraneous variable

EXAMPLE 2
Hypothesis – pleasant scentattraction Independent – - Dependent – Participants – first year undergrad
males

Problems… INDEPENDENT EXTRANEOUS RESULT
No scent
Mildly Pleasant
Very Pleasant
Explanation Differences in Differences in

Types of extraneousvariables: 2
A) problem with how expt. conducted- ??? (which one)
B) subject characteristics
Solutions: A)- B) -
e.g.,.. personality, age, IQ, religion, ethnicbackground, height, education, … etc. …

How to equalize…. Random Assignment:
-“controls for extraneous variables bymaking chances or probability equalthat each characteristic will berepresented in each condition”
e.g., flip a coin to decide whichcondition a participant is in whenthey arrive (random)
now, done by computer

Important Concepts cont’d
Validity: Internal – External – (generalizability)
relationship to “real world”
Psych labs real worldParticipants broader world-
research tool Descriptive * - describe the results
in your sample of participants Inferential – go beyond your
sample, to the population -

DESCRIPTIVE STATISTICS Experimental Example: imagery &
recall Conditions:
1. Control – (No image group) –remember the words
2. Image – try to visualize the wordswhile remembering them
Procedure: -

Results(Note: 25 words in the list, 10 participants per condition)
Image No Image 20 5
24 9 20 5 18 9 22 6 19 11 20 8
19 11 17 7 21 9

Presentation Frequency
Distribution – seee.g.
Bar Graph – see e.g. Frequency Polygon –
see e.g.

Presenting Sample Results:Descriptive Statistics In describing the shape of frequency
polygons: A. Symmetricality
- - -
B. Kurtosis (peakedness) - - - (see examples…)

Descriptive Stats: Measures of CentralTendency
one number gives a concise,description of the condition, can beused to compare two (or more)conditions mean:
e.g.,
mode: = e.g.,
median:

To calculate the median:
rank order scores from smallest to largest then identify score that splits group in half
(may be real, or imaginary score) no-image group:
5, 5, 6, 7, 8, 9, 9, 9, 11, 11 median is
if the scores were, 5, 5, 6, 7, 8, 9, 9, 9, 11 - -

these measures of “centraltendency” provide a more concise,descriptive statement of groupthat the freq. distribution

Descriptive Stats: Measures of variability
(a measure of how much the scoresvary, or differ): e.g. – temperature of Albuquerque & San.
Fran. for a year lowest highest X
ALBER SAN. FRAN. thus,

range: (highest score – lowest) AL = SF =
however, Can be a problem example: age variability in two classes
M R A 19, 19, 19, 19, 19, 20, 25 B 17, 17, 17, 20, 23, 23, 23

neither age or range differentiatesclasses
but, for A,
use the variance: VAR =
Standard Deviation = variance

EXAMPLE: No-image group (variance)
Score S – mean (S – M)2
8 8-8=0 02 = 0 11 11-8=3 9 6 -2 4 7 -1 1 5 -3 9 9 1 1 5 -3 9 9 1 1 9 1 1 11 3 9 44 Variance = 44/10 = 4.4 Standard Deviation = var = 2.1

Descriptive statistics summarize our“sample” of subjects/participants
Central Tendency mean * mode median
Variability range variance standard deviation*
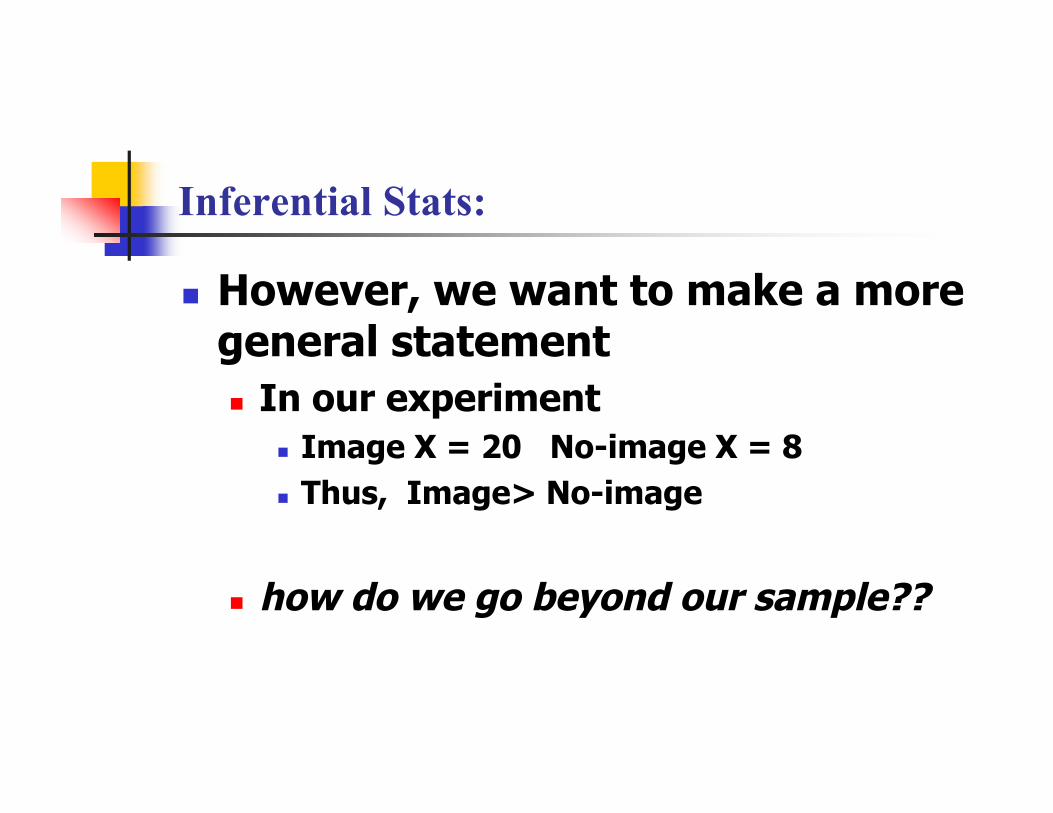
Inferential Stats:
However, we want to make a moregeneral statement In our experiment
Image X = 20 No-image X = 8 Thus, Image> No-image
how do we go beyond our sample??

We want to assume the same thingwould happened no matter whatgroup of participants we chose, -

Inferential Statistics
are a set of mathematical operationsthat… tells us the probability of getting the same
results if we took another sample, another,…
we accept an error probability of p< .05 =
- - -
