intrinsic value for firm valuation: a case study
TRANSCRIPT

Intrinsic Value for Firm Valuation: A Case Study
Qianhao Li* Washington University, United States
[email protected] *corresponding author
Keywords: Enterprise; Value, Economy; Finance
Abstract: To value a rm, there are usually two di erent methods, namely direct val-uation and relative valuation. When referring to direct valuation, we calculate the intrinsic value using the idea of time value of money (TVM) to convert fu-ture cash ow into its present value under a proper discount rate. This method could give us a clear image of how much we value a rm or equity. As for relative valuation, it is a method that usually gives investors an overall idea of comparison among similar companies. We use multiples, or indices, in relative valuation such as P/E, P/B and many other ratios which all function di er-ently as indicators of pro tability of a rm. In this paper, we will utilize the rst method, direct valuation, to value rms.
1. Introduction Researchers have studied many aspects of a valuation process. Some papers focused on the role
of accounting and discussed the valuation model based on \what we know" to avoid speculations as much as possible (Penman, 2006). Moreover, the terminal value calculation is worth arguing among analysts as well. Some papers discussed an alternative to the unrealistic assumption about terminal value calculation by introducing an adjustable fade rate called f (Hol-land, 2018). For practicing purpose, some papers aimed to assist the discounted cash ow (DCF) users by examining the relationship between free cash ow (FCF) and economic value added (EVA) as well as the equivalence to net present value (NPV) in a more general way which links to practical problems (Shrieves and Wachowicz, 2001).
2. Valuation Formula Lots of studies on valuation has been conducted and there are many insight-ful papers each
having its own perspective. Some relevant papers are reviewed as follows. Also, there are papers summarizing ten dif-ferent DCF methods including free cash ow, equity
cash ow and so on in answering whether they provide the same value (Fernandez and Magni, 2007). These topics are vital in yielding a more accurate output. These papers provided a critique of the direct valuation model in identifying what is being captured and what is not (Penman, 2016). As a result, researchers are trying to develop a more robust valuation by stressing three critical points that include the role of accounting, being practical and the accordance with nancial theory.
1.1 Cash Flow Free cash ow is preferable in our valuation model. For rm valuation, we use free cash ow to rm
(FCFF) and for equity valuation; we use free cash ow to equity (FCFE). FCFF = After-tax operating income - net capital expenditure - change in work-ing capital FCFE = Net income - net capital expenditure - change in working capital
1.2 Discount Rate The rate needed to discount cash ow. For equity valuation, we use cost of eq-uity and for rm
valuation, we use cost of capital which is the weighted average of cost of debt and cost of equity.
2020 International Conference on Social and Human Sciences (ICSHS2020)
DOI: 10.38007/Proceedings.0000140 ISBN: 978-1-80052-000-4- 775 -
3. Example In this paper, two major american airline companies, Delta Airlines(DAL) and United
Airlines(UAL), are valued using the intrinsic valuation model.
2.1 Cash Flow Table 1. intrinsic valuation model
DAL UAL operating income 5,264,000 3,779,000
income tax 1,216,000 529,000 net income 3,935,000 2,129,000
working capital 2018 -12,238,000 -5,999,000 working capital 2017 -10,729,000 -5,563,000
working capital -1,509,000 -436,000 depreciation 2,329,000 2,240,000
capital expenditure 5,168,000 4,177,000 FCFF 2,718,000 1,749,000 FCFE 2,605,000 628,000
(All numbers in thousands from Yr2018)
2.2 Discount Rate Table 2. Discount Rate
DAL UAL Risk-free rate1 2.75% 2.75%
1.30 1.22 market return2 6.99% 6.99%
ERP 5.51% 5.17% cost of equity 9.91% 9.06%
market value of equity3 36.42B 22.59B marginal tax rate4 25.30% 25.30%
default spread5 2.00% 3.00% cost of debt 3.55% 4.30%
book value of debt 17.44B 20.18B cost of capital 7.85% 6.81%
a).the arithmetic mean of U.S. 10-yr bond rates from 2018.6 to 2019.6 b).from S&P Dow Jones Indices for U.S. stock market 1yr annualized return c).number of shares outstanding multiplied by the 200-day average of stock price d).arithmetic mean from the lowest 21.00% to as high as 29.60% due to local tax rate e).according to the rating from SP and converting chart from NYU stern
- 776 -

2.3 Growth Rate Table 3. Growth Rate
DAL UAL invested capital 25,356,000 23,795,000
ROC 15.96% 13.66% reinvestment 1,330,000 1,501,000
reinvestment rate 32.86% 46.18% g( rm) 5.24% 6.31%
payout ratio 20.93% 0.00% retention rate 79.07% 100.00%
ROE 33.67% 27.90% g(equity) 26.62% 27.90%
2.4 Cash Flow Chart in 5 Years Based on the cas how and growth rate, the following charts could be calculated:
Table 4. Cash Flow Chart in 5 Years
DAL Y1 Y2 Y3 Y4 Y5 Year 2018 2019 2020 2021 2022 2023
FCFF 2,718,000 2,860,423 3,010,309 3,168,050 3,334,055 3,508,760 FCFE 2,605,000 3,298,451 4,176,499 5,288,283 6,696,023 8,478,505
Table 5. Cash Flow Chart in 5 Years
UAL Y1 Y2 Y3 Y4 Y5 Year 2018 2019 2020 2021 2022 2023
FCFF 1,749,000 1,859,362 1,976,688 2,101,417 2,234,016 2,374,982 FCFE 628,000 803,212 1,027,308 1,313,927 1,680,513 2,149,376
2.5 Terminal Value Table 6. Terminal Value
DAL UAL g0(set around Risk-free rate) 2.00% 2.00%
r0 6.73% 6.21% new reinvestment rate 12.53% 14.64%
terminal value 66,183,819 49,117,110
4. Sensitive Analysis and Conclusion In utilizing direct valuation, there can still be subtle di erence among an-alysts. First, di erent
analysts could have used di erent numbers as inputs. Second, many factors depend on analysts' own expectation to the rm or in-dustry such as the growth rate. In other words, these uncertain data or inputs are variables in the intrinsic valuation model. This is the stage where sensitive analysis is introduced which allows analysts to study the results better.
Before doing sensitive analysis, it is useful to do a comparison on the results stated above.
- 777 -
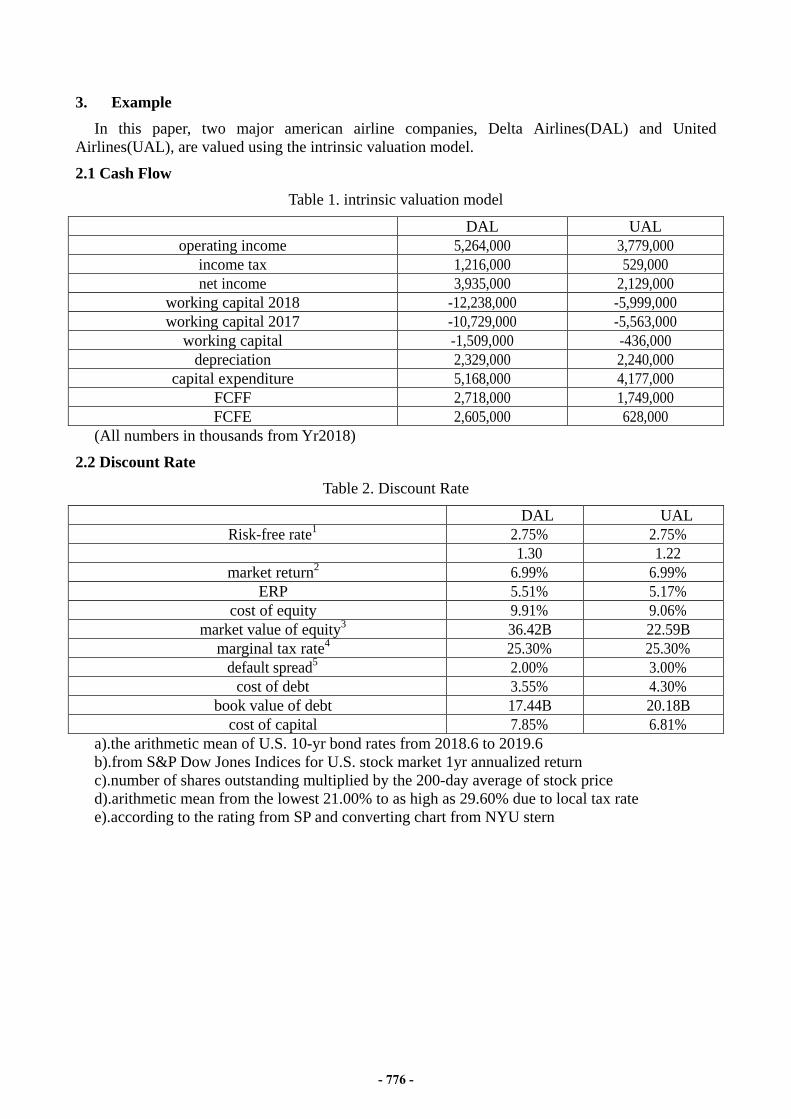
intrinsic value (numbers in billions)
FCFF (numbers in billions) Figure 1. Sensitive Analysis
As shown above, the major input that contributes to the di erence of intrinsic value is FCFF. Although the cost of capital for delta airline is larger than that of united airline, delta still has a greater value. One way to do the sensitive analysis is to change the inputs of one Airline Company so that the output could be almost the same as the other. However, the di erence caused by cash ow has a major e ect which is hard to o set by merely changing other factors such as lowering cost of capital or having a higher growth rate. Though, for example, it is still useful to uctuate the cost of capital within 5% and see the scope of changing of the output.
5. Conclusion For rm valuation, intrinsic value plays an important role as it conveys a clear image of how much
a rm is worth by converting the future cash ows into a present value. Though the amount of and the variety of data are considerable, the output of intrinsic valuation method is of great value itself.
There are four main parts in this case study. First, we presented the main idea behind the study, including the intrinsic valuation and the relative valua-tion, and introduced the existing studies by other scholars. Second, we gener-alized the valuation model by analyzing four vital inputs, cash ow, discount rate, growth rate and terminal value and stated some useful formulas. Then, we further illustrated not only the valuation model but also the calculation pro-cess by valuing two di erent airlines, DAL and UAL, and presented the result. Finally, we conducted a sensitive analysis which is useful in pointing out the impact of variables on rm valuation.
This study is only a small part of rm valuation but it does underlie the fu-ture analysis and even conduct the nal decision making. A steady foundation is always sought by analysts and therefore, future re nements of the calculation details are always needed.
- 778 -

References [1] David A. Holland. An Improved Method for Valuing Mature Companies and Estimating Terminal Value. (2018) : 853-76. [2] Fernandez, Pablo. Valuing Companies by Cash Flow Discounting: Ten Meth-ods and Nine Theories. Managerial Finance 33, no. 11 (2007): 853-76. [3] Penman, Stephen H.. Handling Valuation Models. Journal of Applied Cor-porate Finance 18, no. 2 (2006): 48-55. [4] Penman, Stephen. Valuation: The State of the Art. Schmalenbach Business Review 17, no. 1 (2016): 3-23.
- 779 -