intrapreneurship: testing the application of theory within …€¦ · intrapreneurship: testing...
TRANSCRIPT
Intrapreneurship: Testing the application of theory within a
New Zealand workplace.
A research report presented in partial fulfilment of the requirements of the
degree of Masters of Management at Massey University.
CHRISTOPHER BURGESS
2008
ii
ABSTRACT
The concept of intrapreneurship (as termed by Pinchot, 1985) was built upon the notion
that entrepreneurial characteristics could be integrated within an established organisation.
A growing body of intrapreneurial research and knowledge now exists (Pinchot &
Pellman, 1999). It is however questionable whether the application of such theory is
being appropriately applied in today’s corporate workplace (Teltumbde, 2006). This
research project discusses the relevance of intrapreneurial and entrepreneurial theory and
puts forward an integrated framework for testing intrapreneurship and its culminating
factors.
This project additionally reports on questions relating to an innovative and productive
capacity. This study surveyed 61 random employees from across 14 New Zealand
organisations. The results illustrate a weak acknowledgement and application of
intrapreneurial factors particularly in the areas of ‘organisational foresight’, ‘resistance to
bureaucracy’, ‘time to explore new ideas’, ‘staff review’, ‘staff development’, and
‘strategic vision’. The results go on to show an average productive capacity measurement
of 70% and an innovative capacity measurement of 68% from within the sampled
organisations. Both the innovative and productiveness figures are suggestive of an
inability for New Zealand organisations to adjust to a knowledge based economy in
which New Zealand government policy desires (Clark, 2007; Key, 2008). Intrapreneurial
theorists (Pinchot, 1985; Kuratko, Montagno, & Hornsby, 1990; Zahra, 1993; Carrier,
1994; Knight, 1997; Antoncic & Hisrich, 2003) refer to an association between an
organisations ability to promote intrapreneurial activities and its capacity to be productive
and innovative. This study further explores this association and finds a positive
iii
correlation between a high application of intrapreneurial factors, a high innovative
capacity and a high productive capacity. This project utilises a quantitative research
approach using a 11 point multi-item scale. The intensity of intrapreneurship was
measured through integrating; ‘The Pinchot & Company Innovation Climate
Questionnaire’ (Pinchot & Pellman, 1999), Knight’s (1997) refinement of Khandwalla’s
(1977) ‘ENTRESCALE’, Kuratko, Montagno, & Hornsby’s (1990) ‘Intrapreneurial
Assessment Instrument’, and Hill’s (2003) ‘Intrapreneurial Intensity Index’. Additional
clarification was attained from Antoncic & Hisrich (2001), Carrier (1996), Eesley &
Longenecker (2006), and Maes (2003). An initial research hypothesis was that;
organisations are not realising their full innovative and productive capacity due to poor
acknowledgement of their own staff’s intrapreneurial abilities. This research proved this
hypothesis true and will go on to provide a useful comparative tool in gauging
‘intrapreneurial intensity’ for further research.
iv
TABLE OF CONTENTS
Abstract ii
Illustrative Material vii
1. Introduction 2
2. Literature Review 4
2.1 Context 4
2.2 The concept of the organisation 4
2.2.1 The learning organisation 5
2.3 Entrepreneurship 7
2.3.1 History of entrepreneurship 7
2.3.2 Defining entrepreneurship 9
2.4 Intrapreneurship 9
2.4.1 Defining intrapreneurship 11
2.4.2 Research on intrapreneurship 13
2.5 Innovation, Creativity, & Productivity 18
2.5.1 Innovation 18
2.5.2 Creativity 20
2.5.3 Productivity 21
2.6 The New Zealand Business Environment 23
3. Methodology 26
3.1 Rationale 26
3.2 Research objective 26
3.3 Conceptualisation 27
3.3.1 Research propositions 28
3.4 Construction 29
3.4.1 Questionnaire format 29
3.4.2 Sampling 29
3.4.3 Presentation 30
3.4.4 Scale 32
v
3.4.5 Questionnaire format 33
3.4.6 Compiling of items 34
3.4.7 Validity and reliability 35
3.5 Implementation 36
3.5.1 The Pilot Questionnaire 36
3.5.2 Administering the pilot questionnaire 36
3.5.3 Methodological concerns 36
3.5.3.1 Method/Design Strengths 36
3.5.3.2 Method/Design Weaknesses 37
3.5.4 Review of pilot questionnaire 37
3.5.5 Reformatting the final questionnaire 38
3.5.6 Administering final questionnaire 38
3.5.7 Data capture 39
4. Results 41
4.1 Introduction 41
4.2 Response rate 41
4.3 Results charts 41
5. Discussion 44
5.1 Intrapreneurial factor critique 44
5.1.1 Intrapreneurial factor weakness 44
5.1.2 Intrapreneurial factor strengths 46
5.1.3 A lack of foresight outweighed by motivation 47
5.2 Unrealised productive capacity 47
5.3 Unrealised innovative capacity 48
5.4 Industry comparison 49
5.5 Correlation between intrapreneurship, productivity
and innovativeness 51
6. Conclusion 53
7. Reference list 56
8. Appendices 60
Appendix A: The Questionnaire 60
vi
Appendix B: Letter to Organisations requesting permission
to conduct a survey. 66
Appendix C: 87 Intrepreneurial factors considered for testing 67
Appendix D: 38 Intrapreneurial factors considered for testing 70
Appendix E: Graphical illustration of each organisations
intrapreneurial factor measurement 71
vii
Illustrative Material
Tables
Chapter 2:
Table 2.1. Definitions of intrapreneurship 11
Table 2.2. Top 10 barriers to intrapreneurship 17
Table 2.3. Top 10 gateways to intrapreneurship 17
Table 2.4. Comparable GDP per capita figures 23
Chapter 3:
Table 3.1 Intrapreneurial variables to be surveyed. 34
Table 3.2. Sample organisations 39
Chapter 4:
Table 4.1. Summary of the 14 participating organisations 41
Table 4.2. Mean intrapreneurial factor results 42
Table 4.3. Mean innovative capacity results 43
Table 4.4. Mean productive capacity results 43
Figures
Chapter 2:
Figure 2.1. Organisational control evolution 6
Figure 2.2. Stages of the entrepreneurial process
Figure 2.3. Total early-stage activity (TEA) country comparison
Chapter 3:
Figure 3.1 Declaration to participate 31
Figure 3.2 Multi-choice options for role classification 32
Figure 3.3. Scale reference template 38
Figure 3.4. Website Screenshot 38
viii
Chapter 5:
Figure 5.1. Results mean of intrapreneurial factors within surveyed
sample 46
Figure 5.2. Results mean of innovative and productive capacity of
surveyed sample 49
Figure 5.3. Organisational comparison of innovative & productivity
Capacity measurement 49
Figure 5.4. Organisational contrast 52
2
CHAPTER 1. INTRODUCTION
In 1985 Gifford Pinchot coined the term ‘intrapreneurship’. Intrapreneurship is short for
intra-corporate entrepreneurship (Pinchot, 1985). Pinchot (1985) regards ‘intrapreneurs’
as individuals who take a hands-on approach in facilitating innovation within established
organisations. Academic recognition of the term intrapreneurship followed Pinchot’s
(1985) writings which set a platform for intrapreneurial theory to be further considered a
subset of entrepreneurship (Antoncic & Hisrich, 2001). Pinchot (1985) advocates that in
allowing entrepreneurial characteristics to be cultivated within the workplace, workplace
adaptability and innovativeness is facilitated. However as Carrier (1996) suggests, the
degree to which intrapreneurial theory is applied in the workplace is questionable. Such a
notion underlines the methodology of this research to gauge the application of
intrapreneurial theory within the workplace in a New Zealand context. This project
additionally reports on questions relating to an innovative capacity and productive
capacity as perceived by personnel. This process allowed for a correlation between
intrapreneurship, innovativeness, and productivity to be examined. Carrier (1996)
referred to intrapreneurial research as receiving relatively low levels of scholarly
attention. The literature reviewed assumes that entrepreneurial activities within
organisations are possible and should be facilitated (Pinchot, 1985). The literature
reviewed additionally identified ‘organisational politics’ or a ‘corporate immune system’
as a primary stifling factor of intrapreneurial activity (Birkinshaw, 2000; Pinchot &
Pellman, 1999). My initial research proposition is; organisations are not realising their
full innovative and productive capacity due to poor acknowledgement of their own staff’s
intrapreneurial abilities. My second research proposition is; all individuals’ posses’
naturisms capable of generating innovative and productive ideas, however the capacity
3
to do so is stifled by a ‘corporate immune system’ and a limited acknowledgment of
intrapreneurial theory. My third research proposition is that; New Zealand companies are
not fulfilling their innovative potential due to a sluggish adjustment to a knowledge based
form of management.
This research report sought to critique the application of intrapreneurial theory within
New Zealand organisations, while working to highlight factors that can maximise an
organisations capacity to be innovative and productive. This research aims to be
influential in characterising appropriate measures for intrapreneurial testing and for
determining procedural and cultural weaknesses within New Zealand organisations. It is
hoped that this research will help stimulate the acknowledgement of intrapreneurial
theory within participating organisations and help create a cause-and-effect rationale,
useful for critiquing intrapreneurial factors in different organisational environments and
international settings.
4
CHAPTER 2. THE LITERATURE REVIEW
2. 1 Context
This literature review will use the year 1945 as a starting point to consider the framework
of intrapreneurship and it’s relating topics. This rationale is associated with the rise of
Weber’s (1947) Organizational thory, neo-liberalism (Friedman, 1982), immigration
(Hunter & Morrow, 2006), business schools (Starkey & Tiratsoo, 2007), and
globalisation (Easton, 2007) that followed the Second World War and continues to
influence current day business operations. This literature review will critique the concept
of the organisation, entrepreneurship, intrapreneurship, innovation, creativity,
productivity, and the New Zealand business environment.
2.2 The concept of the Organisation
Pinchot (1985) referred to intrapreneurs as entrepreneurs operating within the realms of
established organisations. Scott (2003) defines an ‘organisation’ as “collectivities
orientated to the pursuit of relatively specific goals” (p. 26). Scott (2003) elaborated
suggesting that organisations are a social arrangement pursuing collective goals with a
controlling influence over its own performance. Developments in organisational theory
include Taylor’s (1911) ‘scientific management’ which involves analysing and
synthesising work processes, Weber’s (1947) ‘organisational theory’ which embodied
efficiency and control through bureaucratic processes, and Senge’s (1990) notion of a
‘learning organisation’ which suggests organisations have a capacity to learn through
cultivating collective ideas from personnel. Morgan (1998) refers to an organisation as
being one of three metaphors (a ‘machine’, an ‘organism’ and a ‘brain’). The perspective
5
that an organisation is a ‘machine’ is suggestive of predetermined actions (Morgan,
1998). This metaphor is based on Weber’s (1947) ‘organizational theory’ and Taylor’s
(1911) ‘scientific management’ approach. The second metaphor is suggestive of an
organisation being seen as an ‘organism’ by its ability to continually grow and adapt
within an indefinite life time (Morgan, 1998). The third perspective sees the organisation
as a brain that can learn and process information (Morgan, 1998). This research will
consider an organisation to be an ‘organism’ in which it has the ability to continually
grow and adapt while also being a ‘brain’ through which personnel continually learn and
process information.
2.2.1 The learning organisation
Pinchot (1985) suggested that intrapreneurs take a hands-on role for creating innovation
within organisations. However, the ability to create something innovative depends on
whether a organisations processes will allow it (De Geus, 1988). De Geus (1988)
suggests that businesses need to adapt to their environment through learning quicker
while acting more effectively than their competitors. Senge (1990) stated that learning
organisations are; “organizations where people continually expand their capacity to
create the results they truly desire” (p. 3). Kim (1998) backs up this premise by affirming
that organisations need to continually learn in order to sustain their existence. A growing
body of literature now surrounds the notion of a ‘learning organisation’ including the
topics of ‘change management’ (Hayes, 2002), ‘knowledge economy’ (Sarkar, 2007), and
‘team creativity’ (Adair, 2007). Encompassing such concepts is a movement suggestive
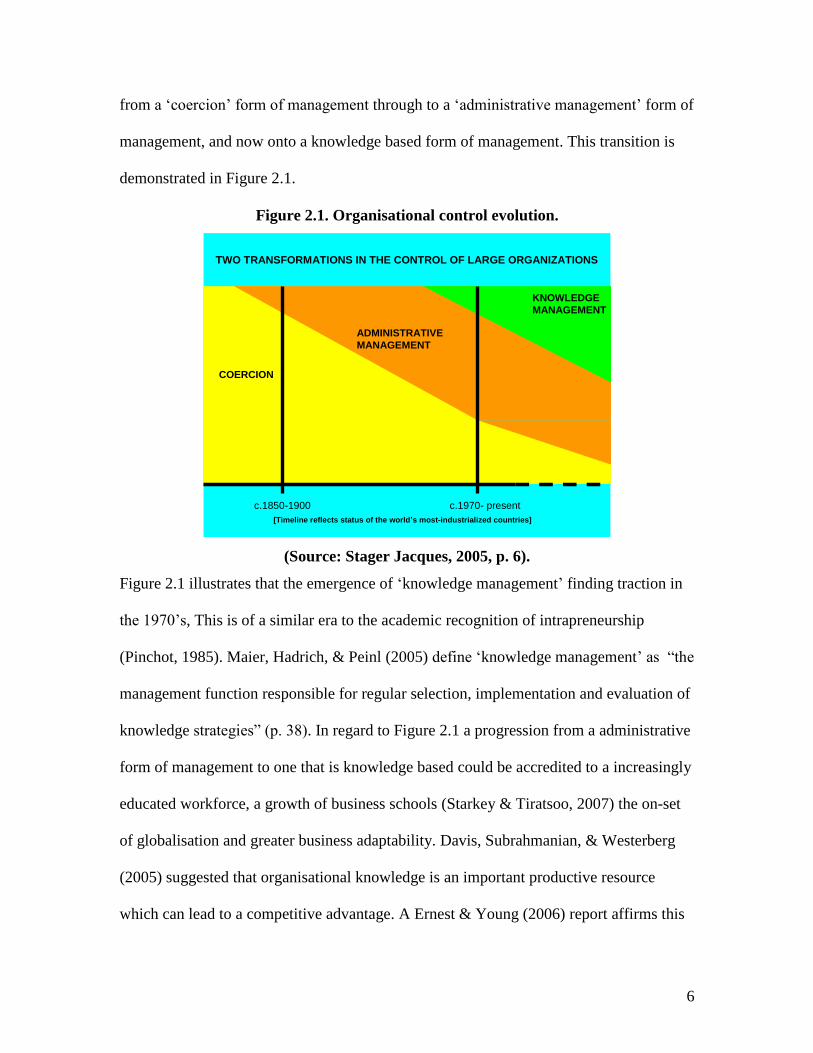
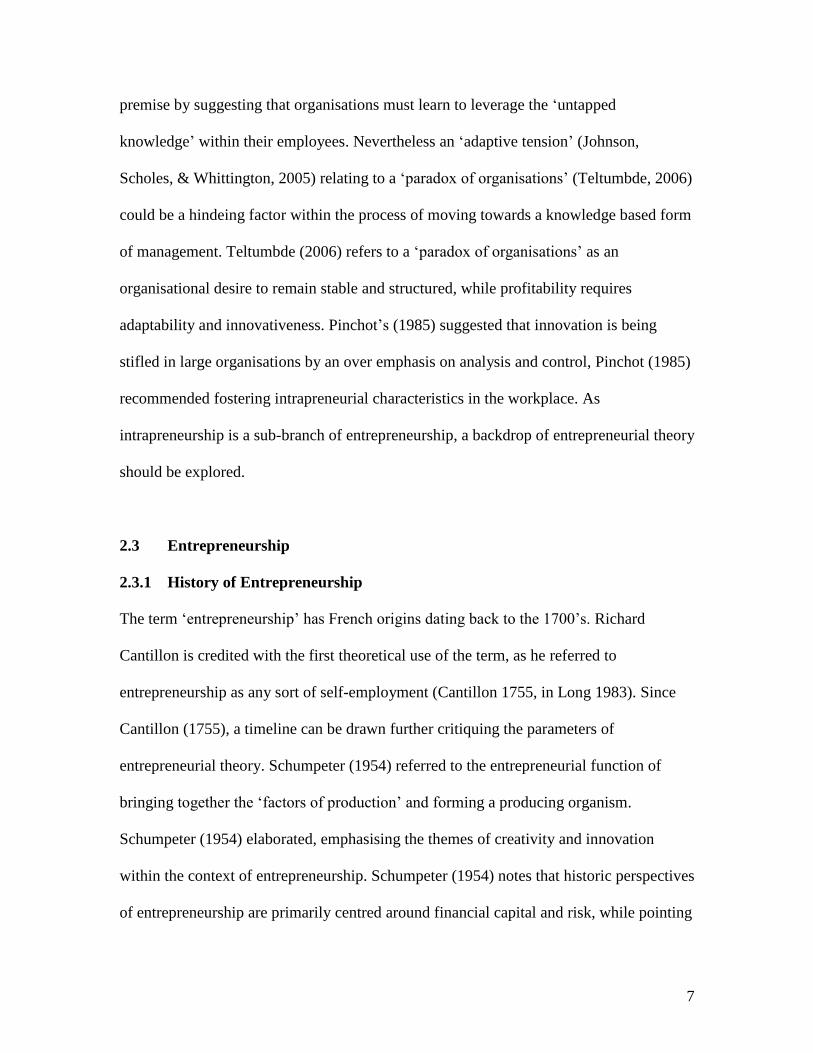
of an underlining transformation of how organisations operate. Stager Jacques (2005)
puts forward that a ‘transformation of control’ within large organisations has evolved
6
from a ‘coercion’ form of management through to a ‘administrative management’ form of
management, and now onto a knowledge based form of management. This transition is
demonstrated in Figure 2.1.
Figure 2.1. Organisational control evolution.
COERCION
c.1850-1900 c.1970- present
ADMINISTRATIVE
MANAGEMENT
KNOWLEDGE
MANAGEMENT
TWO TRANSFORMATIONS IN THE CONTROL OF LARGE ORGANIZATIONS
[Timeline reflects status of the world’s most-industrialized countries]
(Source: Stager Jacques, 2005, p. 6).
Figure 2.1 illustrates that the emergence of ‘knowledge management’ finding traction in
the 1970’s, This is of a similar era to the academic recognition of intrapreneurship
(Pinchot, 1985). Maier, Hadrich, & Peinl (2005) define ‘knowledge management’ as “the
management function responsible for regular selection, implementation and evaluation of
knowledge strategies” (p. 38). In regard to Figure 2.1 a progression from a administrative
form of management to one that is knowledge based could be accredited to a increasingly
educated workforce, a growth of business schools (Starkey & Tiratsoo, 2007) the on-set
of globalisation and greater business adaptability. Davis, Subrahmanian, & Westerberg
(2005) suggested that organisational knowledge is an important productive resource
which can lead to a competitive advantage. A Ernest & Young (2006) report affirms this
7
premise by suggesting that organisations must learn to leverage the ‘untapped
knowledge’ within their employees. Nevertheless an ‘adaptive tension’ (Johnson,
Scholes, & Whittington, 2005) relating to a ‘paradox of organisations’ (Teltumbde, 2006)
could be a hindeing factor within the process of moving towards a knowledge based form
of management. Teltumbde (2006) refers to a ‘paradox of organisations’ as an
organisational desire to remain stable and structured, while profitability requires
adaptability and innovativeness. Pinchot’s (1985) suggested that innovation is being
stifled in large organisations by an over emphasis on analysis and control, Pinchot (1985)
recommended fostering intrapreneurial characteristics in the workplace. As
intrapreneurship is a sub-branch of entrepreneurship, a backdrop of entrepreneurial theory
should be explored.
2.3 Entrepreneurship
2.3.1 History of Entrepreneurship
The term ‘entrepreneurship’ has French origins dating back to the 1700’s. Richard
Cantillon is credited with the first theoretical use of the term, as he referred to
entrepreneurship as any sort of self-employment (Cantillon 1755, in Long 1983). Since
Cantillon (1755), a timeline can be drawn further critiquing the parameters of
entrepreneurial theory. Schumpeter (1954) referred to the entrepreneurial function of
bringing together the ‘factors of production’ and forming a producing organism.
Schumpeter (1954) elaborated, emphasising the themes of creativity and innovation
within the context of entrepreneurship. Schumpeter (1954) notes that historic perspectives
of entrepreneurship are primarily centred around financial capital and risk, while pointing
8
out that in modern times entrepreneurship has taken on more of an innovative perspective
with an increased focus on creating new products, services, and processes in new or
different combinations. Further critique of the entrepreneurial construct followed
Schumpeter’s (1954) writings, including Knight’s (1967) reference to uncertainty and
risk as encompassing factors of entrepreneurship, Kirzner’s (1973) reference to an
entrepreneurs strength of identifying new opportunities in the marketplace, and
Leibenstein (1976) reference to entrepreneurs needing to have strong managerial
capabilities. Kanter (1989) built on these themes and was suggestive of a ‘post-
entrepreneurial’ revolution, which aligns with Pinchot’s (1985) description of
intrapreneurship. Kanter (1989) spoke about the concept of entrepreneurship being taken
a step further by applying the principles of entrepreneurship within traditional workplace.
Kanter (1989) makes reference to the importance of organisations encouraging
‘continuous improvement’ through a process of ‘incremental innovation’. Covin &
Slevin’s (1989) referred to ‘innovativeness’, ‘risk taking’, and ‘pro-activeness’ as the
primary dimensions of the entrepreneurial orientation. Lumpkin & Dess (1996) sought to
clarify the nature of ‘entrepreneurial orientation’ and illuminate the differences between
‘entrepreneurship’ and ‘entrepreneurial orientation’. Lumpkin & Dess (1996) referred to
‘entrepreneurship’ as a ‘new act’, or a: ‘new venture’, ‘new goods’, ‘new service’, or
‘new markets’. In contrast Lumpkin & Dess (1996) referred to an ‘entrepreneurial
orientation’ as the “processes, practices, and decision-making activities that lead to a new
entry” (p. 2). Morris (1998) suggested that historical definitions of entrepreneurship have
often been too narrowly focused.
9
2.3.2 Defining entrepreneurship
Morris (1998) defined entrepreneurship as “the process through which individuals and
teams create value by bringing together unique packages of resource inputs to exploit
opportunities in the environment” (p. 16). This differs to Cantillon’s (1755) interpretation
of intrapreneurship as ‘any sort of self employment’. A quandary regarding the
interpretation of entrepreneurship still however remains prevalent although a large
amount of entrepreneurial theory exists (Lumpkin & Dess, 1996). An example can be
seen within the ‘Global Entrepreneurship Monitor’ (GEM) (as cited by Frederick (2004))
which collects and correlates entrepreneurial activity data from around the world
(Frederick, 2004). When presenting the entrepreneurial activity data the ‘GEM’ places all
its emphasis on business start-ups and early activity statistics. However as Morris (1998)
suggests, a start-up that quickly becomes stagnant in its operations is only entrepreneurial
in the fact that it opened for business and is not representative of a growth-oriented,
proactive, or innovative approach that an entrepreneurial orientation by essence is about
(Lumpkin & Dess, 1996). This is evident of a mismatch between how entrepreneurial
theorists define entrepreneurship and how the theory is applied. This literature review
will now explore the intricacies of intrapreneurship in more detail.
2.4 Intrapreneurship
Corporations must innovate to survive; the best method is to encourage creative people
to become entrepreneurs within the company structure (“intrapreneurs”) by allowing
them to earn the freedom and resources (‘intracapital”) with which to pursue their
visions (establish “intraprises”) (Pinchot, 1985, p. 1).
10
Gifford Pinchot spurred on academic recognition of the term ‘intrapreneurship’ in 1985
with a book named ‘Intrapreneuring: why you don't have to leave the corporation to
become an entrepreneur’. Intrapreneurship encompasses the concept of ‘internal
corporate entrepreneurship’ (Schollhammer, 1982) and ‘corporate entrepreneurship’
(Vesper, 1984). Pinchot (1985) suggested that intrapreneurs are “those who take hands-on
responsibility for creating innovation of any kind within an organization” (p. ix). Pinchot
(1985) goes on to explain that an article by Norman Macrae (1976) titled ‘The coming
entrepreneurial revolution: a survey’, printed in the London Economist was the basis for
his ideas relating to the potential of entrepreneurs within large organisations and spurred
a challenge for him to turn the idealism into a reality. Since Pinchot (1985), scholars and
practitioners have taken a growing interest in the usefulness of entrepreneurial activities
within an organisational context (Antoncic & Hisrich, 2001). A line can also be drawn
between Pinchot’s (1985) explanation of intrapreneurship and earlier institutional theorist
such as Zucker (1983), Meyer & Scott (1983), and Kanter (1984). The definition of
intrapreneurship is now often seen in various lights because of the assorted nature of an
organisation.
11
2.4.1 Defining intrapreneurship
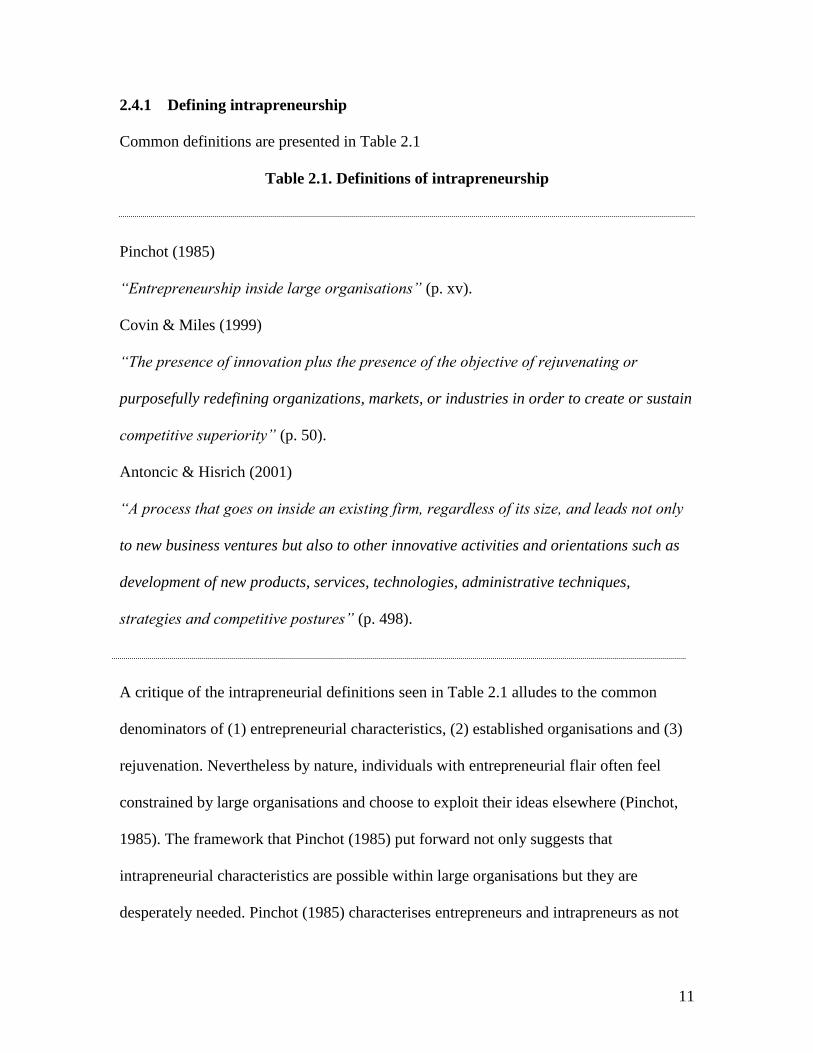
Common definitions are presented in Table 2.1
Table 2.1. Definitions of intrapreneurship
Pinchot (1985)
“Entrepreneurship inside large organisations” (p. xv).
Covin & Miles (1999)
“The presence of innovation plus the presence of the objective of rejuvenating or
purposefully redefining organizations, markets, or industries in order to create or sustain
competitive superiority” (p. 50).
Antoncic & Hisrich (2001)
“A process that goes on inside an existing firm, regardless of its size, and leads not only
to new business ventures but also to other innovative activities and orientations such as
development of new products, services, technologies, administrative techniques,
strategies and competitive postures” (p. 498).
A critique of the intrapreneurial definitions seen in Table 2.1 alludes to the common
denominators of (1) entrepreneurial characteristics, (2) established organisations and (3)
rejuvenation. Nevertheless by nature, individuals with entrepreneurial flair often feel
constrained by large organisations and choose to exploit their ideas elsewhere (Pinchot,
1985). The framework that Pinchot (1985) put forward not only suggests that
intrapreneurial characteristics are possible within large organisations but they are
desperately needed. Pinchot (1985) characterises entrepreneurs and intrapreneurs as not
12
being motivated by monetary rewards, but rather driven by a personal desire to achieve.
Eleven years later, Carrier (1996) agrees suggesting that many successful entrepreneurs
were once discontented intrapreneurs. Intrapreneurship differentiates itself from
entrepreneurship by the context to which an act takes place (Carrier, 1996). Carrier
(1996) refers to entrepreneurs as individuals who innovate for themselves, whereas
intrapreneurs take action on behalf of an organisation. Claver, Llopis, Garcia, & Molina
(1998) unite in making reference to a managerial intension of cultivating intrapreneurial
activity, but the reality of what commonly eventuates are worlds apart. Teltumbde (2006)
suggests that organisational politics or a ‘corporate immune system’ will often respond
with scepticism to a new idea. This premise reinforces Pinchot’s (1985) earlier notion
that innovation within large organisations is ‘stagnating’ because of an over entrenchment
of analysis and control. Pinchot (1985) has used the term stagnating in the context of
being ‘dormant’ or ‘sluggish’. Seshadri & Tripathy (2006) advocates that intrapreneurs
are “urgently required by corporations” (p. 17). Pinchot (1985) explains that intrapreneurs
can help stimulate an entrepreneurial spirit useful in cultivating adaptive change and
innovative ideas. Pinchot (1985) suggests that corporations must learn to ‘manage’
intrapreneurs and therefore retain innovative people, otherwise potential intrapreneurs
risk getting frustrated and moving on. Carrier (1996) notes that the majority of
intrapreneurial research has been conducted within the realms of large organisations.
However Zahra & Pearce (1994) advocates that intrapreneurial activities are just as
important within smaller organisations.
13
2.4.2 Research on intrapreneurship
Intrapreneurship is a relatively young concept, however because intrapreneurship is a
sub-branch of entrepreneurship a substantial backdrop for scholarly reference exists
(Antoncic & Hisrich, 2003). Academic recognition of the term intrapreneurship has
evolved since Pinchot’s 1985 publication of ‘Intrapreneuring’. Further studies (Covin &
Slevin, 1989; Kuratko et al., 1990; Zahra, 1991; Knight, 1997; Antoncic & Hisrich, 2001;
Hill, 2003) have paid particular reference to developing intrapreneurial assessment
instruments while others have sought to better understand the construct of
intrapreneurship (Lumpkin & Dess, 1996; Meng & Roberts, 1996 ; Eesley &
Longenecker, 2006).
Khandwalla (1977) developed an early measuring tool named the ‘ENTRESCALE’
which was designed to measure a firm’s orientation towards entrepreneurship. The
‘ENTRESCALE’ tested eight items relating to innovativeness’ and ‘proactiveness’ using
a 9 point item scale. The ‘ENTRESCALE’ was found to have strong validity and
reliability (Knight, 1997). The primary themes found within the ‘ENTRESCALE’ were
innovativeness and proactiveness which aligned with Pinchot’s (1985) notion that
intrapreneurship involves ‘creating’ innovation within a ‘hands on’ proactive manner.
Pinchot (1985) compiled a self-test of 12 questions that was used to measure
intrepreneurial tendencies of an organisation. The self test was derived from 10 factors in
which Pinchot had considered ideal for an intrapreneurial environment to foster. The
factors were; (1) ‘self selection’, (2) ‘no handoffs’, (3) ‘the doer decides’, (4) ‘corporate
slack’, (5) ‘ending the home-run philosophy’, (6) ‘tolerance of risk, failure, and
mistakes’, (7) ‘patient money’, (8) ‘freedom from turfiness’, (9) ‘cross-functional teams’,
14
and (10) ‘multiple options’. These ten factors laid a platform for other intrapreneurial
researchers to build from. Covin & Slevin (1989) went on to consider the effectiveness of
different strategic responses to environmental hostility within small manufacturing
companies. Covin & Slevin’s (1989) findings indicated that the performance of small
firms operating in a hostile environment are positively related to its ‘entrepreneurial
posture’, ‘organic structure’, and ‘long-term orientation’.
Kuratko, Montagno & Hornsby (1990) built upon the ‘ENTRESCALE’ model by
developing a ‘intrapreneurial assessment instrument’ to measure the degree of change
within a corporations cultural perspective before and after an intrapreneurial training
program. Kuratko et al. (1990) identified (1) ‘management support’, (2) ‘organisational
structure’, and (3) ‘resource availability’ as crucial factors in facilitating intrapreneurial
activity.
Zahra (1991) developed the ‘Corporate entrepreneurship scale’ which was later refined in
Zahra (1993). The ‘Corporate entrepreneurship scale’ measured an organisations
commitment towards venturing, self-renewal activities and innovation. Zahra’s (1991)
findings indicated that; (1) ‘environmental dynamism’, ‘heterogeneity’, and ‘hostility’ all
intensify corporate entrepreneurship, (2) growth oriented strategies can positively relate
to increased corporate entrepreneurship, (3) a strategy of stability is not conducive with
corporate entrepreneurship, (4) predefined organisational values relate positively with
corporate entrepreneurship, and (5) extensive controls can have a stifling effect on
corporate entrepreneurship. Zahra’s (1993) ‘Corporate entrepreneurial scale’ focused on
the themes of ‘new business venturing’, ‘self renewal’, and ‘innovativeness’. The
intrapreneurial theme of innovativeness is present in Khandwalla (1977) and Pinchot’s
15
(1985) models, however Zahra (1993) goes further to emphasis the themes of ‘self
renewal’ and ‘business venturing’.
Md-Nor’s (1992) research compared American and Malaysian intrapreneurs in an attempt
to distinguish if cultural differences existed within intrapreneurial style, personality or
climate. Md-Nor’s (1992) concluded that there were no significant intrapreneurial style
differences between American and Malaysian intrapreneurs.
Carrier (1994) conducted a intrapreneurial comparative study between ‘small to medium
enterprises’ (SME) and large firms. Carrier (1994) suggested that large firms find it more
challenging to detect potential intrapreneurs than SME’s and that intrapreneurs in large
organisations are potentially more disruptive but have the benefit of greater anonymity.
Carrier’s (1994) ‘disruptive’ description alludes to the effect that intrapreneurs may have
in challenging the ‘status quo’, linking back to the ‘paradox of organisations’ dilemma
(Teltumbde, 2006). Carrier (1994) referred to the importance of financial and symbolic
rewards to facilitate successful intrapreneurial activities within both small to medium
sized enterprises (SME’s) and large organisations. Carrier (1994) pointed out that SME’s
are often more reactive to intrapreneurial actions than large organisations as SME often
have a greater willingness to adapt. Carrier (1994) goes on to note that losing frustrated
intrapreneurs within SME’s is often more severe than that seen by larger organisations,
particularly if an intrapreneur moves into competition.
Research conducted by Lumpkin & Dess (1996) sought to clarify the construct of an
‘entrepreneurial orientation’ and put forward a framework for investigating the
association between ‘entrepreneurial orientation’ and a firms operating performance.
Lumpkin & Dess (1996) concluded that the entrepreneurial orientation construct is
16
representative of the entrepreneurial process while engaging in a combination of (1)
autonomy, (2) innovativeness, (3) risk taking, (4) proactiveness, and (5) competitive
aggressiveness. Notably, Lumpkin & Dess (1996) highlighted the themes of
innovativeness and proactiveness in which Khandwalla (1977) and Pinchot (1985) had
earlier identified.
Knight (1997) sought to assess the ‘cross-cultural’ reliability and validity of the
‘ENTRESCALE’ that was originally developed by Khandwalla (1977). Knight (1997)
sampled English-specking and French-speaking managers to clarify if a measuring
instrument developed in America would be troublesome within another culture. Knight
(1997) concluded that this was not the case, suggesting that the ‘ENTRESCALE’ was a
suitable tool for using abroad. However such a decisive conclusion has limited validity
with only one nationality being tested.
Antoncic & Hisrich (2001) also built upon the ‘ENTRESCALE’ (Khandwalla, 1977),
however integrated it with the ‘corporate entrepreneurship scale’ (Zahra, 1993). Antoncic
& Hisrich (2001) believed an integrated intrapreneurial scale would more widely consider
the dimensions of ‘new-business venturing’, ‘innovativeness’, self-renewal’, and
‘proactiveness’. As in the case of Knight’s (1997) researh, Antoncic & Hisrich (2001)
tested for an American bias, but instead developed an integrated scale to test a sample
from America and Slovenia. Antoncic & Hisrich (2001) also concluded that an American
bias was not distinctive and that the integrated intrapreneurial instrument showed suitable
validity across both samples. Hill (2003) set out to develop an ‘intrapreneurial intensity
instrument’ by building on Tushman & Nadler’s (1997) ‘Congruence model for
organisational analysis’ as a theoretical framework. Hill (2003) asserted that the resulting
17
instrument suitably provided an overview of an organisation’s intrapreneurial ability and
could identify areas requiring organisational change.
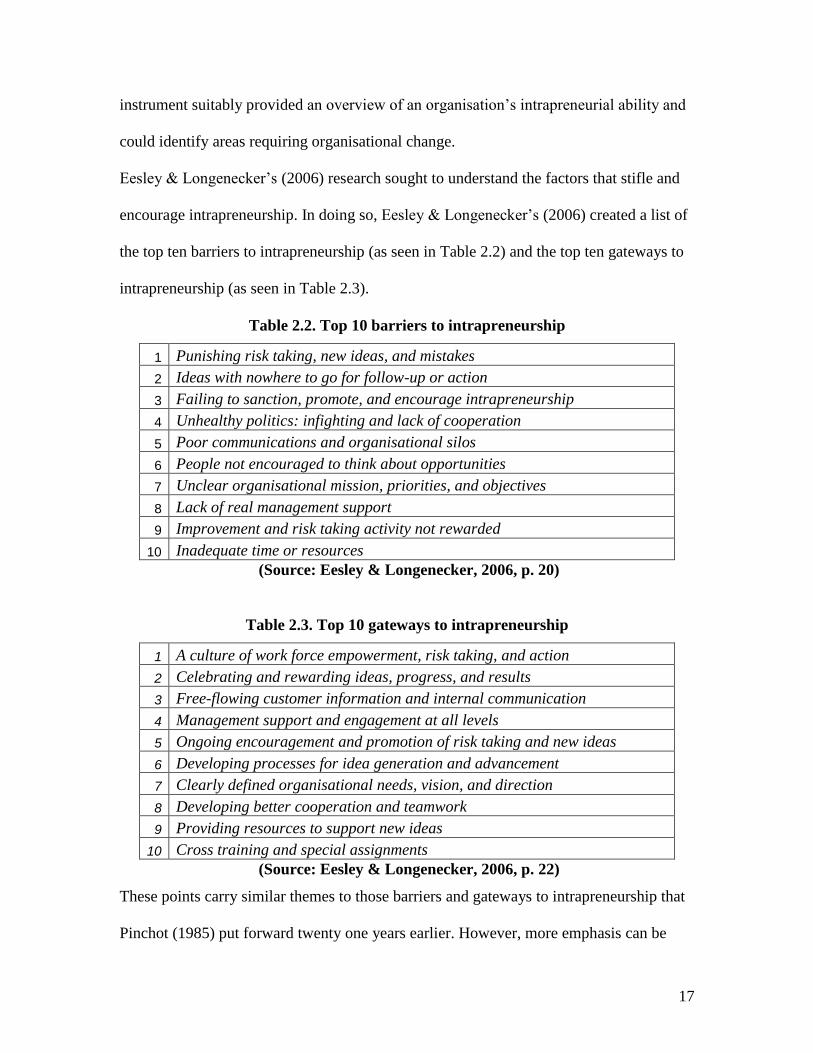
Eesley & Longenecker’s (2006) research sought to understand the factors that stifle and
encourage intrapreneurship. In doing so, Eesley & Longenecker’s (2006) created a list of
the top ten barriers to intrapreneurship (as seen in Table 2.2) and the top ten gateways to
intrapreneurship (as seen in Table 2.3).
Table 2.2. Top 10 barriers to intrapreneurship
1 Punishing risk taking, new ideas, and mistakes
2 Ideas with nowhere to go for follow-up or action
3 Failing to sanction, promote, and encourage intrapreneurship
4 Unhealthy politics: infighting and lack of cooperation
5 Poor communications and organisational silos
6 People not encouraged to think about opportunities
7 Unclear organisational mission, priorities, and objectives
8 Lack of real management support
9 Improvement and risk taking activity not rewarded
10 Inadequate time or resources
(Source: Eesley & Longenecker, 2006, p. 20)
Table 2.3. Top 10 gateways to intrapreneurship
1 A culture of work force empowerment, risk taking, and action
2 Celebrating and rewarding ideas, progress, and results
3 Free-flowing customer information and internal communication
4 Management support and engagement at all levels
5 Ongoing encouragement and promotion of risk taking and new ideas
6 Developing processes for idea generation and advancement
7 Clearly defined organisational needs, vision, and direction
8 Developing better cooperation and teamwork
9 Providing resources to support new ideas
10 Cross training and special assignments
(Source: Eesley & Longenecker, 2006, p. 22)
These points carry similar themes to those barriers and gateways to intrapreneurship that
Pinchot (1985) put forward twenty one years earlier. However, more emphasis can be
18
seen in Eesley & Longenecker’s (2006) writings in regard to the importance of clearly
defining an organisations vision and direction. Eesley & Longnecker (2006) also built on
entrepreneurial themes identified by Lumpkin & Dess (1996) such as autonomy, risk
taking, and competitive aggressiveness. Eesley & Longenecker (2006) note that the
primary barriers to intrapreneurship are not based on financial or time constraints, but
rather through a lack of systematic methods to empower and encourage innovative action
on the part of personnel.
De Clercq, Castaner, & Belausteguigoitia’s (2007) research considered the theoretical
framework of intrapreneurship and concluded that entrepreneurial ideas in the workplace
are more intense when (1) an idea is believed to be strategically important (2) individuals
are content with strategic direction, (3) resources and human capital are perceived to be
available, and (4) management suitably communicates organisational goals.
De Clercq et al. (2007) goes on to reinforce the importance of selling an idea to
management and the significance of having the appropriate political backing to enable an
idea to be suitably heard.
Now a platform for intrapreneurial theory has been put forward, a more detailed review
of the associating concepts - innovation, creativity, and productivity is needed.
2.5 Innovation, Creativity, & Productivity
“The ability of firms to innovate can often be attributed to organisational and
management problems” (Harvey, 2003, p. 20).
2.5.1 Innovation
19
The term innovation is Latin, meaning to ‘make new’ or to alter (Oxford, 2004).
According to Schumpeter (1954) innovation is either ‘incremental’ or ‘radial’.
Incremental innovation refers to gradual improvements and radical innovation refers to
sudden change. Lumpkin & Dess (1996) stated that “innovativeness reflects a firm’s
tendency to engage in and support new ideas” (p. 6). Morris (1998) elaborated further,
stating “innovation implies something new, something unknown, something that has not
happened yet” (p. 25). Fagerberg (2003) summarised innovation as the first
commercialization of an idea” (p. 3). Sundbo & Gallouj (1998) built on Schumpeter’s
(1954) reference noting that innovation is rarely radical and is often about small
adjustments to procedures. Claver, Llopis, Garcia, & Molina (1998) suggested that
without clear values and a shared orientation towards innovation, results are unlikely to
materialise within an organisational environment. Harvey (2003) suggests that the
amount innovation materialises or not can be made relative to an ‘innovative capacity’.
Harvey (2003) noted that innovation requires a different form of management, and that
suitably organising ‘existing ideas’, ‘capabilities’, ‘skills’ and ‘resources’ is where the
challenge lies. The concept of an ‘innovative capacity’ is built on by Claver et al. (1998).
Claver et al. (1998) notes that an innovative capacity relates to an organisations ability to
blend and control creativity, manage diversity and effectively deploy resources.
Fagerberg (2003) points out that an organisation which is open to new ideas and allows
groups to experiment with new solutions can mobilise a knowledge base more effectively
and be more adapt to fostering innovation. This aligns with Pinchot (1985) suggestion
that intrapreneurial characteristics can induce a greater freedom for personnel to express
and follow up new ideas.
20
2.5.1.1 Cultivating innovation
In cultivating intrapreneurship and innovative practices, Kuratko, Montagno, & Hornsby
(1990) refer to an idea used by 3M employees that allows personnel to use a percentage
of their work time to consider and develop new concepts, products or procedures. Adair
(2007) suggests that a flexible organisational framework, inter-department cooperation,
clear lines of communication and suitable reward practices are good starting points to
foster innovation. Conversely, factors that can hinder innovation are notably an
overemphasis on rules, formalities, hierarchy and specialisation (Adair, 2007). New
Zealand based research conducted by Gilberston, Gilberston, & Andrews (1995) put
forward the following nine key barriers to innovation; (1) low incentives for idea
champions, (2) over control of creative people, (3) management which are short-term
orientated, (4) accountants and lawyers with too much influence in management, (5) high
personal risk if the innovation fails, (6) limited incentives for organisational
entrepreneurs, (7) institutionalising attitude change, (8) decision-making is too
centralised, (9) a reluctance to invest is in ‘problem-orientated training’. These barriers
encompass similarities to the barriers of intrapreneurship (Pinchot, 1985) such as
management short sightedness and a stifling of creativity.
2.5.2 Creativity
Jevons (1877) refers to creativity as a divergence from common lines of thought.
However in business a divergence from common paradigms can be part of creating new
and innovative ideas which can propel growth and generate competitive advantages
21
(Harvey, 2003). An association between intrapreneurship and creativity can also be seen
in Pinchot’s (1985) writings where he wrote “intrapreneurs are dreamers” (p. 21) who
form an idea and transform it into a reality. Unfortunately as Amabile (1998) suggests,
business creativity gets stifled more often than it gets supported. Amabile (1998) believes
that this is not because managers are against creativity, but rather due to a business
yearning for control and coordination. Amabile (1998) points out a common
misconception in business is that creativity is often seen as the sole property of the
marketing or R&D department, rather than a generic function that can provide benefits to
all facets of an organisation. Jevons (1877) referred to creativity being a ‘divergence from
common lines of thought’, this premise aligns with Amabile’s (1998) notion that
creativity can be applied in all facets of an organisation where decisions are made. Bilton
(2007) notes that creative ideas need to be aligned with organisational resources in order
to materialise, otherwise non-conformist ideas will be stifled. Amabile (1998) points out
that the risk of stifling creativity is not just in losing new ideas, but also in losing the
commitment and enthusiasm of employees which is fundamental to intrapreneurship and
also productivity.
2.5.3 Productivity
Longenecker & Fink (2006) refer to a crucial business challenge of the 21st century as
being able to remain productive and innovative. Productivity is seen as being relative to
‘output per unit of labour’ (Farrell, 2006). To be productive, workers must function at
their ‘optimum’ ability at all times (Sumanth, 1998). Parker’s (2008) cites Paul Krugman,
the 2008 winner of the Nobel Prize for economics as stating, “productivity isn’t
22
everything, but in the long run it’s nearly everything” (p. 2). Sumanth (1998) referred to
motivation, focus, ease of doing a job, communication, lack of distractions, ability to
manage time, bureaucracy, and political factors as themes that can affect a capacity to be
productive. Sumanth (1998, p. 47) refers to a Theodore Barry and Associates study
whereby a typical 8 hour day was broken down and derived the following statistics:
o 4.4 hrs (55%) productive time
o 1.2 hrs (15%) unavoidable delays
o 2.4 hrs (30%) wasted time
Such an illustration of wasted time is a far cry from functioning at an ‘optimum’ ability.
Sumanth (1998) points out that; (1) poor planning or scheduling of work, (2) unclear and
untimely instructions to employees, (3) an inability to adjust staff size and duties, (4)
peak and valley workload periods, (5) required tools not being available, (6) excess travel
time, and (7) lax supervision of workers starting and finish times as being detrimental to
productivity. If in the case innovative processes brought about by intrapreneurial actions
diluted this 30% wasted time, a correlation between intrapreneurship and productivity
could be drawn. A New Zealand Department of Labour report (D.O.L, 2008) identified
the following seven practices as having a positive effect on workplace productivity; (1)
worker training, (2) workplace culture, (3) encouragement of workers to think
innovatively, (4) development and training of managers (5) team building activities, and
(6) encouragement of workers to use new technology. Many of these factors interlink
with the factors of intrapreneurship and a capacity to be productive. To further
understand the New Zealand context further examination of the New Zealand business
environment is needed.
23
2.6 The New Zealand Business Environment
“Managing and organising work in ways that reflect its social character is of
fundamental importance to New Zealand’s innovative success.” (Harvey, 2003, p. 5).
The New Zealand economic environment has a history of being innovative and
independent while generating a relatively high standard of living (Hunter & Morrow,
2006). This is despite New Zealand’s geographic isolation from its primary trading
partners. Since the end of the Second World War, New Zealand has evolved from being a
heavily regulated and insulated economy to one that adopted open-market policies rapidly
in the 1980’s. However throughout this transition New Zealand’s ‘Gross domestic
product’ (GDP) figures have failed to keep pace with other developed countries (Hunter
& Morrow, 2006).
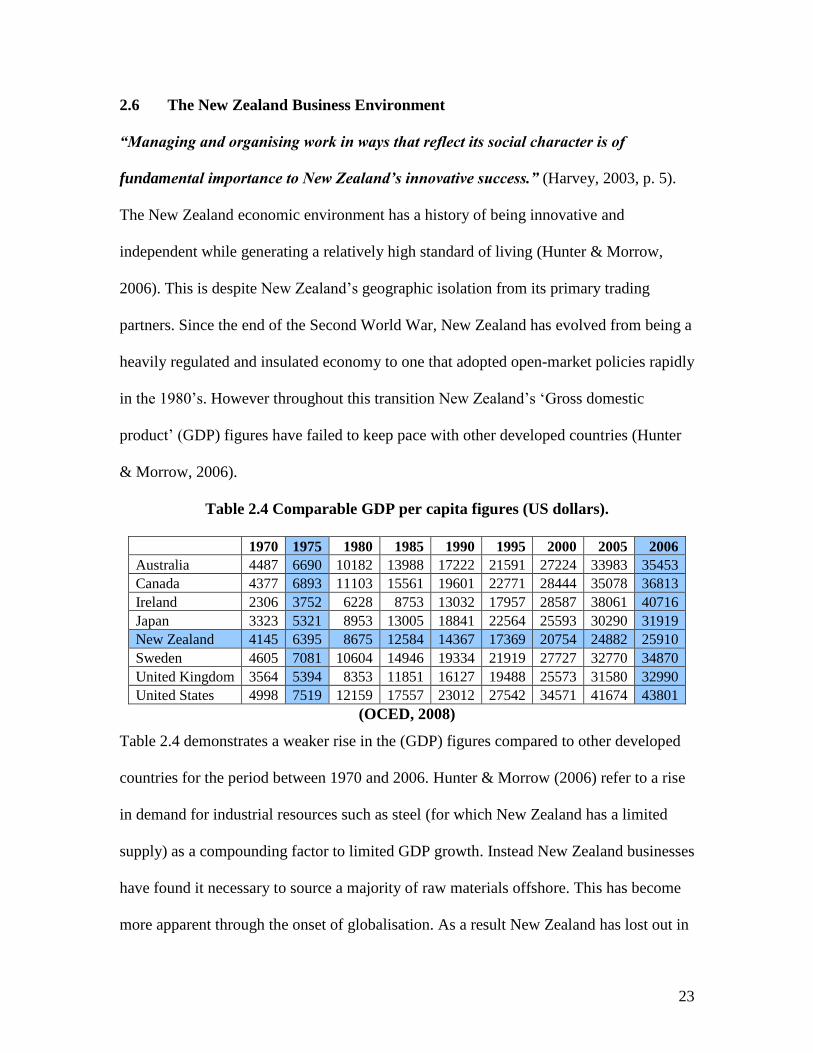
Table 2.4 Comparable GDP per capita figures (US dollars).
1970 1975 1980 1985 1990 1995 2000 2005 2006
Australia 4487 6690 10182 13988 17222 21591 27224 33983 35453
Canada 4377 6893 11103 15561 19601 22771 28444 35078 36813
Ireland 2306 3752 6228 8753 13032 17957 28587 38061 40716
Japan 3323 5321 8953 13005 18841 22564 25593 30290 31919
New Zealand 4145 6395 8675 12584 14367 17369 20754 24882 25910
Sweden 4605 7081 10604 14946 19334 21919 27727 32770 34870
United Kingdom 3564 5394 8353 11851 16127 19488 25573 31580 32990
United States 4998 7519 12159 17557 23012 27542 34571 41674 43801
(OCED, 2008)
Table 2.4 demonstrates a weaker rise in the (GDP) figures compared to other developed
countries for the period between 1970 and 2006. Hunter & Morrow (2006) refer to a rise
in demand for industrial resources such as steel (for which New Zealand has a limited
supply) as a compounding factor to limited GDP growth. Instead New Zealand businesses
have found it necessary to source a majority of raw materials offshore. This has become
more apparent through the onset of globalisation. As a result New Zealand has lost out in
24
terms of many ‘value added’ industries. In contrast, New Zealand’s largest trading
partner Australia, has a wealth of minerals as well as a larger population to a greater
economies of scale (Hunter & Morrow, 2006).
2.6.1 New Zealand as a knowledge economy
Prior to 1975 New Zealand was a big exporter of agricultural products particularly to the
United Kingdom. However with the effect of the United Kingdom becoming more
immersed within the European Economic Community (Hunter & Morrow, 2006) and the
culminating factors of market de-regulation, many New Zealand industries have struggled
to be internationally competitive. To rectify this competitive issue, talk of a ‘knowledge
economy’ has become more prevalent within New Zealand politics (Clark, 2007; Key,
2008). Under a backdrop of a knowledge economy, both Clark (2007) and Key (2008)
considered that New Zealand could create value added processes and services irrespective
of New Zealand’s geographic location or a lack of raw materials.
2.6.2 New Zealand’s ability to be innovative
In 2008, New Zealand business’s operated under a backdrop of a comparatively low
population base (4,2 million (stats.govt.nz, 2008)), high levels of self-employment
(Frederick, 2004), and with a skilled yet culturally diverse workforce (Hunter & Morrow,
2006). Although a knowledge based economy is yet to fully materialise, New Zealand
can be seen as a country with entrepreneurial flair (Frederick, 2004). This alludes to New
Zealanders having the ability to build their own business, or be successful intrapreneurs.
Frederick (2004) refers to figures presented in the ‘Global Entrepreneurship Monitor’
25
(GEM) which illustrates this. Frederick (2004) refers to New Zealand’s ranking of being
the 5th highest entrepreneurial country in regard to ‘total early stage activity’. Further note
worthy statistics show that a significantly high proportion of female entrepreneurs and a
high propensity of Maori entrepreneurs (Frederick, 2004) .
Throughout this literature review a context for a knowledge economy has been set, the
benefits of intrapreneurship acknowledged and the rationale why a knowledge based form
of management may be stifled.
The next section of this report will describe the methodology used to test the application
of intrapreneurial theory within the New Zealand workplace.
26
CHAPTER 3. METHODOLOGY
This chapter discusses the rationale, conceptualisation and administration of a measuring
instrument developed to gauge the intrapreneurial activity of New Zealand organisations.
A quantitative methodology was used within a questionnaire format. An electronic and
printed version of the questionnaire was developed and tested within a pilot study and
later refined for the implantation of the final questionnaire.
3.1 Rationale
From the outset, the researcher sought to develop a user-friendly measuring device that
could graphically depict the extent to which New Zealand organisations acknowledge and
apply intrapreneurial theory within their workplace. The researcher further sought to
measure the perceived innovative and productive capabilities of the sample organisations
from the perspective of personnel. In doing so a correlation between the application of
intrapreneurial factors, innovativeness, and productivity could be tested. Furthermore it
would demonstrate the level of continuity between what personnel believe and what
organisations are doing. Within the literature review, Carrier’s (1996) suggestion that
acknowledgment and application of intrapreneurial theory are ‘worlds apart’ was
discussed. This research would develop a methodology to test this notion with in a New
Zealand context.
3.2 Research Objective
The objective of this research is to gauge the acknowledgment and application of
intrapreneurial theory within New Zealand organisations and to test for a correlation
27
between intrapreneurship, innovation, and productivity from the perspective of personnel.
Furthermore this study will endeavour to provide a testing format that can graphically
illustrate an organisations intrapreneurial abilities, so it can later be conducive to practical
interpretation.
3.3 Conceptualisation
The research objective sought to quantify the extent to which intrapreneurial factors were
being acknowledged and applied within New Zealand organisations. The research
objective additionally called for a relationship between intrapreneurial factors,
productivity and innovativeness to be examined. Measuring the differing factors of
intrapreneurship, productivity, and innovativeness in their own right is not new, however
measuring the three together within a integrated format is new. In conceptualising the
design of a suitable measuring instrument, the research by Khandwalla (1977), Pinchot
(1985), and Antoncic & Hisrich (2001) were identified as being suitable benchmarks for
further development and exploration. Particular interest was taken upon Antoncic &
Hisrich’s (2001) research which built on Khandwalla’s (1977) ‘ENTRESCALE’ and
Zahra’s (1993) ‘Corporate entrepreneurial scale’. Antoncic & Hisrich’s (2001)
methodology integrated these two previously used scholarly models, combining common
denominators and in turn aiding construct validity in a contemporary format.
Within the literature review Carrier (1996) questioned the application of intrapreneurial
theory in the work place, relating to the ‘paradox of organisations’ (Teltumbde, 2006)
whereby organisations desire stability. In comparing the differences between the
acknowledgement and application of intrapreneurial theory, Carrier’s (1996) suggestion
28
that acknowledgment and application of intrapreneurial theory are ‘worlds apart’ would
be tested. This measuring technique is new and would facilitate a platform for further
study to work from. The research objective additionally called for a perceived level of
innovativeness and productivity to be measured. Harvey (2003) referred to an innovative
capacity, which would be an ideal parameter to measure. The term capacity relates to a
maximum amount possible (Oxford, 2004), however a portion of an items capacity could
be illustrated as a percentage of 100, as in the case of a school exam where a student may
get 78% correct. It was conceptualised that asking the participants to rate how productive
and also innovative they thought there organisation was out of 100%, an illustration of
how much room to improve the personnel felt existed within their respective
organisations could attained. Within the realms of measuring intrapreneurial factors, an
innovative capacity and a productive capacity from the perspective of personnel, the
following research presumptions were put forward.
3.3.1 Research propositions
The research presumptions within this study were as follows;
(1) All individuals’ posses’ naturisms capable of generating innovative and
productive ideas, however the capacity to do so is stifled by a ‘corporate immune
system’ and a limited acknowledgment of intrapreneurial theory.
(2) New Zealand companies are not fulfilling their innovative potential due to a
sluggish adjustment to a knowledge based form of management.
(3) Organisations are not realising their full innovative capacity due to poor
acknowledgement of their own staff’s intrapreneurial abilities.
29
3.4 Construction
3.4.1 Questionnaire format
Through the conceptualisation process a case for a quantitative research methodology
beckoned. Firstly, the research objective called for the results to be graphically
presentable for practical interpretation. Secondly, integrating comparative testing models
that were quantitatively based meant that a similar format needed to be followed. Thirdly
a qualitative testing method was going to be a more accessible way of attaining a large
pool of data from a number of organisations.
3.4.2 Sampling
The research design called for a large population base to be surveyed from various
organisational types. Industry segments such as manufacturing, design, banking,
education, legal, and governmental were identified as being suitable for inclusion.
Criteria for inclusion were based upon organisation having a minimum of 10 staff
members permanently employed, been operating for at least 5 years, and located in New
Zealand. This would insure that an organisation was suitably established. Participation
from the personnel would then be based upon full-time employment for a minimum of six
months. This would certify that a participant had a suitable understanding of the
parameters and processes of their respective organisation. The research task required a
large amount of reliable data to be collected. An anonymous approach was therefore
chosen to insure participants were not put off answering questions honestly. Collecting
anonymous questionnaires from participating organisations also aligned with a
quantitative format. Within such parameters the response rate of comparative research
30
was considered. Hill (2003) received a response rate of “36%” (p. 97) from a population
pool of “370” (p. 97). A sample size of at least 50 employees from a minimum of 10
organisations were identified as being sufficient. This would mean at least 15 employees
from each organisation would need to be approached in order to fulfil the sample
requirements. For the purposes of a pilot questionnaire the sample size would be reduced
to at least 1 participant from at least 5 different organisations.
Randomly selecting volunteers with the help of the participating organisations ‘human
resources’ and ‘information technology’ department was initially intented. A letter to
thirty five organisations was written to organisations that were identified as being
suitable. The majority of organisations unfortunately didn’t reply and others excused
themselves due to time restraints. One general manager that declined to take part in the
research stated, “I feel we are suffering from survey fatigue”. As a result, organisations
that agreed to participate were embraced and were followed up on.
3.4.3 Presentation
The studies conceptualisation called for the questionnaire to be as user-friendly as
possible. The OECD (2005) Oslo manual backed up this notion by stating “the
questionnaire should be as simple and short as possible, logically structured, and have
clear definitions and instructions” (p. 71). Therefore no reference to ethnicity, sex,
politics, religion, physicality, mental, criminal or trade union views where included. This
point also held alignment with Massey Universities code of conduct (2006) which states;
“researchers have a responsibility to provide prospective participants with all information
31
relevant to their decision to participate, in a manner comprehensible to prospective
participants” (p. 8).
In considering the questionnaire layout, background information was provided to assist
the participant in making an informed decision whether to participate or not. Secondly, a
definitions page accompanied the questionnaire to help explain the wording and clarify
the context. The type of the questions alternated between acknowledgement of an
intrapreneurial factor and the application of an intrapreneurial factor for test category.
Through the development of the questionnaire, steps were taken to insure the appropriate
ethical considerations were met. The Massey University (2006) code of ethical conduct
for research makes reference to ‘informed and voluntary consent’. Accordingly
participation for this research will be voluntary. A ‘declaration to participate’ box (as
seen in Figure 3.1) was included to enhance authenticity and ensure the participants of
their anonymity.
Figure 3.1 Declaration to participate
Step (1) - Declaration
I understand the nature of this research and I am voluntarily participating. I also understand that strict confidentiality guidelines will be adhered to. I Agree: (Please tick)
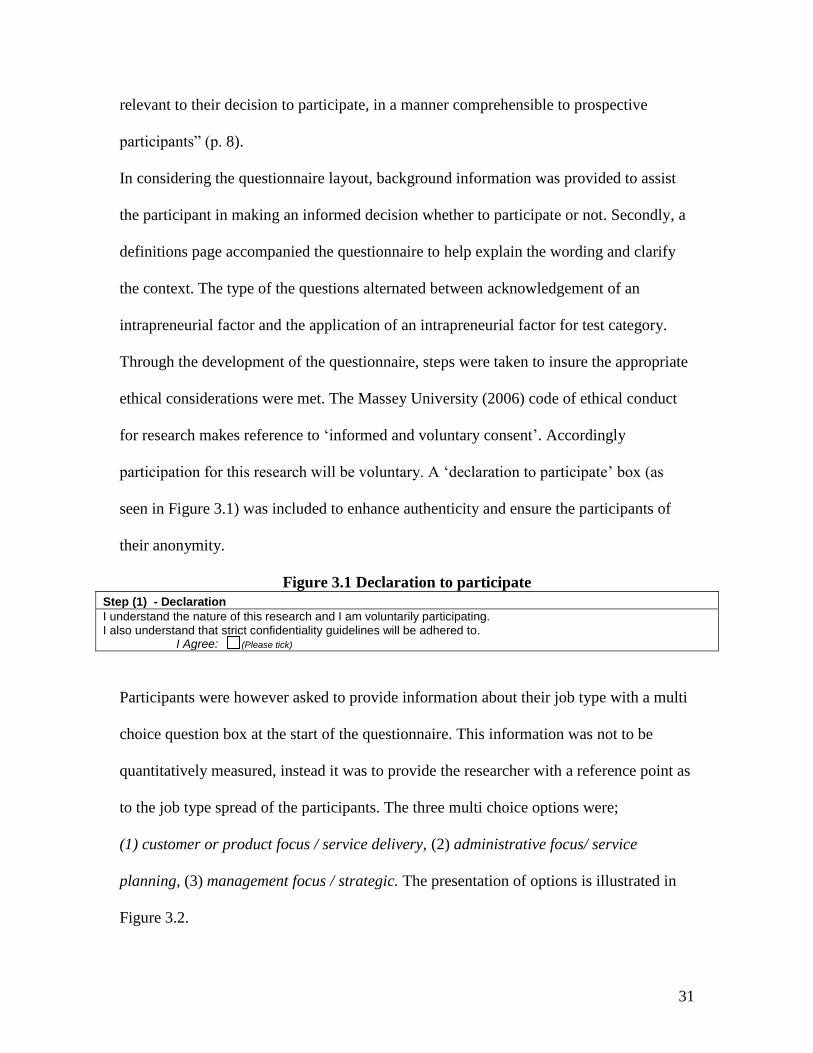
Participants were however asked to provide information about their job type with a multi
choice question box at the start of the questionnaire. This information was not to be
quantitatively measured, instead it was to provide the researcher with a reference point as
to the job type spread of the participants. The three multi choice options were;
(1) customer or product focus / service delivery, (2) administrative focus/ service
planning, (3) management focus / strategic. The presentation of options is illustrated in
Figure 3.2.
32
Figure 3.2 Multichoice options for role classification
Step (2) Please circle the letter (A, B or C) that best describes your role within your organisation :
A Customer or Product Focus / Service Delivery
B Administrative Focus / Service Planning
C Management Focus / Strategic
3.4.4 Scale
Selecting a suitable questionnaire scale was widely considered to ensure a high level of
validity and reliability. Brace (2004) suggests that a questionnaire design needs to be
straight forward, and easy to analyse. A Likert Scale (Fink, 2003) and a ‘multiple-rating
list scale’ (Alreck & Settle, 2004) were short listed. Alreck & Settle (2004) advocated
that a ‘multiple-rating list scale’ uses less question space and lessons the “response task”
(p. 138), while being quick, easy and accurate. Alreck & Settle (2004) also pointed out
that circling an item (within a ‘multiple-rating list’) is faster than filling out a written
response or scribing a symbol. Such factors positively correspond with the researcher’s
intention of creating user-friendly measuring tool. As a result a ‘multiple-rating list’ scale
was selected over a Likert Scale. An eleven point satisfaction scale was then thought to
be appropriate size to attain a detailed response. Krosnick & Fabrigar (1997) affirmed
this design by stating that “scales that are to short cannot reveal much about the
distinctions a person makes among a large set of objects” (p. 146). Brace (2004)
discusses the use of a ‘balanced scale’ by citing that a ‘balanced’ or ‘non-balanced’ scale
decides whether a neutral answer can occur or not. Avoiding neutral answers was
desirable as to facilitate decisive responses. However because of the intention to present
the final results as a numerical percentage of 100, an eleven point the rating scale (from 0
to 10, or 0% to 100%) was deemed to be suitable.
33
3.4.5 Questionnaire Format
Two questionnaire formats, an online electric version and a printed version were
developed to maximise the chances of a high response rate. The electronic version was
initially seen as preferable for its ease of data collection and cost effectiveness. Alreck &
Settle (2004) advocated that the majority of people have access to email and that modern
software and online databases allow for more secure and timely interpretation of results.
However, it was further acknowledged that not all employees will have access to
computers during work time. Therefore a printed hard copy version was still going to be
required. Individual coding upon each electronic questionnaire deciphered the
organisational origin of the survey. This coding also corresponded with the printed
version distributed to each organisation.
3.4.5.1 Characteristics of the hard copy questionnaire format
- Distributed and submitted via traditional postal services
- Appropriate answer box will be circled upon the A4 print out
- The organisations H.R department will be asked to distribute the
questionnaires randomly as so the researcher does not have access to the
participants email address or contact details.
3.4.5.1 Characteristics of the electronic questionnaire format
- The questionnaire will be located upon an electronic form based upon a
secure website that accesses an online database using MySQL software.
34
- An email link (specific to the participating organisation) will be addressed
to the participant.
- The organisations I.T department will be asked to distribute the
questionnaires randomly as so the researcher does not have access to the
participants email address or contact details.
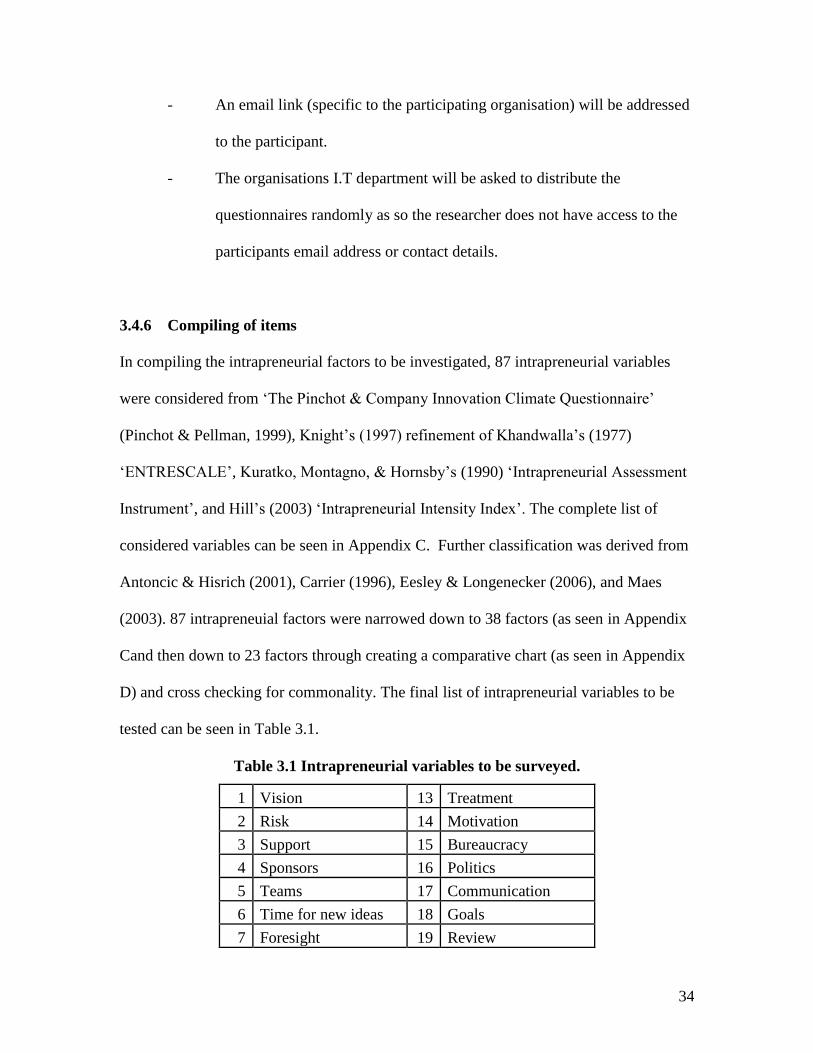
3.4.6 Compiling of items
In compiling the intrapreneurial factors to be investigated, 87 intrapreneurial variables
were considered from ‘The Pinchot & Company Innovation Climate Questionnaire’
(Pinchot & Pellman, 1999), Knight’s (1997) refinement of Khandwalla’s (1977)
‘ENTRESCALE’, Kuratko, Montagno, & Hornsby’s (1990) ‘Intrapreneurial Assessment
Instrument’, and Hill’s (2003) ‘Intrapreneurial Intensity Index’. The complete list of
considered variables can be seen in Appendix C. Further classification was derived from
Antoncic & Hisrich (2001), Carrier (1996), Eesley & Longenecker (2006), and Maes
(2003). 87 intrapreneuial factors were narrowed down to 38 factors (as seen in Appendix
Cand then down to 23 factors through creating a comparative chart (as seen in Appendix
D) and cross checking for commonality. The final list of intrapreneurial variables to be
tested can be seen in Table 3.1.
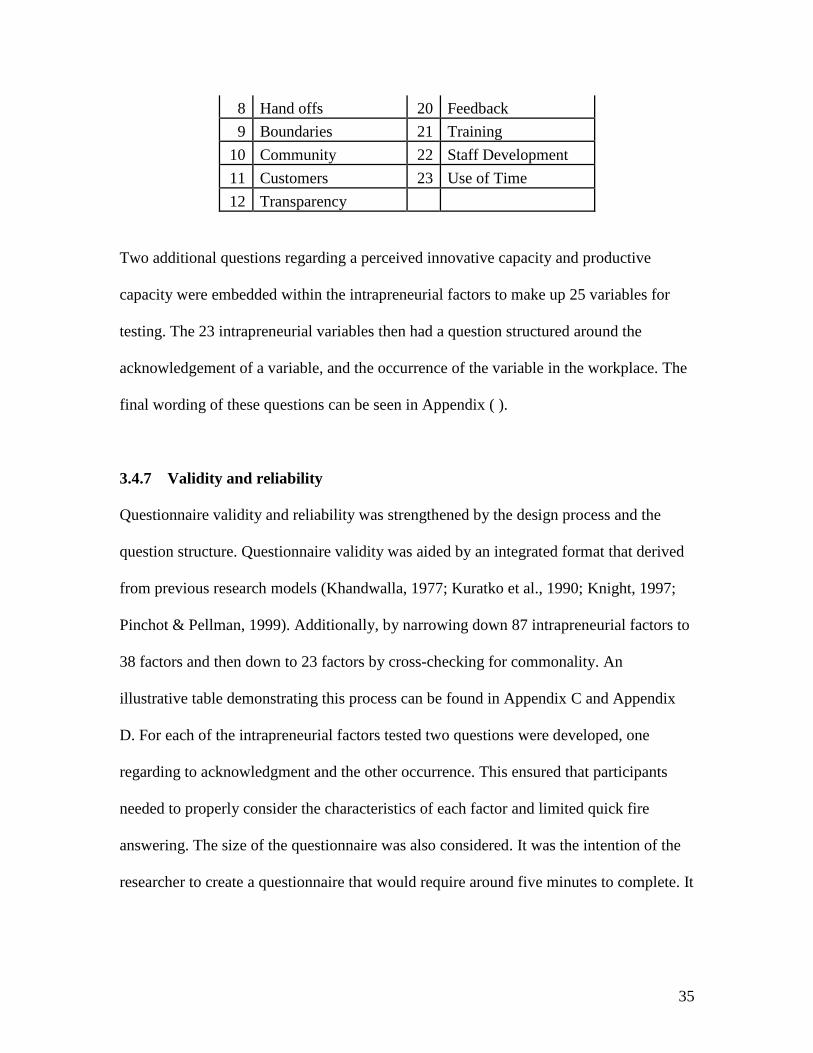
Table 3.1 Intrapreneurial variables to be surveyed.
1 Vision 13 Treatment
2 Risk 14 Motivation
3 Support 15 Bureaucracy
4 Sponsors 16 Politics
5 Teams 17 Communication
6 Time for new ideas 18 Goals
7 Foresight 19 Review
35
8 Hand offs 20 Feedback
9 Boundaries 21 Training
10 Community 22 Staff Development
11 Customers 23 Use of Time
12 Transparency
Two additional questions regarding a perceived innovative capacity and productive
capacity were embedded within the intrapreneurial factors to make up 25 variables for
testing. The 23 intrapreneurial variables then had a question structured around the
acknowledgement of a variable, and the occurrence of the variable in the workplace. The
final wording of these questions can be seen in Appendix ( ).
3.4.7 Validity and reliability
Questionnaire validity and reliability was strengthened by the design process and the
question structure. Questionnaire validity was aided by an integrated format that derived
from previous research models (Khandwalla, 1977; Kuratko et al., 1990; Knight, 1997;
Pinchot & Pellman, 1999). Additionally, by narrowing down 87 intrapreneurial factors to
38 factors and then down to 23 factors by cross-checking for commonality. An
illustrative table demonstrating this process can be found in Appendix C and Appendix
D. For each of the intrapreneurial factors tested two questions were developed, one
regarding to acknowledgment and the other occurrence. This ensured that participants
needed to properly consider the characteristics of each factor and limited quick fire
answering. The size of the questionnaire was also considered. It was the intention of the
researcher to create a questionnaire that would require around five minutes to complete. It
36
was thought that if participants understood that it wasn’t going to take too long to
complete they would pay more attention to each question and limit survey fatigue.
3.5 Implementation
3.5.1 Pilot Questionnaire
A pilot study was used to test the suitability of questions and distribution methods. The
pilot questionnaire followed the planned format for the final questionnaire however with
a target sample size will be at least 1 participant from a minimum of 5 organisations.
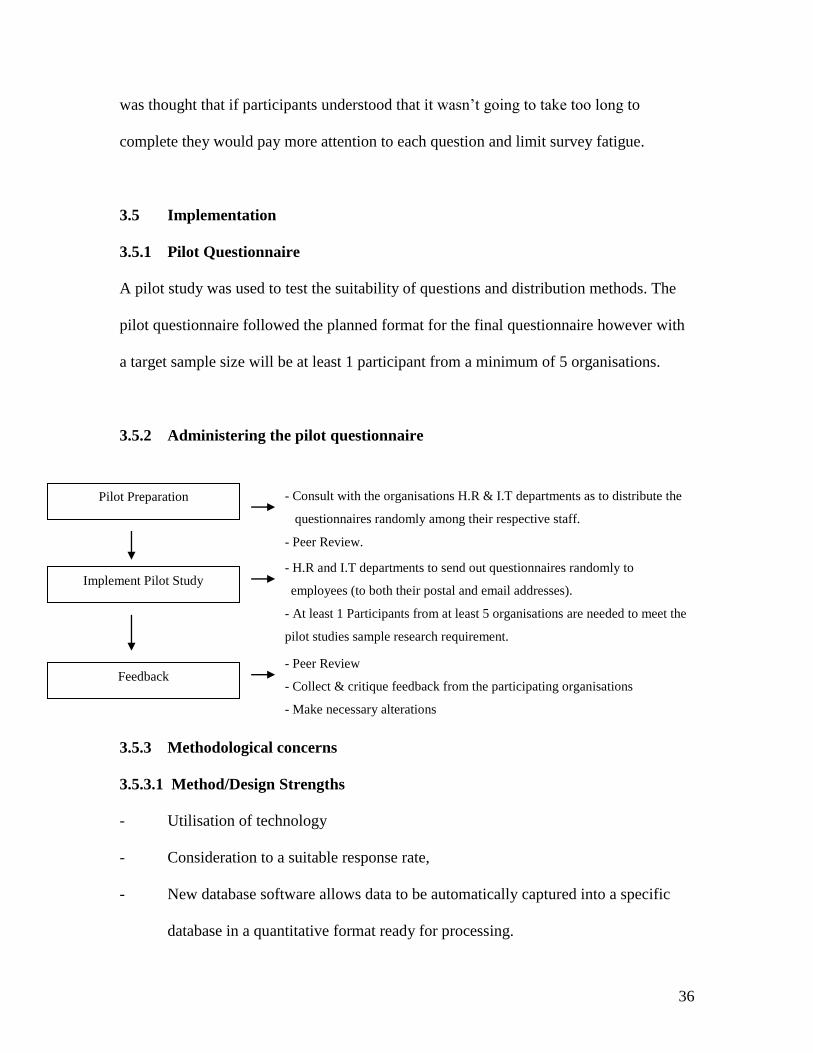
3.5.2 Administering the pilot questionnaire
3.5.3 Methodological concerns
3.5.3.1 Method/Design Strengths
- Utilisation of technology
- Consideration to a suitable response rate,
- New database software allows data to be automatically captured into a specific
database in a quantitative format ready for processing.
Pilot Preparation
Implement Pilot Study
Feedback
- Consult with the organisations H.R & I.T departments as to distribute the
questionnaires randomly among their respective staff.
- Peer Review.
- H.R and I.T departments to send out questionnaires randomly to
employees (to both their postal and email addresses).
- At least 1 Participants from at least 5 organisations are needed to meet the
pilot studies sample research requirement.
- Peer Review
- Collect & critique feedback from the participating organisations
- Make necessary alterations
37
3.5.3.2 Method/Design Weaknesses
- Procedures need to be put in place to ensure only one response is receive from
each individual.
- Random sampling is dependent upon the co-operation of the organisations H.R
and I.T department to randomly disperse questionnaire material.
3.5.4 Review of pilot questionnaire
The feedback from the pilot questionnaire was generally positive. Participants noted that
the questionnaire did not take overly long to complete and question format seemed
appropriate. However further feedback suggested that the printed version of the
questionnaire was going to be more user-friendly and receptive to a higher response rate
than the online alternative.
The researcher noted that some participants showed signs of being a little dubious and
reluctant prior to taking part. However to the researchers surprise a change of attitude
seemed apparent once the pilot surveys were collected. Participants noted that the survey
got them thinking about their organisations processes and were interested in the results.
This curiosity spurred on a confidence to go fourth with the final questionnaire.
However, a clear change of ‘tack’ was needed in regard to distribution and collection if a
hard copy format was going to be used more widely. Comparative research conducted by
Hill (2003) cited that the use of a designated contact person within each of the
participating organisations reduced many of the headaches in distributing, collecting and
attaining feedback on the questionnaires. This suggestion was noted and efforts were
made to identify a suitable contact person.
38
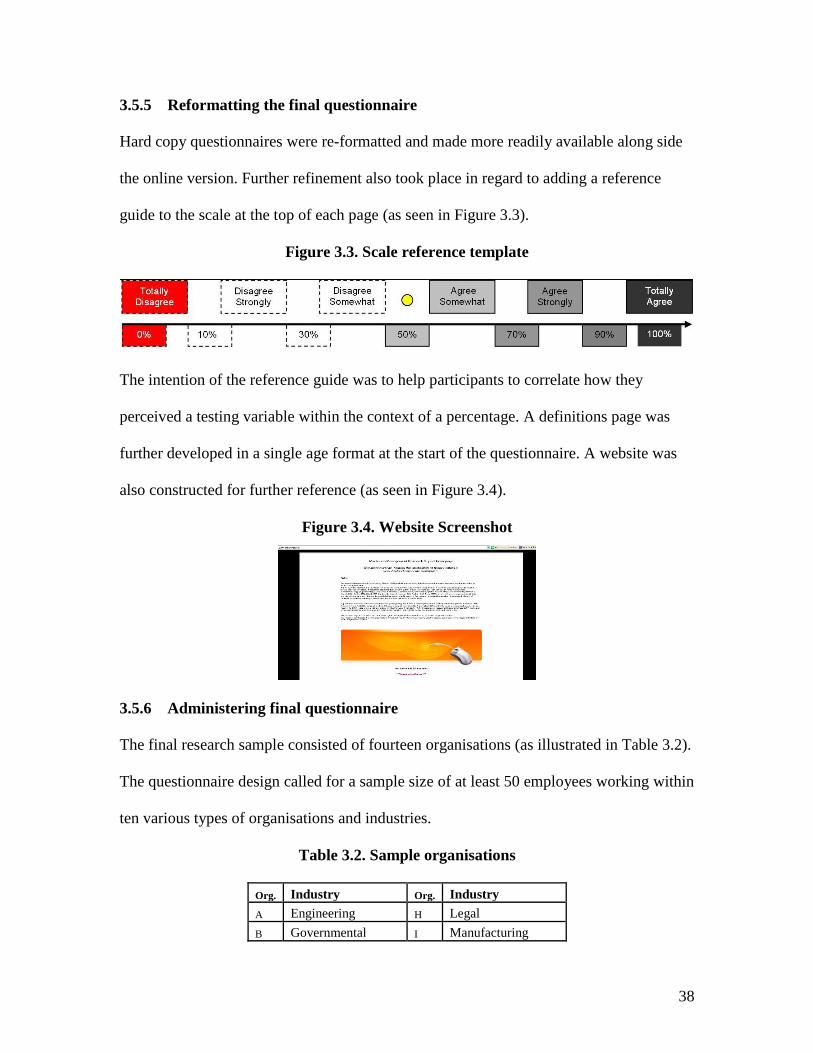
3.5.5 Reformatting the final questionnaire
Hard copy questionnaires were re-formatted and made more readily available along side
the online version. Further refinement also took place in regard to adding a reference
guide to the scale at the top of each page (as seen in Figure 3.3).
Figure 3.3. Scale reference template
The intention of the reference guide was to help participants to correlate how they
perceived a testing variable within the context of a percentage. A definitions page was
further developed in a single age format at the start of the questionnaire. A website was
also constructed for further reference (as seen in Figure 3.4).
Figure 3.4. Website Screenshot
3.5.6 Administering final questionnaire
The final research sample consisted of fourteen organisations (as illustrated in Table 3.2).
The questionnaire design called for a sample size of at least 50 employees working within
ten various types of organisations and industries.
Table 3.2. Sample organisations
Org. Industry Org. Industry
A Engineering H Legal
B Governmental I Manufacturing
39
C Telecommunication J Manufacturing
D Finance K Manufacturing
E Manufacturing L Manufacturing
F Manufacturing M Architecture
G Education N Bank
Once confirmation to conduct the final questionnaire was attained a contact person from
each organisation was identified. The contact person was then briefed about the study and
the research process. The contact person was an important link to provide constructive
feedback. Questionnaires were then distributed to other employees who were willing to
participate in the study. The researcher and the contact person agreed on a collection date
and continued to communicate via telephone and email. This insured any problems could
be dealt with accordingly. Printed copies of the questionnaire were given to the contact
person along with instructions and a link to an online version to distribute. Permission
was obtained from the participants through a declaration from embedded within the
questionnaire. The contact person facilitated the safe and confidential return of the
questionnaires to the researcher.
3.5.7 Data capture
Once the timeframe for each organisation to complete the questionnaires had ended, the
researcher collected the completed printed questionnaires and went on to enter the results
into a online database. This allowed for spreadsheets to be generated. Organisations were
named; Organisation ‘A’, through to Organisation ‘N’. The final results can be seen in
the following section of this report.
100%
40
CHAPTER 4. RESULTS
4.1 Introduction
The results within this section transcend from the research methodology and provide a
clear depiction how personnel from 14 organisations perceive the intrapreneurial factors
of their organisation.
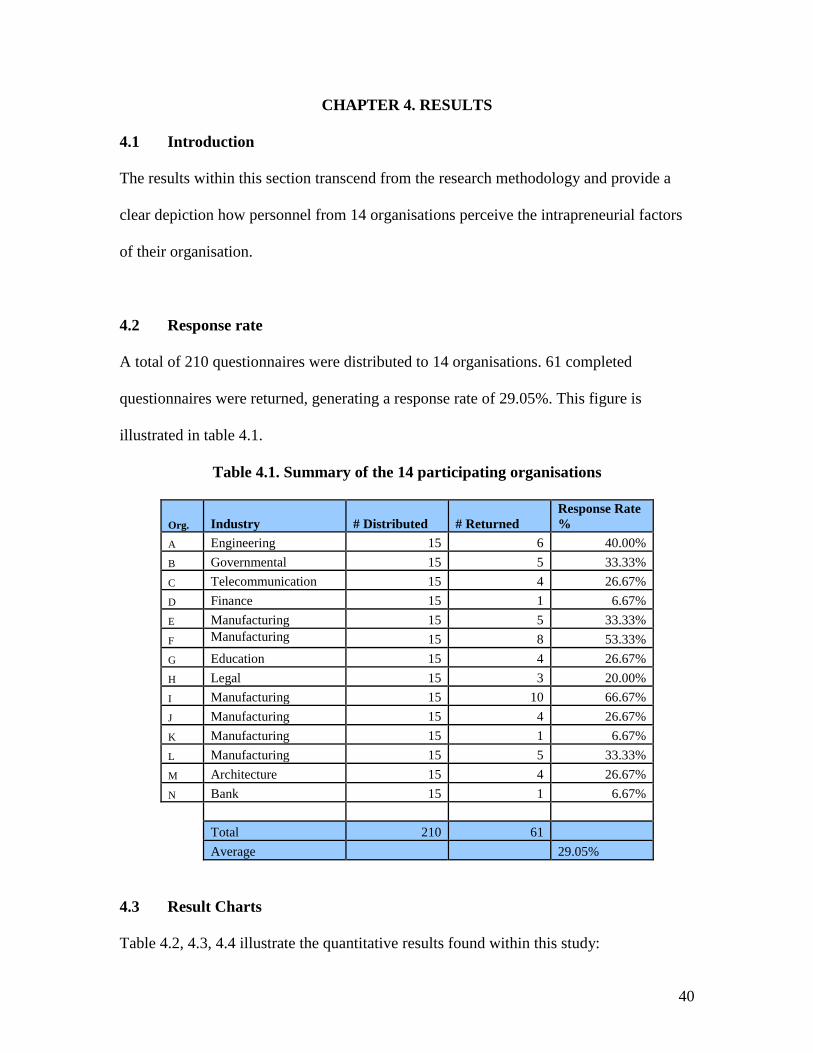
4.2 Response rate
A total of 210 questionnaires were distributed to 14 organisations. 61 completed
questionnaires were returned, generating a response rate of 29.05%. This figure is
illustrated in table 4.1.
Table 4.1. Summary of the 14 participating organisations
Org. Industry # Distributed # Returned
Response Rate
%
A Engineering 15 6 40.00%
B Governmental 15 5 33.33%
C Telecommunication 15 4 26.67%
D Finance 15 1 6.67%
E Manufacturing 15 5 33.33%
F Manufacturing 15 8 53.33%
G Education 15 4 26.67%
H Legal 15 3 20.00%
I Manufacturing 15 10 66.67%
J Manufacturing 15 4 26.67%
K Manufacturing 15 1 6.67%
L Manufacturing 15 5 33.33%
M Architecture 15 4 26.67%
N Bank 15 1 6.67%
Total 210 61
Average 29.05%
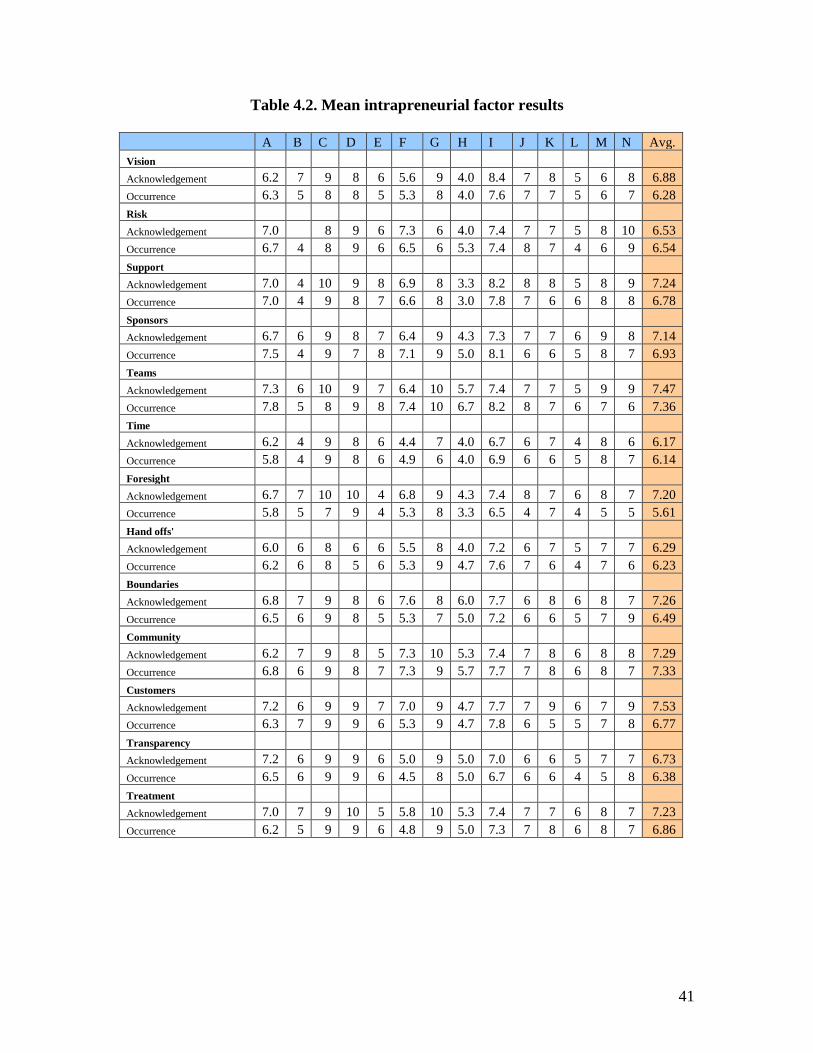
4.3 Result Charts
Table 4.2, 4.3, 4.4 illustrate the quantitative results found within this study:
100%
41
Table 4.2. Mean intrapreneurial factor results
A B C D E F G H I J K L M N Avg.
Vision
Acknowledgement 6.2 7 9 8 6 5.6 9 4.0 8.4 7 8 5 6 8 6.88
Occurrence 6.3 5 8 8 5 5.3 8 4.0 7.6 7 7 5 6 7 6.28
Risk
Acknowledgement 7.0 8 9 6 7.3 6 4.0 7.4 7 7 5 8 10 6.53
Occurrence 6.7 4 8 9 6 6.5 6 5.3 7.4 8 7 4 6 9 6.54
Support
Acknowledgement 7.0 4 10 9 8 6.9 8 3.3 8.2 8 8 5 8 9 7.24
Occurrence 7.0 4 9 8 7 6.6 8 3.0 7.8 7 6 6 8 8 6.78
Sponsors
Acknowledgement 6.7 6 9 8 7 6.4 9 4.3 7.3 7 7 6 9 8 7.14
Occurrence 7.5 4 9 7 8 7.1 9 5.0 8.1 6 6 5 8 7 6.93
Teams
Acknowledgement 7.3 6 10 9 7 6.4 10 5.7 7.4 7 7 5 9 9 7.47
Occurrence 7.8 5 8 9 8 7.4 10 6.7 8.2 8 7 6 7 6 7.36
Time
Acknowledgement 6.2 4 9 8 6 4.4 7 4.0 6.7 6 7 4 8 6 6.17
Occurrence 5.8 4 9 8 6 4.9 6 4.0 6.9 6 6 5 8 7 6.14
Foresight
Acknowledgement 6.7 7 10 10 4 6.8 9 4.3 7.4 8 7 6 8 7 7.20
Occurrence 5.8 5 7 9 4 5.3 8 3.3 6.5 4 7 4 5 5 5.61
Hand offs'
Acknowledgement 6.0 6 8 6 6 5.5 8 4.0 7.2 6 7 5 7 7 6.29
Occurrence 6.2 6 8 5 6 5.3 9 4.7 7.6 7 6 4 7 6 6.23
Boundaries
Acknowledgement 6.8 7 9 8 6 7.6 8 6.0 7.7 6 8 6 8 7 7.26
Occurrence 6.5 6 9 8 5 5.3 7 5.0 7.2 6 6 5 7 9 6.49
Community
Acknowledgement 6.2 7 9 8 5 7.3 10 5.3 7.4 7 8 6 8 8 7.29
Occurrence 6.8 6 9 8 7 7.3 9 5.7 7.7 7 8 6 8 7 7.33
Customers
Acknowledgement 7.2 6 9 9 7 7.0 9 4.7 7.7 7 9 6 7 9 7.53
Occurrence 6.3 7 9 9 6 5.3 9 4.7 7.8 6 5 5 7 8 6.77
Transparency
Acknowledgement 7.2 6 9 9 6 5.0 9 5.0 7.0 6 6 5 7 7 6.73
Occurrence 6.5 6 9 9 6 4.5 8 5.0 6.7 6 6 4 5 8 6.38
Treatment
Acknowledgement 7.0 7 9 10 5 5.8 10 5.3 7.4 7 7 6 8 7 7.23
Occurrence 6.2 5 9 9 6 4.8 9 5.0 7.3 7 8 6 8 7 6.86
100%
42
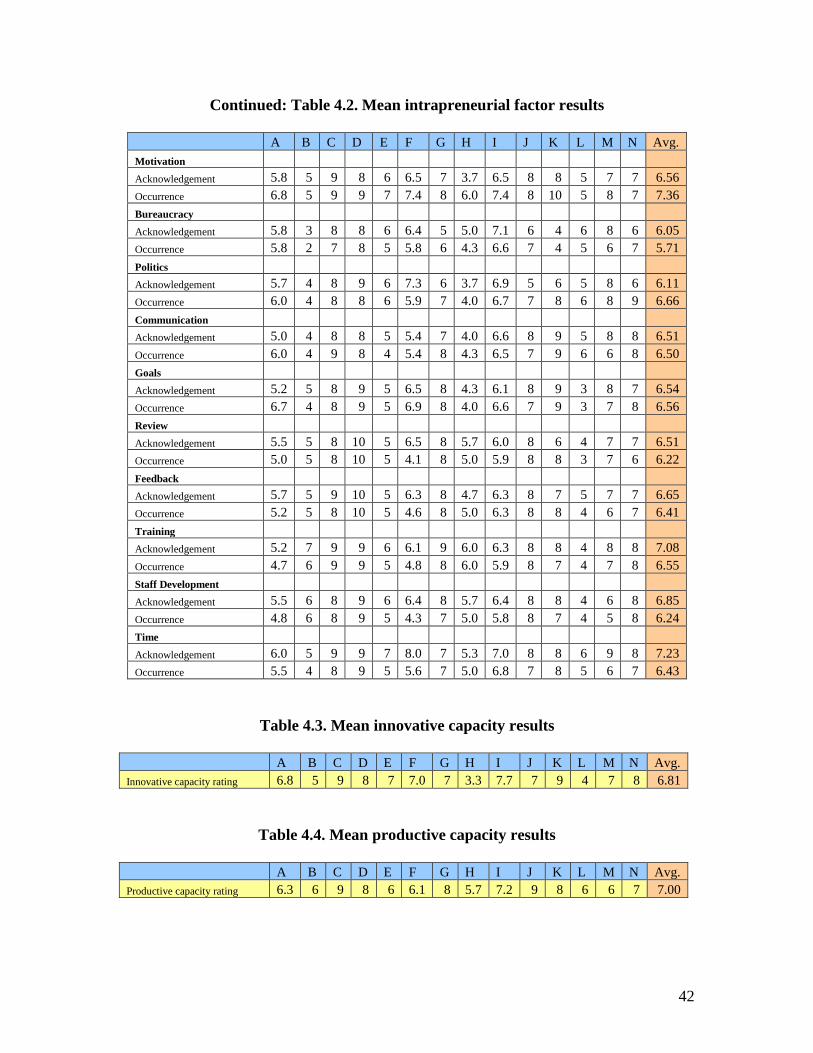
Continued: Table 4.2. Mean intrapreneurial factor results
A B C D E F G H I J K L M N Avg.
Motivation
Acknowledgement 5.8 5 9 8 6 6.5 7 3.7 6.5 8 8 5 7 7 6.56
Occurrence 6.8 5 9 9 7 7.4 8 6.0 7.4 8 10 5 8 7 7.36
Bureaucracy
Acknowledgement 5.8 3 8 8 6 6.4 5 5.0 7.1 6 4 6 8 6 6.05
Occurrence 5.8 2 7 8 5 5.8 6 4.3 6.6 7 4 5 6 7 5.71
Politics
Acknowledgement 5.7 4 8 9 6 7.3 6 3.7 6.9 5 6 5 8 6 6.11
Occurrence 6.0 4 8 8 6 5.9 7 4.0 6.7 7 8 6 8 9 6.66
Communication
Acknowledgement 5.0 4 8 8 5 5.4 7 4.0 6.6 8 9 5 8 8 6.51
Occurrence 6.0 4 9 8 4 5.4 8 4.3 6.5 7 9 6 6 8 6.50
Goals
Acknowledgement 5.2 5 8 9 5 6.5 8 4.3 6.1 8 9 3 8 7 6.54
Occurrence 6.7 4 8 9 5 6.9 8 4.0 6.6 7 9 3 7 8 6.56
Review
Acknowledgement 5.5 5 8 10 5 6.5 8 5.7 6.0 8 6 4 7 7 6.51
Occurrence 5.0 5 8 10 5 4.1 8 5.0 5.9 8 8 3 7 6 6.22
Feedback
Acknowledgement 5.7 5 9 10 5 6.3 8 4.7 6.3 8 7 5 7 7 6.65
Occurrence 5.2 5 8 10 5 4.6 8 5.0 6.3 8 8 4 6 7 6.41
Training
Acknowledgement 5.2 7 9 9 6 6.1 9 6.0 6.3 8 8 4 8 8 7.08
Occurrence 4.7 6 9 9 5 4.8 8 6.0 5.9 8 7 4 7 8 6.55
Staff Development
Acknowledgement 5.5 6 8 9 6 6.4 8 5.7 6.4 8 8 4 6 8 6.85
Occurrence 4.8 6 8 9 5 4.3 7 5.0 5.8 8 7 4 5 8 6.24
Time
Acknowledgement 6.0 5 9 9 7 8.0 7 5.3 7.0 8 8 6 9 8 7.23
Occurrence 5.5 4 8 9 5 5.6 7 5.0 6.8 7 8 5 6 7 6.43
Table 4.3. Mean innovative capacity results
A B C D E F G H I J K L M N Avg.
Innovative capacity rating 6.8 5 9 8 7 7.0 7 3.3 7.7 7 9 4 7 8 6.81
Table 4.4. Mean productive capacity results
A B C D E F G H I J K L M N Avg.
Productive capacity rating 6.3 6 9 8 6 6.1 8 5.7 7.2 9 8 6 6 7 7.00
100%
100%
43
CHAPTER 5. DISCUSSION
This study quantitatively measured the perception ratings of 23 intrapreneurial factors, a
perceived innovative capacity and a perceived productive capacity from 61 individuals
across 14 New Zealand organisations. The results particularly highlight; (1) a weak
application and acknowledgement of intrapreneurial factors in New Zealand
organisations, (2) an average productive capacity of 70%, (3) an average innovative
capacity of 68%, and (4) a positive correlation between intrapreneurship, productivity,
and innovativeness.
5.1 Intrapreneurial factor critique
5.1.1 Intrapreneurial factor weaknesses
Results within this study show a weak application and acknowledgement of
intrapreneurial theory within New Zealand organisations. Most notably in the areas of
‘organisational foresight’, resistance to ‘bureaucracy’, ‘time to explore new ideas’, ‘hand
offs’, ‘staff review’, ‘staff development’, ‘strategic vision’, ‘feedback’, ‘transparency’,
‘time management’, and ‘goal setting’. These results suggest that New Zealand
businesses are acting more re-actively than proactively. A weak application of
intrapreneurial factors in the workplace aligns with the research presumption that ‘New
Zealand companies are not fulfilling their innovative potential due to a sluggish
adjustment to a knowledge based form of management.’ The intrapreneurial factor
results are illustrated in Figure 5.1. To reduce a low acknowledgment and application of
‘discretionary time practices’ Pinchot & Pellman (1999) suggests; (1) allowing
employees to use 10 to 15 percent of their time to work on projects of their own
44
choosing, (2) don’t over assign work projects, (3) value employees that stop to investigate
a new idea. To minimise a low acknowledgment and application of practices that reduce
project ‘hand-offs’ Pinchot & Pellman (1999) recommends; (1) allow intrapreneurs to
remain stay with their projects till completion, (2) when team changes occur, move one
person at a time to insure continuity, (3) allow intrapreneurs to recruit others.
To counteract a low acknowledgment and application of respect for others, Pinchot &
Pellman (1999) recommends; (1) making rules about how people are to be treated within
the organisation, (2) discourage brutal behaviour, even if it produces short term results,
(3) develop a safety net for employees that lose their job.
To counteract a low acknowledgment and application of organisational transparency,
Pinchot & Pellman (1999) recommends; (1) create an open-book policy, (2) communicate
candidly, (3) reward honesty. To minimise a low acknowledgment and application of low
levels of customer satisfaction, Pinchot & Pellman (1999) recommends; (1) getting
employees from different departments spend time with different customers, (2) measure
customer satisfaction levels, (3) develop value propositions. To minimise a low
acknowledgment and application of community spirit within an organisation, Pinchot &
Pellman (1999) recommends; (1) develop a set of organisational values, develop a caring
organisational culture, discourages symbols of rank and hierarchy. To reduce a low
acknowledgment and application of procedures to overcome organisational boundaries
Pinchot & Pellman (1999) recommends; (1) develop a culture that interacts across
organisational boundaries, (2) cross boundary social events, (3) set up rewards for
companywide performance.
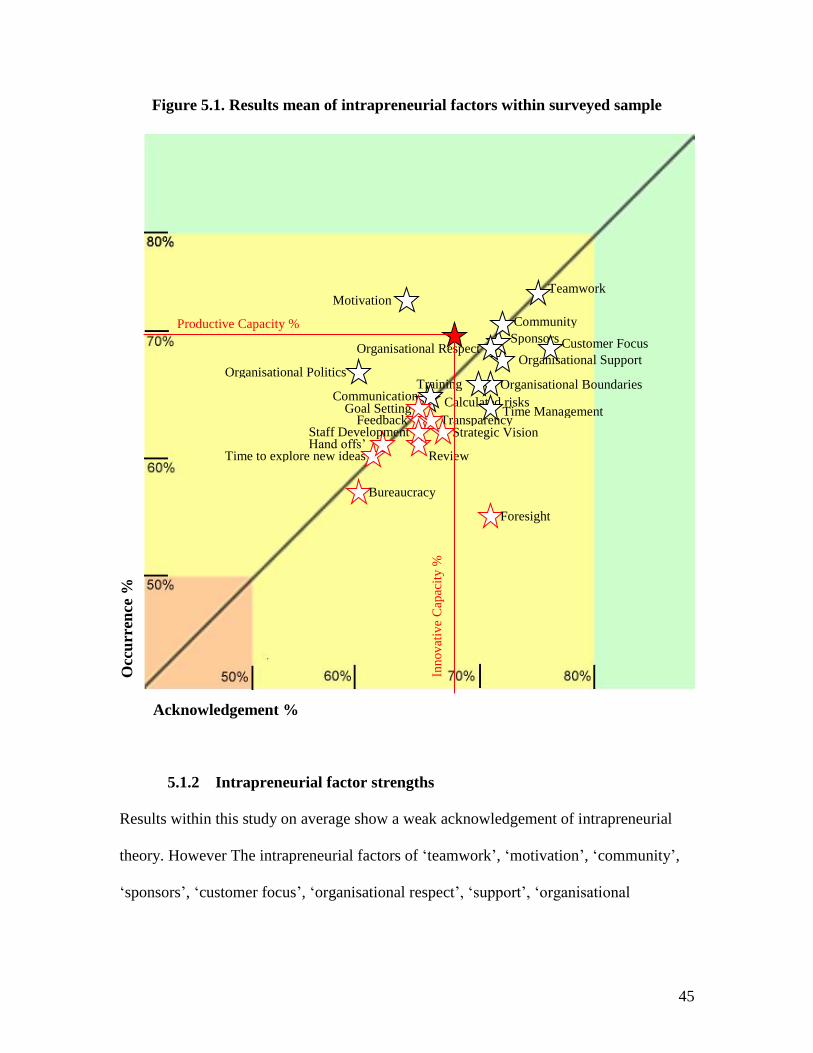
45
Figure 5.1. Results mean of intrapreneurial factors within surveyed sample
5.1.2 Intrapreneurial factor strengths
Results within this study on average show a weak acknowledgement of intrapreneurial
theory. However The intrapreneurial factors of ‘teamwork’, ‘motivation’, ‘community’,
‘sponsors’, ‘customer focus’, ‘organisational respect’, ‘support’, ‘organisational
Communication Goal Setting
Transparency Feedback Strategic Vision
Review Hand offs’
Time to explore new ideas
Acknowledgement %
Occ
urr
ence
%
Organisational Support
Calculated risks
Teamwork
Sponsors
Time Management
Organisational Respect
Staff Development
Training
Foresight
Organisational Boundaries
Community
Customer Focus
Motivation
Bureaucracy
Organisational Politics
Productive Capacity %
Inn
ov
ativ
e C
apac
ity
%
46
boundaries’, ‘training’, ‘organisational politics’, and ‘communication’ scored on average
a higher perception rating as seen in Figure 5.1.
5.1.3 A lack of foresight outweighed by motivation
The results (as illustrated in Figure 5.1) suggest a high occurrence of employee
motivation is possibly compensating for a lack of organisational foresight within New
Zealand organisations. This alludes to the kiwi ‘can do’, ‘she’ll be right’ mentality being
applied in the way New Zealanders do business. This also aligns with the earlier
observation that New Zealand organisations are acting reactively than proactively. The
implications of poor organisational foresight is emphasised in times of economic
downturn which can manifest problems relating to stock levels and cash flow (Parker,
2008). To counteract a low acknowledgment and application of ‘organisational foresight’
Pinchot & Pellman (1999) recommends; (1) involving personnel in visioning exercises
that consider five, ten, and fifty years ahead, (2) in all meetings, consider the effect of
decisions on the organisation two to ten years in the future, (3) notice who cares about
thinking into the future and who considers it to be silly, (4) consider long-term thinking
within personnel appraisals.
5.2 Unrealised productive capacity
The results show an average ‘productive capacity’ rating of 70% as perceived by
employees of the sampled organisations. This suggests that on average there is an
unrealised potential of 30% productive capacity not being utilised by the sampled
organisations. This firstly indicates that New Zealand businesses could be operating more
47
effectively and secondly, personnel are acknowledging ways to improve productivity, but
are not actively following through with their concern. This observation aligns with
research presumption that ‘all individuals’ posses’ naturisms capable of generating
innovative and productive ideas, however the capacity to do so is stifled by a ‘corporate
immune system’ and a limited acknowledgment of intrapreneurial theory.
5.3 Unrealised innovative capacity
The results identify that personnel from the sampled organisations believe on average that
their organisations are only operating at 68% of their potential innovative capability. This
figure is demonstrated in Figure 5.2 and aligns with the research presumption that New
Zealand companies are not fulfilling their innovative potential due to a sluggish
adjustment to a knowledge-based form of management. If New Zealand organisations
only are fulfilling two thirds of their innovative potential, it is furthermore suggestive that
underlying issues in the way New Zealand organisations are structured and managed in
New Zealand. Additionally If New Zealand is to grow a knowledge-based economy, it
needs to utilise this untapped potential in order to create value-added products and
services.
Harvey (2003) notes that New Zealand managers have not been proven to be particularly
strong at designing work processes and managing personnel in a way to generate
innovative outcomes. Harvey (2003) recommends that organisations need to strengthen
their innovative managerial capabilities’ within the context that they operate.
Gilberston et al (1995) suggested that organisations that have; (1) low incentives for idea
champions, (2) management which is overly focused on the short term, (3) overly
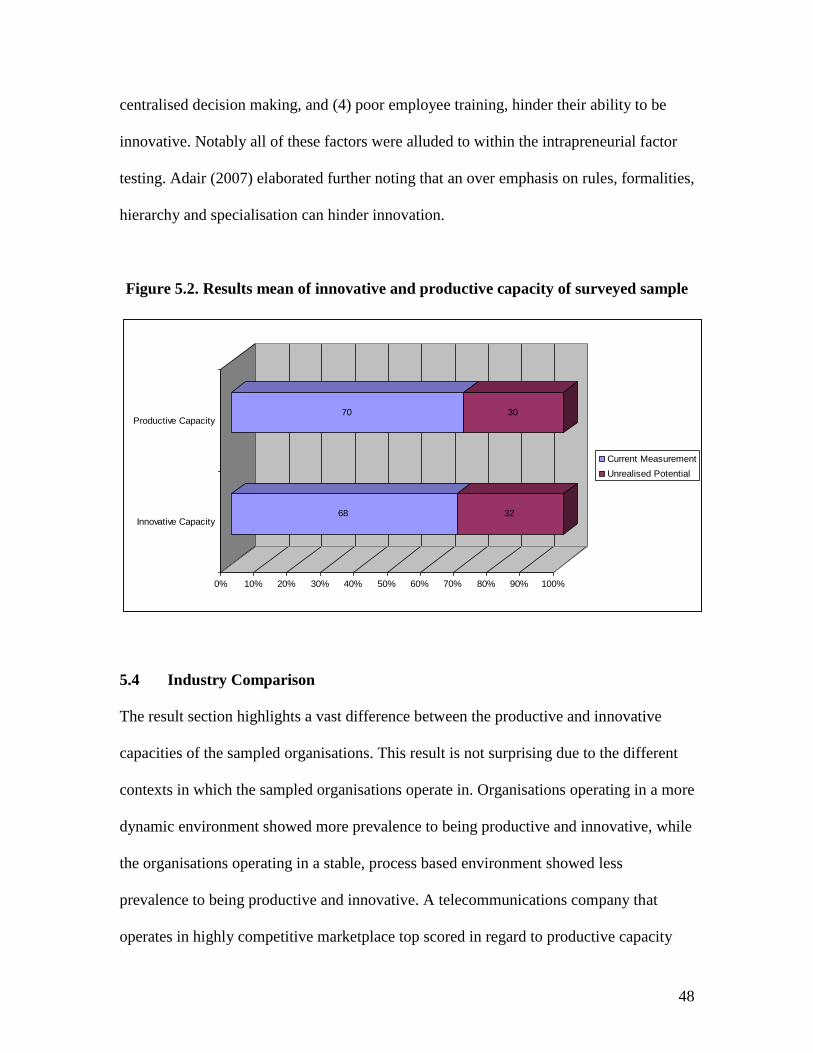
48
centralised decision making, and (4) poor employee training, hinder their ability to be
innovative. Notably all of these factors were alluded to within the intrapreneurial factor
testing. Adair (2007) elaborated further noting that an over emphasis on rules, formalities,
hierarchy and specialisation can hinder innovation.
Figure 5.2. Results mean of innovative and productive capacity of surveyed sample
68 32
70 30
0% 10% 20% 30% 40% 50% 60% 70% 80% 90% 100%
Innovative Capacity
Productive Capacity
Current Measurement
Unrealised Potential
5.4 Industry Comparison
The result section highlights a vast difference between the productive and innovative
capacities of the sampled organisations. This result is not surprising due to the different
contexts in which the sampled organisations operate in. Organisations operating in a more
dynamic environment showed more prevalence to being productive and innovative, while
the organisations operating in a stable, process based environment showed less
prevalence to being productive and innovative. A telecommunications company that
operates in highly competitive marketplace top scored in regard to productive capacity
49
(88%) and innovative capacity (90%), while a government department measured the
lowest (productive capacity 56%, innovative capacity 52%). This can be compared to the
sample mean of 70% and ‘innovative capacity’ and 68% ‘productivity capacity’. From
observing these results it is noticeable that the figures for innovative capacity and
productive capacity don’t deviate more than 10%. This alludes to a correlation between
productivity and innovativeness. Two exemptions are however apparent. ‘Organisation
H’ (a law firm) and ‘Organization L’ (an import/distribution company) both have a
substantially lower innovative capacity reading’s than that of its productivity capacity
measurement. Organisation ‘H’ had a productive capacity rating of 57% and an
innovative capacity rating of 33%. Conversely Organisation ‘L’ has a productive capacity
rating of 60% and an innovative capacity of 40%. This is suggestive of both organisations
‘machine like’ structure (as previously alluded to by Morgan, 1998) stifling innovation. It
should also be noted, that both organisations fall below the sample mean’s innovative and
productive capacity measurement. Figure 5.4 illustrates this observation and alludes to
organisations which are heavily process based not being as productive in the long run
because of a failure to allow innovative improvements to eventuate. This result also
aligns with the research presumption that ‘organisations are not realising their full
innovative capacity due to poor acknowledgement of their own staff’s intrapreneurial
abilities’.
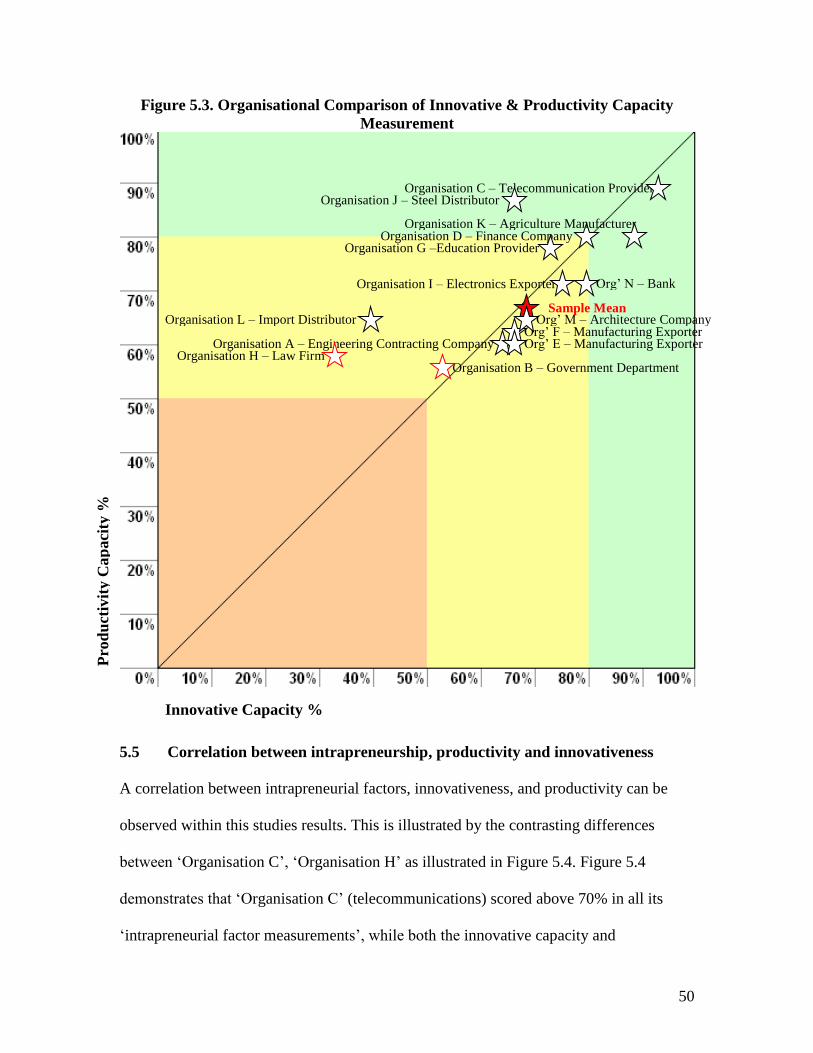
50
Figure 5.3. Organisational Comparison of Innovative & Productivity Capacity
Measurement
5.5 Correlation between intrapreneurship, productivity and innovativeness
A correlation between intrapreneurial factors, innovativeness, and productivity can be
observed within this studies results. This is illustrated by the contrasting differences
between ‘Organisation C’, ‘Organisation H’ as illustrated in Figure 5.4. Figure 5.4
demonstrates that ‘Organisation C’ (telecommunications) scored above 70% in all its
‘intrapreneurial factor measurements’, while both the innovative capacity and
Organisation I – Electronics Exporter
Org’ M – Architecture Company
Innovative Capacity %
Pro
du
ctiv
ity C
ap
aci
ty %
Organisation B – Government Department
Organisation C – Telecommunication Provider
Organisation A – Engineering Contracting Company
Organisation D – Finance Company
Org’ E – Manufacturing Exporter
Organisation L – Import Distributor
Organisation G –Education Provider
Org’ F – Manufacturing Exporter
Sample Mean
Organisation K – Agriculture Manufacturer
Organisation J – Steel Distributor
Organisation H – Law Firm
Org’ N – Bank
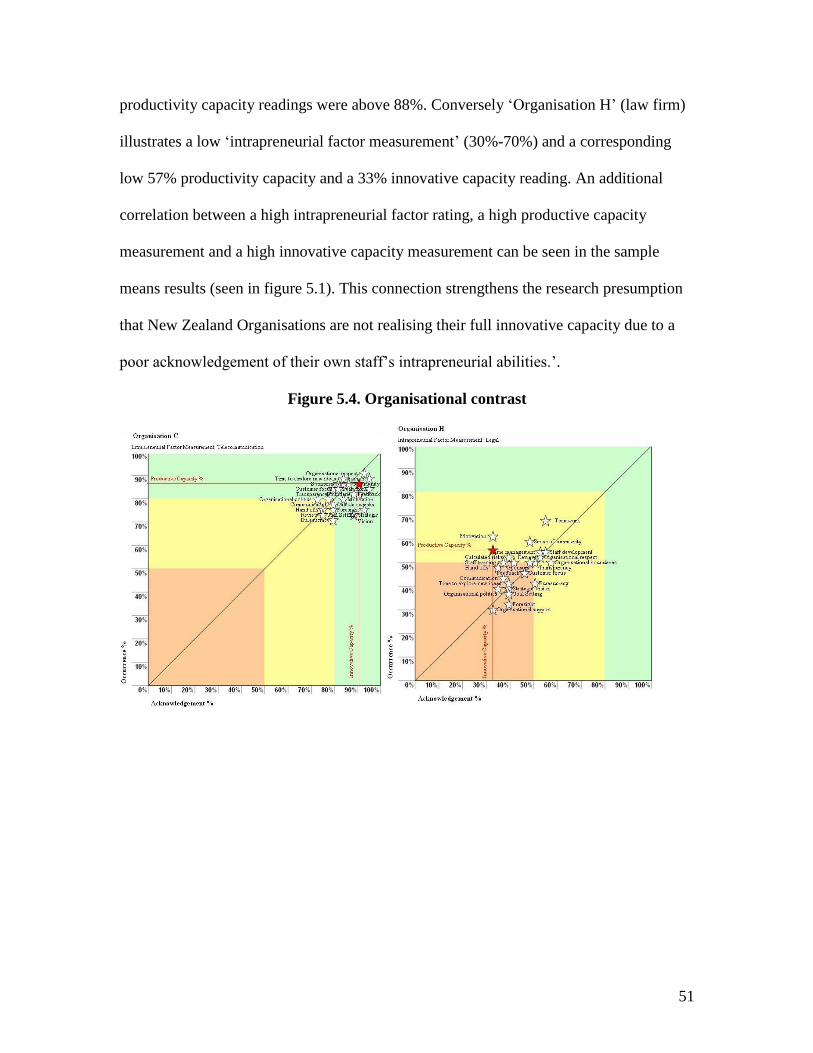
51
productivity capacity readings were above 88%. Conversely ‘Organisation H’ (law firm)
illustrates a low ‘intrapreneurial factor measurement’ (30%-70%) and a corresponding
low 57% productivity capacity and a 33% innovative capacity reading. An additional
correlation between a high intrapreneurial factor rating, a high productive capacity
measurement and a high innovative capacity measurement can be seen in the sample
means results (seen in figure 5.1). This connection strengthens the research presumption
that New Zealand Organisations are not realising their full innovative capacity due to a
poor acknowledgement of their own staff’s intrapreneurial abilities.’.
Figure 5.4. Organisational contrast
52
CHAPTER 6. CONCLUSION
This research set out to test the application of intrapreneurial theory within a New
Zealand workplace. This study met this objective by surveying sixty one personnel from
fourteen varied organisations. Through this process, a wide range of literature was
reviewed, a intrapreneurial measurement tool was further refined, and benchmarkable
results were attained.
This research hypothesised that ‘organisations are not realising their full innovative and
productive capacity due to a poor acknowledgement of their own staff’s intrapreneurial
abilities’. This presumption was confirmed by a strong correlation between the tested
intrapreneurial factors, and the corresponding productive capacity (70%) and innovative
capacity (68%) results. This matches Carrier’s (1996) suggestion that the managerial
intention of cultivating intrapreneurial activity is commonly worlds apart from what
eventuates. A second hypothesis was that ‘all individuals’ posses’ naturisms capable of
generating innovative and productive ideas, however the capacity to do so is stifled by a
‘corporate immune system’ and a limited acknowledgment of intrapreneurial theory’.
This hypothesis was confirmed by the existence of unrealised innovative capacity (32%)
and productive capacity (30%) being acknowledged by participants, while the
intrapreneurial factor testing verified the restrictive tendencies of ‘bureaucracy’ and
‘organisational politics’.
Overall, a generally weak acknowledgment and application of intrapreneurial factors
were present within this studies results, as well as mediocre production capacity and
innovative capacity readings. This aligns with the third research presumption that New
53
Zealand companies are not fulfilling their innovative potential due to a sluggish
adjustment to a knowledge based form of management.
Out of the 23 intrapreneurial factors tested, particular weaknesses were found in the areas
of ‘organisational foresight’, ‘resistance to ‘bureaucracy’, ‘time to explore new ideas’,
‘hand offs’, ‘staff review’, ‘staff development’, ‘strategic vision’, ‘feedback’,
‘transparency’, ‘time management’, and ‘goal setting’. Conversely the intrapreneurial
factors of ‘teamwork’, ‘motivation’, ‘community’, ‘sponsors’, ‘customer focus’,
‘organisational respect’, ‘support’, ‘organisational boundaries’, ‘training’, ‘organisational
politics’, and ‘communication’ scored more positively.
Through this research evidence suggests that New Zealand organisations are acting more
re-actively than pro-actively and a lack of ‘organisational foresight’ is being outweighed
by employee motivation. In addition the average ‘innovative capacity’ measurement of
68% and a average ‘productive capacity’ measurement of 70% alludes to a disconnect
being present between what personnel believe, and what organisations are doing in order
to be productive and innovative.
The relevance of this research is definitely becoming more apparent as the international
business landscape evolves. It is hoped that this research can assist organisations in
identifying ways to promote and foster innovative and productive ideas in all facets of
business.
Further research is advised in the areas of improvement benchmarking of intrapreneurial
factors and also in international comparisons. A qualitative research methodology would
also be insightful into understanding how management felt about their respective
organisations intrapreneurial abilities.

54
55
REFERENCE LIST
Adair, J. (2007). Leadership for innovation: how to organise team creativity and harvest
ideas. London: Kogan.
Alreck, P., & Settle, R. (2004). The survey research handbook (3rd ed.). New York:
McGraw-Hill Irwin.
Amabile, T. (1998). How to kill creativity. Harvard Business Review, 76(5), 76-87.
Antoncic, B., & Hisrich, R. (2003). Clarifying the intrapreneurship concept. Journal of
small business and enterprise development, 10(1), 7-24.
Antoncic, B., & Hisrich, R. D. (2001). Intrapreneurship: Construct refinement and cross-
cultural validation Journal of Business Venturing, 16(5), 495.
Bilton, C. (2007). Management and creativity : from creative industries to creative
management Malden, MA: Blackwell
Birkinshaw. (2000). Entrepreneurship in the global firm. London: Sage Publications.
Buckman, R. (2004). Building a knowledge-driven organization. New York: McGraw
Hill.
Carrier, C. (1994). Intrepreneurship in large firms and SMEs: a comparative study.
International small business journal, 12(3), 54-61.
Carrier, C. (1996). Intrapreneurship in Small Businesses: An Exploratory Study.
Entrepreneurship: Theory & Practice, 21(1), 5-20.
Clark, H. (2007). Prime Minister’s Statement to Parliament. Retrieved 19 November,
2008, from http://www.beehive.govt.nz/node/28357
Claver, E., Llopis, J., Garcia, D., & Molina, H. (1998). Organizational culture for
innovation and new technological behaviour. The Journal of High Technology
Management Research, 9(1), 55-68.
Covin, J. G., & Miles, M. P. (1999). Corporate entrepreneurship and the pursuit of
competitive advantage. Entrepreneurship: Theory & Practice, 23(4), 47-63.
Covin, J. G., & Slevin, D. P. (1989). Strategic management of small firms in hostile and
benign environments. Strategic management journal, 10, 75-87.
Covin, J. G., & Slevin, D. P. (1991). A conceptual model of entrepreneurship as firm
behavior. Entrepreneurship: Theory & Practice, 16(1), 7-25.
D.O.L. (2008). High Performance Workplace Practices in APEC Economies. Retrieved
June 4, 2008, from
http://www.dol.govt.nz/workplaceproductivity/resources/research/highperformanc
eapec.asp
Davis, J., Subrahmanian, E., & Westerberg, A. (Eds.). (2005). Knowledge management :
organizational and technological dimensions Berlin: Physica-Verlag,.
De Clercq, D., Castaner, X., & Belausteguigoitia, I. (2007). The secrets of
intrapreneurship. European Business Forum(31), 40-45.
De Geus, A. (1988). Planning as learning In Harvard business review on managing
uncertainty Boston: Harvard business school publishing.
Easton. (2007). Globalisation and the wealth of nations. Auckland: Auckland University
Press.
Eesley, D. T., & Longenecker, C. O. (2006). Gateways to Intrapreneurship. Industrial
Management, 48(1), 18-23.
56
Fagerberg, J. (2003). Innovation: a guide to the literature [Electronic Version]. Centre for
technology, innovation and culture, University of Oslo. Retrieved 10 September,
2008 from http://www.globelicsacademy.net/pdf/JanFagerberg_1.pdf.
Farrell, D. (Ed.). (2006). The productivity imperative: wealth and poverty in the global
economy. Boston: Harvard Business School Publishing.
Fink, A. (2003). How to design survey studies (2nd ed.). London: Sage Publications.
Frederick, H. (2004). Toward high growth enterprise in New Zealand: The Unitec global
entrepreneurship monitor 03/04. Auckland: Unitec.
Friedman, M. (1982). Capitalism and freedom. Chicago: University of Chicago Press.
Gilberston, D., Gilberston, D., & Andrews, B. (1995). Innovation and management in
New Zealand. In Innovation and Management; New Zealand case studies (pp. 45-
68). Palmerston North: Dunmore Press.
Harvey, O. (2003). Innovative enterprises: managing and organising for innovation:
report for growth and innovation advisory board. Retrieved 4 June, 2008, from
http://www.giab.govt.nz/work-programme/people/innovative-
enterprises/index.html
Hayes, J. (2002). The theory and practice of change management. New York: Palgrave.
Hill, M. (2003). The development of an instrument to measure intrapreneurship:
entrepreneurship within the corporate setting. Unpublished master's thesis.
Rhodes University, Grahamstown.
Hunter, I., & Morrow, D. (Eds.). (2006). City of enterprise: perspectives on Auckland
business history Auckland: Auckland University press.
Jevons, W. S. (1877). The principles of science: A treatise on logic and scientific method.
New York: Macmillan.
Johnson, G., Scholes, K., & Whittington, R. (2005). Exploring corporate strategy: text
and cases (7th ed.). London: Prentice Hall.
Kanter, R. M. (1984). The Change Masters. New York: Simon & Schuster.
Key, J. (2008). Speech to the PSA Congress. Retrieved 19 November, 2008, from
http://johnkey.co.nz/index.php?/archives/475-Speech-to-the-PSA-Congress.html
Khandwalla, P. (1977). The Design of Organizations. New York: Harcourt Brace
Jovanovich.
Kim, D. (1998). The link between individual and organizational learning In D. Klein
(Ed.), The strategic management of intellectual capital (pp. 40-62). Boston:
Butterworth-Heinemann.
Kirzner, I. M. (1973). Competition and Entrepreneurship. Chicago: University of
Chicago Press.
Knight, F. (1967). The Economic Organization. New York: Augustus M. Kelley.
Krosnick, J., & Fabrigar, L. (1997). Designing rating scales for effective measurement in
surveys. In L. Lyberg, P. Biemer, M. Collins, E. de Leeuw, C. Dippo, N. Schwarz
& D. Trewin (Eds.), Survey measurement and process quality (pp. 141-164). New
York: John Wiley & Sons, Inc.
Kuratko, D., Hornsby, J. S., Naffziger, D. W., & Montagno, R. V. (1993). Implement
entrepreneurial thinking in established organizations. SAM Advanced
Management Journal 58(1), 28-33.
57
Kuratko, D., Montagno, R., & Hornsby, J. (1990). Developing an intrapreneurial
assessment instrument for effective corporate entrepreneurial environment.
Strategic Management Journal, 11, 49-58.
Leibenstein, H. (1976). Beyond economic man : a new foundation for microeconomics.
Cambridge: Harvard University Press.
Longenecker, C., & Fink, L. (2006). Closing the management skills gap: a call for action
Development and Learning in Organizations: An International Journal, 20(1), 16-
19.
Lumpkin, G. T., & Dess, G. G. (1996). Clarifying the entrepreneurial orientation
construct and linking it to performance Academy of Management Review, 21(1),
135-172.
Macrae, N. (1976). The coming entrepreneurial revolution: a survey. The Economist.
Maier, R., Hadrich, T., & Peinl, R. (2005). Enterprise knowledge infrastructures. Berlin:
Springer.
Massey University. (2006). Code of ethical conduct for research, teaching and
evaluations involving human participants. Retrieved July, 19, 2007, from
http://humanethics.massey.ac.nz/massey/research/ethics/human-
ethics/code/code.cfm
Md-Nor, M. (1992). A study of American and Malaysian intrapreneurs: Their differences
in intrapreneurial personality, style and climate. Unpublished doctoral
dissertation, Nova University, Florida.
Meyer, J., & Scott, R. (1983). Organizational environments: Ritual and rationality
Beverly Hills, CA: Sage.
Morris, M. (1998). Entrepreneurial intensity: sustainable advantages for individuals,
organisations and societies New York: Quroum Books.
OCED. (2008). OECD Factbook : Economic, Environmental and Social Statistics.
Retrieved 10 September, 2008, from
http://ocde.p4.siteinternet.com/publications/doifiles/01-01-01t1.xls
Oxford (Ed.) (2004) Concise Oxford English Dictionary New York: Oxford University
Press.
Parker, S. (2008, 18 October). Crash course. New Zealand Herald, pp. B1-2.
Pinchot, G. (1985). Intrapreneuring: Why you don't have to leave the corporation to
become an entrepreneur. New York: Harper & Row.
Pinchot, G., & Pellman, R. (1999). Intrapreneuring in action: A handbook for business
innovation. San Francisco: Berrett-Koehler.
Schollhammer, H. (1982). "Internal corporate entrepreneurship," In Encyclopedia of
entrepreneurship. Englewood Cliffs, NJ: Prentice Hall.
Schumpeter, J. (1954). History of economic analysis. New York: Allen & Unwin.
Scott, R. (2003). Organizations. Rational, Natural, and Open Systems. New Jersey:
Prentice Hall.
Senge, P. (1990). The fifth discipline : the art and practice of the learning organisation.
London: Random House.
Seshadri, D., & Tripathy, A. (2006). Innovation through intrapreneurship: The road less
travelled. The Journal for Decision Makers, 31(1), 17-29.
Stager Jacques, R. (2005). From manufacturing-organization "quality" to knowledge-
organization "professional standards". A white paper Aoraki Polytechnic
58
Starkey, K., & Tiratsoo, N. (2007). The business school and the bottom line Cambridge:
Cambridge University Press
stats.govt.nz. (2008). Estimated resident population of New Zealand Retrieved 16
September, 2008, from http://www.stats.govt.nz/populationclock.htm
Sumanth, D. (1998). Total productivity management: a systemic and quantitative
approach to compete in quality, price and time. Boca Raton: St. Lucie Press.
Sundbo, J., & Gallouj, F. (1998). Innovation in services in seven European countries:
synthesis report for European commission. Roskilde University and University of
Lille (Innovation in Services, Services in Innovation), DG XII, TSER-SI4S
Taylor, F. W. (1911). Principles of scientific management. New York: Harper & Row.
Teltumbde, A. (2006). Entrepreneurs and Intrapreneurs in Corporations. Vikalpa: The
Journal for Decision Makers, 31(1), 129-132.
Tushman, M. L., & Nadler, D. A. (1997). Competing by design: the power of
organisational architecture. New York: Oxford University.
Vesper, K. H. (1984). Three faces of corporate entrepreneurship. A pilot study, Frontiers
of entrepreneurship research, Wellesley, MA: Babson College, 294-320.
Weber, M. (1947). The theory of social and economic organization. London: Oxford
University Press.
Young, E. (2006). What Is the Knowledge Economy? Retrieved 19 November, 2008,
from
http://www.med.govt.nz/templates/MultipageDocumentPage____17263.aspx#P10
3_27167
Zahra, S. A. (1991). Predictors and financial outcomes of corporate entrepreneurship: An
exploratory study. Journal of Business Venturing 6(4), 259-285.
Zahra, S. A. (1993). A Conceptual Model of Entrepreneurship as Firm Behavior: A
Critique and Extension. Entrepreneurship: Theory & Practice, 17(4), 5-21.
Zucker, L. (1983). Organizations as institutions. Research in the sociology of
organizations, 2, 1-47.
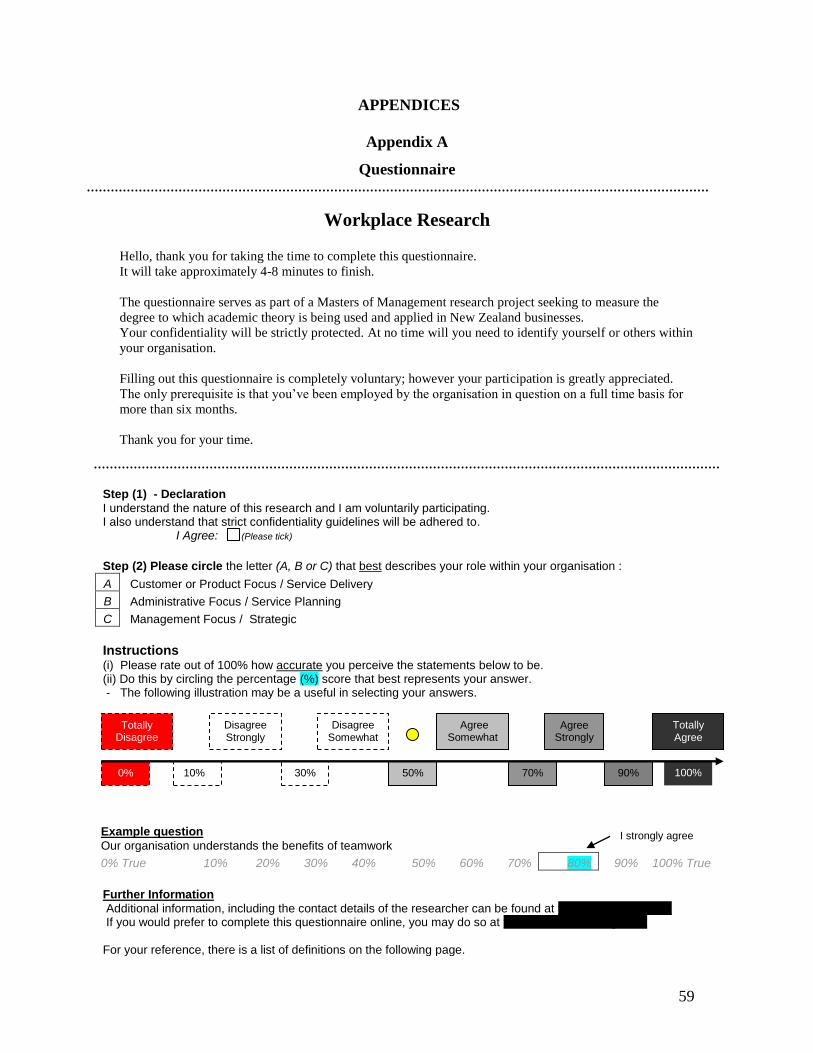
59
APPENDICES
Appendix A
Questionnaire
Workplace Research Hello, thank you for taking the time to complete this questionnaire.
It will take approximately 4-8 minutes to finish.
The questionnaire serves as part of a Masters of Management research project seeking to measure the
degree to which academic theory is being used and applied in New Zealand businesses.
Your confidentiality will be strictly protected. At no time will you need to identify yourself or others within
your organisation.
Filling out this questionnaire is completely voluntary; however your participation is greatly appreciated.
The only prerequisite is that you’ve been employed by the organisation in question on a full time basis for
more than six months.
Thank you for your time.
Step (1) - Declaration
I understand the nature of this research and I am voluntarily participating. I also understand that strict confidentiality guidelines will be adhered to. I Agree: (Please tick)
Step (2) Please circle the letter (A, B or C) that best describes your role within your organisation :
A Customer or Product Focus / Service Delivery
B Administrative Focus / Service Planning
C Management Focus / Strategic
Instructions (i) Please rate out of 100% how accurate you perceive the statements below to be. (ii) Do this by circling the percentage (%) score that best represents your answer. - The following illustration may be a useful in selecting your answers.
Example question
Our organisation understands the benefits of teamwork
0% True 10% 20% 30% 40% 50% 60% 70% 80% 90% 100% True
Further Information
Additional information, including the contact details of the researcher can be found at www.letsinnovate.org If you would prefer to complete this questionnaire online, you may do so at www.letsinnovate.org/5432 For your reference, there is a list of definitions on the following page.
100% 90% 70% 50% 30% 10% 0%
Totally Disagree
Totally Agree
Disagree Strongly
Disagree Somewhat
Agree Somewhat
Agree Strongly
I strongly agree
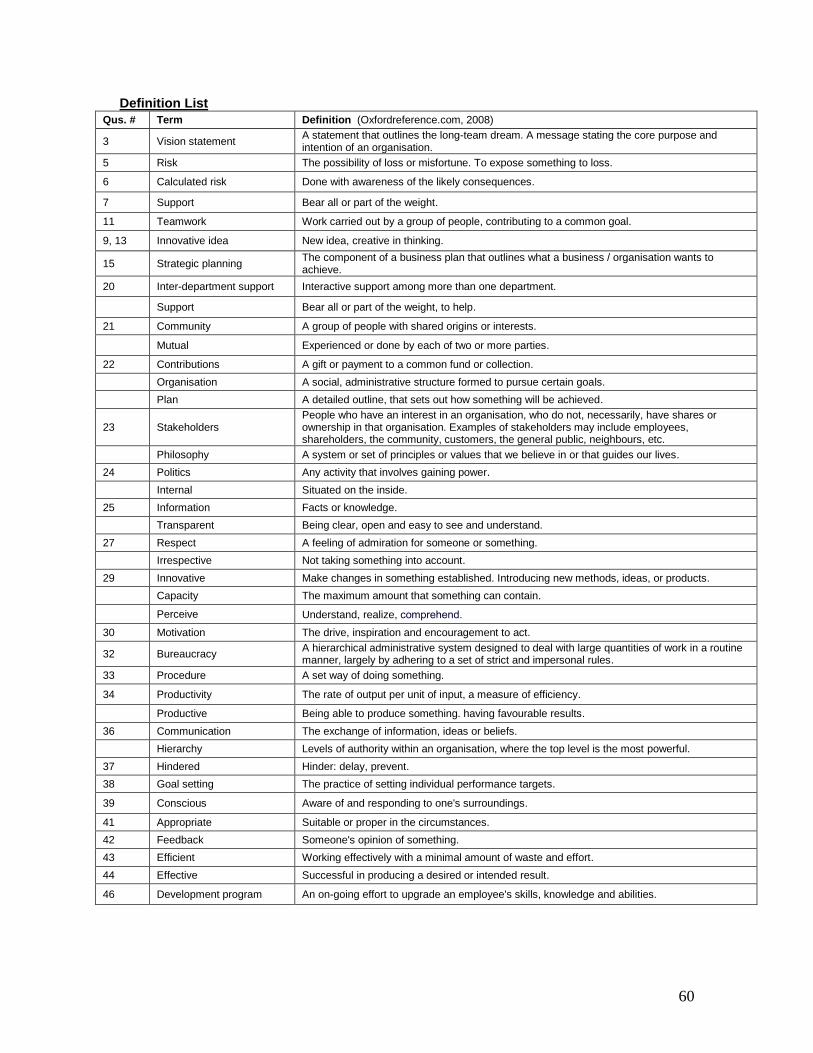
60
Definition List
Qus. # Term Definition (Oxfordreference.com, 2008)
3 Vision statement A statement that outlines the long-team dream. A message stating the core purpose and intention of an organisation.
5 Risk The possibility of loss or misfortune. To expose something to loss.
6 Calculated risk Done with awareness of the likely consequences.
7 Support Bear all or part of the weight.
11 Teamwork Work carried out by a group of people, contributing to a common goal.
9, 13 Innovative idea New idea, creative in thinking.
15 Strategic planning The component of a business plan that outlines what a business / organisation wants to achieve.
20 Inter-department support Interactive support among more than one department.
Support Bear all or part of the weight, to help.
21 Community A group of people with shared origins or interests.
Mutual Experienced or done by each of two or more parties.
22 Contributions A gift or payment to a common fund or collection.
Organisation A social, administrative structure formed to pursue certain goals.
Plan A detailed outline, that sets out how something will be achieved.
23 Stakeholders People who have an interest in an organisation, who do not, necessarily, have shares or ownership in that organisation. Examples of stakeholders may include employees, shareholders, the community, customers, the general public, neighbours, etc.
Philosophy A system or set of principles or values that we believe in or that guides our lives.
24 Politics Any activity that involves gaining power.
Internal Situated on the inside.
25 Information Facts or knowledge.
Transparent Being clear, open and easy to see and understand.
27 Respect A feeling of admiration for someone or something.
Irrespective Not taking something into account.
29 Innovative Make changes in something established. Introducing new methods, ideas, or products.
Capacity The maximum amount that something can contain.
Perceive Understand, realize, comprehend.
30 Motivation The drive, inspiration and encouragement to act.
32 Bureaucracy A hierarchical administrative system designed to deal with large quantities of work in a routine manner, largely by adhering to a set of strict and impersonal rules.
33 Procedure A set way of doing something.
34 Productivity The rate of output per unit of input, a measure of efficiency.
Productive Being able to produce something. having favourable results.
36 Communication The exchange of information, ideas or beliefs.
Hierarchy Levels of authority within an organisation, where the top level is the most powerful.
37 Hindered Hinder: delay, prevent.
38 Goal setting The practice of setting individual performance targets.
39 Conscious Aware of and responding to one's surroundings.
41 Appropriate Suitable or proper in the circumstances.
42 Feedback Someone's opinion of something.
43 Efficient Working effectively with a minimal amount of waste and effort.
44 Effective Successful in producing a desired or intended result.
46 Development program An on-going effort to upgrade an employee's skills, knowledge and abilities.
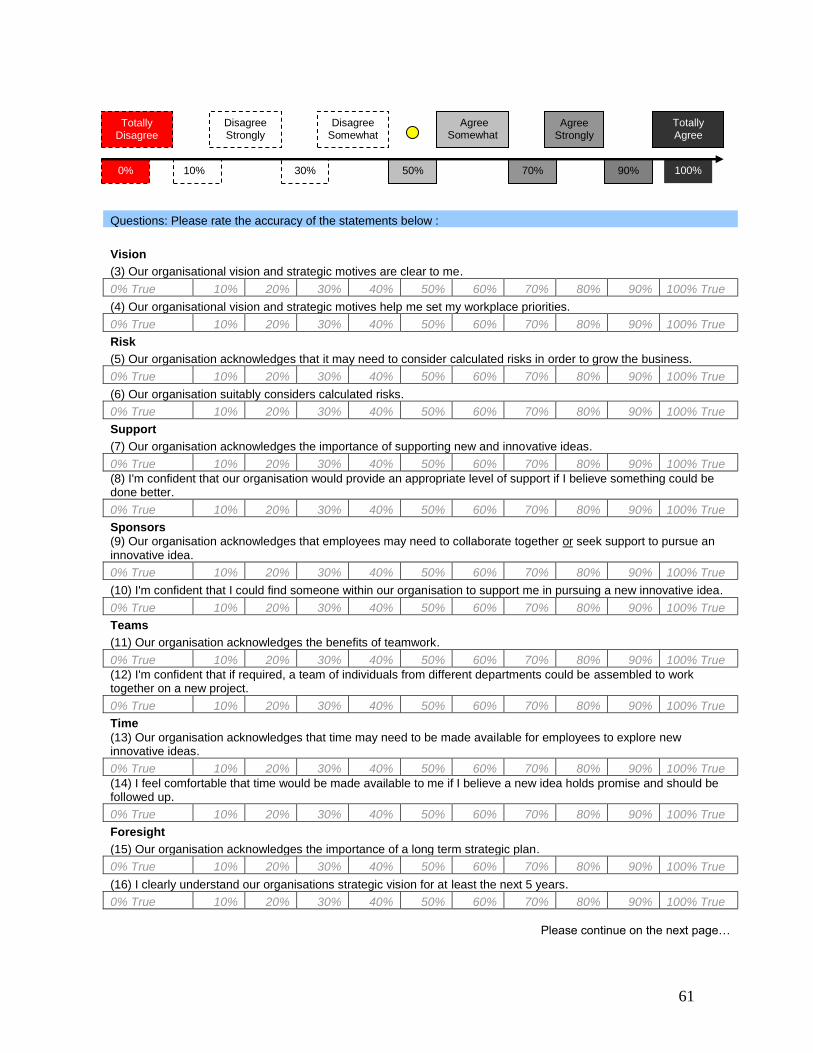
61
Questions: Please rate the accuracy of the statements below :
Vision
(3) Our organisational vision and strategic motives are clear to me.
0% True 10% 20% 30% 40% 50% 60% 70% 80% 90% 100% True
(4) Our organisational vision and strategic motives help me set my workplace priorities.
0% True 10% 20% 30% 40% 50% 60% 70% 80% 90% 100% True
Risk
(5) Our organisation acknowledges that it may need to consider calculated risks in order to grow the business.
0% True 10% 20% 30% 40% 50% 60% 70% 80% 90% 100% True
(6) Our organisation suitably considers calculated risks.
0% True 10% 20% 30% 40% 50% 60% 70% 80% 90% 100% True
Support
(7) Our organisation acknowledges the importance of supporting new and innovative ideas.
0% True 10% 20% 30% 40% 50% 60% 70% 80% 90% 100% True
(8) I'm confident that our organisation would provide an appropriate level of support if I believe something could be done better.
0% True 10% 20% 30% 40% 50% 60% 70% 80% 90% 100% True
Sponsors
(9) Our organisation acknowledges that employees may need to collaborate together or seek support to pursue an innovative idea.
0% True 10% 20% 30% 40% 50% 60% 70% 80% 90% 100% True
(10) I'm confident that I could find someone within our organisation to support me in pursuing a new innovative idea.
0% True 10% 20% 30% 40% 50% 60% 70% 80% 90% 100% True
Teams
(11) Our organisation acknowledges the benefits of teamwork.
0% True 10% 20% 30% 40% 50% 60% 70% 80% 90% 100% True
(12) I'm confident that if required, a team of individuals from different departments could be assembled to work together on a new project.
0% True 10% 20% 30% 40% 50% 60% 70% 80% 90% 100% True
Time
(13) Our organisation acknowledges that time may need to be made available for employees to explore new innovative ideas.
0% True 10% 20% 30% 40% 50% 60% 70% 80% 90% 100% True
(14) I feel comfortable that time would be made available to me if I believe a new idea holds promise and should be followed up.
0% True 10% 20% 30% 40% 50% 60% 70% 80% 90% 100% True
Foresight
(15) Our organisation acknowledges the importance of a long term strategic plan.
0% True 10% 20% 30% 40% 50% 60% 70% 80% 90% 100% True
(16) I clearly understand our organisations strategic vision for at least the next 5 years.
0% True 10% 20% 30% 40% 50% 60% 70% 80% 90% 100% True
Please continue on the next page…
100% 90% 70% 50% 30% 10% 0%
Totally Disagree
Totally Agree
Disagree Strongly
Disagree Somewhat
Agree Somewhat
Agree Strongly
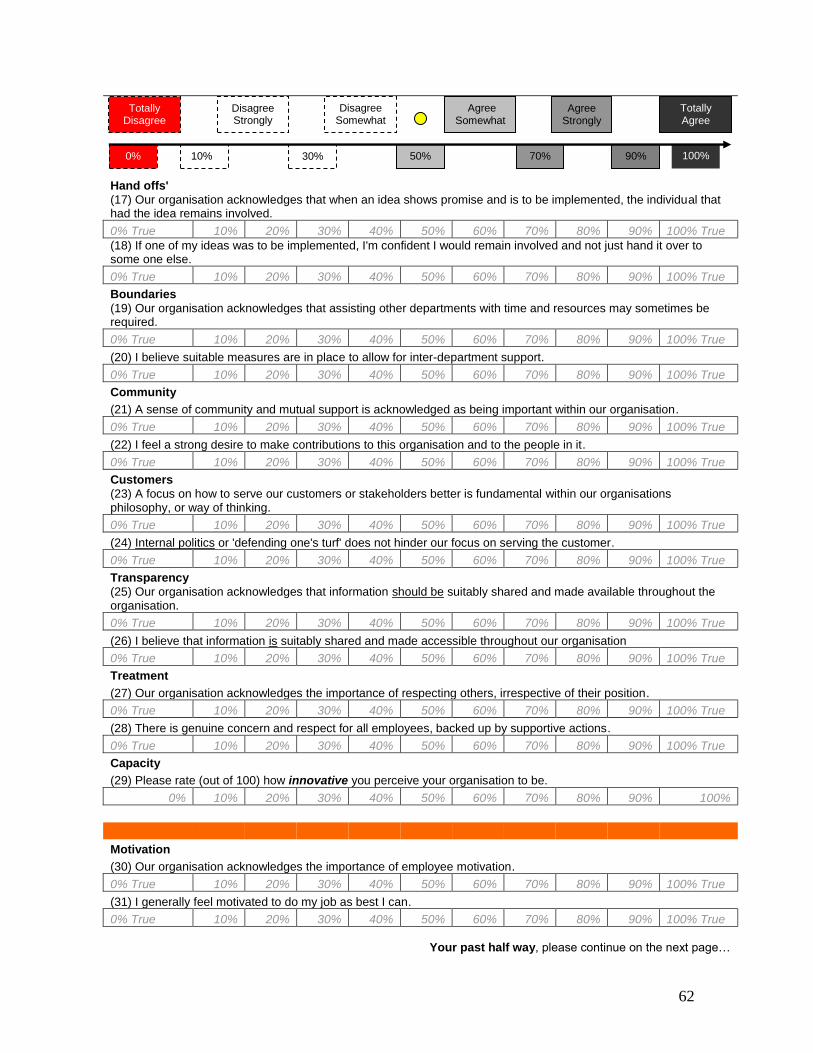
62
Hand offs'
(17) Our organisation acknowledges that when an idea shows promise and is to be implemented, the individual that had the idea remains involved.
0% True 10% 20% 30% 40% 50% 60% 70% 80% 90% 100% True
(18) If one of my ideas was to be implemented, I'm confident I would remain involved and not just hand it over to some one else.
0% True 10% 20% 30% 40% 50% 60% 70% 80% 90% 100% True
Boundaries
(19) Our organisation acknowledges that assisting other departments with time and resources may sometimes be required.
0% True 10% 20% 30% 40% 50% 60% 70% 80% 90% 100% True
(20) I believe suitable measures are in place to allow for inter-department support.
0% True 10% 20% 30% 40% 50% 60% 70% 80% 90% 100% True
Community
(21) A sense of community and mutual support is acknowledged as being important within our organisation.
0% True 10% 20% 30% 40% 50% 60% 70% 80% 90% 100% True
(22) I feel a strong desire to make contributions to this organisation and to the people in it.
0% True 10% 20% 30% 40% 50% 60% 70% 80% 90% 100% True
Customers
(23) A focus on how to serve our customers or stakeholders better is fundamental within our organisations philosophy, or way of thinking.
0% True 10% 20% 30% 40% 50% 60% 70% 80% 90% 100% True
(24) Internal politics or 'defending one's turf' does not hinder our focus on serving the customer.
0% True 10% 20% 30% 40% 50% 60% 70% 80% 90% 100% True
Transparency
(25) Our organisation acknowledges that information should be suitably shared and made available throughout the organisation.
0% True 10% 20% 30% 40% 50% 60% 70% 80% 90% 100% True
(26) I believe that information is suitably shared and made accessible throughout our organisation
0% True 10% 20% 30% 40% 50% 60% 70% 80% 90% 100% True
Treatment
(27) Our organisation acknowledges the importance of respecting others, irrespective of their position.
0% True 10% 20% 30% 40% 50% 60% 70% 80% 90% 100% True
(28) There is genuine concern and respect for all employees, backed up by supportive actions.
0% True 10% 20% 30% 40% 50% 60% 70% 80% 90% 100% True
Capacity
(29) Please rate (out of 100) how innovative you perceive your organisation to be.
0% 10% 20% 30% 40% 50% 60% 70% 80% 90% 100%
Motivation
(30) Our organisation acknowledges the importance of employee motivation.
0% True 10% 20% 30% 40% 50% 60% 70% 80% 90% 100% True
(31) I generally feel motivated to do my job as best I can.
0% True 10% 20% 30% 40% 50% 60% 70% 80% 90% 100% True
Your past half way, please continue on the next page…
100% 90% 70% 50% 30% 10% 0%
Totally Disagree
Totally Agree
Disagree Strongly
Disagree Somewhat
Agree Somewhat
Agree Strongly
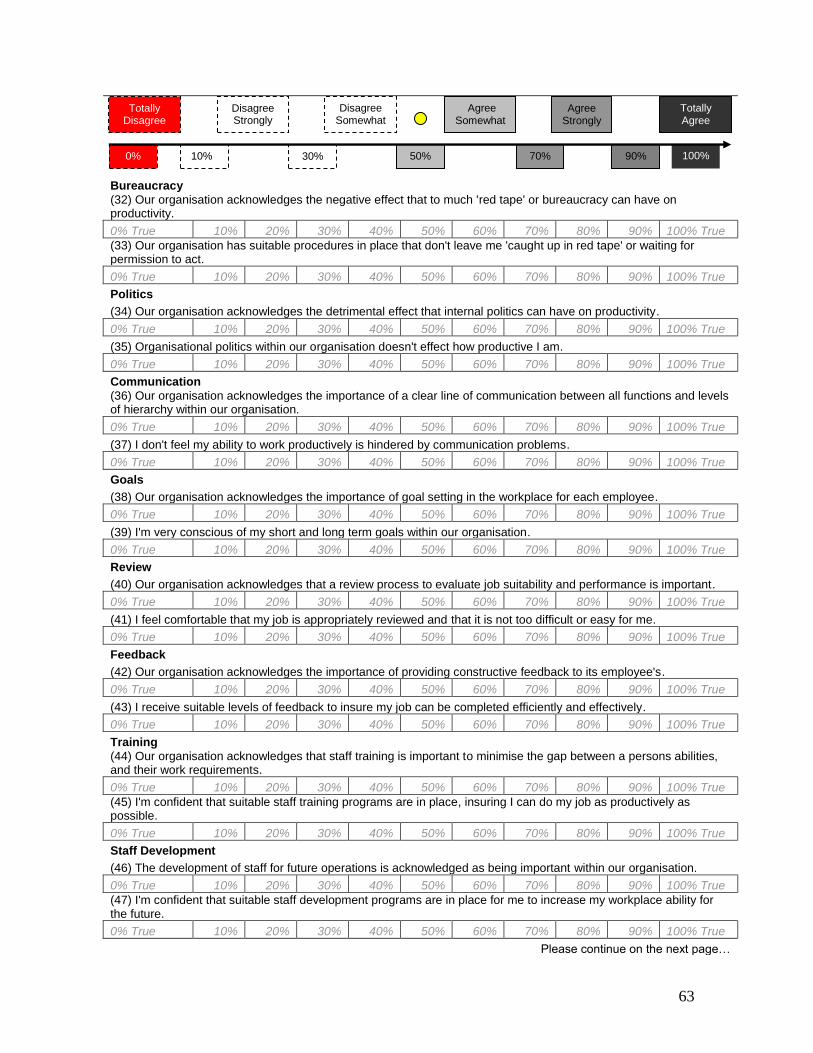
63
Bureaucracy
(32) Our organisation acknowledges the negative effect that to much 'red tape' or bureaucracy can have on productivity.
0% True 10% 20% 30% 40% 50% 60% 70% 80% 90% 100% True
(33) Our organisation has suitable procedures in place that don't leave me 'caught up in red tape' or waiting for permission to act.
0% True 10% 20% 30% 40% 50% 60% 70% 80% 90% 100% True
Politics
(34) Our organisation acknowledges the detrimental effect that internal politics can have on productivity.
0% True 10% 20% 30% 40% 50% 60% 70% 80% 90% 100% True
(35) Organisational politics within our organisation doesn't effect how productive I am.
0% True 10% 20% 30% 40% 50% 60% 70% 80% 90% 100% True
Communication
(36) Our organisation acknowledges the importance of a clear line of communication between all functions and levels of hierarchy within our organisation.
0% True 10% 20% 30% 40% 50% 60% 70% 80% 90% 100% True
(37) I don't feel my ability to work productively is hindered by communication problems.
0% True 10% 20% 30% 40% 50% 60% 70% 80% 90% 100% True
Goals
(38) Our organisation acknowledges the importance of goal setting in the workplace for each employee.
0% True 10% 20% 30% 40% 50% 60% 70% 80% 90% 100% True
(39) I'm very conscious of my short and long term goals within our organisation.
0% True 10% 20% 30% 40% 50% 60% 70% 80% 90% 100% True
Review
(40) Our organisation acknowledges that a review process to evaluate job suitability and performance is important.
0% True 10% 20% 30% 40% 50% 60% 70% 80% 90% 100% True
(41) I feel comfortable that my job is appropriately reviewed and that it is not too difficult or easy for me.
0% True 10% 20% 30% 40% 50% 60% 70% 80% 90% 100% True
Feedback
(42) Our organisation acknowledges the importance of providing constructive feedback to its employee's.
0% True 10% 20% 30% 40% 50% 60% 70% 80% 90% 100% True
(43) I receive suitable levels of feedback to insure my job can be completed efficiently and effectively.
0% True 10% 20% 30% 40% 50% 60% 70% 80% 90% 100% True
Training
(44) Our organisation acknowledges that staff training is important to minimise the gap between a persons abilities, and their work requirements.
0% True 10% 20% 30% 40% 50% 60% 70% 80% 90% 100% True
(45) I'm confident that suitable staff training programs are in place, insuring I can do my job as productively as possible.
0% True 10% 20% 30% 40% 50% 60% 70% 80% 90% 100% True
Staff Development
(46) The development of staff for future operations is acknowledged as being important within our organisation.
0% True 10% 20% 30% 40% 50% 60% 70% 80% 90% 100% True
(47) I'm confident that suitable staff development programs are in place for me to increase my workplace ability for the future.
0% True 10% 20% 30% 40% 50% 60% 70% 80% 90% 100% True
Please continue on the next page…
100% 90% 70% 50% 30% 10% 0%
Totally Disagree
Totally Agree
Disagree Strongly
Disagree Somewhat
Agree Somewhat
Agree Strongly
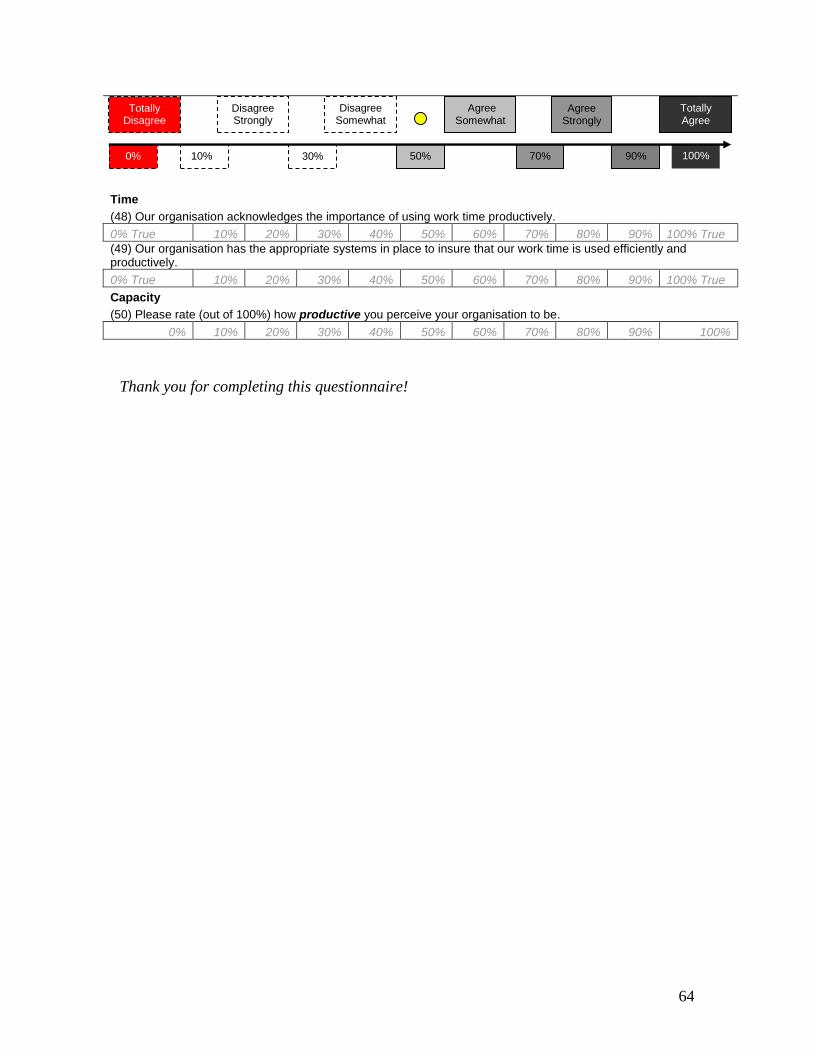
64
Time
(48) Our organisation acknowledges the importance of using work time productively.
0% True 10% 20% 30% 40% 50% 60% 70% 80% 90% 100% True
(49) Our organisation has the appropriate systems in place to insure that our work time is used efficiently and productively.
0% True 10% 20% 30% 40% 50% 60% 70% 80% 90% 100% True
Capacity
(50) Please rate (out of 100%) how productive you perceive your organisation to be.
0% 10% 20% 30% 40% 50% 60% 70% 80% 90% 100%
Thank you for completing this questionnaire!
100% 90% 70% 50% 30% 10% 0%
Totally Disagree
Totally Agree
Disagree Strongly
Disagree Somewhat
Agree Somewhat
Agree Strongly
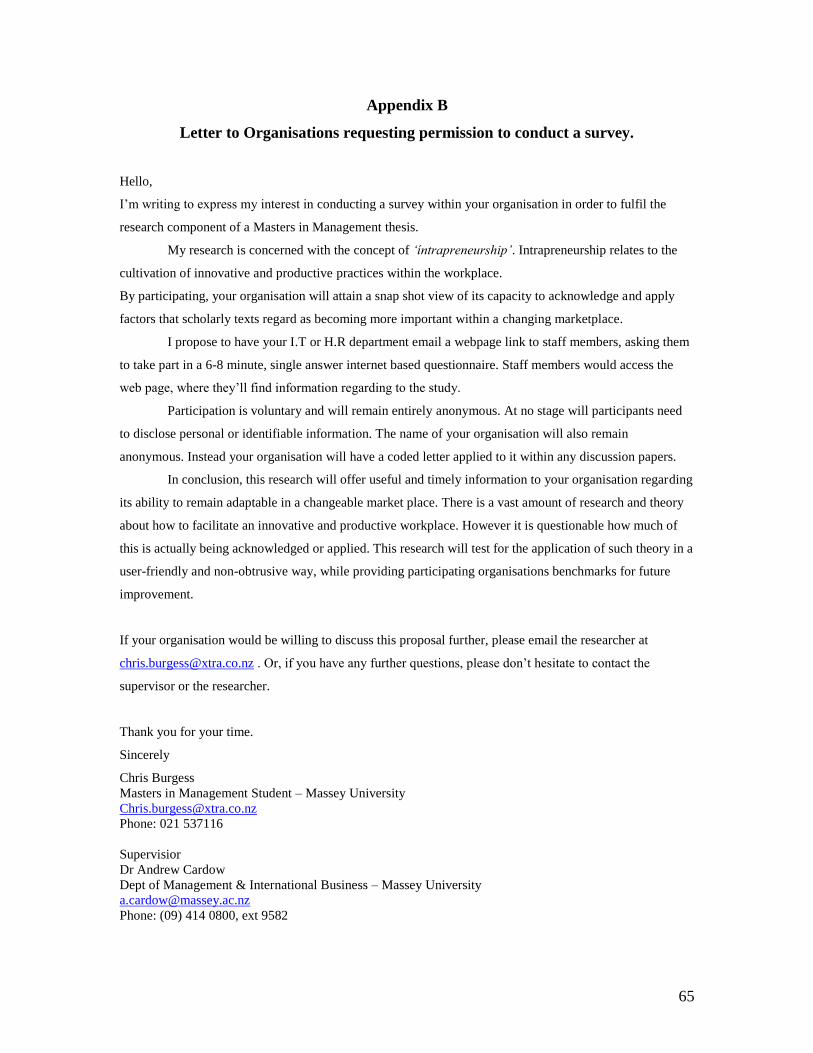
65
Appendix B
Letter to Organisations requesting permission to conduct a survey.
Hello,
I’m writing to express my interest in conducting a survey within your organisation in order to fulfil the
research component of a Masters in Management thesis.
My research is concerned with the concept of ‘íntrapreneurship’. Intrapreneurship relates to the
cultivation of innovative and productive practices within the workplace.
By participating, your organisation will attain a snap shot view of its capacity to acknowledge and apply
factors that scholarly texts regard as becoming more important within a changing marketplace.
I propose to have your I.T or H.R department email a webpage link to staff members, asking them
to take part in a 6-8 minute, single answer internet based questionnaire. Staff members would access the
web page, where they’ll find information regarding to the study.
Participation is voluntary and will remain entirely anonymous. At no stage will participants need
to disclose personal or identifiable information. The name of your organisation will also remain
anonymous. Instead your organisation will have a coded letter applied to it within any discussion papers.
In conclusion, this research will offer useful and timely information to your organisation regarding
its ability to remain adaptable in a changeable market place. There is a vast amount of research and theory
about how to facilitate an innovative and productive workplace. However it is questionable how much of
this is actually being acknowledged or applied. This research will test for the application of such theory in a
user-friendly and non-obtrusive way, while providing participating organisations benchmarks for future
improvement.
If your organisation would be willing to discuss this proposal further, please email the researcher at
[email protected] . Or, if you have any further questions, please don’t hesitate to contact the
supervisor or the researcher.
Thank you for your time.
Sincerely
Chris Burgess
Masters in Management Student – Massey University
Phone: 021 537116
Supervisior
Dr Andrew Cardow
Dept of Management & International Business – Massey University
Phone: (09) 414 0800, ext 9582
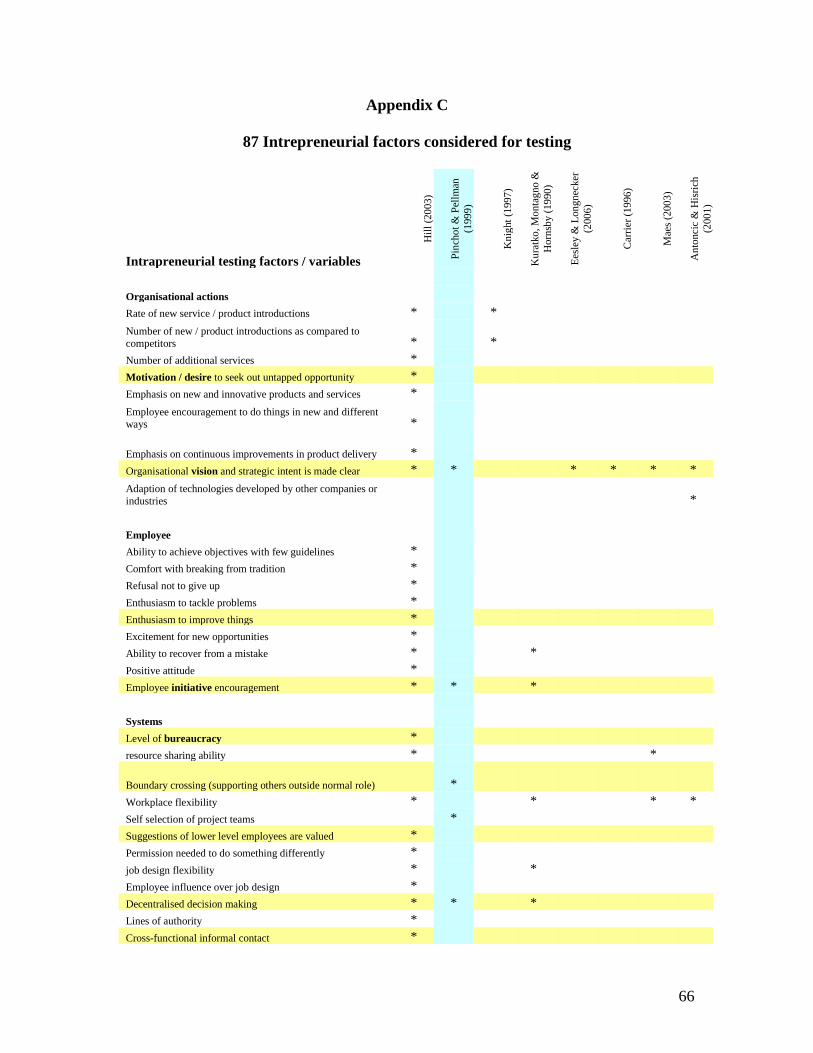
66
Appendix C
87 Intrepreneurial factors considered for testing
Intrapreneurial testing factors / variables
Hil
l (2
003
)
Pin
cho
t &
Pel
lman
(199
9)
Kn
ight
(1997
)
Ku
ratk
o, M
onta
gno
&
Ho
rnsb
y (
19
90
)
Ees
ley &
Lon
gn
ecker
(200
6)
Car
rier
(19
96
)
Mae
s (2
00
3)
An
tonci
c &
His
rich
(200
1)
Organisational actions
Rate of new service / product introductions * *
Number of new / product introductions as compared to
competitors * *
Number of additional services *
Motivation / desire to seek out untapped opportunity *
Emphasis on new and innovative products and services *
Employee encouragement to do things in new and different
ways *
Emphasis on continuous improvements in product delivery *
Organisational vision and strategic intent is made clear * * * * * *
Adaption of technologies developed by other companies or
industries *
Employee
Ability to achieve objectives with few guidelines *
Comfort with breaking from tradition *
Refusal not to give up *
Enthusiasm to tackle problems *
Enthusiasm to improve things *
Excitement for new opportunities *
Ability to recover from a mistake * *
Positive attitude *
Employee initiative encouragement * * *
Systems
Level of bureaucracy *
resource sharing ability * *
Boundary crossing (supporting others outside normal role) *
Workplace flexibility * * * *
Self selection of project teams *
Suggestions of lower level employees are valued *
Permission needed to do something differently *
job design flexibility * *
Employee influence over job design *
Decentralised decision making * * *
Lines of authority *
Cross-functional informal contact *
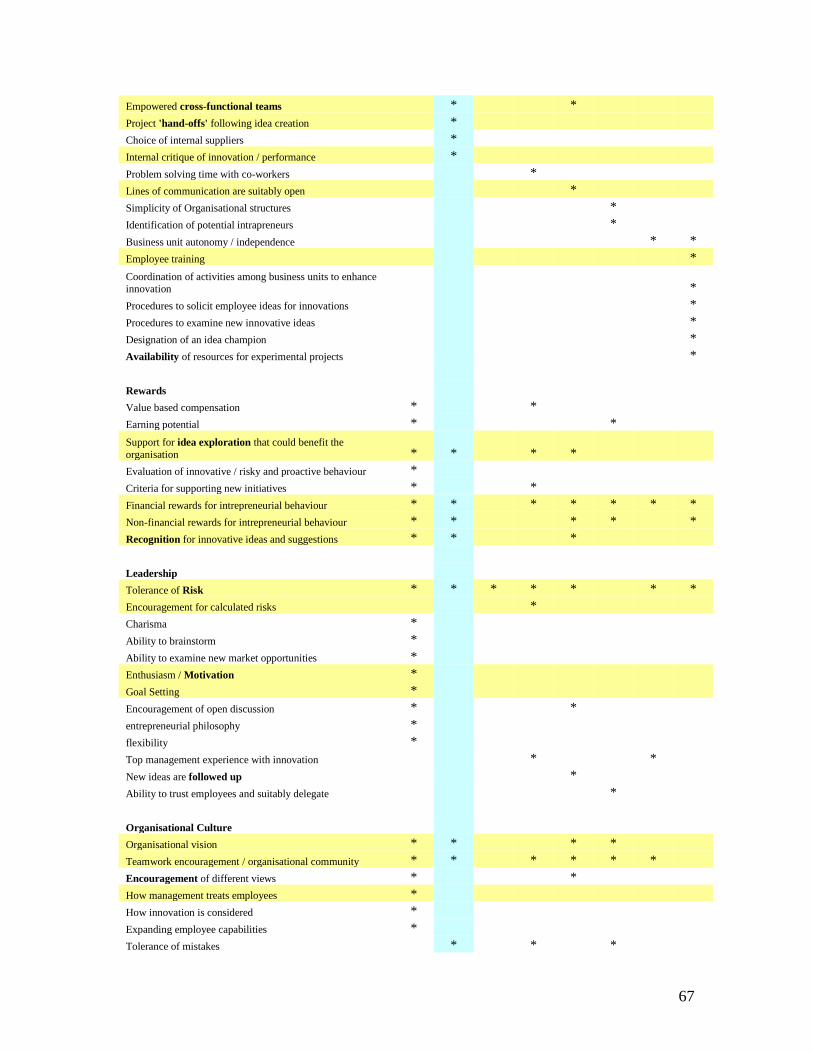
67
Empowered cross-functional teams * *
Project 'hand-offs' following idea creation *
Choice of internal suppliers *
Internal critique of innovation / performance *
Problem solving time with co-workers *
Lines of communication are suitably open *
Simplicity of Organisational structures *
Identification of potential intrapreneurs *
Business unit autonomy / independence * *
Employee training *
Coordination of activities among business units to enhance
innovation *
Procedures to solicit employee ideas for innovations *
Procedures to examine new innovative ideas *
Designation of an idea champion *
Availability of resources for experimental projects *
Rewards
Value based compensation * *
Earning potential * *
Support for idea exploration that could benefit the
organisation * * * *
Evaluation of innovative / risky and proactive behaviour *
Criteria for supporting new initiatives * *
Financial rewards for intrepreneurial behaviour * * * * * * *
Non-financial rewards for intrepreneurial behaviour * * * * *
Recognition for innovative ideas and suggestions * * *
Leadership
Tolerance of Risk * * * * * * *
Encouragement for calculated risks *
Charisma *
Ability to brainstorm *
Ability to examine new market opportunities *
Enthusiasm / Motivation *
Goal Setting *
Encouragement of open discussion * *
entrepreneurial philosophy *
flexibility *
Top management experience with innovation * *
New ideas are followed up *
Ability to trust employees and suitably delegate *
Organisational Culture
Organisational vision * * * *
Teamwork encouragement / organisational community * * * * * *
Encouragement of different views * *
How management treats employees *
How innovation is considered *
Expanding employee capabilities *
Tolerance of mistakes * * *
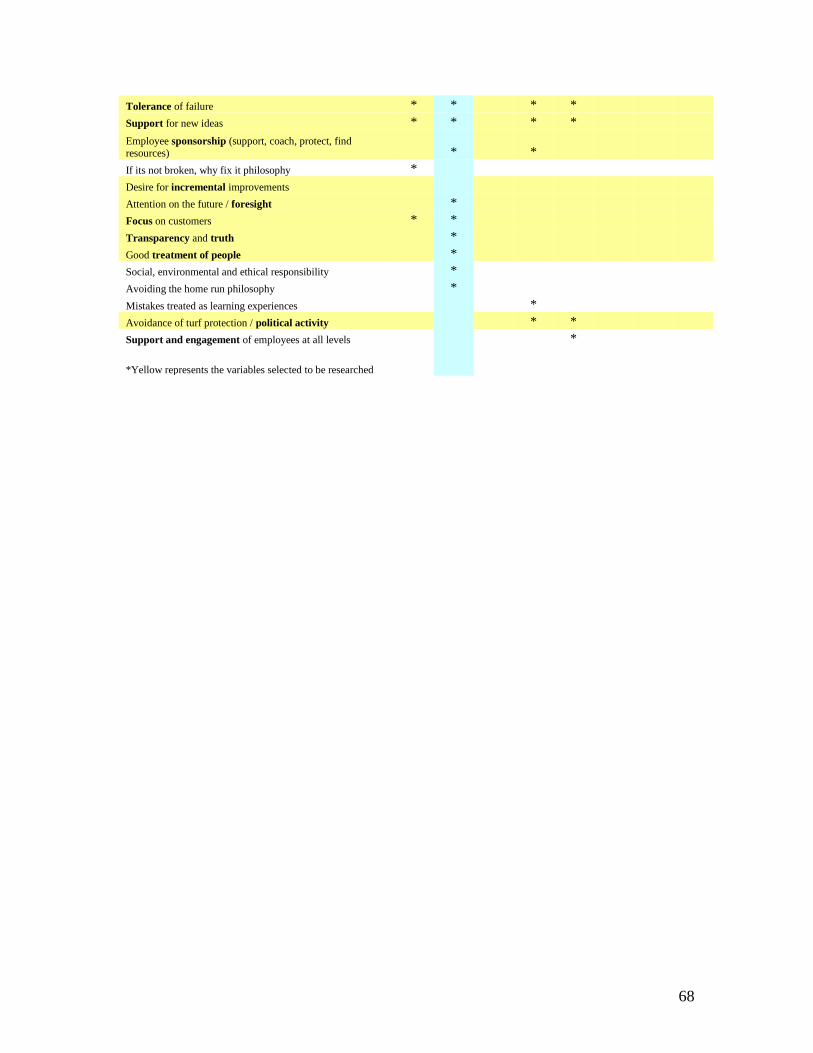
68
Tolerance of failure * * * *
Support for new ideas * * * *
Employee sponsorship (support, coach, protect, find resources) * *
If its not broken, why fix it philosophy *
Desire for incremental improvements
Attention on the future / foresight *
Focus on customers * *
Transparency and truth *
Good treatment of people *
Social, environmental and ethical responsibility *
Avoiding the home run philosophy *
Mistakes treated as learning experiences *
Avoidance of turf protection / political activity * *
Support and engagement of employees at all levels *
*Yellow represents the variables selected to be researched
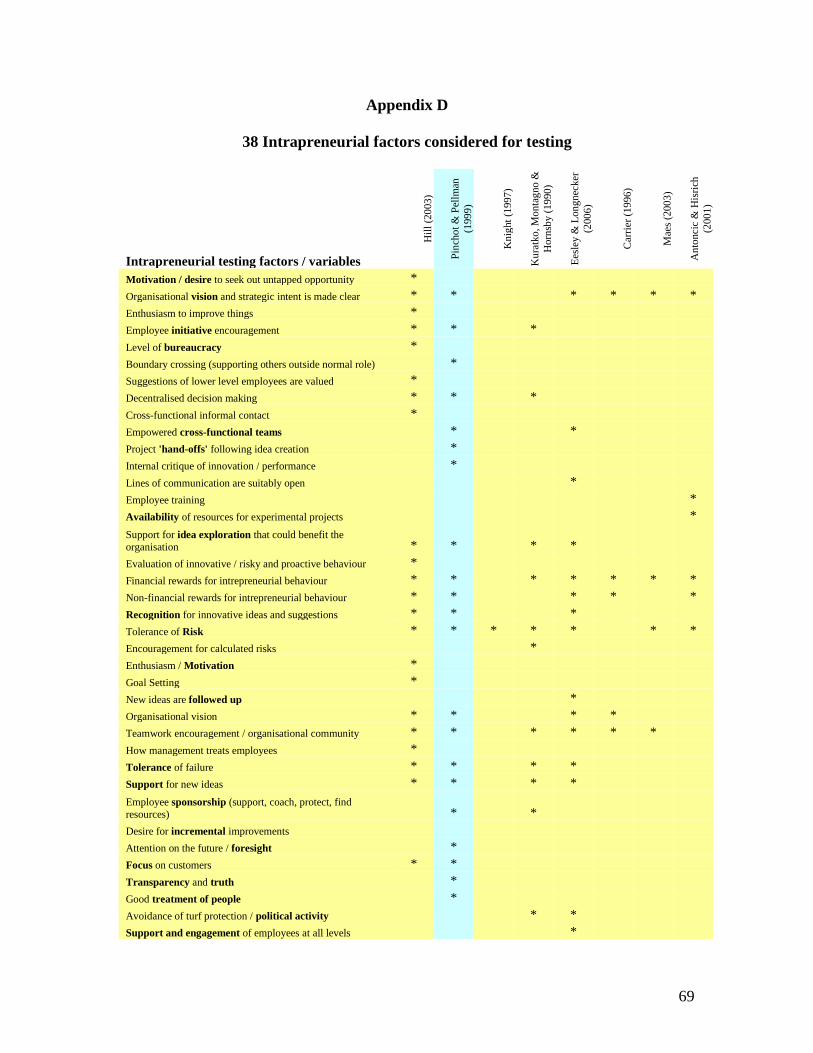
69
Appendix D
38 Intrapreneurial factors considered for testing
Intrapreneurial testing factors / variables
Hil
l (2
003
)
Pin
cho
t &
Pel
lman
(199
9)
Kn
ight
(1997
)
Ku
ratk
o, M
onta
gno
&
Ho
rnsb
y (
19
90
)
Ees
ley &
Lon
gn
ecker
(200
6)
Car
rier
(19
96
)
Mae
s (2
00
3)
An
tonci
c &
His
rich
(200
1)
Motivation / desire to seek out untapped opportunity *
Organisational vision and strategic intent is made clear * * * * * *
Enthusiasm to improve things *
Employee initiative encouragement * * *
Level of bureaucracy *
Boundary crossing (supporting others outside normal role) *
Suggestions of lower level employees are valued *
Decentralised decision making * * *
Cross-functional informal contact *
Empowered cross-functional teams * *
Project 'hand-offs' following idea creation *
Internal critique of innovation / performance *
Lines of communication are suitably open *
Employee training *
Availability of resources for experimental projects *
Support for idea exploration that could benefit the
organisation * * * *
Evaluation of innovative / risky and proactive behaviour *
Financial rewards for intrepreneurial behaviour * * * * * * *
Non-financial rewards for intrepreneurial behaviour * * * * *
Recognition for innovative ideas and suggestions * * *
Tolerance of Risk * * * * * * *
Encouragement for calculated risks *
Enthusiasm / Motivation *
Goal Setting *
New ideas are followed up *
Organisational vision * * * *
Teamwork encouragement / organisational community * * * * * *
How management treats employees *
Tolerance of failure * * * *
Support for new ideas * * * *
Employee sponsorship (support, coach, protect, find
resources) * *
Desire for incremental improvements
Attention on the future / foresight *
Focus on customers * *
Transparency and truth *
Good treatment of people *
Avoidance of turf protection / political activity * *
Support and engagement of employees at all levels *
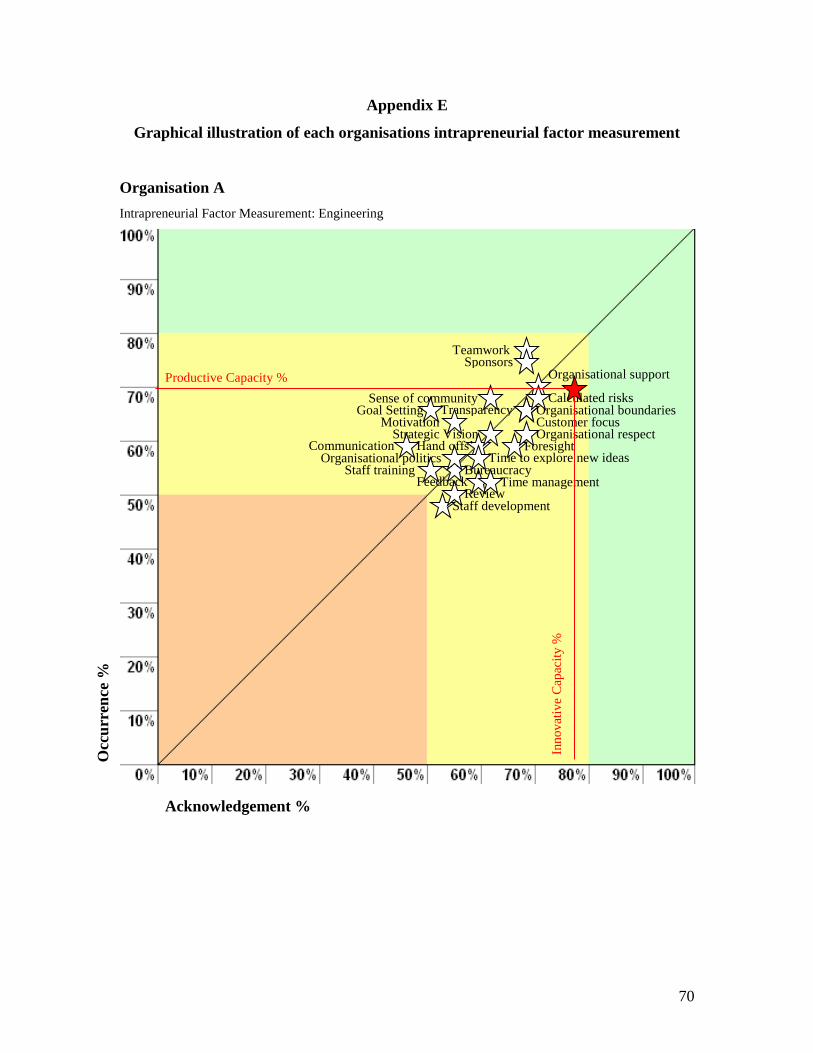
70
Appendix E
Graphical illustration of each organisations intrapreneurial factor measurement
Organisation A
Intrapreneurial Factor Measurement: Engineering
Organisational boundaries
Foresight Time to explore new ideas
Customer focus
Acknowledgement %
Occ
urr
ence
%
Organisational support
Calculated risks
Strategic Vision
Sense of community
Teamwork Sponsors
Hand offs’ Organisational politics
Time management Bureaucracy
Motivation Organisational respect
Transparency
Staff development
Staff training Feedback
Review
Goal Setting
Communication
Productive Capacity %
Inn
ov
ativ
e C
apac
ity
%
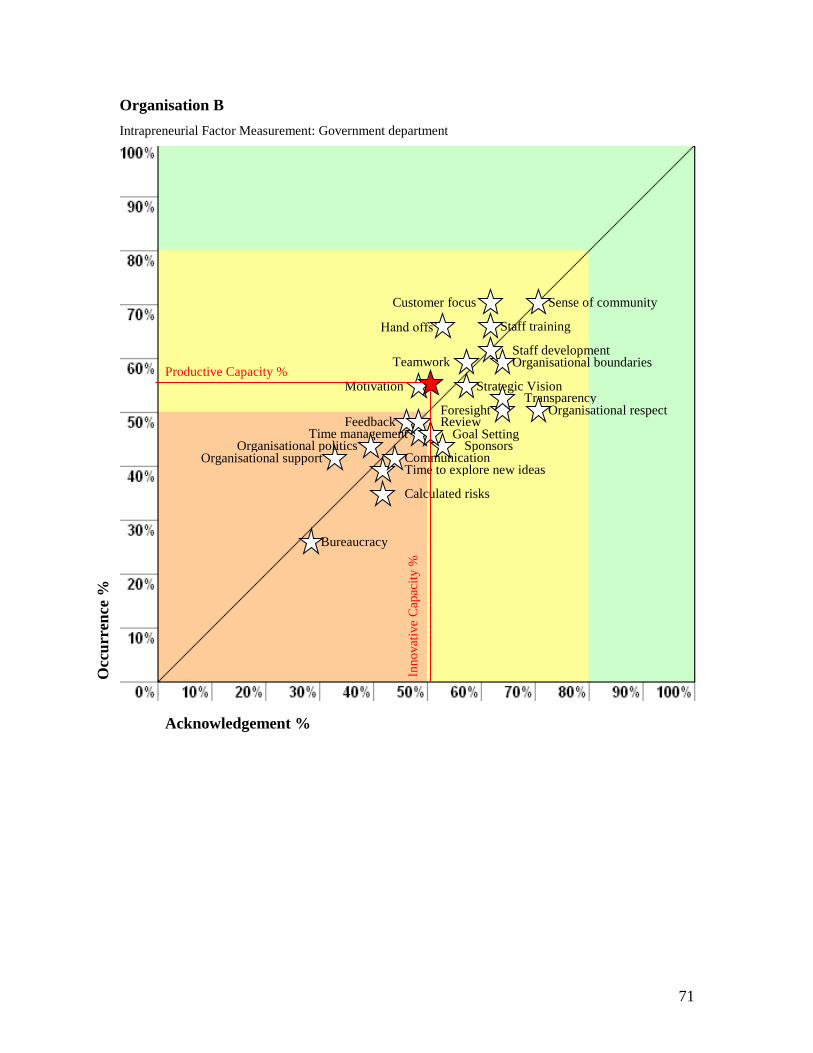
71
Organisation B
Intrapreneurial Factor Measurement: Government department
Acknowledgement %
Occ
urr
ence
%
Organisational support
Calculated risks
Strategic Vision
Sense of community
Organisational boundaries
Foresight
Teamwork
Sponsors
Time to explore new ideas
Hand offs’
Customer focus
Organisational politics Time management
Bureaucracy
Motivation
Organisational respect Transparency
Staff development
Staff training
Feedback Review Goal Setting
Communication
Productive Capacity %
Inn
ov
ativ
e C
apac
ity
%
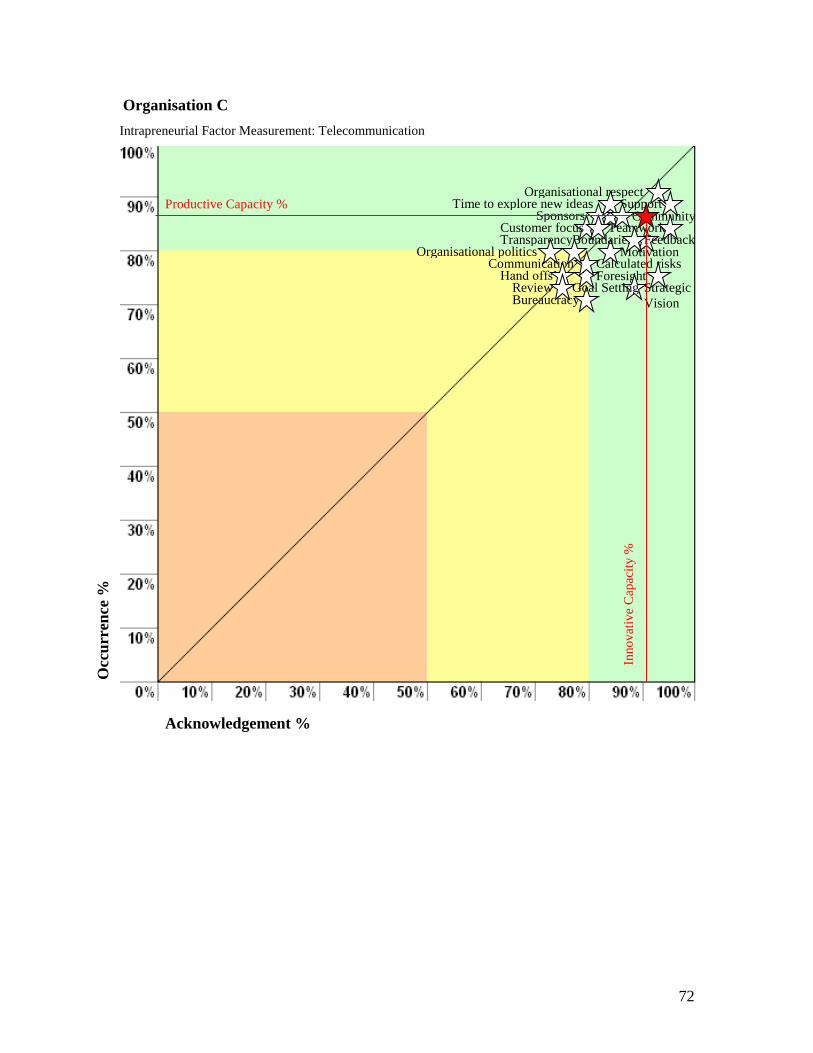
72
Organisation C
Intrapreneurial Factor Measurement: Telecommunication
Bureaucracy
Acknowledgement %
Occ
urr
ence
%
Support
Calculated risks
Strategic
Vision
Community
Boundaries
Foresight
Teamwork Sponsors
Time to explore new ideas
Hand offs’
Customer focus
Organisational politics Motivation
Organisational respect
Transparency Feedback
Review Goal Setting
Communication
Productive Capacity %
Inn
ov
ativ
e C
apac
ity
%
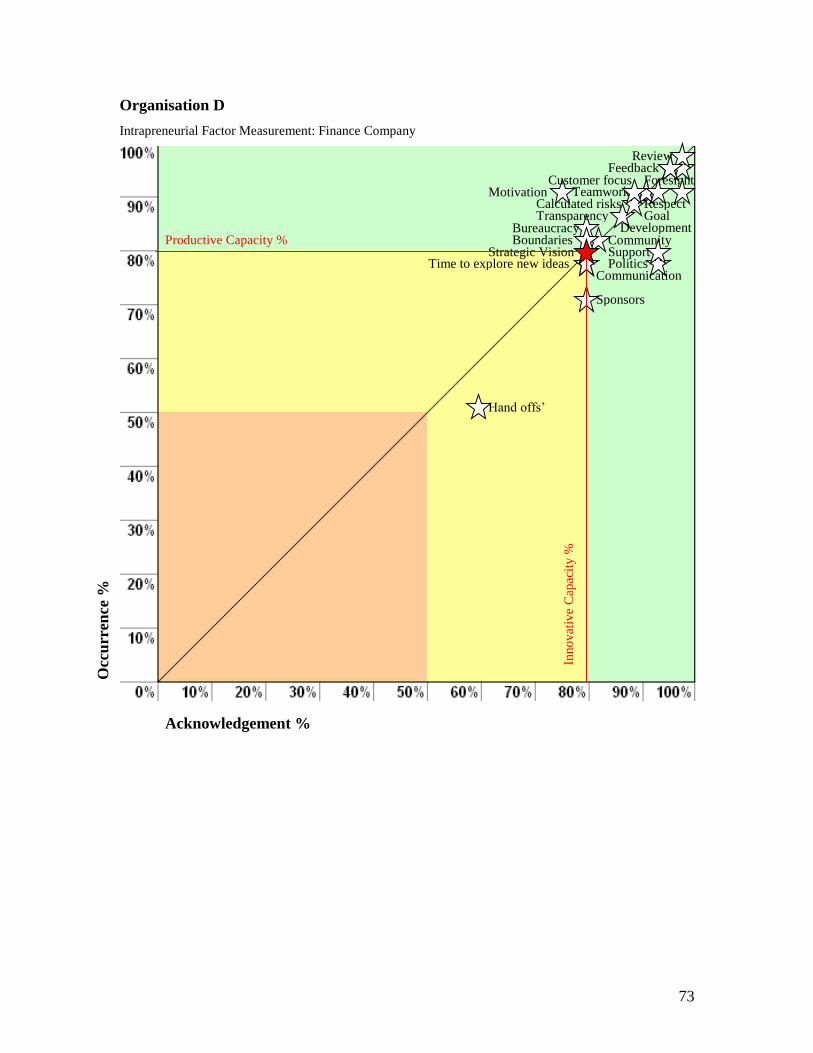
73
Organisation D
Intrapreneurial Factor Measurement: Finance Company
Acknowledgement %
Occ
urr
ence
%
Support
Calculated risks
Strategic Vision Community Boundaries
Foresight Teamwork
Sponsors
Time to explore new ideas
Hand offs’
Customer focus
Politics
Bureaucracy
Motivation Respect
Transparency Development
Feedback Review
Goal
Communication
Productive Capacity %
Inn
ov
ativ
e C
apac
ity
%
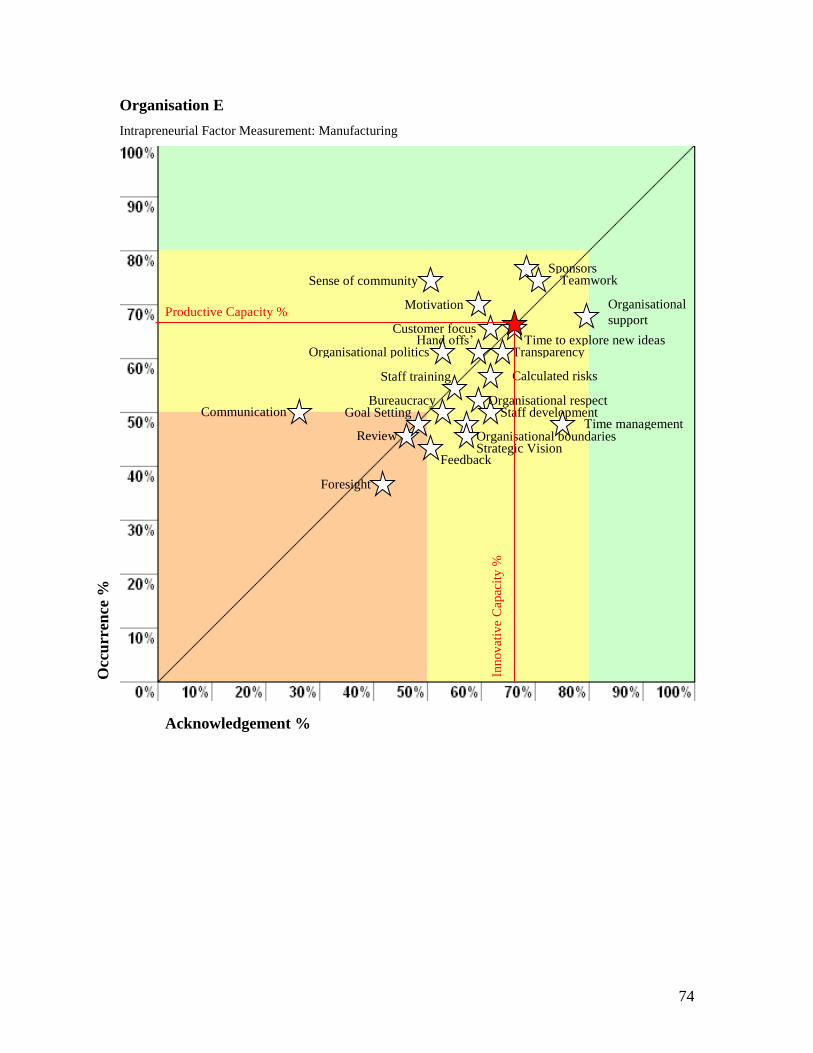
74
Organisation E
Intrapreneurial Factor Measurement: Manufacturing
Acknowledgement %
Occ
urr
ence
%
Organisational
support
Calculated risks
Strategic Vision
Sense of community
Organisational boundaries
Foresight
Teamwork Sponsors
Time to explore new ideas Hand offs’ Customer focus
Organisational politics
Time management
Bureaucracy
Motivation
Organisational respect
Transparency
Staff development
Staff training
Feedback
Review
Goal Setting Communication
Productive Capacity %
Inn
ov
ativ
e C
apac
ity
%
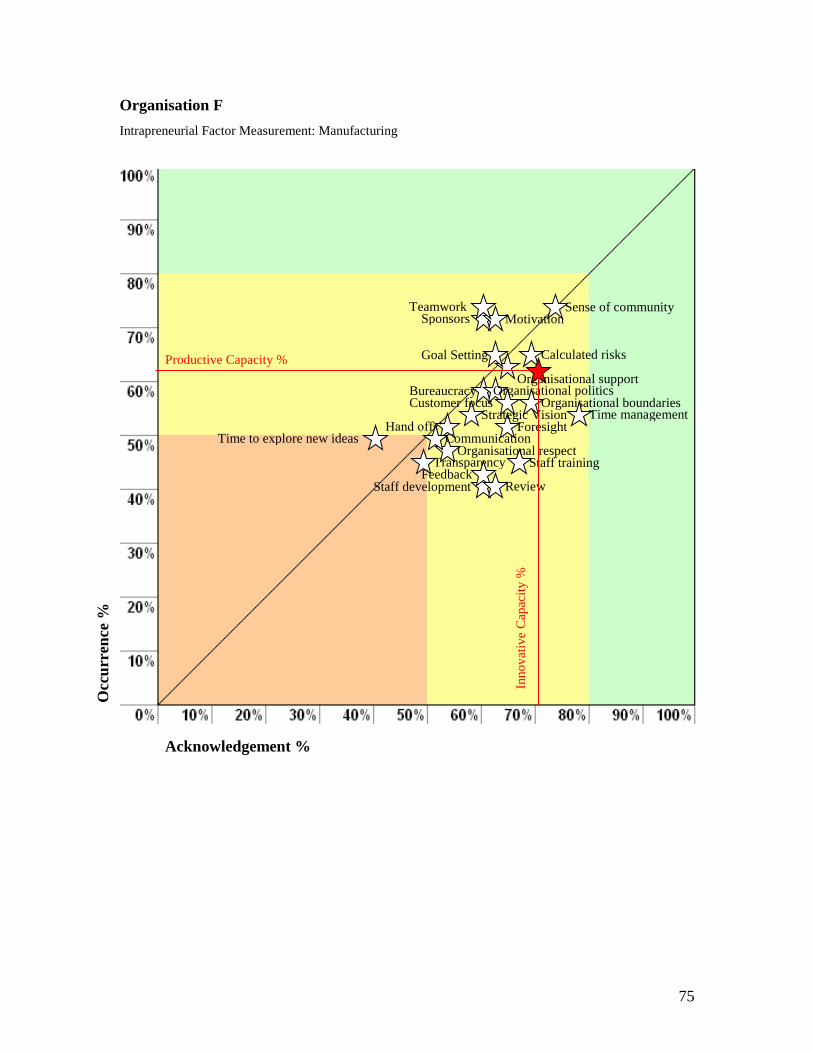
75
Organisation F
Intrapreneurial Factor Measurement: Manufacturing
Acknowledgement %
Occ
urr
ence
%
Organisational support
Calculated risks
Strategic Vision Organisational boundaries
Foresight
Teamwork Sponsors
Time to explore new ideas Hand offs’
Organisational politics
Time management
Bureaucracy
Organisational respect Transparency
Staff development
Staff training Feedback
Review
Goal Setting
Communication
Sense of community
Customer focus
Motivation
Productive Capacity %
Inn
ov
ativ
e C
apac
ity
%
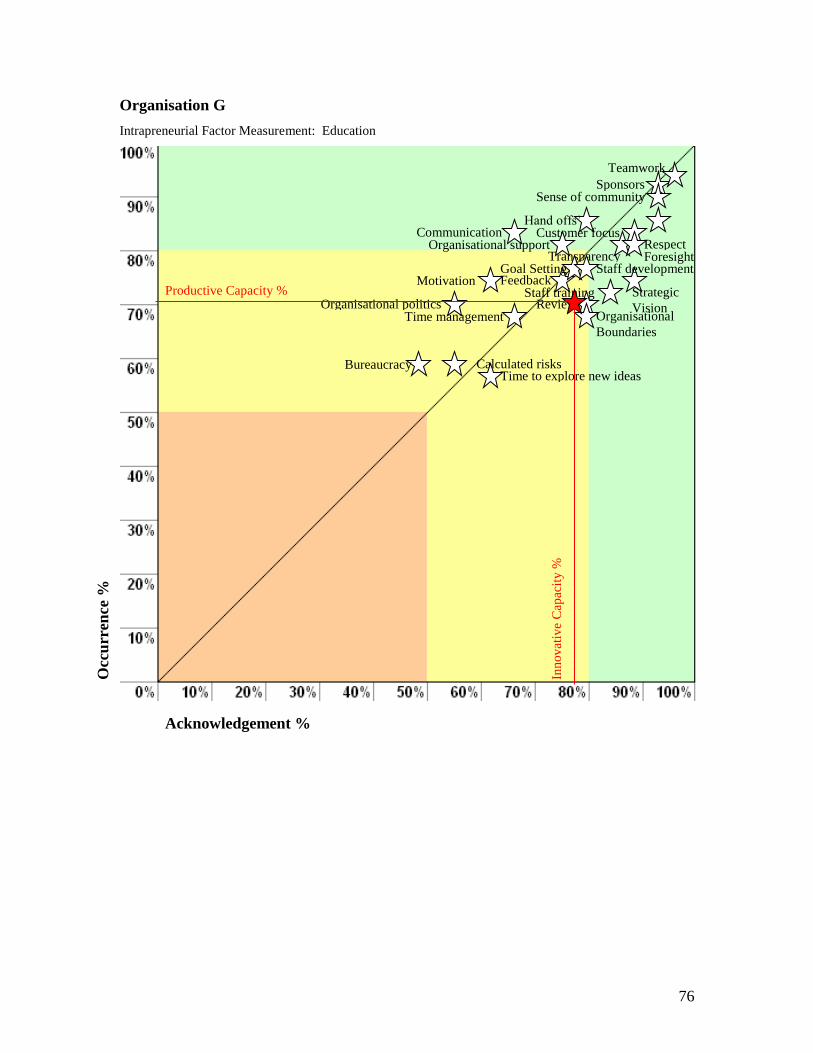
76
Organisation G
Intrapreneurial Factor Measurement: Education
Staff training
Acknowledgement %
Occ
urr
ence
%
Organisational support
Calculated risks
Strategic
Vision
Sense of community
Organisational
Boundaries
Foresight
Teamwork
Sponsors
Time to explore new ideas
Hand offs’ Customer focus
Organisational politics Time management
Bureaucracy
Motivation
Respect Transparency
Staff development Feedback
Review
Goal Setting
Communication
Productive Capacity %
Inn
ov
ativ
e C
apac
ity
%
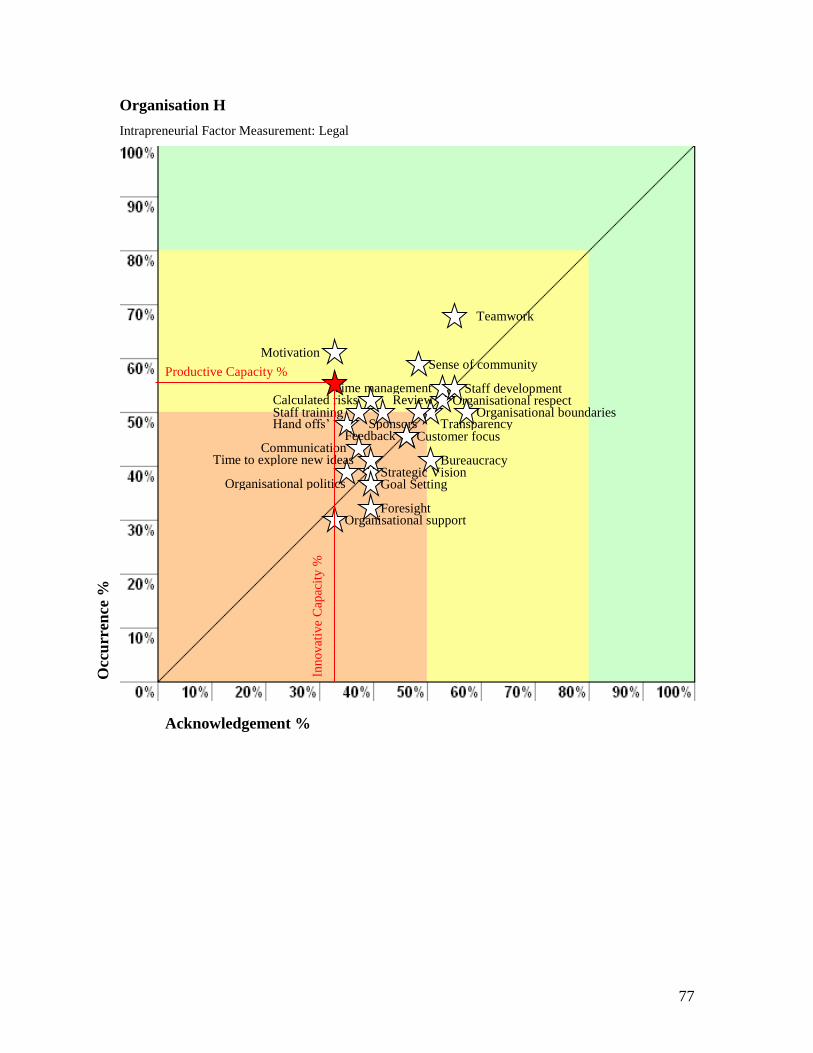
77
Organisation H
Intrapreneurial Factor Measurement: Legal
Acknowledgement %
Occ
urr
ence
%
Organisational support
Calculated risks
Strategic Vision
Sense of community
Organisational boundaries
Foresight
Teamwork
Sponsors
Time to explore new ideas
Hand offs’ Customer focus
Organisational politics
Time management
Bureaucracy
Motivation
Organisational respect
Transparency
Staff development
Staff training
Feedback
Review
Goal Setting
Communication
Productive Capacity %
Inn
ov
ativ
e C
apac
ity
%
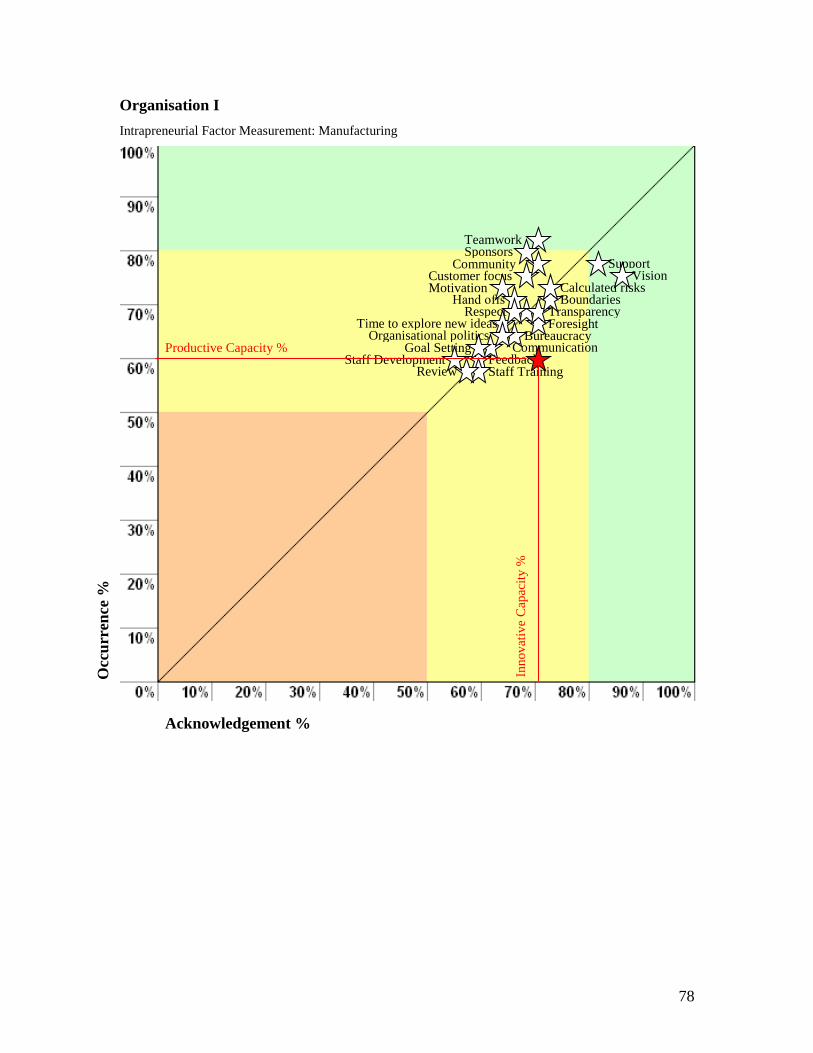
78
Organisation I
Intrapreneurial Factor Measurement: Manufacturing
Hand offs’
Customer focus
Acknowledgement %
Occ
urr
ence
%
Support
Calculated risks Vision
Community
Boundaries
Foresight
Teamwork Sponsors
Time to explore new ideas Organisational politics Bureaucracy
Motivation
Respect Transparency
Staff Development Staff Training Feedback
Review
Goal Setting Communication Productive Capacity %
Inn
ov
ativ
e C
apac
ity
%
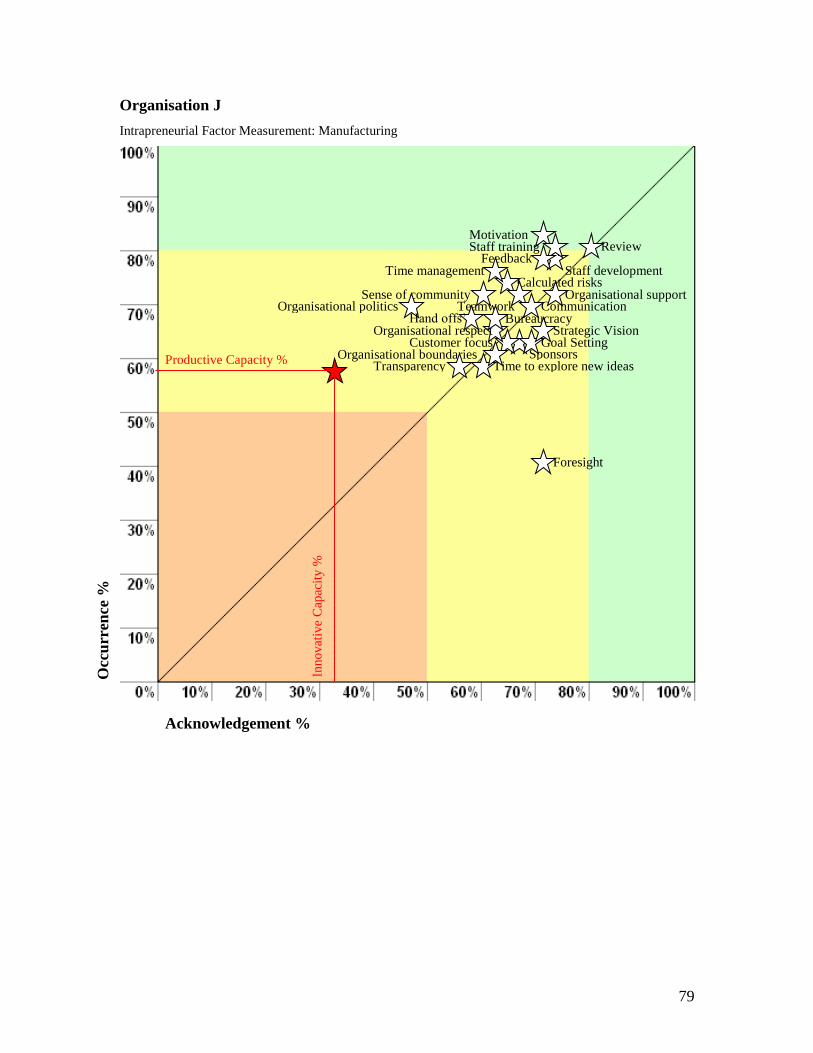
79
Organisation J
Intrapreneurial Factor Measurement: Manufacturing
Acknowledgement %
Occ
urr
ence
%
Organisational support Calculated risks
Strategic Vision
Sense of community
Organisational boundaries
Foresight
Teamwork
Sponsors Time to explore new ideas
Hand offs’
Customer focus
Organisational politics
Time management
Bureaucracy
Motivation
Organisational respect
Transparency
Staff development
Staff training Feedback
Review
Goal Setting
Communication
Productive Capacity %
Inn
ov
ativ
e C
apac
ity
%
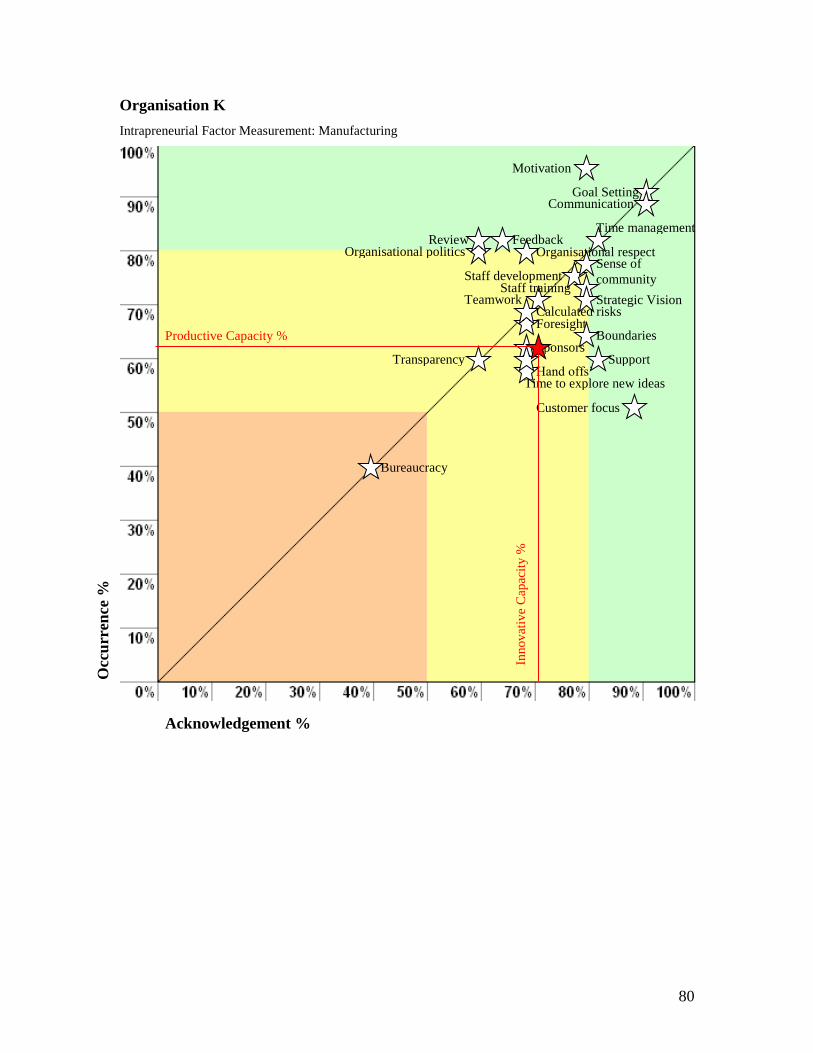
80
Organisation K
Intrapreneurial Factor Measurement: Manufacturing
Acknowledgement %
Occ
urr
ence
%
Support
Calculated risks Strategic Vision
Sense of
community
Boundaries Foresight
Teamwork
Sponsors
Time to explore new ideas Hand offs’
Customer focus
Organisational politics
Time management
Bureaucracy
Motivation
Organisational respect
Transparency
Staff development Staff training
Feedback Review
Goal Setting Communication
Productive Capacity %
Inn
ov
ativ
e C
apac
ity
%
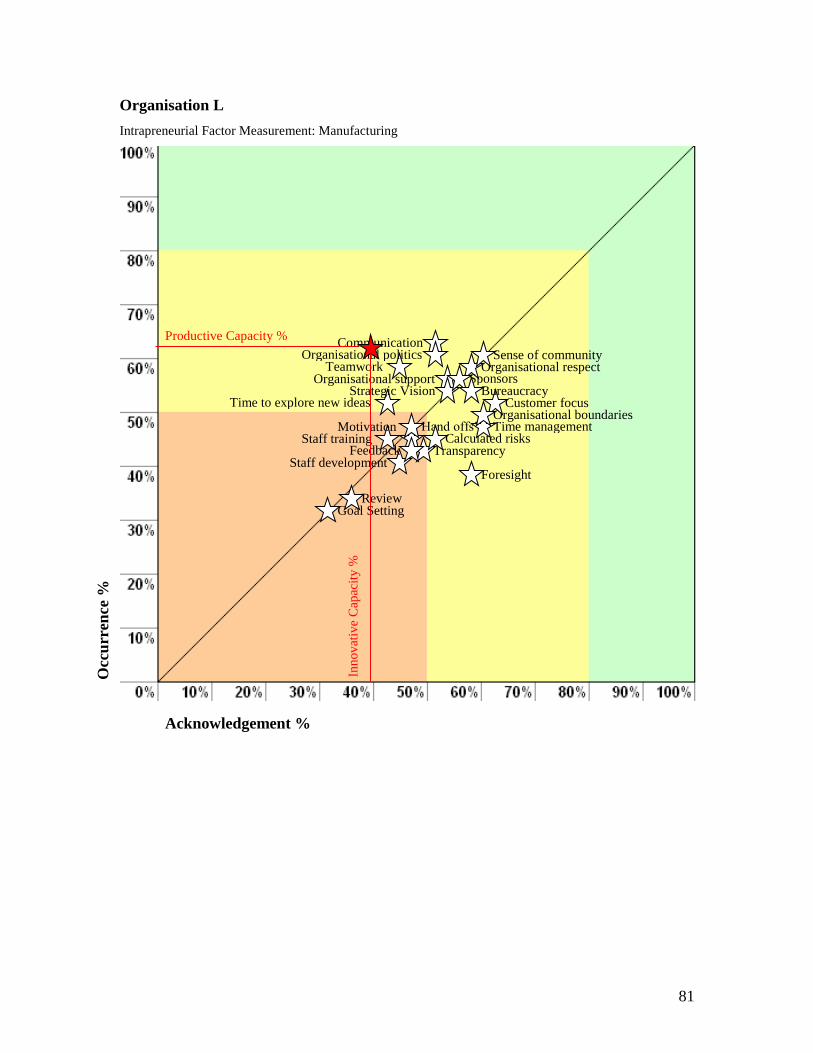
81
Organisation L
Intrapreneurial Factor Measurement: Manufacturing
Acknowledgement %
Occ
urr
ence
%
Organisational support
Calculated risks
Strategic Vision
Sense of community
Organisational boundaries
Foresight
Teamwork Sponsors
Time to explore new ideas
Hand offs’
Customer focus
Organisational politics
Time management
Bureaucracy
Motivation
Organisational respect
Transparency Staff development
Staff training Feedback
Review Goal Setting
Communication Productive Capacity %
Inn
ov
ativ
e C
apac
ity
%
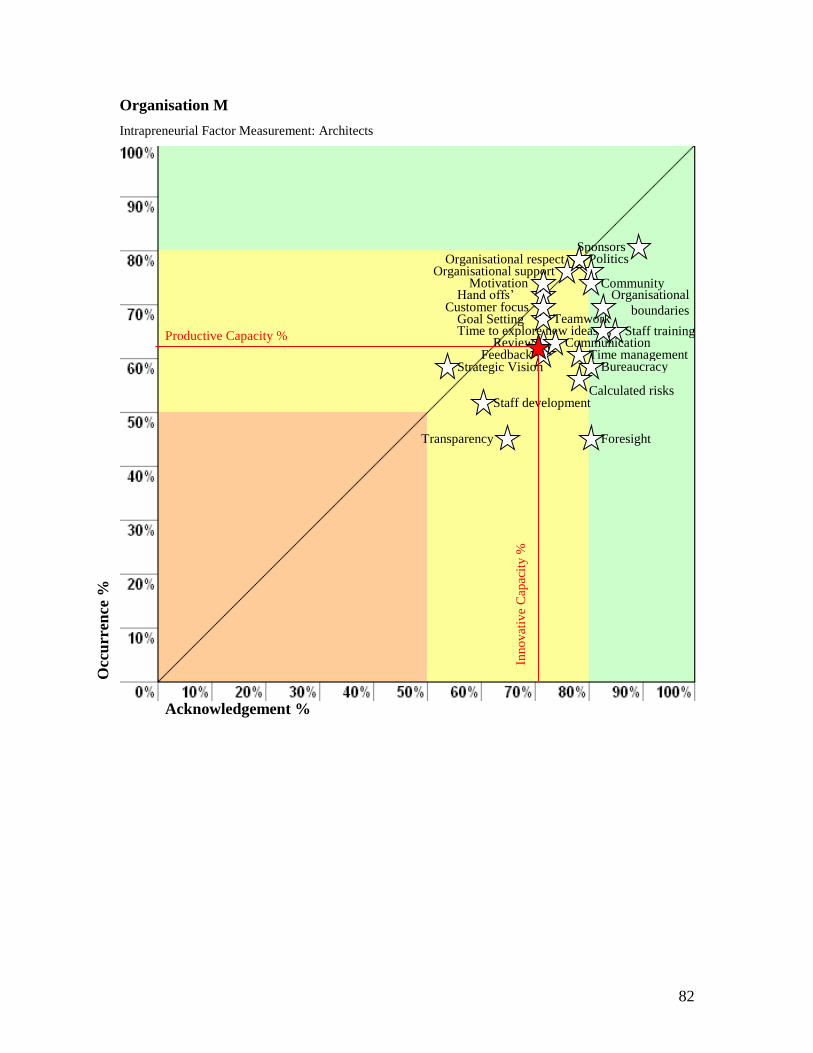
82
Organisation M
Intrapreneurial Factor Measurement: Architects
Bureaucracy
Acknowledgement %
Occ
urr
ence
%
Organisational support
Calculated risks
Strategic Vision
Community Organisational
boundaries
Foresight
Teamwork
Sponsors
Time to explore new ideas
Hand offs’ Customer focus
Politics
Time management
Motivation
Organisational respect
Transparency
Staff development
Staff training
Feedback Review
Goal Setting
Communication Productive Capacity %
Inn
ov
ativ
e C
apac
ity
%
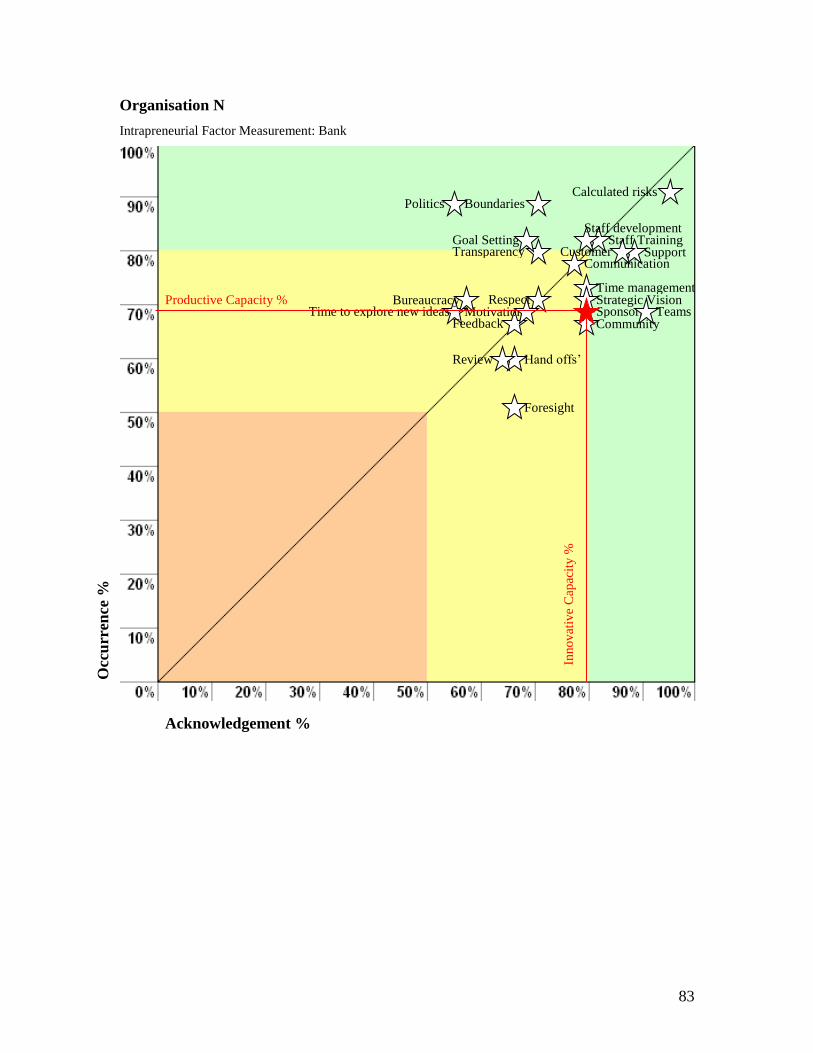
83
Organisation N
Intrapreneurial Factor Measurement: Bank
Acknowledgement %
Occ
urr
ence
%
Support
Calculated risks
Strategic Vision
Community
Boundaries
Foresight
Teams Sponsors Time to explore new ideas
Hand offs’
Customer
Politics
Time management Bureaucracy
Motivation Respect
Transparency
Staff development Staff Training
Feedback
Review
Goal Setting
Communication
Productive Capacity %
Inn
ov
ativ
e C
apac
ity
%

84