intramolecular distances and dynamics from the combined ... · intramolecular distances and...
TRANSCRIPT

Intramolecular Distances and Dynamics from the Combined PhotonStatistics of Single-Molecule FRET and Photoinduced ElectronTransferDominik Haenni,† Franziska Zosel,† Luc Reymond,‡ Daniel Nettels,*,† and Benjamin Schuler*,†
†Department of Biochemistry, University of Zurich, Winterthurerstrasse 190, CH-8057 Zurich, Switzerland‡Institute of Chemical Sciences and Engineering (ISIC), Ecole Polytechnique Federale de Lausanne (EPFL), CH-1015 Lausanne,Switzerland
*S Supporting Information
ABSTRACT: Single-molecule Forster resonance energy transfer (FRET) and photo-induced electron transfer (PET) have developed into versatile and complementarymethods for probing distances and dynamics in biomolecules. Here we show that the twomethods can be combined in one molecule to obtain both accurate distance informationand the kinetics of intramolecular contact formation. In a first step, we show that thefluorescent dyes Alexa 488 and Alexa 594, which are frequently used as a donor andacceptor for single-molecule FRET, are also suitable as PET probes with tryptophan as afluorescence quencher. We then performed combined FRET/PET experiments withFRET donor- and acceptor-labeled polyproline peptides. The placement of a tryptophanresidue into the polyglycylserine tail incorporated in the peptides allowed us to measureboth FRET efficiencies and the nanosecond dynamics of contact formation between oneof the fluorescent dyes and the quencher. Variation of the linker length between thepolyproline and the Alexa dyes and in the position of the tryptophan residuedemonstrates the sensitivity of this approach. Modeling of the combined photon statistics underlying the combined FRET andPET process enables the accurate analysis of both the resulting transfer efficiency histograms and the nanosecond fluorescencecorrelation functions. This approach opens up new possibilities for investigating single biomolecules with high spatial andtemporal resolution.
■ INTRODUCTION
Single-molecule spectroscopy has become an integral part ofbiophysical research,1 and a wide range of biological questionshave been addressed with these methods, including themechanisms of molecular machines,2−4 protein-nucleic acidinteractions,5,6 enzymatic reactions,7 and protein or RNAfolding,8−10 to name but a few. A particular strength of thesemethods is the possibility to resolve conformational hetero-geneity and to observe dynamics of processes that are difficultto synchronize with the perturbation methods frequentlyemployed in ensemble experiments. A very popular approachhas been the use of fluorescence detection, especially incombination with Forster resonance energy transfer (FRET).11
Single-molecule FRET allows distances and distance dynamicsto be probed from about 2 to 10 nm, a range dictated by theForster radii of suitable dye pairs. Advances in methodology, inparticular, the use of fluorescence lifetimes and anisotropies inaddition to fluorescence count rates from donor and accept-or,12,13 rigorous data analysis, especially based on thedevelopment of comprehensive theoretical concepts12,14−21
now enables distances,12 distance distributions,22,23 anddynamics to be obtained over a wide range of timescales13,24−26 with remarkable accuracy.27
A single-molecule method complementary to FRET that hasstarted to provide important dynamic information on themicrosecond and submicrosecond time scale is photoinducedelectron transfer (PET) combined with nanosecond-fluores-cence correlation spectroscopy (nsFCS), pioneered by Sauerand colleagues.28,29 In this case, static quenching of afluorophore by tryptophan is used to obtain dynamics basedon contact formation within proteins or peptides, conceptuallyrelated to some ensemble quenching techniques30−32 and thuscomplementary to the long-range dynamics accessible withFRET. The on/off behavior resulting from the steep distancedependence of the fluorescence emission in PET can, inprinciple, be used to probe any process that leads to a change inquenching dynamics, but the method does not afford directdistance information. For instance, PET-FCS allows thedetermination of loop-closure rates between two points withina polypeptide chain.28 Recent applications include studies ofmodel peptides,28,33 molecular crowding,34 and fast-foldingproteins.35,36
Special Issue: Peter G. Wolynes Festschrift
Received: March 7, 2013Revised: May 8, 2013
Article
pubs.acs.org/JPCB
© XXXX American Chemical Society A dx.doi.org/10.1021/jp402352s | J. Phys. Chem. B XXXX, XXX, XXX−XXX

An important recent goal of single-molecule spectroscopyhas been the possibility to monitor more than one distancewithin a molecule or molecular complex. In the context ofprotein folding, for example, the simultaneous time-resolvedmeasurement of even a few distances would place much morestringent constraints on the evolution of the native fold than asingle distance, and could provide critical tests of theoreticalmodels and simulations. The analysis of the correlation amongthese distances could also yield information on the width of themicroscopic pathway distributions, as pointed out by Onuchic,Wang, and Wolynes.37 One promising approach toward thisgoal are multicolor FRET experiments, where energy transferbetween more than two fluorophores is used to obtaininformation about more than one distance at the sametime.38−41 However, in view of the complementarity ofsingle-molecule FRET and PET, the direct combination ofthese two methods could be an alternative strategy to enablelong-range distances and dynamics based on FRET and more
local dynamics of contact formation to be probed in the samemolecule at the same time. An additional aspect of interest isthe access to submicrosecond time scales, which are ofparticular relevance for rapid processes such as in very fast-folding proteins42 or unfolded state dynamics,9 and whichprovide an important link to theory, simulation, and a betterunderstanding of the physical basis of protein folding in termsof the properties of the underlying free energy landscapes.43−48
Here we show that a direct combination of single-moleculeFRET and PET is feasible and can be used to obtain accurateinformation both on intramolecular distances and contactformation dynamics. Quantitative use of the FRET/PETcombination requires knowledge about the influence of thequenching process on the photophysics of FRET, and itrequires a detailed kinetic model underlying the photonstatistics that can be employed to calculate the resultingphoton count rates and correlation functions. As a first step, wehave thus characterized the interaction of a suitable quencher,
Figure 1. Photophysical models of the electronic and molecular transitions of two FRET dye pairs in the presence of donor or acceptor quenchinginduced by collisions and complex formations with Trp. In a and b, the investigated constructs are illustrated schematically. Both FRETconfigurations consist of an Alexa 488 dye as a donor (green star) and an Alexa 594 dye (red star) as an acceptor separated by a stiff polyprolinesequence indicated as zigzag lines. The PET quencher Trp (gray oval) is attached to flexible (glycine-serine)n linkers. The left cartoon (a) representsacceptor quenching; the right cartoon (b) represents donor quenching. The respective other dye is separated too far from the Trp residue to bequenched. The kinetic schemes (c and d) illustrate the two photophysical models. Both models have the states DA, D*A, DA*, and D*A* incommon, which describe the electronic states of FRET donor (“D”) and acceptor (“A”). The asterisks indicate the electronically excited states fromwhich fluorescence emission is possible. Depending on the construct, each model has to be extended by two additional states: DAQ and D*AQ inthe case of acceptor quenching (c), and DQA and DQA* in the case of donor quenching (d). DQ and AQ represent the dye-Trp complexes, inwhich the dyes (D or A) are statically quenched. Fluorescence correlations and mean photon rates can be calculated for both models using thecorresponding rate matrices K and detection matrices VD and VA represented in (e) and (f) (see Theory). The diagonal elements, Kii, result from therequirement that the sums over the elements of each column must be zero. The parts of the rate matrices that are different for donor and acceptorquenching are highlighted in gray. The state vector for donor quenching is p = (pDA,pD*A,pDA*,pD*A*,pDQA,pDQA*)
T and for acceptor quenching p =(pDA,pD*A,pDA*,pD*A*,pDAQ,pD*AQ)
T, respectively.
The Journal of Physical Chemistry B Article
dx.doi.org/10.1021/jp402352s | J. Phys. Chem. B XXXX, XXX, XXX−XXXB

tryptophan (Trp), with the fluorophores Alexa 488 and Alexa594, a popular FRET pair for single-molecule studies ofproteins, to characterize the requisite photophysical properties.In a second step, we incorporated the FRET pair in syntheticpeptides consisting of two parts (Figure 1): a polyprolinesegment acting as a stiff spacer between the dyes, and a flexibleglycine-serine linker with Trp incorporated at differentpositions. FRET between the Alexa dyes thus reports ontheir intramolecular distance, and the dynamics of quenching ofeither the donor or the acceptor dye by Trp reports on theintramolecular dynamics of loop formation in the flexible partof the peptide. In a third step, we use a combined kinetic modelof the FRET and PET processes (Figure 1) for a quantitativeanalysis of the nanosecond correlation functions and thetransfer efficiency histograms in terms of the underlying photonstatistics. Finally, we show that this analysis allows bothaccurate FRET efficiencies and intramolecular contact dynam-ics to be extracted.
■ MATERIALS AND METHODSSamples. Alexa 488C2-maleimide and Alexa 594C2-
maleimide were synthesized from the corresponding commer-cially available succinimidyl esters (Invitrogen, Eugene, Oregon,USA). Two solutions of Alexa 488 succinimidyl ester (1.3 mg,2.0 μmol, 1 equiv) and Alexa 594 succinimidyl ester (1.6 mg,2.0 μmol, 1 equiv) in dry dimethyl sulfoxide (DMSO) (100μL) were prepared. N-(2-Aminoethyl)maleimide trifluoroace-tate (0.7 mg, 3.0 μmol, 1.5 equiv) and diisopropylethylamine(DIPEA) (10 μL, 58 μmol, 27 equiv) were added successivelyto each solution. The reactions were quenched after 30 minincubation at room temperature by adding 50 μL water and 10μL acetic acid (AcOH). The products were purified by reversephase HPLC chromatography (SunFire Prep C18 5 μm, 19 ×150 mm, Waters, Milford, MA, USA) with a gradient from 0.1%trifluoroacetic acid (TFA) in water to 90% acetonitrile within30 min at a flow rate of 4 mL/min. The samples werelyophilized, yielding red (1.12 μmol, 53%) and blue (1.05 μmol,50%) powders for Alexa 488 and Alexa 594, respectively. Bothpowders were dissolved in dry DMSO.The polyproline peptides were produced by solid phase
synthesis, purified to 80−90% by analytical HPLC, and theirmass confirmed by electrospray ionization mass spectrometry(ESI-MS; PEPTIDE 2.0, Chantilly, VA, USA). Following theprotocol supplied by the manufacturer, the cysteines wereeither labeled with Alexa Fluor 488C2/C5-maleimide or AlexaFluor 594C2/C5-maleimide (Invitrogen, Eugene, Oregon,USA). An initial purification step was performed using sizeexclusion chromatography (Superdex Peptide 10/300GL, GEHealthcare, UK). A further purification step using reverse phasechromatography (XTerra RP18 Column, 5 μm, 4.6 × 250 mm,Waters, Milford, MA, USA) was performed to remove residualfree dye. An HPLC gradient from 0.1% TFA in water to 40%acetonitrile over 50 min was applied with a flow rate of 1 mL/min. Gradients had been optimized for each peptide before-hand by several analytical runs. The lyophilized peptides weredissolved in a 200 mM pH 9.2 sodium bicarbonate buffer andlabeled at the N-terminal glycine using either Alexa Fluor 488or Alexa Fluor 594 succinimidyl esters (Invitrogen, Eugene,Oregon, USA). A 50-fold molar excess of reactive dye andcontinuous sonication of the labeling reaction were required tolabel the glycine residues. The large excess of dye was removedby gel filtration using disposable gravity flow polyacrylamidedesalting columns (Thermo Scientific, Rockford, IL, USA) or
spinZeba spin desalting columns (7K MWCO, 0.5 ml, ThermoScientific, Rockford, IL, USA). Subsequently, labeled peptidewas purified by multiple cycles of reverse phase chromatog-raphy. The labeling success was verified by single-moleculespectroscopy and ESI-MS.
Fluorescence Spectroscopy. Fluorescence lifetime decayswere measured using a custom-built instrument describedpreviously.49 Picosecond light pulses from a white light source(SC-450-4, 20 MHz, Fianium, Southampton, U.K.) were usedfor excitation. The excitation wavelengths were selected byHQ470/40 (Chroma) and z582/15 (Semrock) bandpass filtersfor Alexa 488 and 594, respectively. Samples (0.1 to 1 μM)were measured in 100 mM potassium phosphate buffer (pH7.2) containing 143 mM 2-mercaptoethanol and 0.001% (v/v)Tween 20. The instrument was used in magic angleconfiguration for all measurements.50 The recorded fluores-cence lifetime decays were fitted with single exponential decaysconvolved with the instrument response function (IRF)obtained from the measurement of scattered laser light.50
Fluorescence spectra were recorded at room temperature on aFluorolog-3 spectrofluorometer (Horiba Jobin Yvon, Edison,NJ). The buffer contained 100 mM potassium phosphate pH7.2, 143 mM 2-mercaptoethanol, and 0.001% Tween 20. A dyeconcentration of 40 nM was used for both Alexa dyes. Fordetails of the Stern−Volmer analysis of dynamic and staticquenching, see the Supporting Information (SI).
Single Molecule Instrumentation and Measurements.Single-molecule fluorescence data were recorded using aMicroTime 200 (PicoQuant, Berlin) confocal microscopewith four detectors in a configuration described previously.49
Alexa 488 was excited with a continuous wave (cw) solid-statediode-pumped laser (Coherent Sapphire 488−200). A cwHeNe laser (594 nm, CWI Melles Griot) was used for excitingAlexa 594. The excitation powers, measured at the fullyilluminated back-aperture of the water immersion objective(UPLSAPO 60XW, Olympus, Switzerland) of the microscope,were 100 μW and 40 μW for Alexa 488 and Alexa 594,respectively. Transfer efficiency histograms and nsFCS datawere recorded at sample concentrations of 50 pM and 1 nM,respectively, in potassium phosphate buffer (see above). FornsFCS data, we recorded both donor and acceptor photonswith a pair of detectors each. The photons were distributed bymeans of a polarizing beam splitter cube followed by dichroicmirrors. The measurement time for each nsFCS measurementwas 10−15 hours. A four channel picosecond event timer(HydraHarp 400, PicoQuant, Berlin) recorded the detectiontimes of the photons individually for each detection channel.An autocorrelation, FCSDD(τ) or FCSAA(τ), was obtained bycrosscorrelating the time data of the corresponding detectorpair. The donor−acceptor crosscorrelation FCSDA(τ) wasdetermined by crosscorrelating the combined data of thedonor channels with those of the acceptor channels. Cross-correlating detector signals makes it possible to obtain FCSdata for lag times shorter than the dead times (∼100 ns) of thedetectors.26,51 All three correlation curves were determined forpositive and negative lag times in order to make optimal use ofthe data. Note that FCSAD(τ) = FCSDA(− τ). The nsFCS datawere determined with a time binning of one nanosecond if notindicated otherwise. Rotational diffusion of the molecules anddyes would be visible in the subnanosecond part of the FCScurves and thus does not interfere with the dynamicsinvestigated here.26,49
The Journal of Physical Chemistry B Article
dx.doi.org/10.1021/jp402352s | J. Phys. Chem. B XXXX, XXX, XXX−XXXC
■ THEORY
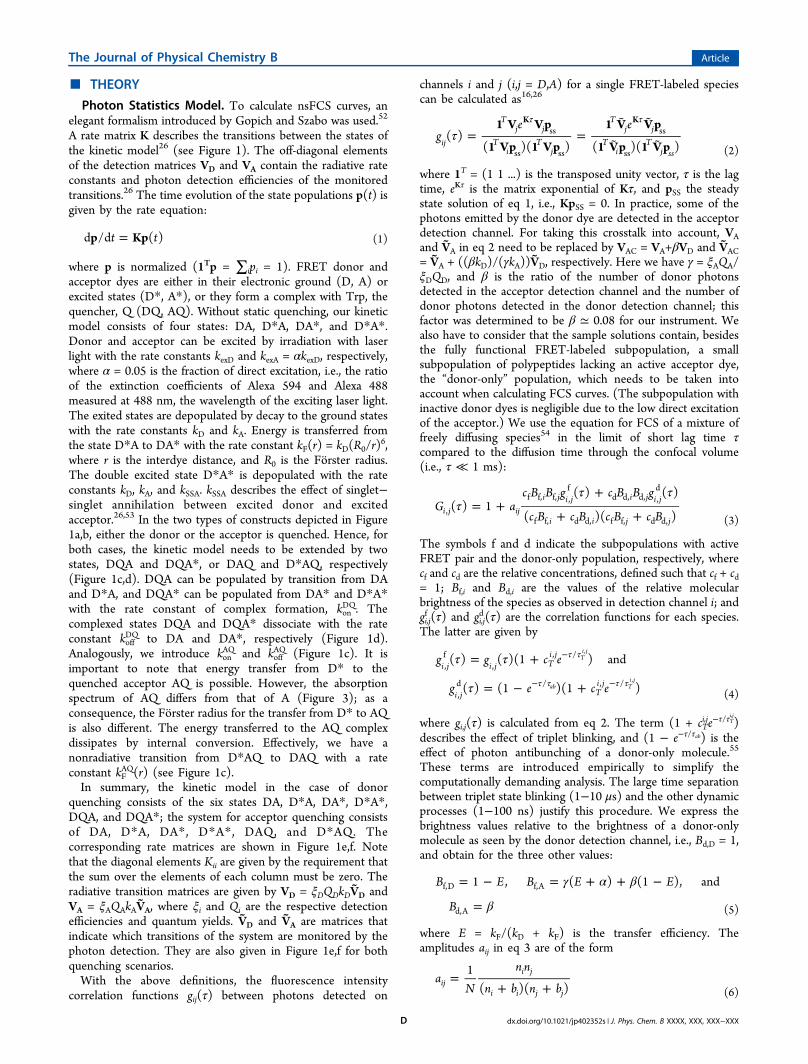
Photon Statistics Model. To calculate nsFCS curves, anelegant formalism introduced by Gopich and Szabo was used.52
A rate matrix K describes the transitions between the states ofthe kinetic model26 (see Figure 1). The off-diagonal elementsof the detection matrices VD and VA contain the radiative rateconstants and photon detection efficiencies of the monitoredtransitions.26 The time evolution of the state populations p(t) isgiven by the rate equation:
=t tp Kpd /d ( ) (1)
where p is normalized (1Tp = ∑ipi = 1). FRET donor andacceptor dyes are either in their electronic ground (D, A) orexcited states (D*, A*), or they form a complex with Trp, thequencher, Q (DQ, AQ). Without static quenching, our kineticmodel consists of four states: DA, D*A, DA*, and D*A*.Donor and acceptor can be excited by irradiation with laserlight with the rate constants kexD and kexA = αkexD, respectively,where α = 0.05 is the fraction of direct excitation, i.e., the ratioof the extinction coefficients of Alexa 594 and Alexa 488measured at 488 nm, the wavelength of the exciting laser light.The exited states are depopulated by decay to the ground stateswith the rate constants kD and kA. Energy is transferred fromthe state D*A to DA* with the rate constant kF(r) = kD(R0/r)
6,where r is the interdye distance, and R0 is the Forster radius.The double excited state D*A* is depopulated with the rateconstants kD, kA, and kSSA. kSSA describes the effect of singlet−singlet annihilation between excited donor and excitedacceptor.26,53 In the two types of constructs depicted in Figure1a,b, either the donor or the acceptor is quenched. Hence, forboth cases, the kinetic model needs to be extended by twostates, DQA and DQA*, or DAQ and D*AQ, respectively(Figure 1c,d). DQA can be populated by transition from DAand D*A, and DQA* can be populated from DA* and D*A*with the rate constant of complex formation, kon
DQ. Thecomplexed states DQA and DQA* dissociate with the rateconstant koff
DQ to DA and DA*, respectively (Figure 1d).Analogously, we introduce kon
AQ and koffAQ (Figure 1c). It is
important to note that energy transfer from D* to thequenched acceptor AQ is possible. However, the absorptionspectrum of AQ differs from that of A (Figure 3); as aconsequence, the Forster radius for the transfer from D* to AQis also different. The energy transferred to the AQ complexdissipates by internal conversion. Effectively, we have anonradiative transition from D*AQ to DAQ with a rateconstant kF
AQ(r) (see Figure 1c).In summary, the kinetic model in the case of donor
quenching consists of the six states DA, D*A, DA*, D*A*,DQA, and DQA*; the system for acceptor quenching consistsof DA, D*A, DA*, D*A*, DAQ, and D*AQ. Thecorresponding rate matrices are shown in Figure 1e,f. Notethat the diagonal elements Kii are given by the requirement thatthe sum over the elements of each column must be zero. Theradiative transition matrices are given by VD = ξDQDkDVD andVA = ξAQAkAVA, where ξi and Qi are the respective detectionefficiencies and quantum yields. VD and VA are matrices thatindicate which transitions of the system are monitored by thephoton detection. They are also given in Figure 1e,f for bothquenching scenarios.With the above definitions, the fluorescence intensity
correlation functions gij(τ) between photons detected on
channels i and j (i,j = D,A) for a single FRET-labeled speciescan be calculated as16,26
τ = =
τ τ
ge e1 V V p
1 Vp 1 V p
1 V V p
1 Vp 1 V p( )
( )( ) ( )( )ij
Tj j
Ti
Tj
Tj j
Ti
Tj ss
K Kss
ss ss
ss
ss (2)
where 1T = (1 1 ...) is the transposed unity vector, τ is the lagtime, eKτ is the matrix exponential of Kτ, and pSS the steadystate solution of eq 1, i.e., KpSS = 0. In practice, some of thephotons emitted by the donor dye are detected in the acceptordetection channel. For taking this crosstalk into account, VAand VA in eq 2 need to be replaced by VAC = VA+βVD and VAC= VA + ((βkD)/(γkA))VD, respectively. Here we have γ = ξAQA/ξDQD, and β is the ratio of the number of donor photonsdetected in the acceptor detection channel and the number ofdonor photons detected in the donor detection channel; thisfactor was determined to be β ≃ 0.08 for our instrument. Wealso have to consider that the sample solutions contain, besidesthe fully functional FRET-labeled subpopulation, a smallsubpopulation of polypeptides lacking an active acceptor dye,the “donor-only” population, which needs to be taken intoaccount when calculating FCS curves. (The subpopulation withinactive donor dyes is negligible due to the low direct excitationof the acceptor.) We use the equation for FCS of a mixture offreely diffusing species54 in the limit of short lag time τcompared to the diffusion time through the confocal volume(i.e., τ ≪ 1 ms):
ττ τ
= ++
+ +G a
c B B g c B B g
c B c B c B c B( ) 1
( ) ( )
( )( )i j iji j i j i j i j
i i j j,
f f, f, ,f
d d, d, ,d
f f, d d, f f, d d, (3)
The symbols f and d indicate the subpopulations with activeFRET pair and the donor-only population, respectively, wherecf and cd are the relative concentrations, defined such that cf + cd= 1; Bf,i and Bd,i are the values of the relative molecularbrightness of the species as observed in detection channel i; andgi,jf (τ) and gi,j
d(τ) are the correlation functions for each species.The latter are given by
τ τ
τ
= +
= − +
τ τ
τ τ τ τ
−
− −
g g c e
g e c e
( ) ( )(1 ) and
( ) (1 )(1 )
i j i j Ti j
i j Ti j
,f
,, /
,d / , /
Ti j
ab Ti j
,
,
(4)
where gi,j(τ) is calculated from eq 2. The term (1 + cTi,je−τ/τT
i,j
)describes the effect of triplet blinking, and (1 − e−τ/τab) is theeffect of photon antibunching of a donor-only molecule.55
These terms are introduced empirically to simplify thecomputationally demanding analysis. The large time separationbetween triplet state blinking (1−10 μs) and the other dynamicprocesses (1−100 ns) justify this procedure. We express thebrightness values relative to the brightness of a donor-onlymolecule as seen by the donor detection channel, i.e., Bd,D = 1,and obtain for the three other values:
γ α β
β
= − = + + −
=
B E B E E
B
1 , ( ) (1 ), andf,D f,A
d,A (5)
where E = kF/(kD + kF) is the transfer efficiency. Theamplitudes aij in eq 3 are of the form
=+ +
aN
n n
n b n b1
( )( )iji j
i i j j (6)
The Journal of Physical Chemistry B Article
dx.doi.org/10.1021/jp402352s | J. Phys. Chem. B XXXX, XXX, XXX−XXXD

where N is the mean number of fluorescent particles present inthe confocal volume, ni and nj are the mean fluorescencephoton detection rates, and bi and bj are the background ratesin detector channels i and j, respectively.56 Note that we use aijas fit parameters, since the individual components are not ofinterest for our analysis.Global Fitting of the nsFCS Data. We fitted the model
nsFCS curves GDD(τ), GDA(τ), and GAA(τ) (eq 3) globally tothe measured auto- and crosscorrelation functions, FCSi,j, byminimizing the sum of the three corresponding χ2 functions ofthe form
∑χ τ τ= −w FCS G( ( ) ( ))ij ijm
i j m ij m2
,2
(7)
The weights are the reciprocal variances for each data point, wij= 1/σij
2 (we assume constant variances for each data point inone nsFCS curve). Koppel56 showed that the signal-to-noiseratio of an FCS curve of a single species is proportional to itsmolecular brightness B if B·Δ ≪ 1, where Δ is the binninginterval of the FCS data. (In our case, with a molecularbrightness of ∼0.1 μs−1 and Δ = 20 ps, this requirement isclearly met.) As the amplitude of the FCS curve itself does notdepend on the brightness, we conclude that the variance of thesignal is proportional to σ2 ∝ 1/B2. Generalizing this result todual color FCS, we obtain σij
2 ∝ 1/(BiBj). Therefore, we weightthe χ2 functions with wDD = BDBD, wAA = BABA, and wAD =4BABD, where Bi is the mean relative brightness Bi = cfBf,i +cdBd,i. The factor 4 for wAD is justified since the cross-correlationwas obtained from two donor and two acceptor detectionchannels (see Materials and Methods). The effective molecularbrightness “seen” by a detector pair is twice as large as for asingle detector.Most model parameters are known from independent
experiments. The excitation rate constant kexD = 0.02 ns−1
was determined from the relaxation of the antibunchingcomponent in the nsFCS of donor-only labeled constructs.26
kD was determined from ensemble fluorescence lifetime decaysof donor-only constructs. Corresponding decays for determin-ing kA were obtained by acceptor direct excitation of donor-and acceptor-labeled constructs. E, cf, and cd were obtainedfrom single-molecule transfer efficiency histograms, and kF wascalculated according to57
= −k k E E/(1 )F D (8)
kFAQ was calculated using
= =k k R R k J J( / ) /FAQ
F 0AQ
06
F AQ (9)
where J and JAQ are the spectral overlap integrals57 for theenergy transfer to the unquenched and quenched acceptordyes, respectively. We determined JAQ/J = 0.73 (see below). αand β were determined as described.58 The determination of γis described below. Triplet decay times τij were determined byfitting the nsFCS curves of Trp-free reference peptides. Theremaining free fitting parameters for the data obtained from theconstructs with Trp were kon and koff for describing the staticquenching dynamics, the triplet blinking amplitudes cTij
, and theamplitudes of the correlation functions, aij. Note that the valuesof aij do not affect the relative amplitudes of the nanosecondcomponents of gi,j(τ), but the relative amplitudes of gi,j(τ) arefully determined by our kinetic model (see eq 2). Due to ourlimited knowledge about singlet−singlet annihilation betweenAlexa 488 and Alexa 594, we also treated kSSA as a free fitting
parameter, but this process will only affect dynamics on theorder of the excited state lifetimes and thus has no significanteffect on the contact dynamics of interest here.
Determination of E from Photon Detection Rates. Insingle-molecule FRET experiments, we aim to obtain thetransfer efficiency from the measured donor and acceptorphoton detection rates. We calculate their theoretical meanvalues for our kinetic models as52
= =n n1 V p 1 V pandT Tss ssD D A A (10)
If we assume that the laser intensities are small (kexA ≪ kA),such that the population of the double-excited state D*A* isnegligible, and if we further assume that kF
AQ ≈ kF, then thefollowing relation can be used to calculate E from nD and nA:
γ≡
+=
′′ + + −E
kk k
nn n k k(1 / )
F
D F
A
A D onAQ
offAQ 1
(11)
whereα
αγ β′ = −
++ + −−n n n n k k n
1( (1 / ) )A A A D on
AQoffAQ 1
D
Equation 11 can be verified by inserting nD and nA calculatedfrom eq 10 for the kinetic model with static acceptorquenching. Static donor quenching has no influence on theformulas. In the absence of static acceptor quenching, the (1 +konAQ/koff
AQ)−1 terms can be omitted.In single-molecule experiments, we estimate E from the
numbers of donor and acceptor photons, ND and NA, in a burstof photons. We obtain the rates by nD = ND/T−bD and nA =NA/T−bA, where T is the duration of the burst, and bD and bAare the background rates in the two detection channels. Theobtained values for nD and nA are inserted into eq 11 forcalculating E. Because of the limited number of photons presentin a burst (at least 30), the obtained values of E scatter aroundthe true mean transfer efficiency (shot noise). The methoddescribed is correct in the limit T ≫ (kon
AQ + koffAQ)−1, i.e., if the
photon signal is averaged over many cycles of AQ complexformation and dissociation, which is the case here.
Determination of γ. The value of the correction factor γ =ξAQA/ξDQD is affected by dynamic quenching of both thedonor and the acceptor dyes. We determined its value γ0 forAlexa 488 and Alexa 594 free in buffer solution for ourinstrument as described.58 The value for γ when the dyes arebound to our peptides can be calculated according to
γ γττ
ττ
= 0D0
D
A
A0 (12)
where τD0 and τA0 are the fluorescence lifetimes of free donorand acceptor measured in buffer solution, and τD = kD
−1 and τA =kA−1 are the corresponding fluorescence lifetimes of the dyeswhile bound to the constructs. They were obtained as describedin the Quenching of Alexa 488 and 594 by Tryptophan section.
■ RESULTSQuenching of Alexa 488 and 594 by Tryptophan. A
first step toward the combined use of single-molecule FRETand PET is to characterize the quenching of a FRET pair, inthis case Alexa 488 and 594, with a suitable quencher. Of thenaturally occurring amino acids, L-tryptophan (Trp) is the onewith the largest quenching effect on the Alexa 488 and Alexa594 fluorescent dyes.59 Therefore we characterized the dynamicand static quenching interactions of these dyes with the free
The Journal of Physical Chemistry B Article
dx.doi.org/10.1021/jp402352s | J. Phys. Chem. B XXXX, XXX, XXX−XXXE
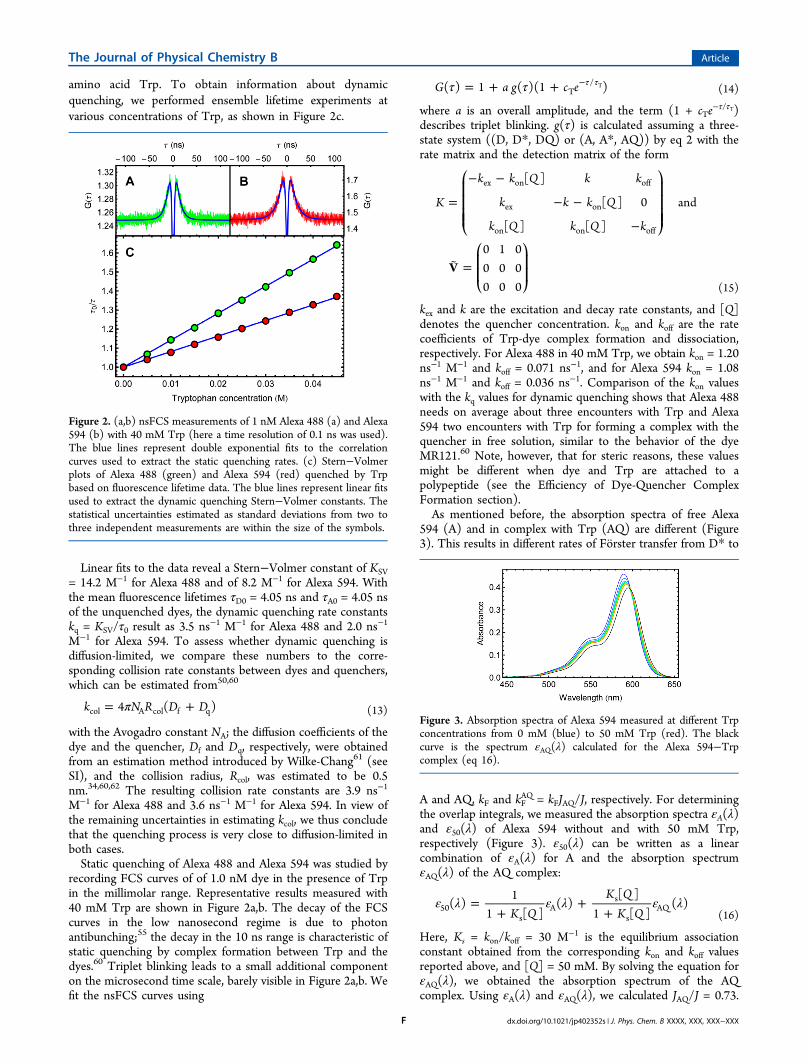
amino acid Trp. To obtain information about dynamicquenching, we performed ensemble lifetime experiments atvarious concentrations of Trp, as shown in Figure 2c.
Linear fits to the data reveal a Stern−Volmer constant of KSV= 14.2 M−1 for Alexa 488 and of 8.2 M−1 for Alexa 594. Withthe mean fluorescence lifetimes τD0 = 4.05 ns and τA0 = 4.05 nsof the unquenched dyes, the dynamic quenching rate constantskq = KSV/τ0 result as 3.5 ns−1 M−1 for Alexa 488 and 2.0 ns−1
M−1 for Alexa 594. To assess whether dynamic quenching isdiffusion-limited, we compare these numbers to the corre-sponding collision rate constants between dyes and quenchers,which can be estimated from50,60
π= +k N R D D4 ( )col A col f q (13)
with the Avogadro constant NA; the diffusion coefficients of thedye and the quencher, Df and Dq, respectively, were obtainedfrom an estimation method introduced by Wilke-Chang61 (seeSI), and the collision radius, Rcol, was estimated to be 0.5nm.34,60,62 The resulting collision rate constants are 3.9 ns−1
M−1 for Alexa 488 and 3.6 ns−1 M−1 for Alexa 594. In view ofthe remaining uncertainties in estimating kcol, we thus concludethat the quenching process is very close to diffusion-limited inboth cases.Static quenching of Alexa 488 and Alexa 594 was studied by
recording FCS curves of of 1.0 nM dye in the presence of Trpin the millimolar range. Representative results measured with40 mM Trp are shown in Figure 2a,b. The decay of the FCScurves in the low nanosecond regime is due to photonantibunching;55 the decay in the 10 ns range is characteristic ofstatic quenching by complex formation between Trp and thedyes.60 Triplet blinking leads to a small additional componenton the microsecond time scale, barely visible in Figure 2a,b. Wefit the nsFCS curves using
τ τ= + + τ τ−G a g c e( ) 1 ( )(1 )T/ T (14)
where a is an overall amplitude, and the term (1 + cTe−τ/τT)
describes triplet blinking. g(τ) is calculated assuming a three-state system ((D, D*, DQ) or (A, A*, AQ)) by eq 2 with therate matrix and the detection matrix of the form
=
− −
− −
−
=
⎛
⎝
⎜⎜⎜⎜
⎞
⎠
⎟⎟⎟⎟⎛
⎝⎜⎜
⎞
⎠⎟⎟
K
k k Q k k
k k k Q
k Q k Q k
V
[ ]
[ ] 0
[ ] [ ]
and
0 1 00 0 00 0 0
ex on off
ex on
on on off
(15)
kex and k are the excitation and decay rate constants, and [Q]denotes the quencher concentration. kon and koff are the ratecoefficients of Trp-dye complex formation and dissociation,respectively. For Alexa 488 in 40 mM Trp, we obtain kon = 1.20ns−1 M−1 and koff = 0.071 ns−1, and for Alexa 594 kon = 1.08ns−1 M−1 and koff = 0.036 ns−1. Comparison of the kon valueswith the kq values for dynamic quenching shows that Alexa 488needs on average about three encounters with Trp and Alexa594 two encounters with Trp for forming a complex with thequencher in free solution, similar to the behavior of the dyeMR121.60 Note, however, that for steric reasons, these valuesmight be different when dye and Trp are attached to apolypeptide (see the Efficiency of Dye-Quencher ComplexFormation section).As mentioned before, the absorption spectra of free Alexa
594 (A) and in complex with Trp (AQ) are different (Figure3). This results in different rates of Forster transfer from D* to
A and AQ, kF and kFAQ = kFJAQ/J, respectively. For determining
the overlap integrals, we measured the absorption spectra εA(λ)and ε50(λ) of Alexa 594 without and with 50 mM Trp,respectively (Figure 3). ε50(λ) can be written as a linearcombination of εA(λ) for A and the absorption spectrumεAQ(λ) of the AQ complex:
ε λ ε λ ε λ=+
++K QK Q
K Q( )
11 [ ]
( )[ ]
1 [ ]( )50
sA
s
sAQ
(16)
Here, Ks = kon/koff = 30 M−1 is the equilibrium associationconstant obtained from the corresponding kon and koff valuesreported above, and [Q] = 50 mM. By solving the equation forεAQ(λ), we obtained the absorption spectrum of the AQcomplex. Using εA(λ) and εAQ(λ), we calculated JAQ/J = 0.73.
Figure 2. (a,b) nsFCS measurements of 1 nM Alexa 488 (a) and Alexa594 (b) with 40 mM Trp (here a time resolution of 0.1 ns was used).The blue lines represent double exponential fits to the correlationcurves used to extract the static quenching rates. (c) Stern−Volmerplots of Alexa 488 (green) and Alexa 594 (red) quenched by Trpbased on fluorescence lifetime data. The blue lines represent linear fitsused to extract the dynamic quenching Stern−Volmer constants. Thestatistical uncertainties estimated as standard deviations from two tothree independent measurements are within the size of the symbols.
Figure 3. Absorption spectra of Alexa 594 measured at different Trpconcentrations from 0 mM (blue) to 50 mM Trp (red). The blackcurve is the spectrum εAQ(λ) calculated for the Alexa 594−Trpcomplex (eq 16).
The Journal of Physical Chemistry B Article
dx.doi.org/10.1021/jp402352s | J. Phys. Chem. B XXXX, XXX, XXX−XXXF

The analysis of the fluorescence spectra as a function of Trpconcentration is in agreement with our assumption that thedye−Trp complexes are dark, as in previously investigatedcases60,63 (see SI). We further analyzed Stern−Volmer plotsfrom the fluorescence data (see SI), and obtained equilibriumconstants for static quenching of KS = 14.9 M−1 for Alexa 488and KS = 29.6 M−1 for Alexa 594. These values compare wellwith the ones obtained from the nsFCS data above (KS = 17M−1 for Alexa 488 and KS = 30 M−1 for Alexa 594), supportingthe consistency of the results.FRET and PET Quenching Dynamics in the Same
Molecule. To study FRET combined with PET quenching in awell-defined system, we prepared peptide constructs based onour previous experience with similar systems,64,65 where 20proline residues form a stiff spacer between the FRET dyes(Alexa 488 and Alexa 594) (Figure 4). Even though polyprolinepeptides have been shown to comprise considerable conforma-tional heterogeneity65,66 caused by peptidyl-prolyl cis−transisomerization,65 they are the stiffest natural peptide sequences,and the residual distance heterogeneity does not interfere withthe requirements for our investigation. For the combinationwith PET quenching, a flexible (GlySer)4 sequence wasincluded at the C-terminal end of the polyproline peptide,with a Trp residue inserted at different positions. Neuweiler etal. used Gly-Ser-linkers of similar length to study theintramolecular quenching effects of Trp on the oxazinefluorophore MR121.34 They found pronounced quenching forlinker lengths ranging from 4 to 10 residues. We thus prepared
peptides with similar sequence separation (three to nineresidues) between the Trp residue and the cysteine to whichthe Alexa dye is attached (Figure 4). To avoid effects on thetransfer efficiency from variations in steric constraintsintroduced by different lengths of the flexible peptide, thenumber of Gly-Ser repeats was kept constant, with Trp locatedat different positions in the peptide. The general sequence ofthe peptide is GP20CGS(W3)GS(W5)GS(W7)GS(W9), whereWX indicates the different Trp positions used. To control fornonspecific effects, a reference construct consisting of thepolyproline and the GS-sequence but without Trp wasproduced. For simplicity, we name the constructs Ref, W3,W5, W7, and W9 for the reference and the peptides with Trp atthe respective positions. For introducing the fluorescent dyessite-specifically, the peptides where labeled on the amino groupof the N-terminal glycine using succinimidyl esters and on thecysteine in position 22 using maleimide derivatives of the Alexadyes. Besides the commercially available Alexa dyes with a C5linker, we also synthesized maleimide derivatives of the Alexadyes with a C2 linker. This allows us to study the influence ofthe dye linker length on the FRET and PET dynamics. Toinvestigate the effect of PET quenching on both the FRETdonor and the acceptor, all constructs were labeled specificallyin the two different possible permutations, with either thedonor (A488C2/C5) or the acceptor (A594C2/C5) attachedto the cysteine close to the Gly-Ser tail containing the Trp(Figure 4). In total, we thus investigated 20 differentconstructs: five peptide sequences (Ref, W3, W5, W7, W9),
Figure 4. Transfer efficiency histograms measured with the peptide constructs Ref, W3, W5, W7, and W9 with the C5 dye linker. As indicated by thestructural representations on top, the left group of histograms (a,b) contains data from peptides with a quenched FRET donor (A488C5), and theright group (c,d) contains data from peptides with a quenched FRET acceptor (A594C5). Donor and acceptor are highlighted by green and red starsin the structures. Numbers indicate the different positions of the quenching Trp. In the structures shown, Trp is at position 9. The correspondingTrp positions are indicated in the histograms. Reference histograms from constructs lacking Trp (Ref) are also shown. The small peaks at E ≈ 0correspond to molecules without active FRET acceptor (“donor-only”). The left (a,c) and right (b,d) columns of each group show histogramswithout and with correction for dynamic and static quenching, respectively. Dashed lines indicate the positions of the peak maxima of the referencemeasurements without Trp to facilitate the comparison. Corresponding histograms for the constructs with C2 linkers are shown in the SI.
The Journal of Physical Chemistry B Article
dx.doi.org/10.1021/jp402352s | J. Phys. Chem. B XXXX, XXX, XXX−XXXG

each with two different dye-linkers (C2 and C5) and twolabeling permutations.Figure 4 shows transfer efficiency histograms recorded for
the 10 constructs with the C5 dye linkers. Even though thehistograms are clearly broadened beyond shot noise owing toresidual peptidyl-prolyl cis/trans isomerization,65 they provide awell-defined peak at transfer efficiencies close to 1/2, whichallows us assess the effect of PET quenching on the transferefficiency with high sensitivity. All histograms are shownwithout and with correction for dynamic and static quenchingeffects. Not correcting for quenching means that we use eq 11with γ = γ0, the value measured for free dyes in the absence ofTrp, and that we neglect the (1 + kon
AQ/koffAQ)−1 term, a procedure
that would correspond to the typical practice in single-moleculeFRET experiments. For the peptides with a quenched donor(Figure 4a), the presence of Trp (W3−W9) leads to a slightincrease of the uncorrected (or apparent) transfer efficiencies,Eapp, due to the change in donor quantum yield. For thepeptides with a quenched acceptor, the change in Eapp is muchmore drastic (Figure 4c), although the dynamic quenchingeffect of Trp on Alexa 594 is less pronounced than for Alexa488 (see the Fluorescence Lifetime Measurements section).The strong shift of the peak position with Trp present in thesequence is hence induced by the effect of static quenching ofthe acceptor. The reason for this strong effect is that Alexa 594in the statically quenched state still accepts energy from Alexa488 (since its absorption spectrum is only slightly changed inthe complex with Trp, Figure 3), but it does not fluoresce,whereas donor emission is virtually unaffected. In contrast, inthe case of static quenching of the donor, any excitation of thedonor in the DQ state will lead to rapid nonradiativedeexcitation, and neither Alexa 488 nor Alexa 594 will emitfluorescence. Static donor quenching thus does not have anyeffect on the observed transfer efficiency; it just reduces theaverage molecular brightness of the entire FRET system.The uncorrected mean transfer efficiencies of all constructs
(including those with the short C2 dye linker) are summarizedin Figure 5a (see the SI for transfer efficiency histograms of theC2 variants). The transfer efficiencies found for the referencevariants are close to E = 0.6. In the case of donor quenching,only a slight decrease in Eapp results from increasing thesequence separation between Trp and Alexa 488. In the case ofacceptor quenching, the much more pronounced effect on Eappis apparent, and a clear increase in Eapp with increasingsequence separation is visible, as expected. In all cases, the
variants with the shorter C2 dye linker show systematicallyslightly lower transfer efficiencies, presumably because theshorter linkers do not allow donor and acceptor to approacheach other as closely as for the longer dye linkers. In summary,intramolecular PET quenching by Trp of FRET donor andacceptor results in systematic effects on Eapp. In the followingsections, we will demonstrate how the parameters (τD, τA, kon
AQ,and koff
AQ) required for quantifying and understanding theseeffects based on the kinetic model of the combined FRET/PETprocess can be obtained from fluorescence lifetime and nsFCSmeasurements.
Fluorescence Lifetime Measurements. To quantify theintramolecular dynamic quenching effect of Trp on the FRETdyes, we determined fluorescence lifetimes with ensemble time-correlated single photon counting. Figure 6a shows tworepresentative fluorescence lifetime measurements. For apeptide labeled only with Alexa 488 at the cysteine, a significantdifference is seen in a peptide without (Ref, light green) andwith Trp (W3, dark green), as expected from a contribution ofdynamic quenching. Both lifetime histograms are well fitted bysingle exponential decays (see lines in Figure 6a), indicative of ahomogeneous sample. For all 20 variants, we determined themean fluorescence lifetimes of the dyes attached to the cysteineresidue, i.e., the dye position affected by Trp quenching (Figure6b). For all donor lifetimes, we used peptides lacking anacceptor fluorophore.The comparison of the values obtained for the reference
(Ref) variants to the values obtained for the peptidescontaining Trp (W3−W9) reveals in all cases a significantdecrease of the mean lifetime owing to dynamic quenching.The change in mean lifetime is only weakly dependent on theTrp-dye sequence separation. As for the lifetime experimentswith free dye and free Trp, a larger dynamic quenching effectwas found for Alexa 488 compared to Alexa 594. The dye-linkerlength (C2 or C5) also has a systematic impact on thefluorescence lifetimes. Whereas the lifetime differences betweenthe C2 and the C5 dye variants are small for the Ref peptideconstructs, the differences are larger for the Trp containingconstructs. For the peptides with the longer (C5) dye linkers,the observed fluorescence lifetimes are lower compared to thecorresponding C2 constructs, possibly due to greater stericconstraints or lower accessibility of the Alexa dye imposed bythe shorter linker. Altogether, the dynamic quenching effectsand their variation with the position of the Trp residue in thepeptide are not very large, but they definitely need to be taken
Figure 5. Transfer efficiencies (averaged over all photon bursts with E > 0.1) of all 20 polypeptide constructs. The values are shown without (a) andwith (b) correction for quenching effects. Green and red indicate the variants with donor and acceptor quenching, respectively. Values for thevariants with C5 dye-linkers (framed symbols) and C2 dye-linkers (unframed symbols) are shown.
The Journal of Physical Chemistry B Article
dx.doi.org/10.1021/jp402352s | J. Phys. Chem. B XXXX, XXX, XXX−XXXH

into account for a quantitative analysis of the data. The meanacceptor fluorescence lifetimes, measured for the constructswith quenched donor (A488C5) (see Figure S2), do notdeviate from the value found for the corresponding referencewithout Trp. Therefore we can exclude that the dyes at the N-terminal Gly are dynamically quenched by Trp.
PET Dynamics from a Global Analysis of nsFCS FRETCurves. In the next and most important step, we quantified thedynamics of the static intramolecular PET quenching of FRETdonor and acceptor by Trp. Using a confocal single-moleculeinstrument with four synchronized detection channels, werecorded complete sets of nsFCS curves for all 20 constructs,including donor autocorrelations, GDD(τ), acceptor autocorre-lations, GAA(τ), and donor−acceptor crosscorrelations, GDA(τ).Figure 7 shows two sets of nsFCS data together with the globalfits to the corresponding kinetic models (Figure 1) according tothe procedures described in Materials and Methods. Depictedare representative FCS curves for the W3 peptide withquenched donor dye (W3 Alexa 488C5, Figure 7a−c) andfor the W3 peptide with quenched acceptor dye (W3 Alexa594C5, Figure 7d−f), together with data from the correspond-ing reference peptides without Trp (gray), which only show anantibunching component on the time scale of a fewnanoseconds, as expected.PET quenching of the FRET donor (A488C5) leads to
components with a large positive amplitude in all threecorrelation curves. The formation and dissociation of DQcomplexes leads to correlated fluctuations of the photon signalon all detection channels, since neither donor nor acceptor emitfluorescence while the DQ complex is formed. In contrast, incase of acceptor quenching (A594C5), only the acceptorautocorrelation shows a similarly large positive quenchingcomponent. In this case, the AQ complex has only very littleeffect on the fluorescence emission of the donor. However, thecrosscorrelation GDA(τ) does show a small (but significant)component with negative amplitude on the same time scale asthe large component in GAA(τ). Our kinetic model allows us toidentify the reason: this small amplitude can be attributed tothe change in Forster radius and thus transfer rate constant(from kF to kF
AQ) when Alexa 594 and Trp associate (see theQuenching of Alexa 488 and 594 by Tryptophan section). As aresult, donor and acceptor signals are slightly anticorrelated, as
Figure 6. (a) Representative fluorescence lifetime decays of donor-only labeled Ref (light green) and W3 (dark green) peptides. Bothdecays were fitted with single-exponential decays (blue lines). (b)Donor (green) and acceptor (red) mean fluorescence lifetimes of all20 constructs. Donor fluorescence lifetimes were measured for thevariants labeled at the cysteine with Alexa 488. (For thesemeasurements, the constructs were not labeled with acceptor dye.)Acceptor fluorescence lifetimes were measured for the variants labeledat the cysteine with Alexa 594. (c) Collisional quenching rate constantsdetermined from the fluorescence lifetime data (b). Values for thevariants with C5 dye-linkers (framed symbols) and C2 dye-linkers(unframed symbols) are shown throughout. The statistical uncertain-ties estimated as standard deviations from two to three independentmeasurements are within the size of the symbols.
Figure 7. nsFCS data for W3 peptides with quenched donor (A488C5, a-c) and quenched acceptor (A594C5, d-f). For both measurements, thedonor−donor (green), donor−acceptor (orange), and acceptor−acceptor (red) nsFCS curves are shown. For each set, model correlation curvesGDD(τ), GDA(τ), and GAA(τ) (blue lines) were fitted globally to the data. nsFCS results for the identically labeled reference constructs lacking the Trpresidue are shown for comparison (gray).
The Journal of Physical Chemistry B Article
dx.doi.org/10.1021/jp402352s | J. Phys. Chem. B XXXX, XXX, XXX−XXXI

the donor emission rates increase upon formation of theacceptor−Trp complex owing to the lower rate of energytransfer (kF
AQ = 0.73kF). If no energy was transferred from thedonor to the AQ complex, we would observe a much strongeranticorrelation in GDA(τ), and GDD(τ) would also show asignificant component due to acceptor quenching.We fitted each of the two FCS data sets globally with the
appropriate kinetic model including either donor or acceptorquenching (see Figure 2). As described in the Theory section,the only free fitting parameters were the on- and off-rateconstants for dye−Trp complex formation, the singlet-singleannihilation rate kSSA, the triplet blinking amplitudes cTij
, andthe amplitudes aij, which depend only on sample concentrationand background signal. All other parameters in the model weredetermined independently. The values for E used forcalculating kF (see eq 8), and the relative values of themolecular brightness (see eq 5) were not determined from thetransfer efficiency histograms recorded for the correspondingconstructs, but from the transfer efficiency histograms recordedfor the corresponding reference constructs without Trp. Thekinetic model describes the data very well, including the relativeamplitudes of all correlation functions from the staticquenching component, one of the most stringent requirementsfor the quantitative description of the process. Figure 8a−fshows the entire series of donor (a,b) and acceptor (e,f)autocorrelation and crosscorrelation (c,d) nsFCS data for theconstructs with quenched donor (a,c,e) and quenched acceptor(b,d,f) with C5 dye linkers, illustrating the systematic changeswith dye and Trp positions in the sequence. (All FCS data,including those for the C2 linker variants, are shown togetherwith the fits in Figures S4−S7.) Note that in the presentsystem, the Forster transfer rate, kF, can also be included as afree fit parameter that yields values very close to those of thereference molecules. Even more importantly, the resultingvalues of kon and koff are in excellent agreement with the valuesdetermined here. In the case of static quenching of the acceptorby Trp, kon and koff can also be determined from nsFCSmeasurements after direct excitation of the acceptor (FigureS9), so that the preparation of a reference without Trp in thesequence is not required for a quantitative analysis.As expected, we observe that the amplitudes from static
quenching in the FCS curves decrease with increasing Trp-dyesequence separation. Figure 8g shows a comparison of all on-and off-rate constants obtained from the nsFCS fits for all 16peptides containing Trp. As seen already for the dynamicquenching rate constants (see the Fluorescence LifetimeMeasurements section), the on-rates are largely independentof the Trp-dye sequence separation (downward triangles inFigure 8g). More surprisingly, the off-rates increase withincreasing dye-quencher separation (upward triangles). Thechange in off-rates is thus responsible for the decrease in thestability of dye-quencher complexes with increasing sequenceseparation between the dye and the Trp. While there are noclear differences in the on-rates for the two different dye-linkerlengths in case of Alexa 488C2 and Alexa 488C5, the Alexa594C5 peptides show systematically slightly higher on-ratescompared to the corresponding Alexa 594C2 peptides, thesame trend as observed for the dynamic quenching rateconstants from ensemble lifetime experiments (Figure 6).Consistent with the bimolecular nsFCS experiments with dyeand Trp free in solution, we find higher off-rates for peptideswhere the donor is quenched than where the acceptor is
quenched. For comparison, we repeated the measurements forthe constructs with quenched acceptor, but by directly excitingthe acceptor instead of the donor. The acceptor autocorrelationdata obtained were fitted with the corresponding, muchsimpler, photophysical model. The on- and off-rate constantsresulting for the Alexa 594-Trp complex are in good agreementwith the results presented above (see Figures S8 and S9 in theSI), confirming that the kinetic model can be used to reliablyextract the correct rate constants in the combination of PETwith FRET. We confirmed that the dye attached to the N-terminal Gly is not statically quenched by Trp by recordingnsFCS data of Alexa 488C5 constructs, where we directlyexcited the acceptor dye with 594 nm laser light (see FigureS10).
Efficiency of Dye−Quencher Complex Formation. Forthe interpretation of PET quenching measurements in terms ofcontact formation (the quantity that is usually of mechanisticinterest), it is important to know the efficiency of complexformation, i.e., how many collisions between Trp and dye arerequired on average before a stable complex is formed. Fromour bimolecular measurements with dye and Trp free insolution, we know that the collision rate constant, kcol, is
Figure 8. Donor−donor (a, b) and acceptor−acceptor (e,f) anddonor−acceptor (c,d) nsFCS data of peptides with quenched Alexa488C5 (a,c,e) and with quenched Alexa 594C5 (b,d,f). The colors ina−f indicate the position of Trp: red (W3), orange (W5), green (W7),blue (W9), black (Ref without Trp). For this comparison, the curvesare offset by 0.12. (g) On- and off-rate constants obtained from fits ofthe kinetic models (Figure 1) to the FCS data of the W3, W5, W7, andW9 peptides. Represented are kon
DQ(green downward triangles),koffDQ(green upward triangles), kon
AQ(red downward triangles), andkoffAQ(red upward triangles). Values for both the variants with C5 dyelinkers (framed symbols) and C2 dye-linkers (unframed symbols) areshown. Error bars indicate statistical uncertainties estimated asstandard deviations from two to three independent measurements.In the cases where the error bars are invisible, they are smaller than thesize of the symbols.
The Journal of Physical Chemistry B Article
dx.doi.org/10.1021/jp402352s | J. Phys. Chem. B XXXX, XXX, XXX−XXXJ

approximately equal to the rate constant of dynamic quenching,kq. We can thus estimate the mean number of quencher-dyecollisions needed before a complex is formed from the on-rateconstants, kon, from the nsFCS measurements as kcol/kon = kq/kon. Figure 9 shows the corresponding ratios calculated from
the kq and kon values given in Figure 6c and Figure 8g,respectively. We observe that, on average, five to nine collisionsare required before a complex is formed. For dye and Trp freein solution, we found values for kq/kon ranging from 2 to 3(data also shown in Figure 9 for comparison).Correcting Transfer Efficiency Histograms for
Quenching Effects. Given the robust results obtained fromthe analysis of the fluorescence lifetime and nsFCS data, thefinal question is whether we can use these results to account forthe transfer efficiency histograms of our peptides in thepresence of PET quenching (Figure 4). Direct comparison tothe transfer efficiency histograms of the reference peptides(Ref) allows us to test the accuracy of this approach. Inaddition to the uncorrected histograms already discussed,Figure 4 also shows the corrected histograms from the sameexperimental data, but corrected according to eqs 8 and 9, i.e.,by taking into account the rates of dynamic and staticquenching for calculating the effect on the photon countrates and the correction factor γ. For the peptides with aquenched donor (Alexa 488C5), the distortion of the transferefficiencies is small, but the correction does improve theagreement with the unquenched reference (Figure 4b). For thepeptides with a quenched acceptor (Alexa 594C5), however,the effect of the quenching Trp is dramatic and the correctioncorrespondingly large (Figure 4d). Again, the agreement of thecorrected FRET efficiency histograms with the reference is verygood. Figure 5b shows the mean transfer efficiencies (E > 0.1)of the corrected transfer efficiency histograms for all peptidevariants. A comparison of the Ref values to the corrected meantransfer efficiencies reveals differences below ∼0.03, which iswithin the typical uncertainty of single-molecule FRETexperiments.23 The trend in the transfer efficiencies for thedifferent dye-linker lengths with higher transfer efficiencies forthe C5 linkers is also well conserved after application of thecorrection. From this result we can derive three importantconclusions. First, the good agreement between the correctedand the reference histograms shows that the correction factors,and therefore the quenching rates obtained, are accurate.Second, these results show that the applied approach and thekinetic model is well suited for quantifying dynamic and static
quenching and for correcting single-molecule fluorescence data.Finally, this result highlights how single-molecule FRET can beused as an accurate and precise spectroscopic ruler even in thepresence of pronounced quenching effects.
■ DISCUSSIONOur results demonstrate the possibility of directly combiningquantitative single-molecule FRET and PET in one exper-imental system. The approach requires a pair of fluorophoresthat is suitable for single-molecule FRET, and at the same timecan be quenched efficiently by a specific additionalchromophore incorporated in the polypeptide chain. Ourresults show that the well-established FRET pair consisting ofAlexa 488 and Alexa 594 as donor and acceptor, respectively,together with the natural amino acid Trp, provides a suitablecombination of this type. Trp is an efficient fluorescencequencher of both Alexa dyes, with dynamic and staticquenching contributions, similar to those in established PETsystems, e.g., the oxazine dye MR121, which has beeninvestigated in great detail by Sauer and colleagues.60 As inthe case of MR121,60 dynamic quenching of Alexa 488 and 594by Trp is close to the value expected for a diffusion-limitedprocess that can be quantified experimentally by fluorescencelifetime measurements. The two Alexa dyes also form anonfluorescent complex with Trp with an affinity that is onlytwo- to 4-fold lower than for MR121, and that is stable for tensof nanoseconds and can thus be observed by nsFCS.Given these characteristics, single-molecule FRET between
Alexa 488 and 594 can be combined with PET between one ofthe dyes and Trp in one molecular system. In the exampleinvestigated here, the FRET process provides informationabout the distance between the Alexa dyes spaced by a rigidpolyproline linker, and the PET process monitors the contactformation of one of the dyes with Trp incorporated in a flexiblepeptide tail. However, the two photophysical processes can nolonger be treated independently. The most obvious indicationis the change in apparent transfer efficiencies caused by thequenching of the FRET dyes (Figure 4). Similarly, the PETprocess is modulated by FRET, and the resulting nsFCS curveswill exhibit signatures of both electron and energy transfer. Thesimple analysis of nsFCS measurements of PET in terms ofsingle-exponential decays and correlation amplitudes60 is thusno longer sufficient. A solution to this problem is provided byusing a complete kinetic model that takes into account bothprocesses (Figure 1) and can be used to calculate the completephoton statistics of the corresponding measurements accordingto the procedures developed by Gopich and Szabo,15,16,26,52
including the photon emission rates and the fluorescencecorrelation functions. Here, we implemented this approach in away that allows direct fitting of the entire kinetic model to thensFCS data, i.e., the donor and acceptor autocorrelationfunctions and the donor−acceptor crosscorrelation functions,in a global analysis. Since many of the photophysical parametersof the model can be determined independently, a robustanalysis of the PET dynamics and the resulting changes in theobserved transfer efficiencies is possible. Note that even theamplitudes of the correlation functions are captured quantita-tively by the kinetic model, which provides an importantconstraint for the description of the system.To enable systematic variation of the quenching efficiency by
PET, the position of the Trp residue in the disordered tail ofthe peptide was varied, with a sequence separation betweenquenched fluorophore and Trp ranging from three to nine
Figure 9. Ratios of collisional quenching rate constant, kq, and the on-rate constant, kon, for dye−Trp complex formation. The values foundfor the peptide constructs (W3, W5, W7, W9) are compared with theratio found for dye and Trp free in solution (Dye/Trp). Green and redsymbols represent the values for donor and acceptor quenching,respectively. Values for the variants with C5 dye linkers (framedsymbols) and C2 dye linkers (unframed symbols) are shown.
The Journal of Physical Chemistry B Article
dx.doi.org/10.1021/jp402352s | J. Phys. Chem. B XXXX, XXX, XXX−XXXK

residues. The use of Gly-Ser peptides allows a directcomparison to previous experiments on contact formation insequences of this type using PET34,60 or triplet−triplet energytransfer.67,68 Additionally, the FRET dyes were conjugated inboth permutations to probe the effect of selective quenching ofeither the FRET donor or the acceptor, and the length of thedye linkers was varied. In terms of transfer efficiencies (Figures4, 5), the effects are most pronounced for quenching of theFRET acceptor, since in this case virtually only the emission ofAlexa 594 is affected. In the case of quenching of the donor,Alexa 488, the emission of both FRET dyes is reduced to verysimilar extents and the apparent FRET efficiencies are onlyweakly affected (by the dynamic quenching contribution). Thisbehavior is also reflected in the correlation functions (Figure 7).Acceptor quenching is essentially only visible in the acceptorautocorrelation function, but donor quenching affects bothautocorrelations and the crosscorrelation function to similarextents. As expected, the effect of quenching and the stability ofthe Trp-fluorophore complex increases with decreasingsequence separation of fluorophore and Trp (Figure 8). Theorigin of this trend, however, is somewhat unexpected: whilethe on-rate for the intramolecular formation of the complexbetween Trp and FRET dye is essentially independent of theirsequence separation over the range investigated here, the off-rate increases with increasing sequence separation. The formerobservation is in agreement with previous experiments on shortflexible peptides32,34,60,67−69 and has been attributed to stiffnesseffects of the chain in a range of segment lengths close to thepersistence length, where simple polymer scaling behaviorbreaks down.32,69−72 The detailed molecular origin of thechange in off-rate is currently not clear. However, thepronounced effects of even small changes in linker length ofthe FRET dyes on the PET process (Figure 8) indicates thatsteric aspects play an important role, such as the possiblerelative orientations of dye and Trp and conformational strainfrom the linker peptide. To our knowledge, no comparable datafor the off-rates have been reported in the literature. The on-rates, however, are similar to previously reported values. Theyrange from ∼0.02 ns−1 to ∼0.06 ns−1, compared to ∼0.08 ns−1
for terminal contact formation and ∼0.03 ns−1 for internalcontact formation in Gly-Ser peptides of similar length.73 Thisagreement provides additional support for the validity of ouranalysis. Molecular simulations might allow a more detailedassignment of the possible role of steric effects in the observedbehavior.Finally, the kinetic parameters determined from our analysis
can be used to account for the effect of PET quenching on thetransfer efficiency histograms (Figure 4, Figure S3), and theagreement of the corrected transfer efficiencies with thehistograms in the Trp-free peptides confirms the consistencyof the results. We want to point out that PET quenching byTrp (and to a lesser extent by other amino acids59,60) can thusalso affect FRET experiments in natural proteins and distort theobserved transfer efficiency distributions and fluorescencecorrelation functions. In the presence of Trp in the sequence,it is therefore essential to exclude the influence of such effects ifquantitative information on distances or distance dynamics areto be determined from the experimental data. The mosteffective way of identifying complications of this type is aquantitative comparison of transfer efficiencies from photoncount rates and fluorescence lifetimes in multiparameteranalyses12,74 and auto- and crosscorrelations of FRET donorand acceptor fluorescence.13,49 In the absence of PET
quenching, the transfer efficiencies from photon count ratesand fluorescence lifetimes should be in agreement. Further-more, PET quenching leads to characteristic correlatedfluctuations of the photon signal apparent in the nsFCSexperiments (Figure 7). Note that the effect of PET quenchingcan be clearly distinguished from distance dynamics betweenFRET donor and acceptor by comparing auto- and cross-correlations: FRET-based measurements of distance dynamicslead to correlated fluctuations visible in the donor and acceptorfluorescence autocorrelations, but to anticorrelated behavior inthe donor−acceptor crosscorrelation functions13,49 (withidentical relaxation times16). It is thus essential to analyzeauto- and crosscorrelation functions globally to ensure a correctinterpretation of the results. In case of doubt, it is advisable toprepare a Trp-free variant of the protein or peptide underinvestigation to allow an unequivocal assignment of the effect.The same concepts and methods used here can of course alsobe employed in a subpopulation-specific analysis of thecorrelation functions.26 However, for dynamics on the fasttime scales investigated here, the measurement times wouldhave to be extended significantly to obtain sufficient photonstatistics.
■ CONCLUSION
The combination of single-molecule FRET and PET opens upa range of applications and future developments. The FRET/PET approach extends the accessible distance range for theinvestigation of intra- and intermolecular dynamics incomplementarity to multicolor FRET, whose scope is limitedby the relatively large Forster radii of current FRET pairssuitable for single-molecule spectroscopy. Note that PET is notlimited to the submicrosecond time scale monitored here andcould be used for slower processes, e.g. large conformationalchanges, if fluorophore and quencher come into sufficientlyclose contact. Since Trp is by far the most efficient quencher oftypical FRET dyes, the direct combination of FRET and PET isalso highly suitable for nonsynthetic polypeptides; as a naturalamino acid, Trp can easily be incorporated at suitable positionsin recombinant proteins. An important next step will be toextend the FRET/PET approach in a way that allowsinformation on dynamics to be extracted not only from thePET but also from the FRET process, e.g. to probe correlationsbetween local and nonlocal distance fluctuations within aprotein or peptide. The methods and the kinetic model usedhere can easily be amended for this purpose in analogy to theapproach used for extracting long-range distance dynamicsfrom single-molecule FRET and nsFCS.13,16,26,49,75 We thusexpect that this combined approach will allow previouslyinaccessible questions in biomolecular dynamics and mecha-nisms to be answered.
■ ASSOCIATED CONTENT
*S Supporting InformationStern−Volmer analysis for Alexa 488C5 and Alexa 594C5. Thecomplete set of the nsFCS data together with the fits for the C2and C5 dye-linker variants. Transfer efficiency histograms forthe C2 dye-linker variants. Alexa 594 direct excitation controls.This material is available free of charge via the Internet athttp://pubs.acs.org.
The Journal of Physical Chemistry B Article
dx.doi.org/10.1021/jp402352s | J. Phys. Chem. B XXXX, XXX, XXX−XXXL

■ AUTHOR INFORMATIONCorresponding Author*E-mail: [email protected] (B.S.); [email protected](D.N.).NotesThe authors declare no competing financial interest.
■ ACKNOWLEDGMENTSThis work was supported by the Swiss National ScienceFoundation, the Swiss National Center of Competence inResearch (NCCR) for Structural Biology, and a Starting Grantof the European Research Council.
■ REFERENCES(1) Bai, C.; Wang, C.; Xie, X. S.; Wolynes, P. G. Single MoleculePhysics and Chemistry. Proc. Natl. Acad. Sci. U.S.A. 1999, 96, 11075−11076.(2) Dunkle, J. A.; Cate, J. H. D.; Rees, D. C.; Dill, K. A.; Williamson,J. R. Ribosome Structure and Dynamics During Translocation andTermination. Annu. Rev. Biophys. 2010, 39, 227−244.(3) Marshall, R. A.; Aitken, C. E.; Dorywalska, M.; Puglisi, J. D.Translation at the Single-Molecule Level. Annu. Rev. Biochem. 2008,77, 177−203.(4) Greenleaf, W. J.; Woodside, M. T.; Block, S. M. High-Resolution,Single-Molecule Measurements of Biomolecular Motion. Annu. Rev.Biophys. Biomol. Struct. 2007, 36, 171−190.(5) Kapanidis, A. N.; Strick, T. Biology, One Molecule at a Time.Trends Biochem. Sci. 2009, 34, 234−243.(6) Ha, T.; Kozlov, A. G.; Lohman, T. M.; Rees, D. C. Single-Molecule Views of Protein Movement on Single-Stranded DNA. Annu.Rev. Biophys. 2012, 41, 295−319.(7) Smiley, R. D.; Hammes, G. G. Single Molecule Studies of EnzymeMechanisms. Chem. Rev. 2006, 106, 3080−3094.(8) Zhuang, X. W. Single-Molecule RNA Science. Annu. Rev. Biophys.Biomol. Struct. 2005, 34, 399−414.(9) Schuler, B.; Hofmann, H. Single-Molecule Spectroscopy ofProtein Folding Dynamics − Expanding Scope and Timescales. Curr.Opin. Struct. Biol. 2013, 23, 36−47.(10) Borgia, A.; Williams, P. M.; Clarke, J. Single-Molecule Studies ofProtein Folding. Annu. Rev. Biochem. 2008, 77, 101−125.(11) Selvin, P. R.; Ha, T. Single-Molecule Techniques: A LaboratoryManual; Cold Spring Harbor Laboratory Press: New York, 2008.(12) Sisamakis, E.; Valeri, A.; Kalinin, S.; Rothwell, P. J.; Seidel, C. A.M. Accurate Single-Molecule FRET Studies Using MultiparameterFluorescence Detection. Methods Enzymol. 2010, 475, 455−514.(13) Soranno, A.; Buchli, B.; Nettels, D.; Muller-Spath, S.; Cheng, R.R.; Pfeil, S. H.; Hoffmann, A.; Lipman, E. A.; Makarov, D. E.; Schuler,B. Quantifying Internal Friction in Unfolded and IntrinsicallyDisordered Proteins with Single Molecule Spectroscopy. Proc. Natl.Acad. Sci. U.S.A. 2012, 109, 17800−17806.(14) Gopich, I. V.; Szabo, A. Single-Molecule FRET with Diffusionand Conformational Dynamics. J. Phys. Chem. B 2007, 111, 12925−12932.(15) Gopich, I. V.; Szabo, A. Theory of Photon Counting in Single-Molecule Spectroscopy. In Theory and Evaluation of Single-MoleculeSignals; Barkai, E., Brown, F. L. H., Orrit, M., Yang, H., Eds.; WorldScientific Pub. Co.: Singapore, 2009; pp 1−64.(16) Gopich, I. V.; Nettels, D.; Schuler, B.; Szabo, A. ProteinDynamics from Single-Molecule Fluorescence Intensity CorrelationFunctions. J. Chem. Phys. 2009, 131, 095102−095106.(17) Gopich, I. V.; Szabo, A. Decoding the Pattern of Photon Colorsin Single-Molecule FRET. J. Phys. Chem. B 2009, 113, 10965−10973.(18) Gopich, I. V.; Szabo, A. FRET Efficiency Distributions ofMultistate Single Molecules. J. Phys. Chem. B 2010, 114, 15221−15226.(19) Kalinin, S.; Valeri, A.; Antonik, M.; Felekyan, S.; Seidel, C. A.Detection of Structural Dynamics by FRET: A Photon Distribution
and Fluorescence Lifetime Analysis of Systems with Multiple States. J.Phys. Chem. B 2010, 114, 7983−7995.(20) Hyeon, C.; Lee, J.; Yoon, J.; Hohng, S.; Thirumalai, D. HiddenComplexity in the Isomerization Dynamics of Holliday Junctions. Nat.Chem. 2012, 4, 907−914.(21) Gopich, I. V.; Szabo, A. Theory of the Energy TransferEfficiency and Fluorescence Lifetime Distribution in Single-MoleculeFRET. Proc. Natl. Acad. Sci. U.S.A. 2012, 109, 7747−7752.(22) Laurence, T. A.; Kong, X. X.; Jager, M.; Weiss, S. ProbingStructural Heterogeneities and Fluctuations of Nucleic Acids andDenatured Proteins. Proc. Natl. Acad. Sci. U.S.A. 2005, 102, 17348−17353.(23) Hoffmann, A.; Kane, A.; Nettels, D.; Hertzog, D. E.; Baumgartel,P.; Lengefeld, J.; Reichardt, G.; Horsley, D. A.; Seckler, R.; Bakajin, O.;Schuler, B. Mapping Protein Collapse with Single-MoleculeFluorescence and Kinetic Synchrotron Radiation Circular DichroismSpectroscopy. Proc. Natl. Acad. Sci. U.S.A. 2007, 104, 105−110.(24) Chung, H. S.; Gopich, I. V.; McHale, K.; Cellmer, T.; Louis, J.M.; Eaton, W. A. Extracting Rate Coefficients from Single-MoleculePhoton Trajectories and FRET Efficiency Histograms for a Fast-Folding Protein. J. Phys. Chem. A 2011, 115, 3642−3656.(25) Hoffmann, A.; Nettels, D.; Clark, J.; Borgia, A.; Radford, S. E.;Clarke, J.; Schuler, B. Quantifying Heterogeneity and ConformationalDynamics from Single Molecule FRET of Diffusing Molecules:Recurrence Analysis of Single Particles (RASP). Phys. Chem. Chem.Phys. 2011, 13, 1857−1871.(26) Nettels, D.; Gopich, I. V.; Hoffmann, A.; Schuler, B. UltrafastDynamics of Protein Collapse from Single-Molecule Photon Statistics.Proc. Natl. Acad. Sci. U.S.A. 2007, 104, 2655−2660.(27) Schuler, B.; Eaton, W. A. Protein Folding Studied by Single-Molecule FRET. Curr. Opin. Struct. Biol. 2008, 18, 16−26.(28) Doose, S.; Neuweiler, H.; Sauer, M. Fluorescence Quenching byPhotoinduced Electron Transfer: A Reporter for ConformationalDynamics of Macromolecules. ChemPhysChem 2009, 10, 1389−1398.(29) Neuweiler, H.; Sauer, M. Using Photoinduced Charge TransferReactions to Study Conformational Dynamics of Biopolymers at theSingle-Molecule Level. Curr. Pharm. Biotechnol. 2004, 5, 285−298.(30) Hagen, S. J.; Hofrichter, J.; Szabo, A.; Eaton, W. A. Diffusion-Limited Contact Formation in Unfolded Cytochrome c: Estimatingthe Maximum Rate of Protein Folding. Proc. Natl. Acad. Sci. U.S.A.1996, 93, 11615−11617.(31) Bieri, O.; Wirz, J.; Hellrung, B.; Schutkowski, M.; Drewello, M.;Kiefhaber, T. The Speed Limit for Protein Folding Measured byTriplet−Triplet Energy Transfer. Proc. Natl. Acad. Sci. U.S.A. 1999, 96,9597−9601.(32) Lapidus, L. J.; Eaton, W. A.; Hofrichter, J. Measuring the Rate ofIntramolecular Contact Formation in Polypeptides. Proc. Natl. Acad.Sci. U.S.A. 2000, 97, 7220−7225.(33) Noe, F.; Doose, S.; Daidone, I.; Lollmann, M.; Sauer, M.;Chodera, J. D.; Smith, J. C. Dynamical Fingerprints for ProbingIndividual Relaxation Processes in Biomolecular Dynamics withSimulations and Kinetic Experiments. Proc. Natl. Acad. Sci. U.S.A.2011, 108, 4822−4827.(34) Neuweiler, H.; Lollmann, M.; Doose, S.; Sauer, M. Dynamics ofUnfolded Polypeptide Chains in Crowded Environment Studied byFluorescence Correlation Spectroscopy. J. Mol. Biol. 2007, 365, 856−869.(35) Neuweiler, H.; Banachewicz, W.; Fersht, A. R. Kinetics of ChainMotions within a Protein-Folding Intermediate. Proc. Natl. Acad. Sci.U.S.A. 2010, 107, 22106−22110.(36) Neuweiler, H.; Johnson, C. M.; Fersht, A. R. Direct Observationof Ultrafast Folding and Denatured State Dynamics in Single ProteinMolecules. Proc. Natl. Acad. Sci. U.S.A. 2009, 106, 18569−18574.(37) Onuchic, J. N.; Wang, J.; Wolynes, P. G. Analyzing SingleMolecule Trajectories on Complex Energy Landscapes Using ReplicaCorrelation Functions. Chem. Phys. 1999, 247, 175−184.(38) Hohng, S.; Joo, C.; Ha, T. Single-Molecule Three-Color FRET.Biophys. J. 2004, 87, 1328−1337.
The Journal of Physical Chemistry B Article
dx.doi.org/10.1021/jp402352s | J. Phys. Chem. B XXXX, XXX, XXX−XXXM

(39) Clamme, J. P.; Deniz, A. A. Three-Color Single-MoleculeFluorescence Resonance Energy Transfer. ChemPhysChem 2005, 6,74−77.(40) Lee, N. K.; Kapanidis, A. N.; Koh, H. R.; Korlann, Y.; Ho, S. O.;Kim, Y.; Gassman, N.; Kim, S. K.; Weiss, S. Three-Color Alternating-Laser Excitation of Single Molecules: Monitoring Multiple Interactionsand Distances. Biophys. J. 2007, 92, 303−312.(41) Lee, J.; Lee, S.; Ragunathan, K.; Joo, C.; Ha, T.; Hohng, S.Single-Molecule Four-Color FRET. Angew. Chem., Int. Ed. 2010, 49,9922−9925.(42) Kubelka, J.; Hofrichter, J.; Eaton, W. A. The Protein Folding‘Speed Limit’. Curr. Opin. Struct. Biol. 2004, 14, 76−88.(43) Bryngelson, J. D.; Onuchic, J. N.; Socci, N. D.; Wolynes, P. G.Funnels, Pathways, and the Energy Landscape of Protein Folding: ASynthesis. Proteins 1995, 21, 167−195.(44) Onuchic, J. N.; Luthey Schulten, Z.; Wolynes, P. G. Theory ofProtein Folding: The Energy Landscape Perspective. Annu. Rev. Phys.Chem. 1997, 48, 545−600.(45) Oliveberg, M.; Wolynes, P. G. The Experimental Survey ofProtein-Folding Energy Landscapes. Q. Rev. Biophys. 2005, 38, 245−288.(46) Dill, K. A.; Ozkan, S. B.; Shell, M. S.; Weikl, T. R. The ProteinFolding Problem. Annu. Rev. Biophys. 2008, 37, 289−316.(47) Shakhnovich, E. Protein Folding Thermodynamics andDynamics: Where Physics, Chemistry, and Biology Meet. Chem. Rev.2006, 106, 1559−1588.(48) Thirumalai, D.; O’Brien, E. P.; Morrison, G.; Hyeon, C.Theoretical Perspectives on Protein Folding. Annu. Rev. Biophys. 2010,39, 159−183.(49) Nettels, D.; Hoffmann, A.; Schuler, B. Unfolded Protein andPeptide Dynamics Investigated with Single-Molecule FRET andCorrelation Spectroscopy from Picoseconds to Seconds. J. Phys.Chem. B 2008, 112, 6137−6146.(50) Lakowicz, J. R. Principles of Fluorescence Spectroscopy, 2nd ed.;Kluwer Academic/Plenum Publishers: New York, 1999.(51) Hanbury Brown, R.; Twiss, R. Q. Correlation between Photonsin Two Coherent Beams of Light. Nature 1956, 177, 27−29.(52) Gopich, I. V.; Szabo, A. Theory of the Statistics of KineticTransitions with Application to Single-Molecule Enzyme Catalysis. J.Chem. Phys. 2006, 124, 154712−154732.(53) Hubner, C. G.; Zumofen, G.; Renn, A.; Herrmann, A.; Mullen,K.; Basche, T. Photon Antibunching and Collective Effects in theFluorescence of Single Bichromophoric Molecules. Phys. Rev. Lett.2003, 91, 093903−093906.(54) Single Molecule Detection in Solution, Methods and Applications;Zander, C., Enderlein, J., Keller, R. A., Eds.; Wiley-VCH: Berlin, 2002.(55) Fleury, L.; Segura, J. M.; Zumofen, G.; Hecht, B.; Wild, U. P.Nonclassical Photon Statistics in Single-Molecule Fluorescence atRoom Temperature. Phys. Rev. Lett. 2000, 84, 1148−1151.(56) Koppel, D. E. Statistical Accuracy in Fluorescence CorrelationSpectroscopy. Phys. Rev. A 1974, 10, 1938−1945.(57) Van Der Meer, B. W., Coker, G., III, Chen, S. Y. S. ResonanceEnergy Transfer: Theory and Data; VCH Publishers, Inc.: New York,1994.(58) Schuler, B. Application of Single Molecule Forster ResonanceEnergy Transfer to Protein Folding. Methods Mol. Biol. 2007, 350,115−138.(59) Chen, H. M.; Ahsan, S. S.; Santiago-Berrios, M. B.; Abruna, H.D.; Webb, W. W. Mechanisms of Quenching of Alexa Fluorophores byNatural Amino Acids. J. Am. Chem. Soc. 2010, 132, 7244−7245.(60) Doose, S.; Neuweiler, H.; Sauer, M. A Close Look atFluorescence Quenching of Organic Dyes by Tryptophan. Chem-PhysChem 2005, 6, 2277−2285.(61) Poling, B. E.; Prausnitz, J. M.; O’Connell, J. P. The Properties ofGases and Liquids, 5th ed.; McGraw-Hill: New York/London, 2000.(62) Vaiana, A. C.; Neuweiler, H.; Schulz, A.; Wolfrum, J.; Sauer, M.;Smith, J. C. Fluorescence Quenching of Dyes by Tryptophan:Interactions at Atomic Detail from Combination of Experiment andComputer Simulation. J. Am. Chem. Soc. 2003, 125, 14564−14572.
(63) Choi, J.; Kim, S.; Tachikawa, T.; Fujitsuka, M.; Majima, T.Unfolding Dynamics of Cytochrome c Revealed by Single-Moleculeand Ensemble-Averaged Spectroscopy. Phys. Chem. Chem. Phys. 2011,13, 5651−5658.(64) Schuler, B.; Lipman, E. A.; Steinbach, P. J.; Kumke, M.; Eaton,W. A. Polyproline and the “Spectroscopic Ruler” Revisited with SingleMolecule Fluorescence. Proc. Natl. Acad. Sci. U.S.A. 2005, 102, 2754−2759.(65) Best, R.; Merchant, K.; Gopich, I. V.; Schuler, B.; Bax, A.; Eaton,W. A. Effect of Flexibility and Cis Residues in Single Molecule FRETStudies of Polyproline. Proc. Natl. Acad. Sci. U.S.A. 2007, 104, 18964−18969.(66) Doose, S.; Neuweiler, H.; Barsch, H.; Sauer, M. ProbingPolyproline Structure and Dynamics by Photoinduced ElectronTransfer Provides Evidence for Deviations from a Regular PolyprolineType II Helix. Proc. Natl. Acad. Sci. U.S.A. 2007, 104, 17400−17405.(67) Krieger, F.; Moglich, A.; Kiefhaber, T. Effect of Proline andGlycine Residues on Dynamics and Barriers of Loop Formation inPolypeptide Chains. J. Am. Chem. Soc. 2005, 127, 3346−3352.(68) Krieger, F.; Fierz, B.; Bieri, O.; Drewello, M.; Kiefhaber, T.Dynamics of Unfolded Polypeptide Chains as Model for the EarliestSteps in Protein Folding. J. Mol. Biol. 2003, 332, 265−274.(69) Lapidus, L. J.; Steinbach, P. J.; Eaton, W. A.; Szabo, A.;Hofrichter, J. Effects of Chain Stiffness on the Dynamics of LoopFormation in Polypeptides. Appendix: Testing a 1-DimensionalDiffusion Model for Peptide Dynamics. J. Phys. Chem. B 2002, 106,11628−11640.(70) Guo, Z. Y.; Thirumalai, D. Kinetics of Protein-Folding −Nucleation Mechanism, Time Scales, and Pathways. Biopolymers 1995,36, 83−102.(71) Camacho, C. J.; Thirumalai, D. Theoretical Predictions ofFolding Pathways by Using the Proximity Rule, with Applications toBovine Pancreatic Trypsin-Inhibitor. Proc. Natl. Acad. Sci. U.S.A. 1995,92, 1277−1281.(72) Thirumalai, D. Time Scales for the Formation of the MostProbable Tertiary Contacts in Proteins with Applications toCytochrome c. J. Phys. Chem. B 1999, 103, 608−610.(73) Fierz, B.; Kiefhaber, T. End-to-End vs Interior Loop FormationKinetics in Unfolded Polypeptide Chains. J. Am. Chem. Soc. 2007, 129,672−679.(74) Kudryavtsev, V.; Sikor, M.; Kalinin, S.; Mokranjac, D.; Seidel, C.A. M.; Lamb, D. C. Combining MFD and PIE for Accurate Single-PairForster Resonance Energy Transfer Measurements. ChemPhysChem2012, 13, 1060−1078.(75) Borgia, A.; Wensley, B. G.; Soranno, A.; Nettels, D.; Borgia, M.;Hoffmann, A.; Pfeil, S. H.; Lipman, E. A.; Clarke, J.; Schuler, B.Localizing Internal Friction Along the Reaction Coordinate of ProteinFolding by Combining Ensemble and Single Molecule FluorescenceSpectroscopy. Nat. Commun. 2012, 2, 1195.
The Journal of Physical Chemistry B Article
dx.doi.org/10.1021/jp402352s | J. Phys. Chem. B XXXX, XXX, XXX−XXXN
S1
Supporting Information
Intramolecular Distances and Dynamics from the Combined
Photon Statistics of Single-Molecule FRET and Photoinduced
Electron Transfer
Dominik Haenni†, Franziska Zosel
†, Luc Reymond
‡, Daniel Nettels
†,* and Benjamin Schuler
†,*
† University of Zurich, Departement of Biochemistry, Winterthurerstrasse 190, CH-8057 Zürich, Switzerland
‡ Institute of Chemical Sciences and Engineering (ISIC), École Polytechnique Fédérale de Lausanne (EPFL), CH-1015 Lausanne, Switzerland
* To whom correspondence should be addressed. E-mail: [email protected], [email protected]

S2
Dye-Trp fluorescence emission spectra and Stern-Volmer plots. To analyze the static quenching of Alexa 488 and Alexa 594 by Trp and to test whether the dye-Trp complex is non-fluorescent, we recorded fluorescence emission spectra of free dye in the presence of Trp. The resulting spectra taken
for Trp concentrations ranging from 0 to100 mM are depicted in Figure S1a-c. The ratios 0 /I I of the
integrated intensities are shown in the Stern-Volmer plots (Figure S1d-f). 0I is the integrated
fluorescence intensity in the absence of Trp. The data could be described assuming a combination of static and dynamic quenching processes1:
[ ] [ ]0 (1 ) (1 )S D
IK Trp K Trp
I= + ⋅ + , (1)
where SK an DK are the Stern-Volmer constants for static and dynamic quenching, respectively. We
obtained DK from fluorescence lifetime measurements (see main text) and varied SK for fitting the
data. The fits (red lines) yielded static quenching constants KS of 15 M-1 for Alexa 488 and 30 M-1 for
Alexa 594. These values are in good agreement with the ones obtained from nsFCS measurements (17 M-1 for Alexa 488 and 30 M-1 for Alexa 594, see main text). Additionally, we also show the static
quenching contribution alone by dividing the data by [ ](1 )DK Trp+ (blue lines in Figure S1d-f). To
confirm that the dye-Trp complex is non-fluorescent, we fit the data with a more general model that includes a term describing a potential residual fluorescence intensity Ires of the dye-Trp complex:
[ ] [ ]0 [ ]1
1 1 1 [ ]S
res
D S S
I K TrpI I
K Trp K Trp K Trp= ⋅ +
+ + +. (2)
Data and fits are shown in Figure S1g-i. Again, we used the KD values from the fluorescence lifetime measurements. Ires was constrained to nonnegative values. We obtained essentially the same values for KS as from the fits above and the found values for Ires to be virtually zero (~10
-9). Since the extrapolation is sensitive to small experimental errors, we repeated the measurements for Alexa 488 at pH 2.5 to increase the solubility of Trp. This enabled us to measure at Trp concentrations up to 100 mM. The resulting value for KS (26.5 M
-1) is significantly higher than the value found at pH 7.2. The residual fluorescence intensity of the dye-Trp complex is again virtually zero. We conclude that the data agree within error with our assumption that the dye-Trp complex is non-fluorescent. The assumption is also supported by our observation that with increasing quencher concentration, we observe only a decrease in amplitude, but no change in the shape of the spectra. The spectra are hence not a superposition of two different spectra, as might be expected for a fluorescent dye-Trp complex.
Calculation of diffusion coefficients. The diffusion coefficients of the dyes (including the hydrolyzed linker) and of Trp were calculated using the Wilkie-Chang estimation method combined with the additive method by Schroeder for estimating molar volumes at the normal boiling point2. The obtained molar volume for Trp is 217 cm3 mol-1 and the corresponding diffusion coefficient in water at 25 °C is 6.7·10-6 cm2 s-1, which is in good agreement with reported values1,3. For Alexa 488, we obtained a molar volume of 644 cm3 mol-1 and for Alexa 594 of 896 cm3 mol-1. Using these values to calculate the diffusion coefficients, we obtained 3.5·10-6 cm2 s-1 for Alexa 488 and 2.9·10-6 cm2 s-1 for Alexa 594. For Alexa 488, dual-focus FCS measurements4 performed in our laboratory yielded a diffusion coefficient of 3.7·10-6 cm2 s-1, in good agreement with the calculated value.

S3
Figure S1. Fluorescence quenching of Alexa 488 and Alexa 594 by free Trp. (a-c) Fluorescence emission spectra of Alexa 488 (a: pH 7.2, b: pH 2.5) and Alexa 594 (c: pH 7.2) for increasing Trp concentrations (blue to red: 0-60 mM Trp (a, c), 0-100 mM Trp (b)). (d-f) Stern-Volmer plots obtained from integrated intensities of the spectra (lighter colored symbols). The data were fitted with the Stern-Volmer equation (Eq. 1) (red curves). The
darker points and the blue curves are obtained by division of the data and the fits by [ ](1 )DK Trp+ . The
normalized integrated intensities are also represented in (g-i), where the blue curves represent fits with an extended Stern-Volmer model (Eq. 2).

S4
Figure S2. Mean acceptor fluorescence lifetimes measured for the constructs with quenched donor (A488C5). As expected, the lifetimes of the peptides containing Trp (W3-W9) do not differ significantly from the reference (Ref) without Trp. This indicates that there is no dynamic quenching of the fluorescent dye attached to the N-terminal Gly of the peptides. Only the fluorescence of the dye attached to the cysteine is quenched. The statistical uncertainties estimated as standard deviations from two to three independent measurements are within the size of the symbols

S5
Figure S3. Transfer efficiency histograms measured with the peptide constructs Ref, W3, W5, W7, and W9 with the C2 dye-linker. The left group of histograms (a, b) contain data from peptides with a quenched donor (A488C2), and the right group (c, d) data from peptides with a quenched acceptor (A594C2). Reference histograms (Ref) from constructs lacking Trp are included. The left (a, c) and right (b, d) columns of each group show histograms without and with correction for dynamic and static quenching, respectively. Dashed black lines indicate the positions of the peak maxima of the reference measurements. (Corresponding histograms for the constructs with C5 linkers are shown in the main text.)

S6
Figure S4. nsFCS data obtained from the A488C2-constructs (Ref, W3-W9). For all measurements, the donor-donor (green), donor-acceptor (orange), and acceptor-acceptor (red) nsFCS curves are shown. For each set,
model correlation curves ( )DD
G τ , ( )DA
G τ , and ( )AA
G τ (blue lines) were fitted globally to the data.

S7
Figure S5. nsFCS data obtained from the A488C5-constructs (Ref, W3-W9). For all measurements, the donor-donor (green), donor-acceptor (orange), and acceptor-acceptor (red) nsFCS curves are shown. For each set,
model correlation curves ( )DD
G τ , ( )DA
G τ , and ( )AA
G τ (blue lines) were fitted globally to the data.

S8
Figure S6. nsFCS data obtained from the A594C2-constructs (Ref, W3-W9). For all measurements, the donor-donor (green), donor-acceptor (orange), and acceptor-acceptor (red) nsFCS curves are shown. For each set,
model correlation curves ( )DD
G τ , ( )DA
G τ , and ( )AA
G τ (blue lines) were fitted globally to the data.
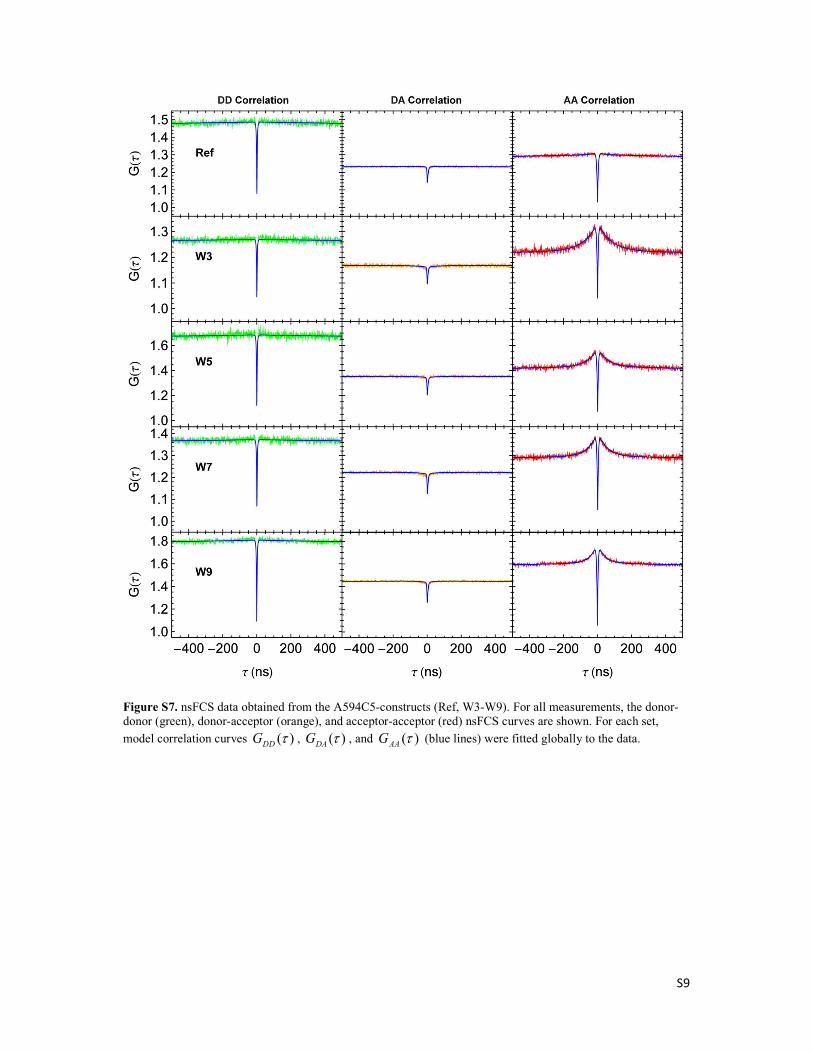
S9
Figure S7. nsFCS data obtained from the A594C5-constructs (Ref, W3-W9). For all measurements, the donor-donor (green), donor-acceptor (orange), and acceptor-acceptor (red) nsFCS curves are shown. For each set,
model correlation curves ( )DD
G τ , ( )DA
G τ , and ( )AA
G τ (blue lines) were fitted globally to the data.

S10
Figure S8. Acceptor-acceptor nsFCS data of peptides with quenched Alexa 594C2 (a) and Alexa 594C5 (b) upon direct excitation of the acceptor at 595 nm. The colors indicate the position of Trp: red (W3), orange (W5), green (W7), blue (W9), black (Ref without Trp). For easier comparison, the curves are offset by 0.16. (c) On-
and off-rate constants obtained from photon statistics fits to the nsFCS data in (a) and (b). Represented are: AQ
onk
(downward triangles) and AQ
offk (upward triangles). Values for the variants with C5 dye-linkers (framed
symbols) and C2 dye-linkers (unframed symbols) are shown. The nsFCS data together with the fits are also presented in Figure S10. Error bars indicate statistical uncertainties estimated as standard deviations from two to three independent measurements. In the cases where the error bars are invisible, they are smaller than the size of the symbols.

S11
Figure S9. Acceptor-acceptor nsFCS data from Alexa 594C2 constructs (left column) and Alexa 594C5 constructs (right column) upon direct excitation of the acceptor at 595 nm. Fits are shown in blue.

S12
Figure S10. Acceptor-acceptor nsFCS data from the peptides W3-W9 with a quenched donor, Alexa 488C2 (a) and Alexa 488C5 (b) upon direct excitation of the acceptor at 595 nm. The colors indicate the position of Trp: red (W3), orange (W5), green (W7), blue (W9). For easier comparison, the curves are offset by 0.16. The difference in the noise levels between (a) and (b) are due to different measurement times. No static quenching component is observed in these correlation data.
References
(1) Lakowicz, J. R. Principles of Fluorescence Spectroscopy, 2nd ed.; Kluwer Academic/Plenum Publishers: New York, 1999 (2) Poling, B. E.; Prausnitz, J. M.; O'Connell, J. P. The Properties of Gases and Liquids, 5th ed. ed.; McGraw-Hill: New York ; London, 2000 (3) Polson, A. On the Diffusion Constants of the Amino-Acids. Biochemical Journal 1937, 31, 1903-1912 (4) Dertinger, T.; Pacheco, V.; von der Hocht, I.; Hartmann, R.; Gregor, I.; Enderlein, J. Two-Focus Fluorescence Correlation Spectroscopy: A New Tool for Accurate and Absolute Diffusion Measurements. Chemphyschem 2007, 8, 433-443