interventions and supports to ameliorate math anxiety in k
TRANSCRIPT

Brigham Young University Brigham Young University
BYU ScholarsArchive BYU ScholarsArchive
Theses and Dissertations
2020-12-10
Interventions and Supports to Ameliorate Math Anxiety in K-12 Interventions and Supports to Ameliorate Math Anxiety in K-12
Schools: A Meta-Analysis of Experimental Group Design Research Schools: A Meta-Analysis of Experimental Group Design Research
Madeline Rose Hardy Brigham Young University
Follow this and additional works at: https://scholarsarchive.byu.edu/etd
Part of the Education Commons
BYU ScholarsArchive Citation BYU ScholarsArchive Citation Hardy, Madeline Rose, "Interventions and Supports to Ameliorate Math Anxiety in K-12 Schools: A Meta-Analysis of Experimental Group Design Research" (2020). Theses and Dissertations. 8757. https://scholarsarchive.byu.edu/etd/8757
This Thesis is brought to you for free and open access by BYU ScholarsArchive. It has been accepted for inclusion in Theses and Dissertations by an authorized administrator of BYU ScholarsArchive. For more information, please contact [email protected], [email protected].

Interventions and Supports to Ameliorate Math Anxiety in K-12 Schools: A Meta-Analysis
of Experimental Group Design Research
Madeline Hardy
A thesis submitted to the faculty of Brigham Young University
in partial fulfillment of the requirements for the degree of
Master of Science
Cade T. Charlton, Ph.D., Chair Jared R. Morris, Ph.D.
Christian V. Sabey, Ph.D.
Department of Counseling Psychology and Special Education
Brigham Young University
Copyright © 2020 Madeline Hardy
All Rights Reserved

ABSTRACT
Interventions and Supports to Ameliorate Math Anxiety in K-12 Schools: A Meta-Analysis of Experimental Group Design Research
Madeline Hardy Department of Counseling Psychology and Special Education, BYU
Master of Science
“Math anxiety is commonly defined as a feeling of tension, apprehension, or fear that interferes with math performance” (Ashcraft, 2002, p. 181). Symptoms of math anxiety are reported by 33% of students by the time they reach the age of 15, possibly contributing to this workforce dilemma (Organisation for Economic Co-operation and Development, 2013). Many models and perspectives of math anxiety have been established including conceptualizing math anxiety as a function of working memory deficits, sociocultural conditioning, lack of reappraisal, and anxiety as a precursor to escape-maintained behavior. Math anxiety is more common in individuals with certain disabilities, such as developmental dyscalculia and deaf and hard of hearing. Hembree (1990) conducted a meta-analysis of research evaluating intervention effects on math anxiety and its moderators. They reported that cognitive-behavioral interventions were most effective at reducing math anxiety. While definitions of, models examining, and causes and co-occurrences of math anxiety are well examined in current literature, Hembree’s (1990) meta-analysis remains the only such investigation for the past 30 years.
The purpose of the present study is to conduct an updated meta-analysis based on previous research (Hembree, 1990) but focused on interventions in K-12 school settings. We identified 11 articles between the years of 1990-2020 that met our inclusion criteria. From those articles, we calculated an omnibus effect size, tested homogeneity, evaluated publication bias, explored moderating variables, and assessed methodological rigor. Our Q statistic indicated homogeneity; however, the forest plot and I2 indicated a small amount of heterogeneity. The asymmetric shape of the funnel plot may be indicative of publication bias. The omnibus effect size was g = 0.316. The results of our moderator analysis indicated that math anxiety interventions produce the best results when conducted in targeted small groups. Additionally, three studies were considered methodologically sound. Our findings support the use of school-based interventions to reduce math anxiety, especially when those interventions are implemented as a targeted, small group intervention.
Keywords: math anxiety, math achievement, elementary education, secondary education, systematic reviews

iii
TABLE OF CONTENTS
TITLE PAGE ................................................................................................................................... i
ABSTRACT .................................................................................................................................... ii
TABLE OF CONTENTS ............................................................................................................... iii
LIST OF TABLES ...........................................................................................................................v
LIST OF FIGURES ....................................................................................................................... vi
CHAPTER 1: Background ...............................................................................................................1
Statement of the Problem ............................................................................................................ 2
Statement of the Purpose ............................................................................................................ 5
Research Questions ..................................................................................................................... 5
CHAPTER 2: Review of Literature .................................................................................................6
Models of Math Anxiety ............................................................................................................. 6
Math Anxiety and Disability ..................................................................................................... 10
Meta-Analysis Exploring Correlations and Interventions for Math Anxiety ........................... 11
Research Not Synthesized in Related Meta-Analysis ............................................................... 13
Research Gaps ........................................................................................................................... 17
Statement of the Purpose .......................................................................................................... 18
Research Questions ................................................................................................................... 19
CHAPTER 3: Method ....................................................................................................................20
Article Selection Process .......................................................................................................... 20
Coding Procedures .................................................................................................................... 23
Training Coders ........................................................................................................................ 27
Inter-Rater Agreement .............................................................................................................. 28
iv
Data Analysis ............................................................................................................................ 29
CHAPTER 4: Results ....................................................................................................................33
Research Question 1: Efficacy of Math Anxiety Interventions ................................................ 33
Research Question 2: Moderating Variables ............................................................................ 45
Research Question 3: Methodological Quality ......................................................................... 49
Chapter Summary ..................................................................................................................... 52
CHAPTER 5: Discussion ...............................................................................................................54
Practical Significance of Effects ............................................................................................... 54
Comparison of Findings to Hembree (1990) ............................................................................ 55
Moderator Variables ................................................................................................................. 58
Methodological Quality ............................................................................................................ 59
Limitations ................................................................................................................................ 60
Implications for Practitioners .................................................................................................... 61
Future Research ........................................................................................................................ 61
Conclusion ................................................................................................................................ 62
REFERENCES ..............................................................................................................................63
APPENDIX A: Calculation Details ...............................................................................................71
APPENDIX B: Qualtrics Coding Survey ......................................................................................76
APPENDIX C: Coding Vocabulary Guide ....................................................................................92

v
LIST OF TABLES
Table 1 Independent Variables .................................................................................................38
Table 2 Dependent Variable: Math Anxiety .............................................................................41
Table 3 Math Performance Data Collection Procedures and Effect Sizes ...............................45
Table 4 Moderator Analysis: Intervention Group Size .............................................................47
Table 5 Moderator Analysis: Intervention Type .......................................................................48
Table 6 Moderator Analysis: Number of Sessions ....................................................................49
Table A1 Math Anxiety: Campbell’s Collaboration Calculations ..............................................71
Table A2 Math Performance: Campbell’s Collaboration Calculations .....................................72
Table A3 Math Anxiety Pre/Post Data ........................................................................................73
Table A4 Math Performance Pre/Post Data ...............................................................................75

vi
LIST OF FIGURES
Figure 1. Article Selection Process .............................................................................................23
Figure 2. Hedge’s g Forest Plot ..................................................................................................34
Figure 3. Funnel Plot...................................................................................................................36
Figure 4. Council of Exceptional Children Quality Indicators ...................................................52

1
CHAPTER 1
Background
Mathematics is a tool to make sense of, to explain, and to navigate the world around us,
as Descartes insisted, “mathematics is a more powerful instrument of knowledge than any other
that has been bequeathed to us by human agency” (Code, 2005, p. 36). As our modern world
becomes more and more complex, it is increasingly critical for people to possess mathematical
competencies and apply those competencies in an array of everyday decision making.
Learning mathematics is not just an academic curiosity, it is essential to our quality of
life. For example, mathematical capability is directly related to our ability to make meaningful
personal health decisions. Reyna et al. (2009) wrote, “Low numeracy distorts perceptions of risks
and benefits of screening, reduces medication compliance, impedes access to treatments, and
impairs risk communication” (p. 943). Additionally, the ability to calculate and comprehend
numerical values is integral to financial literacy. Individuals with poor financial literacy are more
likely to make poor monetary decisions, less likely to invest in stocks, and are at greater risk for
increased high-cost borrowing (Lusardi & Mitchell, 2014). A longitudinal study reported that
lower math performing students later had lower SES in adulthood as compared to higher
performing peers (Ritchie & Bates, 2013).
Additionally, as digital information systems, from social and news media to online
purchasing, become increasingly reliant on algorithms, consumers are engaging with massive
amounts of data online, and often doing so without understanding the ways this information is
manipulated by those algorithms (Rainie & Anderson, 2017). Rainie and Anderson (2017) also
explain that because these mathematical processes are hidden and not well understood, we
become disconnected from that critical thinking process and begin to rely too heavily on the

2
results of what may be a biased, overgeneralized, or simply inaccurate calculation. These
algorithms push content that gets clicks over prioritizing content that is truthful. This can
encourage a shift of our ideologies into the extremes. We become “quarantined into distinct
ideological areas” (Rainie & Anderson, 2017, Theme 5 section), where in that echo chamber, we
no longer face contrasting views that help us maintain nuance. In the end, these divisive
algorithms target the poor and uneducated, and as such, it is imperative that we booster our math
curricula to prepare citizens to step back and do the math and critical thinking for themselves
(Rainie & Anderson, 2017).
Statement of the Problem
Unfortunately, only 40% of fourth grade students are proficient in math; and competency
continues to decline throughout the upper grades (e.g., 33% of eighth grade students and 25% of
high school seniors, U.S. Department of Education (2017). To compound this, students are less
likely to sign up for advance placement classes in high school when they do not begin the 7th
grade with high math achievement. Additionally, students not enrolled in algebra 1 or above by
the 8th grade were less likely to report wanting to attend a 4-year college or pursue an advanced
degree (Walston & McCaroll, 2010). Perception of aptitude and self-appraisal in a given subject
are linked to pursuing that subject further, through taking classes and being more likely to
consider a career related to that topic (Wang & Degol, 2013). Interestingly, self-appraisal is
highly linked to math anxiety (Meece et al., 1990).
Math Anxiety
One contributor to poor math achievement is math anxiety. A frequently circulated
definition states that “math anxiety is commonly defined as a feeling of tension, apprehension, or
fear that interferes with math performance” (Ashcraft, 2002, p. 181). Math anxiety has an

3
identity independent of both general anxiety and test anxiety. Ho et al. (2000) describes two
dimensions found in any type of anxiety: affective and cognitive. Affective symptoms are
feelings or states of being: sadness, discomfort, or irritability. Cognitive symptoms are thoughts:
“I’m nervous. I don’t like this.” Affective symptoms are a stronger moderating factor between
math anxiety and math performance, whereas cognitive symptoms are the stronger moderating
factor between test anxiety and math performance. Meaning, math anxious students’
performance is primarily impacted by affective barriers; while test anxious students’
performance is primarily impacted by cognitive barriers (Ho et al., 2000). Additionally, Dowker
et al. (2016) found that test anxiety and general anxiety highly correlated with each other, while
math anxiety correlated very little with either. Ho et al. (2000) and Dowker et al. (2016) provide
captivating evidence to demonstrate that math anxiety is a separate entity from generalized
anxiety and test anxiety.
In addition to studies investigating definitions of math anxiety, data exists describing its
prevalence and its effect on math performance. One measure indicated that math anxiety is
present in 33% of 15 year olds (Organisation for Economic Co-operation and Development,
2013). Gunderson et al. (2018) explained that math anxiety is reciprocally associated with
achievement and motivation. The latest meta-analysis reviewing the influence of math anxiety on
math performance in K-12 students reported a significant correlation coefficient (-0.34) across
131 studies (Namkung & Lin, 2019). This is comparable to Ma (1999), who reported significant
common population correlation (-0.27) in 26 studies. Hembree (1990) reported significance (g =
-0.61) covering 13 studies.

4
Hembree (1990)
Hembree (1990) published the last meta-analysis that reviewed intervention for math
anxiety. They also studied moderators that explain why certain individuals have more anxiety
than others. They reported that females exhibited higher levels of anxiety, although that gap has
narrowed since the time of their analysis (Ganley et al., 2013). They also found that Hispanic
students exhibited higher rates of math anxiety as compared to other ethnicities. IQ, low math
performance, and negative perceptions of math also correlated with higher anxiety levels.
Hembree (1990) organized their reviewed interventions into four categories: classroom,
cognitive, behavioral, and behavioral cognitive. They reported that behavioral-cognitive
interventions produced the highest effect. These types of interventions included elements of
mindset training or reappraisal and paired them with cognitive approaches such as systematic
desensitization or relaxation training.
Hembree (1990) assessed design quality, but did not define what elements were
measured. They reported a median score of two, out of three possible points. We believe it is
important to expand this measure of methodological rigor by utilizing commonly accepted
assessments, and to explicitly outline strengthens and weakness of methodological
rigor. Methodological quality is the basis by which a field can determine if a practice is
evidence-based (Council for Exceptional Children Standards for Evidence-based Practices in
Special Education, 2014). Utilizing these practices is especially important in context of Response
to Intervention (RTI) frameworks, where practitioners rely on such practices to provide
universal, small group, and individualized supports (Jimerson et al., 2016).

5
Statement of the Purpose
The purpose of this study is to conduct the first meta-analysis for math anxiety
interventions exclusively in K-12 settings, and to update the field on the availability of evidence-
based practices. We, defined as the graduate student author supported by an assistant professor in
special education, conducted moderating analyses to determine what factors make interventions
more efficacious. Lastly, we assessed the methodological quality of this literature.
Research Questions
1. To what extent are school-based interventions targeting math anxiety effective at
reducing anxiety and/or increasing math performance for K-12 students?
2. Are these effects moderated by other intervention factors (e.g., intervention intensity,
duration, disability status)?
3. To what extent is the current literature on this topic methodologically rigorous?
6
CHAPTER 2
Review of Literature
Math illiteracy restricts future options for impacted students and limits opportunities for
society to progress in STEM-related fields. The demand for STEM careers is expanding twice as
fast as other markets, yet the number of students pursuing STEM majors is growing 23.1%
slower than other fields (National Governors Association, NGA Center for Best Practices, 2011).
It is clear that student educational outputs are not meeting workforce demands in an economy
that increasingly relies on competencies grounded in mathematical thinking. Carl Sagan
declared, “We live in a society absolutely dependent on science and technology and yet have
cleverly arranged things so that almost no one understands science and technology. That's a clear
prescription for disaster" (Head, 2006, p. 100). Given that by 8th grade, less than half of students
are proficient in math (U.S. Department of Education, 2017), and that math anxiety is highly
correlated with low math performance (Gunderson et al., 2018), it is imperative to address math
anxiety in school settings. This chapter will cover models of math anxiety and explore research
in math anxiety interventions.
Models of Math Anxiety
The causes and catalysts for math anxiety are complex, nuanced, and not mutually
exclusive. As such, diagnosing the anxiety’s origin is challenging. It is valuable to understand
how teacher, community, and cultural actions may contribute to this problem. It is also important
to develop and implement evidence-based practices that can remediate the anxiety regardless of
its ultimate origin. Models discussed include direction of influence, sociocultural,
neurobiological, reappraisal, and behavioral.

7
Direction of Influence Models
The literature suggests three discrete models that attempt to explain directionality of math
performance and math anxiety. First, the disruption model suggests that low math performance is
the result of math anxiety. Second, the reduced competency model states that poor math
performance creates future math anxiety (Ramirez et al., 2018). Finally, the bidirectional model
declares that establishing directionality is not possible because math anxiety and math
performance influence each other through a dialectal relationship (Namkung & Lin, 2019).
Sociocultural Models
Also explored in the literature are sociocultural models explaining the genesis and
impacts of math anxiety. One perspective proposes that math anxiety is transferred from parents
and teachers to students. Hembree (1990) reported that the college students with the most math
anxiety were majoring in elementary education. This suggests an alarming trend that those
introducing a child’s first math experiences may also be inadvertently introducing math anxiety.
Mixed results slightly favor that transference was more common for girls (Hembree, 1990). This
may be a result of cultural expectations that insinuate girls are worse at math compared to boys.
It could also be linked to cultural ideas that girls are more allowed to freely express emotions,
meaning boys under-report anxiety (Ramirez et al., 2018). However, gender gaps have narrowed
in recent studies, such as reported by Ganley et al. (2013), suggesting there is flux in gender-
based sociocultural models.
Neurobiological Model
Research conducted through a neurobiological lens has provided new understanding
about the region of and processes in the brain that are involved with mathematical processing
and math anxiety. For example, Mammarella et al. (2019) reported that the amygdala is more

8
active in students with higher math anxiety. The amygdala is part of the central executive system
that sustains working memory. This activation of the amygdala in anxious students shows that
working memory is impaired as a result of the attention demands on anxiety.
Working Memory. Dowker et al. (2016) reports that math anxiety is correlated most
often with multi-step problems. This finding supports the notion that working memory is a key
mediator between math anxiety and performance. Working memory is the cognitive component
serving as a “scratch-pad” to hold and manipulate temporary information (Skagerlund et al.,
2019). The more steps in a problem, the more working memory is required. Using
electrophysiological scans, Klados et al. (2015) found that working memory, anxiety, and
mathematical problem solving place demands on the same areas of the brain. Skagerlund et al.
(2019) suggested that anxiety consumes available working memory, leaving insufficient capacity
to attend to mathematical thinking.
Cognitive Preparation. A second implication found in neurobiological research is
cognitive preparation. When presented math stimuli, students with low math anxiety demonstrate
brain patterns suggestive of cognitive preparation for completing that task. In contrast, students
with high levels of math anxiety do not show that cognitive planning. This discrepancy suggests
that anxiety is connected to a lack of cognitive preparation (Mammarella et al., 2019).
Reappraisal Model
A model attracting attention in recent literature is reappraisal. This model suggests that
math anxiety is more about the interpretation that past math experiences were negative,
regardless if they were truly net negative or positive encounters. These “Math efficacy-related
judgments significantly predict math anxiety in students” (Meece et al., 1990, p. 68). Those who
perceive low performance as an outcome of low ability will perform worse in the future than

9
those who perceive low performance to be a consequence of low effort (Mammarella et al.,
2019). Students with poor reappraisal will view feelings of physiological arousal before a math
task as a threat, rather than as cognitive preparation for a task, which contributes to the cycle of
negative perceptions.
Behavioral Model
Behavioral models examine math anxiety through visible, and therefore more observable,
behaviors to qualify and quantify the effects of math anxiety on individuals. Much like a phobia
(Ramirez et al., 2018), the function of math anxiety is usually avoidance (Ashcraft, 2002).
Individuals with math anxiety are negatively reinforced by the removal of the math stimulus
when engaging in avoidant behavior. For example, students may display behaviors in the
classroom such as leaving their desks, disrupting instruction with inappropriate behavior, or
engaging peers to escape math tasks by being removed from the classroom or delaying the start
of their work until the period is over. Math anxiety predicts the avoidance of signing up for math
classes suggesting that students avoid even signing up for math classes due to previous negative
experiences (Meece et al., 1990).
To increase a school community’s ability to recognize math anxiety, it is imperative to
make risk factors observable and measurable. The following proposed definition bridges
neurological approaches of math anxiety with a behavior analytic view of math anxiety: the
presence of math stimuli elicits physiological arousal (heart racing, tension, and nervousness
(Ashcraft, 2002) which evoke other escape-related responses (e.g., expressing frustration,
leaving homework unfinished, seeking peer attention or other more highly preferred activities)
which have been reinforced in the past by the removal of the math stimuli. In this case, the
removal of the math stimuli reinforces the escape-related behaviors and simultaneously

10
strengthens the respondent conditioning associated with the physiological experience of anxiety.
This vicious cycle maintains escape-related responding over time and can result in decreased
math engagement and performance if ignored or ineffectively addressed by school staff.
Math Anxiety and Disability
When seeking to understand phenomena such as math anxiety, it is important to consider
how it may present differently in those with disabilities. Unfortunately, very little research exists
on the intersection of math anxiety and disability in K-12 settings.
Developmental Dyscalculia
Developmental Dyscalculia (DD) is a condition that makes it difficult to process
numerical and spatial information (Mammarella et al., 2015). Devine et al. (2018), in study of
nearly 2,000 K-12 students, found that those with DD are twice as likely experience math
anxiety. The author explains that although this comorbidity is common, math anxiety as
compared to cognitive blocks inherent to DD affect math performance in distinctly different
ways (Devine et al., 2018). In fact, Mammarella et al. (2015) conducted a study on the cognitive
profiles of students with isolated DD and students with isolated math anxiety. Students with DD
scored lower on visuospatial working memory, while students with math anxiety scored lower on
verbal working memory, implying that math anxiety and DD impact performance oppositely.
Thus, while overlap with DD and math anxiety commonly exists, these issues must be treated
with interventions that accommodate and treat their respective working memory deficits.
Autism
Georgiou et al. (2018) compared the prevalence of math anxiety between teens students
with autism and typically developing peers. Interestingly, the researcher found that those with
autism reported lower levels of anxiety. It has been a concern in the past that students with

11
autism have a decreased ability to self-report feelings, but authors cited more recent research, as
well as cited high reliability within their own study, to indicate this is not true. Unfortunately,
math anxiety in autism research is scarce, and as academic and cognitive needs differ across the
autism spectrum, these results should be considered but not widely generalized.
Deaf and Hard of Hearing
Students who are deaf and hard of hearing were also found to have higher levels of math
anxiety as compared to typical peers (Ariapooran, 2017). They typically perform two standard
deviations below their grade mean and are 3.5 years delayed in math competency as compared to
same age peers. To compound these statistics, students with deafness also display lower levels of
self-determination and intrinsic motivation. Ariapooran (2017) found that students who are deaf
and hard of hearing exhibit higher levels of extrinsic goal orientation as compared to hearing
peers. The combination of poor performance, lack of intrinsic motivation, and high levels of
math anxiety all compound to further solidify barriers to math success.
Meta-Analysis Exploring Correlations and Interventions for Math Anxiety
Hembree (1990) conducted a meta-analysis on math anxiety to identify correlates and
differentials, as well as reviewed interventions for math anxiety. Across all included studies, 29
(19%) included participants in K-12 settings, but an unreported number of these studies were not
exclusively K-12, including post-secondary participants. Hembree (1990) did not specify age
groups within the 70 experimental studies. They provided a simple metric of methodological
quality, reporting a median of two out of three possible points. They did not report which factors
were measured, which practices or studies exhibited high levels of rigor, or explain what
improvements would benefit this field of research.

12
Correlates and Differentials
Their findings indicated that factors relating to high anxiety include lower IQ, low math
performance, feeling negatively towards math, and not feeling confident in math ability.
Hembree (1990) also found that math anxiety increases as school grade increases. Females were
linked to higher anxiety than males, but this gap narrowed by college. Lastly, Hispanic students
experience higher levels of math anxiety as compared to students of other ethnicities.
Interventions
Hembree (1990) reviewed 115 studies that conducted interventions in K-12 and
postsecondary settings. He organized intervention types into four categories: classroom,
cognitive, behavioral, and cognitive-behavioral.
Classroom Interventions. This category included all interventions that occurred in a
classroom. Hembree (1990) differentiated two types of interventions: curricular changes and
psychological interventions. Curricular changes included calculator accommodations, whole
group versus small group instruction, and self-paced learning. They did not provide examples of
psychological interventions in the classroom. The effect size for both curricular changes (∆ = -
0.04) and psychological interventions (∆ = -0.10) were not significant.
Cognitive Interventions. Cognitive modifications included group counseling and
restructuring. The practice of restructuring is also called reappraisal. As discussed previously,
reappraisal is the idea that perception of an experience is more impactful than reality. When
reconstructing is used as an intervention, the individual attempts to deconstruct their negative
perceptions (Mamarella et al., 2019). Hembree (1990) reported group counseling as not effective
(∆ = -0.03), and reconstructing as a medium effect (∆ = -0.51).

13
Behavioral Interventions. Behavioral treatments addressed observable signs of anxiety.
The interventionist manipulated variables in the environment to shape the individual’s behavior,
with the goal to elicit less anxiety when confronted with the anxiety-inducing stimuli in the
future. Interventions include systematic desensitization and relaxation training. Systematic
desensitization is a form of classical conditioning where the individual is gradually introduced to
their phobia trigger in more invasive ways, but only when anxiety is diminished in the current
stage (McLeod, 2015). Relaxation training encompasses intentional tensing and relaxing of the
muscles. It also can include guided imagery, of both imagining scenarios that are peaceful and
those that are anxious. The interventionist walks the individual through anxious scenarios to
teach them to identify, monitor, and understand their body’s reaction to stress (Bernstein et al.,
2000). Systematic desensitization had a large effect (∆ = -1.04), and relaxation training had a
medium effect (∆ = -0.48).
Cognitive-Behavioral Interventions. Cognitive-behavioral interventions combined
cognitive strategies as mentioned previously, with behavioral strategies as mentioned previously.
Integrating these two practices together produced the highest effect (∆ = - 1.15).
Research Not Synthesized in Related Meta-Analysis
Researchers tended to remediate math anxiety from two angles. Some studies attempted
to reduce anxiety by academic strategies, while other studies used therapeutic tools.
Academic Interventions
Pedagogical Strategies. Batton (2010) conducted a quasi-experimental study to test the
impact of a nine-week cooperative learning intervention on math anxiety and achievement for 64
fifth graders. Cooperative learning is an instructional strategy that encourages students to solve
problems together. Per Batton (2010), this design allows students to learn new strategies from

14
each other, develop social skills, and improve academic achievement. Mixed ability and mix
gender groups worked for 70 minutes’ total weekly, split into two sessions a week. The teacher
did not provide help until the groups tried all alternatives, and only provided positive feedback
when assignments were turned in. Following the intervention, female participants in the
experimental group demonstrated greater improvement in math anxiety symptoms as compared
to the control group [F(1, 30) = 4.75, p = .037]. Interestingly, males did not demonstrate
statistically significant differences across control and treatment phases. This result suggests that
gender is likely a moderating factor for the effectiveness of certain treatments.
One-on-One Tutoring. Supekar et al. (2015) reported that one-on-one math tutoring
improved math anxiety symptoms, increased math performance, and decreased observed
amygdala reactivity. The amygdala is one location in the brain where anxiety is processed, and
higher levels of anxiety produce increased activation on brain scans (Supekar et al., 2015). Forty-
six third graders were divided into 2 groups by levels of math anxiety: low math anxiety (LMA)
and high math anxiety (HMA). Both groups received tutoring on single and double digit
problems for addition and subtraction, as well as instruction on associative, commutative, and
identity properties. The authors reported that the HMA group had significantly lower anxiety
levels post tutoring and equalized to similar levels as the LMA group. Interestingly, LMA math
anxiety levels were the same before and after the intervention. Supekar et al. (2015) observed
less amygdala activation in the HMA group after the intervention. Their hyperactivity equalized
to the same activation levels as the students with LMA after the treatment. Meaning, after the
tutoring intervention, the brains of students with HMA did not activate any more anxiety than did
the brains of students with LMA. The authors surmised that the intervention was successful due
to the math skill remediation functioning similar to desensitization and exposure-therapy

15
treatments. Desensitization occurs with focused exposure to the anxiety inducing stimuli
(Bernstein et al., 2000), which is exactly what happened as students were provided focused
exposure to the anxiety inducing math stimuli. Students may be able to escape and disengage in
classroom settings but working individually with a tutor can help them stay engaged and
reconcile math anxiety in a structured environment.
Therapeutic Interventions
Expressive Writing Therapies. Hines et al. (2016) studied the effect of an expressive
writing intervention with 93 low performing secondary students in their geometry class. This
intervention may fit under Hembree’s (1990) behavioral intervention category. The experimental
group was directed to write down their feelings about math class, math tests, and school for an
average of twenty minutes a day for three classes. The control group was tasked to write about
school, but on themes unrelated to emotions, and other emotionally neutral themes like favorite
time of year. After the intervention, authors reported that, compared to the control, the
experimental group produced more organized writing and more effectively analyzed their
thought patterns. Hines et al. (2016) surmised this is because being directed to write about
emotions made students better at processing those emotions. The experimental group was also
better at identifying their anger and negative emotional responses. Both mathematical and
general anxiety symptoms were improved in the experimental group, and the control group
exhibited improved math anxiety symptoms. Both the experimental and control experienced
improvement in math anxiety symptoms in response to the treatment, and there was no
significant variance between the groups [F(l, 93) = 2.3, p>.05]. Although this was not the
anticipated result, the authors learned that even just writing about school or life in general while
in math class may reduce levels of math anxiety. Lastly, the experimental group’s increased

16
ability to identify and process emotions as compared to the control, is an additional strategy that
students could use if they were to experience future instances of math anxiety.
Reappraisal Therapies. Ramirez et al. (2018) defined reappraisal as cognitive strategies
that improve math anxiety symptoms by teaching the individual to question perceived level of a
threat. This is beneficial for math anxiety because those with anxiety tend to overestimate the
consequences of a given situation. Reappraisal consists of addressing physiological symptoms
associated with a threat, such as increased heart rate, faster breathing, increased body
temperature, and fidgeting. Individuals who are good at reappraisal, activate certain parts of their
brain that aid precurrent problem solving better than those who are not good at reappraisal.
Meaning, they are more efficient at gearing up to face a task that may elicit anxiety, as better at
mentally collecting relevant information that may assist in problem solving that task.
Hocker (2017) conducted an experimental design study at five public charter high schools
for at risk-students. Math anxiety, mindset, and view of math were measured before and after
treatment. The five-hour curriculum taught and practiced growth mindset, problem solving, and
math exploration. Teachers praised students who shared mistakes, reinforcing the value of
productive struggle. The intervention produced a medium effect (d = 0.38). Reframing mistakes
as an integral part of learning and viewing effort as more important than the right answer may be
an effective treatment to improve math anxiety symptoms.
Cognitive-Behavioral Therapies. Mindfulness-Based Cognitive Therapy (MBCT) is an
approach to regulating emotional responses using mindfulness (LaGue et al., 2019). Mindfulness
is a practice of observing emotions, feelings, and the surrounding setting without judgment.
LaGue et al. (2019) tested MBCT’s impact on math anxiety through a nonconcurrent multiple-
baseline single-case design, with three students in secondary education. The authors’ visual

17
analysis of graphed results reported that math anxiety symptoms improved in all three
participants. However, for one student, the data did not demonstrate a stable baseline before
intervention. As such, the authors should have considered confounding variables that may have
contaminated the data. For another student, the data did not seem to demonstrate an effect until
the last two data points, thus not establishing a strong treatment effect in the given time frame.
Research Gaps
Need for Methodological Quality
One of the greatest gaps in math anxiety intervention analysis is the lack of
methodological quality measurement. According to the Council for Exceptional Children
Standards for Evidence-based Practices in Special Education (CEC), a study must meet all of its
respective quality indicators to be considered methodologically sound. Quality assessment
measures, like the CEC Standards, require a clearly established independent and dependent
variable with data analysis proving a functional relationship. Inter-rater and inter-observer
reliability is assessed to ensure the statistical analysis is based on accurate data. For a treatment
to be considered a best practice, it must be supported by at least two methodologically sound
studies of that treatment (CEC, 2014). It is crucial that the current literature is assessed for
methodological quality so effective interventions can be disseminated to teachers and
practitioners as evidence-based practices.
Teacher-Led Interventions
Additionally, Hembree (1990) reported that interventions that occur in the classroom are
not significantly impactful on math anxiety. However, recent research challenges Hembree’s
(1990) claim. Given the availability of contemporary research on classroom interventions, it is

18
imperative to seek out and synthesize data from new interventions to inform practitioners if this
is a viable and effective pathway to treat math anxiety.
K-12 Focus
Hembree (1990) did not provide a clear context for what interventions benefit K-12
students specifically. As bad math experiences accumulate over time, and in different
developmental stages, anxiety may get worse or require different types of interventions.
Moderating Variables
There is no existing review on disability as a moderating factor in the success of math
anxiety interventions. Just as age may impact what interventions are effective, so might
disability. Additionally, frameworks such as response to intervention (RTI), organize decision-
making for when a student needs more intensive supports. In an RTI framework, all students
receive the first universal tier, small groups of students receive second tier services, and in the
last tier, students are provided highly individualized interventions. Knowing in which tier an
intervention would be most effective is valuable information for practitioners (Jimerson et al.,
2016). Providing an analysis of moderating factors such as these would be indispensable in
guiding practical and effective application of math anxiety treatments.
Statement of the Purpose
The purpose of this study is to conduct the first meta-analysis for math anxiety
interventions exclusively in K-12 settings, and to update the field on the availability of evidence-
based practices. We conducted moderating analyses to determine what factors make
interventions more efficacious. Lastly, we assessed the methodological quality of this literature.

19
Research Questions
1. To what extent are school-based interventions targeting math anxiety effective at
reducing anxiety and/or increasing math performance for K-12 students?
2. Are these effects moderated by other intervention factors (e.g., intervention intensity,
duration, disability status)?
3. To what extent is the current literature on this topic methodologically rigorous?
20
CHAPTER 3
Method
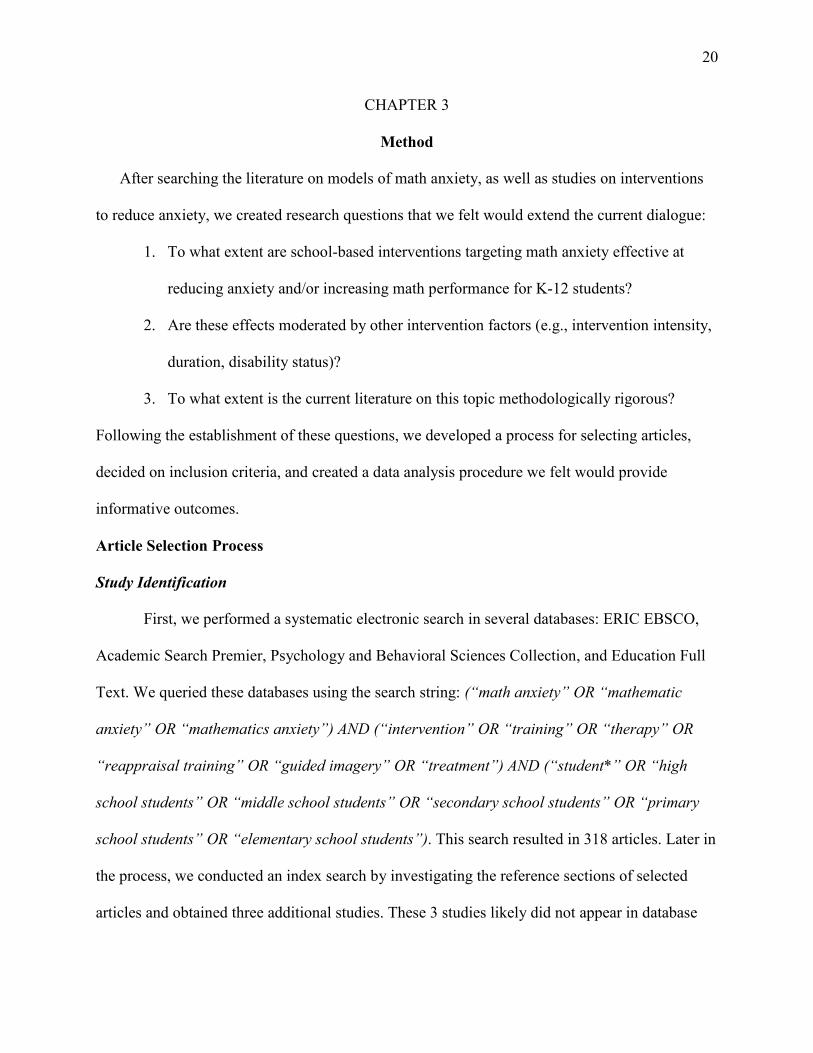
After searching the literature on models of math anxiety, as well as studies on interventions
to reduce anxiety, we created research questions that we felt would extend the current dialogue:
1. To what extent are school-based interventions targeting math anxiety effective at
reducing anxiety and/or increasing math performance for K-12 students?
2. Are these effects moderated by other intervention factors (e.g., intervention intensity,
duration, disability status)?
3. To what extent is the current literature on this topic methodologically rigorous?
Following the establishment of these questions, we developed a process for selecting articles,
decided on inclusion criteria, and created a data analysis procedure we felt would provide
informative outcomes.
Article Selection Process
Study Identification
First, we performed a systematic electronic search in several databases: ERIC EBSCO,
Academic Search Premier, Psychology and Behavioral Sciences Collection, and Education Full
Text. We queried these databases using the search string: (“math anxiety” OR “mathematic
anxiety” OR “mathematics anxiety”) AND (“intervention” OR “training” OR “therapy” OR
“reappraisal training” OR “guided imagery” OR “treatment”) AND (“student*” OR “high
school students” OR “middle school students” OR “secondary school students” OR “primary
school students” OR “elementary school students”). This search resulted in 318 articles. Later in
the process, we conducted an index search by investigating the reference sections of selected
articles and obtained three additional studies. These 3 studies likely did not appear in database
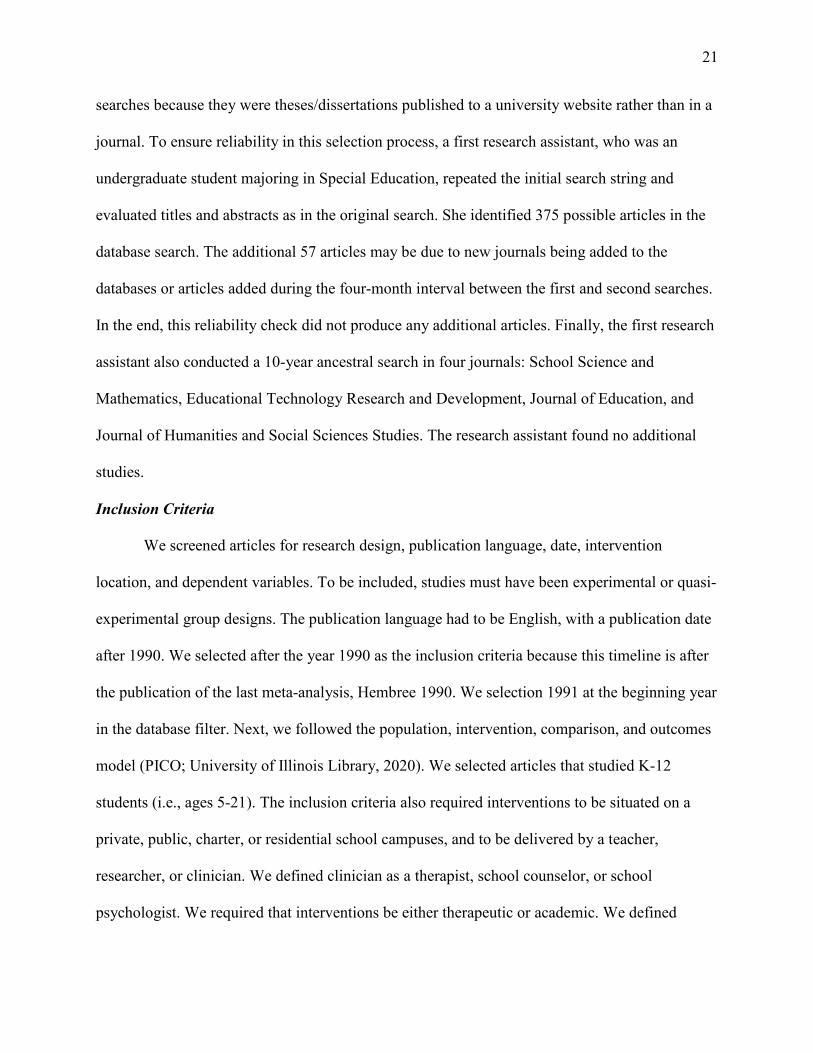
21
searches because they were theses/dissertations published to a university website rather than in a
journal. To ensure reliability in this selection process, a first research assistant, who was an
undergraduate student majoring in Special Education, repeated the initial search string and
evaluated titles and abstracts as in the original search. She identified 375 possible articles in the
database search. The additional 57 articles may be due to new journals being added to the
databases or articles added during the four-month interval between the first and second searches.
In the end, this reliability check did not produce any additional articles. Finally, the first research
assistant also conducted a 10-year ancestral search in four journals: School Science and
Mathematics, Educational Technology Research and Development, Journal of Education, and
Journal of Humanities and Social Sciences Studies. The research assistant found no additional
studies.
Inclusion Criteria
We screened articles for research design, publication language, date, intervention
location, and dependent variables. To be included, studies must have been experimental or quasi-
experimental group designs. The publication language had to be English, with a publication date
after 1990. We selected after the year 1990 as the inclusion criteria because this timeline is after
the publication of the last meta-analysis, Hembree 1990. We selection 1991 at the beginning year
in the database filter. Next, we followed the population, intervention, comparison, and outcomes
model (PICO; University of Illinois Library, 2020). We selected articles that studied K-12
students (i.e., ages 5-21). The inclusion criteria also required interventions to be situated on a
private, public, charter, or residential school campuses, and to be delivered by a teacher,
researcher, or clinician. We defined clinician as a therapist, school counselor, or school
psychologist. We required that interventions be either therapeutic or academic. We defined
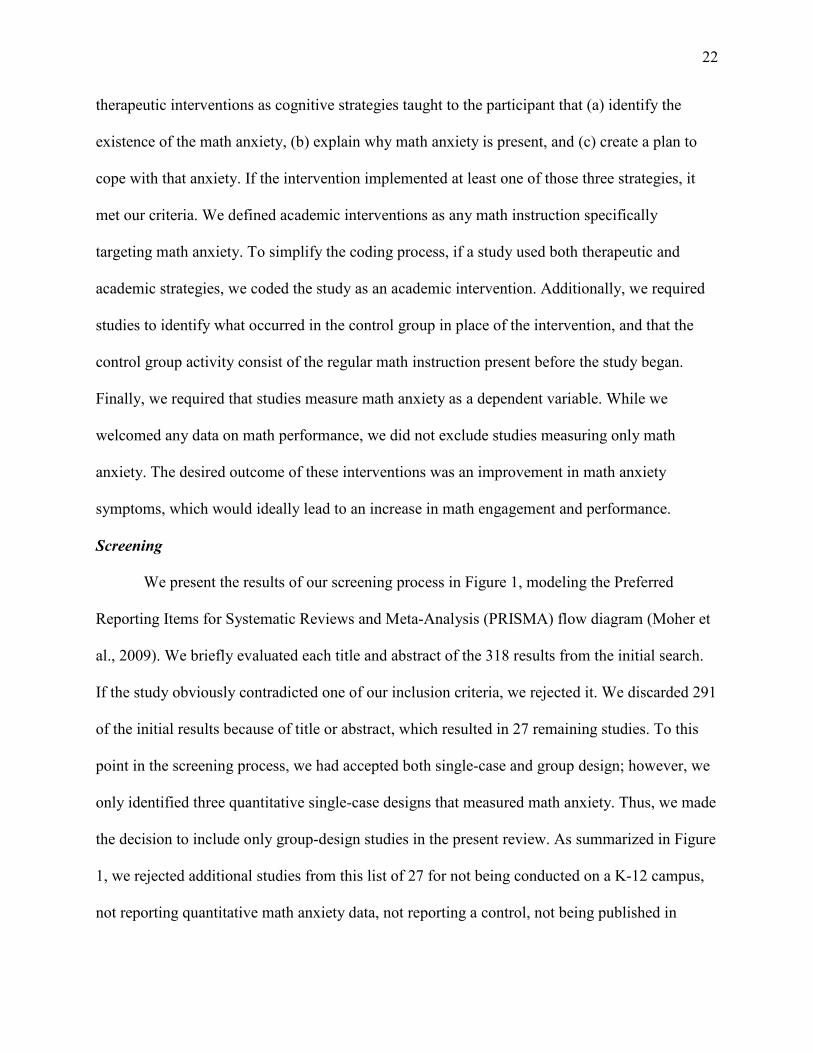
22
therapeutic interventions as cognitive strategies taught to the participant that (a) identify the
existence of the math anxiety, (b) explain why math anxiety is present, and (c) create a plan to
cope with that anxiety. If the intervention implemented at least one of those three strategies, it
met our criteria. We defined academic interventions as any math instruction specifically
targeting math anxiety. To simplify the coding process, if a study used both therapeutic and
academic strategies, we coded the study as an academic intervention. Additionally, we required
studies to identify what occurred in the control group in place of the intervention, and that the
control group activity consist of the regular math instruction present before the study began.
Finally, we required that studies measure math anxiety as a dependent variable. While we
welcomed any data on math performance, we did not exclude studies measuring only math
anxiety. The desired outcome of these interventions was an improvement in math anxiety
symptoms, which would ideally lead to an increase in math engagement and performance.
Screening
We present the results of our screening process in Figure 1, modeling the Preferred
Reporting Items for Systematic Reviews and Meta-Analysis (PRISMA) flow diagram (Moher et
al., 2009). We briefly evaluated each title and abstract of the 318 results from the initial search.
If the study obviously contradicted one of our inclusion criteria, we rejected it. We discarded 291
of the initial results because of title or abstract, which resulted in 27 remaining studies. To this
point in the screening process, we had accepted both single-case and group design; however, we
only identified three quantitative single-case designs that measured math anxiety. Thus, we made
the decision to include only group-design studies in the present review. As summarized in Figure
1, we rejected additional studies from this list of 27 for not being conducted on a K-12 campus,
not reporting quantitative math anxiety data, not reporting a control, not being published in

23
English, not including a mathematic or therapeutic intervention in the design, or not utilizing a
quasi-experimental group design. This step reduced our qualified articles to eight. After this
point was when we conducted the index search and added three more articles. In total, we
identified 11 articles for inclusion in this systematic review.
Figure 1
Article Selection Process
Note. The top left bubble is indicative of the beginning of the article selection process. All left
bubbles contain information on where articles were found and how many were found in that
location. The bubbles on the right contain the reasons for article rejection.
Coding Procedures
We coded all articles that met our inclusion criteria using a survey in Qualtrics, an online
survey tool (Qualtrics, Provo, UT). Members of the research team utilized a code sheet to review
each study. We organized the code sheet into eight sections: identification information, research

24
design, participant information, setting, intervention procedures, dependent variable, results, and
methodological quality. The survey in its entirety can be found in Appendix B.
Identification Information
We noted who coded the article, article name, location of study, journal name, and date
of publication.
Research Design
We included coding to identify the independent and dependent variables, research
question(s), and research design.
Participant Information
We gathered data on participant characteristics, including the number of participants,
participant age, gender identity, race/ethnicity, disability status, and socioeconomic status.
Setting
We identified the type of school, where in the school the intervention occurred, and
whether the intervention was presented to an individual, small group, or an entire class setting.
Intervention Procedures
We entered information regarding the interventionist qualifications, duration of
intervention, treatment type (e.g., therapeutic or academic), and the specific activities employed
during the intervention. If the study included both therapeutic and academic elements, it was
coded as academic to simplify coding procedures.
Dependent Variables
We noted if authors measured math anxiety, math performance, or both. For
Additionally, we documented how authors measured anxiety and/or math performance.

25
Results
We gathered all information available regarding social validity, implementation fidelity,
data analysis, means with corresponding standard deviations, and effect sizes.
Methodological Quality
We assessed articles using the Council for Exceptional Children Standards for Evidence-
based Practices in Special Education [CEC Quality Indicators] (CEC, 2014) to evaluate the
methodological quality of each article. We selected these indicators with the rationale that a high
number of students with math anxiety also have a disability. For example, in students with
developmental dyscalculia, the incident rate of math anxiety can be 50% higher than those of
their typical peers (Mammarella et al., 2015).
When coding each article, the coders responded yes or no to each indicator. We used this
information to illuminate our understanding of the quality of research available for math anxiety
interventions. Per CEC (2014), an article must meet all respective indicators to be considered
methodologically rigorous. The CEC Quality Indicators organize standards into eight sections.
We only utilized certain components, as some were specifically targeted for single-case designs
and were not relevant to our review.
QI 1.0 Context and Setting. (1.1) The study had to include relevant information
regarding the school and classroom setting.
QI 2.0 Participants. (1.1) Authors were required to provide demographic information
about the participants, and (2.1) give details about participants with disabilities or with at risk
status.

26
QI 3.0 Intervention Agent. (3.1) They had to describe the interventionist’s background
and role in the study. (3.2) They also needed to indicate the training given to the interventionist
about their role in the study, as well as credentials required to be an interventionist.
QI 4.0 Description of Practice. (4.1) The study had to describe essential components of
the intervention, and (4.2) explain what materials were used as a part of the intervention.
QI 5.0 Implementation Fidelity. (5.1) Authors needed to assess implementation fidelity
and report the results. (5.2) They had to assess implementation fidelity about the length of the
study and/or the duration of intervention sessions with direct and reliable measures. (5.3) It must
be reported that implementation fidelity occurred for all interventionists and during the entire
intervention process.
QI 6.0 Internal Validity. (6.1) Authors needed to prove that they had control over
manipulating the independent variable. This cannot be met if indicator 5.1 is not met. (6.2)
Authors had to indicate the differences between control and treatment setting. (6.3) The study
needed to reference how they prevented the control group from accessing the intervention. (6.4)
Authors had to explain how participants were assigned to control or treatment groups. (6.8) They
needed to report that overall attrition was lower than 30% during their study and (6.9) indicate
that differential attrition was less than 10%.
QI 7.0 Outcome Measures. (7.1) Authors needed to explain that outcomes were socially
important, and (7.2) how they measured dependent variables. (7.3) They had to report all results,
not just those with the desired outcomes, (7.4) and disclose that data collection occurred with
appropriate frequency and timing. (7.5) Authors had to reveal that their measure of reliability
was at least 80% or higher, and (7.6) report adequate validity.

27
QI 8.0 Data Analysis. (8.1) Authors had to employ and report relevant data analysis
techniques, (8.3) and report effect sizes or data that an effect size could be calculated from.
Training Coders A primary and secondary coder completed the Qualtrics (Provo, UT) survey to record
relevant article information. The primary coder was the researcher, and the secondary coder was
an unpaid volunteer who has an M.Ed. in Curriculum and Instruction. This coder was not the
same individual who conducted reliability in the article selection process. Before initiating this
process, the secondary coder participated in a training session. The primary coder led the training
over a Zoom conference call using Google Slides and modeled coding an example article. After
the completion of this training presentation, the primary coder assessed the secondary coder via a
practice article, which had been previously coded by the primary coder. Answers were compared
to generate a proficiency score for the secondary coder. To qualify as proficient, the inter-rater
agreement was required to be at least 80%. If agreement had been less than 80%, the secondary
coder would have been required to discuss inter-rater disagreements, review the original
presentation, and code a second practice article. However, this was not necessary because the
first attempt resulted in an inter-rater agreement of 80.6%. The primary and secondary coders
discussed and resolved discrepancies before the termination of the training. After this portion of
the training was complete, the secondary coder had access to the Google Slide presentation at
any time. The presentation was also uploaded to Nearpod (Nearpod, n.d.) with recorded
commentary by the primary researcher. Additionally, the secondary coder had access to a
vocabulary guide that defined relevant terminology, such as dependent/independent variable,
various research designs, and statistical terms. This document, found in Appendix C, was
allowed during both the practice and official coding.

28
Inter-Rater Agreement
The secondary coder completed four out of 11 articles. The primary coder completed all
eleven articles. We used a random number generator function in Microsoft Excel to select the
double-coded articles (Savitsky, n.d.). In one column, each first authors’ last name was listed in
alphabetical order. In a second column, the randbetween function was used to associate a random
number with each authors’ name. We selected the four smallest numbers as our inter-rater
reliability articles.
We calculated percent agreement by adding up the number of agreements and dividing
that total by the number of opportunities to agree. If the percent of agreement did not meet the
criteria of at least 80%, the coders would have been required to review the initial training and
demonstrate at least 80% practice accuracy on an additional practice article before returning and
re-coding in the official process. Additionally, coders were to discuss all inconsistencies until a
consensus was made.
The articles selected by random generation included Kim et al. (2016), Ruark (2018),
Walter (2018), and Wei (2010). The respective percentages of inter-rater agreements were
85.48%, 85.48%, 91.94%, and 85.48%. The most consistent question marked as a disagreement
was CEC component 1.1. This component states, “The study describes critical features of the
context or setting relevant to the review; for example, type of program or classroom, type of
school (e.g., public, private, charter, preschool), curriculum, geographic location, community
setting, socioeconomic status, physical layout" (CEC, 2014). Of the inter-rater reliability articles,
50% were scored as a mismatch on this question. Inconsistency could be attributed to the
additional question description, where it was clarified that it was allowable to select “met” if type

29
of school could be inferred. Coders likely exhibited a discrepancy on what qualified a description
as sufficient to extrapolate an inference.
Data Analysis
Dependent Variable: Math Anxiety
To calculate a common metric in Cohen’s d, we used Campbell’s Collaboration (Wilson,
n.d.). We made adjustments to ensure that, for all studies, a positive effect size meant an
improvement in math anxiety symptoms. Most of the studies provided adequate information to
use the test “Means, Standard Deviations, and Sample Sizes.” Kim et al. (2016) and Wittman
(1996) only reported data into anxiety-level subgroups, so in these cases we employed the test
“Means and Standard Deviations in Subgroups.” White (1997) provided means and a T-test, but
no standard deviation; as such, we used the test “T-Test, Unequal Sample Sizes.” The math
anxiety data that Walter (2018) provided was sparse. However, they because they reported an F-
test, we were able to use the test “F-test, 2-group, Unequal Sample Sizes” to calculate an effect
size.
Hocker (2017) provided means and mean differences for treatment and control, as well as
a Cohen’s d. They also provided two t-tests, one for treatment and another for control. Although
they reported a standard deviation for the treatment group, the control group’s standard deviation
was absent. Additionally, no confidence intervals were reported for either group. To address
these gaps, we had to assume that the control group standard deviations were relatively equal for
both pre-test and post-test. We took an average of the SD from pre-test and post-test and made it
the denominator and the mean difference of pre-test and post-test as the numerator. This process
provided an estimated SD of 0.28. We applied this information in the Campbell’s Collaboration

30
(Wilson, n.d.) test “Mean Gain Scores, Pre and Post SDs, and paired t-tests” to produce
confidence intervals.
Zyl and Lohr (1994) was a complex case. Authors did not provide an effect size or t-test
and did not report standard deviations. They only presented a mean decrease in anxiety level for
treatment and control. We conducted a search in all articles that cited Zyl and Lohr (1994) but
could not find any additional versions of this article, or additional data. As such, based on article
parameters, we imputed random hypothetical participants for treatment and control. We adjusted
this data until it lined up with the provided means, which also outputted standard deviations that
we could utilize alongside our means to generate a t-statistic. The result of this t-test was t = -
3,65674, which was then put into the test “Student’s T-test and Total Sample Size” to generate
an estimate effect size. Although we strived to be as conservative as possible to avoid effect size
inflation, the resulting effect size was 14.94 standards deviations above the omnibus grand mean.
A summary of all Cohen’s d effect sizes can be found in the table, Campbell’s Collaboration
(n.d.) Calculations, found in Appendix A, as well as pre/post data used in this process.
We conducted a random model analysis with Comprehensive Meta-Analysis (Borenstein
et al., 2013), and elected to convert effect sizes to Hedge’s g for the individual and omnibus
effect size estimation. We used Hedge’s g because it uses the same underlying metric but is less
biased in circumstances like this review where the sample size is small (Card, 2011). We
presented results in form of a forest plot. We addressed outliers, compared confidence intervals,
and referenced p-values. Additionally, we conducted tests for heterogeneity. Homogeneity is
decided when all confidence intervals overlap a common effect, and that any deviation can be
ascribed to “random sampling fluctuation” (Card, 2011, p. 184). Lastly, we analyzed publication

31
bias, the tendency of authors to publish only desirable results (Card, 2011). We displayed
publication bias results using a funnel plot.
Dependent Variable: Math Performance
We did not conduct analyses with math performance data beyond converting all results
into Cohen’s d using Campbell’s Collaboration (Wilson, n.d.). Walter (2018) and Wei (2010)
included sufficient data to use the test “Means, Standard Deviations, and Sample Size.” In the
case of Wittman (1996), we used the F-test from their provided ANOVA and conducted the “F-
test, 2-group, Equal Sample Sizes.” This is because they did not provide data for the control
group but did provide an ANOVA for the treatment. Kim et al. (2016) broke down reporting into
anxiety-level subgroups so we used “Means and Standard Deviations with Subgroups.” Lastly,
White (1997) did not provide standard deviations, but gave means and a t-test, so we used “T-
test, Unequal Sample Sizes.” We adjusted effect sizes to indicate that a positive effect size meant
that math performance increased. A summary of the Campbell’s Collaboration (Wilson, n.d.)
process, including pre/post data, can be found in Appendix A.
Moderating Variables
Based on patterns in the literature and availability of data, we conducted moderating
analyses on three moderating variables we felt might highlight factors that improve intervention
efficacy. We ran two analysis as random effect models comparing two binary groups. The last
analysis was a meta-regression, because the variable was not a categorical characteristic. For the
first two analyses, we compared effect sizes, referenced p-values, compared confidence intervals,
and measured homogeneity within each group and across groups.
32
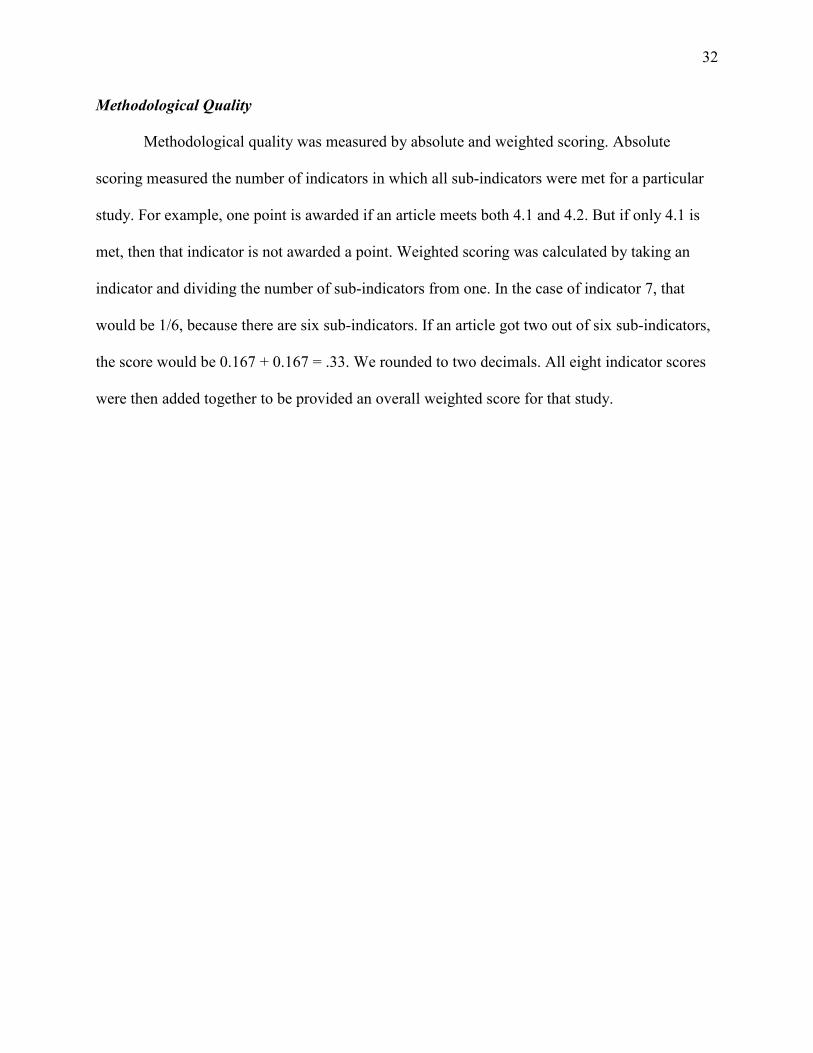
Methodological Quality
Methodological quality was measured by absolute and weighted scoring. Absolute
scoring measured the number of indicators in which all sub-indicators were met for a particular
study. For example, one point is awarded if an article meets both 4.1 and 4.2. But if only 4.1 is
met, then that indicator is not awarded a point. Weighted scoring was calculated by taking an
indicator and dividing the number of sub-indicators from one. In the case of indicator 7, that
would be 1/6, because there are six sub-indicators. If an article got two out of six sub-indicators,
the score would be 0.167 + 0.167 = .33. We rounded to two decimals. All eight indicator scores
were then added together to be provided an overall weighted score for that study.

33
CHAPTER 4
Results
We included 11 studies in the final analysis. Three studies were peer reviewed articles
and the remaining eight were either a dissertation or thesis. The mean publication year was 2011,
the range being 1994 to 2019. We organized results of the meta-analysis by research question:
efficacy of interventions, moderating variables, and methodological quality.
Research Question 1: Efficacy of Math Anxiety Interventions
We examined the efficacy of math anxiety interventions by converting all effect sizes to a
common metric and calculating an omnibus effect size using a random effects model, accessed
through Comprehensive Meta-Analysis (Borenstein et al., 2013). We present results of this
model in Figure 2.
Omnibus Effect
For purposes of uniformity, a positive effect indicates an improvement in math anxiety
symptoms. The omnibus effect size was g = 0.316, [0.158, 0.475], p = 0.000. Guidelines for
interpreting Cohen’s d can also be used for Hedge’s g, “d = 0.20 considered a small effect, d =
0.50 considered a medium effect, and d =.80 considered a large effect” (Card, 2011, p. 92). The
omnibus effect size g = 0.316 is considered a small effect.
Individual Effect
Individual effect sizes ranged from 0.075 and 1.566. Accordingly, nine studies had small
effects sizes (Batton, 2010; Henderson, 2019; Hines et al., 2016; Hocker, 2017; Kim et al., 2016;
Ruark, 2018; Walter, 2018; Wei, 2010; White, 1997). Two studies had large effects (Wittman,
1996; Zyl & Lohr, 1994). Two studies exceed the omnibus upper limit of 0.475, meaning they
are likely outliers (Wittman, 1996; Zyl & Lohr, 1994).

34
Figure 2
Hedge’s g Forest Plot
Note. The table on the left includes Hedge’s g statistics. The final, unlabeled row represents the
mean of all studies. A forest plot is located on the right. The larger the black box, the larger the
sample size. Horizontal lines represent confidence intervals and the rhombus in the bottom center
represents the grand mean.
Heterogeneity
When we tested heterogeneity, we ensured that all measures assessed the same outcome
of math anxiety. We assessed chi-squared by calculating a Q-statistic from all Hedge’s g effect
sizes. For the output Q to be considered sufficiently homogeneous, it could not exceed its
correlating df(q) and the corresponding p-value (Card, 2011). For this study, the df(q) = 10, p =
.204. The chi-square critical value at df(q) 10 and p-value .2 is 13.442. Because our q-value of
13.370 did not exceed its corresponding chi-square value, we can conclude that our studies had

35
sufficient homogeneity. Because the Q statistic only indicates whether studies are homogeneous,
we also calculated an I-squared index to examine the degree of heterogeneity evident in our data.
For the present study, I2 = 25.207%, which is considered a small amount of heterogeneity (Card,
2011). However, Card (2011) suggests a visual test of the forest plot to determine heterogeneity.
Because not all confidence intervals cross over the omnibus mean, this visual test does not
indicate homogeneity.
Publication Bias
The funnel plot in Figure 3 illustrates the level of publication bias in the present review.
The y-axis represents standard error, and the x-axis represents the standard difference in means.
Each dot signifies a study. The solid funnel lines suggest what a symmetric shape might look
like. Typically, the larger the sample size, the smaller the standard error (Card, 2011). A funnel
plot that exhibits less publication bias will have a symmetric shape around the grand mean,
whereas one with more publication bias will appear asymmetric. The bottom left area of the
quadrant is typically the area where studies with smaller sample sizes and smaller effects are
located (Card, 2011). Studies with smaller sample sizes, larger standard errors, and small to
negative effects are less likely to be published. The furthest right outlier, Zyl and Lohr (1994),
was a study with a small sample size. The second furthest right outlier was Wittman (1996). The
asymmetric shape of the funnel plot may be indicative of publication bias. Additionally, Card
(2011) stated that another way to measure publication bias is to conduct a visual test on the
funnel plot by comparing placement of published versus non-published studies. Graphed on the
funnel plot, two of the published articles were just around the grand mean, while one was an
extreme positive outlier. This may mean that the publication bias may be less severe. The
inclusion of many non-published studies is a strength to this analysis, as it mitigates the tendency

36
of a field to not publish smaller effects (Card, 2011). However, the small number of studies
included in this review limits our conclusions in this area.
Figure 3
Funnel Plot
Note. Open circles represent each study. The x-axis represents the standard difference in means
of a study and the y-axis with the standard error. The lines indicate what a symmetric spread of
data should look like.
Independent Variables
Table 1 contains a summary of intervention elements for each study. Researchers
administered technology mediated interventions in four studies. Teachers conducted the
intervention in the rest of the studies. In 73% of the studies, treatment locus was the classroom,
1% in the library, 1% in the computer lab, and 1% in a private room. Entire class treatments were
administered in 64% of studies; small group settings comprised 37% of studies. Session length in
minutes ranged from one minute to seventy minutes. Batton (2010) tested the effectiveness of
cooperative learning. Henderson (2019) studied the influence of mindfulness exercises. Hines et
al. (2016), Ruark (2018), and Walter (2018) tested the impact of expressive writing interventions
where students were directed to write about their math experience and emotions. Hocker (2017)
37
developed a math mindset training for students, followed by collaborative math investigations
where students implemented those mindset strategies. Kim et al. (2016) and Wei (2010)
implemented the same computer-based math curriculum that included an “embodied agent” that
provided encouraging feedback targeted at math anxiety. White (1997) tested the effectiveness of
positive teacher attitudes, cooperative learning, and hands-on group activities. Wittman (1996)
studied a computer program that intended to encourage multiplication automaticity. Zyl and Lohr
(1994) created a cassette tape intervention for students, recorded with muscle relaxation
strategies followed by guided imagery through math scenes that may provoke math anxiety.

38
Table 1
Independent Variables
Study Intervention
type Research
design Interventionist Treatment Location
Instructional group size
# of sessions
Session length in
mins
Batton (2010)
A Q Teacher Classroom W 18 70
Henderson (2019)
T Q Teacher Classroom W 30 5-10
Hines et al. (2016)
T Q NR Classroom W 3 15-30
Hocker (2017)
A E Teacher Classroom W NR 300 total from all sessions
Kim et al. (2016)
A E Tech Classroom W 4 35-45
Ruark (2018) T E Teacher Classroom S 10 “At least one min”
Walter (2018)
T Q Teacher Classroom W 5 10
Wei (2010) A E Tech Computer lab
S 4 50
White (1997) A Q Teacher Classroom W NR NR
Wittman (1996)
A E Tech School library
S Up to 13 NR
Zyl & Lohr (1994)
T E Tech Private listening
room during study hall
S >6 30
Note. A = academic T = therapeutic; E = group experimental Q = group quasi-experimental;
Tech = technology-aided instruction, W = whole class S = small group.
Dependent Variable
Table 2 contains all information researchers provided on the math anxiety rating scale
enlisted in their studies. In most cases, researchers employed commonly used and previously

39
validated measures of math anxiety. These authors usually did not test for reliability and validity
themselves, rather cited past work.
Reliability
In some cases, authors did test for reliability on popular measures. Kim et al. (2016)
tested reliability on Revised Mathematics Anxiety Rating Scale (RMARS; Plake & Parker, 1982)
and reported a pretest coefficient of a = 0.91 and posttest coefficient of a = 0.94 posttest. Walter
(2018) reported their own numbers, and cited that previous researchers found overall a = 0.87.
They broke their results down into two categories: negative and worry. Results were between
0.04 and 0.19 points lower than the reliability cited from Ganley and McGraw (2016). Wei
(2010) reported previous reliability on RMARS, and conducted an internal consistency
coefficient alpha. Their result of 0.91 it was 0.07 points lower than the cited Plake and Parker
(1982). Zyl and Lohr (1994) employed the Negative Affective Reaction Scale (Wigfield &
Meece, 1988) and mentioned that it had previously tested as reliable but did not cite any data. In
one case, the authors developed their own measure. Hocker (2017) created their own math
anxiety scale and did tests for both reliability and validity. They reported an alpha for treatment
(0.84) and control (0.88).
In summary, other than Zyl and Lohr (1994) who reported no reliability data, all alpha
coefficients scores, whether cited from past researchers or conducted by the researchers in the
present studies, were above 0.70, and most even higher. Meaning, all studies with reliability data
for their measure of math anxiety had sufficient reliability.
Validity
Seven studies mentioned validity. Batton (2010) measured validity but did not report if it
was adequate. Five studies reported that validity was adequate but did not provide data. Hocker

40
(2017) mentioned that three mathematic experts, four educational experts and two research
experts vetted their scale. They also said they piloted for validity but did not report data beyond
mentioning that it was adequate. Wittman (1996) was the only study that presented validity data.
They measured construct validation for MARS-E (Suinn et al., 1988), and reported significant
correlation to the Stanford Achievement Test at (-0.31).

41
Table 2
Dependent Variable: Math Anxiety
Study Math Anxiety Measure Sample Size Reliability Validity
Batton (2010) The Mathematics Anxiety Scale for Children (MASC)
Reliability (n = 562) Validity (n = 287)
Cronbach alpha 0.90 to 0.93, median 0.924
Cited Beasley, Long, and Natali (2001) and reported that it was measured
**Henderson (2019); Ruark (2018)
The Modified Abbreviated Math Anxiety Scale (mAMAS)
NR Ordinal alpha 0.89 for year 4 students Cronbach alpha 0.85 Test-retest reliability .85
Cited Carey et al. (2017) and reported good construct and divergent validity
Hines et al. (2016)
The Math Anxiety Rating Scale (MARS)
NR Reliability coefficient 0.90 Cronbach alpha 0.96 Test-retest reliability 0.90
NR
Hocker (2017)
Created by researcher, no name given
*Reliability control (n = 63) treatment (n = 48)
*Cronbach alpha (treatment 0.84) (control 0.88) *Validity reviewed by three mathematic experts, four educational experts, and two research experts. *Piloted scale and reported adequate validity
Kim et al. (2016)
Revised Mathematics Anxiety Rating Scale (RMARS)
*Reliability (n = 138)
* Cronbach alpha (pretest 0.91) (posttest 0.94) NR
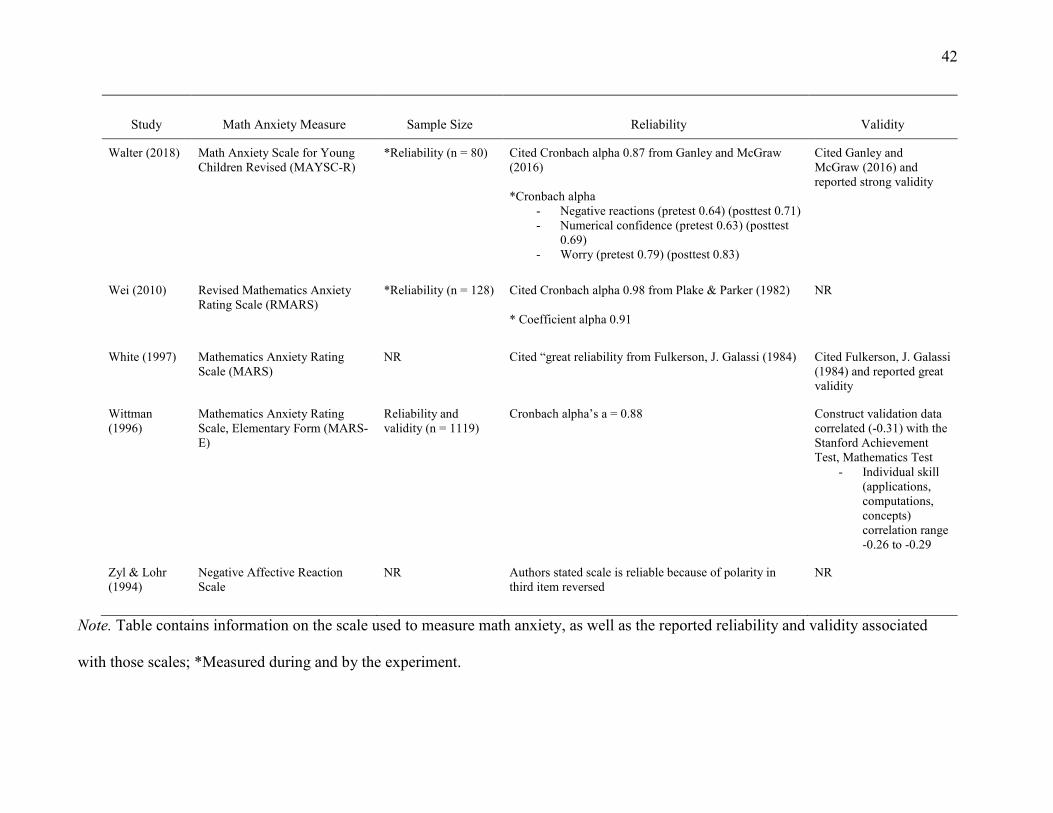
42
Study Math Anxiety Measure Sample Size Reliability Validity
Walter (2018) Math Anxiety Scale for Young Children Revised (MAYSC-R)
*Reliability (n = 80) Cited Cronbach alpha 0.87 from Ganley and McGraw (2016) *Cronbach alpha
- Negative reactions (pretest 0.64) (posttest 0.71) - Numerical confidence (pretest 0.63) (posttest
0.69) - Worry (pretest 0.79) (posttest 0.83)
Cited Ganley and McGraw (2016) and reported strong validity
Wei (2010) Revised Mathematics Anxiety Rating Scale (RMARS)
*Reliability (n = 128) Cited Cronbach alpha 0.98 from Plake & Parker (1982) * Coefficient alpha 0.91
NR
White (1997) Mathematics Anxiety Rating Scale (MARS)
NR Cited “great reliability from Fulkerson, J. Galassi (1984) Cited Fulkerson, J. Galassi (1984) and reported great validity
Wittman (1996)
Mathematics Anxiety Rating Scale, Elementary Form (MARS-E)
Reliability and validity (n = 1119)
Cronbach alpha’s a = 0.88 Construct validation data correlated (-0.31) with the Stanford Achievement Test, Mathematics Test
- Individual skill (applications, computations, concepts) correlation range -0.26 to -0.29
Zyl & Lohr (1994)
Negative Affective Reaction Scale
NR Authors stated scale is reliable because of polarity in third item reversed
NR
Note. Table contains information on the scale used to measure math anxiety, as well as the reported reliability and validity associated
with those scales; *Measured during and by the experiment.

43
Math Performance
As summarized in Table 3, five authors measured math performance. Walter (2018)
modified addition and subtraction fluency content from the curriculum program “i-Ready”
(Curriculum Associates, n.d.) and used it as their math performance measure. The content of this
assessment was addition and subtraction fluency. This is the only assessment that we know
sourced outside curriculum. In two studies, the classroom teachers and researchers collaborated
to create an Algebra 1-level assessment (Kim et al., 2016; Wei, 2010). White (1997) did not
specify who created their measure and did not describe the content beyond being basic algebraic
level. Wittman (1996) utilized flashcards as their assessment but did not specify if they were
created or purchased.
We converted results into Cohen’s d effect sizes. For purposes of our review, a positive
effect size indicates that math performance increased. As mentioned previously, a small effect
size must be at least 0.20 (Card, 2011). Only Wittman (1996) exceeded 0.20, but their effect of d
= 5.2126 was also a likely outlier, as was their anxiety effect size. Lastly, two authors reported a
negative effect. Although most effects are not significant, it must still be mentioned that
researcher-created measures typically result in inflated effect sizes (Cheung & Slavin, 2016).
While authors often relied on pre-established validity and reliability for their anxiety
measures, all reports of reliability and validity were tested during the study for math performance
measures. This is likely because, unlike anxiety measures, most performance assessments were
created during the study, and were not outside norm-referenced measures. This cautiously
includes Walter (2018), who did take content from i-ready (Curriculum Associates, n.d.), but
then modified it to meet the needs of his study. The only exception is White (1997), who did not
clarify who created their measure.

44
Kim et al. (2016) was the only study to report validity. They developed the measure to
mirror current classroom instructional content and reported sufficient face validity after
researchers and teachers inspected the test questions. Three studies reported reliability. Kim et al.
(2016) reported a high test-retest r = 0.79. Wei (2010) also reported = 0.79 for their test-retest
reliability. While Walter (2018) included i-ready’s (Curriculum Associates, n.d.) pre-established
report of reliability, they also tested it on their own modified assessment, which is what we chose
to include in the present review. They stated that results were strongly reliable, reporting pretest
(α = 0.89) and posttest (α = 0.87).

45
Table 3
Math Performance Data Collection Procedures and Effect Sizes
Study Measure Assessment procedures Sample
Size Reliability/validity Effect size
Kim et al. (2016)
Teacher and researcher created
Pre/posttest in every session covering: fundamentals of algebra, signed number arithmetic, combining like terms and distribution, factoring, and graphing linear equations using slope and y-intercept
T: 58 C: 70
*Face validity *Test-retest reliability Pearson pretest/posttest correlation r = 0.79
0.0459
Walter (2018)
i-Ready computational fluency practice
Pre/posttest addition and subtraction fluency
T: 38 C: 42
*Test-retest Reliability pretest (α = 0.89) and posttest (α = 0.87) measures
-0.1542
Wei (2010) Teacher and researcher created
Algebra pre/posttest in every session covering: order of operations, simplifying expressions, prime factorization, greatest common factor, and graphing concepts
T: 60 C: 68
*Test-retest reliability Pearson pretest/posttest correlation r = 0.79
0.0589
White (1997)
Not specified Pre/posttest covering “basic algebraic skills”
T: 23 C: 25
NR -0.0688
**Wittman (1996)
Flashcards
Pre/posttest measuring mean reaction time of 2 through 9 multiplication tables
T: 21 C: 12
NR 5.2126
Note. T= treatment C = control; Effect size as Cohen’s D as measured by Campbell’s
Collaboration (Wilson, n.d.); Positive effect size indicates increase in mathematic performance;
*asterisk indicates that reliability or validity was measured during the experiment; **only
measured performance in treatment group.
Research Question 2: Moderating Variables
We selected moderators based on availability of data and common patterns found in the
literature. Interventions were either administered to an entire class, or to a small group of
students that were pulled out of their class. Some interventions were therapeutic strategies used
with the goal of ameliorating math anxiety, while other authors employed math-based

46
interventions to attempt the same goal. The last pattern we decided to run in a moderator analysis
is the length of study. Some authors implemented their intervention for a couple days, while
others did so for a month.
Group Size
As found in Table 4, whole class settings resulted in a small effect size g = 0.257, p < .05.
Studies using a small group targeted intervention format resulted in a medium effect size of g =
0.603, p < .05. However, there is substantial overlap in confidence intervals, the small group
confidence interval being over twice as large as the whole class confidence interval. It is also
worth noting that the two outliers of the overall review were small group studies (Wittman, 1996;
Zyl & Lohr, 1994). Based on these limited data, small group and universal interventions produce
significant improvements in math anxiety but targeted small group interventions are more likely
to produce a larger effect size.
For whole class studies, the chi-square value for df(q) = 6, p = 0.877 is 2.423. Because
the corresponding q-value = 2.426 is essentially equal to its chi-square value, the data may be
considered homogenous. For small group studies, the chi-square value for df(q) = 3, p = 0.022 is
9.630. Because the corresponding q-value = 9.673 exceeds its corresponding chi-square value,
there is evidence of heterogeneity. The I2 for whole class functions as the reference group at
zero, and the 68.987% for small group relative to that indicates medium heterogeneity between
the two groups.

47
Table 4
Moderator Analysis: Intervention Group Size
Statistic Whole class Small group Number of studies 7 4 Hedge’s g 0.257 0.603 Standard error 0.079 0.274 Variance 0.006 0.075 Lower limit 0.102 0.067 Upper limit 0.411 1.140 Z-value 3.259 2.203 p-value 0.001 0.028 Q-value 2.426 9.673 df (q) 6 3 p-value (heterogeneity) 0.877 0.022 I-squared 0.000 68.987
Note. Calculated as a random effects model.
Intervention Type
As reported in Table 5, our analysis of academic interventions resulted in a small effect
size g = 0.331, p < .05. Therapeutic interventions also resulted in a small effect size g = 0.342, p
< .05. It should be mentioned that the biggest outlier of the overall review, Zyl and Lohr (1994),
was a therapeutic intervention. The other outlier, Wittman (1996), was an academic intervention.
Substantial overlap in confidence intervals exists, which alongside similar effect sizes, may
indicate that there is no distinctive discrepancy in effectiveness between academic and
therapeutic interventions for math anxiety.
In terms of heterogeneity for academic studies, the critical chi-square value for df(q) = 5
and p-value = 0.564 is 3.899. Because the corresponding q-value = 3.899 is equal to its chi-
square value, and does not exceed it, this groups may be sufficiently homogeneous. For
therapeutic studies, the critical chi-square value for df(q) = 4 and p-value = 0.060 is 9.044.
Because the corresponding q-value = 9.047 is essentially equal, this group is likely sufficiently

48
homogenous. The I2 for academic functions as the reference group at 0, and the 55.788% for
therapeutic relative to that indicates medium heterogeneity between the two groups.
Table 5
Moderator Analysis: Intervention Type
Statistic Academic Therapeutic Number of studies 6 5 Hedge’s g 0.331 0.342 Standard error 0.095 0.160 Variance 0.009 0.026 Lower limit 0.146 0.028 Upper limit 0.517 0.656 Z-value 3.496 2.135 p-value 0.000 0.033 Q-value 3.899 9.047 df (q) 5 4 p-value (heterogeneity) 0.564 0.060 I-squared 0.000 55.788
Note. Random effects model.
Number of Sessions
Number of sessions ranged from 3-30. Two studies did not report the exact number of
sessions, so only nine studies from our review were eligible for this analysis. Hocker (2017)
reported that their intervention was a “minimum of five hours” (p. 59) but did not explain how
these hours were divided into sessions. White (1997) explained they implemented their`
intervention across six weeks, but also did not specify the number of sessions. The findings from
this meta-regression analysis are found in Table 6. As this is not a categorical characteristic, we
opted to perform a meta-regression. Although the session coefficient b = -0.00064 is suggestive
of a slightly negative slope, it is so close to zero that it likely means that there is no change in
effect size relative to number of sessions. This means that the number of sessions might not
influence the efficacy of the intervention, or that there is too little data reported in the reviewed

49
studies. Reinforcing this result, the p-value for sessions b = -0.00064, p = 0.5549, is above 0.50,
meaning this moderating variable is not significant. Because the session coefficient confidence
interval overlaps with zero, there is no significant difference between that coefficient and zero.
Table 6
Moderator Analysis: Number of Sessions
Covariate Coefficient Standard Error 95% Lower 95% Upper Z-value p Intercept 0.3879 0.1634 0.0676 0.7082 2.37 0.0176 Sessions -0.0064 0.0108 -0.0275 0.0148 -0.59 0.5549
Note. Meta-regression calculated from Hedge’s g effect sizes of 9 studies to analyze number of
sessions as a moderating variable.
Research Question 3: Methodological Quality
A visual representation of methodological quality can be found in Figure 4. Studies with
a circle or triangle graphed above the horizontal 80%-met dotted line may be considered a
somewhat methodologically rigorous study. Absolute scoring is more rigorous because the study
is rewarded a point for an indicator only if all components are met, while the weighted system
awards partial points if only a few components are met.
Methodologically Rigorous Studies
None of the reviewed studies met the requirements to be identified as methodologically
rigorous based on the absolute scoring method. Three of the reviewed studies scored above 80%
based on the weighted coding method (Henderson, 2019; Wei, 2010; Wittman, 1996).
Interestingly, Wei (2010) and Wittman (1996) tested the same computer program, barring small
modifications to the overall intervention process. Wittman (1996) had the second highest effect
size g = 0.868. While Wei (2010) had a smaller effect g = 0.221, it was still significant. The fact
that these studies reported an impact on lowering math anxiety, as well as decent methodological

50
rigor, is indicative of trustworthiness and dependability. Unfortunately, Henderson (2019)
reported no significant effect.
Methodological Strengths
All 11 studies met each component of indicator four, meaning authors reported critical
elements of intervention procedures and materials utilized. All studies met 5.2, where it was
required to report on length and duration of the intervention. Components 6.2, 6.3, 6.4 were also
all met, covering the difference in control and treatment environments, ensuring the control
participants could not access the treatment, and how participants were assigned to groups.
Components 7.1, 7.2, 7.3 were also all met, requirements included socially important outcomes,
clearly defined dependent variable, and reporting of all measures even when there was not a
positive effect. Lastly, 8.1 and 8.2 were met by all studies. These questions asked that statistical
measures were included, such as ANOVAs or t-tests, effect sizes, or data from which an effect
could be calculated.
Methodological Weaknesses
Component 2.1 was not met in 55% of the articles, which required information on
participant demographics such as age, gender, ethnicity, language status, and socioeconomic
status. Age and gender were the most consistently reported characteristics. There was no pattern
in how often the other demographics were omitted, what was reported was quite variable across
studies. Component 2.2 was unmet by 64% of the articles, where it was required that authors
report on disability or risk status in their participant population. Component 5.1 was not fulfilled
by 91% of the studies, in which they had to collect and report implementation fidelity through
direct measurement. In 91% of the articles, component 5.3 was not met, where they should have
reported on the implementation fidelity process and data collected through all stages of the

51
intervention, on all interventionists, settings, and participants. Studies did not pass component
6.1 in 91% of cases, which could not be met if 5.1 was not met. This indicator claims that an
article cannot prove that the researcher was in control of the independent variable without
implementation fidelity measures. Component 6.8 was unmet by 64% of the articles, in which
authors needed to report an overall attrition rate below 30%. Component 6.9 was unmet by 82%
of articles, being required to report a differential attrition rate below 10%. Most of the studies
that did not pass 6.8 and 6.9 simply did not report if attrition happened at all.
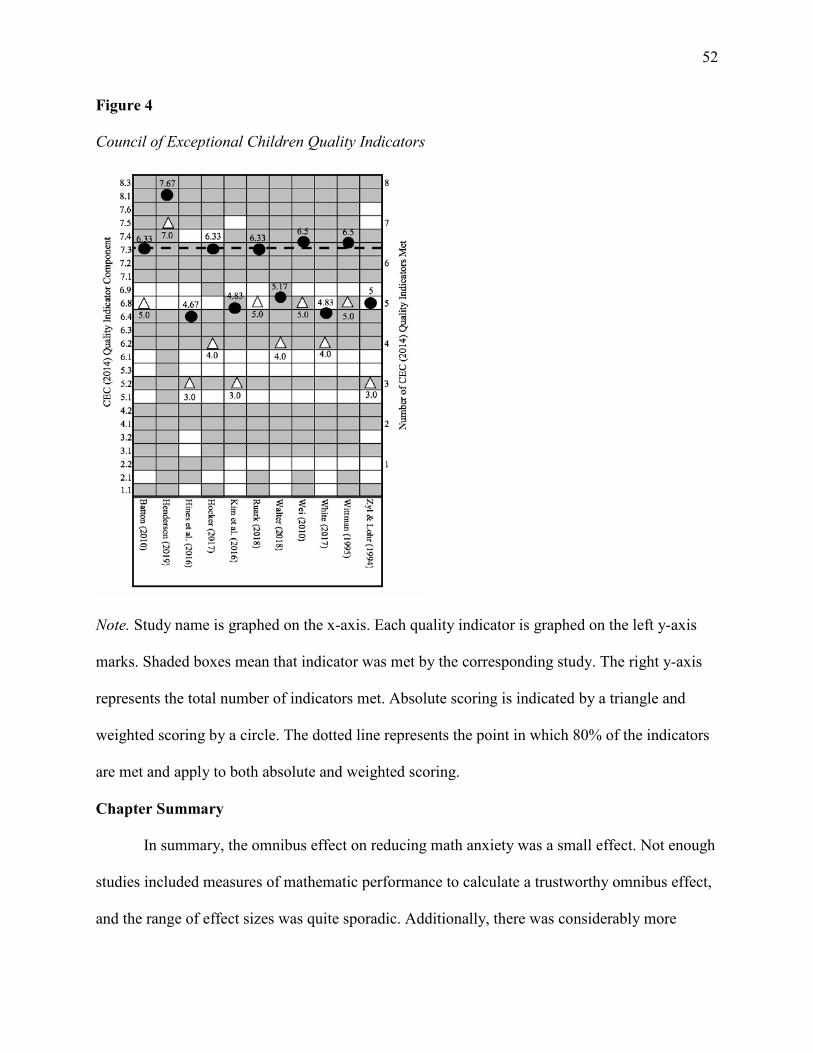
52
Figure 4
Council of Exceptional Children Quality Indicators
Note. Study name is graphed on the x-axis. Each quality indicator is graphed on the left y-axis
marks. Shaded boxes mean that indicator was met by the corresponding study. The right y-axis
represents the total number of indicators met. Absolute scoring is indicated by a triangle and
weighted scoring by a circle. The dotted line represents the point in which 80% of the indicators
are met and apply to both absolute and weighted scoring.
Chapter Summary
In summary, the omnibus effect on reducing math anxiety was a small effect. Not enough
studies included measures of mathematic performance to calculate a trustworthy omnibus effect,
and the range of effect sizes was quite sporadic. Additionally, there was considerably more

53
consistency in authors selecting common, well-tested metrics for math anxiety as compared to
math performance. The moderating analysis that had the most significant discrepancy was the
difference between entire class interventions and small groups. Small groups being more
effective in improving math anxiety symptoms. Lastly, only three studies met the criteria to
qualify as potentially methodologically rigorous.

54
CHAPTER 5
Discussion
The present review is the first meta-analysis evaluating math anxiety interventions since
Hembree’s (1990) analysis. It is also the only review exclusively focused on interventions
implemented in K-12 school settings. The omnibus effect of our review indicated that these
interventions have small effect in improving math anxiety symptoms. In context of practical
significance, we discovered that even a small effect may be valuable. While Hembree (1990) did
not generate an omnibus effect, they reported a large effect for certain therapeutic treatments
outside the classroom, and no significant effect for classroom-based interventions. Through our
moderator analysis, we uncovered variables that expand Hembree’s (1990) work to understand
what may make classroom-based interventions effective. We then continue this chapter by
discussing additional moderating variables, our methodological assessment, limitations,
implication for practitioners, and end with a call for future research.
Practical Significance of Effects
Most studies reported no significance in the improvement of math anxiety symptoms
because of confidence intervals that overlapped with zero. For studies that reported at least some
improvement, authors reported practical significance in a myriad of ways. In one case, the author
reported a benefit in terms of math behavior. Wittman (1996) reported that students increased
their knowledge of multiplication facts and improved automaticity. Other times, authors reported
benefit in terms of emotional intelligence, self-confidence and attitudes towards math. Batton
(2010) explained that at the beginning of their study, several students would often ask for the
nurse because of stomach aches or try to call home. After the study, these students expressed
excitement and did not try to escape class anymore. Henderson (2019) reported that as math
55
anxiety symptoms improved, so did self-efficacy. Hines et al. (2016) shared that students
demonstrated increased ability to analyze their thought patterns and became more effective at
processing emotions. Hocker (2017) cited that improvement in math anxiety symptoms was
associated with improved growth mindset and viewing math positively. One student who
previously exhibited reluctance in math participation, asked if they could sign up for additional
mindset classes. Hocker (2017) also reported higher attendance and increased math engagement.
Zyl and Lohr (1994) reported a large effect but did not include a description of practical
significance.
Comparison of Findings to Hembree (1990)
While Hembree (1990) did include K-12 interventions in their review, they also
incorporated post-secondary studies. As such, while our comparisons may provide important
insight, they must be approached with prudence.
Math Anxiety
Academic Interventions. Hembree’s (1990) “curricular change” intervention category is
comparable to our academic category. Hembree (1990) was insistent that these curricular
interventions were not successful. Their effect ∆ = -.04 [-0.46, 0.48], p< 0.01, is not significant.
It is important to note that, in their study, a negative indicated an improvement in math anxiety
symptoms. Additionally, their confidence intervals overlap with zero, which also suggests there
was no effect. Our academic result g = 0.331[0.146, 0.517], p = 0.000 is a small effect.
Confidence interval overlap exists between these two effects, indicating that our present study
could have a small measure of homogeneity with Hembree (1990). Although caution must be
exercised when comparing a Glass’s ∆ with a Hedge’s g, it is still clear that there is a significant
discrepancy between the two effects. One reason for this discrepancy could be because

56
Hembree’s (1990) analysis included 17 studies, while our academic intervention analysis only
included six. The fewer studies in a meta-analysis, the more influence outliers can have on the
overall effect (Meta-Analysis, 2013). In contrast, because Hembree (1990) did not report a
detailed methodological assessment, we cannot determine which analysis contained more
rigorous studies. Our limited number of studies and Hembree’s (1990) lack of methodological
quality means we should approach both reviews with some measure of caution.
Therapeutic Interventions. Hembree’s (1990) several psychological intervention
categories equate with our therapeutic category. Their effect for whole-class psychological
interventions ∆ = -0.10 [-.38, 0.18], p< 0.01 was inadequate because the confidence intervals
overlap with zero, and the effect size was not significant. Hembree’s (1990) out-of-class
categories ranged in effect from ∆ = 0.03 to d = 1.15, with an estimated mean of 0.642. The
present review’s therapeutic intervention analysis included five classroom-based studies and one
out-of-class study. This analysis produced a small effect g = 0.342 [0.028, 0.656], p = 0.033. It is
difficult to compare our present study to Hembree’s (1990) because we did not separate our
therapeutic analysis into subgroups by location of treatment as they did. However, it is
interesting to note that our one out-of-class intervention (Zyl & Lohr, 1994) had a much larger
effect in comparison to the classroom-based interventions, which does seem to validate
Hembree’s (1990) results. In one of our moderator analyses, we discovered that small-group
settings produced higher effects. Because the out-of-class studies for both Hembree (1990) and
our review were small-groups, the results of this moderator analyses could be the explanation for
why out-of-class therapeutic interventions were more effective.
Our third highest effect size, and the highest non-outlier, Hocker (2017) g = 0.449 [0.085,
0.812], p = 0.015, combined mindset training with math activities that then applied mindset

57
strategies. Hembree’s (1990) largest effect size ∆ = 1.15 [0.46, 1.83] was the result of
interventions that combined cognitive and behavioral strategies. Cognitive interventions included
reappraisal, which, according to Ramirez et al. (2018), is a key mindset skill. Systematic
desensitization is one type of behavioral intervention that Hembree (1990) reviewed. There may
be some parallels to consider between systematic desensitization and targeted math instruction.
However, it is important to note that, (a) Hocker’s (2017) effect size is much lower with no
confidence interval overlap, (b) Hocker (2017) was conducted in a whole-class setting, while in
contrast, Hembree’s (1990) cognitive-behavior category was out-of-class.
Math Performance
Hembree (1990) reported their math performance dependent variable in seven subgroups.
Of their seven categories, only one was a small effect, and only two were medium effects. The
remaining four had no significant effect. In our review, we did not calculate the overall effect for
our included studies. Of our five studies, the Cohen’s d range was -0.1542 to 5.2126. This effect
size range is rather large and overlaps with zero, indicating there could be no effect. If Hembree
(1990) and our present review reported such little impact of math anxiety interventions on math
performance, it’s important to discuss the point of implementing these interventions. It is
possible that one issue is that of timing. For example, while patterns gathered in the present
review demonstrate that math anxiety symptoms can improve even with relatively few
intervention sessions (average interventions lasting only 7.4 sessions), it is logical to conclude
that even with an abrupt drop in math anxiety, time is needed to then remediate math skills lost
during the period of high math anxiety.

58
Moderator Variables
Setting
The response to intervention framework (RTI) advocates for continuous assessment of
performance to discern when a student may need more intensive support. All students receive
universal tier one supports, small groups of students receive more intensive tier two supports,
and individualized plans are created at tier three. A key variable in this framework is utilizing
evidence-based practices to address student needs (Jimerson et al., 2016). When developing
these interventions, it is imperative to determine in which tier that practice will be most
efficacious. The results of our moderator analysis indicated that small group settings were
slightly more effective at reducing math anxiety than whole-class, otherwise called universal
settings in the RTI framework. Of the small-group studies, 50% were academic-based, which
may contradict Hembree’s (1990) assertion that these types of interventions are not effective.
Hembree (1990) never ran an analysis to determine the efficacy of universal versus small-group
settings for academic (curricular) interventions. By analyzing the difference between whole-
group and small-group settings, when Hembree (1990) did not, we discovered a pattern that
otherwise couldn’t be determined from a single omnibus effect. As such, our analysis suggests
that academic interventions may actually be effective when conducted in small group settings.
Intervention Type
The results of the intervention type moderator analysis indicated that there was virtually
no difference between therapeutic and academic interventions within our included studies.
Practitioners should be allowed flexibility to implement interventions that meet students’ needs
and fit the classroom context. However, as noted previously the most beneficial interventions are
typically a combination of both types.

59
Number of Sessions
There was no significant difference in efficacy when we moderated for number of
sessions. Meaning, more sessions did not improve math anxiety symptoms at a larger effect as
compared to fewer sessions. Therefore, it may be justified to anticipate changes in math anxiety
levels in even just seven sessions, the average intervention length. Knowing how fast an
intervention should work can help inform when to decide if a student needs to move to more
intensive tiers in the RTI framework. However, the quick improvement of math anxiety
symptoms does not necessarily mean it wouldn’t be beneficial to continue these practices in
longer term. Perhaps, there is value in implementing these interventions as a form of
maintenance. Lastly, it is important to note that this meta-regression included below the
recommended number of studies, so these results should be generalized with caution.
Methodological Quality
Under the CEC (2014) requirements, studies must meet all indicators to be considered
methodologically sound. None of our studies met this requirement. Three studies met more than
80% of the indicators, which means they are potentially methodologically sound studies. One of
the most glaring deficits was that 91% of studies did not meet questions covering implementation
fidelity. This is concerning because, as mentioned in indicator 6.1, one cannot prove that the
researcher had control over the independent variable without reporting implementation fidelity
(CEC, 2014).
Additionally, while Wittman (1996) was a positive outlier, this study was also one of the
most methodologically rigorous studies in our review. Their attention to rigor increases the
credibility of their reported effect. As Wittman (1996) was an academic intervention, this
indicates that this treatment category may truly be more efficacious than it currently appears.

60
This might also be suggesting that we have a large research gap in academic interventions for
math anxiety, and if addressed through conducting methodologically rigorous academic
interventions, we might find that Wittman (1996) may not be an outlier.
Limitations
It must be noted that the criteria to include articles after the year 1990 may have
inadvertently missed articles that Hembree’s (1990) analysis also missed. If Hembree (1990)
submitted their paper for publication in the late 1980’s there might have been new studies
published before the beginning of our inclusion criteria. Additionally, although coding reliability
was acceptable, the article search reliability was very low. It is unclear if directions were
ambiguous, or if training was insufficient. However, because the reliability process did not
produce new qualifying articles, and because we conducted both an ancestral and index search,
we remain confident that we did our due diligence to represent the current field.
When conducting a meta-analysis, it is important to include at least 10 studies (Meta-
Analysis, 2013). Unfortunately, when we ran our “number of sessions” meta-regression, we only
included nine. As such, these results should not be widely generalized. Secondly, because
Hocker (2017) did not provide the reader all necessary standard deviations, we had to perform
some estimation to generate the control group’s standard deviation. This comes with some
measure of risk of altering the overall effect. Additionally, Zyl and Lohr (1994) reported the
mean change for treatment and control, but no standard deviation. Because we had to create
hypothetical participant data to fill in these gaps, caution should be maintained when
generalizing the effect size. Although we strived to be conservative, Zyl and Lohr (1994) was
still a notable outlier. With a standard deviation of 0.084, they were located 14.94 standard
deviations above the omnibus mean.

61
Implications for Practitioners
Based on our meta-analysis, it is our recommendation that practitioners should consider
implementing math anxiety treatments as tier two interventions within an RTI framework. These
interventions may reduce math anxiety quickly. If math anxiety symptoms do not improve after
approximately seven sessions, a more intensive intervention might be necessary. Additionally,
although math anxiety can be treated quickly, maintenance interventions might be valuable while
the teacher remediates math deficiencies. Academic and therapeutic interventions were equally
efficacious in the present study; meaning, practitioners may select the intervention type makes
the most sense in their setting. That said, the most effective intervention in the present study
involved teaching of a therapeutic skill followed with structured math lessons where the
therapeutic skill was applied. This was also confirmed in Hembree (1990).
Future Research
We had hoped to collect enough data to run a moderator analysis with disability status;
unfortunately, authors rarely reported disability status of their participants. The special education
population often has additional barriers to math performance, and surely, those barriers
contribute to math anxiety. This field would benefit from studies that measure the prevalence of
math anxiety in these diverse populations, as well as what interventions are most efficacious for
which disabilities. In general, this field would benefit from increased commitment to
methodological rigor. There is greatest need for improvement in the reporting of implementation
fidelity. As defined by CEC (2014), this can take the form of direct measures such as
“Observations using a checklist of critical elements of the practice.” When measuring dosage,
self-reporting is also appropriate. These checklists would be used to record that the
interventionist and participants completed required tasks, and that they completed tasks in the

62
right setting. The interventionist or observer should document a checklist at the “Beginning,
middle, and end of the intervention period” (CEC, 2014, p. 4). Lastly, math performance
improvement was quite low in both the present study and in Hembree (1990). As remediating
math performance, may take time, improvement might not show up in a week or month long
study. The field would benefit from longitudinal research on math anxiety interventions’ impact
on math performance. It may be useful to shift the framework from measuring math performance
to math engagement. There may be more immediate changes in math engagement as compared
to the time it may take to remediate math performance. As such, measuring engagement may
more quickly reveal if improvement in math anxiety symptoms is translating into learning
outcomes. This framework also provides a way to track observable behavior.
Conclusion
School-based interventions for math anxiety address a very relevant and concerning trend
of high levels of math anxiety within K-12 student populations. High math anxiety can affect an
individual’s monetary decision-making skills and the ability to assess risk in day-to-day life.
Math anxiety may also contribute to workforce-demand deficits in STEM-related fields. The
interventions included in the present review can be effective tier-two interventions within the
RTI framework. The most effective format is the combination of therapeutic elements, such as
mind-set training, expressive writing, and mindfulness applied within math instruction. Most
studies included in the present review were not statistically significant because confidence
intervals overlapped with zero. Yet, the omnibus effect was significant, which attests to the
power of the meta-analysis aggregate.
63
REFERENCES
References marked with an asterisk indicate studies included in the meta-analysis.
Ariapooran, S. (2017). Mathematics motivation, anxiety, and performance in female deaf/hard-
of-hearing and hearing students. Communication Disorders Quarterly, 38(3), 172-178.
https://doi-org.erl.lib.byu.edu/10.1177/1525740116681271
Ashcraft, M. H. (2002). Math anxiety: Personal, educational, and cognitive consequences.
Current Directions in Psychological Science, 11(5), 181-185.
https://doi.org/10.1111/1467-8721.00196
*Batton, M. (2010). The effect of cooperative groups on math anxiety [Unpublished doctoral
dissertation]. ProQuest Dissertations Publishing and Theses Global.
Bernstein, D., Borkovec, T. D., & Hazlett-Stevens, H. (2000). New directions in progressive
relaxation training: A guidebook for helping professionals. Praeger Publishers.
Borenstein, M., Hedges, L., Higgins, J., & Rothstein, H. (2013). Comprehensive meta-analysis
(Version 3) [Computer software]. Biostat. https://www.meta-analysis.com
Card, N. A. (2011). Applied meta-analysis for social science research. Guilford Press.
Cheung, A. C., & Slavin, R. E. (2016). How methodological features affect effect sizes in
education. Educational Researcher, 45(5), 283–292.
Code, M. (2005) Mathematical naturalism and the powers of symbolisms. Cosmos and History:
The Journal of Natural and Social Philosophy, 1(1), 35-53.
Council for Exceptional Children Standards for Evidence-Based Practices in Special Education.
(2014). CEC professional standards.
https://www.cec.sped.org/~/media/Images/Standards/CEC%20EBP%20Standards%20co
ver/CECs%20Evidence%20Based%20Practice%20Standards.pdf

64
Curriculum Associates. (n.d.). i-Ready: Actionable insights. Engaging instruction. Meaningful
growth. https://www.curriculumassociates.com/products/i-ready
Devine, A., Hill, F., Carey, E., & Szűcs, D. (2018). Cognitive and emotional math problems
largely dissociate: Prevalence of developmental dyscalculia and mathematics
anxiety. Journal of Educational Psychology, 110(3), 431–444.
https://doi.org/10.1037/edu0000222
Dowker, A., Sarkar, A., & Looi, C. Y. (2016). Mathematics anxiety: What have we learned in 60
years? Frontiers in Psychology, 7(508). https://doi.org/10.3389/fpsyg.2016.00508
Ganley, C. M., Mingle, L. A., Ryan, A. M., Ryan, K., Vasilyeva, M., & Perry, M. (2013). An
examination of stereotype threat effects on girls' mathematics performance.
Developmental Psychology, 49(10), 1886–1897. https://doi.org/10.1037/a0031412
Georgiou, A., Soulis, S. G., Rapti, D. (2018). Math anxiety of students with high functioning
autism spectrum disorder. American International Journal of Social Science, 7(4), 112-
122. https://doi.org/10.30845/aijss.v7n4p15
Gunderson, E. A., Park, D., Maloney, E. A., Beilock, S. L., & Levine, S. C. (2018). Reciprocal
relations among motivational frameworks, math anxiety, and math achievement in early
elementary school. Journal of Cognition and Development, 19(1), 21-46.
https://doi.org/10.1080/15248372.2017.1421538
Head, T. (2006). Conversations with Carl Sagan. University Press of Mississippi.
Hembree, R. (1990). The nature, effects, and relief of mathematics anxiety. Journal for Research
in Mathematics Education, 21(1), 33-46. https://doi.org/10.2307/749455

65
*Henderson, D. P. S. (2019). Exploring the impact of a mindfulness-based intervention in
relation to primary school children’s math anxiety [Unpublished dissertation]. University
of Exeter.
*Hines, C. L., Brown, N., & Myran, S. (2016). The effects of expressive writing on general and
mathematics anxiety for a sample of high school students. Education, 137(1), 39-45.
Retrieved from https://eric.ed.gov/?id=EJ1112175
Ho, H., Senturk, D., Lam, A. G., Zimmer, J. M., Hong, S., Okamoto, Y., ... Wang, C. (2000).
The affective and cognitive dimensions of math anxiety: A cross-national study. Journal
for Research in Mathematics Education, 31(3), 362-379. https://doi.org/10.2307/749811
*Hocker, T. L. (2017). A study of perceptions of math mindset, math anxiety, and view of math
by young adults [Unpublished doctoral dissertation]. Southeastern University.
Jimerson, S. R., Burns, M. K., & VanDerHeyden, A. M. (2016). Handbook of response to
intervention: The science and practice of multi-tiered systems of support. Springer.
*Kim, Y., Thayne, J., & Wei, Q. (2016). An embodied agent helps anxious students in
mathematics learning. Education Tech Research Dev, 65(1), 219-235.
https://doi.org/10.1007/s11423-016-9476-z
Klados, M. A., Simos, P., Micheloyannis, S., Margulies, D., & Bamidis, P. D. (2015). ERP
measures of math anxiety: How math anxiety affects working memory and mental
calculation tasks? Frontiers in Behavioral Neuroscience, 9(282), 1-9.
https://doi.org/10.3389/fnbeh.2015.00282
LaGue, A., Eakin, G., & Dykeman, C. (2019). The impact of mindfulness-based cognitive
therapy on math anxiety in adolescents. Preventing School Failure: Alternative

66
Education for Children and Youth, 63(1), 1-7.
http://dx.doi.org/10.1080/1045988X.2018.1528966
Lusardi, A., & Mitchell, O. S. (2014). The economic importance of financial literacy: Theory
and evidence. Journal of Economic Literature, 52(1), 5–44.
http://dx.doi.org/10.1257/jel.52.1.5
Ma, X. (1999). A meta-analysis of the relationship between anxiety toward mathematics and
achievement in mathematics. Journal for Research in Mathematics Education, 30(5),
520-540. https://doi.org/10.2307/749772
Mammarella, I. C., Dowker, A., & Caviola, S. (2019). Math anxiety: What is known, and what is
still missing. Routledge, Taylor and Francis Group.
Mammarella, I. C., Hill, F., Devine, A., Caviola, S., & Szűcs, D. (2015). Math anxiety and
developmental dyscalculia: A study on working memory processes. Journal of Clinical
and Experimental Neuropsychology, 37(8), 878-887.
https://doi.org/10.1080/13803395.2015.1066759
Meece, J., Wigfield, A., & Eccles, J. (1990). Predictors of math anxiety and its influence on
young adolescents' course enrollment intentions and performance in mathematics.
Journal of Educational Psychology, 82(1), 60-70. https://doi.org/10.1037/0022-
0663.82.1.60
Meta-Analysis. (2013, September 15). Meta regression using comprehensive meta-analysis
[Video]. Youtube. https://youtu.be/39PKfU4cRBc
McLeod, S. (2015). Systematic desensitization. Simply Psychology.
https://www.simplypsychology.org/Systematic-Desensitisation.html
67
Moher, D., Liberati, A., Tetzlaff, J., Altman D. G. (2009). Preferred reporting items for
systematic reviews and meta-analyses: The PRISMA statement. PLoS Med, 6(7),
e1000097. doi:10.1371/journal.pmed1000097
Namkung, J., & Lin, X. (2019). The relation between mathematics anxiety and mathematics
performance among school-aged students: A meta-analysis. Review of Educational
Research, 89(3), 459-496. https://doi.org/10.3102/0034654319843494
National Governors Association, NGA Center for Best Practices. (2011). Building a science,
technology, engineering, and math education agenda an update of state actions.
Retrieved from https://files.eric.ed.gov/fulltext/ED532528.pdf
Nearpod. (n.d.). You’ll wonder how you taught without it. https://nearpod.com/
Organisation for Economic Co-operation and Development. (2013). Education at a glance 2013:
OECD indicators. OECD Publishing. http://dx.doi.org/10.1787/eag-2013-en
Plake, B. S., & Parker, C. S. (1982). The development and validation of a revised version of the
mathematics anxiety rating scale. Educational and Psychological Measurement, 42(2),
551–557. https://doi.org/10.1177/001316448204200218
Rainie, L., & Anderson, J. (2017, February 8). Code-dependent: Pros and cons of the algorithm
age. Pew Research Center. https://www.pewresearch.org/internet/2017/02/08/code-
dependent-pros-and-cons-of-the-algorithm-age/
Ramirez, G., Shaw, S., & Maloney, E. (2018). Math anxiety: Past research, promising
interventions, and a new interpretation framework. Educational Psychologist, 53(2), 1-
20. https://doi.org/10.1080/00461520.2018.1447384

68
Reyna, V. F., Nelson, W. L., Han, P. K., & Dieckmann, N. F. (2009). How numeracy influences
risk comprehension and medical decision making. Psychological Bulletin, 135(6), 943–
973. https://doi.org/10.1037/a0017327
Ritchie, S. J., & Bates, T. C. (2013). Enduring links from childhood mathematics and reading
achievement to adult socioeconomic status. Psychological Science, 24(7), 1301-1308.
https://doi.org/10.1177/0956797612466268
*Ruark, A. D. (2018). The effect of expressive writing on the math anxiety scores of middle
school students enrolled in a public school in east Texas [Unpublished doctoral
dissertation]. Liberty University.
Savitsky, D. (n.d.). How to create a random sample in excel. Survey Monkey.
https://www.surveymonkey.com/curiosity/how-to-create-a-random-sample-in-excel/
Skagerlund, K., Östergren, R., Västfjäll, D., & Träff, U. (2019). How does mathematics anxiety
impair mathematical abilities? Investigating the link between math anxiety, working
memory, and number processing. PLOS ONE, 14(1), 1-17.
https://doi.org/10.1371/journal.pone.0211283
Suinn, R., Taylor, S., & Edwards, R. (1988). Mathematics anxiety rating scale for elementary
school students (MARS-E): Psychometric and normative data. Educational &
Psychological Measurement, 48(4), 979-986. https://doi.org/10.1177/0013164488484013
Supekar, K., Iuculano, T., Chen, L., & Menon, V. (2015). Remediation of childhood math
anxiety and associated neural circuits through cognitive tutoring. The Journal of
Neuroscience: The Official Journal of the Society for Neuroscience, 35(36), 12574-
12583. doi.org/10.1523/JNEUROSCI.0786-15.2015

69
University of Illinois Library. (2020, October 15). Evidence based medicine: PICO. University
Library. https://researchguides.uic.edu/ebm
U.S. Department of Education. (2017). NAEP mathematics & reading assessments. The Nation’s
Report Card. Retrieved from
https://www.nationsreportcard.gov/reading_math_2017_highlights/
Walston, J., & McCarroll, J. C. (2010). Eighth-grade algebra: Findings from the eighth-grade
round of the early childhood longitudinal study, kindergarten class of 1998-99. U.S.
Department of Education: NCES. Retrieved from:
https://nces.ed.gov/pubs2010/2010016.pdf
*Walter, H. (2018) The effect of expressive writing on second-grade math achievement and math
anxiety [Unpublished doctoral dissertation]. George Fox University.
Wang, M., & Degol, J. (2013). Motivational pathways to STEM career choices: Using
expectancy–value perspective to understand individual and gender differences in STEM
fields. Developmental Review, 33(4), 304-340. https://doi.org/10.1016/j.dr.2013.08.001
*Wei, Q. (2010). The effects of pedagogical agents on mathematics anxiety and mathematics
learning [Unpublished doctoral dissertation]. Utah State University.
*White, P. J. (1997). The effects of teaching techniques and teacher attitudes on math anxiety in
secondary level students [Unpublished master’s thesis]. Salem-Teikyo University.
Wigfield, A., & Meece, J. L. (1988). Math anxiety in elementary and secondary school
students. Journal of Educational Psychology, 80(2), 210–216.
https://doi.org/10.1037/0022-0663.80
Wilson, D. B. (n.d.). Practical meta-analysis effect size calculator [Online calculator]. Retrieved
from https://campbellcollaboration.org/research-resources/effect-size-calculator.html
70
*Wittman, T. K. (1996). The relationship between automatization of multiplication facts an
elementary school children’s mathematics anxiety [Unpublished doctoral dissertation].
University of South Dakota.
Qualtrics [Apparatus and software]. (2019). Provo, Utah. Retrieved from
https://www.qualtrics.com
*Zyl, T. V., & Lohr, J. W. (1994). An audiotaped program for reduction of high school students’
math anxiety. School Science and Mathematics, 94(6), 310-312.
https://doi.org/10.1111/j.1949-8594.1994.tb15681.x

71
APPENDIX A
Calculation Details
Table A1
Math Anxiety: Campbell’s Collaboration Calculations
Study Sample Size
Test Used Effect size Confidence Intervals
Batton (2010) T: 32 C: 32
Means, Standard Deviations, and Sample Sizes -0.2561 -0.2561, -0.74
Henderson (2019)
T: 102 C: 82
Means, Standard Deviations, and Sample Sizes -0.1244 -0.2359, 0.1666
Hines et al. (2016)
T: 54 C: 39
Means, Standard Deviations, and Sample Sizes -0.2925 -0.7065, 0.1215
Hocker (2017) T: 48 C: 63
Mean Gain Scores, Pre and Post SDs, and Paired T-
tests
0.4517 0.082, 0.8215
Kim et al. (2016)
T: 55 C: 63
Means and Standard Deviations with Subgroups -0.075 -0.6572, 0.5072
Ruark (2018) T: 18 C: 22
Means, Standard Deviations, and Sample Sizes -0.1621 -0.7861, 0.4618
Walter (2018) T: 38 C: 42
F-test, 2-group, Unequal Sample Sizes -0.3126 -0.7541, 0.1288
Wei (2010) T: 60 C: 68
Means, Standard Deviations, and Sample Sizes -0.2326 -0.5809, 0.1157
White (1997) T: 23 C: 25
T-test, Unequal Sample Sizes -0.3313 -0.9015, 0.2388
Wittman (1996) T: 21 C: 12
Means and Standard Deviations with Subgroups -0.8898 -1.6308, 0.1488
Zyl & Lohr (1994)
T: 10 C: 10
Student’s T-test and Total Sample Size -1.6353 -2.6478, -0.6229
Note. The Campbell’s Collaborative Cohen’s d calculator (Wilson, n.d.) used for each study is
indicated; Effect size as Cohen’s d; T = treatment C = Control; negative effect indicates
improvement in math anxiety symptoms.

72
Table A2
Math Performance: Campbell’s Collaboration Calculations
Study Sample Size Test Used Effect Size
Confidence Intervals
Kim et al. (2016)
T: 58 C:70
Means and Standard Deviations with Subgroups
0.0459 -0.3021, 0.394
Walter (2018) T: 38 C: 42
Means, Standard Deviations, and Sample Sizes
-0.1542 -0.5937, 0.2853
Wei (2010) T: 60 C: 68
Means, Standard Deviations, and Sample Sizes
0.0589 -0.2883, 0.4062
White (1997) T: 23 C: 25
T-test, Unequal Sample Sizes -0.0688 -0.6352, 0.4977
Wittman (1996) T: 21 C: 12
F-test, 2-group, Equal Sample Sizes 5.2126 3.4191, 7.0062
Note. The Campbell’s Collaborative Cohen’s d calculator (Wilson, n.d.) used for each study is
indicated; Effect size as Cohen’s d; T = treatment C = Control; Positive effect indicates increase
in math performance, except for Wittman (1996).

73
Table A3
Math Anxiety: Pre/Post Data
Study Control Pre Control Post Treatment Pre Treatment post
Batton (2010) M = 38 SD = 9.09 M = 37.53 SD=10.74 M = 41.44 SD = 10.93 M=35.06 SD=8.41
Henderson (2019) M = 21.79 SD = 6.91 M = 20.82 SD=8.26 M = 23.32 SD = 8.89 M=19.79 SD=8.30
Hines et al. (2016) M = 209.3 SD = 71.9 M = 196.8 SD=71.6 M = 232.7 SD = 74.5 M=218.8 SD=77.7
Hocker (2017) *M = 3.99 SD = 0.28 *M = 3.90 SD = 0.28 M = 4.36 SD = 1.23 M=3.89 SD=1.25
Kim et al. (2016) High M = 49.95 SD = 12.54 Medium-high M = 32.71 SD = 3.06 Medium-low M = 23.39 SD = 2.19 Low M = 17.38 SD = 1.41
High M = 49.47 SD = 15.66
Medium-high M = 28.84 SD = 4.98
Medium-low M = 19.33 SD = 2.93 Low M = 16.81 SD = 1.56
High M = 46.31 SD = 5.59 Medium-high M = 32.69 SD = 3.09 Medium-low M = 24.67 SD = 2.50 Low M = 17.36 SD = 1.22
High M= 40.38 SD= 10.99 Medium-high M= 34.56 SD= 11.43 Medium-low M= 24.80 SD= 7.31 Low M= 16.50 SD= 0.94
Ruark (2018) M = 25.18 SD = 7.17 M = 23.09 SD = 7.48 M = 26.22 SD = 7.67 M=24.33 SD=7.85
Walter (2018)
NR NR NR NR (F-test= 1.949)
Wei (2010) M = 28.44 SD = 10.27 M = 26.10 SD = 10.63 M = 29.57 SD = 11.00 M=28.75 SD=12.20
Notes. High, medium, lows indicate level of anxiety; *Estimated by the present research team.

74
Study Control Pre Control Post Treatment Pre Treatment Post
White (1997) M = 194.652 M = 198.739 M = 217.88 M = 223.04 (T-test = -1.1467)
Wittman (1996) Comparison-boys M = 52.67 SD = 11.36 Comparison-girls M = 47.67 SD = 11.89
Comparison-boys M = 38.50 SD = 7.00 Comparison-girls M = 54.33 SD = 35.08
High-boys M = 72.67 SD = 2.08 Low-boys M = 39.00 SD = 4.60 High-girls M = 85.83 SD = 12.68 Low-girls M = 38.83 SD =5.56
High-boys M = 75.00 SD = 6.55 Low-boys M = 37.16 SD = 6.11 High-girls M = 58.50 SD = 24.93 Low-girls M = 37.00 SD = 4.19 (F-test = 142.65)
Zyl & Lohr (1994) NR Mean reduction = 4.1 NR Mean reduction = 11.3 *(T-test = -3.65674)
Notes. High, medium, lows indicate level of anxiety; *estimated by the present research team.

75
Table A4
Math Performance: Pre/Post Data
Study Control Pre Control Post Treatment Pre Treatment Post
Kim et al. (2016)
High M = 16.21 SD = 6.20 Medium-high M = 17.47 SD = 4.98 Medium-low M = 15.12 SD = 6.54 Low M = 18.50 SD = 4.12
High M = 18.63 SD = 6.34 Medium-high M = 21.21 SD = 6.06 Medium-low M =19.00 SD = 6.51 Low M = 22.69 SD = 2.55
High M = 15.27 SD = 5.64 Medium-high M = 17.88 SD = 5.90 Medium-low M = 17.44 SD = 5.67 Low M = 16.31 SD = 5.68
High M = 18.40 SD = 6.20 Medium-high M = 22.06 SD = 5.79 Medium-low M = 21.38 SD = 6.52 Low M = 19.94 SD = 5.81
Walter (2018)
M = 15.10 SD = 5.09
M = 16.50 SD = 4.15
M = 15.16 SD = 4.78
M = 15.79 SD = 5.06
Wei (2010) M = 16.76 SD = 5.47
M = 20.34 SD =5.81
M = 16.93 SD = 5.46
M = 20.68 SD = 5.72
White (1997)
M = 5.24
M = 7.28
M = 5.435
M = 7.13 (T-test = -0.238)
Wittman (1996)
NR NR High M= 8.5 Low M= 3
High M = 3 Low M = 2 (F-test = 142.65)
Notes. Positive increase indicates increase in math performance, except for Wittman (1996);
High, medium, low indicate level of anxiety level.

76
APPENDIX B
Qualtrics Coding Survey

77

78

79

80

81
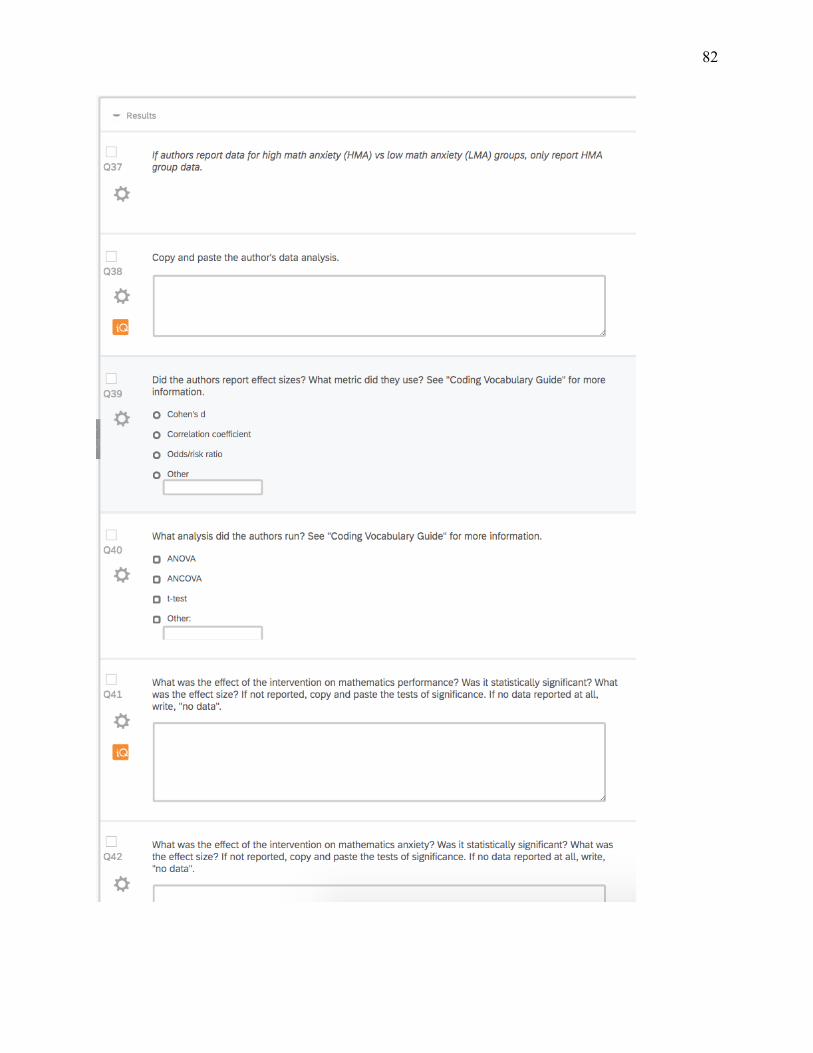
82
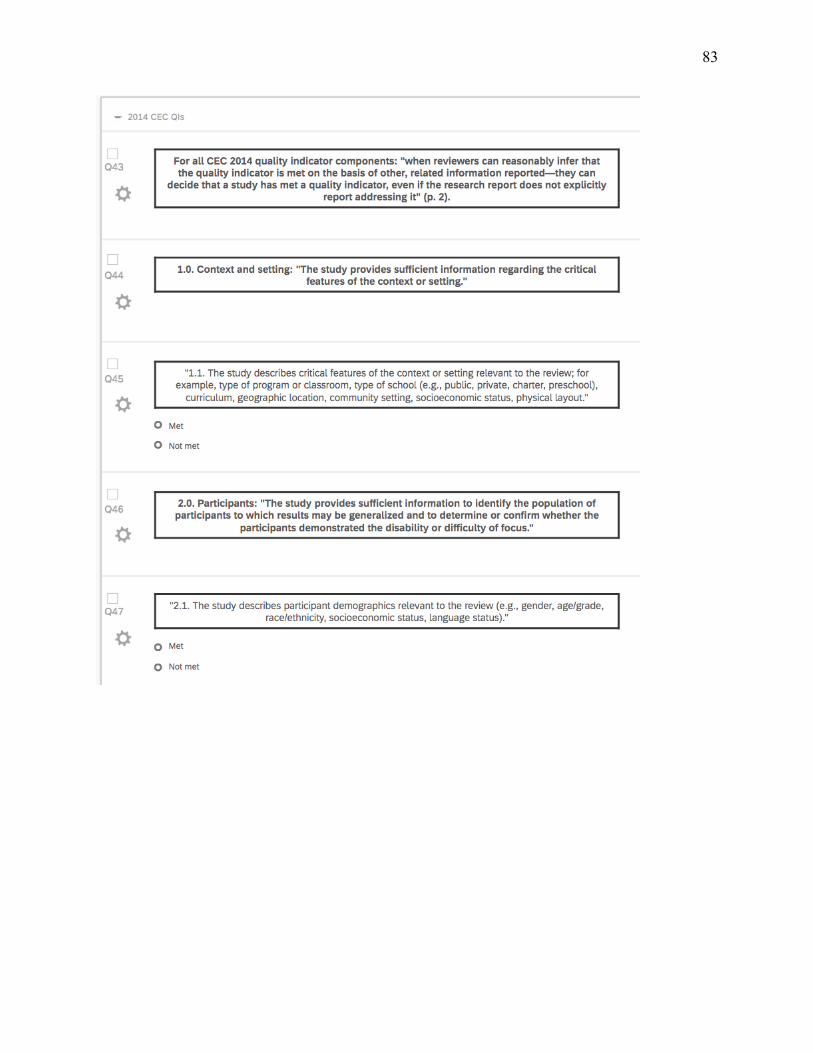
83

84

85

86

87

88

89

90
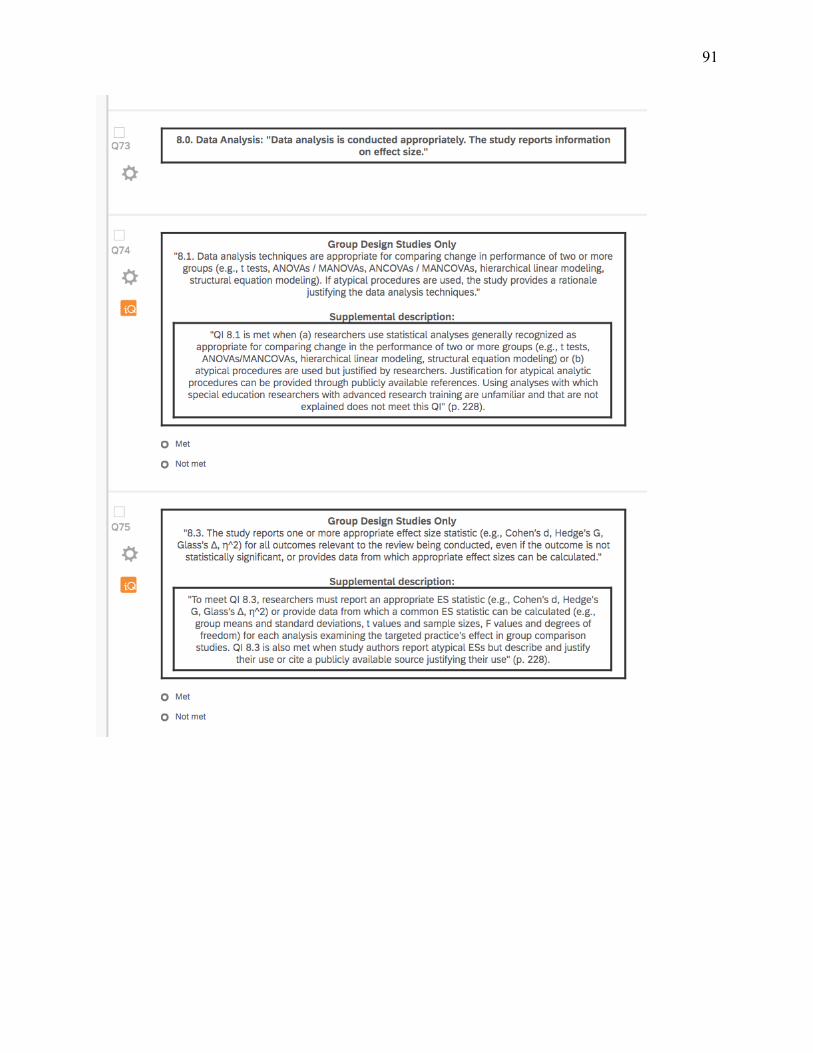
91

92
APPENDIX C
Coding Vocabulary Guide
Part 1 Nearpod Code: DFBSG Part 2: Nearpod Code: DJUMW
Term Definition
Independent Variable The intervention
Dependent Variable Math anxiety (and sometimes math performance)
Research Design The procedures and steps used to implement the intervention and to collect/analyze the data (e.g., randomized control trial, quasi-experimental).
Group Experimental Design
Measures the impact of an intervention with random assignment of participants into control and treatment groups.
Group Quasi Experimental Design
Measures casual impact of an intervention without random assignment.
Control Group The group of participants that is not receiving the intervention.
Treatment Group The group of participants that is receiving the intervention.
Random Assignment Participants are placed randomly into control or treatment groups. Experiments that are randomized typically include random selection for the study and/or random assignment to groups.
At Risk Students at risk may display past math failure, overall past academic failure, and/or behavioral patterns that relate to poor academic performance (e.g., absences causing missed instruction or not completing coursework).
Math Concept An intervention teaches a math concept when it teaches how to solve math problems.
Therapeutic Concept An intervention teaches a therapeutic concept when it teaches emotional and mental strategies to treat math anxiety.
Direct Measurement Measuring dependent variable as the behavior is occurring.

93
Indirect Measurement Measuring dependent variable by measures that record the behavior while it is not happening. May include interviews, rating scales, and surveys.
Functional Behavioral Assessment
Functional Behavioral Assessment (FBA) is a multifaceted process that discovers the function of a participant's behavior. Meaning why they are doing that behavior.
Effect Size Calculators Include: Cohen’s d, correlation coefficient, odds/risks ratio.
Tests of Significance Include: ANOVA, ANCOVA, t-test.
Implementation Fidelity Quantitative measurements to see if the intervention was implemented like it was intended.
Overall Attrition How many participants left the study before it was over, usually presented as a percentage.
Differential Attrition How many participants left the control group versus how many left the experimental group before the study was over. (if overall attrition less than 10%, then met, even if not reported)
Inter-rater-reliability, Inter-observer-reliability, Internal-reliability
These are all tests to see how similar multiple data collectors measured the dependent variable during data collection.
Social Validity Can be quantitative or qualitative measurement on how helpful this intervention is. Commonly measured factors are how easy it is to implement, if it is time efficient, if it is cost effective, and if it actually lowers math anxiety.
Tricky Questions Guidance
Question Number
Note
Q9 Sometimes a study will be a mixed review. Meaning it collects qualitative data and quantitative data. If this happens, just look at the quantitative data and decide whether that is experimental or quasi-experimental
Q10 In dissertations, there is often a definitions page where you can find math anxiety. I just search definition or similar words.
Q15 Some will explain socioeconomic status and not free reduced lunch. Say not reported. A CEC indicator will later cover that.

94
*Q21 (From example paper) If computer lab, don’t just say classroom, specify “other: computer lab”
Q22 Most likely, the selection will be the entire class or small group, in terms of tiered support. Small group is defined by multiple people receiving the intervention. Doesn’t have to be a group activity.
Q23 If the teacher is the researcher, still select teacher.
Q26 Count school days only!
Q38 There should be a data analysis section that says how they calculated things before providing results. It will typically be describing what kind of anova, ancovas, or t-tests used. And effect sizes sometimes. Sometimes they measure lots of things and it can be confusing to know what’s applicable. If in doubt, just copy and paste. But ultimately we are looking for conditions impact on math anxiety. Time is sometimes a part of that analysis, and there are different combinations, and it can be complicated, so just include if not sure
Q39 Another effect size you may see is eta squared (n squared)
Q50 In selecting what data to copy and paste, use the same logic as described for Q35.
Quality Indicators
2.1 I selected met if 3/5 demographics were reported.
5.2 Counts if authors explained how many classes occurred and/or how long the sessions were.
6.1 Asking if researchers are in control of the difference between treatment vs control groups, instead of a natural random event causing the difference. Basically, it’s met or not met mirroring your answer to 5.1.
6.4 You will either see (a) or (b) occurring. So, don’t worry about the other examples.
7.1 I say yes even if the results aren’t super significant.

95
*7.5, 7.6 For all of our studies, these measurements are on the anxiety rating scale (and sometimes a math test too). If they cite where they got the rating scale from and say it's reliable and valid, that’s good enough. If they use their own scale, they have to prove the validity through their own testing.
8.3 Don’t have to have effect size to say “met” As long as there was an Anova, Ancova, or t-test you can say “met.”