intervariability of phosphorus speciation in selected
TRANSCRIPT

....... ~ ~<;,
~- ....... ~~l· I f- ~
IINTER-VARIABILITY OF PHOSPHORUS SPECIATlO ~ -:;_ ....
IN SELECTED MANGROVE ECOSYSTEMS
AROUND GREATER COCHIN
A Thesis Submitted to the COCHIN UNIVERSITY OF SCIENCE AND TECHNOLOGY
in Partial Fulfilment of the Requirements for the Degree Of
llIodor ® f ~"ilo5 0pI1!l
1111
Elluirolllllelltal C!U,clllis tru
Under The Faculty 01 Marine Sciences
By
SHALYJOHN
DEPARTMENT OF CHEMICAL OCEANOGRAPHY SCHOOL OF MARINE SCIENCES
COCHIN UNIVERSITY OF SCIENCE AND TECHNOLOGY KOCHI-682016
MARCH 2003

atcrtificatc
This is to certiftj that this thesis is an authentic record of
the research work carried out. by Ms. Shaly John, under my
supervision and guidance in the Department of Chemical
Oceanography, School of Marine Sciences, Cochin Universihj of
Science and Technology, in. partial fulfilment of the requirement for
the degree of Philosophiae Doctor of the Cochin Universihj of Science
and Technology.
Cochin-16
March 2003. Supervising Teacher.

CONTENTS
1. INTRODUCTION
1.1 Global Distribution of Mangroves
1.2 Distribution of Mangroves in India
1.3 Distribution of Mangroves in Kerala
1.4 Economic Import3nce
1.5 Mangroves and Nutrient Elements
1.6 Scope of the Study
2. MATERIALS AND METHODS
2.1 Description of the Study Area
2.2 Sampling and Storage
2.3 Analytical Procedure
3. DISTRIBUTION OF NITROGEN AND PHOSPHORUS
1
3
3
6
7
8
11
19
19
22
22
IN THE WATER COLUMN 29
3.1 Introduction 29
3.2 Results and Disc~ssion 35
3.2.1 General hydrography 35
3.2.2 Distribution of dissolved inorganic forms of nitrogen 53
3.2.3 Nitrogen: Phosphorus ratio (NIP) 61
3.2.4 Phosphorus Forms In Water Column 65
3.3 Conclusion 85
4. SEDIMENT CHARACTERISTICS AND NUTRIENT STATUS
4.1 Introduction 95
4.2 Results And Discussion 98
4.2.1 Properties of Surface Sediments 98
4.2.2 Nutrient levels in surface sediments 104
4.2.3 Stoichiometries of C, Nand P in surface sediments 118
4.2.4 Properties of Core Sediments 126
4.2.5 Nutrient distribution in sediment cores 134
4.2.6 Stoichiometries of C, Nand P along core sediments 157
4.3 Conclusion 168
5. FRACTIONATION OF PHOSPHORUS IN SEDIMENT CORES
5.1 Introduction
5.2 Results And Discussion
189
189
198
5.2.1. Vertical variation of phosphorus forms in sediment cores 198
5.2.2 Comparative study on the distribution of phosphorus fractions 227
5.3 Conclusion
6. SUMMARY
APPENDIX
244
259
273

Chapter 1
INTRODUCTION
Mangroves are the characteristic littoral plant formations of tropical and
subtropical sheltered coastlines and are at the interface between the land and the
sea. The importance of mangroves stems from their pivotal role in both terrestrial
and aquatic production, and by the many amenities provided within and beyond its
boundaries. Although these ecosystems are economically extremely valuable, they
are under increasing threat of being wiped out by rapid human encroachment and
environmental pollution. Thus an understanding of these ecosystems is vital to their
survival. The classic work of Heald (1969) and Odum (1970) on mangrove
productivity in Florida have attracted wide attention to the general significance of
mangrove communities in the coastal zone. Mangrove forest areas and their
associated food chain and nutrient cycles are often closely linked to those in
adjacent coastal waters (Alongi et al., 1993; Alongi, 1996). The trees can be
regarded as links between the terrestrial and marine ecosystem (Chale, 1993), and
mangrove ecosystems are open with exchange of nutrients, detritus and sediment
facilitated by tidal flushing (Wood roffe , 1985; Lee, 1995). The habitat receives
nutrient and organic detritus from land and from fresh water streams (Morell and
Corredor, 1993) and nutrients are effectively recycled within the ecosystem. The
extent to which the mangrove systems exchange dissolved and particulate
nutrients with adjacent waters depends on several factors including
geomorphology, tidal regime and ~Iimate (Alcr~~;, ~ 996). ~.~3:1groves are
considered to play an important role in controlling coastal hydrodynamics and
sediment movements (80to, 1992; Eong, 1993).

Chapter 1
A mangrove is a tree, shrub, palm or ground fern, generally exceeding one
half meter in height, and which normally grows above mean sea level in the
intertidal zone of marine coastal environments, or estuarine margins. Of late, the
terms 'mangroves' or 'mangal' are being synonymously used to refer to the
mangrove habitat although the former is far more popular. Mangroves are a diverse
group of predominantly tropical trees and shrubs growing in the marine intertidal
zone, sheltered coastlines, mudflats and river banks in many parts of the world,
belong to a variety of plant families. Here they are subject to both short term
rhythms of tides and seasons, as well as to longer-term changes of climate and
sea level. As a group, they share several highly specialized and collectively well
known adaptations, notably exposed breathing roots and support roots. salt
excreting leaves, and viviparous water ~ dispersed propagules. However. as
individuals. these characteristics are not shared equally by all species. It is
believed that the variation at particular sites influences both the types of
mangroves that can become established and survive (Karim. 1991). and their
morphology (Soto and Corrales, 1987: Duke, 1990). Hence, the type and condition
of mangroves at particular sites reflect the physical conditions of those sites. The
common characteristic they all possess is tolerance to salt and brackish waters.
Furthermore, different taxa have different mechanisms for coping with high salt
concentrations. and not all have salt - excreting gland on their leaves. Others
exclude salt at the roots. although this creates xeric conditions for the plant.
Another group also allows low concentrations of salt into their sap. but this is
neutralized by its transfer into senescent leaves or by storing it in their bark or
wood. Mangroves also need to cope with growth in water-saturated. often
anaerobic. substrates. Some of these latter characteristics are shared with
freshwater swamp trees. This lack of gaseous exchange in substrate requires them
to have special breathing structures on the exposed roots and/or trunk. These may
be quite different, depending on the taxon. Some speCies like Rhizophora have
aerial prop roots bending down either from the trunk or branches. high above the
substratum. Others have shallow. subsurface cable roots with series of vertical,.'
stem like breathing roots. called pnuematophores. By contrast in certain
mangroves, there are no elaborate physical structures, instead numerous air
breathing lenticels are often present on the trunk. Other essential attributes in this
water-saturated environment are structures to support the above groundmass of
the trees. This is very important to larger individuals. which commonly attains a
2

Introduction
height of about -40 meters height. Where roots are unable to penetrate more than
a metre or so because of the anaerobic condition, lateral support structures are
essential. In these cases, the root structures, contribute a great deal. However
other support structures like trunk buttresses are also common in mangrove plants.
1.1 GLOBAL DISTRIBUTION OF MANGROVES
Mangroves are distributed according to three important scales, namely their
coastal range, their location within an estuary, and their position along the intertidal
profile. On the global scale, mangrove plants are found throughout tropical regions of
the world. The mangrove species, the most tropical, shallow marine coastal habitats,
are divided into two global hemispheres, the Atlantic East Pacific (AEP) often
referred to as the New World, and the Indo West Pacific (IWP), or Old World. These
more or less equal portions of the earth also have equivalent aerial extent of
mangrove forests (Saenger et al., 1983). The AEP has fewer species and fewer
additional genera. The most diverse flora is seen in the IWP. The dominanent world
mangrove zones are restricted to the Indo-West Pacific region of the Old World. The
most important world mangroves are distributed in South-East Asia, North-East Australia and South- East Africa and extend mainly within the tropics and subtropics
between latitude 32°00'N and 33°00'S and longitude 300E and 165 0E. In the New
World zone, the mangroves are distributed in North America at Lousiana, Pacific
coast of North-West Mexico, Bermuda Islands and Pacific coast of South America.
1.2 DISTRIBUTION OF MANGROVES IN INDIA
The Sunderban mangroves of Ganga delta form the largest belt covering
about 4200km2 area intersected by criss-crossing rivers and estuaries. These
mangroves present complex ecological conditions due to their vastness in extent
and ramification of the riverine system leading to the several islands. The diversity
of habitats resulted in zonation and development of different associations.
Physiogonomically also these mangroves are highly variable, depending upon the
dominant species which may be Excoecaria agallocha, Avcennia officina lis,
Sonneratia apetala or Ceriops decandra. Each of these gregarious species may
constitute a pure formation. Besides these, Bruguiera gymnorrhiza, Xylocarpus
granatum, X. mofuccenis, Aeglc~,-u:;' comici.ifatiiiTi, Phoenix paludosa and
Rhizophora mucomata are also observed (Oagar, 2000).
3

Chapter 1
The glory of Sunderban mangroves is, however, disappearing rapidly due to
increasing biotic pressure. Many species which once dominated the mangrove
stands have rare or all together are absent. Some of them have been listed as
endangered (Nasker and Guha Bakshi, 1987) include Heritiera fomes, Ceriops decandra, C. tagal, Rhizophora apiculata, R.mucronata, and Kandelia candal.
Heritiera fomes which had been a common dweller of the Sunderbans delta region
is now very occasionally found in the tidal swamps. It has been exploited
indiscriminately for its timber value.
The Mahanadi mangroves covering an area of about 200km2 are in a
degraded state due to conversion for agriculture and development of port facilities
at Paradweep. Dense forest are seen in Bhatarkanika estuarine mud flats and
deltaic creeks between the rivers Devi and Dharma. Phoenix paludosa and Aegialitis rotundifolia occur more towards estuarine conditions. Rhizophora
mucronata, Avecennia alba, Avecennia officinalis, Sonneratia alba, Ceriops
decandra, Ceriops tagal, Bruguiera gymnorrhiza, B.paNiflora, B.cylindrical,
Xylocarpus granatum and Kandelia candal grow luxuriantly in the tidal zone.
Acanthus i1icifolius is found in elevated fringe areas. But most of the areas
particularly away from the river remain highly degraded.
The mangroves of Go~avari and Krishna estuaries depend on the frequency
and amount of flooding of the river and configuration of the coast. During the hot
season, salinity increases considerably and only certain taxa such as Avecennia,
Excoecaria and Sonneratia with wide ecological amplitude exist. Ceriops decandra,
Rhizophora mucronata, Rhizophora mucronata, and R.apiculata can be found
frequently nearer to lagoons but are rare elsewhere. Scyphiphora hydrophyl/acea
once reported to be widely distributed, is found in new patches.
The mangroves of Cauvery deltaic system are discontinuous. The Pichavaram
mangrove area (southeast India) support about 1100 ha, of which 50% is covered by
forest, 40% by water-ways and the remaining filled by sand flats and mud flats
(Krishnamurthy and Jayaseelan, 1983). The mangals of Pichavaram show a marked
zonation where A vecennia marina forms pure stands and Rhizophora apiculata and
R. mucronata grow well along the channel and creeks. These are mixed with
Bruguiera cylindrical, Ceriops decandra, and Sonneratia apetala. Other species in
this region included Lumnitzera racemosa, Aegiceras comiculatum and Excoecaria
agaiiocha. The fre~h water zone is generally dominated by Acanthus i1icifolius, Avcennia marina is found more towards the marine zone and A. officinalis towards
freshwater zone influenced by Coleroon estuarine water.
4

Introduction
Mangroves of Karnataka coast are highly degraded. These are formed on
shallow coastal waters, estuaries or lagoons. Avcennia officinalis, A. marina,
Excoecaria agal/ocha,Acanthu!': ilicifolius, Rhi7ophora mucronata, Ceriops tagal,
Sonneratia caseolaris, Kandelia candal, and Heritiera littoralis are frequent species
forming pure or mixed association.
The mangroves of Goa region cover about 200km2 consisting of seven
estuaries of which Zuari, Mandovi, and the Cambarjua canal connecting them with
harbour cover about 75% mangrove area. Avcennia officinalis, Rhizophora
mucronata,Sonneratia alba, are the prominent species which are associated with
R.apiculata, S. Caseolaris, Kandelia candal, Bruguiera gymnorrhiza, B.parviflora,
Aegiceras corniculatum, Excoecaria agal/ocha, and Acanthus ilicifolius. These
stands are not rich in their biodiversity due to excessive biotic pressure but during
recent ~imes attempts have been made to regenerate mangrove stands by planting
the trees artificially (Oagar, 2000)
The mangroves of Maharashtra coast are under tremendous biotic pressure at almost all sites. Many species which were reported as common have become
rare or all together absent on many of these sites. At many localities bushes of
Avcennia marina are most prominent showing the capacity of tolerance to biotic
pressure. All along Gujarat coast Rhiiophoraceae element is very rare. Species of
Avcennia form gregarious but stunted stands. (Oagar,2000)
The Andaman and Nicobar Islands harbour some of the best developed
mangroves which are comparatively less disturbed. There is a distinct zonation
pattern. Rhizophora mucronata and Rhizophora.stylosa, are the prominent
towards sea where others cannot stand. Species of Bruguiera, Sonneratia,
Aegiceras, Xylocarpus, Aegiceras, Avcennia, Ceriops, and Scyphiphora are
common in the middle zone while species of Excoecaria, Lumnitzera, Cynomitra,
and Heritiera are common towards land. Nypa fruticans, Acanthus spp, and
Phoenix paludosa are common along creeks. The distribution of Acanthus
ebractatus, A. volubilis, Lumnitzera littorea, Bruguiera sexangula, Rhizophora
stylosa and R.lamarckii is interesting in these islands as these are not frequent
elsewhere. In recent years due to developmental activities these stands are also
under high biotic pressure and many species are becoming rare.
Besides the over exploitation of these resources there are other reasons
also which are responsible for the dwindling of mangrove ecosystems. Khushoo
(1986) has stated that role of pollutants is very discriminatal for the deterioration of
5

Chapter 1
these coastal vegetation in Bombay, Madras, Ernakulam to Trivandrum, Andhra
Pradesh, Karnataka and Orissa.
1.3 DISTRIBUTION OF MANGROVES IN KERALA
Kerala once supported about 700km2 mangroves along its coast
(Ramachandran et al., 1986) and what is seen now are only relics of the great past.
The increasing pressure on the coastal area as the population density increases
initiates a radical transformation of the natural environment. Early development of
the state was mainly through sea trade in the past and more recent changes in
agricultural and industrial sectors resulted in consumption of large extents of
mangrove vegetation. Moreover, the ecological significance of this unique
ecosystem was not at all understood. By the time the ecological importance are realized, the mangroves had dwindled from 700km2 to about 17km2
.
The entry of tidal waters regularly from the sea, the enrichment of 30 estuaries
and backwaters with the regular supply of fresh water flowing from the 44 perennial rivers create a peculiar ecological environment leading to the development of a
unique mangrove vegetation on the fringes of the backwaters, estuaries, and creeks.
The important species found are Acanthus ilicifolius, Acrostichum aureum, Avcennia . . marina, Avcennia officinalis, 8ruguiera gymnorrhiza,: 8.parviflora, Ceriops tagal,
Derris trifoliate, Excocaria indica, Kandelia candal, Lumnitzera racemosa,
Rhizophora mucronata, R. apiculata and Sonneratia casealaris.
The district wise distribution of manfJroves is given in a table below (Chand
Basha, 1991)
6
District
Thiruvanathapuram
Kollam
Alappuzha
Kottayam
Ernakulam
Thrissur
Malappuram
Kozhikode
Kannur
Kasarkode
Total
Mangrove area (approximate ha)
23
58 90
80
260
21
12
293
755 79
1671

Introduction
Patches of varying extent exist along the sides of the railway line especially
in the Trivandrum-Quilon, Ernakulam- Alleppy and Thanur-Kasargode sectors. In
most places the vegetatinn is in a \/"'';.' "!arrow linear ~trip. Bigger bits are available
in some parts especially on the sides of the line from Mahe to Dharmadom,
Pazhayangadi, Ezhimala, Payyannur, Edakkad and so on. These are
comparatively bigger patches, and support fairly good and developed mangrove
vegetation. The Quilon strip has a length of O.75km and a varying width of
1-10metres from the water front. The total extent of this may be around 2ha.
Kumarakom which is declared as a bird sanctuary supports a narrow belt of
approximately one-kilometer long mangrove vegetation along the fringe of
Vembanad lake varying in width from 10-20m. This area comes approximately to
4ha including vacant marshy patches.
The Vypeen area in Ernakulam district, support about 10ha of mangroves.
These forms a part of the naturally accreted area called Puthuvypu at the southern
tip of Vypen Island located on the North- Western bank of Cochin bar-mouth. In
Kerala some of the mangrove vegetation are under the forest department. In
Ernakulam district the land called "Mangala VanamN also support a good amount of
mangrove vegetation.
1.4 ECONOMIC IMPORTANCE
The viability of an ecosystem can be judged from its diversity of species
which indicate the survival value of the community. A rich gene pool means a
higher adaptation potential. It leads to increased stability in an ecosystem. In
mangrove ecosystem there is large accumulation of plant debris. To a wide range
of animals, the litter is valuable feed either as such or after microbial degradation.
Many of them make use of mangrove communities as habitat, nursery ground and
source of food. The debris also serves as breeding ground for the juveniles of
many types of fish, crustaceans and other fauna. Mangrove roots and branches
serve as a good shelter for large number of organisms including many beautiful
mosses, lichens, algae, fungi, bacteria, ciliates, nematodes and amphipods which
colonize and form food for many kinds of fish. Many of the fish species utilize the
mangrove water as good nursery and breeding ground. Thus mangrove
ecosystems not only provide fuel wood and charcoal, timber and construction
material, pulp, tannin, food and beverages, honey, fodder, medicine, and
7
Chapter 1
stabilization of the coast, but also sustain diverse communities of flora by providing
them with habitat, energy and nutrition. In the mangrove ecosystems,
phytoplaliktons and zooplanktons become supplementary source of nutrition to the
small fish and other aquatic life. The fish culture ponds may be created in cleared
portions or behind the mangrove without further denudation of mangroves. Low
lying marshy areas connected with the sea offer good scope brackish water fish
and prawn culture. Mullets grow well in mangrove waters. The prominent
commercial mollusks, the black lip pearl oyster and green mussel culture offer
good scope in intact mangrove areas.
1.5 MANGROVES AND NUTRIENT ELEMENTS
Carbon, nitrogen and phosphorus are the most significant micronutrients in
aquatic ecosystems. In the aquatic environment, the nutrients are distributed
between the water and the sediment interface in both dissolved and particulate
forms. Bioavailable nutrients are taken up and metabolized by aquatic organisms in
the lifecycJes. In a specific aquatic ecosystem, nut~ient dynamics partition the
elements carbon, nitrogen, and phosphorus among water, sediment and biota to
attain a natural balance. This balance may change as nutrients are introduced from
agricultural, industrial and urban sources.
Sediment particles in lakes and rivers are constantly resuspended and
redeposited, depending on environmental conditions. The nutrient content in particles
is important in their transport from bottom sediments to the overlying water. The
knowledge of their concentrations is used to understand their movement within the
aquatic ecosystem, particularly at the sediment water interface.
Mangrove forests are best developed on tropical shorelines where there is
an extensive intertidal zone, with an abundant supply of fine grained sediment
(Walsh, 1974). While mangroves are generally associated with low-energy, muddy
shorelines, particularly tropical deltas, they can grow on a wide variety of
substrates, including sand, volcanic lava or carbonate sediments.
A comprehensive understanding of nutrient behavior in aquatic ecosystems
requires their study in both the water and sediments. Bonanni et al. (1992) showed
that sediments play an important role in the accumulation and regeneration of
nutrients. Organic matter produced by phytoplankton in eutrophic shallow lakes
8

Introduction
settles to the sediment and decompose by aerobic and anaerobic processes,
during which different carbon, nitrogen and phosphorus compounds are produced
(Anders0n and Jensen,1992). Further more, decomposing arganic matter affects
changes in oxygen concentration and redox potentials which in turn affects
nitrogen and phosphorus release from sediments to the overlying water. In order to
obtain a complete picture of the effects of flooded soils on plant productivity,
relatively long term studies on nutrient status, redox potential, pH, soil mineralogy,
and salinity changes must be made. The redox potential is a convenient measure
of the extent to which the soil is in a reducing or anaerobic stage. The large
positive values of redox potential indicate a well oxidized or aerated stage. As the
oxygen supply is limited, it is rapidly consumed by bacterial respiration. It was
found that this process takes place at an Eh range of +350 to +380mV. When all
the oxygen is consumed the conversion of Mn +4 to Mn +2 and N03 to N2 takes place.
When Mn+2 and N03 are completely consumed, then Fe+3 is reduced to Fe+2 and so
on until the soil eventually reaches a highly anaerobic state where the reduction of
dioxide to methane takes place. The rate at which all these processes depends
upon the time of flooding and organic carbon present in the soil.
The ecological significance of carbon as a nutrient is manifested through its
organic forms. The concentration of total organic carbon is often used in correlation
with other elements. For example carbon to nitrogen and carbon to phosphorus
ratio is used to characterize the association of nitrogen and phosphorus in organic
matter. Nitrogen species include organic nitrogen, ammonia nitrogen, nitrate and
nitrite nitrogen. Biological activities in living dead tissues produces reduced forms
of organic nitrogen ranging from simple amines to complex proteins. Ammonia is
the most common form of inorganic nitrogen, and is the product of decomposition
of organic matter. Bacterial oxidation in the nitrification cycle produces nitrite and
nitrate. Phosphorus species in the environment include organic phosphorus
compounds, inorganic phosphates, and mineralized inorganic complexes with iron,
calcium and aluminium. Phosphorus precipitates to form low solubility compounds
and metallic complexes, and is relatively immobile compared to carbon and
nitrogen. The natural abundance of nutrients of interest is carbon, nitrogen and
phosphorus. Due to this sequence, phosphorus is often considered to be the
limiting nutrient in the ecological cycle.
9

Chapter 1
Sediments receive a mixture of labile and refractory organic and inorganic
phosphorus compounds from the overlying waterand the surrounding landmasses.
Some of these compounds behave as inert material and are simply buried in their
orginal form. Others decompose or dissolve and simply release the phosphate to
the sediment pore water. The regenerated phosphate may be released to the
overlying water, reprecipitated within the sediment as an authigenic phase or
adsorbed by other constituents of the sediment. Adsorption on metal oxides in the
sediment has been identified as one of the principal reactions involving phosphate.
(Lijklema 1976; Krom and Berner 1981 :Frolich 1988). Mangrove soils are expected
to contain a high proportion of organic phosphorus compounds due to their
generally high organic matter content (Boto, 1988). Boto has pointed out that much
of this organic phosphorus is in the phytate form and bound to humic compounds,
and has been found in lake sediments, and is not probably not available for
microbial and mangrove plant nutrition. The inorganic phosphate represents the
largest potential pool of plant available, soluble reactive phosphorus. Most of the
inorganic phosphorus in mangrove sediments is either bound in the form of Ca, Fe,
and AI phosphates or as soluble reactive pho~phorus adsorbed onto, or
incorporated into hydrated Fe and AI sesquioxides. Total organic P concentrations,
proportionally greater in surface sediments, reflect the influence of roots, whereas
the inorganic fractions mainly Fe bound. phosphorus, proportionally and in real
terms increase gradually with depth reflecting the influence of increasing anoxia
p~rticularly below the root layer.
Every organism participates to some extent in the phosphorus cycle by virtue
of its need to assimilate organic and/or inorganic phosphorus for growth and
maintenance, and by excreting phosphorus containing byproducts. Bacteria, algae
and higher plants, including mangroves, take up dissolved orthophosphate; and
organic phosphates are either taken up directly or first hydrolysed by extracellular
alkaline phosphates. Organic phosphorus may be very resistant to hydrolysis and not
readily assimi:able to organisms. Orthophosphate is coupled to ADP to form A TP in
cells, and is essential for energy transfer and phosphorylations, and for synthesis of
nucleic acids, phospholipids and phosphoproteins (Ingraham et al., 1983). In
comparison with release rate of phosphorus from mineral phosphates a refractory
organic material, the turnover time for P uptake, utilization and excretion by living
organisms is very short, on the order of minutes to tens of hours, depending on the
rate of biological activity and the amount of available phosphorus. Once P is taken up
10

Introduction
and used in cells as phosphate, it is eventually liberated via excretion or through
mineralisation of detritus as phosphte. This means that all organisms have evolved
efficient uptake mechanisms for a very small and virtually constant proportion of the
earth's P in a very competitive cycle, and P on a localized level may limit growth of
biomass. Local P cycle can be very efficient in tropical mangroves, where it has been
estimated that up to 88% of the forest P pool is retained within the sysem (Boto and
Bunt, 1982). The cycling of phosphorus through mangrove food web is presumably
similar to that in other aquatic systems. At the base of pelagic and benthic food
webs, a 'microbial loop'exists in which interactions among bacteria, microalgae and
nanoprotozoans and larger protests facilitates net release of phosphorus into the
water column and pore water.
An increasing number of studies have investigated the influence of
mangrove forest on coastal nutrient cycles and food chain and found that the
actual amount of dissolved and particulate matter exchanged depends on the
factors such as aerial extend of the forest, tidal amplitude and seasonality. Tropical
mangrove forests, on average, appear to export particulate nutrients and to import
some dissolved species, depending upon season, tidal amplitude and
geomorphology. (Alongi et al., 1993).
1~SCOPEOFTHESTUDY
. Tropical mangrove systems in Australia and southeast Asia face continuing
degradation from human activities. These include indirect effects from nutrient and
toxic pollution associated with development and ac;uaculture (Kaly et al., 1997).
Scientific investigations on mangrove systems are particularly significant allows the
Kerala coastline, as the economy of this state largely depends on its coastal
fisheries. In the coastal areas especially near mangrove forests, prawn culture
farms are established, which produce effluents with organic and inorganic
pollutants. These pollutants damage the ecology of the system. Cutting of trees for
fuel and over grazing by cattle has led to soil erosion and stunted growth of the
plants in this area. Although extensive areas of mangrove woodland were found
along the banks of Cochin estuary most of these have now disappeared. Study
sites represent some of the few remaining areas of mangroves. It is evident that
the remaining mangroves are important breeding and feeding areas for the local
commercial fish and prawn stocks.
11

Chapter 1
Basha, (1991) reported on the mangrove vegetation of Kerala coast in its
present condition, and also gave a historical background to make the reason clear
for the dwindling of the :-:-:angrovc ~':'~ost to the pre56nt stage of discontinuous and
isolated bits. Three mangrove ecosystems of Kerala, namely Veli, Qullon and
Kumarakom were compared with respect to the species distribution and the
hydrographical characteristics by Thomas and Fernandez (1993). The different
factors, that are responsible for the colonization of the predominant vegetation,
Acanthus ilicifolius, in mangrove areas of Cochin, were investigated by
Muraleedharan and Rajagopalan (1993). About thirty three species of
polycheaetes were identified in mangrove regions of Cochin (Kumar and Antony,
1994). The texture of Tellichery mangrove sediments was found as silty sand due
to the prevalent high energy zone (Raghunadh et al., 1995). A pollution survey was
carried aut by assessing the heavy metal (Fe, Mn, Cu, Zn, Pb, Co) concentration in
mangrove flora and sediments (Thomas and Fernandez, 1997). A critique on the
occurrence and distribution of macro-zoobenthos in an aquaculture pond
suggested a better scope for aquaculture in brackish water pond lined with
mangroves in the margin (Kumar, 1998). The importance of mangroves to the
estuarine ecosystem in general and for the propagation of marine shrimps in
particular is emphasized in a report of Achuthankutty and Sreepada (1998). A
statistically significant correlation was found between sediment size in the
distribution pattern of organic carbon (TOC) and total phosphorus (TP) in
mangrove sediments at Veli, Kochi and Kannur (Badarudeen et al., 1998a).
Investigations on inorganic nutrient levels of interstitial waters in a mangrove forest
of Cochin, revealed that dissolved phosphate, ammonium and silicate were several
times higher in interstitial waters than in overlying waters (Bava and Seralathan,
1998). A comparison of the distribution of sodium and potassium in sediments of
Veli, Kochi, and Kannur mangroves exposed the enrichment of potassium over
sodium in sediments of Kannur mangroves (Badaruddin et al., 1998b).
Subramanian (2000) reported that Cochin backwaters had many pockets of
mangrove habitats with the same species diversity as any other mangrove
ecosystems.
Perusal of literature, on the mangrove ecosystems of Kerala revealed that
most of the investigations concentrated on the physical and biological
characteristics. Biologists often view mangrove forests as highly productive
sources of organic matter, from which there is a net outwelling of energy supporting
12

Introduction
complex estuarine and near shore food webs. Geologists, on the other hand, view
mangrove shore lines as sediment sinks, characterized by long-term import of
sediment, as indicated by the substantial accumulation of recent sediments which
underline mangrove forests and adjacent coastal planes. However chemists
attempt to find exact processes by which the mangrove acts as a source or sink of
organic and inorganic nutrients.
Until now, no rigorous reports exist on chemical investigations on the
nitrogen and phosphorus dynamics in mangrove fringed creek waters and
sediments of Cochin. Although there are several studies on the distribution and
speciation of nutrients in Cochin estuary, the information regarding the same
lacking at the mangrove areas of Cochin estuary. Therefore an attempt has been
made to investigate nutrient distribution of selected mangrove systems of the
Greater Cochin area. The main objectives of the study undertaken were,
• to determine seasonal trends of dissolved inorganic nitrogen and phosphorus
in selected mangrove fringed creeks around Greater Cochin area and the main
parameters affecting their variability.
• to attempt a comparison of nutrient concentration among Stations and
between seasons.
• to determine the distribution of different forms of phosphorus in surface waters
of mangrove-fringed creeks.
• to characterise the sediments of these creeks by monitoring properties like
grain-size, moisture percentage, pH, and also the nutrient status by measuring
the three important nutrient element, carbon, nitrogen and phosphorus.
• to explore the vertical distribution patterns of C, Nand P in sediment cores so as
to generate information on aspects that influence the sediment nutrient profile.
• to study the fractionation of phosphorus, in mangrove core sediments and to
explore the impact of environmental factors on their distribution.
Clearly, a whole set of processes like mineralogical diagenesis, biotic and
abiotic redox processes, biological assimilation enzymatic and non-enzymatic
hydrolysis reaction etc. are operating in the sediments at anyone time (Hakanson
and Jansson, 1983) and the dominant process will depend, in part, upon the
phosphorus species present. Therefore, knowledge of phosphorus speciation
13

Chapter 1
should allow for an understanding of the mechanisms for phosphorus release or
assimilation by sediments.
REFERENCES
Achuthankutty, C.T. & Sreepada, RA 1998 Brackish water shrimp farming:
Possible impacts on estuarine ecosystems. In Advances in aquatic biology
and fisheries: Prof. N. Balakrishnan Nair, felicitation volume (Natarajan, P.,
ed). University of Kerala, India. pp. 175-189.
Alongi. D.M. 1996. The dynamic of benthic nutrient pools and fluxes in tropical
mangrove forest. Journal of Marine Research 54, 123-148.
Alongi, D.M., Christoffersen, P. & Tirendi, F. 1993 The influence of forest type on
microbial nutrient relationships in tropical mangrove sediments. Journal of
Experimental Marine Biology and Ecology 171,201-223.
Anderson, F.O. & Jensen, H.S. 1992 Regeneration of inorganic phosphorus and
nitrogen from seston in a freshwater sediment. Hydrobiologia 228, 71.
Badarudeen, A., Padmalal, D. & Sajan, K. 1998a. Organic carbon and total
phosphorus in the sediments of some selected mangrove ecosystems of
Kerala. Journal of Geological society of India 51, 679-684.
Badaruddin, -A.,-Sakkir, S. & Sajan, K. 1998b Distribution of Na and K in the
sediments of Veli, Kochi and Kannur mangroves. Indian Journal of Marine
Science 27, 253-255.
Basha, S.C. 1991 Distribution of Mangroves in Kerala. Indian Forester 117, 439-448.
Bava, K.A. & Seralathan, P. 1998 Interstitial water and hydrochemistry of a
mangrove forest and adjoining water system, south west coast of India.
Environmental Geology 38,47-52.
Bonanni, P., Caprioli, R., Ghiara, E., Mignuzzi, C., Orlandi, C., Paganin,
G. & Monti, A. 1992 Sediment interstitial water chemistry of the Orbetello
lagoon (Grosseto, Italy): nutrient diffusion across the water sediment
interface. Hydrobiologia 235, 553.
14

Introduction
Boto, K.G. 1988. The phosphorus cycle. In Mangrove Microbiology (Agate, A.D.,
Subramanian, C.V. & Vannucci, M., eds). UNDP/UNESCO Regional Project
(RAS/86/1988), New Delhi, pp. 85-100
Boto, 1992 Nutrients and mangroves. In Pollution in tropical aquatic systems
(Connell, D.W., Hawker D.W., eds). CRC press, Soca Raton, FI, pp. 129-145.
Boto, K.G., Bunt, J.S. 1982 Carbon export from mangroves. In The cycling of
carbon, nitrogen, sulphur and phosphorus in terrestrial and aquatic
ecosystems (Galbally, I.E. & Freney, J.R., eds). Australian Academy of
Sciences, Canberra, pp. 105-110.
Boto, K.G. & Wellington, J.T. 1988 Seasonal variations in concentrations and f1uxes
of dissolved organic and inorganic materials in a tropical,~d~!ly. dominated
mangrove water- way. Marine Ecology Progress Series 50, 151-160.
Chale, F.M.M. 1993 Degradation of mangrove leaf litter under aerobic conditions.
Hydrobiologia 257, 177-183.
Dagar, J.C. 2000 Biodiversity of sal.ine habitats. In Environment biodiversity and
conservation W::'an, MA ed.) APH Publishing Corporation, Ansari Road,
Darya Ganj, pp. 135-170.
Duke, N.C. 1990 Morphological variation in the mangrove genus Avicennia in
Australia: systematic and ecological considerations. Australian Systematic
Botany 3, 221-239
Eong, C.J. 1993 Mangroves- a carbon source and sink. ChemJsphere 27,1097-1107.
Froelich, P.N. 1988 Kinetic control of dissolved phosphate in natural rivers and
estuaries: A primer on the phosphate buffer mechanism. Umnology and
Oceanography 33,649-668.
Hakanson, L. & Jansson, M. 1983 Principles of Lake Sedimentology. Springer
Verlag, Berlin, 316 pp.
* Heald, E.J. 1969 The production of organic detritus in a south Florida estuary.
Ph.D. Dissertation, University of Miami.
15

Chapter 1
Ingraham, J. L., Maaloe, O. & Neidhardt, F. C. 1983 Growth of the Bacterial cell,
Sinauer, Sunderland, 435 pp.
Kaly, U.L., Eugelink, G. & Robertson, A.1. 1997 Soil conditions in damaged North
Queensland mangroves. Estuaries 20,291-300.
Karim, A. 1991 Environmental factors and the distribution of mangroves in
Sunderbans with special reference to Heritiera fomes Buch.-Ham.
Ph.D Thesis, Botany Department, University of Calcutta, 230 pp.
Khushoo, T.N. 1986 Presedential address of 63rd session of Indian Science
Congress Association, New Delhi.
Krishnamurthy, K. & Jayaseelan, M.J. 1983 The Pichavaram (India) mangrove
ecosystems. Intemational Joumal of Ecology and Environment Science 9, 79-85.
Krom, M.D., Berner, RA. 1981 The diagenesis of phosphorus in a near shore
marine sediment. Geochimica et Cosmochimica Acta 45, 207-216.
Kumar, RS. 1998 A critique on the occurrence and distribution of macrozoobenthos
in a traditional prawn field and adjacent mangroves in Cochin backwaters.
Joumal of Marine Biology Association of India 40, 11-15.
Kumar, RS. & Antony, A.1994 Impact of environmental parameters on polychaetous
annelids in the mangrove swamps of Cochin, south west coast of India. Indian
Joumal of Marine Science 23, 137-142.
Lee, S.Y. 1995 Mangrove outwelling: a review. Hydrobiologia 295,203-212.
*Lijklema, L. 1976. The role of iron in the exchange of phosphate between water and
sediments in interactions between sediments and fresh water.
Symp.Proc.Junk. pp. 313-317.
Morell, J.M. & Corredor, J.E.1993 Sediment nitrogen trapping in a JT1angrove
lagoon. Estuarine, coastal and she/fscience 37, 203-212.
Muraleedharan, C.M. & Rajagopalan, M.S. 1993 Colonization of the mangrove
Acanthus iIIicifo/ius the sea accreted regions near Cochin. Mariculture
Research Under the Post Graduate Programme in Mariculture -Part - 2
16

Introduction
(Rengarajan, K., Noble, A., Prathibha, Kripa, V., Sridhar, N, Zakhriah, M.,
eds). Cochin, India, 53, 39-47.
Nasker, K.R. & Guha Baskhi, D.N. 1987 Mangrove swamps of the Sunderbans,
Naya Prakash, Calcutta.
·Odum, W.E. 1970 Pathways of energy flow in a South Florida estuary. Ph.D.
Dissertation, University of Miami.
Raghunadh, 1<., Sushadevi, K.P. & Sajan, K.P. 1995 Texture of Tellichery
mangrove sediments, south west coast of India. Indian Journal of Marine
Science 24, 91-93.
Ramachandran, K.K., Mohanan, C.N., Balasubramaniam, G., Johnson K. and
Jessy T. 1986 The mangrove ecosystems of Kerala its mapping, inventory
and some environmental aspects. Progress report. November 1985 to
November 1986. State Committee on Science, Technology and
Environment, Trivandrum.
Ramachandran, K.K. & Mohanan, C.N. 1987 Perspectives in management of
mangroves of Kerala with special reference to Kumarakom mangroves: a
bird sanctuary. Proceedings of the National seminar on estuarine
management, June, 1987, Trivandrum. pp 252-257.
Saenger, P. Hegerl, E.J. & Davy, J.D.S. 1983. Global Status of Mangrove
Ecosystems. The Environmentalist 3,1-88.
·Soto, R. & Corrales, L. F. 1987 Variacon de algunas charcterristica foliares de
Avicennia germinas (L.) L. en un gradiente climatico y salinidad. Revista de
8iologia Tropical 35, 245-256.
Subramanian, V. 2000 Impact of socio-economic development on the mangrove
ecosystems of Cochin in Kerala. In Environmental Problems of Coastal
Areas in India (Sharma, V.K., ed). New Delhi, India Bookwell Publishers pp.
191-200.
Thomas, G. & Fernandez, T.V. 1993 A comparative study on the hydrography and
species composition in three mangrove ecosystems of Kerala, south India.
Journal of Ecobiology 5, 181-188.
17

Chapter 1
Thomas, G. & Fernandez, T.V. 1997 Incidence of heavy metals in mangrove flora
and sediments in Kerala, India. Hydrobiologia 352, 77-87.
Valiela, I. 1984 Marine Ecological Processes, Springer Verlag, New York, 546 pp.
Walsh, G.E. 1974 Mangroves: a review. In Ecology of Halophytes (Reimold, R.J. &
Queen, W.H., eds). Academic Press, New York, pp. 51-174.
Woodroffe, C.D. 1985 Studies of a mangrove basin, Tuff Carter, New Zealand. Ill.
18
The flux of organic and inorganic particulate matter. Estuarine, coastal shelf
science 20, 447-462.

Chapter 2
MATERIALS AND METHODS
2.1 DESCRIPTION OF THE STUDY AREA
The areas of investigation were the mangrove-fringed canals in the Cochin
backwaters, a major estuary on the south west coast of India. Cochin backwaters
situated at the tip of the northern Vembanad lake is a tropical positive estuarine
system extending between go 40' and 10° 12N' and 76° 10' and 76° 30~ with its
northern boundary at Azhikode and southern boundary at Thanneermukkam bund.
The lake has a length of 80 km and the width varies from 500m and 4000 m. Water
from two major rivers viz., Periyar and Muvattupuzha drain into this estuary,
whereas Thannermui--kam bund regulates the flow from four rivers namely
Meenachil, Manimala, Achenkovil and Pamba. During south-west monsoon, the
estuary is virtually converted into a freshwater basin even in areas around
barmouth where saltwater penetration occurs below 5 m depth only. The two
mangrove locations on Vypeen island which were sampled experience only a weak
tidal flow. The narrow creeks had with obstructions that restricted the free flow of
water. Semidiurnal tidal range of Cochin estuary has been reported to be 1 m. No
perceptible tidal range was observed in the two selected mangrove locations in
Vypeen island.
Around Cochin, good mangrove formation are seen in areas like Vypeen,
Kannamali, Maradu, Elamkulam an.d Vallarpadam. Small patches and isolated
strands are seen at Kumbalam, Nettoor, Panangad, and Kundannur. Most

Chapter 2
extensive and highly developed mangroves are found on Vypeen island. Among
the flora Rhizophora mucornata is the most dominant species, followed by
Avcennia officinalis and Avcennia i/icifolius. Rhizophora mucornata is the largest
species which grows up to nine metre height. The exact nature of early mangrove
vegetation on the banks of Vembanad lake is not fully known. This is because the
vegetation has undergone considerable disturbances during the last few years due
to human interferences. They have been destroyed and used for fuel, and the land
has been used for paddy cultivation, prawn culture. coconut plantation and other
purposes. The destruction of mangrove plants leads to soil erosion and silting in
Cochin backwaters. When accretion along the coast takes place, colonization by
mangroves is rapid. In places devoid of human interferences were not affected,
colonization of mangrove takes place along some stretches of Cochin backwaters.
Three important mangrove locations around Greater Cochin were sampled
(Fig.2.1). Station 1 is situated between latitudes 90 59' North and longitude 76 0 14'
East and is located at Murikkumpadam in Vypeen island. In Vypeen, the areas
bordering the canals are densely populated. Station 1 located near the terminus of
a 5-7 feet wide canal. It is about 1 km distant from the adjoining estuarine water
body. It is characterized by a community of dwellings and therefore prone to
sewage inputs. Tidal amplitudes do not vary more than a feet. Along the water
course a few bushy clumps of Acanthus i1icifolious and few relic stands of Avcennia
could also be seen. Rhizophora existed as isolated individuals. No submerged
floras were noticed at any part of the year.
Station 2 is situated between latitudes 90 58' and North longitude 76 0 11' East
and is located at Puthuvypu on the southern tip of the Vypeen Island located on the
North Western Bank of Cochin bar mouth. This Station represents a carefully
preserved mangrove habitat inside the premises of Kerala Agricultural University
campus. The mangrove vegetation consisted primarily of Avcennia species which
is growing gregariously on the Western side with Rhizophora spp.and 8ruguiera
spp. constituting occasional growth. Effectfve area under mangrove vegetation is
about 10 ha.
20

Materials And Methods
05
1>
,'" , 1>
10 N <ll -
55'
.... " : .. ,.',25' ....
Fig. 2.1 Map of eochin estuary showing location of sampling sites
The sampling site was located at the terminus of the canal, which extend for
aboul1 .Skm from open waters into the Kerala Agricultural University campus. An
extent of 10 ha of land supporting mangroves in patches exists at Puthuvypu. This
forms part of Vypeen Island having 300 ha in extent. The entire area of 101 ha is
marshy containing natural basins; sand pits, crevices and canals support good
mangrove vegetation. This area is being used by the university for research in the
field of brackish water fish farming . The land is regularly inundated by the tidal
rhythm of eochin ba; mouth and the tidal waters bring in lot of fish seed of
commercially important species like Mughi/ eepha/us, Chanos, Lates ea/earifer,
Eleutheronema tetradacty/um, and prawns such as Penaeus indieus and Penaeus
mondon (Purushan, 1989). Since there is not much destruction from outside the
succession of mangrove vegetation is progressing unhindered. There is even some
trial of artificial regeneration of Rhizophora spp.and Bruguiera spp.in order to
21

Chapter 2
speed up the growth of mangroves. This is the biggest mangrove area available in
the Kerala coast (Basha, 1991).
Station 3 is situated between latitudes 9°54' North and longitude 76°18' East • and is located at Aroor which is in the southern part of Cochin estuary. This site
has only moderate amount of plants. An estuarine site (Station R) on the Vypeen
Island was also sampled during the study to facilitate comparison of the dissolved
nutrient profiles.
2~SAMPUNGANDSTORAGE
Monthly samplings were done at three mangrove stations from December
1999 to December 2000 except in June 2000. The water samples for different
nutrient analysis were collected in different polythene bottles directly from the water
sampler. Surface sediment samples were collected at low tides with clean polythene
scoop. Sediment cores were sampled to a depth of 20cm, since the mangrove plants
are shallow rooted. A PVC corer was used to collect core sediment samples from the
same Stations to a depth of 10-20cm. The core samples were taken with little
compaction as possible. The core sediment was cut into five fragments: 0- 2cm,
2-4cm, 4-6cm, 6-10cm, and 10-20cm. All of them including surface samples were
kept in plastic bags and carried in iceboxes to the laboratory. These sediment
samples were homogenized and kept deep frozen until analysis.
The dissolved ammonium analyses were done without delay. 50ml of the
water samples were preserved by adding 2ml of phenol reagent in the same vessel
in which the analyses were carried out. Nitrite analyses were also done within a day.
The water samples for analysis of dissolved phosphate were filtered using 0.45J,1m
poresize glassfibre filter paper (Whatman GF/F) and stored frozen till analyses. The
filter papers were stored for the analysis of total particulate phosphorus. The water
samples of total phosphorus, nitrate, nitrite etc were kept without filtration.
2.3 ANALYTICAL PROCEDURE
All glass wares used in the analysis were washed, soaked in dilute
hydrochloric acid and rinsed with distilled water. All reagents used were of
analytical grade, reagents and standard solutions were prepared with Milli-Q water.
22

Materials And Methods
Dissolved nutrients
Dissolved phosphate, nitrate, nitrite, ammonium and total phosphorus were
analysed colorimetrically according to the methods described in Grasshoff et al.
(1983a). Nitrite was analysed as azodye after reaction with' ethylene diamine and
sulphanilamide. Nitrate was first reduced in cadmium column and analysed as nitrite
with 5cm flow cell at 540nm. Ammonium analyses were carried out following the
indophenol procedure. The absorption of indophenol blue was measured in a 5cm
cell at 630nm. The dissolved inorganic phosphate (DIP) was determined according to
Murphy and Riley as phosphomolybdate complex (5cm/880nm). Total phosphorus
(TP) in water sample was obtained after oxidation by persulphate and analysed as
phosphate as above. Dissolved organic phosphates (DOP) were calculated by
subtracting the DIP from the TP value. All standard colorimetric methods were
carried out using Hitachi model 160-20 UV-Visible spectrophotometer.
Paticulate total phosphorus (PP)
Particulate phosphorus (PP) was determined by the method of drying a sample
with magnesium sulphate and baking the residue at a high temperature to decompose
organic phosphorus compounds (Solorzano and Sharp, 1980). The residue is then
treated with hydrochloric acid to hydrolyze poly phosphates and the resulting ortho
phosphate is measured by the molybdate method.
General hydrography
Water samples were analysed for general hydrographic parameters like
salinity and dissolved oxygen, following the standard methods (Grasshoff et al.,
1983b, 1983c). pH was measured using a portable pH meter and temperature by a
sensitive thermometer.
Total suspended solids (rSS)
A known volume of water was filtered through a Whatman GF/F 25mm filter
paper held in a filter holder. All filter papers were pre ashed (450°C for 4 hours),
pre weighed and held in separate numbered petri dishes. The filter papers
containing suspended matter were dried at 59°C in an oven for 24 hours.
Particulate organic Carbon (POC)
POC was determined by the wet digestion of the filter paper containing
particulate matter, using acid dichromate followed by titration to determine the
concentration of carbon (Parson et al., 1984).
23

Chapter 2
Moisture percentage in sediments
Moisture content was estimated by drying approximately 10g of
homogenized wet sediment sample in an oven at 90°C for 48 hours. The difference
in weights gave the percentage of moisture in the sediment samples.
Total Organic Carbon in sediment
The organic carbon content in the sediment was estimated by the dichromate
method (Walkley and Black, 1934) as modified by El Wakeel and Riley (1957).
Total Nitrogen in sediment
Total nitrogen was measured by Kjeldahl method (De Lange et al., 1992).
About 1 gm finely ground air-dried sediment samples were digested with 6ml of
concentrated sulphuric acid and catalyst (Mix katalyser, Merck). When the colour of
the solution changes to white greenish it was centrifuged and the clear
centrifugates and washings were transferred to a sample holder connected to the
steam distillation unit. The ammonia was distilled into 1 % boric acid after adding
25ml of 10 N KOH. The distilled ammonium was determined by back titration with
0.1 N hydrochloric acid. The total nitrogen (TN) concentrations were determined from the equivalents of ammonia obtained in boric acid.
Exchangeable ammonium and nitrate in sediments
Exchangeable ammonium and nitrate are defined as the amount of
ammonium and nitrate extracted by a 2N KCI solution. Analyses of exchangeable
inorganic nitrogen (ammonium and nitrate) were carried out on wet sediment
sample. The extraction of the exchangeable fraction of inorganic nitrogen including ammonium, and nitrate were done using a solution of 2N KCI (Agemian, 1997). This method involves the shaking of a wet sediment sample in a centrifuge tube
with 2N solution of KCI at room temperature for an hour. A portion of the
centrifugate was analyzed for ammonium, colorimetrically, using the indophenol blue method, in which it reacts with phenate in the pres~nce of hypochlorite and nitroprusside as catalyst. Another portion was analyzed for nitrate by reduction to
nitrite by tf)e method of spongy cadmium (Jones, 1984). The nitrite was determined
colorimetrically by reacting with sulphanilamide under acidic conditions to form a
diazo compound that couples with N-1 (Naphthylrethylene diamine
dihydrochloride to form reddish purple azodye .
24

Materials And Methods
Grain size analysis
Texture analysis was carried out by sieving and pipette analysis. A known
weight of wet sediment was dispersed overnight in .025N sodium hexameta
phosphate (Calgon) solution. The sand fraction was separated from the dispersed
sediments by wet sieving using a 230 mesh (63IJm) ASTM sieve (Carvar, 1971).
The filtrate containing silt and clay fraction was subjected to pipette analysis
(Krumbein and Pettijohn 1938; Lewis 1984).
Total iron in sediments
The oven dried sediment samples were ground in an agate mortar and 0.5g
aliquots were weighed into beakers for estimation of total metal. Each sample was
carefully digested with 10 ml of an acid solution (HCI04 , HN03 and HCI in the ratio
1:1 :3) at 90°C until complete digestion and evaporated to incipient dryness. After
cooling, the sides of the beaker were rinsed with Milli-Q water, centrifuged and the
centifugate made up to 50 ml. Metal concentrations in the solution were determined by atomic absorption spectrophotometry (Perkin-Elmer 3110 MS), calibrated using
secondary standard solutions prepared by appropriate dilution of 1000mgL01
standard solutions (Merck). Analytical blanks were prepared using the same
procedures and reagents.
Chemical fractionation of phosphorus
Phosphorus fractionation was performed by sequential extraction with
chelating compounds (Golterman, 1996). This procedure was slightly modified in
accordance with validation of different fractionation procedures by Pardo et al.
(1998). The different fractions extracted were water exchangeable inorganic
phosphate (W-IP), water exchangeable organic phosphate (W-OP), iron bound
inorganic phosphate (Fe-IP), iron bound organic phosphate (Fe-OP), calcium
bound inorganic phosphate (Ca-IP), calcium bound organic phosphate (Ca-OP),
acid soluble organic phosphate (Ac-OP), alkali exchangeable organic phosphate (Alk-OP) and residual organic phosphate (ROP). The extractions were carried out
according to the scheme depicted in Fig. 2.2. All organic phosphates were
obtained as the difference of total phosphate (TP) and dissolved inorganic
phosphate (DIP) in the extract.
25

Chapter 2
Phosphorus Extraction Scheme
Extractant
0.5-1 g Sediment
Distilled water 1 h 1-----------.
Residue
1 h Ca-EDT Aldithionate
pH -8
Residue
1 Na-EDTA ~
pH - 4.5
Residue
1 H2S04 ~
pH < 1
Residue
NaOH 90°C
-pH 14
Residue Digested with
K2S20 e / 0.5 M H2S04
DIP TP
DIP TP
DIP TP
TP
TP
TP
Phosphorus fraction
W-IP and W-OP
Fe-IP and FeOP
Ca-IP and Ca-OP
Ac-OP
Alk-OP
ROP
Fig. 2.2 Phosphorus fractionation scheme illustrating the
sequential extractions
26

Materials And Methods
Data analysis
Monthly variations of dissolved nutrients and general hydrographic parameters
are presented with a view to tind the variations of these parameters within the
Stations. Spatial variations are discussed mainly using seasonal distributions which
are presented in tables and graphs. The three seasons categorized in this study are
pre-monsoon (Feb-May), monsoon (June-Sept) and post-monsoon (Oct-Jan) unless
otherwise specified. Correlation analysis was carried out to find the influence of
various hydrographic parameters on the distribution of dissolved nutrient
concentrations (Snedecor and Kocharan, 1962). Comparison of dissolved nutrients
among stations and seasons was carried out using two-way analysis of variance
(ANOVA). The nutrient profile of surface and core sediments are illustrated as annual
mean variations as well as seasonal variations. The annual mean variations of each
parameter was used to compare the spatial variation, while seasonal variations are
depicted in a view to identify within the system variations. Comparison of nutrient
concentrations between stations, seasons and sediment depth were carried out
using three-way anlysis of variance.ANOVAs were followed by a least significant
difference test (LSD) if a significant temporal or spatial effect was found. All statistical
analyses were conducted as described by Freud and Wilson (1992).
REFERENCES
Agemian, H. 1997 Determination of nutrients in aquatic sediments. In Manual of
physico-chemical analysis of aquatic sediments (Murroch, A., Azcue, J.M. &
Mudroch, P., eds). CRC Lewis publishers, London.
Basha, S.C. 1991 Distribution of Mangroves in Kerala. Indian Forester 117, 439-448.
"Carvar, R.E. (Ed) 1971 In Procedures in sedimentary petrology. Wiley
Interscience, New York, 427 -428.
De Lange, G.J. 1992 Distribution of exchangeable, fixed, organic and total nitrogen
in interbedded turbiditic I pelagic sediments of the Madeira Abyssal Plain,
eastern North Atlantic. Marine Geology 109,95-114.
"El Wakeel, S. K., Riley, J. P. 1957 The determination of Organic Carbon in marine
muds. J. Con. Int. Pour. Expior. Mer., 22 180-183.
Freund, R.J. and Wilson, W.J. (Eds) 1993 The Analysis of Variance. In Statistical
methods Academic Press, INC.pp. 203-260.
27

Chapter 2
Golterman, H.L. 1996 Fractionation of sediment phosphate with chelating
compounds: a simplification, and comparison with other methods.
Hydrobiologia 335,87-95.
Grasshoff, K., Ehrhardt, M. & Kremling, K. (Eds) 1983a Determination of nutrients.
In Methods of sea water analysis. Verlag Chemie, Weinheim, 125-187.
Grasshoff, K., Ehrhardt, M. & Kremling, K. (Eds) 1983b Determination of Salinitv. In
Methods of sea water analysis. Verlag Chemie, Weinheim, 31-58.
Grasshoff, K., Ehrhardt, M. & Kremling, K. (Eds) 1983c Determination of oxygen. In
Methods of sea water analysis. Verlag Chemie, Weinheim, 61-72.
Jones, M.N. 1984 Nitrate reduction by shaking with cadmium. Water Research 18,
643-646.
Krumbein, W. C., Pettijohn, F. J. (Eds) 1938 In Manual of sedimentary petrography.
Appleton Century Crafts Inc., New York, 1-549.
Lewis, D.W. (Ed) 1984 In Practical Sedimentology Hutchinson Ross, Stroudsburg,
Pensylvania, 1-229.
Pardo, P., Lopez-Sanchez, J. F., Rauret, G. 1998 Characterisation, validation and
composition of three methods for the extraction of phosphate from
sediments. Analytica Chimica Acta 376,183-195.
Parsons, D.W., Maita, Y. and Lalli, C.M. 1984 A manual of chemical and biological
methods for sea water analysis, Pergamon Press. 173p
Purushan, K.S. 1991 Prospects of fish production from mangrove ecosystems.
Fishing Chymes June, 24-26.
Snedecor, G.W. & Cocharan, W.G. (Eds) 1962. Statistical methods, Oxford and
ISH Publishing Company, Culcutta. pp. 339
Solorzano, L. & Sharp, J.H. 1980 Determination of total dissolved phosphorus and
particulate phosphorus in natural waters. Limnology and Oceanography 25,
754-758.
• Not referred in original
28

Chapter 3
DISTRIBUTION OF
NITROGEN AND PHOSPHORUS
IN THE WATER COLUMN
3.1 INTRODUCTION
Nutrients in biological system
A nutrient element is defined as one that is involved functionally in the
processes of living organisms (Parsons, 1975). Traditionally, the term has been
applied almost exclusively to phosphate, nitrate, and silicate. Phosphorus one of
the important nutrient, brought into the aquatic system through weathering of
minerals. Phosphorus inputs can increase the biological productivity of surface
waters. The mean phosphorus content of sea water has been estimated as 2
\JmolL·1 (Grasshoeff et al., 1983). Primary production appears to be phosphorus
limited in many tropical estuarine and coastal systems. Very high nutrient level may
build up in esturies and land locked bodies of water as a result of discharge of
sewage and of effluents containing detergents rich in polyphosphates. Increased
inputs of nitrogen and phosphorus usually result in higher primary production that
can cause eutrophication problems. Advanced eutrophication of surface water
leads to problems with its use for fisheries, recreation, industry or drinking because
of the increased growth of undesirable algae and aquatic weeds and oxygen
shortages caused by their senescence and decomposition. Several outbursts of

Chapter 3
phytoplankton, were reported around Indian coast which often reached bloom
proportion (Qasim, 1972).
Nitrogen is brought to the aquatic system, from fluvial and atmospheric
sources, by diffusion from sediments and in situ nitrogen fixation. Ammonia, nitrite
and nitrate are the three principal dissolved inorganic forms of nitrogen in coastal
systems with nitrate occurring in highest concentration. Nitrite occurs in aquatic
system as an intermediate compound in the microbial reduction of nitrate or in the
oxidation of ammonia. It also comes into the water when phytoplanktons are fed
luxuriantly by nitrate and pho~phate. The natural level of nitrite in seawater is very
low <0.1 ~moIL·1. But where anoxic condition occurs a high nitrite concentration
may occur >2 ~moIL·1 together with low levels of dissolved oxygen as given by
Grasshoeff et al. (1983). High nitrite values may also indicate polluted waters in
estuaries. Nitrate is considered to be the thermodynamically stable product of
inorganic nitrogen in the presence of oxygen in seawater. In many sea areas
nitrate is considered to be the micronutrient controlling primary production in the
euphotic surface layer. The concentration of nitrate in these layers is governed by
the advective transport of nitrate into surface layers, microbial oxidation of
ammonia and the uptake by primary producers. If light penetration into the water is
sufficient, the uptake rate is much faster than the processes transporting nitrate
into the surface layers. Therefore, the nitrate concentration in most ocean surface
waters is close to zero.
The amount of ammonium (NH4 +) rarely exceeds 5 ~moIL·1 in oxygenated
unpolluted water. But in anoxic deep stagnant water, such as in the Black sea, the
amount of ammonium-N can be as high as 1 00 ~moIL·l. Since acid-base pair, NH4 +
-NH3. has a pKa of about 9.3, the ammonium ion is the dominant species in natural
waters with a pH of 8.2 or less. It is the NH3 form that is toxic to fish and other
marine organisms and not the NH4 + ion. The concentration of ammonium in the
aquatic system shows considerable variations and can change rapidly. Ammonium
is found to be the abundant form in surface layers after a period of productivity
when the phytoplankton blooms were removed the greater part of nitrate and
phosphate. In the assimilation processes of phytoplankton ammonia is
preferentially used for synthesizing protein. When nitrate is incorporated it must
first reduced to ammonia before it can be transferred into aminoacid compounds.
The organic nitrogen compounds resulting from decaying organisms and those
30

Distribution 0/ Nitrogen and Phosphorus in tlu Water Column
excreted by plants and animals are rapidly broken down to ammonia by various
species of proteolytic bacteria. When organisms sink below euphotic zone, they
decompose as a result of oxidative bacterial action releasing nitrate and
phosphate. As the water approaches anoxic condition, bacteria use the nitrate ions
to continue the oxidation process. This denitrification leads to the prod~ction of
molecular nitrogen and ammonia. Interaction between nitrate and ammonia
produces more nitrogen gas. At the onset of sulphate reduction, ammonia and
hydrogen sulphide are often produced, some times in high concentration.
There are a variety of forms of phosphorus in seawater; this includes
dissolved inorganic phosphate (predominantly orthophosphate ions) organic
phosphates and particulate phosphorus. Phosphate is also released back into the
water column during the oxidative destruction of organic tissues. Most of the
regeneration of phosr)horus probably takes place via bacterial decomposition,
which leads to the formation of orthophosphates, although chemical decomposition
may occur. The dissolved organic nitrogen and dissolved organic phosphorus also
constitute important sources of nitrogen and phosphorus in the water column. The
total dissolved organic nitrogen and dissolved organic phosphorus concentration
are frequently several times higher than dissolved inorganic concentrations,
espeCially in marine waters (Wells et al., 1991). These l1utrients are constantly
removed from solution by organisms, mainly phytoplankton, during primary
production in the euphotic zone.
The phytoplankton are autotrophs, important members include diatoms,
cocolithophores, silicofiagellates and dinofiagellates, all of which are eukaryotes.
The only major group of autotrophic prokaryotes is the cyanobacteria. They are
unique because they can fix gaseous nitrogen, whereas other phytoplankton can
utilize only already fixed forms of nitrogen. The photo- autotrophic biomas is the
most important primary source of organic carbon in the aquatic system, and
primary production is the initial stage in the marine food production. This
subsequently involves a number of trophic levels in which herbivorous zooplankton
consumes the phytoplankton during secondary production, which in turn is fed
upon by carnivorous zooplankton and fish species.
The process of photosynthesis, in which organic compounds are synthesized
from inorganic constituents present in seawater during the growth of phytoplankton,
is usually termed as primary production. Primary production controls are, light
31

CIulpter3
availability. nutrient availability and zooplankton grazing. The limiting factors for
primary production are therefore the critical minimum of these factors. However the
concept of limiting nutrient strictly refers only to new production. because
productivity can be maintained in the presence of low nutrient concentration by
recycling. Nitrate has usually been considered to be the most important limiting
nutrient for primary production in the marine environment. In certain oceanic region
phosphate can act as limiting nutrient for phytoplankton growth.
Nutrients in mangrove ecosystem
The waters of mangrove swamp ingress and egress with the tides with an
overall and gradual progressive displacement towards the sea. This process of ebb
and flood gives the waters a long residen~e in the swamp. the duration of which
varies with tidal amplitude, coastal profile and amount of land runoff. Sea water
brings with it nutrients of a different kind than those usually dissolved in land run-off
thus input supplement each other: Nutrients are usually not a limiting factor to
productivity in mangrove waters. The waters that flow out of the mangroves have
characteristics peculiar to them, acquired during their long residence in the
swamps. They contain a large amount of dissolved organic matter in the form of
nutrient salts, like nitrates, nitrites, and phosphates also silicates. Mangrove
ecosystem produces large amount of litter in the form of falling leaves, branches
and other debris. Decomposition of the litter contributes to the production of
dissolved organic matter and the recycling of nutrients both in the forest and in
adjacent habitats. The organic detritus and nutrients potentially enrich the coastal
waters and ultimately, support fishery resources. The contribution of mangroves
could be particularly important in clear tropical waters where nutrient
concentrations are normally low.
The importance of mangroves in sustaining productivity in tropical
ecosystem, was established by coupling of mangrove forest and aquatic primary
productivity (Rivera-Monroy, et al., 1998) and opined that the surface mangrove
water could potentially stimulate aquatic primary productivity throughout the year.
In many tropical mangrove systems complex organic compounds are quantitatively
released during decomposition of mangrove leaf litter. Approximately 30-50% of
the orgar,ic matters in mangrove leaves are leachable water-soluble compounds
such as tannins and sugars (Cundell et al., 1979). High concentration of dissolved
organic material exported from mangrove ecosystems may be a key factor
32

Distribution ofNitrogell and Phosphorus in the Water Colu",,,
supporting phytoplankton growth. Twilley (1985) showed leaching of dissolved
organic carbon from mangrove leaf litter provided dissolved organic carbon to the
surface of the basin forest and later exported during rainfall.
The mangrove fringe forest in a lagoon was shown to be an area of active
nutrient transformation (Rivera-Monroy et al., 1995). An export of the dissolved
inorganic'nitrogen from the creek water was found, it was transformed to organic
nitrogen and the forest supplied particulate nitrogen mostly to the creek. Thus, the
fringe mangrove forest in Estero Pargo (Mexico) acts as a sink of inorganic
nitrogen and as a source of dissolved and particulate nitrogen. Export of nitrogen
from the forest coincides with the high net aquatic primary production rates
obtained for the same months in Estero Pargo indicating a direct potential
relationship. The uptake of inorganic nitrogen from tidal waters within mangrove
ecosystem does not necessarily represent a nitrogen sink via denitrification, but
retention of nitrogen in mangrove sediments (Rivera-Monroy and Twilley, 1996). In
Matang Mangrove estuary (Malaysia) the spring tide concentration of ammonium,
silicate and phosphate concentration were higher than those in the neap tide which
suggest that these nutrients are flushed from the mangrove area by the inundation
and tidal mixing of spring tide (Tanaka and Choo, 2000). Nutrient concentration in
creek water were found higher than those of estuarine water, indicating the nutrient
outwelling from the mangrove swamp and ammonium regeneration from mangrove
litter in the creek sediments by the same authors. Matang mangrove forest is a
Riverine Forest type mangrove (Wolanski et al., 1992). The eastern Brazilian shelf
is bordered by small river mangrove systems. An important fraction of DOP and
DON present in adjacent waters are supplied by river-mangrove systems (Ova lie
et al., 1999). A comparison of the mangrove waters of the United Arab Emirates
and the nearby creek waters, showed a higher nitrogen: phosphorus: silicon ratio in
mangrove creek water (Shriadah, 2000). Strong outwelling of nutrients and organic
matter was measured and found in Braganca (North Brazil), exceeding that of other
mangroves in the world (Dittmar and Lara, 2001). In a study which compares the
benthic nutrient pools and rates of dissolved nutrient exchange between the forest
floor and tidal waters in Hinchinbrook island in Queensland, Australia found that a
large proportion of nutrients are tied up in below- £round biomass, the dissolved
nutrient pools and flux are closely linked to plant assimilation mechanism and to
mineralisation processes by microbes. These nutrient cycling process are highly
dynamic and leading to net import of dissolved nitrogen, phosphorus and silicon to
33

Chapter 3
the extent that mangrove forests are a finely balanced and highly efficient sink for
dissolved nutrients in this tropical ecosystem (Alongi, 1996).
The works at Pichavaram mangrove area (southeast India), have
established their importance in enriching the coastal area (Kathiresan, 2000). The
total phosphorus, total nitrogen and ammonia nitrogen concentration in Adayar
mangrove waters showed a tidal variation with low values during high tide (Selvam
et al., 1994). He also found that along with the phytoplankton the mangrove plant
community of the Adayar estuary may also remove large amount of inorganic
nutrients which can be exported out of the estuary. The mangroves in West
Bengal, Sunderbans. support the growth of rich algal communities. which provide a
novel source of nutrients to the whole ecosystem. They remain in the mangrove
forest subsystem as an epiphytic assemblage of algae living on the stems,
pnuematophores of mangrove trees and on the surface of the sediment as
epibenthic form. Besides a good number of algae remain in the water subsystem
as phytoplanktors and and play a great role in the total productivity and energy flow
in the system. (De et al .• 1987). This mangrove ecosystem harbours different types
of bacteria in abundance in their vegetations. soil. water. litter etc that plays a key
role in the nutrient cycle of the ecosystem (Bhowmick et al., 1985). Nutrient status
of the water depends on the availability of silicate (82 1J9L-1 to 140 1J9L-\
phosphate (0.92 ~gL·1 to 2.3IJgL-1) and nitrate (6 ~gL-1 to 18 ~gL-\ which are
instrumental for the total biological productivity of the system (De et al., 1987).
The foregoing observations reveal the importance of nutrients in a mangrove
ecosystem. Examination of the variations in concentration of nitrogen and
phosphorus species in time and space can provide insight into some of the
processes controlling the distribution of nitrogen and phosphorus in mangrove
creek waters. The survey of general hydrographic parameters of the creek waters
provides background information necessary for the study of the processes involved
in the cycling of these elements in this ecosystem. Even though considerable work
has been done on the distribution of nutrients in mangrove ecosystem of Indian
subcontir.ent there is a paucity of data on the nutrient distribution in the mangrove
areas of Greater Cochin.
The environmental parameters recorded may characterise the mangrove
ecosystem under observation. and those values were compared with Station R (an
estuarine station). The data was analysed using Analysis of Variance technique to
34

Distribution of Nitrogen arid P/losphorus in the Water Column
find any significant difference between any of these mangrove stations. Two factor
AN OVA without replication was used for the purpose. Wherever significance is
noted the least significant difference was worked out.
3.2 RESULTS AND DISCUSSION
3.2.1 General hydrography
Salinity
Physical processes control several key biological and chemical processes in
the mangroves. The trends and variation in the distribution of salinity indicate the
physical processes involved and movement of water masses. The tidal circulation is
the dominant cause of water movement in mangrove creek systems. The salinity
values have an impact on the distribution of marine and brackish water invertebrates.
The fall in salinity causes heavy preCipitation, while surface drainage during
monsoon interferes with the distribution of marine forms and higher salinity during
pre monsoon interferes with the freshwater forms in Sunderbans, West Bengal
(Chakraborthy, 1995). The ammonium nitrogen, nitrate nitrogen, and silicate silicon
concentrations in mai.drove forest of Matang (Malaysia) increased with decreasing
salinity, showing fresh water source of these nutrients (Tanaka and Choo, 2000).
Seasonal variations of salinity in surface waters are given in Table 3.1. In
mangrove-fringed creek waters, salinity values ranged between 0.96 x 10.3 at
Station 3 (monsoon) and 31.86 x 10.3 at Station 2 (pre-monsoon). While at Station
R, salinity values ranged between 0.96 x 10'3 (monsoon) and 21.70 x 10,3 (pre
monsoon). The annual mean values of salinity, recorded a minimum of 11.28 x 10,3
at Station 3 and maximum of 18.41 x 10.3 at Station 2. Station R recorded a mean
salinity value of 11.26 x 10.3. Monthly variations of salinity (Fig. 3.1) recorded
higher values during February, March and April in all mangrove fringed creek
waters. However a remarkable increase in salinity values were also observed
during May at Station 2 and Station 3. July, August. September and October were
characterized by low salinity values at all mangrove-fringed creeks.
35

Chapter 3
Table 3.1 Seasonal variation of salinity (x10·3) in surface waters
Stations Season Min Max Mean
Pre-monsoon 10.83 28.57 22.96 ,-Station 1 Monsoon 5.10 12.43 7.97
Post-monsoon 8.11 26.50 18.57
Annual mean 16.98
Pre-monsoon 24.67 31.86 28.85
Station 2 Monsoon 4.78 12.74 7.75
Post-rr onsoon 4.06 24.00 16.45
Annual mean 18.41
Pre-monsoon 11.95 19.89 17.31
Station 3 Monsoon 0.96 6.37 3.61
Post - monsoon 1.16 19.00 10.97
Annual mean 11.28
Pre-monsoon 7.65 21,;0 16.84
Station R Monsoon 0.96 6.37 3.61
'- '.' :-,; ~ Post - monsoon 5.50 15.99 11.46 . '~-.. ~ '.' -'.'- .
Annual mean 11.26
Min - minimum, Max - maximum.
The salinity values of surface water exhibited significant spatial variations.
Generally higher salinities were observed at Station 1 and Station 2 during all
seasons (Fig. 3.2). The salinities recorded during pre-monsoon at Station 1 and
Station 2 were remarkably higher than that recorded at Station 3 and at Station R
(Table 3.1). Station 1 and Station 2 are located at the head of the respective
creeks. Then this upper reaches of mangrove fringed creeks might become
completely isolated from the near shore zone during pre-monsoon, due to low fresh
water discharge into the creek. This might resulted in the formation of salinity
maximum at Station 1 and Station 2. Hence the water in the creek showed salinity
greater than that of seawater. This observation is in unison with the finding of
Wolanski (1989).
36

Distribl/.non of Nitrogen and Phosphorus in tlu Watl'T Column
35
30
" 20 • o
"; 15
10
, •
Monthly_nation of .alinity
. i ~/
• •
o +-~~--~~ ____ ~~--__ ~·~--__ ~ Oec Jan Feb Mlr April Mly .iJ1y Aug Sep Qcl f\by Cec
-.- STN 1 _ _ STN 2 • STN 3 - )(- STN R
Fig 3.1 Monthly variation of salinity In surface waters
Se •• onal varIMlon of ullnlty 3'
30
" • 20 0
';;: 15
10
5
0 1 2 3 •
• Pre·monsoon • Monsoon 0 Post-monsoon
Fig. 3.2 Seasonal mean variation of salinity In surface waters
37

Clulpter3
Seasonal variations of salinity in this estuary are influenced by the increased
fresh water discharge during the monsoon rains. Low salinities were recorded
during monsoon at all Stations, again comparatively higher values were found at
the first two Stations. The higher salinlties observed at Station 1 and Station 2
during all seasons might be due to its geographical position, since these stations
are located at the terminus of respective canals, where the water in the creek
experiencing long residence time, which leads to evaporation during dry weather
conditions (Wolanski, 1989; Ridd et al., 1988). Whereas the salinity values at
Station 3 were of comparable to that of Station R, indicated a regular tidal influence
at this site. The annual variation of salinity of mangrove-fringed creeks at Vypeen
was found to vary from 0.8 x 10⁻³ to 34 x 10-3 (Rathnakala, 1995).
The correlation analysis of salinity with other parameters, showed no
Significant correlation with any other hydrographical parameters or with nutrient
concentrations (Table 3.2a). At Station R, significant positive correlation was found
with temperature and total phosphorus concentrations (Table 3.2b).
Two way AN OVA was used to test the Significance of months and stations on
salinity. The results of ANOVA are given in appendix 1 (App. 1). There is significant
difference between stations (p < 0.001). The least significant difference (LSD) at 5%
level for stations is 3.559. Significantly higher salinities were remained at Station 1
and Station 2 than at Station 3 and Station R may be due to the restricted tidal
influence and evaporation. No significant difference was noticed between Station 3
and Station R, while significant difference experienced between months (p < 0.001).
The LSD at 5% level for months is 3.559. Significantly higher salinity is found in
months of March followed by February, April, May, December and January.
The salinity values observed during the present study indicate less tidal
inundation at the first two Stations compared with the third Station. Also salinity
variation showed the isolation of the head of the creeks (Station 1 and Station 2)
during pre-monsoon due to less fresh water discharge. Station 3 found to be an
open system, with a tidal impact as at Station R.
38

Distributioll of Nitrogr!1l alld PllOSpllorlls ill tile Water Columll
Table 3,2a Correlation matrix of general hydrographlc parameters and nutrient concentrations at the mangrove fringed stations,
Salinity DO pH Temp TSS POC DIP DOP pp TP Nitrite Nitrate
~a:iRIIY t.oooo
DO -0.1194 1.0000
pH 0.1193 ~.4517' 1.0000
Temp 0.3714 0.3477 -0.0271 1.0000
SS 0.2633 -0.2505 0.1640 0.0779 1.0000
POC 0.1951 -0.3170 -0.'396 0.0205 ~.4751' 10000
DIP 0.'373 -O.IS01 0.3112 -0.1700 0.5408" 0.3722 '.0000
looP ~.03IB -0.2193 -O.DOSS -0.1631 0.0759 0.4894' 0.1285 '.0000
pp ~.20S2 -O.4D01' f<l.0968 -0.0248 ~5079"' 0.6884'" 0.6338'" 0.0352 '.0000
TP ~.1844 -0.3537 0.1009 -0.'206 0.5710" 0.6624'" 0.8768'" 0.2395 ~.9066'" 1.0000
Nilrr", 0.0743 -0.'206 0.025' -0."96 -0.0907 ~.0985 ~.3756 0.0595 ~0356 0.2080 1.0000
N,trale -0.1596 -0.3094 -0.4078' -0.'062 -02550 -0.2706 -0.1654 -0.0700 -0.1902 -0.2049 ~.0289 1.0000
~n .. m 0.0940 :-0.4625' -0.'254 0.0715 10.4425" 0.'225 10.4542' -0.0532 10.4951" 0.5015" 1-0.089' 10.1090
Ammontum
1.0000
Table 3,2b Correlation matrix of hydrographlc parameters and nutrient
concentrations at Station R.
Salinity DO pH Temp TSS POC DIP OOP pp TP Nilrite Nltra .. AmmotWm
~onity 1.0000
~ 0.0695 110000
~ 0.5143 ..Q.0865 1.0000
Temp 0.7939' -0.0290 0.8'79' '.0000
TSS 0.0441 00242 0.4363 0.'478 '.0000
/'OC ~.3297 -0.4454 10·5088 0.4456 0.5774 '.0000
PtP ~.1446 -0.4856 -0.'406 0.3419 0.0326 0.34'2 1.0000
PJP ~.2094 0.3204 -0.0'13 -OQ444 -0.2488 -0253' -0.3849 '.0000
~ ~.5235 -0.2576 0.0497 ".4'56 0.4372 0.371' 0.2541 fo·0715 '.0000
TP 0.6124' .().2517 0.0206 10·4648 0.2980 0.326' 0.3674 10. 1780 0.9355- '.0000
Nitrile 0.0205 -0.'243 0.2236 0.0750 0.5656 0.3149 -0.'520 -0.6576' 0.4984 ~.1752 1.0000
Ni!raIe -0.3662 -0.0256 -0.5694 -0.1145 -0.0484 :-0.2274 0.1832 -0.2530 ~.3300 ~.2131 ~.2025 1.0000
~ .0.2271 -0.5082 1-0.3814 -0.2639 ~.1959 f.2337 0.6852' \-0.0845 ~.2072 ~.3339 -0.1846 0.0948 1.0000
P<O.05' p<O.01 p<O.001-
39

Ch4pter3
Dissolved Oxygen (~O)
The degree of horizontal and vertical mixing of water influences the DO concentrations in mangrove waterways. Boto and Bunt (1981) found that DO concentration in mangrove creeks dropped significantly at upstream stations due to phenolic compounds and bacterial population. DO values < 2 ppm were often recorded in blind ending creeks. High concentration of dissolved phenolic compounds leached from mangrove detritus can cause drop in lowering of oxygen concentration as they are oxidized. The larger residence time of wa ter in the upstream sections presumably leads to higher concentration of polyphenolics and thus lower 00 concentration.
Seasonal variations of DO are depicted in Table 3.3. At the mangrove locations. 00 values ranged between 0.52 mll" at Station 2 (monsoon) and B.gJ mll-' at Station 3 (pre-monsoon). At Station R the DO values vary from 0.22 mlr:' to 6.99 mll-' . The annual mean DO values showed highest value (3.84 mIL-1);Pt Station 3 and lowest (2.86 mll·1 ) at Station 2. .... .
Monthly variations of 00 (Fig. 3.3) showed higher values during July. August and September at all Stations except Station 2. However Station 2 recorded highest value of DO during February, March and July. A high value of DO was also observed during December at Station R (Fig. 3.3).
Table 3.3 Seasonal variation of Dissolved oxygen (mll-') In surface waters
Stations Season Min Max Mean
s;;o"-K1 Pre-monsoon 1.64 3.59 2.60 Monsoon 3.39 6.63 4.76 Post-monsoon 0.69 4.82 2.36 , Annual mean 3.04 -. Pre-monsaon 3.28 7.56 5.24
Station 2 Monsoon 0.52 4.08 2.30 Post-monsoon 0.71 2.89 1.66 .. A nual mea 2.86 Pre-mansoon 1.87 8.93 3.79
Station 3 Monsoon 3.13 5.02 4.25 Post - monsoon 1.20 5.47 3.64 Annual mean 3.84 Pre-monsoon 2.24 3.74 2.95
Station R Monsoon 4.08 4.75 4.51 Post - monsoon 0.22 6.99 3.21 Annual mean 3.70
40

Distribution ofNitrogf!JIlJnd Phosphorus in tlu WlJter Column
10
• • 7
• ~ 5
• 3
2 1
Monthly varfatlon of DO
. l x
/ . I " • ....
O ~~~--~~ __ ~--~~~--~~~ Dec .WI Feb ~ Apt tIay ..k.II Aug Sep Qct ft)v Oec
_ SlN 1 • S1N 2 -.l STN 3 --t(- S1N R
Fig 3.3 Monthly variation of dissolved oxygen In surface waters
2 3 R
• ?re - rronsoon. Moraooo Cl Post - rmnsoon
Fig. 3.4 Seasonal mean variation of dJssowed oxygen In surface waters
The seasonal variations of DO (Fig. 3.4) recorded comparatively higher DO
values at Station 3. Monsoon season was characterized by maximum DO at all
Stations except at Station 2. However remarkably high DO value was recorded at
Station 2 during pre--monsoon. The earlier studies also reported similar observation
(RathnakaJa, 1995). Lowest oxygen content was recorded during post monsoon
season invariably at an mangrove stations. The low values of DO were found
41

Chapter 3
during pre-monsoon at Station R. The lower oxygen concentrations during this
period might be due to high microbiological activity (Nair et al., 1988). ANOVA
showed no significant difference between stations and between months of the
dissolved oxygen level (App. 2).
A Significant positive correlation of dissolved oxygen was found with pH at
Station 1 (Table 3.2a). This observation suggests a decrease in DO was not only
due to the oxidation of phenolic compounds but also due to some microbial
processes. However the present study found that low DO values observed at
Station 1and Station 2 (at the head of the creek) might be associated with large
residence time of creek water as well as due to an increased bacterial population.
Station 3 showed DO values comparable to that of estuarine reference Station was
found to be an open system. Dissolved oxygen concentration at mangrove waters
also negatively correlated with particulate phosphorus concentration and
concentrations of ammonium. No significant correlation of DO concentration with
any other parameters was noted at Station R (Table 3.2b).
pH
High concentration of dissolved phenolic compounds leached from mangrove
detritus, can cause drop in pH. The organic matter accumulating at the sediment also
causes low pH values. The higher pH in surface layer may be due to the intense
photosynthesis confined to the upper layer.
Seasonal variations of pH values are depicted in Table 3.4. pH values at
mangrove creek waters found to varied from 6.80 at Station 1 and Station 3 (post
monsoon) to 8.20 at Station 2 (pre-monsoon). While at Station R, pH varied
between 6.94 and 8.40. The lowest and highest values of annual mean of pH
values recorded were 7.42 (Station 3) and 7.64 (Station 2) respectively (Table 3.4).
Similar to Station 2, a mean pH value of 7.66 recorded at Station R. The monthly
variation in pH (Fig. 3.5) recorded higher values during April, May, July, October
and November at all stations. At Station 2 higher pH values were observed during
February and March.
42

OistriflllHon 01 Nifrogtfl rand Phosphorus in thr Wratn Column
Table 3.4 Seasonal variation of pH In surface w.ters
Station 1
Station 2
Station 3
Pre-monsoon
Monsoon
Post·monsoon
Pre·monsoon
Monsoon
Post·monsoon
Pre·monsoon
Monsoon
Post· monsoon
6.90
7.20
6.80
7.10
7.30
6.90
7.00
7.20
7.10
7.80
8.12
8.07
8.20
7.64
8.07
7.60
7.68
7.93
8.40
7.20
7.62
7.53
7.90
7.50
7.46
7.33
7.47
7.30
7.77
8.24 7.58
The high pH values were observed during monsoon at station 1 and Station
3, while at Station 2 high pH values were recorded during pre-monsoon season. However Station R recorded maximum pH during pre-monsoon (Fig. 3.6). In the present study the lower pH at all Stations during certain seasons, may be attributed to the high microbial activity in the water column. Increased microbial activity
decrease the pH value in surface waters (Ram and Zingde, 2000). pH values at Station 1 an<! Stalion 2 showed high varlallol), which may be attribulad 10 the low
pH values observed during prtHTlonsoon. The pH values In mangrove-fringed
creek waters of Cochin estuary were found to vary between 7.5 and 8.7 (Preetha, 1991; Vankelesan, 2001).
43

CluJpter 3
• . S
• . l
• . 1
7 .•
•
f! 7.7
i ~.~ ... / 0 •
Monthly Vllri8tion of pH
7.1 • •
•.• =---. • . 7
•
• . S <-_~~-~_~~-~ __ ~~
~ , a
Oec .lan Feb Mar ·Aptl May July Aug Sep Qcl N::w Oec
_ STN1 _ STN2 . - STN3 - x- STNR
Fig 3.5 Monthly variation of pH In surface waters
s. .. o,"" VII,ildion 01 pH
• . 0
7 .•
7 .•
7 .•
72
7.0
••• 2 l R
• fire · lTOI'I$oon. t.bnsoon 0 Post · rmnsoon
Fig. 3.6 Seasonal mean variation of pH in .urface waters
ANOVA showed (App.3) signifICant difference between months at (p<O.05).
Significantly higher pH was observed during November followed by October, April and September. There is no significant difference among the other months. The high pH values observed during post·monsoon were attributed to high photosynthetic activity. Which in turn was high during this season due to availability
44

Distribution 0/ Nitrogen and Phosphorus in tM Water Column
of light and nutrients. No slgniflCsnt difference was observed between stations.
Similar observation was reported In another mangrove ecosystem study of Cochin
(Rathnakala, 1995). pH values at mangrove creek waters showed a significant
negative correlation with concentrations of nitrate-N (Table 3.2).
Temperature
Seasonal variations of temperature are given in Table3.5. At the three
mangrove fringed creeks, temperature ranged between 26.5°C at Station 2 (post
monsoon) and 34.0°C at Station 3 (pre-monsoon). At Station R the temperature
ranged between 29.50°C (post-monsoon) and 32.0°C (pre-monsoon). The lowest
and highest mean values recorded were 29.21°C (Station 1) and 3O.13°C (Station
3) respectively. Reference Station recorded an annual mean temperature of
30.55°C. Monthly variations in temperature are depicted in Fig. 3.7. Higher values
of temperature were recorded during March, April, May, November and December.
However Station 2 recorded higher values also during July and August.
Tabl, 3.5 S •• sonal variation of t.mperatur. (-C) In surfac. w.t ....
45

CIulpter 3
,. 34
33
32
31
\, 30
" 28
'E
26
Monthly YIIrtatlon at_mperatu,.
•
• '0- • _. ----,;C
/ -• ~ • • , • • •
~~~~~~~--r-__ ~~~~ __
Dec .)an Feb tier AprI May .AA)< Aug Sep Oct t>bv Dec
__ 5TN 1 ... 5TH 2 ----6 5TN 3 - M- STN R
Fig 3.7 Monthly variation of temperature In surface waters
35
34
33
32 31
1'30 29
2. 27
"" 25
s....on.l YllriaHonof"mperature
2 3 R • P1'e-rronsoon • M:lnsoon [] Po$I-lTDfI$oon
Fig. 3.8 Seasonal mean variation of temperature in surface waters
The mangrove fringed creek waters were found to exhibit minimum temperature during post-monsoon season as against the observation at the
reference Station, where minimum temperature recorded during monsoon (Fig. 3.8). It was reported that. the lowest annual temperature of the Cochin
backwaters usually occurred during the monsoon season {Ramaraju et af .• 1975}. Water temperatures were found to vary within nonnallyexpected ranges at all the
46

Distribution of Nitrogen and Phosphorus in the Water Column
stations. The lowest annual mean value of 29.1 °C recorded at Station 1, 29.5°C at
Station 2, and 30.2°C at Station 3. A clear seasonal variation was found at all three
stations. As expected, the maximum temperature was recorded during pre
monsoon at all stations.
ANOVA (App. 4) showed no significant variation of temperature between
months and between stations and between seasons.
Total Suspended Solids (rSS)
TSS in mangrove waters can be divided into two types. The macroscopic
litter and finely divided materials retained on glass fibre filters. The litter from
mangrove area was effectively removed from the system via tidal action. The litter
lying on the ground at low tide always .seems to be effectively removed during each
high tide, in areas frequently inundated in Coral Creek, Queensland (Boto and
Bunt, 1981; Boto, 1982). Here the effect of grazing and decomposition is minor. But
in higher areas, less frequently flood~d, the effect of grazing may be considerable
and some decomposition may occur before exported. The mangrove detritus was
observed floating on the surface of the tidal creek during both the flood and ebb
tide in Tuff Crater, Auckland and the concentration of which varied from 8 mgL-1 to
92 mgL-1 (Woodroffe, 1985).
Seasonal variations of TSS are given in Table 3.6. The TSS values ranged
between 4.40mg L-1 at Station 3 (pre-monsoon) and 360.00mg L-1 at Station 2
(monsoon) at the mangrove creek waters. Similar seasonal variations were observed
at Station R, which recorded values varied between 5.43mg L-1 (post-monsoon) and
88.41mg L-1 (monsoon). Comparatively higher values were recorded during monsoon
at all Stations (Fig. 3.10). The highest mean value ofTSS was recorded at Station 2
(73.15mg L-1) and lowest value was recorded at Station 1(2.39mgL-\
TSS concentrations observed in mangrove stations were found to be
comparatively higher than at the estuarine reference station (Fig.3.9). Generally
higher values were observed during February, April, May and September at the
mangrove fringed creek waters. However at Station 2, a high value was also
observed during November. At Station R, higher values were recorded during April,
May and July.
47

CM"....
Table 3.8 Seasonal variation of TSS(mgL") In surface waters
Station 1
Station 2
Stallon 3
Station R
3'" 300
2'"
200
~ 150 100
'" 0
8.16
Monsoon 30.60
Post-monsoon 17.43
Pre-monsoon 7.13
Monsoon 21 .56
Post-monsoon 14.31
Pre-monsoon 4.40
Monsoon SO.20
Post - monsoon 20.56
Pre-monsoon 23.04
Monsaon 28.40
Post - monsoon 5.43
M--..y varia_ of TSS
... . -
" ,.
149.92
179.00
57.29
108.82
360.00
138.16
76.78
102.60
1SO.13
53.20
88.41
9.06
•
• lA· ,. ""'- /~ .. - --.! .-•
Oec ..181'1 Feb ~r Apr) M3y ..lily Aug Sep Oct Nov Oec
_ SlN1 • STN2 - 6 S1N3 - )(- STNR
Fig 3.9 Monthly variation of TSS in surface waters
48
54.72
88.36
32.61
41 .94
135.39
72.41
47.63
80.59
63.46
36.03
54.92
7.55

Distributioll a/Nitrogen and Phosphorus in tlu? Water Column
S. •• ONII variltionofTSS 140
120
100
" 80
~80 4. 20
• S1Nl S1N2 STN3 STNR
• Pre·monsoon • Monsoon 0 PosHnonsoon
Fig. 3.10 Seasonal mean variation of TSS In surface waters
The mangrove creek waters receive maximum suspended load through river
run-off during monsoon season. During the present observation, examination of the
residue retained on glass fibre showed that a good deal of suspended solid is fine
sediment. Occasionally. small plant debris material was also observed. Therefore
the variations in TSS concentrations were associated with the amount of fresh
waler inundating the respective creeks. However the significantly high TSS
concentration during pre-monsoon at Station 2 was associated with the dry
conditions. The TSS concentrations in creek waters of Vypeen were found to be
vary between 65mgL" and 96mgL" (Venkatesan, 2001) during monsoon.
A significant difference in TSS concentration among months (p< 0.001) were
recorded (App.5). The LSD at 5% level was found to be 73.49mg l·'. Significantly
higher values were observed in the month of May, November, September and July.
The higher TSS in the month of May, at Station 2 was associated with the dry
condition. Suspended sediments associated with river influx and plant litter may
contribute to the large amount of TSS at the creek waters under study area. In litter
bag experiment. the maximum litter fall recorded during the month of July at
Murikkumpadam and Puthuvypu area (Preetha, 1991). AJ-JOVA did not showed any
significant difference between stations. At the mangrove creek waters, TSS
49

Chapter 3
concentrations showed significant -positive correlations with POC, DIP, TP,PP and
ammonium concentrations (Table 3.2a).
Particulate Organic Carbon (POC)
Particulate organic matter is an extremely important part of the marine food
chain as it provides food for organisms at several trophic levels. The particulate
organic carbon includes chlorophyll, the organic carbon exported from forest and
also fine sediment. The particulate organic carbon concentration occurring in the
euphotic layer is relatively high and variable and can roughly correlated with
phytoplankton activity. It has generally been described that mangrove ecosystems
export a large amount of POC to the adjacent coastal waters and the import and
export of micro-POC is almost in balance at a mangrove creek in northern Australia
(Ayuaki et al., 1998). The POC is derived from two main sources at mangrove
ecosystems. They are macro and micro-POC. Macro- POC includes fallen leaves,
twigs, propagules and so on. The micro-POC consisted of decaying plankton and
mangrove debris. Their behavior is different from that of macro-particulate matter.
Seasonal variations of POC concentrations are given in Table 3.7. At the
mangrove fringed creek waters, rpaximum and minimum concentrations of POC
were recorded at Station 2 which vary between 0.27mgL"1 (pre-monsoon) and
25.52mgL"1 (monsoon). While at Station R, the POC concentration varied from
0.62mgL"1 (post-monsoon) to 12.50mgL"1 (pre-monsoon). Comparatively higher
values of POC were observed during pre-monsoon and lower values, during
monsoon season (Fig. 3.12). The lowest and highest mean values recorded were
5.06mgL"1 (Station 3) and 7.15mgL"1 (Station 1) respectively. At Station R a mean
value of 4.19mgL"1 recorded. Monthly variation in POC concentrations (Fig. 3.11)
showed a similar pattern both at the mangrove fringed creek waters and at reference
Station, except during March and September at Station 2. At all Stations, higher
values were recorded during December and May. Other than these, Station 2
recorded a higher value during September and Station R, during March.
50

Distribution 0/ Nitrog~ and Phosphor1lS in tM W4Itn Coltmln
Table 3.7 Seasonal variation of POC(mgL·1} In surface wate,..
Station 1
Pre-monsoon
Monsoon
Post·monsoon
Pre-monsoon
2.39
2.08
1.87
0.27
1.67
18.75
18.75
23.47
8 .45
25.52
9.24
2.85
8 .06
6.12
5.35
High POC values in mangrove waters may be due to mangroves and terrestrial detritus present in the suspended rrfatter. The maximum POC value was obtained during pre-monsoon at Station 1 and at reference station while minimum
was obsefved during monsoon is in agreement with observation of (Rajendran and
Kathlresan, 1999) Pichavram mangrove waters. The POC concentration In surface
waters of Pichavaram mangrove area (south east India) were found to be 21 .3,
33.8, 7.9, and 6~g C 1'1 In summer, pre monsoon, monsoon and post monsoon.
The export of carbon via micro and macro particulate matter amounts to about 11 .5 Kg C ha·l day·l in a Northern Australian mangrove system (Boto and Bunt, 1981).
A lower mean value of POC recorded at Station R.
51
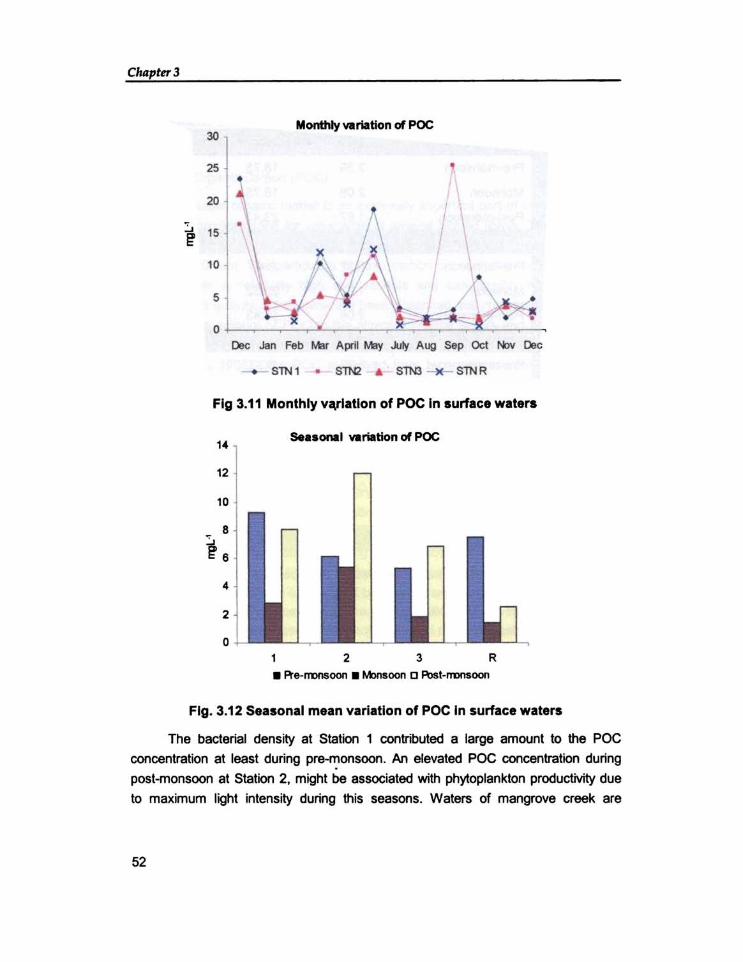
CluJpter 3
30
25
20
1 1S
10
Monthty variation ~ POC
•
O&c Jan Feb f.ler Aprit ~ .lAy Aug Sap Oct Nov Oec
_ SlN 1 • SThQ: • SlN3 - )(- SlN R
Fig 3.11 Monthly va,rtatlon of POC In surface waters
,. Se •• OMI variation ~ POC
12
10
" . 1 •
• 2
o 2 3 R
• Pl'"e-rmnsoon • Monsoon [] R>st-rroosoon
Fig. 3.12 Seasonal mean variation of POC In surface waters
The bacterial density at Station 1 contributed a large amount to the POC
concentration at least during pre-monsooo. All elevated POC concentration during
post-monsoon at Station 2. might be associated with phytoplankton productivity due
to maximum light intensity during this seasons. Waters of mangrove creek are
52

Distribution of Nitrogen and PIlOsphorus in the Water Column
generally turbid because they are shallow regions and subjected to action of tides,
and waves (Jagtap, 1987). Hence fine sediment also contributes to the poe concentration. Comparatively higher POC values at Station 2 during monsoon may
be associated with the presence of fine sediment along with the particulate matter.
Therefore the present observation indicated bacterial density, phytoplankton
productivity as well as the presence of fine sediment in particulate matter resulted in
an elevated concentration of POC in mangrove creek waters. The correlation
analysis showed a significant positive relationship with dissolved organic phosphate
and particulate phosphate in mangrove fringed creek waters (Table 3.2a).
The POC concentrations showed a significant difference between months at
(p< 0.05) (App. 6). The LSD at 5%level was found to be 4.134rngL". Significantly
higher values were ob;erved in the month of May, followed by March and April. The
remarkably high concentration during May was due to dry condition at Station 2.
3.2.2 Distribution of dissolved inorganic forms of nitrogen
The most important dissolved inorganic nitrogen species comprises nitrite,
nitrate and ammonia. Concentrations of dissolved inorganic nitrogen species are low
in tropical mangrove waters, (within the ~molar range) and are dominated by
ammonium with usually low concentration of nitrate and nitrite (Alongi et al., 1992).
Variations in concentrations among estuaries and mangrove water ways can be
ascribed to differences in the extent of fresh water and ground water input, sun light,
oxygen availability and standing stokes and productivity of phytoplankton and
b.:::cterio plankton. By virtue of wide range of oxidation states - 3 for ammonia to + 5
for nitrate nitrogen can serve as a reductant or an oxidant in the diagenesis of
organic matter in addition to its role as a nutrient in microbial and plant assemblages.
Nitrate nitrogen (nitrate-N)
Seasonal variations in nitrate-N at mangrove fringed creek waters and at
Station R, are depicted in Table 3.8. At the mangrove creek waters, nitrate-N
concentrations vary between 0.01 ~moIL" at Station 2 (pre-monsoon) and
5.18IJmoIL·\ at Station 3 (pre-monsoon~. At Station R, nitrate-N concentrations
ranged between 1.83~moIL"(pre-monsoon) and 23.99~moIL"(monsoon). The
annual mean values showed almost similar concentrations of nitrate-N at three
mangrove-fringed creeks with a minimum at Station 1 (1.82~moIL") and maximum
53

Chapter 3
at Station 3 (1.97IJmoIL·'). However remarkably higher mean concentration of
nitrate-N was recorded at Station R (7.74IJmoIL·\
Monthly variations of nitrate-N are depicted in Fig. 3.13. Station R recorded
higher values during all months, and exceptionally higher value recorded during the
month of July. Regarding the mangrove-fringed creeks, the nitrate-N
concentrations recorded were comparatively low, however higher values were
observed during July.
Table 3.8 Seasonal variation of nitrate-N (J.1moIL·') in surface waters
Stations Season Min Max Mean
Pre-monsoon 0.44 3.18 1.68 I ;:-1 Station 1 Monsoon 0.93 3.98 2.23
~
I Post-monsoon 0.08 5.02 1.67
Annual mean 1.82
Pre-monsoon 1.17 3.43 1.87
Station 2 Monsoon 1.28 3.98 2.32
Post-monsoon 0.01 4.16 1.72
Annual mean 1.92
Pre-monsoon 0.49 5.18 3.34
Station 3 Monsoon 0.98 4.60 2.39
Post - monsoon 0.10 3.89 1.70
Annual mean 1.97 . <
Pre-monsoon 1.83 11.66 6.74
Station R Monsaon 4.60 23.99 i2.85
Post - monsoon 2.85 7.05 4.48
Annual mean 7.74
54

Distribution of Nitrogm and PhO$phontS in the Water Column
Monthly Yllrilltlon at nitrate ~ 2.
20
.,- 15
i'0 .1\ 5 -1
O ~~~~~J'~~!:~ __ ~~~ ___ Oec Jan Feb Mar April Mly July Aug Sep Oct IItlv Oec
- _ STN1 --- STN2 .. STN3 - M- $ThR
Fig 3.13 Monthly variation of nitrate in surface waters
,. 12
10
:, 8
~ . • 2
o 2 3 R
S1don _ Pl'e-lTDnSoon _ M>nSOOfI IJ Flbst-mJOSoon
Fig. 3.14 Se .. onal me.n varl.tlon of nitrate In surface waters
Nitrate-N concentrations in surface waters showed seasonal variations at
mangrove stations as well as at Station R (Fig. 3.14). The highest values being
recorded during monsoon followed by pre-monsoon season. Maximum value of
nitf'ate.N was recorded during monsoon at Station 1 and at Station 2. Minimum value
was observed during post monsoon at all stations. A similar trend was reported in
55

Chapter 3
Cochin estuarine waters by Sarala Devi et al. (1991). The concentration of nitrate in
mangrove region of Cochin estuary was found to vary from 2.72 ~mol L-1 to 7.41~mol L-1 (Sheeba et al., 1996). The source of higher concentration of this element in the
estuary and mangroves was by replenishment during monsoon season. A similar
pattem of distribution was observed at the mangroves creeks during the present
investigation. Lowest concentration is generally recorded during the post monsoon
season, coincide with the high rate of primary productivity (Sarala Devi et al., 1991).
The maximum nitrate concentration was recorded during pre monsoon at Station 3.
ANOVA of the nitrate nitrogen showed a significant difference between stations
at (p<O.01) (App.7). The LSD at 5% level for stations is 3.212. Station R showed
significantly higher nitrate nitrogen than at Station 1, Station 2 and Station 3. But there
is no significant difference between Station 1, Station 2 and Station 3. These results
showed that all three mangrove stations were experiencing lower concentration of
nitrate nitrogen. The lower concentration might be due to the uptake by plants. Uptake
by trees and microorganisms, and by sorption on to the sediment matrix considerably
reduces nutrient concentrations in pore water, which can make a mangrove forest to
an effective sink for nutrients (AIongi, 1996). Concentrations of nitrate in mangrove
creek water were found to be correlated with pH values (Table 3.2a).
Nitrite nitrogen (Nitrite- N)
Nitrite-N concentrations exhibited a similar trend as that of nitrate-N
concentrations, with higher values recorded at Station R than the mangrove fringed
creek waters. Seasonal variations of nitrite-N are depicted in Table 3.9. Nitrite-N
concentration varied between O.03~moIL-l at Station 3 (pre-monsoon) and
1.11 ~moIL-l at Station 1 (monsoon) in the mangrove-fringed creeks. However at
Station R nitrite-N concentration ranged from O.39~moIL-l (monsoon) to 1.30~moIL-l (pre-monsoon). The annual mean values of nitrite-N recorded the lowest at Station 3
(O.23~moIL-l) and highest concentration of at Station 1 (O.58~moIL-l). While Station
R recorded an annual mean value of O.82~moIL-l. Temporal variations in nitrite-N
concentration are given in Fig. 3.15. Similar to nitrate-N concentrations, relatively
higher values were recorded for nitrite-N. The mangrove creek waters showed higher
values during July at Station 1, December and August at Station 2 and February at
Station 3. Station R showed higher values during March, May, July and September.
56

Chapter 3
Tabl. 3.9 Seasonal variation of nltrlte~ bunoIL·') In surface waters
Pre-monsoon 0.10 0.83 0.47
Station 1 Monsoon 0.32 1.11 0.69
Post-monsoon 0.09 0.85 0.58
Pre-monsoon 0.29 0.34 0.31
0.18 0.16
0.48 0.24
1.30 1.09
1.18 0.86
Nitrite occurs in aquatic system as an intermediate compound in the
microbial reduction of nitrate or in the oxidation of ammonia. It also comes into the
water when phytoplanktons are fed luxuriantly by nitrate and phosphate. Seasonal variations of nitrite concentrations observed at Station R as well as in mangrove
creek waters. A general trend of nitrite nitrogen distribution showed minimum
values during pre-monsoon at Station 1 and Station 2 (Fig. 3.16). The maximum
value recorded at Station 1 during monsoon may be due to the bacterial activity In surface water. It was found that anoxic conditions results in high nitrite
concentration together with low lev~s of dissolved oxygen (Grasshoeff et s/ .•
1983). The comparatively higher values of nitrite found at Station R, might be due
to the impact of industrial effluents in the es~uary. Nitrite concentration increases
from pre-monsoon to monsoon at Station 1 and Station 2. The maximum
concentration was recorded during pre-monsoon at Station 3, gave an indication of
enhanced bacterial activity during this season.
57

Distribution 0/ Nitrogtn ttrld Phosphorus in /he Wall'r Column
Monthly VI rtlUon of nitrite I .' 1.2
.-" x
1.0 1\ 0.8 •
'-'
" • E 0.6 • ~ -'t
0.' • • • • • • 02 • • --" • • • • 't
0.0 Doe Jon ,... Mo, Mo, JJ~ Aug Sop Clot """ Doe
- STN 1 --- STN 2 - . STN 3 - 11- STNR
Fig 3.15 Monthly varl.Uon of nitrite In turfaee waters
1.2 Se •• onal Vlrlation of nltrtt,
1.0
0.8
;, ~ 0.6
0.'
0.2
0.0 1 2 3 R
• A-.rronsoon • Moosoon c R>sHrol"lsoon
Fig. 3.16 Seasonal mean vartatlon of nitrite In t urfaee waters
ANOVA of the nitrite nitrogen showed a signifICant difference between
stations at (p<0.01) (App.8) The LSD at 5% level for stations is 0.2489. Station R
showed significantly higher nitrite ~itrogen followed by Station 1, while no seasonal
variation was observed. No signifteant correlation was observed with any other
58

Distribution o/Nitrogen Md Phosphorus irl the Water Column
Ammonium Nitrogen (Ammonium-N)
The seasonal variations of ammonium-N are given In Table 3.10. At the
mangrove creek waters the ammonlum-N concentration ranged between
2.84lJmoll-' at Station 1 (post-monsoon) and 92. 121.1mOll·1 Station 2
(pre-monsoon). While at Station R ammonium nitrogen varied between 1.69I.1mOll-1
and 24.27I.1moll-1. The annual mean values of ammonla-N recorded a minimum of
11 .54l.1moll-' at Station 3 and a maximum of 32,90l.Imoll-' at Station 2, Mean
concentration of 14.11I.1moll·' was recorded at Station R (Table 3.10). Monthly
variations of ammonium-N concentration are given In F~. 3.17. Generally higher
ammonium-N concentrations were recorded at Station 1 and Station 2. All
mangrove-fringed creek waters showed higher values during the month of August.
However several other higher values were also observed at Station 2 during April.
May and July. At Station 3, another high value observed during April. Ammonium-N
at Station R recorded peaks during August and October.
iT='b~I~'~3~.1~O~Se::.~.o~n~'~I~v~.~rl~m~lo~n~~~.~m~m~on~lu~m~~~~~ln~'~U~dacew •• n~~~ Pre-monsoon 9.81 15.80 12.24
$lation 1 Monsoon 29.92 13.96
Ammonium was the major dissoWed Inorganic nitrogen species at three of
the mangrove--fringed creeks as well as at the reference station. No significant
59

Chllpter3
seasonal pattern of distribution was found at these stations (Fig. 3.18). Ammonium
enters the water column mainly by excretion of grazers as well as mineralisation
processes. During monsoon maximum concentration of ammonium was observed
at Station 1(13.96 J,lmol L·l ) . The maximum ammonium concentration was recorded
in the month of August at all stations. The .high value of ammonium nitrogen during
monsoon might be due to the heavy fresh water discharge. The ammonium
concentration at Station 3 also attained maximum concentration during pre
monsoon (15.09IJmol L-'), followed by monsoon and post monsoon_
60
'00 90
80
70 eo
~50 .. 30
20
'0 0
MonthJyVllrilotion of ammDr'lUn~
•
.~ .,
• • DIe Jan Feb Mlr Apr Mily .Ail Aug Sep Oct New Dec
_ SlN 1 • SlN2 • SlN3 - )(- STNR
Fig 3.17 Monthly variation of ammonlum-N In surface waters
60
50
4. " 30
120 '0
o
S.aaONllwriation of .mmonium~
2 3 R S<ationo
• Fh-rmnIoon • M:;msoon [] FIOst-rmnsoon
Fig. 3.18 Seasonal mean variation of ammonlum-N In surface waters

Distribution 0/ Nitrogen and Phosphorus in the Water Column
Remarkably high ammonium-N concentrations were recorded at Station 2
during pre-monsoon and monsoon (Fig. 3.18) may be due to local regeneration.
The ammonium concentration at Station 3 also attained maximum concentration
during pre monsoon (15.09~mol L·l) followed by monsoon and post monsoon.
The lower value encountered during post-monsoon may be due to utilization
by grazers (Nair et al., 1988). Bottom sediments represent important sources of
ammonium and phosphate in the water column, especially in summer (Rizzo,
1990). Ammonium immobilization and assimilation were mainly by microbes
(bacteria and fungi) and plants, always accompanies and counteracts the
mineralisation process. The extent to which these processes balance each other is
highly dependent on the C:N ratio of the decomposing organic matter. Substances
rich in nitrogen (Iow C:N) favour net mineralisation, where as those poor in nitrogen
(high C:N) favour net immobilization (Boto, 1982). The high concentration of
ammonium in dissolved phase in mangrove-fringed waters indicated the net
mineralisation of organic matter in this area
ANOVA of the ammonia-N concentrations showed a significant difference
between stations at p<O.01 (App.9). The LSD at 5% level for stations is 13.695.
There is Significantly higher concentration of ammonia nitrogen at Station 2. There
is no significant difference between Station 1, Station 3 and Station R. The
correlation analysis of ammonium with other parameters showed significant
positive correlation with TSS, DIP, PP and TP. However the dissolved ammonium
also found to be negatively correlated with dissolved oxygen (Table 3.2).
3.2.3 Nitrogen: Phosphorus ratio (NIP)
Measurements of dissolved inorganic nitrogen (DIN, nitrate, nitrite and
ammonia) and dissolved inorganic phosphate (DIP, orthophosphate) provide the
biologically available forms of nitrogen and phosphorus. The ratio of dissolved
inorganic nitrogen and dissolved inorganic phosphate (DIN : DIP) can be used to
assess the nutrient status. The Redfield ratio is commonly used to assess the
major nutrient demand for production of phytoplankton biomass (Redfield et al.,
1963). Redfield found that the proportions of C : N : Si : P in marine particulate
matter are 106 : 16 : 16 : 1 (by atoms). Nitrogen and phosphorus are assimiiated
from seawater in an approximately constant proportion of 16: 1 (by atoms) by
phytoplankton as they grow. Thus, N : r ratios> 16 : 1 are considered to reflect an
61

I
Chapter 3
excess of nitrogen, indicating that phosphorus is limiting for algal growth, and ratios
< 16 : 1 are considered to reflect an excess of P, indicating that N is limiting.
However the outcome of the sewage, rivers, industrial and drainage effluents into
the marine ecosystem is likely to influence organic and inorganic nutrient
concentration as well as their ratios are consequently affecting the primary
production level. It was reported that the large input of organic carbon to the
sediments seems to create a reducing environment in a highly productive Spartina
salt marsh, resulted in removal of nitrate in water column by denitrifying bacteria. At
the same time, phosphorus is remobilised in the anoxic pore waters, which may put
into the overlying water by diffusion accounted for a low NIP ratio in coastal waters
(Nixon, 1980).
Table 3.11 Seasonal variation of N:P ratio in surlace waters
Stations Season Min Max Mean~ ",
Pre-monsoon 0.51 3.19 1.69
Station 1 Monsoon 0.10 0.97 0.45
Post-monsoon 0.30 3.21 1.68
Annual mean 1.38
Pre-monsoon 0.68 1.19 1.00
Station 2 Monsoon 0.61 5.76 3.50
Post-monsoon 0.97 2.50 1.61
Annual mean 1.88
Pre"monsoon 1.28 7.21 3.88
Station 3 Monsoon 1.28 11.77 7.10
Post - monsoon 3.78 9.22 6.32
Annual mean 5.70
Pre-monsoon 1.93 6.47 4.15
Station R Monsoon 3.45 9.13 6.00
Post - monsoon 2.93 4.17 3.40
Annual mean 4.48
Monthly variations of NIP ratio are given in Fig. 3.19. Station 1 recorded
higher ratios during January and February. At Station 2 higher ratio was found
durinl:l .Juiy and Jo\ugust. Station 3 and Station R. showed higher ratio during the
month of September. Seasonal variations of NIP ratio are given in Table 3.11. The
ratios ranged from 0.10 at Station 1 (monsoon) to 11.77 at Station 3 (monsoon) in
62

Distribution o/Nitrogtn and Phosp/lorus in the Water Column
mangrove-fringed creeks. At Station R. these ratios ranged between 1.93 and 9.13.
The mean annual ratios recorded a minimum ratio of 1.38 (Station 1) and a
maximum ralio of 5.70 (Station 3).
14
12
• 7
6
5
• 3
2
o
Monthly variation of N:P ratio
•
Oec ..Ian Feb Mar Apr May JuI Aug Sep Oct !ItN Dec
SlN 1 • SlN 2 ....... - S1N 3 -)(- STN R
Flgur. 3.19 Monthly variation of N:P ratio
Sea.onaf variation of N:P ratio
2 ....... 3 R
• Fte-rronsoon • Monaoon 0 R:Mst-rronsoon
Figure 3.20 Seasonal mun variation of N:P ratio
63

ChRpter3
The N:P ratio at Station 1 was influenced both by the concentrations of
nitrogen as well as phosphorus. The minimum NIP recorded during July,
characterized with low N and high P. The maximum was observed during
December and January with comparatively low concentration of P. The ratio found
in the present study was less than that of Redfield ratio, suggesting excess
phosphorus relative to nitrogen. NIP ratio was found to vary from 26:1 to 58:1 in a
tidally dominated mangrove creek in north Queensland, Australia and concluded
that the result was due to the presence of excess nitrogen relative to phosphorus in
water column (Trott and Alongi, 1999).
N:P ratios showed marked seasonal variations at all Stations. Higher ratios
were observed during monsoon at all Stations except at Station 1, where minimum
ratio observed during this season (Fig. 3.20). Station 2 and Station 3 recorded
minimum values during pre-mon~oon. However at Station R, NIP ratio found
minimum during post-monsoon. The NIP ratios observed at Station 2 was found
influenced by the concentration of N. The maximum NIP, 5.76 were reached during
July followed by August. These months were characterized by heavy monsoon and
associated with an input of ammonium compounds through land runoff. NIP ratio
varied from 1.28 during May to 11.77 during September at Station 3, the low ratio
found during May, may be due to high concentration of phosphorus.
The marine algae are considered to be phosphorus limited when the NIP ratio
is >6 and nitrogen limited when the ratio is > 4.5. The two nutrients are near the
optimal assimilative proportion in the range 4.5 to 6. According to this observation, it
may be concluded that Station 1 and Staion 2 are severely nitrogen limited while this
ratio was found as assimilative proportion at Station 3.
A comparative study of NIP ratio in three ecosystems in south India : Ennore
creek, Adayar estuary and Pichavaram mangrove waters (Purvaja and Ramesh,
2000) found that the Red field ratio in these syatems varied from 0.96 N: 1 P at
Ennore creek, 1.75 N: 1 P at Adayar estuary to 15.2 N: 1 P at Pichavaram
mangroves. This observation led them to suggest that Pichavaram mangrove
represents a well equilibrated ecosystem with N: P ratio close to steady state
values in contrast to anthropogenically altered mangrove ecosystem of Ennore
creek and Adayar estuary. It was also reported, at Gorai creek in Mumbai, an
anthropogenically influenced creek, the N: P ratios of varied widely from 2.3 to 13.9
(Ram and Zingde, 2000). The coastal waters of eastern Brazilian shelf showed an
64

Distribution o/Nitrogen a"d Phosphorus in the Water Colu,""
N:P ratio of the order of 5:1, and these waters found to be limited of primary
production by nitrogen. (Ovalle et al., 1999). The above ratios suggest that the
mangrove-fringed creeks of Cochin estuary represent an anthropogenically altered
mangrove ecosystem. The reduction of nitrogen input without a proportional
reduction in phosphorus, creates low NIP ratio, which favours nitrogen fixing
nuisance algae, without any reduction in algal biomass.
3.2.4 Phosphorus Forms In Water Column
Phosphorus is one of the key elements affecting ecosystem productivity and
perhaps the key nutrient in most aquatic systems. There are many distinct pools of
phosphorus in aquatic systems. Routine analytical measurements commonly
distinguish three forms in the water column: soluble reactive phosphorus (DIP)
dissolved organic phosphorus (OOP), and particulate phosphorus (PP).
DIP is closely identified with orthophosphate (H2P04-, HPO/-) and with
negligible amounts of P043- or H3P04• In addition phosphoric acid can undergo
condensation to form dipoly acids as anions of pyrophosphoric acid, H4P20 7, or as
anions of polymetaphosphoric acid (HP03)n - linear polymers, where n is 3-70 per
chain. Since polyphosphates are not readily hydrolysed to orthophosphate ions,
using the conditions of a standard method. Thus polyphosphates are not
separately quantified during the present analysis. Typically the polyphosphate
would appear as part of total phosphorus or as organic phosphorus and the
amount of polyphosphate could be regarded as a useful index of pollution.
DOP fraction is still poorly characterized, but it is thought to be diverse in
terms of structure and size (ranging from simple organic phosphate compounds to
macromolecules in the colloidal size range), bioavailibility to aquatic
microorganisms (bacteria and algae), and lability towards hydrolysis. Lean (1973)
demonstrated that uptake of DIP by aquatic bacteria and algae results in rapid
formation of small amount of labile low molecular weight OOP compound, which
subsequently become associated with a high molecular weight colloid. The latter
material was thought to represent the majority of nonparticulate P in water. Minear
(1972) found that up to 20% of the OOP recovered from algal cultures and lake
water was high molecular weight material consistiilg primarily of Di~A fragments.
65

Cllapter3
The particulate phosphorus (PP) fraction in lakes is even more heterogeneous
than the DOP fraction. PP may include inorganic forms, e.g. phosphate sorbed on to
clay suspended in the water and suspended precipitates of phosphates with such
cations as Ca, AI and Fe. The PP fraction is also comprised of organic forms: detrital
phosphorus from dead and decomposing cells, bacteria (freeliving and attached to
detritus), phytoplankton and various zooplankton classes.
Several physical and biological processes affect the concentration of
phosphorus in marine waters. The physical processes include precipitation and
adsorption of soluble phosphate compounds. DIP is readily available to aquatic
organisms and therefore consumed first in many situations. OrganiC forms require
enzymatic activity, provided by phosphatase. Phosphorus bound in recalcit~flt
organic matrices within particles may possibly re~ ist enzymatic extraction and remain
unavailable. Sorbed phosphorus and polyphosphates can become available quite
readily. Calcium and iron bound phosphorus may become available under the right
physical, chemical and biological conditions. Microbial activity in sediments can also
affect the dissolved phosphate levels in shallow estuarine systems.
Regeneration of phosphate from anaerobic sediments, takes place due to
the fact that reduced phosphate salts are more soluble. In organic rich coastal
sediments, there is significant diffusion of phosphate out of reduced sediments to
the overlying water. Regeneration of phosphate by sediments is thus important in
coastal waters. The above discussion suggests that the concentration of
phosphate in water and sediments is determined by biological activity. Therefore,
the oxygen uptake by organisms in water is well correlated to phosphorus
concentrations (Stumm and Morgan, 1981), since nutrients are released during
aeorobic respiration of organic matter. All the dissimilative reactions result in
regeneration of phosphorus.
Concentrations of dissolved inorganic phosphorus in mangrove waters are
as low as IJ molar range. Values in unpolluted mangrove water ways range from
<0.1 to -20 jJmol. Diphosphoric acid and all polyphosphoric acid may also be
present due to poilution of detergents in the coastal waters. Differences in
concentrations among mangrove estuaries can be ascribed to local characteristics,
stlch as the extent of fresh water and ground water input, and probably productivity
of the biota. Lowest dissolved phosphorus concentration is usually coincident with
dry periods as primary production is the highest.
66

Distribution o/Nitrogen '11Id Phosphonls ill ti,e Water COIUIII1I
The dissolved phosphorus is taken up by phytoplankton in the creek waters
and thus enters the food chain in sea. After death and decay of organisms and
plants a proportion of this phosphorus is returned to the water. The higher DIP
concentration in eastern Brazilian shelf suggests a benthic nutrient regeneration
(Millera, 1996). The earlier studies on nutrient status of Cochin estuary concluded
that one of the major factors governing the distribution of nutrients may be
variations in the regen~rative property of the bottom mud rich in organic matter due
to biological and chemical oxidation (Nair et al., 1988; Sarala Devi et al .. 1991).
The relative difference in phosphorus availability is ultimately a function of the
abiotic controls of phosphorus sorption characteristics of the sediments
(Sundereshwar and Morris, 1999).
Thus quantification of DIP, DOP and PP in water column, may generate
some information on the major processes controlling phosphorus cycling in this
aquatic system.
Dissolved inorganic phosphate (DIP)
In the creek waters, which are fringed by mangroves, showed a large
variation in DIP concentration, where the values ranged between 0.40IJmOI l·' at
Station 3 (post-monsoon) and 32.06lJmol l-' at Station 1 (monsoon) (Table 3.12).
Maximum DIP concentrations were recorded during pre-monsoon at all Stations,
except at Station 1, which exhibited maximum concentration during monsoon
season. Minimum concentration in DIP, were recorded during post-monsoon at all
Stations except Station R, where minimum recorded during monsoon. The annual
mean values of DIP showed a variation from 1.51IJmoll·1 (Station 3) to 10.701Jmol
L·' (Station 2). Station R recorded an annual mean value of 2.071Jmol l-' (Table
3.12). Monthly variations in DIP concentrations are given in Fig. 3.21. Significantly
hiQh values were obtained at Station 1 and Station 2 during the months of July and
May respectively. Higher values were also found during the months of April, May,
August, September and October at Station 1. However at Station 2, higher values
were recorded during the months of April, September and October. Station 3 and
Station R, recorded highest values during April and March respectively. Higher
values were also found during the months of May and July at Station 3 while at
Station R, higher values were recorded during July, August and October.
Comparatively low values were recorded during post-monsoon at all Stations.
67

Choptn3
Table 3.12 Seasonal variation of DIP hunoIL-1) In surface waters
Stations Season
Pre-monsoon 2.18 13.40 7.73
Station 1 Monsoon 12.80 32.06 20.34
Post-monsoon 2.61 11 .30 5.00
Annual mean
Pre-monsoon 6.58 35.9 16.345
Station 2 Monsoon 5.67 18.97 10.7
Post-monsoon 3.85 14.00 6.174
Annual mean
Pre-mon::.oon 1.40 4.28 2.48
Station 3 Monsoen 0.48 2.64 1.52
Post - monsoon 0.40 1.20 0.74
Annual mean
Pre-monsoon 1.16 4.01 2.39
Station R Monsoen 0.60 2.23 1.65
Post - monsoon 1.28 3.45 2.07
Annual mean
Remarkably higher concentration of DIP was found during monsoonr st
Station 1 (Fig. 3.22). High influx of river water during monsoon season into the
estuary causes the desorption of dissolved phosphorus from Fe (OOH) minerals.
into the water column. A large amount of surface runoff into the creek also resulted
in remarkably higher concentration of DIP during monsoon season. Bestdes. as the
shore of this creek is used and inhabited by people the anthropogenic input in to
the water is higher. Species composition. bloom formation and production of
diatoms were comparatively low during monsoon due to high rate of seaward
flushing and poor light conditions (Kannan and Krishnamurthy. 1985). The
decrease in DIP concentration during post-monsoon at Station 1 might be
attributed to the increase in productivity during this season. The gradual increase in
salinity during this post-monsoon season may also leads to increase in number oi
cations present in brackish water. which forms an insoluble calcium phosphate thus
decreasing water-soluble phosphorus.
68

Distribution olNifTogm and PhosphOTUS in tM Watn-Column
Monthly variation of [JP
35
30
25 / , 20
t 15 • • 10
• 5 ~ •
0 * Oec Jan Feb Mlr Apt MIy ..... 1 Aug Sep Det t-t.v Oec
- .-SlN 1 ---- SlN 2 ... SIN 3 -k- SIN R
Fig 3.21 Monthly variation of DIP In aurface wate'"
20 ,. 16
" 12 1 1~ • • 2 o
s..sOnII .".,.tion cl [JP
2 3 R
_ Pte-rronsoon _ M>nsoon c R:lst·rmnsoon
Fig. 3.22 Seasonal mean variation of DIP In surface wate ...
The DIP concentration at Station 1 and Station 2 varied from 2.18jJmoll·' to
13.40jJmol L" and 6.58jJmol l" and 3S.9jJmol l " respectively during prEHTlonsoon
(Table 3.12). The microbially mediated benthic remineralisation of debris is another
major recycling pathway and it can supply a significant fraction to the ovef1ying water
69

Chapter 3
during pre- monsoon. The laboratory studies on role of bacteria in nutrient exchange
(Kairesalo et al., 1995) found that live sediment bacteria lowered the net retention of
P04-P. Based on the observation of Tezuka (1990), the C:N:P ratio of the substrate
determine whether inorganic phosphates or ammonium were released into the water
column. The comparison of inorganic phosphate in overlying water, interface water
and bottom water showed a high inorganic phosphate concentration in interface
water during all months except during November to January (Sarala Devi et al.,
1991). The mangrove areas at Cochin were reported to show higher concentration of
phosphate, varied between 14.29~mol L-1 to 18.97~mol L-1 (Sheeba et al., 1996).
Similar observations were found at Gorai creek in Mumbai, where creek water
showed significantly higher DIP concentration (5-15 ~mol L-1) than the open shore
waters, (1-4~mol L-1) (Ram and Zingde, 2000).
Station 2 exhibited maximum DIP concentration during pre-monsoon, followed
by monsoon and post-monsoon. The high concentration of dissolved inorganic
phosphate during pre-monsoon may be as a result of the evapotranspiration. During
pre-monsoon due to low fresh water discharge into the creek and with high rate of
evaporation, the upper reaches of mangrove creek become completely isolated from
the near shore zone. This phenomenon occurs if the water acquires salinity greater
than that of the seawater. The greater salinity was acquired because of evaporation
over the creek. (Wolanski et al., 1989). A Significantly higher salinity was also
observed in this creek water during pre-monsoon. The significantly higher values of
DIP at Station 1 and Station 2 suggest that ground water is also, probably an
important source of phosphorus in mangrove areas.
The maximum concentration of dissolved inorganic phosphate was registered
at Station 2 during the months of May followed by September. The station
experienced almost dry conditions at the creek due to the formation of a bund at the
mouth of the creek, during May and September, to supply water for an aquaculture
pond resulted in no tidal flushing. The sediment collected during these months had
the smell of hydrogen sulphide indicating the prevalence of anoxic conditions within
the sediments. This anoxic conditions facilitate desorption of phosphate from the
sediments to the overlying water which in tum increases the DIP concentration in
creek water. The omission of these anomalous values for the calculation of the
seasonal averages, the DIP concentrations found were 9.83 ~moIL-1, 6.58 ~moIL-1
and 6.17 ~moIL-1 during pre-monsoon, monsoon and post-monsoon respectively.
70

Distribution of Nitrogen and Phosphorus ill the Water Columll
The maximum DIP concentration was observed in pre-monsoon. followed by
monsoon and post monsoon at Station 3 (Fig. 3.22). The benthic microbial action
increases the nutrients concentration during pre-monsoon. which are diluted during
the southwest monsoon. Lowest concentration during post-m on soon might be
attributed to the maximum uptake by organisms followed by maximum production.
Station 3 was found to be an open system, in which tidal flushing takes place
regularly. hence nutrient concentrations were comparable with Station R.
Seasonal variations of DIP concentration at mangrove locations may be
under the influence of microbial activity. Remarkably higher concentrations of DIP
at Station 1 and Station 2 compared to Station 3 may also be attributed to their
geographical position. Station 1 adjacent to an inhabited area may be under the
influence of untreated sewage. which influence the concentration of DIP. Station 2
experiencing evapotranspiration (Wolanski. 1989) during pre-monsoon. resulted in
higher salinity and elevated concentration in DIP. Also due to the low tidal regime
at the creeks at Station 1 and Station 2 reduce the transport of accumulated
organic matter in the creek. This in turn enhance bacterial activity, which may
reduce oxygen concentrations in sediment water interface in turn a reduced iron
minerals release inorganic phosphate to the water column. The relationship
between seasonal pattern of phosphate in water and flux of phosphate from
sediments is an evidence for the regeneration of benthic phosphate affects water
column concentrations (Nixon. 1980).
The DIP concentrations of mangrove fringed creek waters recorded positive
correlations with concentrations of TSS, PP and TP (p< 0.0, p<0.001) (Table 3.2a).
DIP concentrations recorded positive correlation with dissolved ammonium-N
concentrations at all Stations (p<0.0.05, p<0.01) (Table 3.2a. 3.2b). ANOVA of DIP
showed that a significant difference exists between stations (p<0.05) (App.11). The
LSD at 5% level for stations is 5.8~moIL·1. Significantly higher inorganic phosphate
was noticed at Station 1 and Station 2 as compared to Station 3 and Station R. No
significant difference between either Station 1 and Station 2 or between Station 3
and Station R were recorded.
Dissolved Organic phosphate (OOP).
Phosphorus occurs in all living organisms in the form of organic compounds.
As a result of decay and decomposition it is liberated into water as dissolved
71

CJz(lpter3
substances. which on oxidation presumably by bacterial action. is released as
phosphates in ionic form (Redfield et al .• 1963). The dissolved organic phosphorus
pool has been indicated as a potentially important source of phosphorus for
phytoplankton (Riley and Chester. 1971). In the process of regeneration,
particulate phosphorus from the algal cells and detritus (including animal matter) is
oxidized into inorganic phosphate. The intermediate stage during the process is
dissolved organic phosphate. The organic phosphates include nucleic acid
material. phospholipids, and many decomposition products. A little of the organic
phosphorus material is present as enzyme hydrolysable phosphate esters.
Table 3.13 Seasonal variation of DOP (~moIL" ) In surface waters
Stations Season Mln Max Mean ,;. Pre-monsool. 2.26 11.96 7.02 -
Station 1 Monsoon 0.50 1.08 1.08 Post-monsoon 0.67 10.95 3.21 Annual mean 4.16 Pre-monsoon 1.19 5.15 5.15
Stallon 2 Monsoon 0.49 4.99 2.99 Post-monsoon 0.82 8.69 4.32 Annual mean 3,24 Pre-monsoon 0,01 2.15 0.75
Station 3 Monsoon 0.62 1.33 0.92 Post - monsoon 0.08 2.74 1.30 Annual mean 1.02 Pre-monsoon 0.13 3.23 1.68
Station R Monsoon 0.40 2.50 1.46 Post - monsoon 0.07 2.45 2.24 Annual mean 1.29
Monthly variation in DOP concentrations are depicted in Fig. 3.23. Generally
higher values were recorded during April , May and October at Station 1. Station 2,
and Station 3. However Station R showed higher values during February, August.
November and December. The seasonal variations in DOP are given in Table3.13.
The OOP concenlration recorded a variation from O.Ol ~moIL· l at Station 3
(pre-monsoon) 10 11 .96IJmoIL" at Station 1 (post-monsoon) at the mangrove
fringed creek waters. large variations in OOP concentrations were found at Station
1 and Station 2. Minimum concentrations at these Stations were O.67IJmoIL"
72

Distn'bution o/Nitrogen IInd Phosphorus in the Watereolu",,,
(post-monsoon) and 0.49~moIL·l (monsoon) respectively. Maximum concentrations
recorded were 11 .96IJmolL-1(pre-monsoon) and 8.69 IJmoIL·1(post-monsoon).
However at Station 3, OOP concentrations showed a variation from 0.01IJmoIL-1
(pre-monsoon) to 2.74IJmoIL·1 (post-monsoon). However minimum and maximum
concentrations were recorded during pre-monsoon at Station R were 0.13 IJmol l -1
and 3.23IJmoIL-1 respectively.
" ~
Monthly ~,ition of DOP ,. 12
• ,. 8 •
~ •
~~ • • • • •
2 ~ •
Oec Jan Fi!b Mlr All' J.lsy Jut Aug Sep Det New Dec
SlN1 • SlN2 -.- SlN3 - SlNR
Fig 3.23 Monthly variation of OOP In surface waters
• 7
• 5
1: 2
1
•
S. .. onaIVllr1ation 01 OOP
2 stations 3 R
• Ae--rronsoon _ Mlnaoon 0 Fbst-rronsoon
Fig. 3.24 Sea.onal mean variation of OOP in surface waters
73
Chapter 3
DOP concentrations of the present investigation recorded remarkably higher values compared to the eariier reported values. In Pichavaram waters, (south east coast of India) DOP concentration ranged from 0.5 to 2.75 with maximum levels within the salinity range of 5 to 22 x 10-3 (Balasubramanian and Venugopalan, 1984). At Hinchinbrook Island, Australia, DOP concentrations found to vary from 0.1 to 0.61JM (Boto and Wellington, 1988). The accumulation of DOP occurs after the removal processes such as utilization by bacteria and other heterotrophs and adsorption to particulate matter and sediments. The maximum concentration of DOP recorded during pre-monsoon at Station 1 and Station 2 can be attributed to high bacterial activity during this season. Hays and Phillips (1958) found that bacteria in fresh water cultures convert the added radiophosphate rapidly into dissolved organic compounds. Also an experimental study on assimilation and regeneration of phosphate found that in estuarine sediments, a decrease in DIP and simultaneous increase in DOP may largely be due to the action of microbial flora (Rajagopal, 1973). The monsoon flooding decreases the bacterial density, which in turn reduce the concentration of DOP during this season. In Pichavaram mangrove waters, the maximum DOP was found during. summer and pre-monsoon and minimum was found during monsoon (Balasubramanian and Venugopalan, 1984). This pattern was attributed to mineralisation of DOP and dilution of accumulated organics by floodwaters. It was also found that the DOP concentrations in bottom waters of Pichavaram were significantly higher than those at the surface waters. This also suggests the influence of sediments in the concentration of DOP.
Seasonal variations showed a general pattern of minimum concentration during monsoon season at all Stations except at Station 3 (Fig. 3.24). However maximum concentrations of DOP recorded during pre-monsoon at Station1 and Station 2. Unlike DIP, at Station 3 and at Station R maximum concentrations of DOP were recorded during post-monsoon. The annual mean variation of DOP concentrations, recorded the maximum at Station 1 and minimum at Station 3 (Table 3.13).
The elevated concentration of DOP during post monsoon at Station 2 and Station 3 might be associated with the productivity of surface water. Algal growth produces an increase in particulate phosphorus and as algae senesce release as DOP takes place (Strickland and Austin, 1960). The DOP concentrations in mangrove creek waters were positively correlated with POC concentrations. This suggests a release of DOP during algae senesce. The dissolved oxygen level found to influence the mineralization of organic phosphorus (Sankaranarayan and Reddy, 1970). The present observation in creek waters also recorded a negative correlation of organic phosphate with dissolved oxygen (Table 3.2a).
74

Distribution 01 Nitrog~n and Phosphorus in the Watn Column
The ANOVA of DOP showed that a significant difference exists between stations (p<O.05) (App.12). The LSD at 5% level for stations is 2 .311~molL-l .
Station 1 and Station 2 are having significantly higher organic phosphate compared 10 Station 3 and Station R. No significant difference either between Station 1 and Station 2 or between Station 3 and Station R were recorded.
Particufate Phosphorus (PP)
Spatial and seasonal variations were observed in pp concentrations. The seasonal variations of pp concentration are given in Table 3.14. The particulate phosphorus concentration found to vary between O.49~molL"' at Station 2 (post· monsoon) and 55.40~molL"' at Station 2 (monsoon) in creek waters. However at Station R. pp concentrations found to vary from O.58lJmolL-1 (post-monsoon) to 8.40IJmoIL-' (pre-monsoon). The maximum concentrations of pp were recorded during monsoon at all Stations except at Station R. where maximum concentration was found during pre-monsoon (Fig. 3.26). The annual mean concentrations recorded in mangrove creek waters showed maximum concentration of 16.26IJrnoll"' at Station 2 and a minimum of 5.04lJmoll-' at Station 3. While at Station R the pp concentrations ranged from O.58~rnoll-l and 8.40IJmoIL-1 .
75

Clutpter 3
Monthly variations in pp concentration are depicted in Fig. 3.25. Generany
higher values were observed dul'lng April and July at all Stations. Remarkably
higher values were obtained at Station 2, during May and September.
Monthly vw&.t60n o' pp
60 , 50
40 •
\ 20
Feb Apt MIIy i ll Aug Sep Oct t>br Dec
_ STN1 • STN2 • STN3 - )(- STNR
Fig 3.25 Monthly variation of pp In surface waters
30
25
20
15
t 10
5
o
s.asonalm .. n v.rAdion of PP
1 2 3 R St_ • Pr.rrorwoon • ftobnsoon c Post~rronsoon
Fig. 3.26 Seasonal mean variation of pp In surface waters
Monsoon months were associated with maximum suspended load. The maximum concentraUons of pp obtained during monsoon, may be associated with
76

Distributiotl of Nitrogetl atld PllOsp/lonls itl a,e Wtl ter COIUIIIII
the load of suspended sediment transported to the estuary. A similar observation
was found at Pitchavaram mangrove area (Subramanian and Venugopalan 1983).
In their observation in shallow waters, the distribution of particulate phosphorus
depend on the suspended sediment brought in, by the river discharge and not on
the particulate matter formed on the estuarine mixing. It was found in the estuary of
Purari river of Papua New Guinea where rain fall is very high most of the available
phosphorus is bound, either as particulate or as phosphate adsorbed on to clays,
in the suspended load, rather dissolved free in the water column (Viner, 1982).
Remarkably higher concentration of pp at Station 2, during May and September
may be attributed to the prevalent dry condition at this station. During post
monsoon, pp concentrations were mainly due to phytoplankton biomass.
Comparatively less phosphate found in phytoplankton biomass than sediments.
Hence the minimum concentrations recorded during post-monsoon were
associated with phytoplankton biomass at these stations. Higher values of
particulate phosphorus were registered at Station 1 and Station 2 as compared to
Station 3. The more denser plant distribution at these sites may be contributed to
the particulate matter and organic detritus. The concentrations of pp were positively
correlated with the concentrations of TSS, poe and SRP. A negative correlation was
also recorded with DO (Table 3.2a). No significant difference in pp concentration
was found between months or between stations using AN OVA (App. 13).
Total phosphate (TP)
The TP concentrations showed a variation similar to DIP concentrations. The
seasonal variations of TP are given in Table 3.15. TP concentration at three
mangrove locations found to vary between 2.00IJmoIL"' at Station 3 (post-monsoon)
and 77.87IJmoIL"' at Station 2 (monsoon). At Station R. TP showed a variation from
3.46j.JmoIL"' (monsoon) to 12.79IJmoIL"' (pre-monsoon). Similar to PP, monsaon
season was characterized by maximum concentrations of TP at three mangrove
locations. However at Station R. maximum concentration of TP recorded during
pre-monsoon (Fig. 3.28). Minimum concentrations of TP were observed during post
monsoon at all Stations. The annual mean concentrations of TP showed maximum
value at Station 2 and minimum value at Station R. Monthly variation (Fig. 3.27) of
TP concentrations recorded higher values during April. May, July, and August at all
Stations. Exceptionally higher TP values were recorded during September at Station
2 and during September and October at Station 1. The TP concentrations were
77

CIuJ"ter3
found to be linear at Station R. TP concentrations indicated phosphorus loading in
the water column of mangrove creeks at Station 1 and Station 2 than at Station 3 and
Station R. Phosphorus may enter a water body through the inflows, precipitation. dry
fallout and from the sediments, and it may be removed by sedimentation and through
the outftow. Bacterial reduction of ferric hydroxy-phosphate complexes results in
large amounts of soluble inorganic phosphorus and ferrous iron diffusing across the
sediment-water interface causing intl1mal loading. Ferrous iron is deoxidised when it
encounters oxygen (from the trophogenic zone) to insoluble ferric iron which binds
with orthophosphate. Phosphorus is also released from lake sediments to well
aerated water. Exceptionally high TP concentrations were recorded in the water
column at Station 2 except during post-monsoon might be associated with desorption
of Fe-bound phosphorus due to the above reasons. Since these high values were
associated with dry conditions of the creek during the months of May-end
September.
Table 3.15 Seasonal variation ofTP(J.1IT'OIL-1)lnsurfacewaters
Stations Season ", Min Max Mean Pre-monsoon 13.98 34.62 27.20
Sfatian 1 Monsoon 23.20 46.98 32.05 " Post-monsoon 11 .03 29.93 18.46 _
Arinual mean 25.90 Pre-monsoon 18.93 76.38 42.30
Station 2 Monsoon 16.03 77.87 40.99 Post-monsoon 5.61 21.67 11 .62 _ Annual mean 31.64 Pre-monsoon 7.39 9.57 8.64
Station 3 Monsoon 9.57 13.11 10.72" . Post - monsoon 2.00 4.75 3.75 _
An ua ea 7,70 Pre-monsoon 6,78 12,79 10,05
Station R Monsoon 3.46 8.1 2 5.95 Post - monsoon 4.10 5.37 4,56 _
Annual mean 6,85
Station 1 recorded relatively higher TP concentration during man soon and
pre-monsoon. Remari<ably high TSS (Table 3.15) during monsoon was recorded at
all Stations. The major :;curC9 of susper.ded sedimant may be derived from river
water inundation of the estuary and surface water runoff. Also At relatively higher
temperatures In pre-monsoon, microanaerobic zones are formed very rapidly, and
78

Distribution of Nitrogen and Phosphorus in the Wata Column
redox-controlled liberation of phosphate can occur to well-aerated water. An
increase in temperature gives primarily indirect effects due to increased bacterial
activity, which increases oxygen consumption and decreases the redox potential
and pH·value. The production of phosphate-mobilizing enzymes and chelating
agents might increase accordingly. The Tp· minimum values (Table 3.15) observed
at Station 1 and Station 2 were comparable. Station 3 and Station R recorded similar
concentrations of TP with respect to minimum, maximum and mean values. The
minimum TP was noticed during post monsoon at all Stations.
90
80 70
60
MOfIthly v ... ion of TP
Feb Apt t.'ey .All Aug Sep Oct New [)eoc
_ STN 1 STN 2 -.l- STN 3 - )(- STN R
Fig 3.27 Monthly variation of TP In aurface waters
'S 40 35 30 25
" 2<l ~ 1S ~1O
S o
.... on.lll v.iItion of TP
1 2 3 R -" _ A'e-lTOnsoon _ M:lnsoon c Fbst-rronsoon
Fig. 3.28 Seasonal mean variation of TP In surface waters
79

Chapter 3
Correlation analysis of TP concentrations with other physico-chemical
parameters, in mangrove fringed ~reek waters, showed a positive relationship with
TSS, POC, DIP, PP and ammonium-N concentrations. These correlations suggest
a relationship of TP concentration with concentrations of suspended particles
(Table 3.2a). No significant difference were recorded between months in TP
concentrations in water column (App.14). However, Significant differences were
exhibited between Stations in TP concentrations. The LSD at 5% level between
Stations was 5.711 ~moIL-l. Stations 1 and Station 2 gives significantly higher TP
concentrations than Station 3 and Station R. No significant differences were
exhibited either between Station 1 and 2 or between Station 3 and R (App.14).
Inter comparison of the distribution of phosphorus forms
Total phosphorus concentrations in water column estimated as the sum of
DIP, OOP and PP. The different forms of phosphorus: DIP, DOP and PP were
estimated as the percentage of TP. The Station wise variations in percentage of
each fraction are given below. The seasonal distribution pattern of different forms
of phosphorus is depicted in absolute and relative terms in Table 3.16a and 3.16b.
Table 3.16a Seasonal variation of different forms of phosphorus in surface
waters (IJmoIlL) . Stations Season SRP SOP PP TP
Pre-monsoon 7.73 7.02 10.59 25.34
Station 1 Monsoon 20.34 1.11 10.59 32.05
Post-monsoon 5.00 3.21 5.62 13.68
Pre-monsoon 19.16 3.76 20.63 42.30
Station 2 Monsoon 20.34 2.99 27.29 40.99
Post-monsoon 7.38 3.38 0.86 11.62
Pre-monsoon 2.84 0.82 4.99 8.64
Station 3 Monsoon 1.52 0.92 8.29 10.72
Post - monsoon 0.55 1.36 1.83 3.75
Pre-monsoon 1.85 1.68 7.09 10.05
Station R Monsoon 1.65 1.46 3.32 5.95
Post - monsoon 2.07 2.24 1.02 4.58
80

Di5tributioll of Nitrogelllltui Pho5phoru5 in the Water Columll
Table 3.16b Seasonal variation of different forms of phosphorus In surface waters as V. of TP
., " "
" ., " , .,
i" , .. ' " 20
Stations Season Pre-monsoon
Station 1 Monsoon Post-monsoon Pre-monsoon
Station 2 Monsoon Post-monsoon Pre-monsoon
Station 3 Monsoon Post - monsoon
Station R Pre-monsoon Monsoon Post - monsoon
F.tJ AfI/ '*Y.wI Aug s.p 01:1 to. DIoc
• IF • IXlP 0 pp
la)
Form. ofptlosptloru.M "Ion 3
" ,JAIl,lJ.J, F~ Apt MIy .u A\lg Sep Get NaY Dec
• GP . DJf'D pp
Ic)
DIP 33.21 61 .90 42.93 43.09 26.50 63.97 34.52 13.07 15.66 19.92 26.37 30.03
.. " ro
. " ~ .. t ..
30 20
" ,
DOP PP 24.09 42.70 3.88 34.22
25.03 32.04 9.94 47.30 8.22 63.28
26.42 9.62 8.60 56.68 10.77 76.16 29.97 54.37 13.23 69.88 25.95 57.39 47.67 22.30
Fib AfI/ Mty ... Aug Stp Clet It:I¥ o.c .IF.DOPOF'P
OIl 60 70
• 60
~ '" . " ' 30
20
" o
(b)
Form. of pttospfloru. at Stdon R
Feb Apr MIy .AA Aug Sep Get NoY Dec
• CF . DJf' o pp
Id)
Fig. 3.29 Monthly variation of forms of phosphorus
81
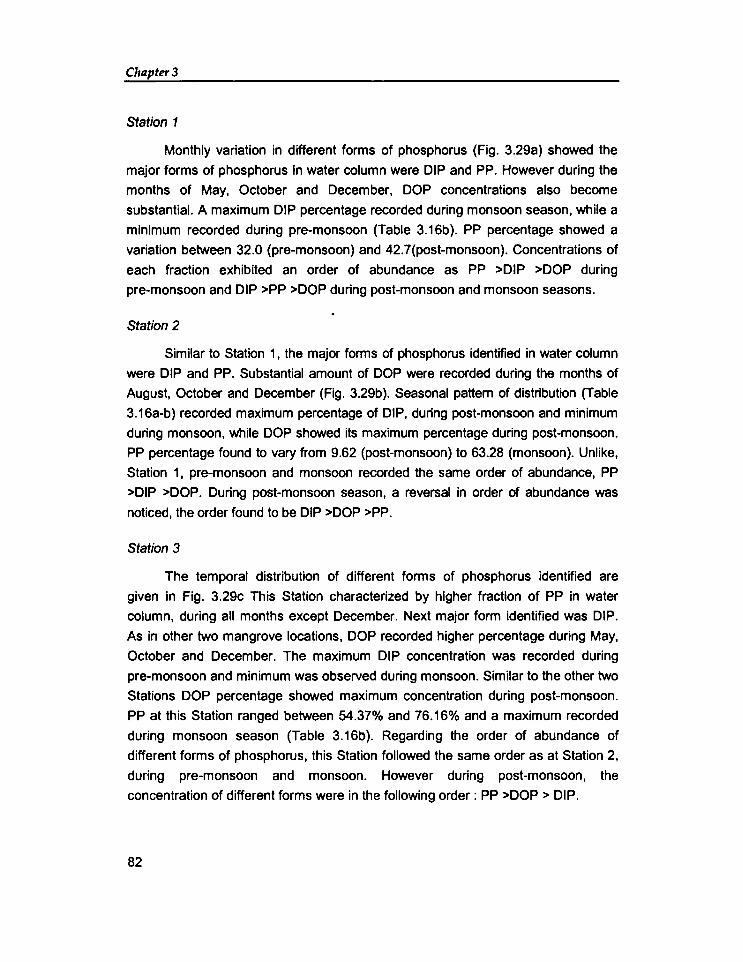
Chapter 3
Station 1
Monthly variation in different forms of phosphorus (Fig. 3.29a) showed the
major forms of phosphorus in water column were DIP and PP. However during the
months of May, October and December, DOP concentrations also become
substantial. A maximum DIP percentage recorded during monsoon season, while a
minimum recorded during pre-monsoon (Table 3.16b). PP percentage showed a
variation between 32.0 (pre-monsoon) and 42.7(post-monsoon). Concentrations of
each fraction exhibited an order of abundance as PP >DIP >DOP during
pre-monsoon and DIP >PP >DOP during post-monsoon and monsoon seasons.
Station 2
Similar to Station 1, the major forms of phosphorus identified in water column
were DIP and PP. Substantial amount of DOP were recorded during the months of
August, October and December (Fig. 3.29b). Seasonal pattern of distribution (Table
3.16a-b) recorded maximum percentage of DIP, during post-monsoon and minimum
during monsoon, while DOP showed its maximum percentage during post-monsoon.
PP percentage found to vary from 9.62 (post-monsoon) to 63.28 (monsoon). Unlike,
Station 1, pre-monsoon and monsoon recorded the same order of abundance, PP
>DIP >DOP. During post-monsoon season, a reversal in order of abundance was
noticed, the order found to be DIP >DOP >PP.
Station 3
The temporal distribution of different forms of phosphorus identified are
given in Fig. 3.29c This Station characterized by higher fraction of PP in water
column, during all months except December. Next major form identified was DIP.
As in other two mangrove locations, DOP recorded higher percentage during May,
October and December. The maximum DIP concentration was recorded during
pre-monsoon and minimum was observed during monsoon. Similar to the other two
Stations DOP percentage showed maximum concentration during post-monsoon.
PP at this Station ranged between 54.37% and 76.16% and a maximum recorded
during monsoon season (Table 3.16b). Regarding the order of abundance of
different forms of phosphorus, this Station followed the same order as at Station 2,
during pre-monsoon and monsoon. However during post-monsoon, the
concentration of different forms were in the following order: PP >DOP > DIP.
82

Distribution of Nitrogen and Phosphorus ill tile Water Columll
Station R
Similar to Station 3, pp found to be the major phosphorus fraction in water
column, except during the months of November and December (Fig. 3.29d). DIP
showed maximum percentage during post-monsoon. Significantly higher
percentage of DOP was found during post-monsoon. pp percentage ranged
between 22.30 and 69.88 and maximum percentage recorded during pre
monsoon. The order of abundance in different forms of phosphorus followed a
similar pattern as at Station 2 and Station 3. However during post-monsoon Station
R, recorded following order of abundance, viz DOP >DIP >PP.
In general, the entire studied water column exhibited, the percentage of PP
to be greater than that of DIP, which in turn larger than DOP, other than certain
exceptions. In lakes, it was found that, phosphorus is partitioned into about 60-70%
PP, 20-30% DOP, and 5-12% DIP (Valiela, 1984). At all mangrove locations, the
percentage of DIP found to be greater than DOP. However at Station R. almost
similar concentrations of DIP and DOP were found. In aquatic systems where cell
concentrations are lower than in lakes, DOP may be smaller than the inorganic
fraction. It was found in English channel, most of the phosphorus present in winter
as DIP, but in summer when there were abundant cells and senescing, there was
more DOP than DIP (Harvey, 1955).
The annual mean percentage of different forms of phosphorus (Table 3.17)
recorded at Station 1 were 48.4%, 17.1%, and 34.48 % of DIP, DOP and PP
respectively. Remarkably higher percentage of DIP at this creek indicated a
eutrophic condition. Jenson and Anderson(1992) have shown that Fe-bound P,
when present in significant proportions in the sediment, may be a major source for
internal P loading in shallow, eutrophic lakes, just as it may be in deeper, stratified
lakes. In all other Stations, the PP percentage recorded maximum values.
At Station 2, Station 3 and at Station R the PP percentage found to be
greater than DIP which in turn greater than DOP. In wet tropical river systems, it
was found that the extremes of rainfall and runoff shift the importance of biological
availability from dissolved inorganiC phosphate to phosphorus tied to the
suspended load, like in Purari river of Papua New Guinea, where rain fall is
extremely high, most of the available phosphor us was bouno, eltner as parucuiate
or as phosphate adsorbed on to clays in the suspended load (Viner, 1982).
83

Chapter 3
Table 3.17 Stationwise annual summary of perCentage of different forms of phosphorus in surface waters
Stations Season Min Max Mean %*
SRP 3.50 32.06 12.54 48.41
Station 1 SOP 1.00 11.96 4.43 17.10
PP 3.22 14.33 8.93 34.48
TP 11.03 46.98 25.90
SRP 3.85 35.90 12.42 39.25
Station 2 SOP 0.49 6.80 3.33 10.52
PP 0.49 55.40 16.26 51.39
TP 5.61 17.87 31.64
SRP 0.40 4.28 1.64 21.24 '\¥
SOP Station 3
0.01 2.74 1.03 13.39 !.~ ..
PP 1.19 10.86 5.04 65.37
TP 2.00 13.11 7.70
SRP 0.61 3.45 1.99 26.67
SOP 0.13 Station R
3.23 1.57 21.02
PP 0.58 8.40 4.58 61.32
TP 3.46 12.79 7.47
* - as percentage of TP.
The low phosphorus concentration is typical of surface waters due to uptake
by primary producers and bacteria. Phosphate is principally regenerated by the
decay of particulate organic phosphorus and by animals. Death, shedding 'or
molting of organisms plus adsorption of phosphate onto particles prodl.ite
particulate organic phosphorus. Some particulate organic phosphorus is releas~d as DIP, as particles decay in water column, but some settle on to sediments. In
sediments further degradation of settled organic phosphorus to DIP can take place
and some of this DIP is precipitated or adsorbed. A high percentage of particulate
phosphorus (Table 3.17) recorded at all Stations except at Station 1.
At Station 1 and Station 3, during post-monsoon, a decrease in DIP was
associated with an increase in DOP with percentage of PP remains the same.
Therefore post-monsoon may be considered as most productive season at these
84

Distriblltioll of Nitrogell alld Phospllorus ill tile Water COIIIIlll/
Stations. Since algae are the primary agent of phosphate removal and their ability
to store nutrients also makes algae a more important reservoir than bacteria.
3.3 CONCLUSION
Seasonal salinity variations were experienced in Cochin estuary. due to the
high volume of fresh water inundating the estuary. during South West monsoon.
Although salinity variation in mangrove fringed creeks were also influenced by
these seasonal variations in the estuary, Station 1 and Station 2 recorded
significantly higher salinities during all seasons compared to Station R. High salinity
values indicated that no real flushing taking place at these two Stations according
to the.tidal dynamics of the estuary. On the other hand Station 3 exhibited salinities
that were similar to Station R. Remarkably higher salinities during pre-monsoon at
Station 1 and Station 2 might be due to isolation of the head of the creek from near
shores by the low fresh water discharge. in turn a maximum salinity regime found
causes an increase in salinity of surface water than sea water.
Low pH values were recorded at Station 3. while all other Stations recorded
alkaline pH values. During pre-monsoon season Station 1 also exhibited an acidic
pH, probably due to microbial activity in surface waters.
Water temperatures were found to vary within normally expected ranges at
all the stations. The lowest annual mean value of 29.1°C recorded at Station 1.
29.5°C at Station 2, and 30.2°e at Station 3. A clear seasonal variation was found
at all three stations. As expected, the maximum temperature was recorded during
pre-monsoon at all stations.
Suspended sediments associated with river influx and plant litter may
contribute to the large amount of TSS at the creek waters under study area. The
maximum concentrations of TSS varied between 150.13mgL01 and 360.80mgL01 at
the three mangrove-fringed creek waters as against the 88.41 mgL01, the maximum
TSS concentration exhibited at Station R. At the mangrove creek waters. TSS
concentrations showed Significant positive correlations with poe, DIP, TP. PP and
ammonium concentrations, while no such correlations were observed at Station R.
Mangrove-fringed creck waters exhH:;;':: maxim;.;:;; roe concentration
during post-monsoon and minimum during monsoon season. An elevated poe
concentration exhibited at Station 1.during pre-monsoon. The annual mean poe
85

Chapter 3
concentrations at three mangrove-fringed Stations ~ere found to be 7.19mgL-',
6.85mgL-', and 5.06mgL-' respectively. At Station R an annual mean value of
4.19mgL-' recorded. Bacterial density, phytoplankton productivity as well as the
presence of fine sediment in particulate matter resulted in an elevated
concentration of POC in mangrove creek waters.
ANOVA on the general hydrographic parameters like, salinity, pH, TSS and
POC values showed significant difference between months. Also the salinity values
at Station 1 and Station 2, exhibited significantly higher values than at Station 3
and Station R.
The annual mean values showed almost similar concentrations of nitrate-N
at three mangrove-fringed creeks with a minimum at Station 1 (1.82I.lmoIL·') aMlf
maximum at Station 3 (1.97I.lmoIL-') while Station R recorded an annual mea¥!
value of 7.74I.lmoIL-'. Uptake by trees and microorganisms, and by sorption on it)
the sediment matrix considerably reduces nitrate concentrations in mangroie
forests, which in turn make it an effective sink for nutrients.
A general trend of nitrite nitrogen distribution showed minimum values during
pre-monsoon at Station 1 and Station 2. The maximum values were recorded at
Station 1 during monsoon and at station 3, during pre-monsoon were may be
attributed to the bacterial activity in surface water.
Ammonium was the major dissolved inorganic nitrogen species at three of the
mangrove-fringed creeks as well as at the reference station. The high concentratiofi
of ammonium was found at these sites indicated the net mineralisation of organic
matter in this area. The annual mean ammonium concentrations recorded at Stations
1, 2, 3 and R were 13.28I.lmoIL-\ 32.90I.lmoIL-\ 11.54l.lmoIL-\ and 14.11I.lmol~' respectively. Remarkably high concentration at Station 2, may be due to the local
regeneration from sediments.
The N:P ratio at mangrove-fringed creek waters were varied between 1.36
and 5.70 and Station R, showed an annual mean value of 4.48. The significantly
lowered ratio at Station 1 and Station 2, were associated with an enhanced
concentration of DIP. The above ratios suggest that the mangrove-fringed creeks
of Cochin estuary represent an anthropogenically altered ecosystem.
Concentrations of nitrate, nitrite and ammonium showed significant
difference' between Stations (ANOVA). Significantly higher concentrations of nitrate
86

Distriblltion of Nitrogetl and Phosphorus in ti,e Water Column
and nitrite were recorded at Station R, while higher concentrations of ammonium
were recorded at Station 2.
Seasonal variations of DIP concentration at mangrove locations were found
to be under the influence of microbial activity. Remarkably higher concentrations of
DIP at Station 1 and Station 2 compared to Station 3 may be attributed to their
geographical position. Station 1 adjacent to an inhabited area may be under the
influence of untreated sewage, which influence the concentration of DIP. Station 2
experiencing evapotranspiration during pre-monsoon, resulted in higher salinity
and elevated concentration in DIP. Also due to the low tidal regime at the creeks,
Station 1 and Station 2 reduce the transport of accumulated organic matter in the
creek. Enhanced bacterial activity may reduce oxygen concentrations in sediment
water interface in turn a reduced iron minerals, release inorganic r hosphate to the
water column. The relationship between seasonal pattern of phosphate in water
and flux of phosphate from sediments is an evidence for the regeneration of
benthic phosphate affects water column concentrations (Nixon et al., 1984). The
highest mean values of ammonium and DIP were recorded at Station 1 and Station
2 may be due to the high residence time for creek water which enhance the
desorption processes. Nutrients are also trapped in sediments during the storage
for a relatively longer period.
Total depletion of nutrients was not observed during the present study in the
mangrove creek waters dnd estuarine reference site to limit the production of
phytoplankton thereby making the waters sustainable for aqua cultural practices.
ANOVA results showed, significantly higher :>IP and DOP concentrations were
recorded at Station 1 and Station 2. Lower values recorded at Station 3 and Station
R and no significant differences were observed, between the concentrations of DIP
and DOP at Station 3 and at Station R. Regarding the PP concentration, no
significant difference found, either betwebn Stations or between months.
Station 1 recorded relatively higher TP concentration during monsoon and pre
monsoon. Remarkably high TP concentrations were also recorded in the water column
of Station 2 except during post-monsoon, might be associated with desorption of
Fe-bound phosphorus attributed to the bacterial reduction of ferric hydroxy-phosphate
complexes. which diffusing across the sediment-water interface causing internal
loading. Station 3 and Station R recorded similar concentrations of TP with respect to
minimum, maximum and mean values. The minimum TP was noticed during post
87

Chapter 3
monsoon at all Stations. The correlations of TP concentration with TSS and POC
concentrations suggest a relationship of TP with suspended particles.
The analysis of relative composition of each form of phosphorus revealed
that the pp concentrations were greater than DIP concentrations which in turn was
greater than DOP at all stations except ·at Station 1, where phosphorus was
partitioned into about 34.5% PP, 48.4% DIP and 17.1% DOP. Anderson and
Jensen (1992) have shown that Fe-bound P, when present in significant
proportions in the sediment, may be a major source for internal P loading in
shallow, eutrophic lakes, just as it may be in deeper, stratified lakes. At Station 2
the relative composition of each form of phosphorus observed were 51.4% PP,
39.3% DIP and 10.5% DOP. While Station 3, recorded the percentage composition
of PP, DIP and DOP as 65.4%, 21.2% and 13.4% respectively. The reference
Station gave a similar composition with 61.3% PP, 26.7% DIP and 21% DOP.
Differences in speciation of phosphorus in water column among the studied area
can be ascribed to local characteristics, such as extent of fresh water in put, land
run-off, tidal amplitude and productivity of biota.
REFERENCES
Alongi, D.M. 1996 The dynamics of benthic nutrient pools and fluxes in tropical
mangrove forests. Journal of Marine Research 54, 123-148.
Alongi, D.M., Boto, K.G. & Robertson, A.1. 1992 Nitrogen and phosphorus cycles.
In Tropical Mangrove Ecosystems. (Robertson, A.1. & Alongi, D.M., eds).
American geophysical Union: Washington, D.C. pp. 251- 292.
Anderson, F.O. & Jensen, H.S. 1992 Regeneration of inorganic phosphorus and
nitrogen from seston in a fresh water sediment, Hydrobiologia, 228, 71-81.
Ayukai, T., Miller, D., Wolanski, E. & Spagnol, S. 1998 Fluxes of nutrients and
dissolved and particulate organic carbon in two mangrove creeks in
northeastern Australia. Mangroves and Salt Marshes 2,223-230.
Balasubramanian, T. & Venugopalan, U.K. 1984 Dissolved organic matter in
Pichavaram mangrove environment, Tamil Nadu, South India; In
Proceedings of the Asian symposium on Mangrove environment: Rp..f::Mlrch
and Management (Soepadmo, E, Rao, A.N. & Macintosh, D.J., eds).
University of Malaya and UNESCO, Kuala Lumpur. pp. 496-513,
88

Distribution o/Nitrogen and Phosphorus in the Water Column
Bhowmic, SK, Roy, G.N. & Chowdhary, A. 1985 A list of twenty four strains of
bacteria from the decomposed litter of mangrove areas of Sunderban complex.
In Proceedings of National Symposium on Biology, Utilization and Conservation
of Mangroves (Bhosale, L.J., ed). Shivaji University press, 467-472.
Boto, K.G. 1982 Nutrient and organic f1uxes in mangroves. In Mangrove
ecosystems in Australia (Clough, B.F., ed). Australian National University
Press, Canberra, pp:239-257.
Boto, K.G. & Bunt, J.S. 1981 Dissolved oxygen and pH relationships in northem
Australian mangrove water ways. Limnology and Oceanography 26, 1176-1178.
Boto, KG. & Wellington, J.T. 1988 Seasonal variations in concentrations and fluxes
of dissolved organic and inorganic materials in a tropical, tidally dcminated
mangrove water- way. Manne Ecology Progress Series 50,151-160.
Chakraborty, S.K. 1995. Aquaculture potential of mangrove ecosystem of
Sunderbans, West Bengal, India. Proceedings Fisheries A Multibillion Dollar
Industry, Madras, India during August 17-19 (Krishnamoorthy, B.,
Krishnamoorthy, KN., Meenakshisundaram, P.T., Nayar, KN., eds.)
Madras, India. Aquaculture foundation of India, pp. 72-83.
Cundell, A.M., Brown, M.S., Standford, R. & Mitchell, R. 1979 Microbial
degradation of Rhizophora mangle leaves immersed in the sea. Estuarine,
Coastal and Shelf Science 9,281-286.
De, T.K., Mitra, A. & Choudhary, A. 1987 Studies on phytoplankton and productivity
around Sagar Island and Prentice island. Sunderbans, India. Proceedings of
National Seminar on Estuarine Management, Trivandrum, pp 327-329.
Dittmar, T. & Lara, R.J. 2001 Do mangroves rather than rivers provide nutrients to
coastal environments south of the Amazon River? Evidence from long term
flux measurements Marine Ecology Progress Series 213,67-77.
Grasshoff, K., Ehrhardt, M., Kremling, K. (Eds) 1983 Determination of nutrients. In
Methods of sea water analysiS. Verlag Chemie, Weinheim, 125-187.
Hays, F.R. & Phillips, J.E. 1958 Lake water and sediment IV Radiophosphate
equilibliulIl with muli, ~Iants and bacteria under oxidized and reduced
condition. Umno/ogy and Oceanography 3,459-475.
89

ChRpter3
Jagtap, T.G. 1987 Seasonal distribution of organic matter in mangrove environment of
Goa. Indian Joumal of Marine Sciences 16,103-106.
Kairesalo, T., Tuominen, L., Hartikainen, H. & Rankinen, K. 1995 The role of
bacteria in the nutrient exchange between sediment and water in a flow
through system. Microbial Ecology 29, 129-145.
Kannan,L. & Krishnamurthy, K. 1985 Nutrients and their impact on phytoplankton.
In Marine Plants (Krishnamurthy, V., Untawale, A.G., eds). Papers presented
at the All India symposium on marine plants, their biology, chemistry and
utilization, Dona Paula, Goa, 73-78.
Kathiresan, K. 2000 A review of studies on Pichavaram mangrove, southeast India,
Hydrobio/ogia 430, 185-205.
Lean, D.R.S. 1973 Phosphorus dynamics in lake water. Science 179, 678-680.
Millero F .J. 1996 Processes in the oceans In Chemical Oceanography, Boca
Raton, Florida CRC press, 469pp.
Minear, RA 1972 Characterization of naturally occurring dissolved organophosphorus
compounds. Environ~ntal Science and Technology 6, 921-927.
Nair KKC., Sankaranarayanan, V.N., Gopalakrishnan T.C., Balasubramanian, T.,
Lalithambika Devi, C.B., Aravindakshan, P.N. & Krishnankutty, 1988
Environmental conditions of some paddy-cum prawn culture fields of Cochin
backwater, southwest coast of India. Indian Joumal of Marine Sciences 17, 24-30
Nixon, S.W. 1980 Between coastal marshes and coastal waters - A review of
twenty years of speculation and research on the role of salt marshes in
estuarine productivity and water chemistry. In Marine Science, vol, 11
Estuarine and Wetland Processes With Emphasis on Modelling, (Hamilton,
P. & MacDonald, K.B., ed). 437-525.
Nixon, S.W., Fumas, B.N., Lee, V., Marshall, M., Ong, J.-E., Wong, C.-H., Gong
W.K. & Sasekumar, A. 1984 The role of mangrove in the carbon and nutrient
dynamic of Malaysia estraries. Proceedings of the Asian Symposium on
Mangrove Environment: Research And Management, 534-544.
90

Distribution a/Nitrogen and Phosphorus in the Water Column
Ovalle, A.R.C., Rezende, C.E., Carvalho, C.E.V., Jennerjahn, T.C. & Ittekkot, V.
1999 Biogeochemical characteristics of coastal waters adjacent to small
river-mangrove systems, East Brazil. Geo-Marine Letters 19,179-185.
Parsons, T.R. 1975 Particulate organic carbon in the sea. In Chemical
Oceanography (Riley, J.P. & Skirrow, G. eds). Vol 2, London, Academic
Press, 365-383.
Preetha P.M. 1991 Eco-Biological studies of mangrove, Rhizophora- species.
M.Sc. dissertation submitted to Cochin University of Science and
Technology, Cochin.
Purvaja, R. & Ramesh, R. 2000 Natural and anthropogenic effects on phytoplankton
primary productivity in mangroves. Chemistry and Ecology 17, 41-58.
Qasim, S.Z. 1972 Taxonomy and biology of blue-green algae, (Oesikachary, T.V. ed).
University of Madras, Centre for advanced Study in Botany, Madras, pp. 433.
Rajagopal, M.D. 1973 On assimilation and regeneration of phosphorus in two
different environments. Mahasagar 7,143-149.
Rajendran,N. & Kathiresan, K. 1999 Seasonal occurrence of juvenile prawn and
environmental factors in a Rhizophora mangal, southeast coast of India.
Hydrobiologia 394, 193-200.
Ram, A. & Zingde, M.D. 2000. Interstitial water chemistry and nutrients f1uxes from
tropical intertidal sediment. Indian Journal of Marine Sciences 29,310-318.
Rama Raju, V.S., Udaya Varma & Pylee, A. 1979 Hydrographic characteristics &
Tidal Prism at the Cochin harbour mouth. Indian Journal of Science 8, 78-84.
Rathna Kala, 1995 Microbial production of antibiotics from mangrove ecosystem.
Ph.D. Thesis submitted to Cochin University of Science and Technology
under the Post Graduate Education and Research Programme in
Mariculture, CMFRI, P.O. Box. 1603, Cochin 14.
Redfield, A. C., Ketchum, B.H. & Richards, FA 1963 The influence of of
organisms on the composition of seawater. In The sea (Hill, M.N., ed). Vo12.
Interscience publishers, New York, pp. 26-77.
Ridd, P.V. Sandstorm, M.W. & Wolanski, E. 1988 Outwelling from tropical tidal salt
flats. Estuarine Coastal and Shelf Science 26, 243-253.
91

Chapter 3
Riley, J.P. & Chester, R 1971 Micronutrient elements In Introduction to Marine
Chemistry Academic Press, New York pp 152-181.
Rivera - Monroy, V.H. & Twilley, RR 1996 The relative role of denitrification and
immobilization in the fate of inorganic nitrogen in mangrove sediments
(Terminos Lagoon, Mexico) Limno/ogy and Oceanography 41, 284-296.
Rivera-Monroy, V.H., DaY,W.J., Twilley, R.R, Vera-Herra, F. & Coronado-Molina, C.
1995 Flux of nitrogen and sediment in a fringe mangrove forest in a terminus
lagoon, Mexico Estuarine, Coastal and Shelf Science 40, 139-160.
Rivera-Monroy, V.H., Madden, J.C., Day Jr.,W.J., Twilley, RR, Vera-Herra, F.&
Alvarez-Guillen, H. 1998 Seasonal coupling of a tropical mangrove forest
and an estuarine water column: enhancement of aquatic productivity.
Hydrobio/ogia 379, 41-53.
Rizzo, W.M. 1990 Nutrient exchanges between the water column and a subtidal
benthic macroalgal community. Estuaries 13, 219.
Sankaranarayanan, V.N. & Reddy, C.V.G. 1970 Bulletin of the National Institute of
Sciences of India 38, pp 138-162.
Sarala Devi K., Jayalakshmi, K.V. & Venugopal, P. 1991 Communities and co
existence of benthos in northern limb of Cochin backwater. Indian Journal of
Marine Science 20,249-254.
Sarkar, S.K., Singh, B.N. & Choudhary, A. 1986 The ecology of copepods from
Hooghly Estuary, West Bengal, India. Mahasagar- Bulletin of National
Institue of Oceanography 19, 103-112.
Selvam, V., Hariprasad, V., Mohan, R & Ramasubramanian, R 1994 Diurnal
variations in the water quality of sewage polluted Adayar mangrove water,
east coast of India. Indian Journal of Marine Sciences 23,94-97.
Sheeba, P., Sarala Devi, K. & Sankaranarayanan, V.N. 1996 Nutrients from
mangrove areas of Cochin backwaters. Proceedings of eighth Kerala
Science congress, Kochi. pp 87.
Shriadah. M.A. 2000 Chemistry of mangrove waters and sediments along the
Arabian Gulf shoreline of United Arab Emirates. Indian Journal of Marine
Sciences 29, 224-229.
92

Distribution o/Nitrogen a,1d PhosphonlS in the Water Column
"Strckland, J.D.H. & Austin, K.H. 1960 Forms of phosphorus in NE pacifiC waters.
Journal of Fisheries Research Board Canada, 7.
Stumm, W. & Morgan, J.J. 1981 An introduction emphasizing chemical equilibria in
natural waters. In Aquatic Chemistry (2rd edn.). Wiley interscience, pp. 62~0.
Subramanian, A.N. & Venugopalan, V.K. 1983 Phosphorus and Iron distribution in
two mangrove species in relation to environment, Mahasagar-Bulletin of the
National Institute of Oceanography, 16,183-191.
Sundareshwar, P.V. & Morris, J.T. 1999 phosphorus sorption characteristics of
intertidal marsh sediments along an estuarine salinity gradient. Limnology
and oceanography 44, 1693-1701.
Tanaka. K .. & C~oo, P. 2000 Influences of nutrient outwelling from the mangrove
swamp on the distribution of phytoplankton in the Matang mangrove estuary,
Malaysia. Journal of Oceanography 56,69-78.
Tezuka. Y. 1990 Bacterial regeneration of ammonium and phosphate as affected
by the carbon:nitrogen:phosphorus ratio of organic substrates. Microbial
Ecology 19,227-238.
Trott, L.A. & A1ongi, D.M. 1999 Variability in surface water chemistry and
phytoplankton biomass in two tropical, tidally dominated mangrove creeks
Marine Fresh Water Research 50, 451-457.
Twilley, R.R. 1985 The exchange of organic carbon in basin mangrove forest in a
south west Florida estuary. Estuarine, Coastal and Shelf Science 20, 543-557.
Valiela, I. 1984 Nutrient Cycles:Phosphorus, Nitrogen and Sulfur In Marine
Ecological Processes, Springer Verlag, New York, 312-340.
Venkatesan V. 2001 Sediment and water characteristics of selected prawn farming
sites at Cochin during pre-monsoon month. M.F.Sc. Dissertation submitted
Cochin University of Science and Technology, under the Post Graduate
Education and Research Programme in Mariculture, CMFRI, P.O. Box.
1603, Cochin 14.
"Viner, A.B. 1982 A quantitative assessment of the nutrient phosphate transported
by particles in a tropical river. Revue Hydrobiologie Tropicale 15, 3-8.
93

ChIlpter3
Wells, Mol., Mayer, L.M. & Gulllard, R.R.L. 1991 Evaluation of iron as a triggering
factor for red tide blooms. Marine Ecology Progress Series 69,93 -100.
Wolanski, E., Mazda, Y. & Ridd, P. 1992 Mangrove hydrodynamics. In Tropical
Ecosystems (Robertson, A.1. & Alongi, D.M., eds). American Geophysical
Union, Washington, D.C. pp 43-62.
"Wolanski, E. 1989 Measurements and modeling of the water circulation in mangrove
swamps. COMARF Regional project for Research and Training on Coastal
Marine Systems in Africa- RAF1871038. Serie Documentaire No.3, 1-43.
Woodroffe, C.D. 1985 Studies of a mangrove basin, Tuff Carter, New Zealand. III The
flux of organic and inorganic particulate matter. Estuarine Coastal and Shelf
Science 20, 447-462.
* Not referred in Original
94

Chapter 4
SEDIMENT CHARACTERISTICS AND
NUTRIENT STATUS
4.1 INTRODUCTION
Carbon, nitrogen and phosphorus are the most significant macronutrient
elements studied in aquatic system. In a specific aquatic system nutrient dynamics
partition these elements among water, sediment and biota to attain a natural
balance. This balance may change as nutrients are introduced from agricultural,
industrial and urban sources. Studies on nutrients in aquatic sediments are mainly
related to the assessment of the effect of thei~ increasing concentrations originating
from different sources. Accumulation of nutrients in water and sediments can result in
eutrophication of lakes, ponds and rivers. The eutrophication is often accompanied
by depletion of oxygen in the water and decrease of biodiversity in the affected water
body (Vollenweider, 1968; Foehrenbach, 1973; Sutcliffe and Jones, 1992). Bonani
et al. (1992) showed that sediments play an important role in the accumulation and
regeneration of nutrients. Organic matter produced by phytoplankton in eutrophic
shallow lakes settles to the sediment and decompose by aerobic and anaerobic
processes, during which different carbon, nitrogen and phosphorus compounds are
produced (Anderson and Jenson, 1992). Furthermore, d~composing organic material
affects changes in oxygen concentrations and redox potential, which in turn affects
nitrogen and phosphorus release from the sediments to the over!ying, water.
Sediments are often thought of as nutrient sinks by their capability to adsorb and
accumulate different forms of nutrients (Bailey, 1968).

Chapter 4
The ecological significance of carbon as a nutrient is through its organic
forms. The concentration of organic carbon in marine surface sediments depends
on the extent of supply of organic matter, preservation condition and dilution by
mineral matter. The results of organic carbon measurements are usually expressed
as total organic carbon (TOC) or Corg values in percentage of dry sediment. Within
sediment, the organic carbon content decreases with increasing depth due to
mostly microbiological remineralisation as well as abiological oxidation during early
diagenisis. Carrying out the analysis to the molecular level could arrive at the
chemical composition of this organic matter. The concentration of total organic
carbon is often used in correlation .with other elements. The carbon to nitrogen and
carbon to phosphorus is used to characterise the association of nitrogen and
phosphorus in organic matter. Nitrogen found in sediments in various forms
dissolved in pore water, adsorbed on the sediment and contained in particulate
organic detritus and living organisms of various sizes. Some of the forms defined
analyticaliy as exchangeable ammonium, exchangeable nitrate and total
nitrogen/total Kjeldahl nitrogen. Biological activity in living and dead tissues
produces reduced form of organic nitrogen ranging from simple amines to complex
proteins. Ammonia is the most reduced form of inorganic nitrogen, and is the
product of decomposition of organic matter. Bacterial oxidation in the nitrification
cycle produces nitrite and nitrate. Phosphorus species in the environment include
organic phosphorus compounds, inorganic phosphate and mineralised inorganic
complexes with iron, calcium and aluminium. Phosphorus precipitates to form low
solubility compounds and metallic complexes, and is relatively immobile compared
to carbon and nitrogen. The natural abundance of these nutrients is in the order
were carbon, nitrogen and phosphorus. Being the least abundant phosphorus is
considered as the limiting nutrient.
The amount of organic carbon in soil is important in soil classification and
chemical characterization. Many soil bacteria require organic carbon as an energy
source. Hence organic soil (organic carbon >6%) are likely to exhibit gieater
microbiological activity than mineral soils. Nitrogen exist in variety of forms in soils,
such as inorganic and organic forms like proteins, amino acids etc. The inorganic
forms, i.e., ammonium, nitrate and nitrite ions, are the only forms that can be directly
utilized by plants. Phosphorus also exists in a variety of chemical forms, which again
can be broadly subdivided into organic and inorganic forms. Organic matter in
sediments relative to the primary producers is enriched particularly in carbo" and
96

Sediment Characteristics and Nutriellt Status
hydrogen, whereas it is depleted in oxygen, (but the degree depend on the extent of
sedimentary organic matter), nitrogen and phosphorus. Loss of nitrogen occurs by
preferential degradation of organic nitrogen compounds. Depletion of phosphorus is
due to facile hydrolytic cleavage of bound phosphate groups.
Tropical mangrove forests are very productive, and their associated food
chains and nutrient cycles are often closely linked to those in adjacent coastal
waters (Woodroffe, 1992). Tropical mangrove sediments possess reduction,
oxidation properties, and other physicochemical characteristics such as pH, grain
size etc typical of other estuarine and marine intertidal deposits (Boto and
Wellington, 1984). Physical, chemical and biological processes, operating in
mangrove ecosystems to sustain high levels of productivity are due to the wide
range of interactions among different structural components such as soil, water,
flora and fauna of the ecosystem. The cycling of nutrients in a mangrove
ecosystem begins with the litter decomposition. The litter decomposition takes
place by the combination of two processes. The leaching of either elements or
compounds (Steinke et al., 1993) and also by the microbial degradation (Lee et al.,
1990). The leaching eventually attracts, more bacterial population (Rajendran and
Kathiresan, 1999). Bacteria and fungi contribute to decomposition of the mangrove
material and to the transformation and cycling of nutrients. A number of factors like
the species of the plant, tidal height, rainfall, temperature etc affect the rate of litter
decomposition and therefore the rate of nutrient cycling. The degrading plant litter
is consumed by wide variety of organisms as well as it releases nutrients to
mangrove ecosystem for recycling. The mangrove insects and macrobenthic
community act as macro degrader by braking the large, thick, wax coated
mangrove leaves into smaller fragments. Then mangrove microbial communities
(viz., bacteria, fungi and protozoa) complete the degradation of the litter into
detritus. The deposit feeders (viz., crabs, molluscs, polychaetes, nematode etc)
through their feeding activities turn over the surface sediment layer thereby
exposing new litter surfaces to microbial attack. Edaphic factors that influence the
productivity are anaerobiosis, nutrient availability and salinity. Factors that prevent
build up of entirely anoxic conditions in mangrove mud are not known, but this
characteristic has been ascribed to several factors such as crab burrowing, poor
quality of organic matter, high bacteri~1 activity and trMc::location of oxygen by
mangrove trees to their roots.
97

Chapter 4
Mangroves are shallow rooted, the roots being concentrated mainly in the
top 50-100 cm of the soil and seldom penetrating to the depths beyond 2 m. Water
and nutrients are absorbed by a dense mat of fibrous roots that usually originate
from underground cable roots or smaller secondary roots in close proximity to the
aerial "breathing" roots and in the case of Rhizophora, at the pOints of entry of the
prop roots to the soil (Gill and Tomlinson, 1977). The shallowness of the root
system, together with the close physical coupling of the smaller metabolically active
roots and the aerial roots minimises the distance through which gases such as
oxygen must diffuse in order to reach the extremities of the root system. In view of
the fact that most of the fine absorbing roots are found near the soil surface, the
physical and chemical properties of the rooting depth of the soil are probably more
important than thos~ at greater depth.
This chapter is concerned with the contributions of mangrove detritus to
adjacent near shore areas in terms of sediment nutrient levels. Although much of
the deposited plant litter is highly refractory, the amount of sedimented material
appears to enrich the bulk concentration of carbon and nitrogen in sediments
(Alongi, 1990). Grain size analysis of surface and core sediments, total organic
carbon, total nitrogen, and total phosphorus were determined and their seasonal
discourse was found out. The spatial and temporal variations in stoichiometries of
carbon, nitrogen and phosphorus were also computed.
4.2 RESULTS AND DISCUSSION
4.2.1 Properties of Surface Sediments
Grain size distribution
A great variety of grain sizes are typical for the sediments on the near
shores, with very coarse sand or gravel accumulating in high-energy environments
and very fine-grained material accumulating in low-energy environments. The
development and the hydrodynamic history of terrigenous sediments are described
in its essentials by the grain- size distribution and the derived sediment
characteristics. Therefore a classification on the basis of textural features appears
suitable to describe the terrigenous sediments. The subdivision of sedimentary
particles in the present study encompasses three major categories: sand (>63IJm),
silt (4-63IJm) and clay «4IJm), each further divided into a number of subcategories.
98

Sediment Characteristics and Nutrient Status
Plotting the percentages of these grain sizes in a ternary diagram results in a
basically quite simple and clear classification of the terrigenous sediments. The ........ ,... ,
classification of clastic sediments as proposed by Folk (1974) is made use of ir)#,·""---- '-'~i;/ present study. I~ I \~
~ I ." "'. -~'" . Table 4.1 Seasonal variations of GSA of surface sediments " ~ \ '., I.
~
Stations Season Sand % Silt % Clay % Nature of sedi~~ ...
Pre-monsoon 11.33 58.04 31.12 sandy mud
Station 1 Monsoon 16.89 55.10 28.07 sandy mud
Post-monsoon 29.57 45.27 25.16 sandy mud
Pre-monsoon 16.17 51.07 33.08 sandy mud
Station 2 Monsoon 17.72 58.96 24.29 sandy silt
Post-m on soon 41.72 40.91 16.93 sandy silt
Pre-monsoon 76.13 11.75 12.39 muddy sand
Station 3 Monsoon 81.91 10.31 8.12 muddy sand
Post - monsoon 85.21 7.15 7.64 muddy sand
* According to Folks classification
The surface sediments showed substantially high content of mud (silt + clay)
at Station 1 and Station 2. while the sediments at Station 3 showed a higher
percentage of sand. Surface sediment in the study area were found sandy mud
(Station 1). sandy silt (Station 2) and muddy sand (Station 3) as per Folk's
classification (1974) (Table 4.1). Remarkably pigh percentage of silt and clay were
recorded at Station 1 and Station 2 whereas Station 3, characterized by the high
percentage of sand. The annual and seasonal variation in the percentage
composition of sand, silt and clay were furnished in Figures 4.1a-1d. The sandy
mud sediment (Station 1) recorded the composition of 45.27 to 58.04% silt, 25.16
to 31.12% clay and 11.33 to 29.57% sand, during three seasons. Sediments at
Station 2 composed of two texturai classes, sandy mud, during pre-monsoon and
sandy silt. during monsoon and post-monsoon. Sand, silt and clay in sandy mud
sediment were 16.17, 51.07 and 33.08% respectively. Post-monsoon season
characterised by a remarkable increase in sand percentage at Station 2. Station 3
revealed the predominance of muddy sand during ail three seasons. The
percentage of sand was observed to increase from 76.13% during pre-monsoon to
99
.. -
.I.t; /"..(J/
-----; ..... / .. I'II.:.J!""£' .

85.21 % during post-monsoon. The mean percentage composition of each fraction
(Figure 4.1 a) also showed substantially high percentage of silt at Station 1 and
Station 2 while sand at Station 3. The characteristic root system of mangroves has
a dense grid of vertical pnuematophores and arial roots. This structure traps
floating detritus and reduces tidal flow, eventually creating conditions where
suspended clay and silt particles settle (Soto-Jimmenez and Paez-Osuna, 2001).
., "" " '" 'so .... " " " o
70
" 50 ,,, .. "
20
" o
Mean ·I.of sand, silt and clay
2 3 SUHons
C Sand 1:1 Sit • oay (a)
Silt
2 SUUons
3
D P~ ..... onsoon .Monsoon DP05! ..... onsoon
(c)
'00
"" . " .. " 20
o
Sand
, , Sblttonl
C Fte-lTDnsoon • MJrlsoon D Fbst-mlnsoon
35
30
2S
i 20 .. " " 5
o
(b)
Clay
, SblUonl
C Fte-rronsoon. MJrlsoon D Fbst-rronsoon
(d)
Fig. 4.1 Annual and seasonal variations of '1.sand, 'I. slit, % clay
The thick mangrove canopy and comparatively low tidal effects at Station 1
and Station 2 might promote siltation and accumulation of mud rich sediments. The
mangrove area of Kannur was also found to have sandy mud sediment nature
where there is rich mangrove vegetation (Badarudeen et af., 1998). Muddy sand
nature predominated at Station 3.which experience tidal effect. The flooding and
ebbing of tidal waters promote washing off finer particles, particularly silt and clays ,
100

Sediment Characteristics and Nutrient Status
leaving the coarser sand grains as lag concentrates. The low density of plants at
this site also promotes the winnowing process to a greater extent. The mud rich
sediment observed at Stations 1 and 2, showed the minimum tidal effect at these
sites and sand dominated sediment at Station 3, had resulted from maximum tidal
effect at this site. The finer fractions . (silt + clay) Qf the sediment found to be
removed where there is maximum tidal influence and impact of waves.
Moisture.
The moisture content (percentage by weight) of the surface sediment varied
from 35.15% (Station 3) to 72.14% (Station 1) (Table 4.2). The mean moisture
percentages observed were higher at Station 1 and Station 2, while low
percentages were recorded at Station 3. The seasonal variations in moisture
percentage were depicted in Figure 4.2. Seasonal variations in moisture
percentage recorded the general pattern, with a maximum during monsoon and
minimum during pre-monsoon except 'at Station 2. However, pre-monsoon season
was associated with maximum percentage of moisture at Station 1 attributed to the
high organic carbon.
Table 4.2 Seasonal variation ~f moisture (%) In surface sediments
5taliO[l2 Monsoon
65.51
62.43
61.25
72.14
63.40
62.56
68.83
62.92
61.91 ,1'. ". ' i , . , .... ' .. • . 1;") ' :("-(", J ~ .• _. . ~_~. • •. ~.L~
61.49 65.72 63.60
65.37 70.31 67.84
Post-monsoon 61.68 63.45 62.57
Pre-monsoon 35.15 42.44 38.80
Monsoon 41.55 47.50 44.53
38.49 46.52 42.51
101

Chapter 4
80 70 60
~ 50 • }; 40 ;I!. 30
20 10
0 -1-"-
Seasonal variation of moisture
2 3
Station
o Pre-rronsoon _ M:)nsoon D Pbst·rronsoon
Fig. 4.2 Seasonal mean variation of moisture (.".) in surface sediments
Remarkably higher moisture percentages were recorded at the first two
Stations and lowering at Station 3 might be associated with the nature of
sediments. The high proportion of fine fractions in sediment texture enables them
to hold more water than the coarse sediments. The higher percentage of moisture
observed at Station 2, during pre-monsoon might be associated with organic matter
present in the sediment. It was well established that, an increase in moisture in
sediment was associated with an increase in organic matter. In the present
investigation, moisture percentages were positively correlated with percentage of
clay, and percentage of silt and organic carbon. A significant negative correlation
was also observed with the percentage of sand. The present observation indicated
the spatial and seasonal variation in moisture content could be attributed to the
variation of organic matter and grain size of the sediment.
pH
The pH of the mangrove sediments is governed by the concentrations of
reduced iron and manganese hydroxides and carbonates, carbonic acid and humic
acid (Patric and Mikkelsen, 1971). The pH values of the surface sedimenls
recorded were in the range 7.63 to 8.63 at Station1, 8.08 to 8.81 at Station 2 and
6.02 to 8.08 s! ~:.:: ;;:m 3 (T~::-la 4.3). Sediments at Station 1 and Station 2 were
generally alkaline while that at Station 3 were acidic. Seasonal variations of pH
values are depicted in Figure 4.3. Minimum pH values were recorded either during
102

Sediment Cllaracteristics and Nutriellt Status
pre-monsoon or post-monsoon at all stations. Monsoon season was characterised
by maximum value of pH at all stations. A significantly low pH value was recorded
at Station 3 during post-m on soon.
Table 4.3 Seasonal variation of pH In surface sediments
Station 1
Station 2
Pre-monsoon 6.63 7.63
Monsoon 6.23 6.36
Post-monsoon 7.97 6.22
Pre-monsoon 6.06 6.26
Monsoon 6.57 6.61
Post-monsoon 6.23 6.53
Pre-monsoon 7.03 6.06
Monsoon 7.66
Seasonal variation of pH In surface sedlments
9.0
B.5 B.O
.:! 7.5 § 7.0
:a. 6.5
6.0 5.5 5.0 l--J"-'-
2 3 Station
(lJ Pre-monsoon _ M:lnsoon a Fbst-rronsoon
Flg.4.3 Seasonal mean variation of pH In surface s.dlm.nts
6.13
6.31
6.09
6.16
6.69
6.36
7.56
7.79
6.66
Seasonal variation of pH (Figure 4.3) may be attributed more riverine
environment prevalent at Station 3. Decreasing of pH values during pre-monsoon
and an increasing trend during monsoon indicated an enhanced microbial activity
103

Cllapter 4
in summer months. Also marked low pH values recorded at Station 3 post
monsoon, might be associated with the productivity of surface sediment. pH values
observed were positively correlated with total organic carbon (TOC), total nitrogen
and ammonium concentrations.
4.2.2 Nutrient levels in surface sediments
Total Organic Carbon (TOC)
The preservation of mangrove forests rests on the belief that carbon and
energy fixed by mangrove vegetation is the most important nutritive source for
animal communities in and near mangrove wetlands (Saenger et al., 1983). The
relative contribution of mangrove carbon to total estuarine or wetland primary
production varies with forest types, and the amount of clear, open water in the
system. The dominant source of carbon is the forest itself, in a riverine mangrove
system, where the ratio of forested to open water habitat is high. In a fringing
forest. phytoplankton, benthic algae and also other macrophytes become major
source of carbon (Day et al., 1982).
Biogenic organic matter is considered labile under most sedimentary
conditions due to its sensitivity to oxidative degradation. either chemically or
biologically mediated. This is true in well-oxygenated waters. Therefore abundant
accumulation of organic matter is associated with anoxia. While recently it was
established that high primary productivity in a dynamic system might also contribute
to the organic matter in sediments (Pedersen and Calvert. 1990; Demaison, 1991).
The food chain in mangrove forests suggested that the prinCipal flow of energy
was along the route, mangrove leaf litter ~ saprophytic community ~ detritus
consumers ~ lower carnivores ~ higher carnivores (Odulll and Heald, 1975).
The seasonal variations of TOC concentrations in surface sediments are
depicted in Table 4.4. The concentrations varied between 21.67mg g" (Station 3)
and 117.80mg g,1 (Station 1). Remarkably higher TOC concentrations were
recorded at Station 1 and Station 2, compared with Station 3. Generally minimum
TOC concentrations were recorded during pre-monsoon at all staticns while
maximum values were recorded during post-monsoon except at Station 3 (Figure
4.4). However Station 3 recorded similar TOC concentrations during all seasons.
104

Sedimellt C/laracteristics and Nutrient Status
Table 4.4 Seasonal variations of TOe (mg g.1) In surface sedlments
61.93 66.42 64.18
84.21 99.94 92.07
Post-monsoon 94.29 117.80 106.04
Pre·monsoon 69.13 75.82 72.47
Monsoon 72.75 106.16 89.46
Post-monsoon 99.20 104.06 101.63
Pre·monsoon 24.72 31.71 28.22
Station 3 Monsoon 21.67 41.07 31.37
Post- monsoon 26.54 32.76 29.65
Seasonal variations of TOe 120
100
80 -",
~ 60
40
20
0
2 3 Station
C Pre-rronsoon • M:>nsoon C FbsHronsoon
Fig. 4.4 Seasonal mean variation of Toe in surface sediments
The organic content of mangrove sediments is usually high with carbon
levels typically ranging from 2 to 15% dry weight (Boto and Well igton, 1984;
Krislensen et al., 1988). The total carbon in surface sediments of south Andaman
varies from 0.65% 10 2.37% (Oinesh, R et al., 1996). A10ngi et al. (2000) observed
that an equal or greater proportion of mangrove carbon is stored in above and
below ground biomass than in sedimentary pools, hence the high retention of fixed
carbon is one of highly efficient mechanism to conserve essential nutrients. In the
105

Cl1apter4
Bangrong area, (Phuket island, Thailand) organic carbon content of mangrove
sediments found varied from 0.5 mmol g-' to 3.7mmol g-'dry weight of sediment
(Kristensen et al., 2000). The mangrove environment of Goa, India, exhibited TOe
concentration ranged from 0.17% to 3.86% of sediment dry weight, and a marked
variation in its distribution also observed (Jagtap, 1987).
Remarkably high TOe concentrations were noticed in the surface sediments at
Station 1 and Station 2 which were varied between 61.93 mg g-' and 117.80 mg g-'
(6.2% to 11.7%). However, Station 3 characterized by relatively low concentration of
TOe, varied between, 21.67 mg g-' and 41.07 mg g-' (2.2% to 4.1 %). The annual mean
value of TOe concentration recorded similar values at Station 1 and Station 2. Earlier
reports on concentration of TOe at mangrove areas of eochin showed that the values
ranged between 0.17% and 4.05% (Sunil Kumar, 1996) 0.64 to 7.94% (Badaruddin,
1997). It is well known that coarser sediments usually have lower concentration of
elements and pore water solutes than finer deposits. The prevalent hydrodynamics and
the presence of mangrove roots which are well developed at Station 1 and Station 2,
retained fine fraction of sediment. The characteristic root system of mangroves has a
dense grid of vertical pnuematophores and arial roots. This structure traps floating
detritus and reduces tidal flow, eventually creating conditions where suspended clay and
silt particles settle (Soto-Jimmenez and Paez-Osuna, 2001). Thus the plant density
together with the low energy tidal regime enhances the concentration of TOe at Station
1 and Station 2.
Organic matter produced or.deposited on the sediment surface in mangrove
forests supports aerobic and anaerobic detritus food chain. Aerobic microbial
decomposition of organiC matter is usually more rapid than the rate of oxygen
diffusion into surface sediments, and oxygen quickly becomes limiting. Anaerobic
bacteria below the upper few millimeters of sediment therefore carry out most
decomposition, except where animal burrows and plant roots channel oxygen to
deeper sediment layers (Anderson and Kristensen, 1988; Aller, 1994). Anaerobic
decomposition in marine sediments is performed by a wide variety of bacterial
types utilizing a number of electron acceptors (e.g., nitrate, oxidized iron and
manganese and sulphate) to oxidize carbon. The present investigation observed a
seasonal variation of TOe concentrations, which might be associated with the
variation in bacterial density. Pre-monsoon season associated with high
temperature as well as restricted flow of water flourish the growth of bacteria and
106

Sedime"t Characteristics a"d Nutriellt Statlls
associated mineralisation resulted in lowering of organic carbon. Several factors
like warm temperature, release of nutrients by mangrove roots, rapid deposition of
organic matter etc account for the bacterial numbers and activity (Alongi et al.,
1993). These conditions were optimum during pre-monsoon, hence decomposition,
followed by lowering of TOe at Station 1 and 2. However Jagtap (1987) found
seasonal variations of TOe could also be attributed to their oxidation and living
organisms present in the few centimeters of the sediment.
The statistical analysis exhibited a significant positive correlation of Toe
concentrations with percentage of clay, percentage of silt, percentage of moisture,
TN, TP and ammonium concentrations (p< 0.01, 0.001) (Table 4.5). The
percentage of TOe in surface sediment from three stations was found to be
relatively higher than the earlier observations at the mangrove habitats of eochin
estuary. The results indicate that the lack of microbial break down of organic
carbon with respect to the organic load at these sites. Maximum TOe was noticed
at Station 1, which was characterized by more anthropogenic input.
Table 4.5 Correlation matrix between parameters of surface sediments
% of clay %ofsilt %ofsand % of moisture pH TOC TN ! TP Ex.Amm. Ex. NO,
% of clay 1
% of silt 0.9225'" 1
%ofsand -0.9621'" -0.9927"" 1
%of moisture 0.8403'" 0.9482'" -0.9315'" 1
pH 0.5753' 0.7083" -0.6786" 0.7343'" 1
TOC 0.6250" 0.7803'" -0.7499'" 0.8219'" 0.6837" 1
TN 0.6979" 0.8087'" -0.7916'" 0.8454'" 0.6900" 0.8932···· 1
TP 0.5165 0.5211' -0.5314 0.6486" 0.4365 0.6470" 0.6372" 1
Ex.Amm. 0.6286" 0.7011" -0.6915" 0.8177'" 0.5358' 0.5929' 0.7598'" 0.7738'" 1
Ex.NO, 0.4932' 0.4833' -0.4949' 0.5143' 0.4431 0.3909 0.4592 0.6780" 0.6327" 1
p<0.05* p<0.01** p<0.001 U *
107

C/tnpter 4
Total Nitrogen (TN)
Nitrogen is the second most abundant element and like carbon, exist in a wide
range of organic forms. Unlike inorganic carbon, transformation between inorganic
nitrogen species occur almost exclusive through biological processes with physical
equiJibria assuming a mirror role. Nitrogen enters mangrove sediments primarily via
autochthonously produced leaf litter, microalgae and epiphytes. Other sources
include nitrogen fixation by bacteria and cyanobacteria as well as possible particulate
and dissolved nitrogen from adjacent coastal zone (A1ongi et al., 1992). Due to high
content of nitrogen-poor structural carbohydrates in mangrove litter entering the
sediment, the nitrogen content of sediment detritus is relatively low, varied from
0.05% to 0.4 % dry weight (Kristensen et al., 1988). There are several studies, which
establishes that the lart)est part of the tolal soil nitrogen was present in sedimente.d
organic matter (Cartaxana et al., 1999).
Total nitrogen (TN) concentration in surface sedimenls exhibited spatial and
seasonal variations. The minimum concentration recorded at Station 3 (O .97mgg")
and maximum concentration was recorded at Station 2 (4 .90mgg'l) (Table 4.6).
The annual mean values recorded were similar to TOC at Station 1 and Station 2,
which exhibited remarkably higher concentration of TN than at Station 3. Seasonal
variation in TN concentrations are depicted in Figure 4.5. Unlike TOe, maximum
concentrations of TN were recorded during pre-monsoon and minimum was
recorded during monsoon at all stations.
Table 4.6 Seasonal variations of TN (mg g'1) in surface sediments
Stations Season Mln Max ... '. Mean • Pre-monsoon 2.90 3.19 3.05 -
Station 1 Monsoon 2.38 4.01 3.20 -Post-monsoon 3.63 4.00 3.82
:-&mual.J1lea 3.38 Pre-monsoon 4.17 4.50 4.34
Station 2 Monsoon 3.77 4.35 4.06 Post-monsoon 4.80 4.90 4.85 Annual mean 4.46
Pre-monsoon 1.21 1.44 1.32
Station 3 Monsoon 0.97 1.23 1.10
Post - monsoon 1.00 1.21 1.10 AnnUal mean 1.31
108

o
Sedimellt Cltaracteristics a"d Nlltriellt Status
Seasonal variations of TN
2 Statbns
3
[] ~e-rronsoon _ M:msoon [] Fbsl-rronsoon
Fig. 4. 5 Seasonal mean variations of TN in surface sediments
Published literatures on TN concentrations in sediments of Cochin
mangroves are rare. However, Remani et al. (1980) have reported a range of
O.70-3.73mg g-1 for TN concentrations in sediments of the Cochin estuary. They
found that the maximum value recorded at a Station near a fertilizer factory during
monsoon months. TN concentrations in sediments of Pichavaram mangrove area
(south east India) were varied between 2.33 gm·2 and 3.4 gm-2 (Kathiresan et al.,
1996). Robertson and Phillips (1995) reported that the nitrogen content in
mangrove soil is O.6-2.0mg g-l, with organic nitrogen being the main form . TN in
sediments from mangrove habitats on the c"larence River, Australia, was varied
between 1.02mg g-1 and 1.12mg g-1 (Smith, 1996). While Wahab and Sterling
(1991) reported that in the accuniulating sediment of culture ponds, the TN
averaged between 3.5mg g-I and 8.7mg g-l . Holmer and Olsen (2002) have
reported a range of 0.24 to 0.25% DW for mangrove sediment of Bangrong (Phuket
Island, Thailand). Thus during the present study, Station 1 and Station 2 showed
TN concentrations, which were found not high as that of culture pond sediments
but greater than that of 8an9rong mangrove sediments (Table 4.5). Station 3
(O.97-1.44mg g' l) exhibited concentrations similar to that of other mangrove
ecosystem and reported values of eachin estuary.
It was well established that nitrogen fixation by cyanobacteria and
heterotrophic bacteria are the important nitrogen transformation processes in
mangrove iorests, occurs on all inhabitable surfaces within the forest like sediment
surface, prop roots, bark, logs and leaf litter (Sheridan, 1991; Alongi et 3/., 1992).
109

Chapter 4
TN concentrations recorded during the present study (Station 1 and 2) were in the
maximum range of what reported !n earlier studies of Cochin estuary. Remarkably
higher concentrations of TN, at Station 1 and Station 2 may be attributed to an
increased nitrogen fixation takes place at this site. Also elevated TOC
concentrations at these stations support a higher nitrogen fixation. Clough et al.,
(1983) found an increased rate of nitrogen fixation after the experimental addition
of organic carbon. However with respect to inorganic nitrogen, mangrc,ve
sediments are poor in release and transformation processes but are efficient in
microbial assimilation (Kristensen et al., 2000).
Other than nitrogen fixation, bacteria also serves as an agent for assimilation
of organic nitrogen pool. Pedersen et al. (1999) found that bacteria incorporatt:;d
nitrogen frolT the indigenous particulate organic nitrogen pool, where as detritus
served as energy source. Seasonal variation of TN (Figure 4.5) might be
associated with the rate of change of microbial assimilation of nitrogen. The studied
area was recorded minimum TOC concentration during pre-monsoon, associated
with an elevated microbial activity, in turn an increased assimilation of nitrogen was
observed during pre-monsoon. Also many stUdies in mangrove areas reported
bacterial fixation of nitrogen (Ravikumar, 1995; Palaniselvam, 1998). Furthermore,
maximum TN concentrations were recorded during post-monsoon, indicated
maximum nitrogen fixation in optimum conditions.
TN concentrations were positively correlated with percentage of clay,
percentage of silt, percentage of moisture, concentrations of TP and exchangeable
ammonium (p<0.01, p<0.001) (Table 4.5). The positive correlation of TN and
exchangeable ammonium concentrations indicated their closed cycling. Seasonal
variation in concentration of TN may also associated with adsorbed ammonium
present in the sediment. During the present study an increase in concentrations of
TN at different stations was observed with respective increase in TOC
concentrations at these stations, indicated nitrogen fixation through cyanobacteria
and heterotrophic bacteria.
Total phosphorus
Total phosphorus concentration in mangrove sediments appears to fall within
the range 0.2-1.5 mg g.1 (Shanmukhappa, 1987; Dinesh et al., 1998; Alongi et al.,
2000). Because of their high organic content mangrove sediments may contain
110

Sedimellt C/laracteristics arId Nutrimt Status
relatively large amount of organic phosphorus. The organic phosphorus accounted
for 75-85% of the total phosphorus in mangrove sediments from Sierra Leone and
Nigeria (Clough et al. , 1983). Most of the organic phosphorus in mangrove
sediments probably occurs as complexes with humic and fulvic acids (Sommers
et al. , 1972). Paludan and Morris (1999) reported that phosphorus can be
preferentially bound to humic acids and trapped in the Fe{lIl) and aluminium pools.
This suggests that the mineral composition of sediments also contribute to the
observed difference in their phosphorus exchange properties. The phosphorus
sorption potential of sediment appears to be controlled by abiotic mechanism such
as salinity, sediment surface area, cation exchange capacity and the mineral
composition of sediments (Sundereswar and Morris, 1999).
Table 4.7 summarises the meaSlTements of TP in surface sediments from
mangrove habitats. Station 3 had the minimum level of TP, while sediment from the
Station 1 and Station 2 had the maximum levels. The concentrations recorded were
SImilar at Station 1 and Station 2, w.ere varied from 1.12mg g-1 to 2.11mg g.1 but
those from Station 3 were significantly lower, ranges from, 0.49mg g-l to O.80rng g.l.
The annual mean concentration recorded maximum at Station 2 and minimum at
Station 3. Seasonal variations. in TP concentrations are depicted in Figure 4.6.
Minimum concentrations of TP were recorded during pre-monsoon at all stations,
while maximum were recorded either during post-monsoon or during monsoon.
Table 4.7 Seasonal variations of TP(mgg-1)insurfacesediments
Stations Season Min Max, . Mean
Pri;-rnonsoon 1.12 1.48 1.30 Station 1 Monsoon 1.35 1.64 1.49
Post-monsoon 1.69 1.96 1.82 Annual mean
Pre-monsoon 1.41 1.61 1.51
Station 2 Monsoon 1.71 2.11 1.63 Post-monsoon 1.50 1.63 1.57 Annual mean 1.66 Pre-monsoon 0.49 0.63 0.56
Station 3 Monsoon 0.58 0.80 0.69 Post - monsoon 0.66 0.78 0.72 ~nual mean 0.66
111

Clrapter4
2.5
2.0
i:n 1.5
g' 1.0
0.5
0.0 '-'-
Seasonal variations of TP
2
Station
o A'e-rronsoon _ M:>nsoon 0 Fbst-rronsoon
3
Fig. 4.6 Seasonal variations ofTPinsurfacesediments
The observed TP concentrations at first two stations were higher than that
reported in other mangrove habitats but however, comparatively lower than the TP
concentrations reported in earlier studies undertaken in each in mangroves
(Badaruddin, 1997). Remarkable spatial variation with higher values at first two
stations might be attributed to different hydrodynamic regime play at these sites.
Station 3 marked by the overbearing of coarse fraction, which inhibits accumulation
of phosphorus in sediments.
Immobilisation of phosphorus in chemical complexes is a major process
occurring in sediments, The oxidative reactions associated with iron and
manganese hydroxides would immobilize phosphorus in sediments (Boto. 1992).
However, the capacity of sediments to adsorb or immobilize phosphorus is limited
by availability of exchange sites and by redox status. The highly reduced mangrove
soils have far less capacity to absorb and occlude phosphorus because of the
greater solubility of ferrous sesquioxides in the reduced soils. Thus the seasonal
variation (Figure 4.6) observed during the present study might be attributed to the
variation in redox status of the soil. Pre-monsoon season characterised by low
fresh water input into the creeks and weak tidal reg ime lead to the accumulation of
organic matter. The oxidation of organic matter resulted in the development of
anoxic microzones on the sediment surface. Thus iron mineral acts as electron
donors, subsequently soluble iron phosphate would be produced. Thus the
anaerobic decomposition laking place in these ecosystems by a wide variety of
bacterial types, utilizing iron minerals as electron acceptors to oxidise carbon might
112

Sedimellt Cllaracteristics a"d Nutrient Status
be an important mechanism to decrease the level of sediment associated TP. The
increase in TP concentration during monsoon might be associated with the
oxidised iron minerals in surface sediment. Anaerobisis exerts profound influence
on the chemistry of phosphorus and nitrogen (Clough et al., 1983).
TP concentrations showed significant positive correlation with percentage of
silt, clay, moisture, TOC and ammonium concentrations (p<0.05, 0.01 )(Table 4.5).
The positive relationship between TP and ammonium again confirms the anaerobic
decomposition taking place in sediments. Organic nitrogen mineralisation in
sediments was found to be a significant source of ammonia nitrogen to the
overlying water (Blackburn et al., 1988). The cycling of phosphorus in the studied
area is highly dynamic at least at first two stations, where the sediments act as an
efficient sink for phosphorus as far as an aerobic environment prevailed.
Exchangeable ammonium.
Ammonium is the main form of inorganic nitrogen in anaerobic mangrove
soils because nitrification of organic nitrogen stops at ammonium due to the lack of
oxygen to oxidise it further to nitrate (Ponnamperuma, 1972). Like other cations,
ammonium is capable of occupying cation exchange sites in soils. However the
high level of sodium in most mangrove sediments tend to swamp the cation
exchange sites, thereby displacing ammonium. Consequently ammonium
associated with sediments concentrate more in dissolved phase than in solid
phase. Interstitial ammonium is highly mobile and is thus susceptible to being
leached by heavy rain or lo~t through drail)age following tidal inundation. The
permeability of mangrove sediments are quite low, particularly in sediments with
high clay and silt content, so that the loss of ammonium and other soluble nutrients
through leaching and drainage may not necessarily be severe. The low
permeability of the sediment may be offset by drainage via channels, which form as
the result of the burrowing activity of animals and the decomposition of roots.
The exchangeable ammonium concentrations varied between 0.081Jmol g-1
(Station 3) and 0.841Jmol g-1 (Station 1 and Station 2), (Table 4.8). Similar to other
elements, ammonium concentrations also recorded maximum valuelS at Station 1
and Station 2. Seasonal variations of exchangeable ammonium concentrations are
depicted in Figure 4.7. Higher values were recorded during pre-monsoon at Station
1 and no significant seasonal variation at other two stations.
113

Chapter 4
Stations
Station 1
Slation 2
Station 3
g g "-
Season Min Max
Pre-monsoon 0.41 0.84
Monsoon 0.32 0.42
Post-monsoon 0.22 0.40
Annual mean
Pre-monsoon 0.38 0.84
Monsoon 0.47 0.59
Posl·monsoon 0.57 0.66
Annual mean
Pre·monsoon 0.08 0.19
Monsoon 0.17 0.26
Post - monsoon 0.12 0.20
Annual mean
Seasonal varlatlon of exchangeable ammonium
0.70
0.80
0.50
0.40
0.30
0.20
0.10
0.00 2
Station 3
_ Pre-monsoon _ Monsoon 0 Post-monsoon
Mean
0.61
0.37
0.32
0.44
0.55
0.52
0.60
0.55
0.15
0.20
0.16
0.17
Fig. 4.7 Seasonal mean variation of exchangeable ammonium In surface sedlments
The exchangeable ammonium concentration in Futian mangrove forest
(Shenzhen. South China) found to vary from 68.35 ~g g'1 to 71 I-Ig g" (Li. 1997). In
salt marsh ecosystem in Portugal, the exchangeable ammonium concentrations
were found to vary from 1.33 to,jJ I-Ig N 9 ~ ary weight (Cartaxana et a/., 1999).
Here a clear seasonal variation in concentration of ammonia was found , showing a
maximum during hot season. In Australian mangrove ecosystem (Clarke. 1985)
114

Sedimellt Characteristics alld Nutriellt Statlls
found the variation as 8-111 IJM in a fringe forest and 7-39 IJM in a riverine mangrove. Low concentration of exchangeable ammonium was observed in the
present study may be due to its removal to interstitial phase and in turn leached by
tidal water. Clay rich sediment at Station 1 and Station 2, may be attributed to the
remarkably high concentrations of ammonium observed at these sites. Exchangeable cations found to be high in soils having high organic carbon and
clay as they provide greater surface area for adsorption of the cations. A clayey soil
rich in organic matter encourage the growth of benthic algae which, along with the
associated micro-organisms, form the main food of fishes. Also the microorganisms
responsible for nitrogen fixation and mineralisation of organic matter thrive well in muddy bottom. Observed minimum concentration at Station 3, associated with
sandy bottom sediment as well as a regular tidal incursion may also remove
ammonium from the soil as it is soluble in water.
The seasonal variation in ammonium at this site was attributed to variation in the amount of organic matter. Comparatively higher values were observed during
pre-monsoon and post monsoon at Station 1 and Station 2. The high concentration
of available ammonium was attributed to high early summer nitrogen mineralization (Cartaxana et al., 1999). Maximum concentration of exchangeable ammonium was
observed during monsoon, at Station 3. This was due to the ammonium that was brought into the system through the allochthonous matter.
Statistical analysis on correlation revealed the positive relationship (Table 4.5) of concentration of ammonium with percentage of clay, silt, concentrations of
TOC, TP, and TN (p<O.05, p<O.01, p<.001). The positive correlation of
exchangeable ammonium and percentage of clay indicated that the higher
percentage of this exchangeable ammonium was due to the decreased mobility in
interstitial phase.
Exchangeable nitrate
Two key processes, nitrification and denitrifiction primarily drive dynamics and f1uxes of nitrate in marine sediments. Chemoautotrophic oxidation of
ammonium to nitrate by nitrifying bacteria in oxic zones of the sediment, and subsequent reduction of nitrate to nitrogen gas by heterotrophic denitrifiers in
anoxic zones, are known to be an efficient sink for combined nitrogen in most
m~rine environment:; (Jenkins and Kemp, .1984; Lindau and DeLaune, 1991; Binnerup et al., 1992). However, only a few attempts have yet been made to
determine rates and processes of nitrate transformation in mangrove sediments
115

Chapter 4
(A1ongi et al., 1993; NedweUet al., 1994). Insufficient oxygen diffusion through the watertogged soil may reduce rates of nitrification and explain the tow nitrate concentration in sediments. Denitrification of nitrate formed to gaseous nitrogen and nitrous oxide may also have contributed to low nitrate concentration found in salt marshes (Cartaxana et al., 1999). In their study a salt marsh ecosystem in Portugal, the exchangeable nitrate found to vary from 2-50 nmol Ncm-3. One
important sinl< for nitrate at the sediment-water interface in mangrove sediments is the active community of benthic microalgae (A1ongi et al., 1993).
Generally, very low exchangeable nitrate concentrations, nanomol, range
were observed at all stations. Significantly higher concentrations were recorded at
Station 1 and Station 2, while lower values were recorded at Station 3. The values
ranged between, 3.29 Ilmolg+1 (Station 3) and 64.31Ilmolg·1 (Station 1) (Table 4.9).
Remarkable seasonal variations of exchangeable nitrate concentrations were
found at all stations (Figure 4.8). Station 1 and Station 3, recorded maximum
values during monsoon while at Station 2, maximum value observed during pre
monsoon. Minimum values recorded at all stations during post-monsoon.
Table 4.9 Seasonal variatIon of exchangeable nitrate (nmol g" ) in surface sedlments
116
8 .09
7.55
3.29
12.25
30.71
5.02
29.63
32.63
19.48
9.64
17.17
4.03

40.00
35.00
30.00
1;" 25.00
g 20.00
c: 15.00
10.00
5.00
0.00
Sediment C/laracteristics a/Id Nutrient Status
Seasonal variation of nitrate
2 Station
3
o Re-rmosoon • M:">nsoon 0 Fbsl-lT"(lnsoon
Fig. 4.8 Seasonal mean variation of exchangeable nitrate in surface sediments
Blackburn et al., (1988) reported that in reduced sediments in earthen marine
fishponds nitrification of ammonia to nitrate was absent, denitrification insignificant
and much of the sedimenting organic detritus was mineralised. Consistent with this
observation, Smith (1996) ObS8fVed organic nitrogen as the main form of nitrogen in
pond sediment as well as in the mangrove habitats of Ctarence River, Australia.
Hence, exchangeable nitrate concentrations may be associated with the assimilation
by sediment microalgae (A1ongi et al., 1993). Spatial variation may also be
associated with the oxygen availability in sedimenls. The higher concentrations at
Station 2 may be associated with an oxic environment at this site as the mangroves
translocate oxygen 10 their roots. While the minimum concentration observed at
Station 1 and Stalion 2, during post·monsoon !"Ray be due 10 the maximum uptake by
plant for their luxurious growth during post-monsoon. The maximum concentration at
Station 3 during monsoon may be as. a result of the high river runoff. The matrix of
correlation of exchangeable nitrate concentrations and other parameters exhibited a
positive relationship with percentages of clay, silt, moisture, TP, and exchangeable
ammonium (p<O.05, p<O.Ol )(Table 4.5).
117

Chapter 4
4.2.3 Stoichiometries of C, Nand P in surface sediments
Garbon:Nitroen ratio (GIN)
Detrital material is the major component of the sediment organic matter in
wetlands, and it acts as a major food source for deposit feeders. (Lopez and
Levinton, 1987; Tenore et al., 1984). The amount of detritus and its further
decomposition influence the carbon and nitrogen content of the sediment.
Ammonium immobilisation and assimilation mainly by microbes and plants, always
accompanies and counteracts the mineralisation processes. Boto (1982) pointed
out that the extent to which these processes balance each other is highly
dependent on the C:N ratio of the decomposing organic matter. Substances rich in
nitrogen (Iow C:N) favour net mineralisation, whereas those poor in nitrogen (high
C:N) favour net immobilisation. The generally high G:N ratio of mangrove tree
components for example leaves, wood etc. and high rates of bacterial cell
production (Alongi, 1988) indicate·that the rates of immobilization may be high in
mangrove sediments.
The organic content of:magrove sediments is usually high, with carbon levels
typically ranging from 2 to 15% dw (Boto and Wellington, 1984; Kristensen et al.,
1988). Due to high content of nitrogen-poor structural carbohydrates in mangrove
litter entering the sediment, the nitrogen content of sediment detritus is relatively
low ranging from .05 to O.4%dw (Kristensen et al., 1988, 1991). Accordingly, the
high bulk C:N molar ratio (25-40) reflects the origin of the sediment detritus. The
algal detritus, an important source of organic matter, in subtidal marine sediments
supported predominantly has a C:N ratio around 10 (Lancelot and Billen, 1985).
Generally higher values (Table 4.10) of C:N ratio were recorded at Station 1
and Station 3 while comparatively lower ratios were recorded at Station 2. The
ratios found to ranged from 20.79 to 35.32 at Station 1, 16.57 to 28.18 at Station 2
and 20.39 to 33.32 at Station 3. The minimum ratio of 16.57 was recorded at
Station 2 and maximum ratio of 35.32 was recorded at Station 1. Seasonal
variations of the ratios are given in Figure 4.9. Remarkably higher C:N ratios were
recorded during monsoon and minimum ratios were observed during pre-monsoon
at all stations.
118

Sedilllellt CJwracteris tics alld Nutrient Status
Table 4.10 Seasonal variation of CfN In surface sediments
Stations
Station 1
Slation 2
Station 3
Season
Pre-monsoon
Mansaon
Post-monsoon
Annual average
Pre-monsoon
Mansoon
Post-monsaan
Annual average
Pre-mansaan
Monsoon
Post - mansoon
Annual average
40
35
30
25
20
15
10
Min
20.79
24.91
25.95
16.57
16.72
20.68
20.39
22.42
26.47
Seasonal variation of CIN
2 Station
Max
21.38
35.32
29.45
16.85
28.18
21.24
22.09
33.32
27.14
3
• Re-rronsoon • Mlosoon C Fbst-rronsoon
Mean
21.07
28.79
27.78
25.88
16.71
22.04
20.96
'!.II. 19.9~
21.31
28.53
26.84
25.56 '
Fig. 4.9 Seasonal mean variation of CfN in surface sediments
The low C/N ratio at Station 2 suggests the mangrove lilter detrital at this
site. The C/N ratio of sediments of mangrove area of Bangrong forest (Thailand)
reported to be 18.3 to 19.3 (Holmer and Olsen, 2002). They suggest that the larger
loss of carbon compared to nitrogen in the mangrove leaves led to an overall
decrea:;e In C:N ratio of the mangrove detritus. A decrease in ratio usually
attributed to colonization by bacteria (~tienke et al., 1993; Wafar et al., 1997). Also
119

Chapter 4
Pedersen et al., (1999) found that bacteria incorporated nitrogen from the
indigenous particulate organic nitrogen pool, where as detritus served as energy
source. The comparatively higher C/N at Station 1, indicated an accumulation of
carbon. It was reported that the sediments from the periphery of prawn farms were
found to be similar to that of intertidal mangrove habitat, which reflect the similar
rate of organic enrichment that both habitats receive (Smith, 1996). Boyd (1992)
reported that for shrimp prawn ponds from four countries, where sediment organic
carbon varied from 1.8mg g-l to 72 mg g-l, showed an average C/N of 5.87. Wahab
and Stirling (1991) reported that in the accumulating sediment of five earthen
ponds used for culture trouts (where nitrogen averaged between 3.58mg g-l and
8.78mg g-l), C/N ratio was 7.9 to 11.6. The fine-grained sediment at Bangrong
(Thailand) rich in organic carbon, (12.6% -15.8%) the C/N ratio varied from 19 to
25. The present results at Station 1 and Station 2 were in close agreement with the
C/N ratios of Bangrong mangrove area. While Station 3, with a comparatively Itr percentage of organic carbon (Table 4.4) also exhibited similar C/N as thaf~f Station 1 (Table 4.10). This results suggest the origin of nitrogenous matter at
Station 3. Generally higher C/N values also found in sediments with high
concentration of humic acid which is known to have a very high C:N ratio
(Shanmukhappa, 1987). Further, the nitrogen in sediments of Station 3 could be
regarded as biogenic, since humic substances are derived mainly from plant
material, are very resistant to microbial mineralisation.
High inorganic nitrogen de~and in decomposing leaf litter may regulate an
efficient recycling of nitrogen, and can serve as the mechanism for nutrient
conservation in mangrove habitats (Twilley et al., 1986a; Alongi et al., 1992).
Denitrification appears to be of minor importance for the nitrogen cycling in
unpolluted mangrove forests (Nedwell, 1975). Low denitrification rates in sediments
of Station 3. may therefore be the consequence of high C:N ratios in the
decomposing detritus. On the other hand comparatively low C:N ratios at Station 2
indicated the presence of detritus that are rich in nitrogen. High ammonium
demand may also be assigned to assimilation during microbial degradation of
nutrient poor litter in the sediment (Alongi, 1996; Rivera-Monroy and Twilley 1996).
It has been suggested that ammonium is trapped in the upper few cm of mangrove
sed!ments due to tight coupling between microbial mineralisaticr: and assimH~!::::;~
in this highly reactive zone (Alongi 1996, Kristensen et al., 1998). In the present
investigation it was observed that denitrification was less in mangrove sediments,
120

Sediment Characteristics alld Nutriellt Status
ammonification (mineralisation) assisted by nitrifying bacteria is a rapid process at
Station 2. It was found in nitrogen mineralisation studies of mangrove sediments,
the net production of ammonium was found as dissolved inorganic nitrogen across
the sediment-water interface and also as bacterial assimilated nitrogen at the
sediment surface (Kristensen et al., 2000). The above process occurs with a very
rapid turn over time of about one day.
Most of the nitrogen appears to be immoblized at Station1 and Station 3.
Seasonal variation of C:N showed minimum ratio during pre-monsoon which
suggest mineralisation followed by denitrification in anoxic zones. Remarkable
increase in C:N ratio found during monsoon -and post-monsoon at Station 1 and
Station 3, may be associated with land derived humic substances. The high C/N
ratio during post-monsoon was associated high concentrations of TOC as well as
high values of TN. Further, a large part of the nitrogen in sediments of Station 1
and Station 3 could be regarded as biogeniC, since humic substances are derived
mainly from plant material, are very resistant to microbial mineralisation. More
evidence of this could be obtained from the exchangeable ammonium
concentrations observed in the present study (Table 4.8). Low C:N ratio at Station
2, indicated a tight coupling between microbial mineralisation or nitrogenous
organic matter and assimilation in this highly reactive surface sediment. These ratio
suggest an origin of mangrove detritus in sediments of studied area. The sediment
C/N ratio in Chuwei mangrove forest (Taiwan) were found to vary from 11-18.8,
suggested a detritus of mangrove origin in the forest (Cheng and Chang, 1999).
The high C/N ratios observed during the present investigation may be as a result of
accumulated organic carbon at Station 1, and humic derived nitrogeneous organic
matter (biogenic origin) at Station 3. Relatively lower ratios observed at Station 2,
was associated with the tight coupling between microbial mineralization and
assimilation in organic sediments of the studied mangrove area.
Nitrogen:Phosphorus ratio (NIP)
This ratio known as Redfield 'atomic ratio 16 N: 1P is fairly constant over
much of the ocean, but is generally lower in coastal areas. The depletion of
nitrogen compared to phosphorus was found in coastal sediments. This loss may
be the result of denitrification. The nitrogen limitation in coastal waters may be due
to remineralistion of 25-50% of the organic matter in the sediments, where nitrogen
may be lost by denitrification (Valeila, 1984).
121

Cha"ter4
Generally very low N:P ratios observed at all stations (Table 4.11). The NIP
ratios recorded, varied between 1.n and 2.87 at Station 1, 2.07 and 3.27 at Station 2
and 1.50 and 2.47 at Station 3. Among them, minimum ratio was found at Station 3 (1.50) and maximum ratio observed at Station 2 (3.27). Comparatively higher ratios
were noticed in sediments at Station 2. Seasonal variations observed with a maximum during pre-monsoon at Station 1 and Station 3, while Station 2, recorded maximum
during post-monsoon (Figure 4.10). Minimum values recorded during posl-monsoon at Station 1 and Station 3, while at Station 2, it was observed during monsoon.
Table 4.11 Seasonal variation of NIP in surface sediments
122
5
4
3
2
1
o +-'-'=
0.97 1.71
Seasonal variation of NIP
2 Slalion~
~~ 3.72 1.59
2.26 1.88 1.66
1.94 2.99
2.43
4.51 3.39
3
COl A"e-rmnsoon • Monsoon C Fbst-ITI)f\300n
Fig. 4.10 Seasonal mean variation of NIP In surface sedlments

Sedimellt Characteristics alld Nutriellt Statu~
Alongi (1990) reported that N:P ratio which ranged from 5.0 to 16.5, at the
Hinchinbrook channel (Australia), and the ratio approached Redfield ratio only at one
site. The variations found were due to several factors one of which was preferential
release of nitrogen relative to carbon and phosphorus. At Pichavaram mangroves
(south east coast of India) N:P ratio in sediments varied from 3.2 to 13.2
(Shanmukhappa, 1987). In the present observation the N:P values were found
largely deviated from the Redfield ratio (Table 4.11). The previous findings at Cochin
estuarine system also revealed low NIP ratio, which varied between 0.80 and 3.69
(Nair, 1992). The low N:P ratios were due to comparatively high concentration of total
phosphorus. N:P ratio can be taken as an index of the extent of extraneous influence
on a productive water body, since the nitrogen if produced is autochthonous,
variation in NIP depend on phosphorus which is mostly external (Shanmukhappa,
1987). The relatively high amount of phosphorus might be due to external source
since the mangrove detritus is known to consist of only comparatively low amount of
phosphorus. The low NIP ratio indicates that the major portion of phosphorus in
sediments of mangrove ecosystem was of abiogenic origin.
The seasonal variation in the quality and quantity of the settling phytoplankton
affects the P dynamics at the: sediment surface, both chemically and biologically
(Tuominen, et al., 1996). The seasonal variation in NIP ratio may be a function of
seasonal variation in TP and TN. Remarkably Iligher NIP values noticed at Station 2,
may be associated with the productivity of the mangrove creek waters during
pre-monsoon and post-monsoon. Nair et al. (1975) found the productivity of the
Cochin estuarine waters was high during pre- and post- monsoon months. Since this
creek was shallow, after the bloom, the phytoplankton in the water column got
deposited on the surface of the sediment. It is well known that fine-grained, silty clay
sediments preserve the organiC matter than sandy sediments. Thus both these
factors most favourable at Station 2, which in turn resulted in a high concentration of
TN in sediment and showed higher value of NIP. Although an enrichment of nitrogen
during pre- and post- monsoon was found at Station 1 during these seasons, a
simultaneous increase in TP also found. Station 3, sediments mostly composed of
sand, exhibited low ratios on account of its low TN and high TP during monsoon and
post-monsoon season. The spatial and seasonal variations of NIP observed during
the present study indicated that the compositions of the mangrove sediment ~'!ere
influenced by allochthonous input during monsoon and high biological activity of the
creek waters during pre-monsoon and post-monsoon.
123

Chapter 4
Carbon:Phosphorus ratio (C / P)
GIP in sediments, of estuary is used an index of pollution by domestic
sewage into an aquatic system, where GIP. used to compare with the Redfield ratio.
The sediments in mangrove environments are rarely in agreement with the
theoretical Redfield ratio (Alongi, 1996). For e.g. the GIP in sediments of
Hinchinbrook channel (Australia) varied from 29.4 to 397.3, and coral creeks of
Hinchinbrook channel the ratios found as 392 in low intertidal site to 1291 at high
inter tidal site (Alongi, 1990; 1996). The sediments at Bangrong mangroves
(Thailand) exhibited a GIP, which varied from 195 to 263. In the Pichavaram
mangrove (south east coast of India) sediments this ratio was found to range from
35.1 to 85.7 (Shanmukhappa, 1987). Outwelling of mangrove litter significantly
influences sediment concentrations of organic carbon and total nitrogen,
stoichiometric ratios of G:N:P (Alongi, 1990). Kairesalo et al. (1995) found that
mineralisation of organic matter by bacteria may either mobilize or immobilize P,
possibly depending on the G/N/P ratio in the available substrate. The richer the
substrate is for P or N compared to bacterial biomass the more easily P or N will be
released in the mineralization. Goldman et al. (1987) have reported that the G/N/P
ratio of natural marine bacterial biomass is 45: 9: 1 (by atoms) or 17.6: 4.1 : 1 (by
mass). Therefore the decrease in sediment bacteria increased the concentration of
inorganic phosphorus in the inter.stitial waters, in turn an accumulation in solid
phase occurs (Tuominen et al., 1996). Also the decrease in bacterial population
decrease the ultimate release of phosphorus from sediment to lake water through
decreased oxygen consumption leading to high phosphorus sorption at the oxic
sediment-water interface (Kairesalo et al., 1995).
Seasonal variation of G:P is depicted in Table 4.12. The values ranged from
41.88 to 62.71 at Station 1, 34.68 to 68.00 at Station 2, and 36.63 to 58.96 at
Station 3. Among the ratios the minimum ratio of 34.68 and maximum ratio of 68.00
were, recoded at Station 2. The mean values of GIP showed higher ratios at
Station 1. Similar lower values were recorded at Station 2 and Station 3. However
remarkable seasonal variations in GIP were observed at all stations (Figure 4.11).
Seasonal variations of GIP were not significant at Station 3, but are significant at
Station 1 and Station 2.
124

Sediment Clwracteristics and Nutrie"t Status
Table 4.12 Seasonal variation of C/P in surface sediments
Stations
Station 1
Station 2
Station 3
Season Min Pre-monsoon 41.88
Mensoon 62.66 Post-monsoon 55.54
Annual mean Pre-monsoon 47.14 Monsoon 34.68
Pesl-monsoon 64.25
Annualm;;an Pre-monsoon 48.71 Monsoon 36.63
Post - man soon 39.91
Annual mean
Seasonal variation of Cl? 70
60
50
40
30
20
10
o l-J'-2
StatDns
Ma. 59.89 62.71
60.23
49.39 62.12
68.00
49.66
58.96 41,45
3
Mean 50.88 62.69
57.89
57.15 48.26 48 .40
66.12
54.26 49.19
47.80 40.68
45.89 '0.
Fig.4.11 Seasonal mean variation of C/P In surface sediments
The observed ratios during the present· investigation were far less than that reported at other mangrove sites. Among the mangrove sites investigated, the Station 1 and Station 2, showed high C/P ratios. According to the observations of
Sinke and Cappenberg (1966) live sediment bacteria enhanced the release of P from the sediment. Comparatively higher C:P values recorded at Station 1 and Station 2, may be associated with an increased bacterial biomass in sediments.
125

Cllapter4
Many studies have shown that bacterial activity is an important part of the inorganic
phosphorus sorption capacity of the sediment (Gachter et al., 1988). Therefore the
comparatively lower G:P ratio at Station 3 may reflect a decrease in bacterial
activity in the sediment. The seasonal variation observed at Station 1, exhibited a
minimum ratio during pre-monsoon, which may be associated with maximum
immobilization of phosphorus by bacterial biomass. A decrease in bacterial
biomass might have occurred during monsoon flooding which enhanced the GIP
during this season at Station 1. Associated with high productivity during post
monsoon season may deplete phosphorus in sediments in turn an increased ratio
was noticed at Station 2.
The observed GIP ratio at the studied area reveal the accumulated
phosphorus load in creek waters could be reduce1 by the mangrove plants and
associated microorganisms. However to arrive at the cause of deviation from
Redfield stoichiometry in the present investigation warrants more information on
the kind of litter produced in this area, and also on the influence of microbes on
carbon, nitrogen and phosphorus dynamics in this particular ecosystem.
4.2.4 Properties of Core Sediments
Grain-size distribution
The vertical variations of sand, silt and clay in weight percentage of sediment
dry weight are illustrated in Table 4.13. Similar to surface grain size analysis, the
core sediments also composed of sandy mud textural facies at Station 1 and
Station 2, while muddy sand texture observed at Station 3. Marked change in
textural facies observed, a mud layer (4-6 cm layer) at Station 1 and a muddy sand
layer (10-20 cm) at Station 2. The variation in percentage of sand, silt and clay at
different depths are depicted in Figures 4.12a to 4.12c. Although there was some
exceptions, maximum and minimum percentage of clay and silt were observed at
Station 1 and Station 3 respectively. However a reversal was found in percentage
of sand, recorded maximum at Station 3 and minimum at Station 1.
The distributions of relative percentage of each fraction at various depths are
illustr<>t,=,d in Figures 4.13a to 4.13c. Generally higher fraction of silt found at
Station 1 and Station 2, while Station 3 recorded higher percentage of sand.
126

Sedimellt Characteristics alld Nutriellt Statlls
Table 4.13 Grain size analysis in sediment cores
Station Depth % Sand % Silt % Clay Nature of sediment
0-2 10.64 32.72 57.14 sandy Mud
2-4 12.02 29.53 58.95 sandy Mud
Station 1 4-6 5.46 37.03 58.17 Mud
6-10 17.58 37.58 44.32 sandy Mud
I 10-20 37.38 22.29 30.03 sandy Mud
0-2 15.01 39.05 46.10 sandy Mud
2-4 17.32 27.12 56.05 sandy Silt
Station 2 4-6 24.51 31.47 43.61 sandy Mud
6-10 11.80 29.79 57.65 sandy Mud
10-20 61.21 21.09 17.86 sandy Mud
0-2 74.56 12.80 12.61 muddy Sand
2-4 77.70 11.98 10.90 muddy Sand
Station 3 4-6 84.54 8.59 6.62 muddy Sand
6-10 85.36 4.94 9.15 muddy Sand
10-20 83.53 6.58 9.41 muddy Sand
The core at Station 1 showed a 1:2 ratio of silt and clay of about 4cm of depth.
At the 4-6 cm interval, sediment was, mud as by Folk's classification. The major
textural facies in this core is sandy mud. Sand percentage was found to increase
from about 6 cm from the surface. The homogeneity in textural facies of the core as
well as the dominance of mud over other size grades indicates the prevalence of a
uniform hydroperiod with rapid siltation in this core (Badarudeen et al., 1998). The
core at Station 2 was predominantly composed of sandy mud sediment. An
intercalation of 10 cm thick muddy sand was recorded at a depth of about 10cm from
the surface. The core sediment at Station 3 is uniform in its textural facies index and
is composed entirely of muddy sand ranged from 4.94 to 12.8% silt and 6.62 to
12.61% clay. The content of sand of this core was found to vary between 74.56%
and 85.36% indicated a high-energy regime at this site. According to Flach and Heip
(1996), a homogeneous distribution pattern of grain size in the vertical column of
sediment suggests a constant mixture by bioturbation effects.
127

C1tapter4
128
Variation of clay In sediment core Variation of 5111 In sed lmenl core ' wO
o 10 20 30 40 50 60 70 80 90 o 10 20 30 40 50 60 70 80 90
B SIOI1;onl _ SIOItion2D SIOItion3 Cl SIOItiont. SIOItion2D Stalion)
(a)
e 0 , <
" • c
(b)
Variation of sand In sediment core • w'
o 10 20 30 40 50 60 70 80 90
0-2~~====::J 2-4
4-.
6·1 0
(c)
Fig. 4.12 Variation of ';' of sand. slit and clay In sediment cores

Sedimellt Characteristics aud Nutriellt Status
Grain size analysis of sediment core Grain size anaiysis of sediment core
Station 1 Station 2 • Sandm Silt. CIioy • SandmE sjt_ 0"
(a) (b)
Grain size anaiysis of sedimen t co re
0-' ,-,
E 0
5 '-6 <
" • c 6-10
10-20
Station 3 _ Sand m!3 $111_ Clay
(c)
Fig. 4.13 Relative composition of sand, silt and clay in sediment cores
Moisture
Table 4.14 summarises the measurement of moisture in sediment cores
from the three mangrove fringed habitats. The values varied between 29.40%
(Station 3) and 73.47% (Station 1). Generally moisture percentage decreases
down the core at all stations (Figure 4.14a). Seasonal variations in percentage of
129

Chapter 4
moisture are depicted in Figures 4.14b - 14d. Higher moisture percentage was
noticed during monsoon season at Station 1, while lower values were recorded
during other two seasons. At Station 2 and Station 3, higher values were observed
during pre-monsoon and post-monsoon respectively. An increase in moisture
percentage was noticed during pre-monsoon and post-monsoon in subsurface
sediment at Station 2.
Table 4.14 Station-wise summary statistics of moisture (%) in sediment cores
Station Depth Min Max Mean SO %ofCV
0-2 60.44 72.80 65.68 4.50 6.85
2-4 59.57 73.47 64.45 4.77 7.41 , I Station 1 4-6 58.50 70.14 63.52 3.99
I
6.28
6-10 55.76 68.78 60.72 4.91 8.09
10-20 51.01 61.86 55.83 4.18 7.49
0-2 57.79 71.57 64.96 5.32 8.19
2-4 61.76 67.82 64.21 2.34 3.64
Station 2 4-6 57.80 71.54 64.54 4.47 6.93
6-10 35.71 66.67 58.17 11.44 19.67
10-20 53.81 64.95 59.31 4.39 7.40
0-2 34.48 57.49 49.74 9.82 19.73 , 2-4 35.12 57.73 47.85 8.16 17.05
I Station 3 4-6 35.85 53.19 43.07 6.29 14.61
6-10 31.84 45.71 37.94 5.61 14.78
10-20 29.40 .
40.68 34.41 4.30 12.49
The spatial variation in moisture observed in the present investigation may
be attributed to the fine sediment present at the first two stations. The moisture
percentage showed a significant positive correlation with organic carbon. It was
well established that in sediments, an increase in organic matter was observed with
an increase in moisture at a given temperature. The annual mean values of
moisture showed identical percentage at Station 1 and Station 2 due to the similar
textural attributes at these stations, while less moisture percentage were recorded
at Station 3, due to predominant muddy sand nature of the sediment.
130

Variation of moisture In sediment core
% wt. 30 35 40 45 50 55 60 65 70
0-2~~~~~~~~--~~~
2-4 ~ .. I E I u
.E 4-6 e.
.c; j 1/ Q. .. Q
6-10
V 10-20 ~ -
.-Stationl-e- Station2-&- Station3
(a)
Variation of moisture in sediment core
2-4
g 4-6 .E
I 6-10
.~ 1(}'20
Station 2
.- Pre.rn:JnSOOn-e- Monsoon-l/i.- Post.rronsoo
(c)
Sedimellt Characteristics a"d Nutrient Status
Variation of moisture In sediment core
%owl. 50 55 60 65 70
0-2
J / 2-4 •
E /\ I u .5 4-6
X/ '" a. . '!.
6-10
J1 10-20
Station-1
(b)
Variation of moisture In sediment core 'I.wI.
30 35 40 45 0-2
!P 2-4
§ 4-6 .E
! 6-10
1\ 10-20
Station-3 .- Pre.monsoon-.- Monsoon-l/i.- Post.rronsoon
(d)
Fig. 4.14 Annual and seasonal variation of moisture in sediment cores
pH
The pH influences the nutrient distribution in sediments, especially calcium
bound inorganic phosphorus <::nd iron bound inorganic phosphorus. With a more
acid pH, the iron bound inorganic phosphorus is dominant although later even
calcium bound phosphorus may be formed (Golterman, 1998). Also Bostrom et al.
131

Cltapter4
(1988) found, the increase in pH was associated with coprecipitation or adsorption
of phosphate on to calcite. Metal oxides carry a net positive charge at typical fresh
water pH and a negative charge at sea water pH (Barrow et al., 1980). The
variations in pH values were also associated with macrophytic photosynthesis.
Hence an estimate of pH variation was ideal in the study of nutrient dynamics.
Table 4.15 Station-wise summary statistics of pH in sediment cores
Station Depth Min Max Mean SO %ofCV
0-2 7.45 8.50 7.98 0.40 5.06
2-4 7.50 8.70 8.28 0.46 5.54
Station 1 4-6 7.50 8.70 8.28 0.47 5.70
6-10 7.70 8.90 8.50 0.49 5.77
10-20 4.50 9.05 8.09 1.77 21.87
0-2 7.30 8.70 8.24 0.49 5.96
2-4 7.80 • 8.83 8.30 0.42 5.05
Station 2 4-6 7.70 8.90 8.42 0.44 5.23
6-10 7.80 8.95 8.50 0.39 4.62
10-20 8.50 9.07 8.71 0.20 2.34
0-2 4.80 8.10 7.11 1.49 20.98
2-4 7.07 8.00 7.50 0.40 5.32
Station 3 4-6 6.20 8.20 7.40 0.93 12.63
6-10 7.10 8.47 7.80 0.59 7.60
10-20 7.70 8.71 8.15 0.42 5.18
Table 4.15 summarises the measurement of pH in sediment cores to a depth
of 20cms. The pH values varied between 4.50 (Station 1) and 9.07 (Station 2).
Remarkably higher pH values were observed at Station 1 and Station 2 while lower
values were noticed at Station 3. Generally an increase in pH values was recorded
down the core at all stations, except beyond 10cm depth at Station 1 (Figure
4.15a). Seasonal variations of the pH values in sediment cores at each Station are
depicted in Figures 4.15b-4.15d. At Station 1, pH values were showed an increase
with increase in depth during mon~oon and post-monsoon. However a remarkable
decrease was noticed beyond 10cm depth at the same Station. All other stations,
showed a down core increase in pH values during all three seasons.
132
I
I
I I :
I I

Annual variation of pH in sediment core
2-4
7.0 7.5 8.0 8.5 0-2.,.A,:----,-----<�t__+--,------,
~ \ 9.0
E u 4-6 .E
j 1\
\A 5 g-0
6_10
10-20
.-StatIon 1 __ - Station2-A- Statlon3
Variation of pH in sediment core
~1~·0 __ 7~.S __ ~8,._0~~8·rl5~-.9.0
\ j \ \ \ \
2-4
\l\ ~ 4-6
! 6-10
1~20
Station-2
.-Premon~-Mon~- Postrronsoon
(c)
Sediment Characteristics and Nutrient Status
Variation of pH in sediment core
0-2 ,...---,7.,-0 __ 7.,.....S ........ _8 ..... t-0 ... _8T"'S~_
2-4
~ oS 4-6
1 6-10
10-20
Statlon-l
__ Premonsoon---4 MonsOOn--A Postmonsoon
(b)
Variation of pH in sediment core
~26.0 6.5 7.0 7.5 8.0 8.5
~ X (/\ -2-4
~\ 6-10
1~20
Station-3
. .-Premon~-Mons()()ll--A- Postmonsoon
(d)
Fig. 4.15 Annual and seasonal variation of pH sediment cores
pH values of mangrove sediments found to be less variable with depth at
around pH 6.8-7.0 (90to and Wellington, 1984). The present investigation showed
an alkaline pH which was the impact of sea water in estuary. pH found to vary from
4.50 (10-20cm) to 9.05 at the same dept!1 at Station 1. Other than these two
remarkable variations, pH values at Station 1 showed a gradual increase down the
core. A sharp decrease 4.5 occurred at the 10-20 cm depth may be due to the
anoxic condition resulting in the formation of hydrogen sulphide. A gradual
133

Chapter 4
increase down the core was observed at Station 2, showed variation from 7.30
(O-2cm) to 9.07 (10-20 cm). Station-wise summary statistics of pH values (Table
4.16) showed high variation at Station 3.' At this Station, pH varied from 4.80
(O-2cm) to 8.71 (10-20cm).
The annual variation of pi-l values in core sediments showed a general
increase down the core at all stations indicated an alkaline condition in sediment till
20cms of depth. However a gradual decrease of pH values was noticed at Station
1 during pre-monsoon. Also a marked decrease in pH was observed in 10-20 cm
depth at the same Station. Seasonal variations in pH may be due to the anoxic
environment created by microbial activity. During post-monsoon at Station 2,
surface sediment showed low value compared to the subsurface sediments. This
may be partly explained by the increased presence of phyto plankton biomass in
the surface sediment, their photosynthesis lead to the formation of carbon dioxide.
The Station 3, which exhibits more riverine characteristics, exhibited a low pH than
the other two stations. The variations in pH values at the three mangrove locations
may be ascribed to the microbial activity prevalent during different depths during
different seasons.
4.2.5 Nutrient distribution Ih sediment cores
Total organic carbon (TOG)
Phytoplankton show relatively constant ratios between carbon content and
the content of important nutrient ~Iements, such as nitrogen and phosphorus, so
studies of the production and fate of organic carbon are useful in understanding the
overall biogeochemistry of aquatic system. The carbon produced within an
ecosystem is known as autochthonous production and organic carbon derived from
land run off is known as allochthonous production, which is an important source of
respirable carbon in lakes. The decomposition of organic matter is orchestrated by
a sequence of metabolic pathways that use different electron acceptors as
chemistry changes with increasing depth (Canfield, 1993). There are evidences to
show that in temperate environments, in intertidal muds, sulphate reduction and
oxic respiration are the most important carbon oxidation path ways (Jickells and
Rae, 1997; Alongi et al., 1998). But in tropical intertidal muds carbon oxidatior is
driven proportionally more by suboxic processes than by sulphate reduction (Alongi
et al., 1999). The net carbon budget for a standard Rhizophora forest identified,
134

Sediment Characteristics and Nutrient Status
three important sinks of carbon are litter export, crab feeding and bacterial
mineralisation (via sulphate reduction) in the sediments, each account for about
20% of carbon removal from the mangrove (Kristensen and Pilgaard, 1999).
TOe concentration in the sediment cores varied between as low as 10.62mg g-l
(Station 3) and as high as 140.23mg g-l (Station 1) (Table 4.16). Remarkably higher
TOe concentrations were observed at Station 1 and Station 2 compared with Station 3.
At Station 1 and at Station 2, TOe concentrations varied from 53.63mg g-l (4-6cm) to
140.23mg g-l (4-6cm) and 49.27mg g-l (10-20cm) and 116.42mg g-l (6-10 cm depth)
respectively. While at Station 3, TOe concentrations ranged from 10.62mg g-l
(6-10cm) to 54.71mg g-l (0-2cm). Generally TOe concentrations showed a decrease
on increasing depth at all stations (Figure 4.16a). Seasonal down core variations ir.
TOe concentrc:tions are depicted in Figures 4.16b-4.16d. Station 1 recorded a
remarkable increase at 4-6 cm depth during post-monsoon, while at Station 2, a
remarkable decrease at depth beyond 10 cm was noticed. A gradual decrease of TOe
concentration was observed at Station 3, down the core, during all seasons.
Table 4.16 Station-wise summary statistics of TOe (mg g-1) in sediment cores
Station Depth Min Max Mean SO %ofeV
0-2 61.94 114.14 91.84 22.31 24.29
2-4 59.87 105.52 84.69 20.28 23.94
Station 1 4-6 53.63 140.23 85.77 28.76 33.53
6-10 55.10 114.11 77.08 21.11 27.39
10-20 56.56 86.33 71.05 12.91 18.17
0-2 69.12 111.87 91.97 18.35 19.95
2-4 65.28 108.22 86.01 16.48 19.16
Station 2 4-6 57.81 111.24 85.58 20.70 24.19 . 6-10 67.81 116.42 85.93 18.85 21.94
10-20 49.27 74.96 61.71 11.28 18.29
0-2 25.76 54.71 39.35 10.46 26.57
2-4 24.70 38.91 30.09 5.44 18.07
Station 3 4-6 13.03 29.58 19.79 6.37 32.18
6-10 10.62 16.80 14.26 2.13 14.95
10-20 13.12 24.77 17.48 4.09 23.42
135

Cllapter 4
Annual variation of TOe in sediment core mg/g
10 20 30 40 50 60 70 80 90 100 0-2 ,-.-r-"'""""T~Io---......... .-,-.......,.~ ....... """"
2-4 I 5 4-6 I .£ j £;
! 6-10
i \ 10-201 ...
.-Station1 __ Sta' ~n~ Station3
(a)
Seasonal variation of TOe in sediment core
2-4
E u 4-6 .£ £;
! 6-10
10-20 ..
Station 2 __ Pre.monsoo~ Monsoo~ Posl.monsoon
(c)
Seasonal variation of TOe in sediment core mg/g
0-250 60 70 80 90 100 110 120
2-4
) E 4-6 u
.5
! 6-10 j/ I 10-20 •
Station 1 . __ Pre.rnonsoorr-e-~- Posl.monsoon
(b)
Seasonal variation of TOC in sediment core
50
Station 3 .• -Pre.~~-Posl.monsoon
(d)
Fig. 4.16 Annual and seasonal variation of TOe in sediment cores
TOC concentrations in sediment cores of the mangrove areas of Kannur,
Cochin and Veli found varied from 22.6mg g-l to 69.8mg g-l with highest values
noticed at the top layer and lowest recorded at 30-40 cm layer Badarudeen (1997).
General pattern of distribution showed a similar variation during the present study.
Variation of total organic carbon among the top 3 cm of the sediment was mainly
due to the macrobenthic activities (Cheng and Chang 1999). Since these activities
136

Sedillletlt Characteristics and Nutrient Status
return some decomposed products into the sediments as secondary input in the
form of fecal pellets and carcasses from litter feeding crabs. Down core decrease
may be associated with bacterial mineralisation. Below this depth, anaerobic
conditions prevailed most of the time, mainly through organic matter degradation
mediated by the sulphate reduction pathway (Kristensen et al., 1991, 1992; Liu
et al., 1996, Morsel and eorredor 1993, Wafar et al., 1997). In contrast to
temperate salt marsh mud, mangrove mud are less anaerobic, rarely more
negative than 300mV, and usually within range of 200 to +100 mV over a one
meter profile (Limpsaichol, 1978; Boto and Wellington, 1984; Alongi, 1987).
Generally highest vaiues of TOe recorded at the top, and lowest content
recorded at 20-30 cm layer. The particles loosened and suspended by the wave
action during inundation of the forest were flush€d into the creek and deposit as a
silt layer on the sediment surface. Nixon et al. (1984) suggested that mangrove
forest in Malaysia act as a sink for suspended solids, and Rivera-Monroy et al.
(1995) found import of microparticulate suspended solids from a mangrove forest in
Mexico. The latter authors also found strong seasonal influence of particulate
transport due to climate forcing, which can affect the magnitude and direction of
water currents. A similar mechanism could explain the low concentrations of TOe
observed during pre-monsoon at Station 1 and Station 2.
Litterfall is also considered as the most important primary source of detritus
in mangrove environment, which account for about 45% of the total detritus in a
mangrove area (Kristensen, 1997). Hence the availability of litter at the first two
stations compared to the other also contributed to the high concentrations of TOe.
The textural facies also contribute to the retention of organic matter. The fine
grained sediment at Station 1 and Station 2, facilitate trapping of fine particles
entering the mangrove ecosystem. Where as the inability of sandy sediment to trap
fine particles resulted in a decrease of TOe at Station 3. Furthermore the variation
along the depth may also reveal the relationship between textural facies of the
sediment and TOe concentrations. The remarkable decrease in TOe concentration
in 10-20 cm depth at Station 2, may be due to the sand dominated texture of the
sediment at this depth.
Among the seasonal variations, (Figures 4.16b-16d) certain subsurface
increase in TOe was found. This increase may be attributed to the presence of
bacterial assemblage in sediments. It was found that the grazing of crabs and their
137

Cllapter4
numerous burrows probably assist in oxidizing subsurface sediments and removing
toxic metabolites like sulphides and ammonium thereby stimulate growth of
microheterotrophs like bacteria al')d trees (Kristensen, 1988; Smith et al., 1991).
Subsurface increase in TaG were found only at Station 1 and Station 2, suggested
oxidized subsurface sediment.
Significant positive correlation was exhibited between all depths with TaG
(p<0.001) (Table 4.17). The positive correlation indicated that in all the depths there
is high degree of association with TaG. The correlation of TaG concentrations
(Table 4.18) with other parameters showed a significant correlation with percentage
of clay, silt, TN (p<0.01) at all depths. A Significant negative correlation was also
exhibited with percentage of sand at all depths (Table 4.18a-4.18e).
Tabl 41 e e 7 orre alion matrix I . . b etween ept s -d h TOe
0-2 2-4 4-6 6-10 10-20
0-2 1.0000
2-4 0.9803*** 1.0000
4-6 0.9817*** 0.9663*** 1.0000
6-10 0.9736*** 0.9748*** 0.9890*** 1.0000
10-20 0.9082*** 0.9547*** 0.9184*** 0.9106*** 1.0000
p<0.01 p<0.001
Three way ANOVA was used to test the significance of station, depth and
season on concentrations of TaG. A significant difference between stations was
observed (p < 0.001) (App.15). The least significant difference (LSD) at 5% level
for stations is 7.5 mg g-1. Station 1 and Station 2 give significantly higher values of
TaG. But there is no significant difference between these two stations. The very
low concentration of carbon at Station 3 compared to other two siles may be due to
the variability of sediment texture along with non-availability of litter. The maximum
value of 110 mg g-1 was recorded at Station 1. A minimum value 13.2 mg g.1 was
recorded at Station 3. Removal of organic carbon by tidal action would explain the
low levels of organic carbon at this site. This site is characterised by maximum tidal
influence and wave action as compared to the other two sites. The organic carbon
.Vd::; found lU increase from the mangrove zone through the fringe forest in wetland
in eastern Australia (Glarke, 1985).
138

Sedimellt C/laracteristics alld Nutriellt Status
The LSD at 5% level for depth is 0.96 mg g-1 The depths, 0-2, 2-4, and 4-6,
layers showed higher amount of organic carbon as compared to 6-10 and 10-20
layers. The minimum value 13.1mg g-1 recorded at a depth of 20-30 cm. The
accumulation of organic carbon in surface sediments might be due to plant litter
associated with the forest. In mineralisation studies of organic matter, in an
intertidal sediment of tropical semi-enclosed delta, the solid phase carbon and
nitrogen found to decline with sediment depth (Alongi, et a/ 1999). The sediment
cores of Gorai creek (near Mumbai) showed a decreasing trend of organic carbon
with depth. They concluded that under tropical temperature, the excess organic
loads are largely oxidized and remineralised by rich bacterial population at the
sediment water interface apart from being consumed by benthic fauna such as
polycheates and bivalves, which are present 'in high numbers in the creek (Ram
and Zingde, 2000).
The LSD at 5% level for season is 7 mg g-1. Significantly higher value of
TOe was recorded during post-monsoon followed by monsoon and pre-monsoon
seasons. Bacterial remineralisation of organic matter is enhanced by the increase
in temperature (Klump and Martens, 1989).
Table 4.18a Correlation matrix between parameters in sediment cores - 0-2cm.
0-2 %clay %silt %sand TOC TN TP EX.Amm. Ex.N03 C/N NIP C/P
%clay 1
%silt 0.8900'" 1
%sand -0.9570'" -0.9840'" 1
TOC 0.8554'" 0.8529'" -0.8769'" 1
TN 0.9570'" 0.7690'" -0.8632'" 0.6786" 1
TP 0.8102'" 0.8758'" -0.8738'" 0.6124" 0.7860'" 1
EX.Amm. 0.8424'" 0.5778' -0.6968" 0.5269' 0.9232'" 0.61131" 1
Ex.N03 0.3261 0.2215 -0.2684 0.2689 0.2770 0.2440 0.3441 1
C/N -0.3752 -0.0570 0.1829 0.0505 -0.5945" -0.2669 -0.6597" -0.0248 1
NIP 0.1694 -0.0746 -0.0187 -0.1146 0.2935 -0.0598 0.5335' 0.5591' -0.4114 1
CIP -0.6249" -0.6530" 0.6596" -0.4700 -0.6284" -0.8381'" -0.5073' -0.1134 0.0819 0.0453 1
p<0.05· p<O.01 p<0.001
139

Cltapter'l
Table 4.18b Correlation matrix between parameters in sediment cores - 2-4cm.
2-4 %clay %silt %sand TOC TN TP Ex.Amm. Ex.N03 C/N NIP C/P
%clay 1
%silt 0.9973*** 1
%sand -0.9985*** -0.9998*** 1
TOC 0.9131*** 0.9206*** -0.9191*** 1
TN 0.8957*** 0.9239*** -0.9171*** 0.8230**· 1
I I
I TP 0.7122*** 0.7168*** -0.7160*** 0.7341*** 0.6591** 1
Ex.Amm. 0.8718*** 0.8832*** -0.8807*** 0.7468*** 0.8830*** 0.4526 1
Ex.N03 0.5748* 0.5707* -0.5720* 0.4476 0.5520* 0.1344 0.4601 1
C/N -0.4284 -0.4679 0.4580 -0.2602 -0.7019** -0.2344 -0.6086** -0.2426 1
NIP 0.01699 0.0439 -0.0369 0.0372 0.1530 -0.4573 0.1898 0.2656 -0.1947 1
C/P -0.5288* -0.5325* 0.5318* -0.4391 -0.5047* -0.8116*** -0.3758 -0.1592 0.1043 0.4452 1
p<o.os· p<0.01 p<0.001
Table 4.18c Correlation matrix between parameters in sediment cores - 4-6cm.
4-6 %clay %silt %sand TOC TN TP Ex.Amm. Ex.N03 C/N NIP IC/P
%clay 1 I %silt 0.9958*** 1 I I
%sand -0.9989*** -0.9990*** 1 I ,
TOC 0.8978*** 0.8787*** -0.8889*** 1 ! I I
TN 0.8390*** 0.7943*** -0.8169*** 0.7974*** 1 I I TP 0.8245*** 0.8062*** -0.8159*** 0.8485*** 0.8089*** 1
, i
Ex.Amm. 0.6773** 0.6565** -0.6673** 0.5230* 0.7582*** 0.3194 1
Ex.N03 0.5028* 0.4750* -0.4890* 0.2063 0.6691** 0.3664 0.6716** 1
C/N 0.0769 0.1112 -0.0946 0.2164 -0.2111 -0.0237 -0.1216 -0.4807* 1
NIP 0.0204 -0.0342 0.0077 0.0656 0.2338 -0.1384 0.3498 0.4042 -0.3557 1
C/P 0.0745 0.06858 -00715 0.1733 _n n.t,? -0.2548 n ?75-4 -0.0353 0.5336 0.5707* 1
p<o.os· p<0.01 p<0.001
140

Sedimellt Cllaracteristics alld Nutriellt Status
Table 4.18d Correlation matrix between parameters in sediment cores - 6-10cm.
%clay %silt %sand TOC TN TP EX.Amm. Ex.N03 C/N NIP C/P
%clay 1
%silt 0.8776*** 1
%sand -0.9550*** -0.9803*** 1
TOC 0.8776*** 0.9209*** -0.9313*** 1
TN 0.8038*** 0.9615*** -0.9261*** 0.8068*** 1
TP 0.5621* 0.7300*** -0.6833** 0.8722*** 0.5979** 1
Ex.Amm. 0.6948** 0.7564*** -0.7543*** 0.6559** 0.7988*** 0.4981* 1
Ex.N03 0.8969*** 0.8798*** -0.9139*** 0.7771*** 0.8509*** 0.4857* 0.6586** 1
C/N 0.0914 -0.1785 0.0729 0.0708 -0.3394 0.0357 -0.3315 -0.0501 1
NIP -0.0325 -0.0978 0.0739 -0.1168 -0.1216 -0.3233 -0.2183 -0.1494 -0.2652 1
C/P 0.4504 0.1888 -0.3023 0.0526 0.2364 -0.4048 0.3231 0.3566 -0.1352 0.5688* 1
p<O.05* p<O.01 p<O.001
Table 4.18e Correlation matrix between parameters in sediment cores -10-20cm.
%clay %silt %sand TOC TN TP Ex.Amm. Ex.N03 C/N NIP C/P
%clay 1
%silt 0.7598*** 1
%sand -0.8900*** -0.9727*** 1
TOC 0.9628*** 0.7912*** -0.8987*** 1
TN 0.8970*** 0.6358** -0.7662*** 0.8012*** 1
TP 0.7531*** 0.8434*** -0.8604*** 0.7219*** 0.6832** 1
Ex.Amm. 0.8065*** 0.5205* -0.6530** 0.6230** 0.8431*** 0.6733** 1
Ex.N03 0.3703 -0.0965 -0.0645 0.2550 0.5094* 0.1715 0.5647* 1
CIN -0.2133 -0.0452 0.1078 -0.1129 -0.4143 -0.0314 -0.3517 -0.2079 1
NIP -0.0617 -0.2210 0.1770 -0.1240 -0.0829 -0.4653 0.0606 -0.0725 -0.6092** 1
CIP fJ.fJ035 -0.2892 0.2016 0.0522 -0.1020 -0.5805* -0.11':81 -0.0739 -0.1~'!" 1':.':340** 1 1
p<O.05* p<O.01 p<O.001
141

Chapter 4
Total nitrogen (TN)
The nitrogen buried in sediments is in various organic and inorganic forms,
and its abundance may decrease with depth in a manner similar to that of carbon
(Haines et al., 1977). A general feature of mangrove ecosystems is the very low
levels of both dissolved and particulate nitrogen compounds (Boto and Wellington,
1984). The primary cause for this apparent nitrogen limitation is the low nitrogen
content (high C:N ratio) of mangrove litter; the major source of organic input to the
decomposer food chains. It has been suggested that mangrove forests are efficient
in retaining and recycling nitrogen via several mechanisms that reduce export. These
mechanisms include re-absorption or re-translocation of nitrogen prior to leaf fall,
burial of fallen detritus by crabs, rapid and efficient uptake of dissolved materials by
bacteria, and comparatively high nitrogen investment in chemical defences by the
trees (Boto, 1984; Twilley et al., 1986b). Nitrogen enters mangrove sediments
primarily via autochthonously produced leaf litter, microalgae and epiphytes. Other
sources include nitrogen fixation by bacteria and cyanobacteria as well as possible
import of particulate and dissolved nitrogen from adjacent coastal zone (Alongi et al.,
1992). Both benthic microalgae (Kristensen,1993) and bacteria are responsible for a
very rapid turnover of nitrogen in mangrove sediments. Alongi (1988) estimated that
the bacterial biomass accounts for nearly 8% of total particulate organic nitrogen pool
in the upper 10 cm of the sediment in an Australian mangrove forest. It was also
suggested by A10ngi (1989) that bacteria and benthic microalgae in mangrove
sediments are sinks for nutrient because the system is characterised by a closed
internal cycling - death, decay uptake and growth - and thus serve as a mechanism
for nutrient conservation i.e. reducing net system mineralisation.
Table 4.19 summarizes the measurement of TN in sediment cores to a depth
of 20cms. The TN concentrations varied between 0.44mg g-1 (Station 3) and
5.84mg g-1 (Station 2). As in the TOC concentrations, Station 1 and 2 showed
higher TN concentrations than Station 3. The TN concentrations ranged from
2.30mg g-1 (4-6cm) to 4.35mg g-1 (4-6cm) and 1.94mg g-1 (10-20) to 5.84mg g-1
(6-10) at Station 1 and Station 2 respectively. However, TN concentrations at
Station 3 showed a variation from 0.44mg g-1 (6-10cm) to 1.81mg g-1 (0-2cm). TN
concentrations showed the same decreasing pattern as TOC concentration with a
remarkable decrease beyond 10-20 cm depth (Figure4.17a). The seasonal
variations in depth pattern are given in Figures 4.17b-4.17d. Higher values of TN
142

Sedimellt Characteristics alld Nutrient Status
concentrations were recorded during pre-monsoon season at all stations except at
Station 3. However at Station 3, higher TN concentration were observed during
post-monsoon with an increase beyond 10cm of depth during all seasons.
Table 4.19 Station-wise summary statistics of TN (mg g-1) in sediment cores
Station Depth Min Max Mean SD %ofCV 0-2 2.39 4.17 3.48 0.70 20.19 2-4 2.46 4.26 3.41 0.63 18.57
Station 1 4-6 2.30 4.35 3.23 0.73 22.71 6-10 2.46 4.06 3.05 0.55 17.90 10-20 2.39 2.84 2.56 0.19 7.37 0-2 4.12 5.40 4.75 0.55 11.50 2-4 4.13 4.65 4.3P 0.23 5.17
Station 2 4-6 3.06 4.82 4.10 0.74 18.08 6-10 3.72 I 5.84· 4.29 0.78 18.12 10-20 1.94 3.92 2.57 0.70 27.46
0-2 1.26 1.81 1.57 0.23 14.58 2-4 0.95 1.55 1.15 0.24 20.60
Station 3 4-6 0.65 0.94 0.80 0.11 13.45 6-10 0.44 0.57 0.54 0.07 12.21 10-20 0.45 0.95 0.65 0.23 35.45
In Bangrong mangrove area (Thailand) TN concentrations reported a
variation of 2.61mg g-1 to 2.14mg g-1 in cores of length 14-16cm (Kristensen et al.,
2000). Core sediment at this location showed a decrease in concentration with
increase in depth. Alongi (1996) reported a decline concentration down the core in
the intertidal mangrove forests of Hinchinbrook Island in Queensland, Australia. A
similar soil organic nitrogen concentration of 3.74 mgg-1 was found in the fringe
forest of eastern Australia (Clarke, 1985). Nitrogen fixation by cyanobacteria and
heterotrophic bacteria are abundant on all inhabitable surfaces in mangrove
ecosystem, enhance the TN concentration in surface sediment. Nitrogen
mineralisation, where nitrogen is liberated from organic matter in the form of
ammonium via hydrolyzation and catabolization of proteins and polynucleotides, is
mediated by all nearly all heterotrophic organisms ranging from bacteria to
macrofauna. Rates of bacterial ammonification found, rapidly decreasing with
depth (Shaiful et al., 1986). Rice and Tenore (1981) found that organic nitrogen
accumulation in mangrove detritus was associated with an influx of dissolved
143

Chapter 4
inorganic nitrogen from water column. The ammonium assimilation by microphyto
benthos and plants are always accompanied by mineralization processes in
mangrove forests providing a net system immobilization. The maximum TN
concentration exhibited at Station 2 may be attributed to ammonium assimilation by
microphytobenthos and plants. Also Station 1 and Station 2 exhibited a remarkable
decrease in TN concentrations at the depth of 10-20 cm while Station 3 showed a
decrease at this depth. This observation support the assimilation of TN by
micorphytobenthos at Station 1 and 2.
Annual variation of TN in sediment core mg/g
1.0 1.5 2.0 2.5 3.0 3.5 4.0 4.5 5.0 0-2
I 2-4
E j u 4-6 .E
j .l:! D-O>
Q 6-10
\ 10-20
_ Station 1 __ Station2-A- Station3
(a)
Seasonal variation of TN In sediment core mglg
2~ 3~ 3~ 4~ 4~ 5~ 5~ 6~
2-4
Station 2
.-Pre.monsoon -e- Monsoon -.A- Post-monsoon
(c)
Seasonal variation of TN in sediment core
mg/g 2.0 2.5 3.0 3.5 4.0 4.5 5.0
0-2
2·4 1~ 11 E
u 4·6 .E
J) '" Q. . c 6·10
10-20
Station 1 .-Pre.monsoon-e- Monsoon--a- Post.monsoon
(b)
Seasonal variation of TN In sediment core
2·4
E ~ 4-6
£ c-.. 0 6 . 10
10-20
Station 3 . __ Pre.mons~fT'Ionsoo~Post.rn,.. ... r~ ......
(d)
Fig. 4.17 Annual and seasonal variation of TN in sediment cores
144

Sediment Characteristics and Nutrient Status
The increase in total detrital nitrogen was also found to be associated with
the production of mucopoly saccharide exudates by bacteria and their
incorporation into humic compounds (Rice, 1982; Rice and Hanson, 1984). It was
also established that mangrove leaf litter found to harbor a large population of bacteria that appear to be highly productive (Robertson, 1988; Benner and Hodson
1985). At the first two stations, a remarkable 'decrease in TN concentrations were
noticed beyond 10 cm depth may be attributed to the bacterial biomass at this
depth. While Station 3, exhibited a marked increase in TN concentration at this
depth. Notable decrease of TN concentration beyond 10 cm depth at Stations 1
and 2 may also be associated with the muddy sand nature of the sediment, which
were inefficient in binding mineralized ammonium.
Table 4.20 Correlation matrix between depths - TN
0-2 2-4 4-6 6-10 10-20
0-2 1.0000
2-4 0.9851*** 1.0000
4-6 0.9568*** 0.9764*** 1.0000
6-10 0.9930*** 0.9854*** 0.9763*** 1.0000
10-20 0.8251 *** 0.8844*** 0.9203*** 0.8655*** 1.0000
p<0.01 p<U.001
Significant positive correlation was found between TN concentrations in all
depths (p<0.01) (Table 4.20). This positive correlation indicated a high degree of
association of TN concentration at all depths. This may be attributed to the
effective bioturbation at the studied area. The minimum amount of tidal flushing, at
Station 1 and Station 2 may enhance the accumulation of ammonium formed by
the mineralisation of organic matter. Also a significant positive correlation was
observed with exchangeable ammonium at all depths (p<0.01) (Table 4.18a-18e)
indicated the close association of TN and ammonium concentration in sediments.
TN correlated positively with TOe and negatively with sediment C/N ratio at 0-2
and 2-4cm depth (p<0.01, p<0.05). This indicated the decrease in C:N ratio was
mainly due to the increase of TN in the sediment. It is possible that the increase in
TN ::::-1d thus decrease in C/N ratio in the sediment partly to the increase of
chlorophyll-containing labile materials (Cheng and Chang, 1999). TN was found to
be positively correlated with percentage of clay, exchangeable ammonium and
145

Chapter 4
TOCI at depths 0-2, 2-4,4-6,6-10 cm. Significant negative correlations were found
with sand at these depths.
Three-way ANOVA analysis showed a significant difference of TN between
stations, between depths and between seasons. The LSD at 5% level for stations is 0.314 mg gO'. Among the stations, Station 2 showed significantly higher value of
TN followed by Station 1, which in turn had significantly higher concentration than
Station 3. The maximum value of 5.40 mggO, was recorded at Station 2. The LSD at
5% level for depth is 0.405. TN recorded significantly higher concentrations at the
depth of 0-2cm and 2-4 cm. TN concentrations followed a decreasing order in the
layers 4-6,6-10 and 10-20 cm. The maximum value of 5.40 mg/g was recorded at
a depth of 0-2 cm. The LSD at 5% level for season is 0.314. Significantly higher concentration of nitrogen was observed during pre-monsoon followed by post
monsoon and monsoon. The maximum TN was found during pre monsoon irrespective of the stations may be associated with maximum nitrogen fixation
during this season.
Exchangeable nitrate.
The nitrogen cycle is rather complex, involving processes such as nitrogen
fixation, denitrification, uptake by plants, immobilization by micro-organisms and
mineralisation. These processes are mediated by biological, mostly microbial,
processes rather than by chemical means. By virtue of a wide range of oxidation
states (-3 for ammonia to +5 for nitrate), nitrogen can serve as a reductant or an
oxidant in the diagenesis of organic matter in addition to its role as a nutrient in microbial and plant assemblages. The presence of litter in the intertidal forested
wetlands (mangroves) establishes different nutritional constraints on nitrogen
transformations on sediments than those observed in subtidal sediments. Thus,
rates of denitrification in mangroves are generally much lower than those of most
estuarine sediments. Evaluating of the fate of inorganic nitrogen in mangrove
sediments depend on time scales of sedimentary processes (Rivera- Monroy and
Twilley, 1996). They also found that most of the inorganic nitrogen remains in the
sediment. High inorganic nitrogen demand in decomposing leaf litter may regulate an efficient recycling of nitrogen that would serve as a mechanism for nutrient
conservation (Twilley et al., 1986 b; Twilley, 1988; Alongi et al., 1992). The
response of denitrification to supply of nitrate may de;:>end on the iii~~ :'~';;i1 demo;,':::
by decomposers as indicated by the C : N of sediments. Presence of nitrate and
146

Sediment Characteristics and Nutrient Status
nitrite in anaerobic soils can be accounted for by nitrification in the aerobic
rhizopheres near the roots of the wetland plant (Haines et al., 1977).
The station-wise summary statistics of exchangeable nitrate are given in Table
4.21. The minimum and maximum values of exchangeable nitrate recorded were
2.71IJmolg·1 (Station 3) and 90.67IJmolg·1 (Station 2) respectively. Comparatively
higher values were recorded at Station 1 and Station 2 than at Station 3. A general
pattern of exchangeable nitrate concentrations, with an increase in sub-surface
sediment followed by a gradual decrease down the core was noticed at all stations
except at Station 3 (Figure 18a). However Station 3 recorded a gradual decrease of
exchangeable nitrate concentration down the core. Seasonal variations in depth
pattern are illustrated in Figures 4.18b-4.18d. The higher concentrations of
exchangeable nitrate were recorded duril.g pre-monsoon season with certain
exceptions like a remarkable increase was recorded at 2-4 cm depth at Station 1 and
Station 2 during monsoon season. However Station 3, recorded the subsurface
increase only during pre-monsoon and post-m on soon seasons.
Table 4.21 Station-wise summary statistics of exchangeable nitrate (nmol g.1)
in sediment cores
Station Depth Min Max Mean SO %ofCV
0-2 12.68 20.64 16.76 3.98 23.77
2-4 5.26 64.31 35.02 29.53 84.32
Station 1 4-6 6.45 32.75 18.60 13.26 71.27
6-10 12.52 15.23 14.09 1.41 9.98
10-20 8.40 14.01 10.75 2.91 27.06
0-2 16.47 28.84 21.31 6.60 30.98
2-4 13.59 49.23 29.70 18.06 60.83
Station 2 4-6 16.01 37.60 23.40 12.30 52.57
6-10 11.10 16.32 13.90 2.63 18.92
10-20 18.85 90.67 45.67 39.21 85.84
0-2 3.29 30.71 14.03 14.64 104.39
2-4 5.02 12.25 8.27 3.67 44.35
Station 3 4-6 3.80 13.24 8.53 4.72 55.28
6-10 2.71 7.72 4.94 2.55 51.57
I .
10-20 2.76 10.47 5.88 4.06 69.08
147

Chapter 4
Annual variation of exchangeable nitrate
nmolfg o 10 20 30 40 50
0-2.,..-~"""T'"""""'~_~"'-~-'-~-'
2-4
E u 4-6 .E .t:;
a c3 6-10
10-20
.-Station 1 __ Station~ Station3
(a)
Seasonal variation of exchangable nitrate
nmotlg
0-2 20 40 60 80
E u 4-6 .E .t:;
a c3 6-10
10-20 ...
Station 2
100
_ P'e.monscor>-e- Monscor>-ol.-- Post.menscon
(c)
Seasonal variation of exchangeable nitrate
nmol/g 20 30 40 50 60 70
~2 ;
2-4
64-6 V i&10 y 10-20 A
Station 1
(b)
Seasonal variation of exchangeable nitrate
nmol/g
0-20 10 20 30
\. 2-4
j 6 4-6 .E j 1&10
11 \ 10-20
Station 3
40
. .- Pre.monsoon--e- t.1onsoon--oI.- Post.rronsooo
(d)
Fig. 4.18 Annual and seasonal variation of exchangeable nitrate in sediment cores
The highest concentration of exchangeable nitrate recorded at Station 2
associated with the luxuriant growth of plants at this Station. Presence of nitrate
and nitrite in anaerobic soils can be accounted for by nitrification in the aerobic
rhizopheres near the roots of the wetland plant (Haines et al., 1977).
Nitrification in sediments might be the cause of increase in concentration of
ammonia at this site. There exist a significant negative correlation between the
148

Sediment Cllaracteristics and Nutrient Status
exchangeable nitrate and ammonium at this station, during pre-monsoon. No
significant difference of exchangeable nitrate exists between Station 1 and Station 3.
Although the difference was not statistically significant in seasonal variations,
monsoon season recorded maximum value of exchangeable nitrate. The 10-20 cm
layer recorded a higher amount during post monsoon. Exchangeable nitrate
recorde.d 12.6 nmolg-1, 97.57 nmolg- and 13.80 nmolg-1 at Station 1, Station 2, and
Station 3 respectively.
The minimum values were recorded at depths of 6-10 cm or 10-20 cm observed mostly during monsoon or post monsoon (Table 4.21). Active growth of
plants takes place during this season, which might cause the decrease of nitrate-N
at this depth. Alternatively tidal incursions can also remove nitrate at Station 3
where tidal influence is maximum. Regular tidal incursions may remove nitrate,
which is more soluble than ammonium from the soil (Clarke, 1985). There is
significant correlation (Table 4.22) between depth ranges 2-4, 4-6 and 6-10 cm (p< 0.01). Correlation is not significant in other depth ranges may be due to the removal of nitrate from surface sediment by grazing organisms and 10-20 cm
depth, major rooting zone of plants, plant uptake decide the concentration of
exchangeable nitrate.
Table 4.22 Correlation matrix between depths - Ex. Nitrate
0-2 2-4 4-6 6-10 10-20
0-2 1
2-4 0.0842 1.0000
4-6 0.3513 0.6702 1.0000
6-10 0.3756 0.5631 0.6971* 1.0000
10-20 0.5650 -0.0576 .0.0905 0.1941 1.0000
p<0.05·
ANOVA of exchangeable nitrate concentration recorded significant variation
among stations but not with depth or season (App.17). The LSD at 5% level for
station is 11.405nmol g-1.
Exchangeable Ammonium.
Organic matter in wetland sediment accumulates on decadal time scales,
and nitrogen immobilisation in sediments can eventually contribute to the burial of
nitrogen in mangrove ecosystem. Some of this immobilized nitrogen in the early
149

Chapter 4
stages of decomposition may be recycled by ammonification and used in plant
uptake. The measurements of inorganic nitrogen immobilization by 15N technique
refer to the accumulation of nitrogen in litter during early stages of decomposition
(Rivera- Monroy and Twilley, 1996). Ammonium is the main form of inorganic
nitrogen in anaerobic mangrove soils because nitrification of organic nitrogen stops
at ammonium due to the lack of oxygen to oxidise it further to nitrate
(Ponnamperuma, 1972). Like other cations, ammonium is capable of occupying
cation exchange sites, but the high level of sodium in most mangrove soils tends to o
swamp the cation exchange sites, thereby displacing ammonium. Thus ammonium
occurs mainly in the interstitial phase where it is highly mobile and susceptible to
being leached by heavy rain or lost through drainage following tidal inundation.
Boto and Wellington (1984) found that ammonium pools could be depleted by tree
uptake during periods of rapid mangrove growth.
Table 4.23 summarises the measurements of exchangeable ammonium in
sediment cores to a depth of ?Ocms. The ammonium concentrations varied between 0.07IJmolg-1 (Station 3) and 1.03IJmolg-1 (Station 1). Higher ammonium
concentrations were noticed at Station 2 than other stations.
Table 4.23 Station-wise summary statistics of exchangeable ammonium (lJITlol g-1)
in sediment cores
Station Depth Min Max Mean SO %ofCV
0-2 0.32 0.41 0.38 0.05 13.59
2-4 0.35 0.58 0.45 0.12 25.59
Station 1 4-6 0.22 0.84 0.48 0.32 67.60
6-10 0.30 0.83 0.49 0.30 60.33
10-20 0.40 1.03 0.63 0.35 55.51
0-2 0.57 0.84 0.67 0.15 23.11
2-4 0.38 0.57 0.48 0.10 19.82
Station 2 4-6 0.42 0.66 0.52 0.12 24.06
6-10 0.31 0.85 0.59 0.27 45.99
10-20 0.57 0.92 0.69 0.19 27.65
0-2 0.16 0.26 0.20 0.05 27.24
2-4 0.12 0.19 0.16 0.04 22.21
Station 3 4-6 0.08 0.20 ~.15 n ne> 41.07 v.vu
6-10 0.07 0.09 0.08 0.01 12.50
10-20 0.07 0.11 0.10 0.02 25.42
150
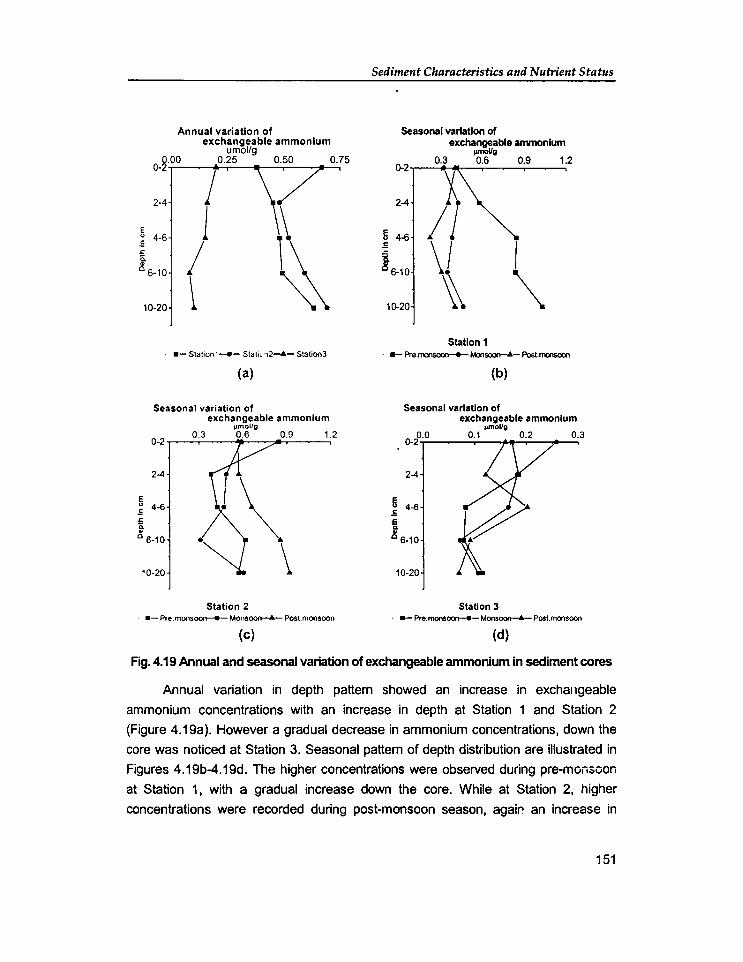
Annual variation of exchangeable ammonium
umol/g ~.oo 0.25 0.50 0.75
0-
j 2-4
1 E u 4-6 .s
I ~ a. '" 0 6-10
~ 10-20
_ Station 1 __ Statlll~- Station3
(a)
Seasonal variation of
0-2
2-4
E u 4-6 .s ~
1i. w 0 6_10
10-20
exchangeable ammonium ~mol/g
0.3 0.6 0.9 1.2
•
Station 2 . .-Pre .mons~-MonS()()f>---A- Post.monsoon
(c)
Sediment Characteristics and Nutrient Status
Seasonal variation of exchangeable anvnonlum
""",Vg 0.3 0.6 0.9 1.2
0-2
~ 2-4
~ ~ ..s .r: \1 I ! 6-10
~ ~ 10-20
Station 1 .• - Pre.~-M:ln~-Post.monsoon
(b)
Seasonal variation of
2-4
~ 4~ ..s 6
! 6-10
10-20
exchangeable ammonium ....,ol/g
Station 3 . .-Pre.monsoon-e- MonS()()f>---A- Post.mansoon
(d)
Fig_ 4.19 Annual and seasonal variation of exchangeable ammonium in sediment cores
Annual variation in depth pattern showed an increase in exchangeable
ammonium concentrations with an increase in depth at Station 1 and Station 2
(Figure 4.19a). However a gradual decrease in ammonium concentrations, down the
core was noticed at Station 3. Seasonal pattern of depth distribution are illustrated in
Figures 4.19b-4.19d. The higher concentrations were observed during pre-monsoon
at Station 1, with a gradual increase down the core. While at Station 2, higher
concentrations were recorded during post-monsoon season, agair. an increase in
151

Chapter 4
concentration down the core was noticed. Unlike the other two stations, at some
depths an increase in exchangeable ammonium concentrations recorded at Station3,
the bottom sediments found to extract less ammonium than the surface sediments.
Table 4.24 Correlation matrix be~een depths - Ex. Ammonium
extr NH3 0-2 2-4 4-6 6-10 10-20
0-2 1.0000
2-4 0.6240 1.0000
4-6 0.5212 0.9037*** 1.0000
6-10 0.6526 0.8769** 0.9201 *** 1.0000
10-20 0.6170 0.9675*** 0.9652*** 0.9544*** 1.0000
p<O.01 p<O.001
The exchangeable ammonium at the depth range 2-4 is significantly
correlated with 4-6, 6-10 and 10-20 cm depth (p< 0.01) (Table 4.24). The 4-6 cm
layer is significantly positively correlated with 10-20 cm depth. While 0-2 cm depth
range did not significantly correlate with any of the other depths. In general,
however the surface layer of the sediments has the highest level of inorganic
nitrogen, this is related to the faster rate of decomposition found on the surface of
the sediments than at the depth (vander Valk and Attiwill, 1984). Correlation of
exchangeable ammonium and other parameters showed a positive relationship
with percentage of clay, total nitrogen, in 0-2, 2-4, 4-6 and 6-10 and 10-20 cm
depth (Table 4.18a-18e). At 4-6 cm depth a positive relationship was observed with
exchangeable nitrate.
Three way ANOVA analysis showed a significant difference of exchangeable
ammonium between station, and between season but not between depth (App.
18). The LSD at 5% level for station and season is 0.122 ~molg·1. Significantiy
higher concentration of exchangeable ammonium was recorded at Station 1 and
Station 2. There is no significant difference between these two stations, while
Station 3 recorded comparatively low concentration of exchangeable ammonium
than the other to stations. Significantly higher value of exchangeable ammonium
was observed during pre-monsoon fOllowed by monsoon and post monsoon.
Significantly low concentration was registered during post-monsoon The
ammonium concentrations were found to increase and maximum were found at the
152

Sediment Characteristics and Nutrient Status
10-20 cm layer at Station 1 and Station 2. The ammonium concentration increases
with depth in the anaerobic soil, indicating denitrification beyond rhizopheres.
Total Phosphorus (TP)
Many studies have revealed a permanent nutrient retention in aquatic system.
The retention and dynamics of particulate matter and associated nutrients especially
phosphorus are strongly affected by sedimentation and adsorption processes dL:ring
low flow periods. The physical and chemical environment at the sediment-water
interface largely governs phosphorus cycling in lakes, fluxes and redistribution
patterns of phosphorus, in particular by the reduction of iron complexes at low redox
potential (Mortimer, 1971). But in recent years, an increased understanding of
microbial processes in aquatic ecosystem has provided a more advanced model,
including the importance of sediment bacteria for phosphorus dynamics (Gachter
and Meyer, 1993). Bacteria are known to have mechanisms for rapid uptake of
phosphate and intracellular storage as poly-phosphate under aerobic conditions and
the hydrolysis and release of phosphate when their environment turns anoxic.
(Deinema et al., 1985; Wentzel et al., 1991). Much of the inorganic phosphorus in
mangrove soils is adsorbed or incorporated within hydrated iron and aluminium
colloidal sesquioxides. Regarding the vertical variation of TP in sediments, Delaune
and Patric (1980) have found a marked decline with depth in a vertical profile of the
distribution of solid phase TP in Lousiana Spartina marshes.
TP concentrations were found to vary between 296.70 I-Igg-1 (Station 3,
10-20cm) and 2190.84I-1gg-1 (Station 1, 10-20cm) (Table 4.25). The minimum at
Station 1 recorded at a depth of 2-4cm (974.93I-1gg-1) and maximum recorded at
10-20 cm (2190.84I-1gg-1) depth. While at Station 2 minimum (974.93I-1gg-1
)
observed at 10-20cm and maximum (2046.38I-1gg-1) at 6-10cm depth. Station 3
recorded the minimum (296.70I-lgg-1) at -10-20 cm depth and maximum
(1412.85.l-Igg-1) at 0-2 layer. TP concentrations were similar at Station 1 and in
Station 2. The annual and seasonal depth distributions of TP are given in Figures
4.20a-20d. The overall picture of the annual variation followed the general pattern
of decreasing phosphorus concentration with increasing depths at Station 1 and
Station 3, except at 10-20 cm depth at Station 1 (Table 4.20). The TP
concentrations exhibited comparatively lower coefficient of variation in 0-2cm layer
at Station 1, 2-4 cm layer at Station 2 and 10-20 cm layer at Station 3. Station 2
showed a subsurface maximum and the values decreasp,s down the core. However
153

Chapter 4
at Station 1 and Station 2 there was a reversal in the above trend at 10-20 cm
depth and at 2-4 cm depth respectively.
Table 4.25 Station-wise summary statistics of TP (mg g.1)
Station Depth Min Max Mean SO %ofCV
0-2 959.60 1967.60 1590.51 361.05 22.70
2-4 951.40 1954.21 1407.45 339.56 24.13
Station 1 4-6 1051.25 1947.46 1400.67 331.74 23.68
6-10 1167.65 1922.13 1489.72 338.74 22.74
10-20 1082.08 2190.84 1693.82 428.92 25.32
0-2 1222.31 1819.23 1501.01 224.98 14.99
2-4 1449.45 1777.34 1648.05 122.67 7.44
Station 2 4-6 1420.68 1768.37 1564.90 137.63 8.79
6-10 1352.78 2046.30 1617.62 294.54 18.21
10-20 974.93 1823.74 1331.14 303.79 22.82
0-2 480.72 1412.85 847.28 320.82 37.87
2-4 452.55 759.70 599.81 118.03 19.68
Station 3 4-6 357.01 608.57 475.93 85.87 18.04
6-10 326.06 596.63 435.52 106.09 24.36
10-20 296.70 476.06 415.91 73.96 17.78
Remarkably higher concentrations of TP were observed at Station 1 and
Station 2 than at Station 3. The maximum concentration of 2190l-lgg·' was recorded
at Station 1. The spatial variation in distribution of TP is explained by the sediment
grain size, presence or absence of macrophytes\ phytoplankton, bacterial
assemblages etc. Redox potentials, pH and sorption/desorption processes have
traditionally are regarded as important regulating factors for the exchange of
phosphorus between sediment and overlying water (Bostrom et al., 1988). Also the
existence of denser vegetation at Station 1 and Station 2 as compared to Station 3
facilitates the trapping of nutrients discharged to this creek. Matrix of correlation
between parameters showed that percentage of clay is positively correlated with
TP at all depths (Table 4.18a-18e). Associated with the high silt and clay
percentage (Table 4.13), the signincantly high concentration of TP was recorded at
the first two stations at all depths compared to the Station 3.
154
I

Annual variation of 1: TP ~g/g
0-2 500 1000 1500 2000
2-4 .-E J u 4-6
X .E
1 J: a. .. 0 6-10
1 10-20
.-Station ,_-Station2-&- Stalion3
E
1200 0-2
2-4
u .E 4-6
" a. ZlS_10
10-20
(a)
Seasonal variation of 1: TP
2200
Station 2 __ Pr8.monsoon--4-Monsoo~ Post.monsoon
(c)
Sediment Characteristics and Nutriellt Status
Seasonal variation of 1: TP f'IIIg
O-~ooo 1200 1400 1600 1800 2000 2200
!: ~ ( ~:: ~~
Station 1 _Pre.~~Pos\.monsocn
2-4
E ~ 4--6 .t: ii • 0 6-10
(b)
Seasonal variation of 1: TP og/g
450 600 750 900 1050
Station 3 __ Pre.monsoon-e-Monsoo~ Post.monsoon
(d)
Fig. 4.20 Annual and seasonal variation of TP in sediment cores
155

Cllapter4
Table 4.26 Correlation matrix between depths - TP
0-2 2-4 4-6 6-10 10-20
0-2 1.0000
2-4 0.8916** 1.0000
4-6 0.9395*** 0.9783*** 1.0000
6-10 0.8891** 0.9346*** 0.9171*** 1.0000
10-20 0.9526*** 0.8647** 0.9161*** 0.8682** 1.0000
p<0.01 p<0.001
Generally at Station 2 and Station 3, 0-2cm and 2-4 cm layers exhibited higher
TP concentrations than the other depths. In mangrove area (Fly Delta, Papua New
Guinea) TP concentration were found high in surface sediments, suggesting
oxidation near or at the sediment-water interface. The oxidative reactions would
immobilize phosphorus and limit its availability to autotrophs and microheterotrophs,
with phosphorus being bound to non reactive metals, particularly as iron and
manganese oxyhydroxides (Boto, 1992). The correlation matrix between depths,
recorded significant positive Correlation of TP concentration among the depth ranges
0-2, 2-4, 4-6 and 10-20 (p< 0.05) (Table 4.26). This positive relationship at different
depths indicated an association of TP concentrations at different depths in the core
sediment. TP concentrations were recorded high in surface and subsurface
sediments, indicating the contribution of below ground roots in maintaining oxidised
surface sediment. The oxidative reactions would limit its desorption of phosphate into
overlying water, since most of the phosphorus being bound to nun-reactive metals,
particularly as iron and manganese oxyhydroxides. Also bacteria are known to have
mechanisms for rapid uptake of phosphate and intracellular storage as
poly-phosphate under aerobic conditions and the hydrolysis and release of
phosphate when their environment turns anoxic.
Three way ANOVA showed a significant difference of TP concentrations
between station (p<0.001) and between season (p<0.01) but not between depths
(App.19). The LSD at 5% level for stations is 144I-1gg-1• The LSD at 5% level for
season is 0.145I-1gg-1• Significantly higher concentration was observed during post
monsoon followed by 11 ,UII:.oon allU pre-monsoon. Maximum retention of
phosphorus during post-monsoon may be associated with the oxidised iron
minerals present in sediment. The present observation indicated the sediments at
156

Sediment Characteristics and Nutrient Status
Station 1 and Station 2 were better nutrient sink than at Station 3,due to its ability
to immobilize phosphorus in an oxidised sediment-water interface.
4.2.6 Stoichiometries of C, Nand P along core sediments
Carbon: Nitrogen ratio (GIN)
C/N ratio in sediments indicate rate of nitrogen mineraliztaion. Aerobial
decomposition of organic matter is usually more rapid than the rate of oxygen
diffusion into surface sediments, and oxygen quickly becomes limiting. Anaerobic
bacteria below the upper few millimetres of sediment therefore carry out most
decomposition, except where animal burrow~ and plant roots channel oxygen to
deeper sediment layers (Anderson and Kristensen, 1988; Aller, 1&94). Anaerobic
,1ecomposition in marine sediments performed by a wide variety of bacterial types
utilizing a number of electron acceptors like nitrate, oxidised iron and manganese
and sulphate to oxidise carbon. Macrophyte detritus from mangrove trees typically
has high GIN ratios compared with the demands of decomposing bacteria
(Kristensen, 1990; Wafar et al., 1997). Since heterotrophic bacteria generally need
organic substrates with a GIN ratio of 10 or less for maintanenace and growth
(Fenchel and Blackburn, 1979) while mangrove litter with GIN ratio up to 100 are a
highly insufficient substrate (Krtlstensen, 1990).
Table 4.27 summarises the variation of GIN ratios observed in core sediments
to a depth of 20cm. The minimum and maximum ratio observed were 10.48 (Station
3) and 56.62 (Station 3) respectively. The GIN ratios recorded at Station 1 were
remarkably higher than the other two stations. GIN ratio varied from 19.09 (2-4cm) to
36.16 (10-20cm), 15.61 (4-6cm) to 38.33 (10-20cm), and 10.48 (4-6cm) to 56.62
(10-20cm) at Station 1, Station 2 and Station 3 respectively. Annual variations in
depth profile showed a general pattern of a sub-surface decrease followed by a
remarkable increase beyond 10 cm depth at all stations (Figure 4.21 a). The seasonal
depth distributions at all stations are illustrated. in Figures 4.21 b-d. The lower values
were observed during pre-monsoon and higher values recorded during monsoon
season at all stations. General pattern of depth distribution followed in seasonal
pattern, except duriilg monsoon season at Station 1.
157

Chapter 4
Table 4.27 Station-wise summary statistics of C/N in sediment cores
Station Depth (cm) Min Max Mean SD %ofCV
0-2 20.75 35.01 26.57 5.15 19.37
2-4 19.09 35.73 25.15 6.30 25.03
Station 1 4-6 20.21 35.20 26.56 5.98 22.53
6-10 19.69 33.41 25.27 5.03 19.90
10-20 23.13 36.16 27.74 4.77 17.19
0-2 15.96 26.69 19.47 4.10 21.07
2-4 15.81 26.23 19.62 I 3.85 .19.60
Station 2 4-6 15.61 32.83 21.29 I 6.32 29.70 . 6-10 17.48 23.73 20.04 2.66 13.25
I 10-20 19.14 38.33 I 25.03 6.92 27.65
I 0-2 18.64 23.64 19.86 1.89 9.53 I 2-4 11.28 23.64 18.14 4.18 23.05
I Station 3 4-6 10.48 25.89 19.18
I
6.33 33.01
6-10 12.37 25.69 19.95 5.32 26.66
10-20 20.49 56.62 30.39 13.27 43.66
Remani et al. (1980) have reported C/N values ranging from 2.87 - 45.44 in
sediments of Cochin estuary. They suggest that the state of break down of organic
matter, which depends on the environmental factors and textural characteristics of the
sediment, rather than its absolute quantity influence the C/N ratio. The fringing
mangrove zones have high C:N ratios indicating an accumulation of carbon relative to
nitrogen; this carbon probably originates from debris washed on to strand lines (Clarke,
1985). A similar condition exists in the stations under investigation. According to C/N
ratio accumulation of carbon was found maximum at Station 1. Based on the station
wise variation of exchangeable ammonium (Figure 4.19a) it can be concluded that
ammonification was high in core sediments at Station 2. The C/N ratio together with the
exchangeable ammonium concentration suggested maximum ammonification takes
place at this site. Kristensen et al. (1998) suggested that, in mangrove sediments, due
to tight coupling between microbial mineralisation and assimilation, ammonium is
trapped in the sediments, which also estimated as TN. Though the TOC
concentrations at Station 3 were very low, C/N was comparable as that of Station 2,
indicate denitrification of the ammonium formed during organic mineralisation. The
158

Sediment Characteristics and Nutrient Status
remarkably high ratios observed at beyond 10 cms of depth suggest a different
pathway of mineralisation, probably as oxidised ir~>n as electron acceptor.
Annual variation of C/N in sediment core Seasonal variation of CIN in sediment core
E ~ 4-6
a c!; 6-10
10-20
2-4
20 24 28 32
:~~j/ 5~ ~v i 6-10 Ii..
.~ 10-20
Station 1 . .-Station ,_-Station2-.- Station3 .-Pre.~-Mlnsoon-~ Post.monsoon
(a) (b)
Seasonal variation of C/N in sediment core Seasonal variation of ClN In sediment core
0-2 15 20 25 30 20 30 40
2-4
6 4-6 .5 .t::
!6-10
10-20
Station 2 Station 3 . _ Pre.mon~Mons~ Post.monsoon
(c) (d)
Fig. 4.21 Annual and seasonal variation of C/N in sediment cores
Sea:>onal variations in GIN ratio in sediment cores at different sites exhibit
variation similar to concentrations of TOG. Minimum GIN ratio observed during pre
monsoon associated with minimum TOG during the same season. However
159
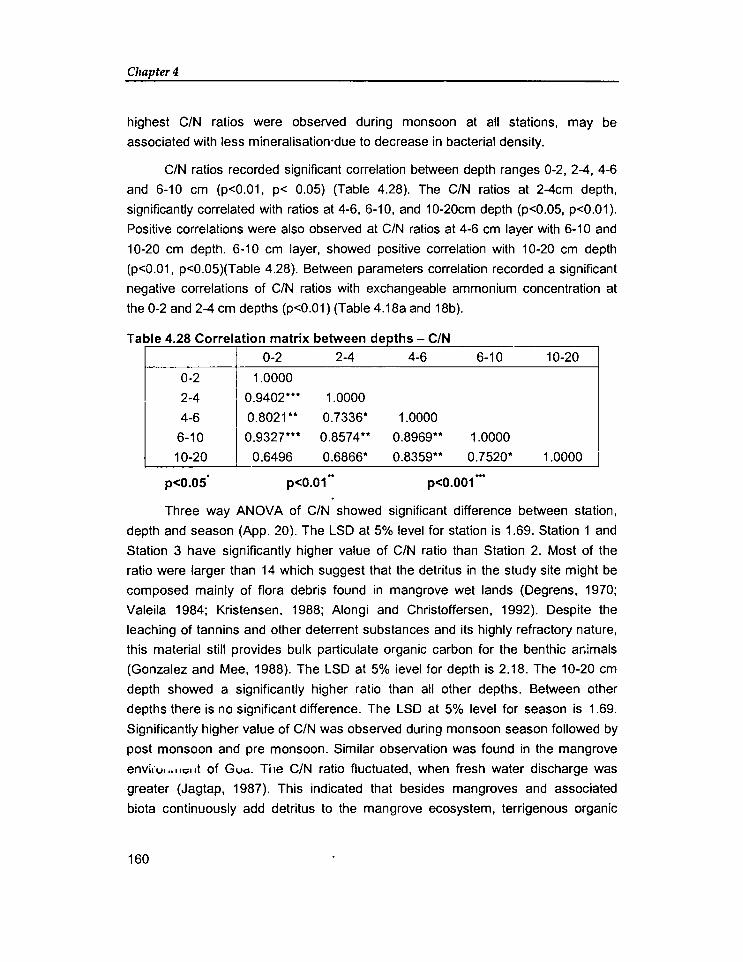
Cllapter4
highest C/N ratios were observed during monsoon at all stations, may be
associated with less mineralisation'due to decrease in bacterial density.
C/N ratios recorded significant correlation between depth ranges 0-2, 2-4, 4-6
and 6-10 cm (p<0.01, p< 0.05) (Table 4.28). The C/N ratios at 2-4cm depth,
significantly correlated with ratios at 4-6, 6-10, and 10-20cm depth (p<0.05, p<0.01).
Positive correlations were also observed at C/N ratios at 4-6 cm layer with 6-10 and
10-20 cm depth. 6-10 cm layer, showed positive correlation with 10-20 cm depth
(p<O.01, p<0.05)(Table 4.28). Between parameters correlation recorded a significant
negative correlations of C/N ratios with exchangeable ammonium concentration at
the 0-2 and 2-4 cm depths (p<0.01) (Table 4.18a and 18b).
Tabl 428 C e orre a Ion ma rlX e If t' b tw een ep' 5-d th C/N
0-2 2-4 4-6 6-10 10-20
0-2 1.0000
2-4 0.9402*** 1.0000
4-6 0.8021** 0.7336* 1.0000
6-10 0.9327*** 0.8574** 0.8969** 1.0000
10-20 0.6496 0.6866* 0.8359** 0.7520* 1.0000 I p<o.os' p<O.01- p<O.001-
Three way ANOVA of C/N showed significant difference between station,
depth and season (App. 20). The LSD at 5% level for station is 1.69. Station 1 and
Station 3 have significantly higher value of C/N ratio than Station 2. Most of the
ratio were larger than 14 which suggest that the detritus in the study site might be
composed mainly of flora debris found in mangrove wet lands (Degrens, 1970;
Valeila 1984; Kristensen. 1988; Alongi and Christoffersen, 1992). Despite the
leaching of tannins and other deterrent substances and its highly refractory nature,
this material still provides bulk particulate organic carbon for the benthic ar,imals
(Gonzalez and Mee, 1988). The LSD at 5% ievel for depth is 2.18. The 10-20 cm
depth showed a significantly higher ratio than all other depths. Between other
depths there is no significant difference. The LSD at 5% level for season is 1.69.
Significantly higher value of C/N was observed during monsoon season followed by
post monsoon and pre monsoon. Similar observation was found in the mangrove
enVI.U'U'":;;lIt of GUd. Ti le C/N ratio fluctuated, when fresh water discharge was
greater (Jagtap, 1987). This indicated that besides mangroves and associated
biota continuously add detritus to the mangrove ecosystem, terrigenous organic
160

Sediment Characteristics and Nutrient Status
matter brought in by fresh water discharge also vary the stoichiometric ratios at
these sites.
Nitrogen: Phosphorus ratio (NIP)
Coastal marine areas around the world are, to a large extent, influenced by
human activities that lead into increased concentrations of nutrients and organic
matter (Clough et al., 1983; Conley, 2000). Bacteria are known to be important
degraders of organic matter and they control the recycling of essential nutrients in
coastal sediments (Alongi, 1994). A rapid immobilization of nutrients may occur
during decomposition in mangrove forest sediments and other sediments as well
(Alongi, 1991; 1994; 1996: Kristensen et al., 1998). Immobilizations due to
adsorption reactions further reduce the availability of phyosphorus. Thus an
increased loading of phosphate and ammonium to the sediment due to increased
human activities such as waste water outlet in shrimp farms in mangroves and
urban waste water loading to mangrove fringed creeks may increase the rate of
decomposition as the nutrient condition for the bacteria improved. Thus the
examination of Redfield ratio (NIP) in core sediments may able to identify the
loading of phosphorus in this system.
Table 4.29 summarises the variation of NIP ratios observed in core
sediments to a depth of 20cm. The minimum and maximum ratio observed were
0.82 (Station 3) and 4.47 (Station 1) respectively. Comparatively higher ratios were
observed at Station 2 (1.06-4.06) than the other two stations. Annual variations
showed a general pattern of decreasing NIP ratio down the core, except at Station
1 where a subsurface increase was noticed (Figure 4.22a). Seasonal variations in
NIP are illustrated in Figures 4.22b-d. Maximum values of NIP were recorded
during pre-monsoon at Station 1 and Station 3, while at Station 2 maximum values
were noticed during post-monsoon.
161

Chapter 4
Table 4.29 Station-wise summary statistics of NIP in sediment cores
Station Depth (cm) Min Max Mean SD %ofCV
0-2 1.67 3.11 2.25 0.52 23.13
2-4 1.89 4.47 2.57 0.97 37.73
Station 1 4-6 1.75 3.43 2.38 0.68 28.67
6-10 1.28 2.65 2.11 0.46 21.98
10-20 1.30 2.21 1.59 0.39 24.57
0-2 2.26 4.08 3.23 0.61 18.89
2-4 2.46 3.00 2.67 0.18 6.60
Station 2 4-6 1.73 3.27 2.65 0.56 21.17 I
6-10 1.93 3.05 2.68 0.40 14.91
10-20 1.06 2.60 1.99 0.53 26.78
0-2 1.16 2.38 1.92 0.45 23.63
2-4 1.27 2.75 1.96 0.66 33.63
Station 3 4-6 1.31 2.34 1.67 0.39 23.47
6-10 0.82 2.13 1.45 0.56 38.79
10-20 0.95 2.18 1.59 0.54 33.99
N:P ratios in core sediments showed a gradual decrease down the core may
be attributed to the decrease of TN, since only TN concentrations showed a
Significant decrease with increasing depth (AN OVA). The highest N:P ratios were
observed in surfacel subsurface sediment at all stations, where TN concentrations
showed significantly higher values. Seasonal variation of NIP ratios were found in
accordance with the seasonal variation of TP at all stations. The value of NIP ratio
during the present study ranged between 0.82 and 4.47. The value of NIP for natural
plankton is 13.8:1 while a ratio of 18.2:1 found for culture planktons. The values
found in here were far below the above values indicated the abiogenic nature of
phosphorus. Sankaranarayan and Panampunnayil (1979) have reported an
a0iogenic nature of phosphorus in sediments of Cochin harbour and adjacent areas.
162

Annual variation of NIP in sediment core
0-2 2 3 4 5
2-4
E u 4-6 .5 ~
15.
i!l6-10
10-20
. _ Stationl __ Station2--A- Station3
(a)
Seasonal variation of NIP In sediment core
2-4
~ 4-6 .5 ~
15.
~ 6-10
10-20
2 3 4 5
Station 2 . _Pre.mons~Mons~Post.monsoon
(c)
Sediment Characteristics and Nutriellt Status
Seasonal variation of NIP in sediment core
0-21 2 3 4 5
t~ 2-4
1 \/ ~4-6 .5
.1 16-10
10-20
Station 1 . .- Pre.rronsoon-+- tIonsoon-.a.- PosI.rronsoon
(b)
Seasonal variation of NIP In sediment core
Station 3 • _ Pre.monsooo-e-Mons~ Post.monsoon
(d)
Fig. 4.22 Annual and seasonal variation of NIP in sediment cores
The correlation matrix between depths showed significant correlation only in
surface sediments (Table 4.30). Significant positive correlations observed among the
depths 0-2cm, 2-4 cm and 4-6 cm (p<0.01, p<0.05). The correlation between other
parameters showed a positive correlation with exchangeable nitrate concentration at
0-2 cm depth (p<0.05) (Table 4.18a).
163

Cllapter4
Table 4.30 Correlation matrix between depths - NIP
0-2 2-4 4-6 6-10 10-20
0-2 1.0000
2-4 0.7834* 1.0000
4-6 0.6690* 0.8543** 1.0000
6-10 -0.4036 0.0614 -0.0759 1.0000
10-20 0.2422 0.4528 0.3796 0.5686 1.0000
p<0.05· p<0.01
Three way ANOVA showed significant difference between station, between
depth and between season (App.21). The l SD at 5% level for NIP ratios among
stations is 0.34. Station 1 and Station 2 showed significantly higher ratio than
observed at Station 3. No significant difference were found between the ratios found
at Station 1 and Station 2. The LSD at 5% level for ratios observed at different depth
is 0.44. Significantly higher value of NIP ratio were observed at 0-2cm, 2-4cm, 4-6cm
depth than the other depths. The LSD at 5% level in NIP ratio during different
seasons is 0.34. During pre-monsoon season, significantly higher ratios were noticed
in sediment cores.
Garbon:Phosphorus ratio (GIP)
The GIP ratio is used as an index of pollution by domestic sewage in any
aquatic environmental system. Several studies established that phosphate is
immobilized in mangrove sediments (Hesse, 1962; Boto and Wellington, 1983).
The capacity of mangrove soil to immobilize phosphate depends on the amount of
organic matter, its GIP ratio and the type and amount of clay minerals present.
Dissolution of mineral phosphate depends on physicochemical characteristics such
as pH, available sulphides, alkalinity and redox state (Boto, 1988). These factors
are affected by the activity of microbes and larger organisms. The variation of GIP
ratio in core sediments may indicate the capacity of immobilization of phosphorus
in sediments.
164

Sediment Characteristics alld Nutriellt Status
Table 4.31 Station-wise summary statistics of C/P hi sediment cores
Station Oepth(cm) Min Max Mean SO %ofCV
0-2 42.00 64.55 55.34 7.76 14.03
2-4 42.88 76.83 57.81 12.70 21.97
Station 1 4-6 40.75 72.01 58.32 11.60 19.88
6-10 42.78 61.36 49.40 6.53 13.21
10-20 30.43 53.34 41.30 9.33 22.58
0-2 40.83 83.22 59.23 14.89 25.13
2-4 28.63 69.20 50.61 13.34 26.36
Station 2 4-6 34.57 72.48 52.95 15.63 29.51
6-10 35.98 60.69 50.72 9.26 18.26 .
10-20 40.79 66.69 48.96 9.43 19.25
0-2 38.73 57.42 46.32 6.19 13.37
2-4 36.02 77.09 51.15 17.23 33.68
Station 3 4-6 29.06 61.08 40.21 10.99 27.33
6-10 25.67 37.41 31.61 4.32 13.67
10-20 33.81 55.87 42.87 8.99 20.97
Table 4.31 summarises the variation of C/P ratios observed in core sediments
to a depth of 20cm. The minimum and maximum ratios observed were 25.67 (Station
3) and 83.22 (Station 2) respectively. Generally a sub-surface increase in C/P ratios
was observed at Station 1 and Station 3 (Figure 4.23a). Seasonal variations in C/P ratios are depicted in Figures 4.23b-d. Similar C/P ratios were recorded at Station 1
in all depths except at 2-4 cm depth, while remarkably higher C/P ratios recorded
during post-monsoon at Station 2 in surface sediment. However Station 3 recorded
maximum C/P ratios during pre-monsoon in surface sediments.
165
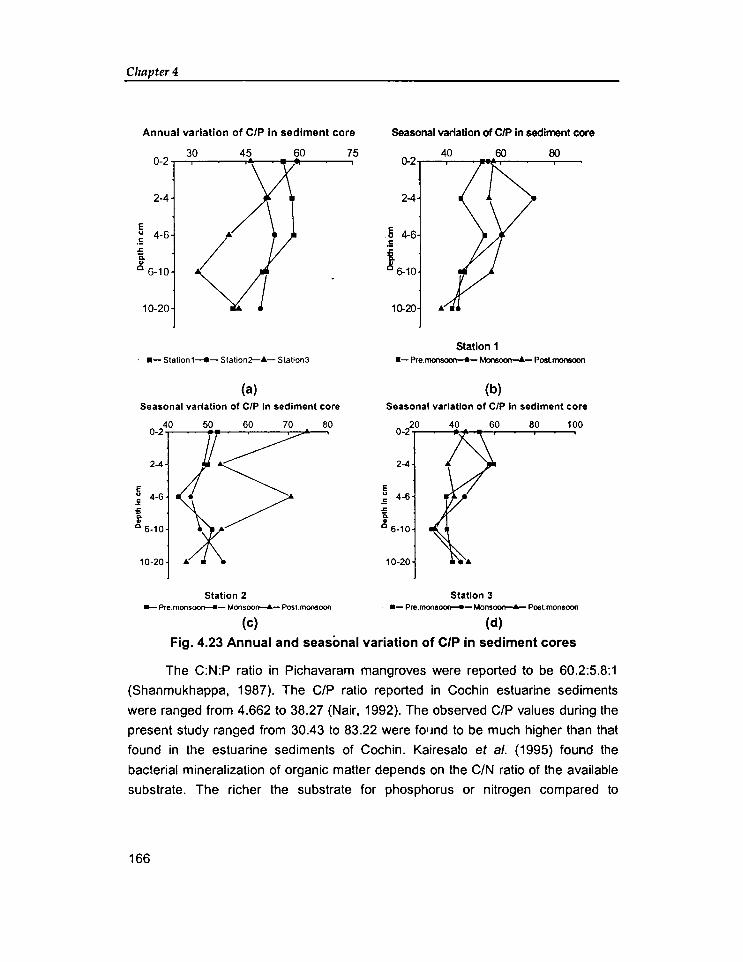
Cltapter4
Annual variation of C/P in sediment core Seasonal variation of CIP in sediment core
30 45 60 75 0-2 0-2
40 60 80
2-4 2-4
E § u 4-6 4-6 .!: .= .r.
15-10 a .. c 6-10
10-20 10-20
Station 1 .- Station 1_-Stationc--.a.- Station3 .-Pre.monsoon-e- Monsooo-.a.- Poslmonsoon
(a) (b) Seasonal variation of C/P In sediment core Seasonal variation of C/P In sediment core
40 50 60 70 80 0-2
y~ 24
E u 4-6 .5
.~ :; a. .. 06_10
10-20
20 80 100 0-2
24
E u 4-6 .5
t • 0 6_10
10-20
Station 2 Station :3 .-Pre.monsoon--e- Monsoort---A- POSI.monsoon . .-Pre.monsoon--e- Monsoon----6- Post.monsoon
(c) (d)
Fig. 4.23 Annual and seasonal variation of C/P in sediment cores
The C:N:P ratio in Pichavaram mangroves were reported to be 60.2:5.8:1
(Shanmukhappa, 1987). The C/P ratio reported in Cochin estuarine sediments
were ranged from 4.662 to 38.27 (Nair, 1992). The observed C/P values during the
present study ranged from 30.43 to 83.22 were fo'md to be much higher than that
found in the estuarine sediments of Cochin. Kairesalo et al. (1995) found the
bacterial mineralization of organic matter depends on the C/N ratio of the available
substrate. The richer the substrate for phosphorus or nitrogen compared to
166

Sediment Characteristics and Nutrient Stahls
bacterial biomass the more easily phosphorus or nitrogen released in the
mineralization. The C:N:P ratio of natural marine bacterial biomass was found as
45:9:1 (Gold man et al., 1987). Tezuka (1990) however stated that this ratio could
vary widely in natural assemblage of fresh water bacteria. However the studied
area observed to compose of substrate richer in phosphorus than marine bacterial
biomass. Comparatively higher C/P ratios found during the present study may be
attributed to fin increased bacterial phosphorus mineralization.
The depth profile of C/P ratio was similar during pre-monsoon and post
monsoon at Station 1. While at Station 2 and Station 3, monsoon and pre-monsoon
season showed a similar depth profile. However maximum C/P were associated
with post-mof"lsoon season at Station 1 and Station 2 except at 2- 4cm depth at
Station 1. The higher values observed during post-monsoon may be attributed to
maximum concentrations of TOC. The depths beyond 10cms, showed minimum
C/P ratios, associated with minimum concentrations of TOC in this layer. The high
organic carbon as well as relatively high C/P ratio observed in this system indicted
that a major portion of the phosphorus in sediment undergoes bacterial
mineralisation. Further more it was also established that mangrove leaf litter found
to harbor a large population: of bacteria that appear to be highly productive
(Robertson, 1988).
Table 4.32 Correlation matrix between depths - CIP
0-2 2-4 4-6 6-10 10-20
0-2 1.0000
2-4 0.9347*** 1.0000
4-6 -0.0115 0.0008 . 1.0000
6-10 -0.2219 0.0799 -0.3022 1.0000
10-20 -0.0310 0.0414 -0.2642 0.1060 1.0000
p<0.001
The C/P ratios were found, positively correlated between the depths 0-2cm and
2-4cm (p< 0.001) (Table 4.32). Correlation matrix between other parameters recorded
significant negative correlation of C/P ratios with % silt and % clay at 0-2 and 2-4 cm
depth p<0.05, p<0.01). Also C/P ratios exhibited positive relationship with TP
concentrations at 0-2,2-4 and 10-20 cm depth (p<0.001, p<0.01) (Table 4.18a, b, e).
167

CIlapter4
Three way ANOVA showed significant difference between Station, between
depth and between season (App.22). The LSD at 5% level for C/P ratios among
stations is 6.027. Station 1 and Station 2 showed significantly higher ratio than
observed at Station 3. No significant difference were found between the ratios
found at Station 1 and Station 2. The LSD at 5% level for ratios observed at
different depth is 7.78. Significantly higher value of C/P ratio were observed at
0-2cm, 2-4cm, 4-6cm depth than the other depths. No significant difference in elP ratios was observed during three seasons.
4.3 CONCLUSION
Textural studies based on Folk's classification, the nature of surface
sediment observe.d were sandy mud, sandy silt and muddy sand at Station 1 ,
Station 2 and Station 3 respectively. The well-developed mangroves at Station 1
and Station 2 support the root system of mangroves, which has a dense grid of
vertical pnuematophores and arial. roots. This structure traps floating detritus and
reduces tidal flow, eventually creating conditions where suspended clay and silt
particles settle, whereas the lack of vegetation as well as tidal influence and impact
of waves remove finer fractions (silt + clay) of the sediment. The mean moisture
percentages observed were higher at Station 1 and Station 2, while low
percentages were recorded at Station 3. The spatial and seasonal variation in
moisture content could be attributed to the variation of organic matter and grain
size of the sediment. Generally higher pH values were observed at Station 1 and
Station 2, while lower pH values were recorded at Station 3. Minimum pH values
were recorded during pre-monsoon or post-monsoon at all stations and maximum
values were recorded during monsoon season.
The concentrations of TOe in surface sediments of Station 1 and Station 2
were very high as that of Station 3. The prevalent hydrodynamics at Station 1 and
Station 2 and the presence of mangrove roots that are well developed, retained
fine fraction of surface sediment. The results indicate that Station 1 and Station 2
were composed of organic rich surface sediment. Generally minimum TOe
concentrations were recorded during pre-monsoon at all stations while maximum
were recorded during post-monsoon except at Station3. However Station 3
recorded similar TOe concentrations during all seasons. The present investigation
observed a seasonal variation of TOe concentrations that might be associated with
168

Sedi'JIent Characteristics a1ld Nutrie1lt Status
the variation in bacterial density. Pre-monsoon season associated with high
temperature as well as restricted flow of water through the creek flourish the growth
of bacteria and associated mineralisation resulted in lowering of organic carbon.
The statistical analysis exhibited a significant positive correlation of TOC
concentrations with percentage of clay, percentage of silt, percentage of moisture,
TN, TP and ammonium concentrations. Total nitrogen (TN) concentration in
surface sediments exhibited spatial and seasonal variations. The minimum
concentration recorded at Station 3 (O.97mgg-1) and maximum concentration was
recorded at Station 2 (4.90mgg-\ The seasonal variation of TN concentration
showed maximum concentrations during pre-monsoon and minimum
concentrations during monsoon at all stations. The TN concentrations varied
between O.97mg g-l (Station 3) and 4.90mg g-l (Station2). The seasonal variations
may be attributed to the variation in TOC concentrations as well as with the
adsorbed ammonium present in the sediment, since exchangeable ammonium
found to be positively correlated with TN concentrations. Similar to TOC and TN
concentrations, the concentrations of TP recorded were similar at Station 1 and
Station 2, were varied from 1.12mg g-l to 2.1 Omg g-l but those from Station 3 were
significantly lower, ranges from, 0.49mg g-l to O.80mg g-l. Remarkable spatial
variation with higher values at first two stations might be attributed to different
hydrodynamic regime play at these sites. Station 3 marked by the overbearing of
coarse fraction, which inhibits accumulation of phosphorus in sediments. The
maximum salinity at Station 2 may cause precipitation of dissolved phosphorus and
hence a maximum concentrations was recorded during pre-monsoon. The cycling
of phosphorus in the studied area is highly dynamic at least at first two stations,
where the sediments act as an efficient sink for phosphorus as far as an aerobic
environment prevailed.
The exchangeable ammonium concentrations in surface sediments varied
between O.08~mol g-l (Station 3) and O.84~mol g-l (Station 1 and Station 2). A
regular tidal incursion at Station 3 may remove ammonium from the soil as it is
soluble in water. Seasonal variations were found with comparatively higher values
during pre-monsoon and post monsoon at Station 1 and Station 2. The high
concentration of available ammonium was attributed to high early summer nitrogen
mineralization (Cartaxana et al., 1999). But at Station 3 the maximum was
observed during monsoon. The surface sediments characterised by very low
exchangeable nitrate concentrations, found" to varied from 3.29 nmolg-1 to
169

Chapter 4
64.31nmolg-'. Spatial variation of exchangeable nitrate may also be associated with
the oxygen availability in sediments. The higher concentrations at Station 2 may be
associated with an oxic environment at this site as the mangroves translocate
oxygen to their roots. While the minimum concentration observed at Station 1 and
Station 2, during post-monsoon may be due to the maximum uptake by plant for
their luxurious growth during post-monsoon. The maximum concentration at Station
3 during monsoon may be as a result of the high river runoff.
Although the C/N ratios varied between 16.57 and 35.32 at all stations,
Station 2, surface sediments exhibited a variation of 16.57 and 28.18, which
indicated an origin of mangrove detritus at this site. The high C/N ratios observed
at Station 1 and Station 3, during the present investigation may be attributed to the
accurlulated organic carbon at Station 1, and humic derived nitrogeneous organic
matter (biogenic origin) at Station 3. Relatively lower ratios observed at Station 2,
suggest a mangrove detrital origin, and were associated with the tight coupling
between microbial mineralization and assimilation in organic sediments of the
studied mangrove area.
The low N:P ratios were due to comparatively high concentration of total
phosphorus. N:P ratio can be taken as an index of the extent of extraneous
influence on a productive water body, since the nitrogen if produced is
autochthonous, variation in N:P depend on phosphorus which is mostly external
(Shanmukhappa, 1987). These ratios indicated an abiogenic origin of phosphorus
in the mangrove fringed creeks.
The C/P ratio varied between 34.68 (Station 2, monsoon) and 68.00 (Station
2, post-monsoon). The observed C/P ratio at the studied area reveal the
accumulated phosphorus load in creek waters could be reduced by the mangrove
plants and associated microorganisms. However to arrive at the cause of deviation
from Redfield stOichiometry in the present investigation warrants more information
on the kind of litter produced in this area, and also on the influence of microbes on
carbon, nitrogen and phosphorus dynamics in this particular ecosystem. However
outwelling of mangrove litter significantly influences sediment concentrations of
TOC, TN and stoichiometric ratios of C:N:P (Alongi, 1990).
The grain size analysis of core sediments recorded Similar observation as
that of surface grain size analysis at all stations except in 4-6 cm layer at Station 1
and in 10-20 cm layer at Station 2. The major tE.xtural facies in sediment core at
170

Sedimellt Characteristics and Nutrient Statlls
Station 1 was sandy mud with a mud layer at 4-6 cm interval. However sediment
core at Station 2 predominantly composed of sandy mud sediment with an
intercalation of 10 cm thick muddy sand was recorded at a depth of about 10cm
from the surface. According to Flach and Heip (1996), a homogeneous distribution
pattern of grain size in the vertical column of sediment suggests a constant mixture
by bioturbation effects.
The moisture percentage in sediment cores varied between 29.40% (Station
3) and 61.76% (Station 2). Generally moisture percentage decreases down the
core at all stations. The moisture percentage showed a significant positive
correlation with organic carbon. The annual mean values of moisture showed
identical percentage at Station 1 and Station 2 due to the similar textural attributes
at these stations, while less moisture percentage were recorded at Station 3, due
to predominant muddy sand nature of the sediment. Seasonal variation in pH
values in core sediments recorded the maximum values during monsoon while
minimum were recorded during pre-monsoon at Station 1 and 2. However a
remarkable decrease was noticed beyond 10cm depth at the same Station. All
other stations, showed a down core increase in pH values during all three seasons.
The three mangrove locations showed pH values as that of an alkaline nature of
sediment up to 20cms of depth with certain exceptions during pre-monsoon at
Station 1 and Station 3. The annual variation of pH values in core sediments
showed a general increase down the core at all stations indicated an alkaline
condition in sediment till 20cms of depth.
Toe concentration in the sediment cores varied between as low as 10.62mg
g.1 at Station 3 and as high as 140.23mg g-1 at Station 1. Significantly higher values
(LSD, 7.5 mg g-1) TOe concentrations were observed at Station 1 and Station 2.
The very low concentration of carbon at Station 3 compared to other two sites may
be due to the variability of sediment texture along with non-availibility of litter. The
depths, 0-2, 2-4, and 4-6, layers showed higher concentrations (LSD, 0.96 mg g-1)
of TOe as compared to 6-10 and 10-20 layers. Significantly higher value of TOe
concentrations (LSD, 7 mg g-1) was recorded during post monsoon followed by
monsoon and pre monsoon seasons.
The TN concentrations varied between O.44mg g-1 (Station 3) and 5.84mg g-1
(Station 2). Three-way ANOVA analysis showed a significant difference of TN
between stations, between depths and between seasons. Among the stations,
171

Clrapter4
Station 2 showed significantly higher (LSD, 0.31 mgg-1) value of TN followed by
Station 1, which in turn had significantly higher concentration than Station 3. The
LSD at 5% level for depth is 0.405mg g-l. The layers 0-2cm and 2-4 cm showed
significantly higher TN concentrations than the other depth ranges. TN
concentrations followed a decreasing order in the layers 4-6, 6-10 and 10-20 cm. TN
correlated positively with TOC and negatively with sediment C/N ratio at 0-2 and
2-4cm depth (p<0.01, p<0.05). This indicated the decrease in C:N ratio was mainly
due to the increase organic nitrogen in the sediment. It is possible that the increase
in TN and thus decrease in C/N ratio in the sediment partly to the increase of
chlorophyll-containing labile materials (Cheng and Chang, 1999).
Significantly higher concentration (LSD, 0.314mg g-1) of nitrogen was
observed during pre-monsoon followed by post monsoon and monsoon.
Exchangeable nitrate concentrations were varied significantly among
stations but not with depth or season. The highest concentration (LSD, 11.40
nmolg·1) of exchangeable nitrate recorded at Station 2 associated with the luxuriant
growth of plants at this Station.
The exchangeable ammonium concentrations varied between 0.07~molg-1 (Station 3) and 1.03~molg-l (Station 1). Significant difference of exchangeable
ammonium concentration observed between station, and between season but not
between depth. The LSD at 5% level for station and season is 0.122 ~molg-1.
Significantly higher concentration of exchangeable ammonium was recorded at
Station 1 and Station 2 while Station 3 recorded comparatively low concentration of
exchangeable ammonium. Significantly higher value of exchangeable ammonium
was observed during pre-monsoon followed by monsoon and post monsoon.
Significantly low concentration was registered during post-monsoon Although no
significant difference between depths exist, an increase down the core observed at
Station 1 and Station 2, during certain instances. The ammonium concentrations
were found to increase with depth in the anaerobic soil, indicating denitrification
beyond rhizopheres. Correlation of exchangeable ammonium and other parameters
showed a positive relationship with percentage of clay, total nitrogen, in 0-2, 2-4, 4-6
and 6-10 and 10-20 cm depth. AlsO at 2-4 cm depth this is correlated with total iron
and at 4-6 cm positive relationship showed with exchangeable nitrate.
TP concentrations were found to vary between 296.70 ~gg-1 (Station 3.
10-20cm) and 2190.84~gg-1 (Station 1. 10-20cm). Significantly higher concentration
172

Sediment Characteristics a"d Nutriellt Status
(LSD, 144~gg-l) of TP was observed at Station.1 and Station 2 than at Station 3. The
spatial variation in distribution of TP is explained by the sediment grain size,
presence or absence of macrophytes\ phytoplankton, bacterial assemblages etc.
Although significant difference does not exist among different depths, 0-2cm and 2-4
cm layers exhibited higher TP concentrations than the other depths. In mangrove
area (Fly Delta, Papua New Guinea) total phosphorus concentration are high in
surface sediments, suggesting oxidation near or at the sediment-water interface.
Significantly higher concentrations of TP were observed during post-monsoon
followed by monsoon and pre monsoon. The oxidative reactions would immobilize
phosphorus and limit its availability to autotrophs and microheterotrophs, with
phosphorus being bound to iron minerals.
The minimum and maximum GIN ratio observed were 10.48 (Station 3) and
56.62 (Station 3) respectively. Three way ANOVA showed significant difference
between station, depth and season. The LSD at 5% level for station is 1.69. Station
1 and Station 3 have significantly higher (LSD,1.69) value of GIN ratio than Station
2. Most of the ratios were larger than 14 which suggest that the detritus in the study
site might composed mainly of flora debris found in mangrove wet lands. The LSD
at 5% level for depth is The .10-20 cm depth showed a significantly higher ratio
(LSD, 2.18) than all other depths. Between 'other depths there is no significant
difference. Significantly higher value (LSD, 1.69) of GIN was observed during
monsoon season followed by post monsoon and pre monsoon. This indicated that
besides mangroves and associated biota continuously add detritus to the
mangrove ecosystem, terrigenous organic matter brought in by fresh water
discharge also vary the stoichiometric ratios at this site.
The NIP ratios recorded in core sedimentd varied between 0.82 (Station 3)
and 4.47 (Station 1) respectively. Three way ANOVA showed significant difference
between Station, between depth and between season. The core sediments at Station
1 and Station 2 showed significantly higher ratio (LSD,O.34) than observed at Station
3. No significant differences were found between the ratios found at Station 1 and
Station 2. Significantly higher value of NIP ratio (LSD, 0.44) were observed at 0-2cm,
2-4cm, 4-6cm depth than the other depths. During pre-monsoon season, significantly
higher NIP ratios (LSD, 0.34) were noticed in sediment cores. The recorded values
found in here were far below the NIP ratios for natural or cultureu plankton, nence
suggest the abiogenic nature of phosphorus.
173
Clrapter4
Distrtibution of C/P ratios in sediment cores suggest a bacterial phosphorus
mineralization, found to varied from 25.67 (Station 3) and 83.22 (Station 2). Station
1 and Station 2 showed significantly higher ratio (LSD, 6.027) than observed at
Station 3. No significant differences were found between the ratios at Station 1 and
Station 2. Significantly higher value (LSD, 7.78) of C/P ratio were observed at
0-2cm, 2-4cm, 4-6cm depth than the other depths. No significant difference in C/P
ratios was observed during three seasons. It W3S also suggested by Alongi (1989)
that bacteria and benthic microalgae in mangrove sediments are sinks of nutrients
because the system is characterised by a closed internal cycling - death, decay
uptake and growth - and thus serve as a mechanism for nutrient conservation.
Phosphorus is an abundant trace elemellt and one of the most important
nutrients. In a mangrove ecosystem the above ground biomass was significantly
correlated with the soil exchangeable phosphorus (Boto and Wellington, 1983).
These plants may remove a significant amount of phosphates from soil. Laborotary
experiment on release of phosphates (P04-P) under anaerobic conditions, two
Lake sediments behaved released differently. It is suggested that these differences
are due to different amounts of organic matter in the sediment utilizable by the
appropriate bacteria. It is further suggested that this is due to the greater degree of
mineralization of detrital organic matter in one of the lake resulting in a lesser
amount of utilizable organic matter. Tracer studies with 32 P showed very high
fluxes, especially under anaerobic conditions. On an annual basis these varied
from 50% to four orders of magnitude higher than the external loads of phosphorus
to these Lakes (Rosich and Cullen, 1982).
It was also suggested that a large proportion of sediment nutrient is derived
from mangrove detritus when the sediment depleted only in phosphorus but not
with carbon and nitrogen.
174

Sedime1lt Characteristics alld Nutrie1lt Status
REFERENCES
Aller, R.C. 1994 The sedimentary Mn cycle in long island sound: its role as
intermediate oxidant and the influence of bioturbation, O2 and Corg flux on
diagenetic reaction of balances. Journal of Marine Research 52, 259-295.
Alongi, D.M. 1987 Intertidal zonation and seasonality of meiobenthos in tropical
mangrove estuaries. Marine Biology 95,447-458.
Alongi, D.M. 1988 Bacterial productivity and microbial biomass in tropical
mangrove sediments. Microbial Ecology 15,59-79.
*Alongi, D.M. 1989 The fate of bacterial biomess and production in marine benthic
food chain. In Recent advances in microbial ecology (Hattori, T., Ishida, Y.,
Maruyama, Y., Monta, R.Y. & Achida, A., eds). Japan Science Society
Press, Tokyo, pp. 355-359.
Alongi, D.M. 1990 Effect of mangroves detrital outwelling on nutrient regeneration
and oxygen fluxes in coastal sediments of the central great barrier reef
lagoon. Estuarine, Coastal and Shelf Science 31,581-598.
Alongi, D.M. 1991 The role of intertidal mudbanks in the diagenesis and export of
dissolved and particulate material from the Fly Delta, Papua New Guinea.
Journal of Experimental Marine Biology and Ecology 149,81-107.
Alongi, D.M. 1994 The role of bacteria in nutrient recycling in tropical mangrove
and other coastal benthic ecosystems. Hydrobiologia 285, 19-32.
Alongi, D.M. 1996 The dynamic of benthic nutrient pools and fluxes in tropical
mangrove forest. Journal of Marine Research 54, 123-148.
Alongi, D.M. & Christoffersen, 1992 Benthic infauna and organism sediment relations
in a shallow, tropical coastal area: influence of outwelled mangrove detritus
and physical disturbance. Marine Ecology Progress Series 81, 229-245.
Alongi, D.M., Boto, K.G. & Robertson, A.I., 1992 Nitrogen and Phosphorus cycles.
In Tropical Mangrove Ecosystems - Coastal and Estuarine Series 41
(Robertson, A.1. and Alongi, D.M., eds). American Geophysical Union,
Washington, pp. 251-292
175

Chapter 4
Alongi, D.M., Christoffersen, P. & Tirendi, F.1993 The influence of forest type on
microbial nutrient relationships in tropical mangrove sediments. Journal of
Experimental Marine Biology and Ecology 171,201-223.
Alongi, D.M., Tirendi, F. & Clough, B.F. 2000 Below ground decomposition of
organic matter in forests of the mangrove Rhizophora stylosa and Avicennia
marina along the arid coast of western Australia. Aquatic Botany 68,97-122.
Alongi, D.M. Sasekumar, A., Tirendi, F. & Dixon, P. 1998 The influence of
stand age on benthic decomposition and recycling of organic matter in
managed mangrove forests of Malaysia. Journal of Experimental Marine
Biology and Ecology 225, 193-217.
Alongi, D.M., Tirendi, F., Deixon., Trott, L.A., Brunskill, G.J. 1999 Mineralization of
organic matter in intertidal sediments of a tropical semi-enclosed delta.
Estuarine, Coastal and Shelf Science 48,451-467.
Alongi, D.M., Ayukai, T., Brunskill, G.J., Clough, B.F. and Wolanski, E. 1998
Sources, sinks, and export of organic carbon through a tropical, semi
enclosed delta (Hinchinbrook channel, Australia). Mangroves and Salt
Marshes 2, 237-242.
Andersen, F.O., Kristensen, E. 1988 Oxygen microgradients in the rhizosphere of
the mangrove avicennia marina (Forsk) Vierh. Marine Ecology Progress
Series 44,201-204.
Anderson, F.O. & Jenson, H.S. 1992 Regeneration of inorganic phosphorus and
nitrogen from seston in a fresh water sediment, Hydrobiologia 228, 71-81.
Badarudeen, A., 1997 Sedimentology and geochemistry of some selected
mangrove ecosystems of Kerala, south west coast of India. Ph.D.
dissertation, Cochin University of Science and Technology, Cochin-16.
Badarudeen, A. Padmalal, D. & Sajan, K., 1998 Hydrodynamic responses on
mangrove sediments of Kannur region, southwest coast of India. Indian
Journal of Marine Sciences 27, 262-265.
*Baiiey, G.W. 1968 Role of soils and sediment in water pollution control - Part 1:
176
Reactions of I/ilrogen and phosphorus compounds with soils and geological
strata , U. S. Department of the interior , Federal Water Pollution Control
Administration, South East Water Laboratory, 90-100.

Sediment Characteristics alld Nutrient Status
Barrow, N.J., Bolland, M.D.A. & Alien, D.J. 1980 Describing the effect of
electrolytes on adsorption of phosphate by a variable charge surface.
Australian Journal of Soil Research 18, 395-404.
Benner, R & Hodson, RE. 1985 Microbial degradation of the leachable and
lignocellulosic components of leaves and wood from rhizophora mangle in a
tropical mangrove swamp. Marine Ecology Progress Series 23,221-230.
Binnerup, S.J., Jensen, K., Revsbech, N.P., Jensen, M.H. & Sorrensen. J. 1992
Denitrification dissimilatory reduction of nitrate to ammonium and nitrification
in a bioturbated estuarine sediment as measured with 15N and microsensor
techniques. Applied and Environmental Microbiology 58,303-313.
Blackburn, T.H., Lund, BA & Krom, M.D. 1988 C- and N- mineralisation in
sediments of earthen marine fishponds. Marine Ecology progress series 44,
221-227.
Bonani, P., Caprioli, R, Ghiara, E., Mignuzzi, C., Orlandi, C., Paganin, G. & Monti,
A. 1992 Sediment interstitial water chemistry of the Orbetello lagoon
(Grosseto, Italy); nutrient diffusion across the water -sediment interface,
Hydrobiologia, 235,553 ..
Bostrom, B., Andersen, J.M., Fleischer, S., Jansson, M. 1988 Exchange of
phosphorus across the sediment water interface. Hydrobiologia 170, 229-244.
Boto, K.G. 1982 Nutrient and organic fluxes in mangroves. In Mangrove
cosystems in Australia (Clough, B.F. ed). Australian National University
Press, Canberra, pp. 239-257.
Boto, K.G. 1984 Water logged saline soils. In The Mangrove Ecosystems:
Research Methods (Snedaker, S.C. & Snedaker, J.G., eds). UNESCO,
Paris, pp. 114-130.
Boto, K.G. 1988 The phosphorus cycle. In Mangrove Microbiology (Agate, A.D.,
Subramanian, C.v., & Vanucci, M., eds). UNDEP/UNESCO regional project
(RAS/86/1988J, New Delhi, pp. 85-100.
Boto, K.G. 1992 Nutrients and mangroves. In Pollution in Tropical Aquatic Systems
(Connel, D.W. & Hawker, D.'N., ::::!s). CRC r'~ess, Boca Raton, pp. 129-145.
177

Chapter 4
Boto, KG. & Wellington, J.T. 1983 Phosphorus and nitrogen nutritional status of a
northem Australian mangrove forest. Marine Ecology Progress Series 11, 63-69.
Boto, KG. & Wellington, J.T. 1984 Soil characteristics and nutrient status in a
northern Australian mangrove forest. Estuaries 7, 61-69.
Boyd, C.E. 1992 Shrimp pond bottom soil and sediment management. In
Proceedings Special session on Shrimp farming (Wyban ed.). World
aquaculture society, Baton Rouge, LA, pp 166-181.
Canfield, D.E. 1993 organic matter oxidation in marine sediments. In Interactions of
C,N,P and S in biogeochemical cycles and global change (Wollaswt, R.,
Mackensie, F.T. & Chou, L., eds). Springer-Verlag, Berlin, pp. 333-363.
Cartaxana, P., Cacador, I., Vale, C., Falcao, M. & Catarino, F. 1999 Seasonal
variation of inorganic nitrogen and net mineralization in a salt marsh
ecosystem. Mangroves and salt marshes 3,127-134.
Cheng, I. J. & Chang, P.C. 1999 The relation between surface macrofauna and
sediment nutrients in a mudflat of the Chuwei mangrove forest, Taiwan.
Bulletin of Marine Sciences 65, 603-616.
Clarke, P.J. 1985 Nitrogen pools ~nd soil characteristics of a temperate estuarine
wetland in eastern Australia. Aquatic Botany 23, 275-290.
Clough, B.F., Boto, KG. & Attiwill, P.M. 1983 Mangrove and sewage: a re
evaluation. In Tasks for vegetation science (Teas, H.J., ed). Dr. W. Junk
Publishers, The Hague, 17, 151-161.
Conley, D.J. 2000 Biogeochemical nutrient cycles and nutrient management
strategies. Hydrobiologia 410,87-96.
Day, J.W., Day, R.H., Barriero, M.T., Ley-Lon, F. & Madden, C.J. 1982 Primary
production in the Laguna de Terminos, a tropical estuary in the southern
Gulf of Mexico. Oceanologica Acta, 5 (suppl), 269-272.
*De Laune, R.D. & Patric Jr. W.H. 1980 Nitrogen and phosphorus cycling in a gulf
coast salt marsh. Proceedings of International Estuarine Research
Federation Conference, Jeckyl Island, GA,
178

Sediment Characteristics and Nutrient Status
Degrens, E.T. 1970 Molecular nature of nitrogenous compounds in sea water
recent marine sediments. In Organic matter in natural waters (Hood, D.W.
ed). Univ Alaska, pp. 59-103
Deinema, M.H., Van Loosdrecht, M. & Scholten, A. 1985 Some physiological
characteristics of Acinetobactor spp. Accumulating large amount of
phosphate. Water Science and Technology 17, 119-125.
Demaison, G.J. 1991 Anoxia vs. productivity: what controls the formation of
organic-carbon-rich sediments of and sedimentary rocks? Bulletin of
American Association of Petrology and Geology 75,499-510.
Dinesh, R, Shome, B.R., Rajeshwari Shome & Bandyopadhay, A.K. 1998 Soil
enzymes in mangroves: Activities and their relation to relevant soil
properties. Current Science 75,511-512.
Fenchel, T. & Blackburn, T. H. 1979 Bacteria and mineral cycling. Academic press,
London, pp. 225.
Flach, E., & Heip C. 1996 Vertical distribution of macrozoobenthos within the
sediments on the continental slope of the Cogan Spur area (NE Atlantic).
Marine Ecology Progress Series 141. 55-66.
*Foehrenbach, 1973 Eutrophication. Journal of Water Pollution Control Federation
45,1237 -1240.
*Folk, RL. 1974 Petrology of sedimentary rocks, Hemphill Publishing company,
Austin, Tex, pp.182.
Gachter, R, Meyer, J.S. & Mares, A. 1988 Contribution of bacteria to release and
fixation of phosphorus in lake sediments. Limnology and Oceanography 33,
1542-1558.
Gachter, RJ., & Meyer, J.S., 1993. The role of microorganisms in mobilization and
fixation of phosphorus in sediments. Hydrobiologia 253, 103-121.
Gill, A.M. & Tomlinson, P.B. 1977 Studie~ on the growth of red mangrove
(Rhizophora mangle L.,) The adult root system. Biotropica 9,145-155.
Goldman; .I.C., Caron, n A Po. Dennpt . M.R. 1987 Regeneration of gross growth
efficiency and ammonium regeneration in bacteria by subtrate C:N ratio.
Limnology and Oceanography 32,1239-1252.
179

Chapter 4
Golterman, H.L. 1998 The distribution of phosphate over iron-bound and calcium
bound phosphate in stratified sediments. Hydrobiologia 364, 75-81.
Gonzalez, F. & Mee, L.D. 1988 Effect of mangrove humic-like substances on
biodegradation rate of detritus. Journal of Experimental Marine Biology and
Ecology 199,1-13.
Haines, E.B., Chalmers, A., Hanson, R. & Sherr, B. 1977 Nitrogen pools and f1uxes
on a Georgia salt marsh, In Estuarine processes (Wiley, M., ed) vol 2,
Academic Press, N.Y., 241-254.
Hesse, P.R. 1962 Phosporus fixation in mangrove swamp muds. Nature 193, 295-296
Holmer, M. & Olsen, A.B. 2002 Role of decomposition of mangrove and seagrass
detritus in sediment carbon and nitrogen cycling in a tropical mangrove
forest. Marine Ecology Progress Series 230 , 87-101.
Jagtap T.G. 1987 Seasonal distribution of organic matter in mangrove environment
of Goa. Indian Journal of Marine Sciences 16, 103-106.
Jenkins, M.C. & Kemp, W.M. 1984 The coupling of nitrification and denitrification in
two estuarine sediments. Limnology and Oceanography 29, 609-619.
*Jickells, T.D. & Rae, J.E. (eds) 1997 Biogeochemistry of intertidal sediments.
Cambridge University Press, Cambridge, pp. 193.
Kairesalo, T., Tuominen, T., Harikainen, K. & Rankinen, K. 1995 The role of
bacteria in the nutrient exchange between sediment and water in a flow
through system. Microbial ecology 29, 1219-144.
Kathiresan, K., Rajendran, N. & Thangadurai, 1996 Growth of mangrove seedlings
in intertidal area of Vellar estuary southeast coast of India. Indian Journal of
Marine Sciences 25, 240-243.
Klump, J.v. & Martens, C.S. 1989 The seasonality of nutrient regeneration in an
organic rich coastal sediment: Kinetic modeling of changing pore water
nutrient and sulphate distribution. Limnology and Oceanography 34, 559-
577.
*Kristensen, E. 1988. Benthic fau~::: ~nd biogeochemical processes in marine
sediments: microbial activities and f1uxes. In Nitrogen cycling in coastal
180

Sediment Cluiracteristics and Nutrient Status
marine sediments (Blackburn, T.H. & Sorrensen, J., eds). John Wiley,
Chichester, pp. 275-299.
Kristensen, E. 1990 Characterization of biogenic organic matter by stepwise
thermograveimetry (STG). Biogeochemistry 9, 135-159.
Kristensen, E. 1993 Seasonal variation in benthic community metabolism and
nitrogen dynamics in a shallow, organic poor Danish lagoon. Estuarine,
Coastal and Shelf Science 36,565-586.
Kristensen, E. 1997 Carbon, Sulphur and Nitrogen Biogeochemistry of Tropical
Mangrove sediments. In Coastal Zone Management Imperative for Maritime
Developing Nations (Haq, B.U. et al., eds). Kluwer Academic Publishers pp
199-232.
Kristensen, E. & Pilgaard, R. 1999 The role of faecal pellet deposition by leaf
eating sesarmid crabs on litter decomposition in a mangrove sediment
(Phuket, Thailand). In Organism-sediment relations (Aller, J.Y. & Aller, R.C.,
eds). University of South Carolina Press.
Kristensen, E., Anderson, F.O. & Kofoed, l.H. 1988 Preliminary assessment of
benthic community metabolism in a South-East Asian mangrove swamp.
Marine Ecology Progress Series 48,137-145.
Kristensen, E., Holmer, M., & Bussarawit, 1991 Benthic metabolism and sulphate
reduction in a southeast Asian mangrove swamp. Marine Ecology Progress
Series 73, 93-103.
Kristensen, E., Devol, AH., Ahemad, S.I., & Saleem, M. 1992 Preliminary study on
benthic metabolism and sulphate reduction in a mangrove swamp of Indus
delta, Pakistan. Marine Ecology Progress Series 90, 287-297.
Kristensen, E., Anderson, F., Holmboe, N., Holmer, M. & Thongtham, N. 2000
Carbon and nitrogen mineralisation in sediments of the bangrong mangrove
area, Phuket, Thailand. Aquatic Microbial Ecology 22, 199-213.
Kristensen, E., Jensen. M.H., Banta, G. T., Hansen, K., Holmer, M. & King, G.M.
1998 Aspects of nitrogen cycling in sediments of a south east Asian
m::mgrover fore:;! F~~;;atic Mfc.-cbiaf Ecology 15,165-175.
181

Chapter 4
Lancelot, C. & Billen, G. 1985 Carbon-Nitrogen relationships in nutrient metabolism
of coastal marine ecosystems. Advances in aquatic microbiology 3,263-321.
Lee, K.H., Moran, MA, Benner, R & Hodson, RE., 1990 Influence of soluble
components of red mangrove (Rhizophora mangle) leaves on microbial
decomposition of structural (lignocellulosic) leaf components in sea water.
Bulletin of Marine Science 46,374-386.
Li, M.S. 1997 Nutrient dynamics of a Futian Mangrove Forest in Shenzhen, South
China. Estuarine coastal and Shelf Science 45,463-472.
*Limpsaichol, P. 1978 Reduction and oxidation properties of the mangrove
sedir.1ent, Phuket island, Southern Thailand. Phuket. Marine Biological
Genter Research Bulletin, No. 23, 13 pp
Lindau, C.W. & DeLaune, RD. 1991 Dinitrogen and nitrous oxide emission and
entrapment in Spartina altemiflora saltmarsh soils following addition N-15 labelled
ammonium and nitrate. Estuarine, Coastal and Shelf Science 32,161-172.
Liu, S-M., Kou, C-E & Hsu, T-B. 1996 Reductive dechlorination of cholorphenols
and pentachlorophen~1 in anoxic estuarine sediment. Ghemosphere 32,
1287-1300.
Lopez, G.R & Levinton, J.S. 1987 Ecology of deposit feeding animals in marine
sediments. Quart. Rev. BioI. 62, 235-260.
Morsel, J.M. & Corredor, J.E. 1993 Sediment nitrogen trapping in mangrove
logoon. Estuaries 37,203-21.
Mortimer, C.H. 1971 Chemical exchanges between sediments and water in the
Great Lakes - speculations on probable regulatory mechanisms. Limnology
and Oceanography 16,387-404.
Nair, P.V.R, Joseph, K.J., Balchand, V.K. & Pillai, V.K. 1975 A study on the
primary production in the Vembanad lake. Bulletin of Department of Marine
Sciences, University of Gochin 7, 161-170.
Nair, V. 1992 Biogeoorganic in the sedimentary environment of Cochin estuary, a
dissertation submitted to Cochin University of Science and Technology,
School of Marine Sciences, Cochin 682018.
182

Sediment Cllaracteristics and Nutrient Status
Nedwell, D.B. 1975 Inorganic nitrogen metabolism in a eutrophicated tropical
mangrove estuary. Water Research 9,221-231.
Nedwell, D.B., Blackburn, T.H., Wiebe, W.J. 1994 Dynamic nature of the turnover
of the organic carbon, nitrogen and sulphur in the sediments of a Jamaican
mangrove forest. Marine Ecology Progress Series 110, 223-231.
Nixon, S.W., Furnas, B.N., Lee, V., Marshall, M., Ong, J.-E., Wong, C.-H., Gong,
W.K. & Sasekumar, A. 1984 The role of mangrove in the carbon and nutrient
dynamic of Malaysia estuaries. Proceedings of Asian Symposium on
Mangrove Environment Research and Management pp. 534-544.
Odum, W.E., & Heald, E.J. 1975 The detritus-based food web of an estuarine
mangrove community. In Estuarine Research (Cronin, L.E., ed) Academic
Press Inc., New York. pp. 265-286.
*Palaniselvam, V. 1998 Epiphytic cyanobacteria of mangrove: ecological,
physiological and biochemical studies and their utility as biofertilizer and
shrimp feed. Ph.D. Thesis, Annamalai University, Parangipettai, India: 141pp
*Paludan, C. & Morris, J.T. 1999 Distribution and speciation of phosphorus along a
salinity gradient in intertidal marsh sediments. Biogeochemistry 45, 197-221.
Patric & Mikkelsen, 1971 Plant nutrient in flooded soil. In Fertilizer Technology and
Use (Olson, R.A., ed). 2nd edition. Soil Science Society of America Inc.
Madison,Wisconsin,USA. pp 187-215.
*Pedersen, T.F. & Calvert, S.E. 1990 Anoxia vs. iJroductivity: What controls the
formation of organic-carbon-rich sediments and sedimentary rocks? Reply.
Bulletin of American Association of Petrology and Geology 75, 500-501.
Pedersen, A.G.U., Bernstsen, J., Lomstein, B.A.A. 1999 The effect of eelgrass
decomposition on sediment carbon and nitrogen cycling: a controlled
laboratory experiment. Limnology and Oceanography 44, 1978-1992.
*Ponnamperuma, F.N. 1972 The chemistry of submerged soils. Advances in
Agronomy 24, 29-96.
Rajendran, N., Kathiresan, K. 1999 Seasonal occurrence of juvenile prawn and
environmental factors in a Rhizophora mangal, southeast coast of India.
Hydrobiologia 394, 193-200.
183

Chapter 4
Ram A., Zingde., M.D. 2000 Interstitial water chemistry and nutrient fluxes from
tropical intertidal sediment Indian Joumal of Marine Sciences 29,310-318.
*Ravikumar, S. 1995 Nitrogen fixing azotobactors from the mangrove habitat and
their utilityas biofertilizers. Ph.D. Thesis, Annamalai University,
Parangipettai, India: 102pp.
Remani, K.N., Venugopal, P., SaralaDevi, K., Lalitha, S. & Unnithan, RV. 1980
Sediments of Cochin backwaters in relation to pollution. Indian Joumal of
Marine Sciences 9, 111-113.
Rice, D.L. 1982 The detritus nitrogen problem: new observationa and perspectives
from organic geochemistry. Marine Ecology Progress Series 9,153-162.
Rice, D.L. & Hanson, RB. 1984 A kinetic model for detritus nitrogen : role of the
associated bacteria in nitrogen accumulation. Bulletin of Marine Science 35,
326-340.
Rice, D.L. & Tenore, RB. 1981 Dynamics of carbon and nitrogen during the
decomposition of detritus derived from estuarine macrophytes. Estuarine
Coastal and Shelf Science 13, 68-70.
Rivera- Monroy, V.H., Day, J.W., Twilley, RR, Vera-Herrera, F. & Cornado-Molina,
C. 1995 Flux of nitrogen and sediment in a fringe mangrove forest in Terminos
Lagoon, Mexico. Estuarine Coastal and Shelf Science 40. 139-160.
Rivera- Monroy, V.H., Twilley, RR 1996 The relative role of denitrification and
immobilization in the fate of inorganic nitrogen in mangrove sediments
(Terminos Lagoon, Mexico). Limnology and Oceanography 41 , 284-296 . .
Robertson, A.I 1988 Decomposition of mangrove leaf litter in tropical Australia
Joumal of Experimental Marine Biology and Ecology 116, 235-247.
Robertson, A.1. & Phillips, M.J. 1995 Mangroves as filters of shrimp pond effluent:
predictions and biogeochemical research needs. Hydrobiologia 295,311-321.
Rosich, RS. & Cullen, P. 1982 Interaction of P,N and C at the sediment water
interface In Cycling of C,N,S and P. In Terrestrial and Aquatic Ecosystems
(Freney, J.F. & Galbally, eds). Springer - Verlag, Berlin, Heidelberg NY.
*Saenger, P., Hegerl, E.G. & Davie, J.D.S. 1983 Global status of mangrove
ecosystems. The Environmentalist 3, 1-88.
184

Sedimellt Characteristics alld Nutrient Status
Sakaranarayanan, V.N. & Panampunnayil, S.U. 1979 Indian Journal of Marine
Science 8 27-35.
*Shaiful, AAA., Abdul Manan, D.M. Ramli, M. R. & Veerasamy, R. 1986
Ammonification and nitrification in wet mangrove soils. Malay Journal of
Science 8,47-56.
Shanmukhappa, H. 1987 Organic matter and C,N,P in sediments of Porto Novo.
Proceedings of National Seminar on Estuarine Management, 1987,
Trivandrum, pp. 128-133.
Sheridan, R.P. 1991 Epicalous, nitrogen-fixing microepiphytes in a tropical mangal
community, Guadeloupe, French W.1. Biotropica 23, 530-541.
*Sinke, A.J.C., Cappenburg, T.E. 1988 Influence of baderial processes on the
phosphorus release from sediments in the eutrophic Loosdrecht Lakes, The
Netherlands. Arch Hydrobiol Beih Ergebn Limnol 30, 5-13.
Smith Ill, T.J., Boto, K.G., Frusher, S.D. & Giddins, R.L. 1991 Keystone species
and mangrove forest dynamics: the influence of burrowing by crabs on soil
nutrient status and forest productivity. Estuarine, Coastal and Shelf Science
33, 419-432.
Smith, P.T. 1996 Physical and chemical characteristics of sediments from prawn
farms and mangrove habitat on the Clarence River, Australia. Aquaculture
146,47-83.
Sommers, L.E., Harris, R.F., William£, J.D.H., Armstrong, D.E. & Syers, J.K. 1972
Fractionation of organic phosphorus in lake sediments. Soil Science society
of America Proceedings 36, 51-54.
Soto-Jimmenez, M.F., Paez-Osuna, F. 200j Distribution and normalization of
heavy metal concentrations in mangrove and lagoonal sediments from
Mazatlan harbor (SE Gulf of California. Estuarine, Coastal and Shelf Science
53,259-274.
Stienke, T.D., Holland, A.J., Singh, Y. 1993 Leaching losses during decomposition
of mangrove leaf litter. South African Journal of Botany 59, 21-25.
185

Chapter 4
Sundareshwar, P.V. & Morris, J.T. 1999 Phosphorus sorption characteristics of
intertidal marsh sediments along an estuarine salinity gradient. Limnology
and oceanography 44, 1693-1701.
Sunil Kumar, R 1996 Distribution of organic carbon in the sediments of Cochin
mangroves, south west coast of India. Indian Journal of Marine Science 25,
274 - 276.
Sutcliffe, D.W. & Jones, J.G. 1992 Eutrophication : research and application to
water supply. Freshwater Biology Association 2,231-240.
Tenore, K.R, Hanson, RB., MC.Claim, J., Maccubbin, A.E. & HodsOll, RE. 1984
Changes in composition and nutritional value to a benthic deposit feeder of
decomposing detritus pools .• Bulletin of Marine Sciences 35,299-311.
Tezuka, Y. 1990 Bacterial regeneration of ammonium and phosphate as affected
by the carbon:nitrogen:phosphorus ratio of organic substrates. Microbial
Ecology 19,227-238.
Tuominen, L., Karesalo, T., Hartikainen, H. & ToUberg, P. 1996 Nutrient fluxes and microbial
activity in sediment enriched with settled seston. Hydrobi%gia 335, 19-31.
Twilley, RR 1988 Coupling of mangroves to the productivity of estuarine and
coastal waters. In Coastal-offshore ecosystems: interactions. Lecture Notes
Coastal Estuarine Studies 22. Springer. p. 155-180.
Twilley, RR, Ejdung, G., Romare, P. & Kemp W.M. 1986a A comparative study of
decomposition oxygen consumption and nutrient release for selected aquatic
plants occurring in estuarine environments. Oikos 47,190-198.
TwiUey, RR, Lugo, A. E., & Patterson-Zucca, C. 1986b Litter production and turnover
in basin mangrove forests in south west Florida. Ecology 67,670-683.
Valiela, I. 1984 Nutrient Cycles: Phosphorus, Nitrogen and Sulfur. In Marine
Ecological Processes, Springer Verlag, New York, pp. 312-340.
Van der Valk, A.G. & Attiwll, P.M. 1984 Decomposition of leaf and root litter of
Avicennia marina at Western port Bay, Victoria. Australia. Aquatic Botany 18.
205-221.
·Vollenweider, R A. 1968 Scientific Fundamentals of the Eutrophication of Lakes
and Flowing waters with Particular reference to Nitrogen and Phosphorus as
186

Sedimellt Characteristics alld Nutriellt Status
Factors in Eutrophication, Organizrltion Economic Cooperation and
Development, Paris, DAS/CSII 68,27.
Wafar, S. & Untawale, A.G., Wafar, M. 1997 Litter fall and energy flux in a
mangrove ecosystem. Estuarine, Coastal and Shelf Science 44,111-124.
Wahab, MA & Stirling, H.P. 1991 Environment and development of benthos in
earthern trout ponds in central Scotland. Aquaculture 97, 335-352.
Wentzel, M.C., Lotter, L.H., Ekama, GA, Loewenthal, R.E. & Mariais, G.v.R. 1991
Evaluation of biochemical models for biological excess phosphorus removal.
Water Science nd Technology 23,567-574.
Woodroffe, C. 1992 Mangrove sediments and geomorphology. In Tropical
Mangrove Ecosystems - Coastal and EstL'arine Series 41 (Robertson, A.1. &
Alongi, D.M., eds). American Geophysical Union, Washington, pp. 7- 41.
• Not referred in original
187

ChapterS
FRACTIONATION OF
PHOSPHORUS IN SEDIMENT CORES
5.1 INTRODUCTION
Phosphorus is one of the key element affecting ecosystem productivity and
perhaps the key nutrient in aquatic system. Unlike carbon and nitrogen, much of
the phosphorus added stays within an ecosystem in a variety of forms like
dissolved inorganic and organic forms, as minerals, associated with biota,
sedimentary phosphate etc. (Reddy et al., 1999). Sediment phosphorus undergoes
various trasformations as it cycles through the inorganic phosphorus pool
(associated with minerals) and the organic phosphorus pools (associated with
plants, animals, microbes, and soil organic matter). The various forms of
phosphorus determine the fate and transport of phosphorus in sediments.
Inorganic phosphorus is mostly found in combination with Aluminium(AI}, Iron(Fe},
Calcium(Ca} and Magnesium (Mg). Phosphate minerals include apatite
[Ca1O(P04}6F21, crandallite [CaAI3(P04)s(OH}21, wavellite[AI3(P04h(OHh], variscite
[AI3(OHhH2P04] and strengite [Fe(OHhH2P04]. Phosphorus may also be fixed
through a variety of chemical reactions, by non crystalline oxides of Fe and AI,
which often occur as coatings on soil particles. An indirect involvement of organic
carbon through complex formation with Fe and AI has been suggested (Reddy
et al. (1999) i" ':3ses w':e,9 significant correlation with carbon in addition to Fe or
AI, was obtained for the phosphorus sorbing capacity of a soil. As a result of
biological and chemical processes a certain amount of phosphate is released from

ChapterS
sediments and becomes available for algae and macrophytes. To determine the
bioavailibility/mobility of sediment phosphate several methods - algae bioassays,
chemical fractionation, exchange with anion resin, electrodialysis and isotopic
exchange etc - have been employed. Chemical fractionation, involving sequential
extraction procedures is, by far, the most widely used. Difficulties in identification of
specific phosphorus minerals have led to the development of chemical fractionation
schemes that attempt to characterize the forms of phosphorus in sediments. Such
schemes have evolved from the assumption that particular chemical reagents
preferentially extract discrete chemical forms of phosphorus from sediments.
Common inorganic phosphorus pools identified in many sequential fractionation
procedures include
1. Loosely bound (labile or exchangeable) phosphorus
2. Phosphorus fractions associated with AI, Fe and Mn oxides and hydroxides
3. Ca (and Mg) bound fractions of phosphorus
4. Phosphorus associated with minerals and organic material resistant to
previous extractants
Because phosphorus. in sediments exist in such a diversity of amorphous
and mineral forms, it is best to consider that the various reagents extract a pool of
phosphorus generally related to a given chemical group. Therefore, the chemical
forms of phosphorus are often operationally defined and are subject to broad
interpretations.
In order to study the role of sediments in the P-cycle of the mangrove
ecosystems it is critical to choose a sediment P-fractionation procedure capable of
discriminating among different org-P fractions and providing information about their
bioavailibility. Two distinct schemes of extractions were recognized - operationally
defined procedures and functional extraction procedures. Operationally defined
procedures referred to sequential extractions with compounds such as NaOH and
HCI .. The pH during the extraction is very ·different from the pH of the sediment.
Functional extractions tried specific extractions with chelating compounds such as
NT A or EDT A, supposed to react with specific compounds present in the
sediments, which are carried out at a pH near to that of the sediment. For the
op6iational extractkJl1S, Chang and Jackson (1957) pioneered the deveiopment of
a comprehensive fractionation procedure that became one of the most widely used
procedures for fractionating phosphorus present in soils and sediments.
190

Fractiollatioll of Phosphorus in Sediment Cores
Subsequently a variety of fractionation schemes (Williams et al., 1971; Hieltjies and
Lijklema 1980; Hedley et al. 1982; Ruttenburg, 1992) were developed to resolve
various problems encountered with Chang and Jackson (1957) procedure to other
research needs.
Functional extractions, viz. extraction with chelators like NT NEDTA are
supposed to react with specific species present in the sediment. Functional
extractions make use of the chemical nature of the compounds to be extracted.
The results obtained may enforce ideas about their structure (De Groot and
Golterman, 1990). Kouwe and Golterman (1976) introduced Ca-NTA and EDTA
solution as chelators of Fe-bound phosphorus and CaC03-bound phosphorus in
sediments. The basic idea was first to extract the iron bound sediment phosphate
with a solution of Ca-NTA, which is inactive towards calciu;n bound sediment
phosphate, after which this compound might be extracted with Na2-EDTA. At first
these extractions took a long time, and the extractions were performed with
columns in which sediment was extracted overnight. Eventhough the reaction
between Fe-bound phosphorus and Ca-NTA is thermodynamically favored, it had a
very low rate of reaction. This was found to be due to the lack of adsorption of the
NTA on to the FeOOH. For the same reason Ca-EDTA reacted even less.
Reducing agents like hydroxyl amine hydrochloride or ascorbic acid were
introduced to accelerate the reaction. Later it was found that these compounds
were active only at pH < 5.5 and might react with CaC03-bound phosphorus. Later,
Golterman and Sooman (1988) used dithionate as reducing agent, which is active
even at pH, 8. The unstable nature of dithionate left as a disadvantage. Due to the
insoluble nature of Ca-NTA at higher concentration than 0.02M, De Graff and
Golterman (1989) suggested several extractions, during this step.
Since it is not feasible to repeat the extraction several times, Golterman
(1996) replaced Ca-NTA by Ca-EDTA because, in the presence 01' dithionate,
extraction would be complete within one or two hours. Also it was proved that Ca
EDTA extracts more Fe-bound phosphorus than Ca-NTA, which suggested a
complexation of Fe-bound phosphorus with organic matter. Na2-EDTA at pH 4.5 is
more effective than at pH 8 and does not attack the acid soluble organic
phosphorus. Although several adaptations Imodifications were suggested by
various workers, me refined EDTA method proposed by Golterman (1996) gained
191

ChapterS
wide acceptances in view of its preferential ability to discriminate between different
inorganic as well as different organic phosphorus fractions.
In fractionation using 'EDTA method', iron bound phosphate is extracted by
Ca-EDTA (0.02M) and calcium bound phosphate is extracted by Naz-EDTA (0.1 M).
Fe(OOH) P + Ca-EDTA--" Fe-EDTA + o-P + Caz+
EDT A solution has the disadvantage of interference with ortho phosphate
and Fe determination. For the ortho phosphate determination, 2ml of 0.1 M EDTA
can be used without interference. The Naz-EDTA is found more effective at pH 4.5
than at pH 8 because it does not attack the acid soluble organic phosphate
(Golterman, 1996). In the sediments of the River Garrone (Netherlands) Ca-NTA
phosphorus appeared to be the best estimate of available P (Fabre et al., 1996).
Apatitic phosphate (extracted by EDTA) is generally considered not to be algal
available phosphate (Williams et al., 1980). Fabre et al., (1996) however, found a
spurious correlation between algal available phosphorus and EDT A phosphorus in
Garrone sediments. A comparison of this method with that of the SEDEX extraction
(Ruttenburg, 1992) and Heiltjes and Lijklema (1980), Golterman (1996) found that
the SEDEX method extracted the same quantity of Fe-bound phosphorus, but less
of CaC03 -bound phosphorus. The SEDEX method uses citric acid, dithionote and
bicarbonate as extractants for Fe-bound phosphorus and sodium acetate followed
by hydrochloric acid for the different forms of Ca- bound phosphorus. Heiltjes and
Lijklema (1980) uses ammonium chloride, sodium hydroxide followed by
hydrochloric acid is used to extract iron bound phosphorus. In Heiltjes and Lijklema
(1980) method, much lower quantities of Fe-bound phosphorus was extracted than
Ca-NTA ( De Groot and Golterman, 1990).
Phosphorus transformation processes in mangrove sediments
Studies on sediment interaction in mangrove sediments have shown high
phosphorus uptake. Total phosphorus content of mangrove sediments appears to
fall within the range of 100-1600 IJgg-1• Mangrove sediments are expected to
contain a high proportion of organic phosphorus compounds due to their generally
high organic matter content. Boto (1988) pointed out that much of this organic
phosphorus is in the phytate form and bound to humic compounds whlctl are not
readily available for microbial and mangrove plant nutrition. Although organic
phosphorus is the major fraction, the inorganic phosphate probably represents the
192

Fractionation of Phosphorus in Sediment Cores
largest potential pool of plant available, soluble reactive phosphorus (Boto, 1988).
Most of the inorganic phosphorus in mangrove sediments is either bound in the
form of Ca, Fe and AI phosphates or present as soluble reactive phosphorus
adsorbed onto, or incorporated into hydrated Fe and AI sesquioxides.
Macrophyte detritus from mangrove trees typically has high high C:N and
C:P ratios (Kristensen, 1990; Wafar et al., 1997) compared with the demands of
decomposing bacteria. Therefore a rapid immobilization of nutrients may occur
during decomposition in mangrove forest sediments (Alongi, 1988; 1991; 1994;
1996; Kristensen et al., 1998). Mangrove sediments found to act as a sink for
phosphates for example in experiments with waste water addition to mangrove
sediment, Tam and Wong (1994; 1995; 1996) found a high retention of phosphate
in the sediment. Wong et al. (1995) studied se ..... ·age discharge in a mangrove area
(Shenzhen) with Kandelia candel and Aegiceras corniculatum, and observed that
about 85% of the added P was retained in the sediment. Mangrove sediments in
Australia we(e reported to have adsorption maxima in the range 250-700l-1g P g.1
dry weight sediment (Clough et al., 1983). The effect of either increased
ammonium or phosphate concentration was studied in Bangrong (Thailand)
mangrove area and Wadden sea sediment (Holmboe et al., 2001). Dissolved
inorganic phosphorus (DIP) was released during anoxic decomposition in Wadden
sea sediment, but was retained in Bangrong mangrove sediment. This study also
found that added excess DIP was efficiently taken up by the sediment particles and
primarily retrieved in the easily exchangeable and iron bound fractions and the
sediment was thus found to act as a phosphorus sink.
Transformation of phosphorus in estuarine systems are categorized as two
sets of processes: biotic and abiotic. Under biotic processes assimilation and
excretion and hydrolysis were included. Precipitation, adsorption and
chemisorption and dissolution and desorption were included under abiotic
processes. The phosphate ions (H2P04 ., HPO/·, P043
• ) in dissolved phase were
found to be strongly adsorbed to clay particles, particular to clay containing iron or
manganese oxyhydroxides through different chemical and physical interactions.
Clay such as kaolinite, abundant in tropical soils and sediments are particularly
efficient in phosphate adsorption. It was also found that the capacity of mangrove
seaiments to immobilize phosphorus was probably limited by the availability of
exchange sites, particularly in sediments already rich in phosphorus. However the
193

ChapterS
capacity of sediments to immobilize phosphates may also depend on their
incorporation into plant biomass (Clough et al., 1983).
Phosphate immobilization by precipitation as Ca, Fe and AI salts also results
in significant net removal of phosphorus into the large mineral pool, limiting the
availability to living systems. In flooded salt marsh and mangroves, the grass and
mangrove trees excrete oxygen through their root system, producing an
oxygenated microenvironment (Silva et al., 1991) capable of trapping phosphorus
as ferric phosphate following the reaction:
4Fe+2 + O2 + 4H+ ----. 4Fe3+ + 2H20
Fe3+ + 3H 20 ----. Fe(OHh +3H+
Fe(OHh + H2P04- ----. FeP04 + OW + 2H20
In the dry season, atmospheric exposure of the sediment would result in
increased Fe3+ concentration leading to the precipitation of ferric hydroxide (Crosby
et al., 1984). Therefore the dominant reactions in the interstitial water are:
Me(OH) (5) + DIP ----. MeDIP (5) + OH- + H20
where Me = Fe and DIP = H3P04 + H2P04 -+ HP042
- + P043
-
In accordance with this, Fabre (1992) found similarly higher phosphorus
concentration in the soils of the Garrone river with largest inundation periods.
Major fraction of phosphorus also found as bound to calcium minerals_ The
formation of inorganic solid phase P reservoirs in carbonate sediments is primarily
driven by chemisorption of phosphorus on to calcite (CaC03) and I aragonite
(CaC03 dimorph of calcite) followed by coprecipitation to form apatite (Stumm and
Leckie, 1970; De Kanel and Morse, 1978; Kitano et al., 1978). Common marine
apatites are hydroxylapatite [CalO(P04)s(OH)2], fluoroapatite [CalO(P04)s(F,OH)2],
and chloroapatite [CalO(P04)6CI] (Morel and Hering, 1993; Greenwood and
Earnshaw, 1997; Yen, 1999). However, fluoroapatite (CFA) is to be the primary
diagenetic sink in tropical marine carbonate sediments (Ruttenburg and Berner,
1993; Jensen et al., 1998).
In general case, low redox potentials in mangrove and other water logged
soils lead to the release of phosphate, particularly at iow pH «1). The mechanisms
involved in this release as given in (Clough et al., 1983) are as follows.
194

Fractiollatioll of Phosphorus ill Sediment Cores
(i) Reduction of insoluble ferric phosphate to more soluble ferrous phosphate; (ii)
the reduction of the hydrated ferric oxide coating on clay and silt particles resulting
in the release of occluded phosphate; (iii) phosphate displacement from ferric and
aluminium phosphates by organic anions; (iv) hydrolysis of ferric and aluminium
phosphates; (v) anion (phosphate) exchange between clay and organic anions.
The smaller grain size and the longer tidal inundation periods also affected the
concentration of Fe-bound phosphorus. During inundation the respiratory activity of
bacteria reduced the Fe3+ to Fe2
+, which resulted in the reactive capacity of iron
(Patrick and Mahapatra, 1968).
The precipitation with Ca2+ or the adsorption of phosphate on to CaC03 is controlled
by the solubility of apatite (Golterman, 1995). A lowering of the pH may also cause an
increased mobilisation of phosphorus from hydroxy apatite (E'.ostrom et al., 1988).
Diagenetic processes in sediments are driven by redox reactions that are
mediated by the decomposition of organic carbon. The extent to which organic
matter is preserved in sediment is critical in determining how far the diagenetic
sequence progresses. Chester (2000) has suggested that diagenetic processes
differ along sediment depth. Froelich et ai., (1979) given a vertical depth zone
diagenetic model in hemipelagic sediments (sediments with intermediate
sedimentation rates and organic carbon typically around 2%, the thickness of oxic
layer ranges from a few centimeters to around a metre). The model is related to the
sequential use uf oxidants for the destruction of organic carbon and they were able to
identify a number of distinct zone in the sediments. The major zones are, Zone 1, the
oxygen being consumed for the dostruction of organic matter, where ammonia is
oxidized to nitrate. Just below this a zone, Zone 2 and Zone 5, where nitrate neither
consumed nor produced so that to a certain depth, nitrate concentration become
linear. Overlapping with this, Zone 3 and Zone 4, an interval over which organic
carbon is oxidized by manganese oxides to release dissolved manganese ions into
the interstitial waters. Below this region, Zone 6 and Zone 7, the organic carbon
oxidation is effected by ferric oxides. Ferrous iron is released into solution, and
diffuses upwards to be consumed near the top Zone 7 and in Zone 6.
But in their study (Silva and Sampio, 1998) they did not find any vertical
variation with depth, might be due to bioturbation actions. Alongi et al., (1998)
compared vertical variation of sulphate reduction between mangrove and mudflat
sediment found that labile organiC matter is the major factor regulating rates of
195

decomposition. The peaks obtained in subsurface sediments of mangrove suggested
a source of labile organic matter, which are most likely derived from tree roots.
Brunskill et al., (1998) found a lack of clear vertical gradients in rates of sulphate
reduction in pore water and solid profiles in mangrove sediments, (Herbert river
region, Australia) attributed to the mixing of organic matter by benthic organisms like
crabs. Earlier studies of this same area found extensive bioturbation, which greatly
influencing nutrient concentrations and mangrove nutrient dynamics (Smith et al.,
1991). The exposed sediments with large amount of organic matter favored
decomposition of organic matter with release of phosphate from organic fraction of
the sediment. Silva and Sampaio (1998) found that the tidal inundation time, which
varies with the topography of the soil, appears to the dominant process favoring the
formation of iron compounds which in turn control phosphorus concentration in the
soil. The relatively large amount of readily available ortho phosphorus could explain
the high productivity of Donana ponds (Espejo et al., 1999).
Biotic transformations of phosphorus in these systems are affected by
uptake and excretion by organisms. Every organism participates to some extent in
the phosphorus cycle by virtue of its need to assimilate organic/ or inorganic
phosphorus for grov.1h and maintenance, and by excreting phosphorus-containing
byproducts. Bacteria, algae and higher plants, including mangroves, take up
dissolved orthophosphate. The organic phosphates could either be taken directly
or they were assimilated after hydrolyzing them by extracellular alkaline
phosphatases. Organic phosphorus found to be very resistant to hydrolysis and not
readily assimilable to organisms. Orthophosphate is coupled to ADP to form ATP in
cells, and is essential for energy transfer and phosphorylations, and for synthesis
of nucleic acids, phospho Iipids and phosphoproteins (Ingraham et al., 1983).
The cycling of phosphorus through mangrove food web is presumably similar
to that in other aquatic system. At the base of pelagic and benthic food webs a
microbial loop exists in which interaction among bacteria, microalgae and nano
protozoans and larger protists facilitates net release of phosphorus into the water
column and pore water (Alongi et al., 1992).
The sequential extraction of P in sediment sample is important for
understanding the mechanisms that control the release/uptake of nhosphorll~ in
sediment. These mechanisms could be chemical or biological in nature or a
combination of both, and the nature of the mechanisms would decide if the element
196

Fractionatioll of Phosphorus iu Sediment Cores
was available or not to flora and fauna (Silva and Mozeto, 1997). Thus the
knowledge of the distribution of phosphorus among chemical forms is useful for
understanding P availability to aquatic plants under varying sediment
environments, predicting the fate and transport of phosphorus in environmental
studies, and evaluating the interaction of phosphorus between sediments and
overlying water. The objective of the present study is to attempt phosphorus
fractionation in core sediments, and to explore the impact of environmental far.tors
on the distribution and also to provide basic data for the study of mangrove
sediments as internal sources of releasing phosphate into the overlying water.
To this end a sequential extraction procedure adapted from the EDTA
method (Golterman, 1996) was designed with slight modification and made use of.
The first st'3P of the extraction was done using distilled water as suggested by Pardo, et al (1998). The details of chemical analysis for fractionation of phosphorus
by EDT A method are given in Chapter 2. There were six steps in the extraction
procedure and the first three extractions were analysed for both inorganic and
organic phosphates. Each functional extraction is named after the functional group
with which phosphate is associated with in the sediment. The first three extractions,
extractants were analysed for inorganic phosphate and total phosphate. The
various steps in the extraction. facilitated the separation of following fractions: 1.
water extractable phosphate (water extractable inorganic phosphate and water
extractable organic phosphate) 2. CaEDTAldithionate extractable phosphate (iron
bound inorganic phosphate and iron bound organic phosphate) 3.NaEDTA
extractable phosphate (calcium bound inorganic phosphate and calcium bound
organic phosphate) 4.Acid extractable organic phosphate 5.NaOH extracted
organic phosphate and 6.Residual organic phosphorus. The sum of fractions at
each depth at every Station is given by LTP.
Abbreviations used in text, tables and graphs for these fractions are as follows:
1. Water extractable inorganic phosphate and water extractable organic
phosphate (W-IP and W-OP)
2. Iron bound inorganic phosphate and iron bound organic phosphate (Fe-lP, Fe-OP)
3. Calcium bound inorganic ohosphate and organic phosphate (Ca-lP, Ca-OP)
4. Organic phosphate acid extractable (Ac-OP)
5. Organic phosphate alkali extractable (Alk-OP)
6. Residual organic phosphorus (ROP)
197

CllapterS
5.2 RESULTS AND DISCUSSION
5.2.1. Vertical variation of phosphorus forms in sediment cores
Water extractable Inorganic Phosphate ( W-IP)
W-IP is the easily exchangeable phosphate fraction in sediment.
Exchangeable fraction includes the phosphorus dissolved in interstitial water as
well as the phosphorus loosely bound to the absorbing surfaces of sediments. This
fraction comprises of phosphorus forms, which would be readily available to the
biota such as benthic bacteria or susceptible to diagenetic transformation, e.g.
Complexation with Fe, AI, Ca or humic substances. In the present study this
fraction was extracted with distilled water.
Station-wise summary statistics of W-IP are given in Table 5.1.
Table 5.1 Station-wise summary statistics of W-IP ( I-Ig/g) in sediment cores
Station Depth Min Max Mean SD %ofCV
0-2 3.52 54.02 14.30 19.61 137.13
2-4 1.69 42.23 15.98 16.34 102.23
Station 1 4-6 3.85 56.19 17.04 19.76 115.97
6-10 6.04 71.32 26.20 23.62 90.13
10-20 22.67 82.56 42.86 21.59 50.38
0-2 1.17 45.84 16.20 19.46 120.15
2-4 0.99 75.41 20.90 28.47 136.25
Station 2 4-6 1.30 85.31 26.64 32.25 121.05
6-10 2.81 75.91 25.96 26.61 102.52
10-20 6.44 51.54 22.71 15.52 68.37
0-2 0.03 5.61 1.70 1.97 115.61
2-4 0.69 10.09 2.85 3.65 128.29
Station 3 4-6 0.46 12.34 4.29 5.36 124.94
6-10 0.92 12.53 4.48 4.52 100.92
10-20 1.67 14.29 7.08 i 5.72 80.84
Season a! ::3nd annual '.'2~;..,~i~!1S in ve~::::8! profiles of W-IP, at three mangrove
stations are depicted in Fig. 5.1a to 5.1d. The concentration ofW-IP ranged between
0.03~gg·1 (0-2 cm, Station 3) and 85.31 ~gg'1 (4-6 cm, Station 2). Eventhough a large
198
I

Fractiollatioll of Phosphorus ill Sedimellt Cores
variation (Table 5.1) was found between stations, consistent values were recorded in
10-20cm layer at all Stations. This fraction showed general increase in concentration
with increasing depth except at Station 2, where, a reversal in the above trend at
depth beyond 10cm was noticed.
Annual variation of W-IP 1'9/g
0 10 20 30 40 50 Seasonal variation of W-IP
l'g1g 0-2
~ o 10 20 30 40 50 60 • .,.. ... ~
0-2,.......,...----r--~\ ............... -,--.--, ~:~') 2-4
\ E u 4-6 oS
1 r: 0. .. 06-10
\ 10-20
.-Station 1_ Station2-.A.- Station3
(a)
Seasonal variation of W-IP f19/g
10 20 30 40 50 60 70
) •
Station 2 . .- Pre.monsoon-e~ Monsoo~- Postmonsaon
(c)
~ 1~_ ~ \ f\ ". "t • • '.J\l . . \\ (~
J,. \ • J
10-20
Station 1 .- Pre.rron~-~- POSl.rronsoon
0 0·2
2-4
E " 4·6 .5 .t:
~ c 6-10
10·20
(b)
Seasonal variation of W-IP I'g/g
5 10
~~ ~ / '\ .~
Station 3
15
. .-Pre.monsoon--e- Monsoon-.- Post.monsoon
(d)
'c,,:.... ..,{II
--- .. " ,/ --4< '
Fig. 5.1 Annual and seasonal variation of W·IP in sediment cores
The seasonal picture showed. a W-IP concentration pattern, more or less
similar during pre-monsoon and post-m on soon and higher during monsoon at all the
three Stations. Station 1 exhibited a regular decrease in W-IP down the core, during
199

ChapterS
pre-monsoon and post-monsoon, with a considerable increase at 10-20 cm depth.
However during monsoon, W-IP found to decrease at 10-20 cm depth at this Station.
Also at Station 2, W-IP recorded an increase in concentration during pre-monsoon
and post-m on soon seasons, while during monsoon; the W-IP concentrations were
found decreasing after 6cm of depth. At Station 3, W-IP showed an entirely different
trend, with slight decrease followed by further increase at depths beyond 6cm during
all se'3sons. An overall picture followed the general pattern of increasing W-IP
concentration with increasing depth, except at Station 2 beyond 10cm.
The W-IP is the easily exchangeable phosphate fraction found in the
sediment. The exchangeable fraction was found not to exceed 2% of the total
phosphorus by Baldwin (1996). In a recovery determination of added phosphorus
study it was observed that a large part of the added phosphorus was recovered in
the exchangeable fraction, which is characterised as easily exchangeable phosphate
adsorbed on to particle surfaces (Jensen and Thamdrup, 1993). This large
adsorption of phosphorus may be due to very high silt+clay content of the sediment.
Present study also confirms this by recording maximum exchangeable phosphorus at
Station 2, at a depth of 4-6 cm (silt+clay, 95%). The general increase in W-IP down
the core may be attributed to an elevated phosphate levels in interstitial waters of the
sediment. The study undertaken by Joseph (2001) phosphates in pore water, in the
same area also confirmed this observation. The increased W-IP concentration levels
may be due to mineralisation of organic matter and dissolution of phosphate bearing
iron oxides in the existing reducing conditions. Froelich et al. (1979) have observed
large increase in pore water phosphate during mobilization of iron bearing oxy
hydroxy coatings. In anoxic environments, another pathways for inorganic phosphate
release from complex organic phosphate entities like phytate and poly phosphates
stored in bacterial biomass were also observed (Suzumura and Kamatani, 1995). It
was reported that bacterial biomass seem to store poly phosphate when they live in
an aerobic environment and hydrolyse under anaerobic conditions (Corn eau et al.,
1986). A typical anoxic environment may prevail in sediments cores of studied area
with increasing depth. Thus increase in W-IP may be attributed clearly to the
increased phosphate concentration in pore water levels.
Water extractable Organic Phosphate (W-OP)
The water extractable organic phosphorus consists of mainly the organic
phosphorus present in pore water.
200

Fractiollatioll of PllOspllOnls ill Sedimmt Cores
The Station-wise summary statistics of w-op are given in Table 5.2. The
maximum concentrations of 52.95I-1gg-1 recorded at Station 2, 6-10 cm layer and
minimum of not detectable were recorded at Station 3, 2-4, 4-6 and 6-10cm depths.
Table 5.2 Station-wise summary statistics of W-OP (~g g-l) in sediment cores
Station Depth Min Max Mean SO %ofCV
0-2 1.47 21.06 11.62 8.23 70.87
2--4 3.59 15.70 7.18 5.27 73.40
Station 1 4--6 0.54 23.31 9.11 8.09 88.86
6--10 3.17 52.95 13.28 19.59 147.50
10--20 1.55 27.79 11.68 11.10 95.00
0-2 3.85 24.16 8.65 7.85 90.78
2--4 0.24 12.82 4.75 4.32 90.99
Station 2 4--6 3.15 8.85 6.11 2.20 36.10
6--10 1.92 15.08 8.90 5.20 58.47
10--20 1.66 10.95 5.35 3.66 68.41
0-2 0.00 19.44 4.23 7.57 179.18
2--4 0.00 11.32 3.72 4.01 107.63
Station 3 4--6 0.00 15.21 4.49 5.57 124.23
6--10 0.45 23.18 6.44 8.69 134.96
10--20 0.00 10.25 3.15 3.68 116.59
Unlike W-IP, this fraction showed a general decrease with increasing depth
except at 6-10 cm depth at all Stations (Fig. 5.2a). The W-OP concentrations
observed were higher at Station 1 and Station 2 than at Station 3. The seasonal
variations of W-OP are given in Fig. 5.2b to 5.2d. During monsoon, an increase at
6-10 cm depth was recorded at all Stations. The overall picture of the annual
variation showed a distinct pattern with a decrease till 4cms of depth followed by a
gradual increase till 10cms with a sharp decrease again beyond 10cms of depth
(Fig. 5.2a). Monsoon season recorded maximum org-P at all stations. During pre
monsoon and post-monsoon similar concentrations were recorded at all stations.
The sub-surface decrease was found maximum during monsoon. Unlike W-IP, less
coefficieni of variations in concentrations of W-OP were observed In surface and
subsurface layers (Table 5.2).
201

ChapterS
Annual variation of W'()P IICIfg
0-2°.0 2.5 5.0 7.5 10.0 12.5 15.0
2-4
5 4-6 .5
16-10
10-20
. _ Station1-*- Station2-6- Station3
(a)
Seasonal variation of W'()P ~glg
0-20 5 10 15
2-4
~ 4-6 .5 .c
16-10
Station 2
20
. .-Pre.monsoon--e- Mons()()1l-.6.- Post.monsoon
(c)
2-4
54-6 .5
16-10
10-20
Seasonal variation of W(JJ
Station 1 . .-Pre.1TI:lIlSOOf)--e- Mnsoon-A- Post. rrcosoon
(b)
Seasonal variation of W-OP ~Ig
10 15
Station 3 . .-Pre.monsoon--e- Monsoon---&- Post.monsoon
(d)
Fig. 5.2 Annual and seasonal variation of W-OP in sediment cores
In sediments, dissolved organic phosphorus (OOP) was mostly used and
recycled by bacteria without any significant net release of total phosphorus to the
water column (Kairesalo et al., 1995). Therefore, the sediment bacteria have an
important role in the phosphorus dynamics of the sediment ecosystem. Sharp
decrease in subsurface sediment may be due to the decrease in bacterial biomass,
202

Fractionation of Pllosphorus i-, Sediment Cores
also due to the less amount of labile organic phosphorus. The gradual increase
found till 10cm of depth may be attributed to the accumulation of organic
phosphorus at this depth. Sinke and Cappenberg (1988) have observed that live
sediment bacteria enhanced the release of phosphorus from the sediment. They
stated that bacterial mineralisation would serve as driving force for the P04-P
release from the sediment. The decrease in W-OP at 10-20 cm may be attributed
to an increased mineralisation of organic phosphorus compounds at this depth.
Therefore the decrease of W-OP down the core sediment indicated a decrease in
bacterial density on increasing sediment depth, as well as increase of W-OP may
be associated with mineralisation of organic phosphorus aided by bacterial
biomass. The bacteria capable of storing polyphosphates may play an important
role in the P04-P release in anaerobic conditions (Hupfer and Uhlmann 1991).
Fe-bound inorganic phosphate (Fe-IP)
Phosphate extracted by Ca-EDT A/dithionite can be considered as the best
predictor for algal available phosphate (Fabre et al., 1996). Phosphate entering
shallow water will be taken up rapidly by phytoplankton during the growing season,
but during winter or less active period by far great amount will be bound on to
settled sediments. The algal phosphate will be recycled several times during the
growing season, but eventually it will become sediment phosphate, either as an
inorganic or as an organic pool (Golterman, 1998). Both fixation of the inorganic
phosphate onto the sediments, and its release from sediments to the overlying
water, are controlled by the two mechanisms (Golterman, 1998). First by
adsorption of dissolved orthophosphate (o-P) on to ferric hydroxide (goethite)
Fe(OOH).x H20 and second by precipitation with Ca2+ as apatite, Ca5 (P04h.OH,
probably as co-precipitation with CaC03• The adsorption on to Fe(OOH) can be
described by Freundlich adsorption isotherm, which in turn influenced by both Ca
concentration and pH (Golterman, 1995). The inorganic fraction mainly iron bound
phosphorus increase gradually with depth (25-100 cm) reflecting the influence of
increasing anoxia particularly below the root layer (Alongi et al., 1992).
The Station-wise summary statistics in depth profile of Fe-IP are given in
Table 5.3. The concentrations of Fe-IP varied from 7.09~gg-1 (4-6cm, Station 3) to
1101.48~gg-1 (10- 20 cm, Station 1). Remaikably higher Fe-IP cuncentrations were
recorded at Station 1 and Station 2. than at Station 3. The seasonal and annual
mean distribution~ of Fe-IP at three stations are given in Fig. 5.3a to 5.3d. The
203

ChapterS
Fe-IP showed general decrease down the core at these Stations, except at Station
1 beyond 10cm depth. Seasonal variations of Fe-IP showed remarkably higher
values during post-monsoon at all Stations. At Station 1 during pre-monsoon and
monsoon, generally, Fe-IP concentration increased down the core. However at
Station 2, monsoon and post-monsoon showed a similar trend, with a subsurface
increase followed by a sharp decrease at 10-20 cm depth. The pre-monsoon
concentration at this Station found to decrease with increasinG depth. The overall
picture of the annual variation followed the general pattern of decreasing trend
down the core at Station 3. At Station 1, a small subsurface maximum and sharp
increase recorded at 10-20 cm layer. Station 2 showed a subsurface maximum
followed by general decrease downwards. The annual summary statistics (Table
5.3) showed comparatively consistent values at the depth, 6-10 cm at Station 1 and
Station3 as well as in 10-20 cm depth at Station 2.
Table 5.3 Station-wise summary statistics of Fe-IP ( 1-19 9-1) in sediment cores
Station Depth Min Max Mean SD %ofCV 0-2 43.61 849.32 412.12 323.58 78.51
2--4 46.08 916.14 425.06 359.67 84.62 Station 1 4--6 45.20 850.10 392.23 347.25 88.53
6--10 49.51 689.16 345.68 248.71 71.95 10--20 40.66 1101.48 495.36 409.44 82.66
0-2 35.74 827.58 427.08 296.49 69.42 2--4 50.90 952.25 477.99 375.34 78.52
Station 2 4--6 45.83 830.24 414.48 315.31 76.07 6--10 41.52 768.26 422.49 305.06 72.20 10--20 48.47 492.24 282.63 190.89 67.54
0-2 13.82 189.74 102.76 57.56 56.02 2--4 11.30 167.32 90.73 56.43 62.20
Station 3 4--6 7.09 112.53 70.52 38.89 55.14 6--10 7.21 78.07 52.41 25.23 48.14 10--20 14.62 91.46 58.69 28.82 49.11
In general, capacity of mangrove soil to immoblize phosphate depends on
the amount of organic matter, its C/P ratio, and the type and amount of clay
minerals present. Dissolution of mineral phosphate also depends on
physicochemical characteristics such as pH, available sulphides, alkalinity and
redox state (Boto, 1988). Generally the Fe-IP found to decrease down the core at
204

Fractionation of Phosphorus in Sediment Cores
Station 1 and Station 3. This is not in accordance with the observation of Alongi
et al. (1992). The Fe-IP found to increase only at 10-20 cm depth at this station. At
this depth bacterial mineralisation will be less, hence added phosphorus get
adsorbed on to sediment. The added phosphate was found to retain in Bangrong
mangrove sediment, primarily by binding large phosphate loadings as easily
exchangeable phosphorus and Fe-bound phosphorus. (Holmboe et al., 2001).
Annual variation of Fe-IP
~glg
0-2 100 200 300 400
2-4
j E u 4-6 .5 j .c Q. .. 0 6-10
i 10-20
.-Station1_ Statlon2-A- Station3
(a)
Seasonal variation of Fe-IP ~glg
0-2 200 400 600 800
2-4
\ / E u 4.Q
T .5
/ .c a I ~ 6-10
10-20
Station 2 . _ Pre.mons~ Mons()()(l--6- Post.monsoon
(c)
500
Seasonal variation of Fe-IP IlQig
~~v 400 600 800
\ 6 4-6 .5
10-20 \ j.
Station 1 .• -Pre.~-~-Poslrronsoon
0-2
2-4
!i 4-6 .5 .c
! 6-10
10-20
(b)
Seasonal variation of Fe-IP I'(IIg
50 100 150
\ / Station 3
. _ Pre.mons~ Monsoon--&- Post.monsoo
(d)
Fig. 5.3 Annual and seasonal variation of Fe-IP in sediment cores
205

ChapterS
The phosphorus sorption capacity of the sediment containing Fe(OOH) is
expected to decrease along the salinity gradient due to corresponding changes in
pH (Paludan and Morris, 1999). Under fresh water conditions (pH ranges from
4.5 - 7), hydroxides of metals such as Fe and AI carry a net positive charge that
would facilitate phosphorus sorption, while under salt water condition (pH ranges
from 7.0 - 8) they carry a negative charge (as given in Sundareshwar and Morris,
1999). Annual pH value in sediment cores ranges from (Table 4.15) 8.0 to 8.5 at
Station 1, 8.2 to 8.7 at Station 2 and 7.1 to 8.2 at Station 3. An exceptionally high
value, of Fe-IP concentration was observed at Station 1 in 10-20 cm layer, might
be associated with a decrease in pH. This could be seen clearly during pre
monsoon, which gave a pH as low as 6.8 for this particular layer at Station1. While
at Station 2 a minimum value of Fe-lP, 28~.63IJgg-1 observed in this layer with an
increasing trend of pH down the core. A decrease in Fe-IP concentrations was
recorded also at Station 3, with an increase in pH.
The P-sorption potential, which is clearly related to the distribution of Fe
species, is another factor that control the depth profile of phosphorus concentrations.
Because Fe (Ill) is more efficient in binding P, the iron bound phosphorus rapidly
declines with depth. It was observed by (Paludan and Morris, 1999) iron
predominantly occurs in the Fe (Ill) state in surface sediments and in the Fe(II) state
in the subsurface sediments. Study on effects of added phosphorus in sediments
revealed that added P recovered mostly as exchangeable fraction and Fe-IP. The
exchangeable fraction found to contain 35-38% in surface sediment and 51-54% in
sUbsurface sediment. The added phosphorus recovered as 44-45% Fe-lP, in surface
sediment and 20-22% in subsurface sediment (Holmboe, et al., 2001). Therefore any
conditions, which bring in phosphorus into the system, may increase the Fe-IP
concentration in surface sediments than the subsurface sediments.
Seasonal variations were found at three stations with maximum during post
monsoon and minimum recorded during pre-monsoon at all three stations.
Sundareshwar and Morris (1999) proposed that pH as well as salinity influence the
binding capacity of phosphorus on to iron oxides. Alkaline conditions, promoted by
sulphate reduction and or increased salinity, shift the charg~ of Fe-oxides from
positive to negative (Stumm and Morgan, 1981) reducing phosphorus adsorption.
Therefore increased salinity during pre-monsoon may be one of the reason to
record minimum Fe-IP during this season. During pre-monsoon, at Station 2, pH
206

Fractiona tion of Phosphorus in Sediment Cores
was found to vary from 7.8 (0-2 cm) to 8.7(10-20 cm). This also support the fact
that pH influence the concentration of Fe-IP. During rainy season these creeks are
enriched with P leached by rainfall from their surrounding vegetation, soils, and
sewage. In shallow lakes and marshes receiving a relatively large P input, nearly
all phosphate is expected to enter the sediments during loading phase as given by
Espejo et al. (1999).
The phosphorus adsorption capacity of sediments found to increase due to
the increase of Fe (OOH) concentration in the sediment. This increase is explained
by the upward leaching of oxides from deeper water in the soil during upwelling of
water-table (Siljestrom and Clemente, 1990). An increase in Fe-IP was observed
during desiccation of a fresh water marsh due to an increase in Fe(OOH) derived
from the oxidation of FeS (De Gront and Fabre, 1993). Thus increase in Fe(OOH)
in surface sediments during post-monsoon may be one of the reason to record
maximum Fe-IP during this season. Furthur more an increase in total iron
concentration was also recorded during post-monsoon and pre-monsoon.
Previous studies using estimates of free sorption sites have demonstrated
the importance of total AI, Fe and Ca concentration on total sedimentary
phosphorus (Lopez et al., 1996). A comparison of the relative degree of free
sorption sites on metal particles can be estimated by the sedimentary Fe:P ratio. In
oxidized fresh water sediment with a molar Fe:P ratio above 8.5, the sediment was
capable of retaining phosphate whereas below this value phosphate leached out of
the sediment (Jensen et al., 1992). The molar Fe:P ratio observed in the present
study is given in Table 5.4. It was found to vary from 9.08 (Station 3) to 14.26
(Station 1). Thus, based on these ratios, both sediments had a high capacity for
binding phosphate to iron. In tropical Bangrong mangrove forest (Thailand) this ratio found to vary from 16 and 20 in low inter tidal zone and 34 and 22 in mid inter
tidal zone (Holmboe et al., 2001). Hence considering all these factors, these
mangrove zones appeared to be a sink for phosphorus.
207

ChapterS
Table 5.4 Station-wise summary statistics of total FefTP (molar ratio) in
sediment core
Station Depth Min Max Mean SD % of CV
0-2 4.60 20.19 12.38 5.10 41.19
2-4 4.93 22.89 13.01 5.82 44.75
Station 1 4-6 4.70 23.75 13.08 6.74 51.49
6-10 3.15 23.28 14.26 6.80 47.68
10-20 4.37 22.07 12.07 5.67 47.00
0-2 6.37 20.42 12.30 5.32 43.27
2-4 5.50 17.38 11.80 4.90 41.51
Station 2 4-6 4.12 20.11 11.00 5.45 49.52
6-10 5.38 16.68 12.48 4.51 36.12
10-20 4.72 18.06 10.22 4.71 46.13
0-2 0.92 19.60 11.34 6.67 58.79
2-4 5.23 18.14 13.10 4.35 33.22
Station 3 4-6 3.62 12.62 9.08 3.72 40.98
6-10 4.60 18.96 10.49 4.70 44.79
10-20 3.82 22.63 12.26 7.38 60.18 _.
Fe-bound organic phosphate (Fe-OP)
The total phosphate was determined in Ca-EDTAldithionite extract by
potassium persulphate digestion. The difference between total phosphorus in the
extract and Fe-IP would give Fe-OP. The mixing of freshwater and and seawater
causes a rapid precipitation of the dissolved humic compounds carried by rivers.
The cations in seawater replace H+ on the exchange sites of the humic materials causing these materials to f10cculate and sink to the bottom (Boyle et al., 1977).
Most dissolved humic compounds and metals such as Fe, that are carried with humus substances are precipitated in the estuary or within short distance of the
mouth of the river (Boyle et al., 1974). The flocculation of dissolved organic
compounds and deposition of larger plant debris account for a major portion of the
organic carbon in estuarine sediments (Hedges et al., 1988). Most of the organic
phosphorus will become ortho phosphate by mineralisation of the organic
phosphate. A small part of the organic phosphoate will sediment and remain as
refractory organic phosphate, of which phytate is probably the most importa"t form
(De Groot and Golterman, 1993).
208

Fractionation of Phosphorus in Sediment Cores
The station wise summary statistics of Fe-OP are given in Table 5.5. Comparatively consistent values (less CV) were recorded in 2-4cm layer at Station 1, 4-6 cm layer at Station 2 and 0-2 cm layer at Station 3. At the three Stations, the concentrations ranged from 6.96J.1gg-1 (Station 3, 4-6cm) to 365J.1gg-1 (Station2, 4-6). The Fe-OP showed generally a decreasing trend down the core. Some exceptionally high values were recorded during post-monsoon at Station 1, 10-20cm depth and at Station 2, 4-6 cm depth. The annual and seasonal variations in depth profile of FeOP are given in Fig. 5.4a to 5.4d. Unlike the inorganic fraction the concentrations were similar during three seasons other than the exceptionally higher values at Station 2. The maximum value of Fe-OP, recorded at Station 2, 4-6 cm layer may be due to the incidental presence of some plant or animal debris.
Table 5.5 Station-wise summary statistics of Fe-OP (J.lg g-1) in sediment cores
Statiun Depth Min Max Mean SO % of CV 0-2 26.47 90.48 60.07 32.13 53.48
2-4 41.02 83.90 61.77 22.28 36.06
Station 1 4-6 18.79 118.67 57.86 46.49 80.35
6-10 9.22 78.38 44.28 35.94 81.17
10-20 30.14 141.26 78.95 48.15 60.98
0-2 30.95 79.42 57.28 21.04 36.74
2-4 46.34 99.58 71.77 25.03 34.88
Station 2 4-6 54.28 365.20 172.84 168.09 97.25
6-10 21.14 66.40 48.17 19.77 41.04
10-20 35.25 97.87 60.73 32.90 54.17
0-2 25.27 62.35 43.94 18.54 42.20
2-4 15.77 41.98 29.09 14.53 49.94
Station 3 4-6 6.96 ·37.81 18.21 14.11 77.48
6-10 9.25 84.91 30.85 36.36 117.85
10-20 11.08 49.53 28.93 17.50 60.47
Together with P, large concentrations of humic substances of poly-phenolic nature are washed from mangrove vegetation into the creek water during monsoon. The importance of humic substances in water can be very large as they can regulate both abiotic and biotically mediated phosphorus cycling (Francko, 1986; De Haan 1992; Jones et al., 1993). The formation of Fe-humic-P complexes in the water is partially reversible depending on ambient phosphorus concentration, changes in pH and exposure to light. As a result they may reduce instantaneous bioavailibility of inorganic phosphate, while maintaining. potentially bioavailable dissolved organic phosphorus, by preventing the precipitation of P and iron (Jones
209

Chapter 5
et al., 1993}. Additionally, humic substances in water can retard the formation of
CaC03 crystals and hence reduce the loss of inorganic phosphorus through co
precipitation with CaC03 (). Contrary to the Fe-lP, the maximum and minimum values were fluctuating down the core. Station 1 and Station 2 recorded similar
values except at 4-6 cm layer at Station 2. The relatively higher values at 10-20 cm
depth might be due to the presence iron bound humic matter at this depth. Earlier studies showed that total organic phosphorus concentration proportionally greater
in 0-25 cm reflects the influence of roots (Hesse, 1963).
Annual variation of Fe-OP
~g/g
0 50 100 150 200 0-2
J 2·4 • j E
u 4·6 .E .r. Q. \ 8 6.10
1 10·20
.-Station1 __ Station2-A- Station3
2-4
§ 4·6 .5 .c
l6.10
10·20
(a)
Seasonal variation of Fe-OP
~g/g
100 200 300 400
Station 2
.• - Pre.mon~-Mon.~- Poslmenscon
1,.\ \V,
Seasonal variation of Fe-OP J'QIg
i610 I 1 ~ 1~20 \ I A
Station 1 . .-Pre.monsoon-e- Monsoon-"'- Post.monsoon
0·2
2·4
E u 4·6 .5
(b)
Seasonal variation of Fe·OP
~g/g
0 80
Station 3
120
. .-Pre.mensoon-e-Mens~- Post.mensoon
(d)
Fig. 5.4 Annual and seasonal variation of Fe-OP in sediment cores
210

Fractionation of Phosphorus in Sediment Cores
Calcium bound inorganic phosphate (Ca-IP)
Apatitic phosphate (extracted by Na2 EDTA) is generally considered not to
be algal available phosphorus (Williams et al., 1980; DePinto et al., 1981; Young
et al., 1985). The major biogeochemical process that transform inorganic
phosphorus from a dissolved to solid state include anion adsorption onto iron and
aluminium oxyhydroxides and carbonate minerals, precipitation and co
precipitation with minerals containing calcium, iron and aluminium; and uptake by
microbes and plants (Jensen and Thamdrup, 1993). Dominance by a particular
biogeochemical process is dependent on sediment type and other physicochemical
factors. Because tropical and subtropical estuaries are typically dominated by
calcium carbonate sediments, as opposed to silicate ar.d clay-dominated
sediments of coastal temperate regions, carbonate chemical equilibria can be more
important than redox reactions in controlling sediment phosphorus transformations.
In estuarine systems where Ca plays a major role in controlling the P
concentration, phosphate adsorbs on to calcite (De Jonge and Villerius, 1989).
Atkinson (1987) argues that if P is bound as CaP04 then its variation must be due
to a contribution from calcifying organisms, where as if P is sorbed to CaC03. then
its variation should be regulated by dissolved phosphate. Earlier studies found that
(Jensen and Anderson 1992) that no significant effects on phosphorus release of
pH change in the range 8.1 to 9.7 in lake Arreskov sediment. In an experimental
study of comparison of phosphate release from sediments from a shallow lake
(Lake, Vortsjarv), under oxic and anoxic conditions, there was no significant
change in concentration of calcium bound inorganic phosphorus during the
incubation (Noges and Kisand, 1999). This led them to conclude, calcium bound
inorganic phosphorus (extracted by HCI) is rather immobile and not available for
the phosphorus cycle in this lake. Diagenic processes may also increase calcium
bound phosphorus in sediments (Goltermann, 1998). In Hooghly surfacial
sediments lack of significant correlation between calcium and the calcium bound
phosphorus have been reported by Vaithiyanathan et al., (1993).
The annual summary statistics (Table 5.6) of Ca-IP concentrations recorded
less CV at 0-2cm depth at all Stations. The concentrations varied from 4.47 ~gg-l (Station 3, 6-10 cm) to 834.21~gg-1 (Station 2, 10-20). The concentrations of Ca-IP
showed an erratic behavior down the core at Station 1 and Station 2. At Station 1 the
Ca-IP varied from 71.53~gg-1 to 626.82~gg-1. At Station 2 the variations found were
211

ChapterS
from 144.13 IJgg,l to 834.56 IJgg'1. Station 3 showed a variation from 4.47lJgg,l to
271.95IJgg,l. Annual mean and seasonal variations in depth profile of Ca-lP, showed
in Fig. 5.5a to 5.5d. At Station 3 this fraction showed a gradual decrease down the
core, during all seasons. At Station 1 Ca-IP showed a decrease during monsoon and
post-monsoon, with a sharp increase at 10-20 cm depth. At Station 2 a regular
increase down the core with an exceptionally high value at 6-10 cm and a decrease
beyond 10cm depth. At Station 3 gradual decrease down the core was found. The
overall picture of the annual variation followed the general pattern at Station 3 with
decreasing concentration down the core. Station 1 decreasing trend down the core
except at 10-20 cm depth was noticed. While at Station 2 showed an increasing
trend down the core with an exceptionally high value at 6-10 cm depth.
Table 5.6 Station-wise summary statistics of Ca-IP (~g g,1) in sediment cores
Station Depth Min Max Mean SO %ofCV
0-2 159.26 509.34 358.83 117.88 32.85
2-4 130.48 475.90 298.88 121.05 40.50
Station 1 4-6 136.44 494.21 303.38 147.45 48.60
6-10 104.20 340.29 246.35 103.26 41.92
10-20 71.53 626.82 362.04 199.40 55.08
0-2 171.03 406.93 I
266.66 81.78 30.67
2-4 170.41 490.80
I
293.88 115.74 39.38
Station 2 4-6 119.54 491.66 287.92 134.55 46.73
6-10 166.72 685.38 I I
442.21 194.95 44.09
10-20 144.13 834.56 365.38 253.23 69.31
0-2 12.29 271.95 149.43 116.14 77.72
2-4 6.98 248.62 87.99 89.24 101.42
Station 3 4-6 10.64 145.55 61.06 55.58 91.03
6-10 4.47 162.44 53.95 61.03 113.12
10-20 6.44 90.21 44.36 37.63 84.82
212
I
I
I

Annual variation of Ca-IP
0-2
2-4
E u 4-6 .E .t:.
ii. .. c 6-10
10-20
100
/ j 1
1'9/g 200 300 400
_ Stationl_- Station2-A- Station3
(a)
Seasonal variation of Ca-IP
~g/g
150 300 450 600 0-2
2-4
E u 4-6 .5 .&:
C. ~
Q 6-10
10-20 •
Station 2 . • - Pre.monsoon---4- Monsoon--.A.- Post.monsoon
(c)
Fractionation of Phosphorus in Sediment Cores
500
2-4
~4-6 .5
!6-10
10-20
Seasonal variation of ca-lP
,.gg 300 450
Station 1
600
.• -Pre.~-~-Post.mcnsoon
(b)
Seasonal variation of Ca-lP
I'IjIg o 50 100 150 200 250 300
0-2.-~~-.-",",,*,r---.-~""""'--'
2-4
10-20
Station 3 . .- Pre.mons()(lll-e- Mc:lnsoor>-6- Poslmonsoon
(d)
Fig. 5.5 Annual and seasonal variation of Ca-IP in sediment cores
These variations down the core may be attributed to the surface area of the
substrate sediment On going down the core the percentage of sand increases and
silt and clay decreases_ Theoretically and experimentally there is a relationship
between increasing phosphorus adsorptive capacity and decreasing grain size
(Waiter and Morse, 1984). pH conditions modified by primary production and
mineralization play an important role in the phosphorus modification (Istvanovics,
1988). When sediments become anoxic, there is naturally a decrease in pH as a
213

ChapterS
result of carbon dioxide produced. This decrease in pH will dissolve the apatite, as it
strongly controls the solubility. Annual pH value in sediment cores ranges from
(Table 4.15) 8.0 to 8.5 at Station 1, 8.2 to 8.7 at Station 2 and 7.1 to 8.2 at Station 3.
In the present observation pH lies in the neutral to alkaline range, hence dissolution
of Ca-IP may not takes place. The sharp increase at 10-20 cm depth at Station 1
may be due to the increase in percentage of calcareous sediment present at this
depth. The increase in concentration at 6-10 cm may be also associated with the
sediment nature at this depth. Considering these variations of Ca-IP contents of
sediments it is to be inferred that, this fraction was modified by texture of sediments.
In French Guanian mangroves the concentrations of Ca-IP were found to related to
origin of the sediment rather than to chemical modification (Fabre et al., 1999).
Calcium bound organic phosphate (Ca-OP)
Carbonate dominated marine ecosystems of the tropics have low dissolved
organic matter in the surface waters, which, has been shown to influence nutrient
uptake in these particular sediment type. Surface-active organic matter can
compete for inorganic phosphate adsorption sites on carbonate particles, create
organic coatings on carbonate surfaces that can physically reduce adsorptive sites
(Morse, 1986). The organic matter can also modify other biogeochemical factors
that influence the formation and release of solid phase phosphorus (e.g. pH and
Eh). Organic phosphorus compounds (phospholipids) have also been shown to
adsorb to carbonate particles, as organo-carbonate association (Suess, 1973),
thus high DOC in surface and pore waters of coastal estuaries in the tropics could
increase carbonate-associated organic phosphorus.
The organically bound calcium phosphates (Ca-OP) were determined as the
difference of total calcium bound phosphorus and Ca-IP. The summary statistics of
Ca-OP concentrations (Table 5. 7) showed more consistent values in 10-20 cm
layer at Station 1 and Station 2 and 2-4 cm layer at Station 3. The concentrations
found to varied from 1.10l-lgg-1 (Station 1, 2-4cm) to 105.80I-lgg-1 (Station 1,6-10
cm). The annual and seasonal variations of Ca-OP are given in Fig. 5.6a to 5.6d.
Ca-OP showed a general decrease in concentration with increasing depth.
However an exceptionally high value recorded at 6-10 cm at Station 1. Unlike Ca
i? concentraliul';', at Statiull 2, Ca-OP concentrations were not deviating from
general pattern. Station 3 recorded high values during pre-monsoon and
post-monsoon. The overall picture of the annual variation showed a decrease
214
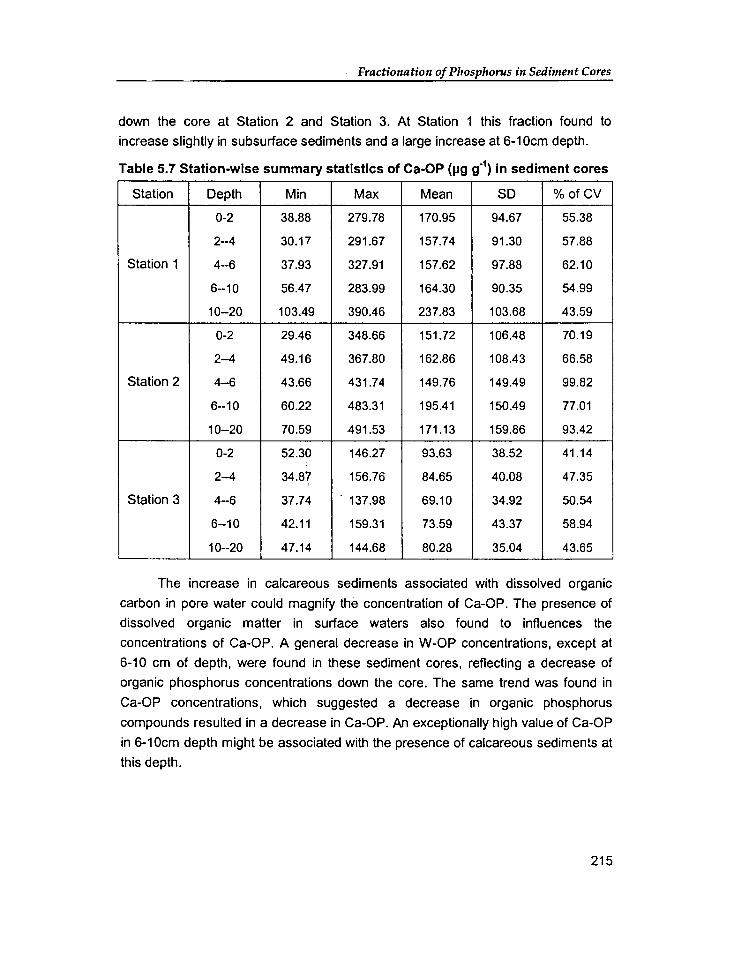
Fractionation of Phosphorus in Sedimellt Cores
down the core at Station 2 and Station 3. At Station 1 this fraction found to
increase slightly in subsurface sediments and a large increase at 6-10cm depth.
Table 5.7 Station-wise summary statistics of Ca-OP (1-19 901
) in sediment cores
Station Depth Min Max Mean SD %ofCV
0-2 38.88 279.78 170.95 94.67 55.38
2--4 30.17 291.67 157.74 91.30 57.88
Station 1 4--6 37.93 327.91 157.62 97.88 62.10
6--10 56.47 283.99 164.30 90.35 54.99
10--20 103.49 390.46 237.83 103.68 43.59
0-2 29.46 348.66 151.72 106.48 70.19
2--4 49.16 367.80 162.86 108.43 66.58
Station 2 4--6 43.66 431.74 149.76 149.49 99.82
6-10 60.22 483.31 195.41 150.49 77.01
10--20 70.59 491.53 171.13 159.86 93.42
0-2 52.30 146.27 93.63 38.52 41.14
2--4 34.87 156.76 84.65 40.08 47.35
Station 3 4-6 37.74 . 137.98 69.10 34.92 50.54
6-10 42.11 159.31 73.59 43.37 58.94
10--20 47.14 144.68 80.28 35.04 43.65
The increase in calcareous sediments associated with dissolved organic
carbon in pore water could magnify the concentration of Ca-OP. The presence of
dissolved organic matter in surface waters also found to influences the
concentrations of Ca-OP. A general decrease in W-OP concentrations, except at
6-10 cm of depth, were found in these sediment cores, reflecting a decrease of
organic phosphorus concentrations down the core. The same trend was found in
Ca-OP concentrations, which suggested a decrease in organic phosphorus
compounds resulted in a decrease in Ca-OP. An exceptionally high value of Ca-OP
in 6-10cm depth might be associated with the presence of calcareous sediments at
this depth.
215

ChapterS
Annual variation of Ca-OP .,glg
0 50 100 150 200 0-2
1 2-4
)~ E " 4-6 .S
)v .c a ~ 6-10
10-20
.-Station1-- Station2-<l- Station3
(a)
Seasonal variation of Ca-OP
I'9Ig
0-20 50 100 150 200 250
j~ 2-4
lh E 4-B " .!:
\1 .c
! 6-10
/1 10-20
Station 2 . .- Pre.mons.,.",.....- Monsoon-A- Post.monsoon
(c)
E " .!: .c a
Seasonal variation of Ca-OP
I'9'g 0-2 0 50 100 150 200 250 300
2-4
Station 1 .-Pre.~-Monsoon-A- Post.monsoon
(b)
Seasonal variation of Ca-OP
0 50 0-2
2-4
4-6
~ 6-10
10-20
Station 3 .-Pre.monsoo~ Monsoo~- Post.monsoon
(d)
Fig. 5.6 Annual and seasonal variation of Ca-OP in sediment cores
Acid soluble organic phosphate (Ac-OP)
The fractionation of organic phosphorus enable three main forms to be
identified. acid soluble organic phosphorus, alkali soluble mostly composed of
humic compounds, and residual organic phosphorus (Mesnage et al., 2002). The
phosphorus which fixes on to the fresh organic material gives compounds of the
216

Fractionfltion of Phosphorus in Sediment Cores
acid soluble organic phosphorus while the phosphorus which associates with more
stable forms of organic material gives humic acid bound phosphorus forms. Ac-OP
is a form of organic phosphorus, which is easily soluble in acid. This fraction
usually represents only a small part of the sediment phosphorus and doesn't show
any variation on a seasonal scale (Mesnage and Picot, 1995). The higher
concentration of Ac-OP in the sediments in an ecosystem of France (Seine
estuary) are interpreted as input of organic material which have come from micro
algae, phyto plankton (Mesnage et al., 2002).
Table 5.8 Station-wise summary statistics of Ac-OP (~gg-1) in sediment cores
Station Depth Min Max Mean SO %ofCV
0-2 38.88 279.78 170.95 94.67 55.38
2-4 30.17 291.67 157.74 91.30 57.88
Station 1 4-6 37.93 327.91 157.62 97.88 62.10
6-10 56.47 283.99 164.30 90.35 54.99
10-20 103.49 390.46 237.83 103.68 43.59
0-2 29.46 348.66 151.72 106.48 70.19
2-4 49.16 367.80 162.86 108.43 66.58
Station 2 4-6 43.66 431.74 149.76 149.49 99.82
6-10 60.22 483.31 195.41 150.49 77.01
10-20 70.59 491.53 171.13 159.86 I 93.42
0-2 52.30 146.27 93.63 38.52 41.14
2-4 34.87 156.76 84.65 40.08 47.35
Station 3 4-6 37.74 137.98 69.10 34.92 50.54
6-10 42.11 159.31 73.59 43.37 58.94
10-20 47.14 144.68 80.28 35.04 43.65
The Station-wise summary statistics of Ac-OP are given in Table 5.B. Both the
minimum Ac-OP 29.46\.1gg-\ (O-2cm),' and maximum Ac-OP, 491.53\.1gg-1, (10-20cm)
were recorded at Station 2. The annual and seasonal depth profiles of Ac-OP are
depicted in Fig. 5.7a-5.7d. Ac-OP showed generally a decrease in concentration
down the core. There was a reversal in this trend at depths beyond 10cm at Station 1
and 6-10cm depth at Station 2. At all Stations more or less similar values were found
during pre-monsoon and post-monsoon, but exceptionally high values recorded
during monsoon. The concentration of acid extractable organic phosphorus found to
217
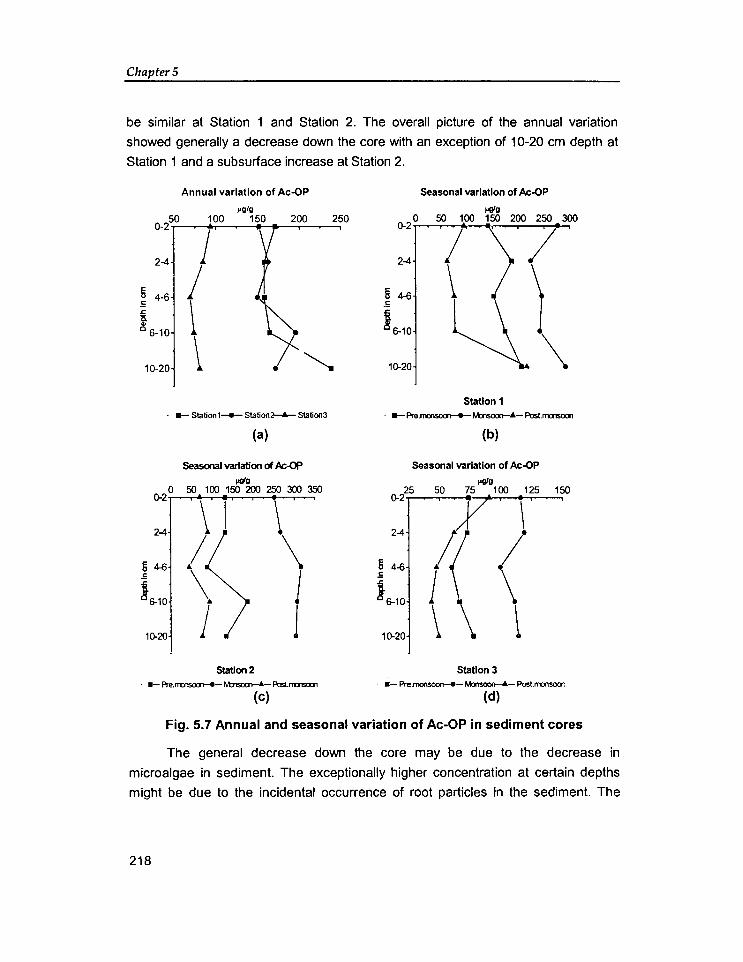
ChapterS
be similar at Station 1 and Station 2. The overall picture of the annual variation
showed generally a decrease down the core with an exception of 10-20 cm depth at
Station 1 and a subsurface increase at Station 2.
Annual variation of Ac-OP Seasonal variation of Ac-OP
",gig I9'g
~~l' r § 4-6 J ~ ~ Cl.
~ 6-10
\ 10-20
150 200 250
2-4
10-20
50 100 150 200 250 300
/
Station 1 . _ Station1 __ Station2---6- Station3 . .-Pre.mon~-Mons()()ll-l.- Post.mcnsoon
(a) (b)
Seasonal variation of k-C1fJ Seasonal variation of Ac-OP
I9'g I9'g 0 50 100 150 200 250 300 350 O-l5 50 75 100 125 150
0-2
\ I \ ) 2-4 2-4
I if g4-6 5 4-6 .5 \ j
.5
{\ \ ~6-10 16-10
j 1 ~ 10-20 10-20
Station 2 Station 3
. .-Pre.rn:ns0c.n-4- M::nsca>--A- Post.mnsocJ1 .-Pre.~-MonS()()l>-olo.- Post.monsoor.
(C) (d)
Fig. 5.7 Annual and seasonal variation of Ac-OP in sediment cores
The general decrease down the core may be due to the decrease in
microalgae in sediment. The exceptionally higher concentration at certain depths
might be due to the incidental occurrence of root particles in the sediment. The
218

Fractionation of Phosphorus in Sedimellt Cores
depths, at which remarkably higher concentrations were recorded, showed high
coefficient of variation (Table 5.8). Seasonal variations were found as against the
observation of Mesnage and Picot' (1995). The maximum concentrations were
recorded during monsoon may be associated with the productivity. During
monsoon season minimum Fe-IP recorded in the sediment which is the algal
available fraction. This observation supports the fact that Ac-OP at these Stations
were decided by the presence of microalgae.
Alkali soluble organic phosphate (Alk-OP)
NaOH extracts contain particularly humic compounds (Golterman, 1998). It
was observed by Baldwin, (1996) that the NaOH extractable phosphorus has some
inter-relation with the amount of phospholipids in the sediment. The phospholipids
in the sediment could be derived from algae, zooplankton, leaf litter or bacteria.
Phospholipid concentration has shown to give a good estimate of sedimentary
bacterial biomass (White et al., 1979). It has also been shown that NaOH can
extract a large proportion of the P associated with the bacteria, Psuedomonas
(Warra et al., 1993), a large portion of which was in the non-reactive form.
Therefore, it is possible that a. proportion of the P extracted by NaOH may have
been associated with sedimentary bacteria. Warra et al. (1993) stimulated bacterial
growth in sediments and found a correlation between bacterial biomass and the P
extracted by NaOH. In a study of polyphosphates in lake sediments it was found
that poly-phosphorus was detected only in samples in which bacteria containing
poly-phosphorus granules were present (Hupfer et al., 1995). Changes in bacterial
activity and biomass were directly related to the changes in the Alk-OP phosphorus
(extracted with 0.1 M NaOH and digested) and labile phosphorus pools in the
sediment and to the uptake and subsequent release of phosphate by the
sediments (Tornblom and Rydin 1998).
The concentrations of Alk-OP varied between 38.47 IJgg,1 (Station 3, 10-20)
and 728.46IJgg,1 (Station 1, 0-2 cm). The annual summary statistics (Table 5.9),
showed more consistent concentrations were recorded in 10-20 cm layer at Station
1, 0-2cm layer at Station 2 and Station 3. Seasonal and annual variations of Alk
OP in depth profile are given in Fig. 5.8a to 5.8d. Alk-OP showed general decrease
in concentiatioii down the CUI e. Contrary to this an increase in Alk-OP
concentration was observed at the sub-surface sediment of Station 2 during
pre-monsoon and post-monsoon. Generally low concentrations were recorded
219

ChapterS
during monsoon at all Stations. The concentrations during pre-monsoon and post
monsoon were close to each other. The surface sediment of Station 1 recorded
considerably high value during pre-monsoon. Minimum values were recorded at
10-20 cm depth at all Stations. The annual mean variations of Alk-OP are given in
Fig. 5.15. The overall picture of the annual variation followed the general pattern of
decrease down the core at Station 1 and Station 3. Station 2 showed an entirely
different picture of subsurface maximum and again decreases beyond 10cm depth.
Table 5.9 Station-wise summary statistics of Alk-OP (~g/g) in sediment cores
Station Depth Min Max Mean SD %ofCV
0-2 113.69 728.46 372.89 229.01 61.41
2--4 114.78 576.29 292.74 171.49 58.58
Station 1 4--6 124.41 678.57 316.43 198.45 62.72
6--10 122.51 410.70 266.62 106.96 40.12
10-20 118.04 354.08 263.98 97.55 36.96
0-2 127.36 380.94 277.32 102.82 37.07
2--4 116.14 490.76 301.48 147.85 49.04
Station 2 4--6 129.34 485.19 296.09 144.81 48.91
6--10 113.86 464.21 285.26 134.45 47.13
10--20 83.13 452.15 237.74 127.12 53.47
0-2 69.90 267.21 183.94 85.01 46.22
2--4 56.21 272.44 149.85 89.42 59.67
Station 3 4--6 45.91 235.55 138.64 68.39 49.33
6--10 47.58 232.57 133.42 67.23 50.39
10--20 38.47 331.43 139.97 103.31 73.81
Other than humic compounds, NaOH also extracted polyphosphates found
in bacterial biomass. Davelaar, (1993) recognized that poly-phosphates containing
bacteria probably are ubiquitous in nature and that poly phosphate metabolism
must be operative in sediments of aquatic environments. The bactarial biomass
seems to store poly phosphorus mainly when they live in an aerobic environment
and hydrolyse under anaerobic conditions (Comeau et al., 1986; Wentzel et al.,
1991). Therefore the general decrease in Alk-OP concentration may due to the
decrease in bacterial biomass down the core sediment. Bacteria! biomass
decreases with increasing sediment depth. (Gachter et al., 1988). Therefore it is
reasonable to infer that the poly-phosphorus content of sediment decreases quickly
220

Fractionation of Phosphorus in Sediment Cores
with increasing sediment depth and increasing redox potential. The maximum
concentration of Alk-OP was recorded at surface sediment of Station 1. This could
be due to an oxic environment in the surface sediment of Station 1, facilitating the
bacterial biomass to store polyphosphates in their cells.
Annual variation of Alk-OP I'II/g oJ 00 150 200 250 300 350 400
2~ ! 5 4-6 j i 6-10 1
~ 10-20
_ Slation1 __ Slation~ Station3
(a)
Seasonal variation of Alk-OP . I'QIg
o-iTOO __ ~~200.-~_300~~ __ 400.-~
! 6-10
10-20
Station 2 .• - Pre.rnonsoon-e-~- Post.monsoon
2~
§ 4-6 oS .c:;
! 6-10
10-20
Seasonal variation of Alk-OP I'QIg
200 300 400 SOO 600
Station 1 . _ Pre.mons()()(l--04-Mons~ Post.monsoon
2~
E u 4-6 oS .c:;
! 6-10
10-20
(b)
Seasonal variation of Alk-OP ~g/g
50 100 150 200 250 300
Station 3 . _ Pre.mons()()(l--04-Monsoo~ Post.monsoon
(c) (d) Fig. 5.8 Annual and seasonal variation of Alk-OP in sediment cores
Station 2 characterized by a subsurface increase in Alk-OP, suggest an oxic
environment existing till 6cms of depth. Beyond this depth, A1k-OP showed a
decreasing trend which may be due to anoxic conditions prevalent in this region.
221

ChapterS
Residual Organic Phosphorus (ROP)
The statiowise summary statistics of ROP are given in Table 5.10.
Comparatively less CV were observed in ROP concentrations, 2-4 cm layer at
Station 1, Station 3 and 10-20 cm layer at Station 2. The values found to vary from
2.61I-1gg-1 (Station 3, 4-6cm) to 345.51I-1gg-1 (Station 2, 2-4cm). The distribution of
ROP in sediment cores is given in Fig. 5.9a to 5.9d. ROP showed general decrease
in concentration with increasing depth. However at all three Stations a subsurface
increase was found. At Station 2 and Station 3 maximum recorded at 2-4 cm depth.
Mean variation of ROP is given in Table 5.10. Maximum concentrations were
recorded during monsoon at all Stations. Pre-monsoon and post-monsoon season
recorded similar concentrations at first two Stations. The overall picture of the annual
variation followed general pattern c f subsurface increase and decrease down the
core at Station 1 and Station 2. At Station 3 gradual decrease recorded on increasing
depth.
Table 5.10 Station-wise summary statistics of ROP (JJg g-l) in sediment cores
Station Depth Min Max Mean SD %ofCV
0-2 26.57 153.75 92.52 43.20 46.70
2--4 42.94 125.98 83.96 31.19 37.15
Station 1 4--6 41.68 141.23 77.68 36.32 46.76
6--10 48.30 142_02 80.05 34.56 43.17
10--20 46.97 148.73 73.93 39.40 53.29
0-2 46.81 201.64 84.13 59.28 70.46
2--4 51.00 345.51 118.07 113.28 95.94
Station 2 4--6 50.53 181.64 91.59 48.86 53.35
6--10 33_33 147.07 79.48 39.93 50.24
10--20 38.39 111.24 65.10 25.64 39.39
0-2 24.56 113.16 49.95 33.12 66.30
2--4 19.69 220.57 78.54 82.38 104.89
Station 3 4--6 2.61 166.90 I
60.19 64.80 107.65
6--10 14.12 126.62 45.55 43.13 94.69
10--20 16.29 172.44 49.68 60.45 121.69
222
I

Annual variation of ROP
I'OIg 25 50 75 100 125 150
0-2'-~*~-'--"""""r--~-r-~.,
2-4
10-20
_ Stationl_- Station2-&- Station3
(a)
Seasonal variation of ROP
~g/g
50 100 150 200 250 0-2 .--+-'It---.-~I;;r--___r-.---,
2-4
G 4-6 .5
i c 6-10
10-20
Station 2 . .- Pre.monsoon--e- Monsoon-.l.- Posl.monsoon
(c)
Fractiotlatiotl of Phosphorus it, Sedimetlt Cores
Seasonal variation at R<P ~g
0-225 50 75 100 125
I I
24 \ • I §4-6 •
.5 I 16-10
\ 10-20 .t; •
Station 1 . .-Pre.rronsocn-e- MJnsoon--.A.- Post.rralSOO1
(b)
Seasonal variation of ROP
~g/g
0-2 0 50 100 150
2-4
v( E u 4-6 .5 £i
!6-10
10-20
Station 3
. .-Pre.monsoon--e- Monsooo---A- Post.monsooo
(d)
Fig. 5.9 Annual and seasonal variation of ROP in sediment cores
The depth profile of residual organic fraction points to the probability of
sediment acting as a sink for phosphorus. The adsorbed phosphates concentrate
in subsurface sediment. The ROP fraction concentrates at 2-4 cm depth, followed
by 4-6 cm depth, at Station1 and Station 2. Station 3 showed a gradual decrease in
concentration may be due to the tidal regime at this site. Due to wave action finer
223

ChapterS
fraction of the sediment wash away and coarser particles settles down, which is
poor in adsorbing phosphate.
Sum offractions (ap)
~TP concentrations were found to vary between 296.70 I-Igg-' (Station 3,
10-20cm) and 2190.84I-1gg-' (Station 1, 10-20cm). The minimum at Station 1
recorded at a depth of 2-4cm (974.93I-1gg-') and maximum recorded at 10-20 cm
(2190.84I-1gg-') depth. While at Station 2 minimum (974.93I-1gg-') observed at 10-
20cm and maximum (2046.38I-1gg-') at 6-10cm depth. Station 3 recorded the
minimum (296.70l-lgg-') at 10-20 cm depth and maximum (1412.85.l-Igg-') at
0-2 layer. ~TP concentrations were similar at Station 1 and in Station 2. The annual
and seasonal depth distributions of ~TP are given in Fig. 5.10a to 5.10d. The overall
picture of the annual variation followed the general pattern of decreasing phosphorus
concentration with increasing depths at Station 1 and Staion 3, except at 10-20 cm
depth at Station 1 (Table 5.11). The ~TP concentrations exhibited comparatively
lower coefficient of variation in 0-2cm layer at Station 1, 2-4 cm layer at Station 2 and
10-20 cm layer at Station 3. Station 2 showed a subsurface maximum and the values
decreases down the core. Hawever at Station 1 and Station 2 there was a reversal in
the above trend at 10-20 cm depth and at 2-4 cm depth respectively.
In Septia Bay, Silva and Mozeto (1997) found in mangrove sediments, total
phosphorus concentrations varying from 170-270I-lgg-'. In the four different kinds of
mangrove sediments, investigated in French Guiana, Fabre et al. (1999) found, sum of
all fractions of phosphorus varied between 600-800l-lgg-'. In the three mangrove areas
observed in this study, the values can be considered as high, values range from
296.70 I-Igg-' to 2190.84l-1gg-'. Near1yall phosphate is expected to enter the sediments
in shallow lakes and marshes receiving a relatively large phosphorus input during the
loading phase (Espejo et al., 1999). The seasonal variation showed comparatively
higher values during post-monsoon at all Stations. Generally the ~TP concentrations
showed a decreasing trend during all seasons except at 10-20 cm depth at Station 1.
While at Station 2, a sub-surface increase in concentration of ~TP was recorded during
post-monsoon and pre-monsoon. Station 3 recorded a gradual decrease in
concentration of ~TP during all seasons.
224

Fractiollati011 of Phosphorus ill Sedimellt Cores
Table 5.11 Station-wise summary statistics of TP (J.1g g.1) in sediment core
Station Depth Min Max Mean SO %ofCV
0-2 959.60 1967.60 1590.51 361.05 22.70
2--4 951.40 1954.21 1407.45 339.56 24.13
Station 1 4--6 1051.25 1947.46 1400.67 331.74 23.68
6--10 1167.65 1922.13 1489.72 338.74 22.74
10--20 1082.08 2190.84 1693.82 428.92 25.32
0-2 1222.31 1819.23 1501.01 224.98 14.99
2--4 1449.45 1777.34 1648.05 122.67 7.44
Station 2 4--6 1420.68 1768.37 1564.90 137.63 8.79
6--10 1352.78 2046.30 1617.62 294.54 18.21
10--20 974.93 1823.74 1331.14 303.79 22.82
0-2 480.72 1412.85 847.28 320.82 37.87
2--4 452.55 759.70 599.81 118.03 19.68
Station 3 4--6 357.01 608.57 475.93 85.87 18.04
6--10 326.06 596.63 435.52 106.09 24.36
10--20 296.70 476.06 415.91 73.96 17.78
The lower concentration observed at Station 3 could be the reflection of the
different geographical and geomorphological location of this Station. This result also
suggests the existence of trapping mechanism for phosphorus in the mangrove
ecosystem. The existence of denser vegetation at Station 1 and Station 2 as
compared to Station 3 facilitates the trapping of nutrients discharged to this creek. It was observed by Silva et al. (1998) that 99% of total phosphorus (R.mangle trees
plus sediment) were present in sediments, again suggests a trapping mechanism in
mangrove sediments. The LTP concentrations at Station 2 were characterized by low
concentrations in surface sediment and relatively higher in sub-surface sediments.
The enrichment of P in sub-surface sediments may be due to the biogeochemical oxidation process occurring in this micro-environment (Silva et al., 1998; Scholander
et al., 1955). The minimum concentration observed at 10-20 cm depth may be due to
an anoxic environment, and is substantiated by the high concentration of dissolved inorganic phosphorus observed in pore water at this depth (Joseph, 2001). The
same observation was found in Yangtze estuary (Min et al., 2001). At Station1, 10-
20cm, sediment exhibited maximum concentration of LTP. It may be due to the less
mineralisation-taking place at this depth. In a comparative study undertaken to find
the anoxic decomposition in sediments Holmboe et al. (2001) found that dissolved
225

ChapterS
inorganic phosphorus (DIP) was released during anoxic decomposition in Wadden
sea sediment, but was retained in Bangrong mangrove sediment. Their study also
found that added excess DIP was efficiently taken up by the sediment particles and
primarily retrieved in the easily exchangeable and iron bound fractions and the
sediment was thus found to act as a phosphorus sink. The present investigation also
recorded maximum concentration of Fe-IP. Comparatively less Alk-OP recorded at
this layer also substantiate the fact that bacterial mil"leralization might be minimum at
this depth, at Station 1.
0-2
2-4
E u 4-6 .E .c:. 1i .. c 6-10
10-20
Annual variation of I TP 1'9lg
500 1000 1500
_ Station1_-Station~ Station3
(a)
Seasonal variation of I TP I'glg
0_~200 1400 1600 1800 2000 2200
2-4
~ 4-6
i c 6-10
10-20 •
Station 2 . _ Pre.mons~-Mons~ Post.monsoon
(c)
Seasonal variation of I TP I'9Ig
0-1000 1200 1400 1600 1800 2000 2200
"'J~ .c:.
!6-10
10-20
Station 1 . .-Pre.mon~-Mon~- Post.monsoon
(b)
Seasonal variation of I TP "gIg
450 600 750 900 1050
2-4
E· ~ 4-6 .c 1i
~ 6-10
Station 3 . __ Pre.monsoon--e-Monsoo~ Post.monsoon
(d)
Fig. 5.10 Annual and seasonal variation of ~TP in sediment cores
226

Fractiollatiolt of Pltosphonls ill Sedime1lt Cores
The depth profile of Station 3 showed an oxidized surface sediment, capable of
retaining phosphate and decreasing concentration down the core, showed prevalent
anoxic environment down the core. LTP concentrations were recorded, high in surface
(0-2 cm) sediments due to oxidation near or at the sediment water interface. It was found that the oxidative reactions would immobilize phosphorus and limit its availability
to autotrops and microheterotrops, with phosphorus being bound to non-reactive
metals, particularly as iron and manganese oxy hydroxides.
5.2.2 Comparative study on the distribution of phosphorus fractions
Phosphorus, an important nutrient in aquatic system, undergoes tremendous
chemical transformations during sedimentation. The comprehension of chemistry of
phosphate is a pre-requisite for the study of phosphorus cycle in aquatic
ecosystems. Hence a comparison of the various forms in which this entity remain in
sediment during diagenesis is very essential to find out the major process
governing P-cycle in this ecosystems. The concentrations of phosphorus forms
found at the three mangrove locations are summarised in Tables 5.12a and 5.12b.
They are expressed as annual mean concentrations of individual fractions and also
as percentage of total phosphorus. The sum of all fractions was designated as the
total phosphorus concentration (LTP). Station wise variations are presented below.
Station 1
At this Station, concentrations of Fe-IP fractions were recorded the maxilllum
concentrations. It was found to be the abundant fraction of phosphorus at all depths
and ranged between 345.68~gg·1 and 495.36~gg·1. W-OP recorded a minimum with values ranging between 7 .18~gg·1 and 13.28~gg·1. Other major fractions found were
Ca-IP (246.35~gg·1 and 362.04~gg·1) and Alk-OP (263.98~gg·1 to 372.89~gg·\ All
other fractions gave intermediate values to those of W-OP and Alk-OP (Table 5.12a).
Regarding the percentage of different fractions at Station 1, Fe-IP was found
to be the highest fraction at all depths and the percentage varied between 21.82
and 28.31. The minimum percentage was recorded for W-OP (0.48 - 0.84). Other
major fractions found at this Station were Ca-lP, which varied from 15.55% to
20.47%, and Alk-OP which varied from 14.22% to 21.35%. Fe-OP and Ca-OP amount to 6.8 - 10.6% and 6.08 - 21 % respectively. Ac-OP showed a variation of
9.75 to 12.82% at various depths. ROP concentrations were <10%. W-II-' and
W-OP fractions were the least extracted with a percentage 1.48 - 2.94% and 0.48
to 0.84% respectively (Table 5.12b).
227

I\)
I\)
CD
Ta
ble
5.1
2a A
nn
ual
mea
n c
on
cen
trat
ion
of
frac
tio
ns
of
ph
osp
ho
rus
J,19
9-1
Sta
tion
D
epth
W
-IP
W-O
P Fe
-IP
Fe-
OP
C
a-IP
C
a-O
P
0-2
14.3
0 11
.62
412.
12
187.
34
358.
83
131.
99
2--4
15
.98
7.18
42
5.06
12
8.57
29
8.88
91
.33
Sta
tion
1
4--6
17
.04
9.11
39
2.23
11
5.30
30
3.38
93
.64
6-1
0
26.2
0 13
.28
345.
68
107.
83
246.
35
333.
95
10
-20
42
.86
11.6
8 49
5.36
15
8.70
36
2.04
20
9.37
0-2
16.2
0 8.
65
427.
08
156.
71
266.
66
259.
49
2--4
20
.90
4.75
47
7.99
17
8.32
29
3.88
23
4.00
Sta
tion
2
4--6
26
.64
6.11
41
4.48
25
1.56
28
7.92
21
9.85
6--1
0 25
.96
8.90
42
2.49
14
4.90
44
2.21
16
4.98
10--
20
22.7
1 5.
35
282.
63
60.7
3 36
5.38
15
0.28
0-2
1.70
4.
23
102.
76
61.4
5 14
9.43
93
.95
2-4
2.
85
3.72
90
.73
44.7
4 87
.99
77.6
5
Sta
tion
3
4--6
4.
29
4.49
70
.52
32.3
5 61
.06
50.6
1
6--1
0 4.
48
6.44
52
.41
54.2
4 53
.95
99.1
5
10--
20
7.08
3.
15
58.6
9 27
.53
44.3
6 72
.47
--
Ac-
OP
Alk
-OP
RO
P
170.
95
372.
89
92.5
2
157.
74
292.
74
83.9
6
157.
62
316.
43
77.6
8
164.
30
266.
62
80.0
5
237.
83
263.
98
73.9
3
151.
72
277.
32
84.1
3
162.
86
301.
48
118.
07
149.
76
296.
09
91.5
9
195.
41
285.
26
79.4
8
171.
13
237.
74
65.1
0
93.6
3 18
3.94
49
.95
84.6
5 14
9.85
78
.54
69.1
0 13
8.64
60
.19
73.5
9 13
3.42
45
.55
80.2
8 13
9.97
49
.68
TP
1752
.56
1501
.43
1482
.43
1584
.26
1855
.75
1647
.95
1792
.25
1744
.01
1769
.59
1361
.04
741.
05
620.
71
491.
25
523.
23
483.
20
Q
~ &'"
t1l

I\)
I\)
et>
Tab
le 5
.12b
An
nu
al m
ean
per
cen
tag
e o
f fra
ctio
ns
of
ph
osp
ho
rus
Sta
tion
D
epth
W
-IP
W-O
P
Fe-
IP
Fe-
OP
C
a-IP
0-2
0.82
0.
66
23.5
2 10
.69
20.4
7
2-4
1.06
0.
48
28.3
1 8.
56
19.9
1
Sta
tion
1
4-6
1.15
0.
61
26.4
6 7.
78
20.4
7
6-10
1.
65
0.84
21
.82
6.81
15
.55
10-2
0 2.
31
0.63
26
.69
8.55
19
.51
0-2
0.98
0.
52
25.9
2 9.
51
16.1
8
2-4
1.17
0.
27
26.6
7 9.
95
16.4
0
Sta
tion
2
4-6
1.53
0.
35
23.7
7 14
.42
16.5
1
6-10
1.
47
0.50
23
.88
8.19
24
.99
10-2
0 1.
67
0.39
20
.77
4.46
26
.85
0-2
0.23
0.
57
13.8
7 8.
29
20.1
7
·2-4
0.
46
0.60
14
.62
7.21
14
.18
•
Sta
tion
3
4-6
0.87
0.
91
14.3
6 6.
59
12.4
3
6-10
0.
86
1.23
10
.02
10.3
7 10
.31
10-2
0 1.
47
0.65
12
.15
5.70
9.
18
-
Ca-
OP
A
c-O
P
7.53
9.
75
6.08
10
.51
6.32
10
.63
21.0
8 10
.37
11.2
8 12
.82
15.7
5 9.
21
13.0
6 9.
09
12.6
1 8.
59
9.32
11
.04
11.0
4 12
.57
12.6
8 12
.63
12.5
1 13
.64
10.3
0 14
.07
18.9
5 14
.06
15.0
0 16
.61
Alk
-OP
RO
P
21.2
8 5.
28
19.5
0 5.
59
21.3
5 5.
24
16.8
3 5.
05
14.2
2 3.
98
16.8
3 5.
11
16.8
2 6.
59
16.9
8 5.
25
16.1
2 4.
49
17.4
7 4.
78
24.8
2 6.
74
24.1
4 12
.65
28.2
2 12
.25
25.5
0 8.
71
28.9
7 10
.28
."
i:l ~ g. s g. ::t
~ ~ ].
Q ~ :;.
Vl ~ g. "' ::t .... ~
~ '"

ChapterS
AnnUIII mean distribution ,."
• 'NIP. WOP. F. IP _ F.cp_ OoIPD QoOP _ kOf' _ AIkOP_ ROP
Momooo ..... (a)
o 100 200 300 400 500 600
_ 'NIP. WOP. F.If' _ F.oF>. CIIIpD CIIOP _ 1Id:JP. NJa>. Ra'
(c)
Pre - monsoon ... o 100 200 300 400 500 600
_ 'MP. WOP_ felP _ f.cP_ CaOPD Cel P _ 1dJf>_ AIcOP_ ROP
(b)
Post - monsoon
"'" o 200 400 600 800
• 'NIP. '10>. FelP . 1'tIClP_ CelpD CIIOP _ NDl_ NJa>_ ID>
(d)
Fig. 5.11 Annual and seasonal variation of fractions of phosphorus at Station 1
The seasonal variations of different phosphorus species at this Station are
depicted in Fig. 5.11b - 5.11d. Generally Fe-lP, Ca-IP and A1k-OP were the more
abundant fractions extracted during the three seasons. During pre-monsoon, the
230

Fractionation of Phosphorus in Sediment Cores
above three fractions gave maximum concentrations at different depths. While Alk
OP was a maximum in 0-2 cm layer and 6-10 cm layer; Ca-OP was a maximum in
the 2-4 and 4-6 layers and Fe-IP was a maximum at the 10-20 cm layer. The
concentration of Fe-IP was comparatively higher than any other fraction during
post-monsoon.
The order of abundance of each phosphorus fraction, in the layers, 0-2, 2-4
and 4-6 cm were similar. Fe-IP was a maximum at all depths followed by Alk-OP,
Ca-lP, Ac-OP, Ca-OP, ROP, Fe-OP, W-IP and W-OP (Fig.5.11a). The 6-10cm
layer showed an order of abundance as follows. Fe-IP> Ca-IP> Alk-OP> Ca-OP>
Ac-OP> ROP> Fe-OP > W-IP > W-OP. At 10-20 cm layer the order found to be Fe
IP> Ca-IP > Alk-OP > Ac-OP > Ca-OP > Fe-OP > ROP > W-IP > Fe-OP.
Station 2
Similar to Station 1, Station 2 core sediments also were generally composed
of Fe-IP as the major fraction at all depths except at 6-10 and 10-20 cm depths.
Fe-IP at this Station ranged between 282.63I-1gg-1and 477.99I-1gg-1. W-OP recorded
minimum concentrations. (4.75I-1gg-1 to 8.901-199-\ Other major fractions at this site
were Ca-lP, which ranged from 266.66I-1gg-1 to 442.21I-1gg-1 and Alk-OP, which
ranged from 237.74I-1gg-1 to 301.481-199-1 (Table 5.12a).
The percentage of different fractions at Station 2 showed a similar trend as
the individual concentrations. Fe-IP fraction gave the maximum concentration in
surface layers. The 6-10 and 10-20 cm depths consist of higher amounts of Ca-IP.
W-IP fraction recorded minimum percentages at all depths. The other major
fractions, Alk-OP and Ca-lP, gave almost similar percentages except at 6-10 and
10-20cm depth. These fractions varied from 16.18 to 26.85% and 16.12 to 17.47%
respectively. The maximum percentage of Ca-IP was recorded at 10-20 cm depth.
Fe-OP and Ca-OP amounts to 4.46 - 14.42% and 9.32 - 15.75% respectively. Ac
OP showed a variation of 8.59 to 12.57% at various depths. The ROP recorded
<10%. The W-IP and W-OP fraction were the least extracted with a percentage
0.98 - 1.67% and 0.27 to 0.52% respectively. All these percentages were
comparable to that of Station 1. (Table 5.12b).
The annual and seasonal variation of fractions of phosphorus at Station 2
are given in Figs. 5.12a-12d
231

ChapterS
Annual .......an dlsbibutlon
___ WOP _ F ... _ F __ eo.PD c.oP _ AtOP_ AIoOP_ ROP
_ WlP. WOP_ F.tP _ ~_ c.lPC] c.op _ 1dJ>_ Mt.Of>_ RCf'
0-2
2-4
! ,
Pr. • monsoon ... 200 300 -400 500
_ VoIP . INOP_ FttP _~_~D~ _ 1dJ>_ IMP_ ROP
Post • monsoon .... o 200 400 600 800
1''' O-"§E=====--
10-20
_ WP_INOP_ FelP _ F.oP_ c.PC] c.op _ NO'_ MIOf'_ RCf'
Fig. 5.12 Annual and seasonal variation of fractions of phosphorus at Station 2
The seasonal distribution of various fractions at Station 2 also showed
variations. Ca·l? and A1k-Op were the two major fractions during pre--monsoon, while
Ca·1? and Fe-I? were the major fractions during monsoon. During monsoon, there
232

Fractionation of Phosphorus in Sediment Cores
was a considerable increase in Ca-OP at 0-2 and 2-4 cm depth. Similar to Station 1,
Fe-IP was the abundant fraction during post-monsoon, followed by A1k-OP.
The order of abundance of each fraction at the depths 0-2, 2-4 and 4-6cm layers were similar. Fe-IP was a maximum at these depths and was followed by AlkOP, Ca-lP, Ca-OP, Ac-OP, ROP, Fe-OP, W-IP, W-OP. At 6-10 and 10-20 cm layers, Ca-IP was the major fraction identified. These layers showed an order of abundance of Ca-IP > Fe-IP > A1k-OP > Ac-OP > Ca-OP > ROP > Fe-OP > W-IP > W-OP (Fig.5.12a).
Station 3
Fractionation of sediment cores at Station 3 gave an entirely different pattern as that of Station 1 and Station 2. The major fraction at this site was Alk-OP. This fraction showed a variation from 133.42IJgg-1 to 183.94IJgg-1. The minimum concentration fraction was also different from the other two Stations. Here W-IP showed minimum concentration at this site, which varied from 1.70lJgg-1 to 7.08IJgg-1. The other major fractions obtained were Fe-IP (52.41 to 102.76IJgg-1) Ca-OP (50.61 to 99.15IJgg-1) and Ac-OP (69.10 to 93.63IJgg-1) (Table 5.12a)
At Station 3, Alk-OP percentage was the maximum 24.14 - 28.97%, followed
by Ca-IP and Fe-lP, which were varied from 9.18 to 20.17% and 10.0 - 14.6%
respectively. The Ca-OP concentration amounts to a significant fraction at this site,
which varied from 10.3 to 18.95%. Ac-OP showed a similar percentage as that
Ca-OP which amounts to 12.60 - 16.61 %. Fe-OP concentration composed of
5.70-10.37% of total phosphorus. ROP, varied from 6.7 to 12.65% (Table 5.12b).
Seasonal distribution of different fractions of phosphorus at Station 3 are
given in Fig. 5.13b-5.13d. Certain seasonal variations were observed in
concentrations of major fractions. During pre-monsoon the abundant fraction
obtained was Alk-OP at all depths. Ca-IP arTd Ca-OP showed exceptionally high
values during this season. Ac-OP concentration was another major phosphorus
fraction extracted during monsoon season. However Alk-OP fraction was the major
phosphate fraction during post-monsoon, except at 0-2 cm layer. The Ca-IP
concentration recorded a maximum in this layer.
233

Chapter 5
o
___ WOf> _ _
_~_(;oIf>Cl~
_ I<d»' _ NJtO> _ _
la) Man.oon ...
50 100 150 200 250
___ WOP _ F.P _ F.OP_ c.PCJ c.op _ 1viDP_ .<.IoOP_ ROP
(c)
! • 1
Pr. - mon.oon
_WIP_ WOP_ '~P _ F __ c.JPc:J COOP _ ""J~ _ AIIdP _ ROP
(0) Post - monaoon ...
150 250 300
___ WOP. FeP
_F.oP C.PDc.OP _ Ad::F_ "loOP. ROP
(d)
Fig. 5.13 Annual and seasonal variation of fractions of phosphorus at Station 3
Various fraclions when arranged in their order of abundance al this Station,
showed that Alk-OP was the major fraction till10cm of depth. Ca-IP concentration
was the major fraction at 10-20 cm depth. The order of abundance for the various
fractions in 0-2cm and 2-4cm layers were Alk-OP > Ca-IP> Fe-IP> Ac-OP> Ca
OP> ROP> Fe-OP> W-OP>W-IP. The 4-6cm showed an order Alk-OP> Ca·OP>
Ac-GP> Ca-IP> RGP> Ca·GP> Fe-GP> W-OP>W-IP. The 6-10 cm showed an
order Alk-OP> Ca-OP> Ac-OP> Ca-IP> Fe-IP> ROP> Fe-OP> W-OP>W-IP. The
234

Fractiollatioll of PllOsp!tonlS ill Sedimellt Cores
10-20 cm layer showed an order Ca-IP> Ac-OP> Ca-OP> Fe-IP> ROP> Ca-IP>
Fe-OP> W-IP>W-OP in abundance (Fig. 5.13a)
The major phosphate forms identified in Cochin estuary are Ca- bound,
resistant organic, hydrolysable organic and Fe and AI bound phosphorus with
regional variability. The abundance of the above phosphorus forms points to the
presence of calcareous materials as well as terrestrial transfer of organic material
in the sediment facies (Balchand and Nair, 1994). It was also reported that,
irrespective of the season, the sediments of fresh water arms of the estuary
showed greater concentrations of Ca-bound phosphorus and resistant organic
phosphorus. While the sediment in waters of intermediate salinity was found to
bind hydrolysable as well as resistant organic forms of phosphorus, those in more
saline environment exhibited a preference for hydrolysable and for Fe or AI bound
phosphorus. The variations in the affinity of phosphorus forms are attributed to the
difference in estuarine chemical reactivity. During the present investigation Station
1 and Station 2 are more saline than Station 3, which lie more adjacent to
barmouth of Cochin estuary. The high saline area of this estuary exhibited a
preference for Fe/AI bound phosphates. Station 3 is of intermediate salinity and
showed a preference for hydrolysable organic phosphorus and calcium bound
organic phosphorus. The speciation of phosphorus in other mangrove ecosystems
also showed preferences of one form of phosphorus or the other with changing
salinity. Regarding the phosphate concentration in mangrove sediments, available
data are scares and there is a large variability among systems and methodology for
data acquisition. Comparison of concentration are difficult task because of
differential analytical technique are used for different speciation.
The major forms of phosphorus identified in Pichavaram (mangrove
ecosystem on the south east coast of India) surfacial sediments were ferric Fe
bound followed by authigenic calcium carbonate bound, exchangeable
phosphorus, detrital apatite and organic phosphorus (Ramanathan, 1997). The
above fractionation done using SEDEX method (Ruttenburg, 1992) was found to
be related to chlorinity variations in the waterways.
In a speciation of Bangrong (Thaiiand) mangrove sediment, Holmboe et al.
(2001) found the distribution as excha,-Igeable inorYd' ,;\, f./hosphul u::; (iP) 0.8-1.1 %,
Fe IP 24.8 -30.4%, adsorbed IP 9.3 -10.3%, humic phosphorus 13.0 - 18.7%, Ca
IP 15.9 - 25.3%, nonreactive phosphorus 12.6 - 15.9% and residual phosphorus
235

ChapterS
9.8 - 13.2%. Thus they found that Fe bound fraction was the abundant and the
exchangeable fraction was the smallest in Bangrong sediments. The present study
also found Fe-IP was the major fractions at Stations 1 and 2. The minor fraction,
W-OP/w-IP is the loosely bound or exchangeable fraction.
Speciation study in French Guianese mangroves by EDTA method', Fabre
et al. (1999) showed, Fe-IP concentrations varied from 34.6 to 61.2%; Ca-IP varied
from 9.3 to 19.6%; Ac-OP varied between 6.8% and 15.8% and ROP varied
between 11.8% and 40.5%. In this particular.
Seasonal variability of fractionation at Station 1 showed Alk-OP to be the
major fraction at 0-2cm depth during pre-monsoon. The Ca-IP was the major
fraction at 2-4 and 4-6 cm of depths. This phenomenon reflects the influence of
sewage into this creek since studies on sediments under the influence of untreated
sewage have revealed the major fractions to be organic and non-apatite
phosphorus (Carreira and Wagener, 1998) ..
Relatively low concentrations of Fe-IP at Station 1 during pre-monsoon
season reflect the anoxic conditions prevalent in sediment cores. Only at 10-20 cm
depth significant amount of Fe-IP was recorded. At this depth bacterial mineralizing
may be less due to decrease in bacterial density and phosphate was bind to fine
fractions of sediment mainly as Fe-IP. In a comparative study undertaken to find
the anoxic decomposition in sediments, (Holmboe et al., 2001) it was found that
dissolved inorganic phosphorus (DIP) was released during anoxic decomposition in
Wadden sea sediment, but was retained in Bangrong mangrove sediment. Since
the added excess DIP was efficiently taken up by the sediment particles and
primarily retrieved in the easily exchangeable and iron bound fractions and the
mangrove sediment was thus found to act as a phosphorus sink. Pre-monsoon
season showed comparatively high concentration of Alk-OP, which also indicated a
high bacterial biomass in sediments. Therefore the variation of phosphorus fraction
down the core at Station 1 may primarily depend up on bacterial mineralisation
during this season. 2-4, 4-6 and 6-10 cm of depth sediments experience anoxic
condition, which were reflected in the Fe-IP concentrations. This may be partly due
to the higher sulphate reduction due to higher bacterial biomass and subsequent
reduction of Fe-oxides by sulphides. It was well established tt,at the reduced Fe
oxides release of Fe-bound phosphate. The higher sulphate reduction caused a
decrease of Fe-bound phosphorus in Wadden sea sediment (Holmboe et al.,
236

Fractionatioll of PllOspllOrus ill Sedimellt Cores
2001). Bacterial dynamics and sedimentation events were reported to be factors
that affected the size of different phosphorus fractions in surfacial sediment in Lake
Erken, Sweden (Goedkoop and Pettersson, 2000). Another factor, which control
the Fe-lP, was salinity. The pre-monsoon season associated with higher salinity
decrease the sites for adsorption on Fe-oxides. Alkaline conditions, promoted by
sulphate reduction and or increased salinity, shift the charge of Fe-oxides from
positive to negative (Stumm and Morgan, 1981) reducing phosphorus adsorption.
During monsoon there was a sharp decrease in Alk-OP, at Station 1,
followed by an increase in Fe-IP. Monsoon flooding of the creek may dilute the
bacterial biomass, which in turn may reflect on Alk-OP. Also decrease in
temparature may reduce the bacterial activity. Another significant difference during
this season was the increase in Ac-OP fraction, which gives an estimate of the
phosphorus, which fixes on to the fresh organic material. This material may be
increasing during monsoon, which in turn increases the productivity of sediment.
The detritus, which carried through land run off, also may contain fresh organic
material. The significant increase of Fe-IP during post-monsoon, indicate an
aerobic environment down the core so that iron may be in Fe +3 oxidation state.
Even though the Alk-OP was the next abundant fraction during post-monsoon,
bacterial mineralistion may not take place in an aeorobic environment.
Station 2, also showed low concentrations of Fe-IP during pre-monsoon and
a substantial increase in concentration of Ca-IP. Both fixation of the inorganic
phosphate onto the sediments, and its release from sediments to the overlying
water, are controlled by the two mechanisms (Golterman, 1998): First, by
adsorption of dissolved orthophosphate (o-P) on to ferric hydroxide (goethite)
Fe(OOH).x H20 and second by precipitation with Ca2+ as apatite, Cas (P04h-OH,
probably as co-preCipitation with CaC03. Two factors that control the distribution of
phosphate between Ca-IP and Fe-IP are pH and water depths. With a more acid
pH, Fe-IP is at first dominant while Ca-IP become dominant only later. If the
phosphorus loading is high in shallower waters then, Ca-IP preCipitation starts
earlier (Golterman, 1998). pH values showed that an alkaline range recorded at
this Station, hence phosphorus loading may influence the distribution of
phosphorus between Fe-IP and Ca-IP. The adsorption on to Fe-oxides would be
reduced due to high salinity of core sedirnents. The salinity of pore waters too
found to increase down the core (Joseph, 2001). Similar to Station 1, the Alk-OP
237
C/lapter5
found to be the major fraction during pre-monsoon, which might be due to the
bacterial biomass present in the sediment. Unlike in Station 1, Station 2 exhibited
lower concentration of inorganic phosphates at 10-20 cm depth. Sediment texture
with increasing sand percentage was one reason of lowering of phosphates at this
depth. A study of phosphorus forms relating to sediment grain size and
geochemical characteristics in French coastal areas showed that the exchangeable
and Fe/AI phosphate were preferantially associated with the fine particles «63IJm)
in three studied areas (Andrieux and Aminot, 2001). In more sandy sediments
these forms were also found in significant correlation in the larger size classes. As
at Station 1 Fe-IP was the major fraction obtained during post-monsoon again
gives an indication of an oxic environment in sediment cores.
Seasonal variation of different fractions of phosphorus at Station 3 showed
maximum Alk-OP, followed by Ca-IP. At lower depths as this fraction increases all
other fractions decreased significantly. A large increase in Alk-OP at 10-20 cm
depth showed the high amount of humic bound phosphorus at this Station. An
increase in Fe-IP from pre-monsoon to post-monsoon found only for surface
sediments. This indicates an anoxic environment at the bottom sediments of this
Station. Since this Station· is characterized by sediments of large grain size,
adsorption of phosphate on· to particles might be less. It was found that the low
concentration of ortho phosphate in the water column favors its release from the
sediment into the water (Fabre, 1988; Golterman, 1995). In mangroves regularly
flooded by the tide, the repeated resuspension of the sediments caused by the
wave action can favor exchange of orthophosphate from the solid to the liquid
phases. The water movement or sediment resuspension have profound influence
on the concentration of orthophosphate in water column. Neverthless, the results
on the effects of res us pension upon ortho phosphate concentration in the water
column are opposed. Adsorption of phosphorus by resuspended sediments has
been recorded whereas the importance of resuspension in releasing phosphorus
also has been noted (Lijklema, 1977; Rippey, 1977). Therefore the relatively low
concentration of Fe-IP at Station 3, might be due to repeated phosphorus
desorption from the resuspended sediments.
It has been established that sediment characteristics could serve as the
basis to assume phosphorus species in sediments and ultimately predict potential
rates of internal phosphorus loading. For example Williams et al. (1976) found
238

Fractiollatioll of Phosphorus i" Sediment Cores
correlations between sediment characteristics and phosphorus species in 48
surfacial sediments from Lake Erie. Ostrofsky(1987) also found significant
correlations between iron and inorganic phosphorus species and between organic
matter and organic phosphorus in surfacial sediments collected from sixty-six lakes
in North Eastern America.
Table 5.13a Correlation matrix between different fractions of phosphorus in sediment cores - 0-2cm.
0-2 W-P Fe-P Ca-P Ac-OP Alk-OP ROP % sand %silt %Clay TOC Fe
W-P 1
Fe-P 0.9989'" 1
Ca-P .{).6182" .{).580S' 1
Ac-OP .{).9936'" .{).9978'" 0.S2SS' 1
Alk-OP .{).8S11'" .{).8749'" 0.1136 0.90S0'" 1
ROP .{).9982'" .{).9999'" 0.5693' 0.9986'" 0.881S'" 1
% sand .{).99S2'" .{).989S'" 0.6920" 0.9778'" 0.79S8'" 0.9874'" 1
%silt 0.9626'" 0.9488'" .{).8080'" .{).92S9'" .{).6772" .{).9444'" .{).984S'" 1
%Clay 0.9782'" 0.9869'" '{).4414 .{).9954'" .{).9417'" .{).9890'" .{).9S32'" 0.88S3'" 1
TOC 0.9993'" 0.996S'" .{).6462" .{).9889'" .{).8316'" .{).99S3'" .{).9981'" 0.9718'" 0.9700'" 1
Fe 0.9981'" 0.9941'" .{).66SS" .{).9848'" .{).8172'" .{).992S'" .{).9993'" 0.977S'" 0.963S'" 0.9997'" 1
p<O.05 p<O.01 p<O.001
W-p = W-IP+W-OP Fe -P = Fe-IP+Fe-OP Ca-P = Ca-IP+Ca-OP
Table 5.13b Correlation matrix between different fractions of phosphorus in sediment cores - 2-4cm.
2-4 W-P Fe-P Ca-P Ac-OP Alk-OP ROP % sand %silt %Clay TOC Fe
W-P 1
Fe-P 0.9787''' 1
Ca-P 0.1111 0.3127 1
Ac-OP .{).8623'" .{).9479'" .{).S992" 1
Alk-OP .{).8301'" .{).9271'" .{).64S9" 0.9982'" 1
ROP .{).99S9'" .{).9933'" .{).2007 0.9046'" 0.877S'" 1
% sand .{).9890'" ·.0.9983'" .{).2S70 0.9277''' 0.9037''' 0.9983'" 1
%silt 0.9850'" 0.9994'" 0.2807 .{).9366'" .{).9140'" .{).9966'" .{).9997'" 1
%Clay 0.9946'" 0.9947''' 0.2137 .{).91 02'" .{).8838'" .{).9999'" .{).9990'" 0.9976'" 1
TOC 0.9708'" 0.9994'" 03.41>1 .{).958S'" -O.~~OA"· -'\.9886··· ·0.C?<?56··· 0.9976'" 0.990S'" 1
Fe 0.9621'" 0.9976'" 0.3781 .{).9677''' .{).9509''' .{).9828'" .{).9919'" 0.9947'" 0.98S2'" 0.9994'" 1
239

ChapterS
Table 5.13c Correlation matrix between different fractions of phosphorus in sediment cores - 4-6cm.
4-6 W-P Fe-P Ca-P Ac-OP Alk-OP ROP % sand %sill %Clay TOC Fe
W-P 1
Fe-P 0.5200· 1
Ca-P 0.6411·· 0.9889··· 1
Ac-OP ~.6478·· ~.9876··· -1··· 1
Alk-OP ~.6607·· ~.9847··· -1"· 0.9999··· 1
ROP ~.3192 ~.9755··· ~.9320··· 0.9287··· 0.9222··· 1
% sand ~.0893 ~.8972·" ~.8217··· 0.8166··· 0.8066··· 0.9724··· 1
%sill 0.0511 0.8796··· 0.7992··· ~.7939"· ~.7834··· -0.9628··· -0.9993··· 1
%Clay 0.1402 0.9187··· 0.8498··· ~.8452·~· ~.8358··· ~.9831··· ~.9987··· 0.9960··· 1 I I
TOC 0.3182 0.9752··· 0.93168··· ~.9284··· ~.9218··· -1·" ~.9727··· 0.9630··· 0.9833'" 1
Fe 0.4757 0.9987··· 0.9800"· ~.9783··· ~.9746··· ~.9854···· ~.9186··· 0.9028'·' 0.9376'" 0.9853'" 1
Table 5.13d Correlation matrix between different fractions of phosphorus in sediment cores - 6-10cm.
6-10 W-P Fe -P Ca-P Ac-OP Alk-OP ROP % sand %silt %Clay TOe I
Fel
w-P 1 I I i
Fe -P 0.0177 1 !
Ca-P 0.5815 0.8237 1
Ac-OP -0.4614 -0.8952 -0.9901 1
Alk-OP -0.2379 -0.9754 -0.9285 0.9715 1
ROP -0.1841 -0.9860 -0.9067 0.9569 0.9985 1
% sand -0.2327 -0.9765 -0.9265 0.9702 0.9999 0.9988 1 I %silt 0.0432 0.9997 0.8379 -0.9063 -0.9807 -0.9899 -0.9817 1
%Clay 0.5172 0.8648 0.9970 -0.9980 -0.9543 -0.9364 -0.9527 0.8774 1 I
TOC 0.2030 0.9826 0.9147 -0.9624 -0.9994 -0.9998 -0.9995 0.9870 0.9430 1 i Fe 0.7697 0.6519 0.9669 -0.9215 -0.8031 -0.7691 -0.8000 0.6711 0.9445 0.781311 I
I
240

Fractiollatioll of PllOspllOrus ill Sedimellt Cores
Table 5.12e Correlation matrix between different fractions of phosphorus in sediment cores - 10-20cm.
10-20 W-P Fe -P Ca-P Ac-OP Alk-OP ROP % sand %silt %Clay TOC Fe
W-P 1
Fe -P 0.8807 1
Ca-P -0.0772 0.4042 1
Ac-OP -0.4014 -0.7873 -0.8822 1
Alk-OP -0.6268 -0.9211 -0.7285 0.9652 1
ROP -0.5509 -0.8805 -0.7895 0.9855 0.9956 1
% sand -0.8463 -0.9977 -0.4657 0.8276 0.9455 0.9108 1
%silt 0.9468 0.9863 0.2476 -0.6747 -0.8441 -0.7901 -0.9727 1
%Clay 0.5104 0.8568 0.8180 -0.9925 -0.9000 -0.9989 -0.89 0.7599 1
TOe 0.5900 0.9018 0.7598 -0.9764 -0.9989 -0.9989 -0.9292 0.8181 0.9955 1
Fe 0.8863 0.99993 0.3933 -0.7799 -0.9164 -0.8748 -0.9968 0.9882 0.8506 0.8966 1
The water extractable fraction showed significant positive correlation with
percentage of silt, clay, organic carbon, and Fe content in 0-2 and 2-4 cm layers
(Table 5.13 a and 5.13b). This shows that a large part of the exchangeable fraction
found as adsorbed phosphorus. The increase in silt and clay increases the surface
area of the sediment, facilitating the adsorption of phosphorus. The higher
percentage of W-IP at Station 1 and Station 2 may be due to the high amount of silt
and clay percentage at these sites. Relatively high percentage of W-OP than W-IP
at Station 3 also indicates that the adsorbed phosphate is less at this site.
The Fe-bound phosphorus was found as, positively correlated with
percentages of silt, clay, organic carbon and iron content at all depths except 6-10
cm layer. In this layer, positive relationship was found with percentage of silt and
organic carbon. The Fe/AI -P were significantly correlated with fine fraction of the
sediment in French coastal area (Andrieux and Aminot, 2001). It was well known that
clay, such as kaolinite, which is abundant in tropical sediments, is very efficient in
phosphate adsorption. This fraction showed a significant negative correlation with
acid extractable orgCl'lic phosphor..!~. ~0P, and ::,e~centage of sand at all depths.
241

ChapterS
No significant correlation was exhibited by Ca-bound phosphorus at 0-2, 2-4,
and 10-20 cm layers. At 4-6 and 6-10 cm layers this fraction was positively
correlated with total organic carbon and iron content and negatively correlated with
organic fraction. Although different phosphorus minerals, is formed in diagenetic
processes, can contribute to this fraction, apatite is the most important among them
(Petterson et al., 1988).
The size of the adsorbing particles has a strong relationship with the reactive
surface area of the sediment. But many biogenic carbonates have complex
physical structures, which would considerably reduce their reactive surface area
(Waiter and Morse, 1984). This will facilitate adsorption on to larger particle (Mc
Glathery et al., 1994). The same phenomenon was observed at north east Florida
Bay (Koch et al., 2001). It was also reported that (Andrieux and Aminot, 2001) that
Ca bound phosphate showed variable distribution over size classes and as a
function of sedimentary calcium. It was suggested that a significant correlation with
fine particles and calcium suggest a metamorphic origin of Ca-P while the absence
of correlation suggest a marine origin. The absence of correlation of concentrations
of Ca-IP with fine particles indicated a marine origin of calcium bound phosphorus
at these sites. Further more Ca-IP may of apatitic nature since its concentration
increases down the core, indicated an inability to resuspend.
The concentrations of Ac-OP showed a significant positive correlation with
other organic fractions, at all depths. A negative relationship was exhibited by this
fraction with percentages of silt, clay, organic carbon and iron content.
A significant or weak negative correlation showed with percentage of sand
with Alk-OP at all depths. This extract showed negative relationship with total
organic carbon, iron content and in some depths percentage of Clay. The presence
of high organic matter in the sediment increases the probability of iron getting
bound onto the humic matter (Selig and Schlungbaum, 2002). However no such
correlation was observed in the present study.
Correlation analysis showed that a similar mechanism governed the
phosphorus speciation at 0-2 and 2-4 cm layers. These layers remain oxygenated
layers at all seasons. The 4-6, 6-10 and 10-20cm layers may become anoxic and
this couid influence the amount of different species of phosphorus present.
242

Fractiollatioll of PllOSpllOnlS ill Sediment Cores
The annual mean concentrations of ~TP were similar at Station 1 (1482IJgg-1-
1855 IJgg-1) and at Station 2 (1361IJgg-1 - 1792 IJgg-1) but concentration were lower
at Station 3 (483IJgg-1_741IJgg-1). It reflects large spatial difference of phosphorus
due to different geographical and geomorphological locations. This result also
indicated a trapping mechanism is operating for phosphorus in the mangrove
ecosystem. At Station 1 and Station 2, denser vegetation was seen compared to
Station 3, which facilitates trapping of nutrients discharged to this creeks from nearby
systems. Also, Station 1 and Station 2 appear to be the sites with high
sedimentation. Therefore the causes of chemical differences among the first two
Stations and the third Station can ascribe to sedimentation, through which the
system can act as a sink of suspended matter. Fabre et al. (1999) found that the
difference in the major form of phosphorus at different mangrove sites in French
Guiana were due to the sedimentation pattern at each sites and also the ability of
these sites to function as a sink for suspended matter. At Station 1 bottom sediment
exhibited maximum concentration of ~TP, reflecting the capacity of retaining
phosphates by mangrove sediments. It was observed (Silva et al., 1998), that 99% of
total phosphorus was (R.mangle trees plus sediment) present in sediments,
suggesting a trapping mechanism. Station 2 is characterised by lower ~TP values in
surface and bottom sediments and higher values in subsurface sediments. The
enrichment of P in sub-surface sediments may be due to the biogeochemical
oxidation process occurring in this micro-environment caused by oxygen excreted
from the below ground roots as given by Silva et al. (1998) (Scholander et al., 1955).
A similar observation was reported from Yangtze estuary (Min et al., 2001). Wetlands
function as major sink for suspended particles. Low flow rates and vegetation
resistance enhance particle settling and associated particulate phosphorus. This
results in accretion of organic matter and the building of new soil material. Influences
of biotic processes like bioturbation, plant uptake and transpiration and root zone
decomposition are some factors which affect the mobilization of P in wetlands. The
order of abundance of each fraction at various depths gave an indication of
bioturbation at mangrove sites. At Station 1, the order of abundance was similar in
the first three layers, which indicated bioturbation at this site. Similarly, the identical
nature of the first three layers at Station 2 also indicated bioturbation at this site.
Unlike Station 1 and Station 2. core sediments at Station 3 recorded different order of
abundance. Station 3 is characterized by resistant organic fraction of phosphate,
which might be less labile than the other fractions.
243

ChapterS
Statistical Analysis - Analysis of Variance (ANOVA)
The data were analysed using three factor ANOVA between site, depth and
fractions. ANOVA was done using minimum, maximum and mean concentration of
each fraction. No significant differences were observed between depths (Table 5.14)
although there were significant differences between fractions and between stations.
Minimum value analyses showed significantly higher phosphorus concentration
at Station 1 followed by Station 2 and Station 3. Among fractions, Fe-IP had a
significantly higher value followed by Ca-lP, Alk-OP, Ac-OP. ROP, Ca-OP Fe-OP, W-IP
and W-OP. No significant differences were found between Fe-IP and Ca-IP (App. 23).
Maximum value ANOVA showed significantly higher values at Station 1
followed by Station 2 and Station 3. Regarding the fractions, the Fe-IP was
significantly higher followed by Alk-OP, Ca-lP, Ca-OP, Ac-OP, Fe-OP, ROP, W-IP
and W-OP. Almost equal concentrations were exhibited by Alk-OP and Ca-IP
(App.24).
Mean value AN OVA showed that Station 1 and Station 2 had significantly
higher concentration of phosphorus than Station 3. Regarding fractions, as in the
minimum and maximum values, Fe-IP showed significantly higher value followed
by Alk-OP. The fraction Ca-IP also showed significantly higher value followed by
Ca-OP, Ac-OP, ROP, W-IP and W-OP.
On the basis of the above analysis it appears that the sediments of the
studied area composed of Fe-IP fraction than any other fraction. The Ca-IP and the
Alk-OP fractions are next two major fractions.
5.3 CONCLUSION
Sequential fractionation techniques, providing an increased resolution of the
sediment phosphorus pool, can be a useful tool to quantify fluxes between
phosphorus forms and to improve our understanding of the processes and
mechanism affecting phosphorus dynamics in an aquatic system. The study on
vertical variation of phosphorus fractionation in sediments indicated that the
variation of phosphorus forms with depth was susceptible to multifactor influences
such as sedimentary environment, early diagenesis, grain sizes and anthropogenic
244

Fractiollatioll of Phosphorus ill Sedimellt Cores
activities. Depth profiles of P fraction were examined to provide information on P
diagenesis as a function of various storage forms.
Among the three mangrove areas investigated, its particular form of
phosphorus characterizes each site. The Fe-IP concentration exceeded any other
fraction at Station 1 and Station 2. However at Station 3, Alk-OP fraction gave
maximum values. High Fe-IP concentration suggest a rapid mineralization of
organic phosphorus and readsorption on Fe (OOH) during sediment resuspension.
Furthermore, as the relation between Fe-IP and bioavailable phosphorus is now
well established, a high potential productivity of the suspended sediments and
overlying water in these mangrove systems are anticipated.
Sum of phosphorus fractions were similar at Station 1 (1482~g g.1 - 1855 ~g g.l) and at Station 2 (1361~g g.1 - 1792 ~g g.l) but concentration were Ic.wer at
Station 3 (483~g g-I_7 41 ~g g-\ It reflects large spatial difference of phosphorus
due to different geographical and geomorphological locations. These results
indicated the occurrence of trapping mechanism for phosphorus in the mangrove
ecosystem. The denser vegetation seen at Station 1 and Station 2 (as compared to
Station 3) facilitates trapping of sediment and nutrients discharged to these creeks
from nearby systems.
The maximum concentration of sum of all fractions recorded at different
depths at different Stations. At the Station 1, 10-20 cm depth, at Station 2, sub
surface sediment and at Station 3, 0-2 cm layer recorded maximum values. The
accumulation of phosphorus in bottom sediments at Station 1 might be due to the
phosphate retaining capacity of this sediment. The enrichment of phosphorus at
Station 2 in sub-surface sediments may be due to the biogeochemical oxidation
process occurring in this micro-environment caused by oxygen excreted from the
below ground roots. The retaining capacity of phosphate in bottom sediments of
Station 2 was found to be less than that of Station 1. This difference might be
attributed to the difference in textural facies of bottom sediments of Station 1 and
Station 2. The relatively low concentration in surface sediments at both Stations
may be resulted from repeated phosphorus desorption from resuspended
sediments to the coastal water.
W-IP, the .:.",;;i:y exchai-,gaable fraction in the sediment showed a general
increase in concentration with increase in depth except at Station 2 beyond 10 cm
depth. The general increase may be attributed to the elevated phosphate levels in
245

ChapterS
interstitial water of the sediment. Desorption of phosphorus into pore water may be
attributed to the anaerobic conditions prevail in the bottom layers of the sediment.
Unlike W-IP, WOP fraction showed a general decrease with increasing depth. The
increase in W-OP may associate with the presence of live sediment bacteria. The
Fe-IP fraction showed general decrease down the core at these Stations except at
Station 2, where a subsurface maximum was recorded. Seasonal variations in
FE-IP were found at three stations with maximum during post-m on soon and
minimum recorded during pre-monsoon at all three stations. The Fe:P ratio in
sediments found to vary from 9.08 (Station 3) to 14.26 (Station 1). Thus, based on
these ratios, the sediments had a high capacity for binding phosphate to iron.
Unlike the inorganic fraction the concentrations of Fe-OP were similar during three
seasons other than the exceptionally higher values at Station 2. The maximum
value of Fe-OP, recorded at Station 2, 4-6 cm layer may be due to the incidental
presence of some plant or animal debris. The concentrations of Ca-IP showed an
erratic behavior down the core at Station 1 and Station 2. The overall picture of the
annual variation followed the general pattern at Station 3 with decreasing
concentration down the core. Station 1 decreasing trend down the core except at
10-20 cm depth was noticed. While at Station 2 showed an increasing trend down
the core with an exceptionally high value at 6-10 cm depth. Variation of Ca-IP in
the study area confirmed the influence of sediment texture in its distribution. Ca-OP
concentration showed a decrease with the increase in depth except at 6-10 cm
depth. The Ac-OP fraction exhibited a general decrease in concentration down the
core. A reversal of this trend was observed at depths beyond 10 cm at Station 1
and 6-10 cm depth at Station 2. The Ac-OP fraction mainly consisted of fresh
organic matter, which decreases with increasing depth. The exceptionally high
values recorded at 6-10cm depth at Station 2 may be due to occasional presence
of root particles in sediment core.
Alk-OP generally decreases down the core except at Station 2 where a
subsurface increase was found. NaOH, extract the humic bound phosphates and
poly phosphates associated with bacteria. Therefore the general decrease down
the core may be attributed to the decrease in bacterial biomass with increase in
sediment depth. The marked subsurface increase in Alk-OP at Station 2 may be
associated with the oxic environment prevalent at this Station. Generally ROP
concentration showed a decrease down the core. However the ROP fraction found
to concentrate in subsurface sediment at Station 2 and Station 3.
246

Fracti01lati01l of Phosphorus i1l Sedime1lt Cores
Seasonal changes in the chemical characteristics of phosphorus fractions in
sediment cores might be due to difference in bacterial biomass, oxic or anoxic
environment prevalent in sediment and different adsorption capacity of textural
facies. Alk-OP was the major fraction during pre-monsoon at Station 1, which
indicated an impact of untreated sewage into the creek. The subsequent increase
in bacterial biomass in sediment during this season caused an anoxic environment,
might due to the higher sulphate reduction. This resulted in reduction of Fe-oxides
and subsequently the release of Fe-bound phosphate occurs. The monsoon
flooding dilute the bacterial biomass and an increase in Fe-bound phosphorus
occurred and maximum Fe-lP, recorded during post-monsoon.
Station 2, also showed low concentration of Fe-IP during pre-monsoon and a
substantial increase in concentration of Ca-IP. The increase in salinity during this sea~on
decreased the phosphate adsorption onto Fe-oxides in sediment. Hence precipitation on
to Ca +2 might be a more favorable process occurred. The increase in salinity of pore
waters with increase in depth also supports the above conclusion. Generally, Fe-bound
phosphorus was the major fraction of phosphorus, at Station 1 and Station 2. However at
depths beyond 6cms, Station 2, recorded a major fraction of Ca-IP.
Analysis of Variance showed that core sediments at Station 1 and Station 2
composed of significantly higher LTP concentration than at Station 3. The Fe-IP
concentration recorded significantly higher concentration than any other fraction.
However the concentrations of Alk-OF and Ca-IP also observed as significant
fractions next to Fe-IP.
References
Alongi, D.M., Boto, K.G. & Robertson, A.I. 1992 Nitrogen and Phosphorus Cycles. in
Tropical Ecosystems (Robertson, A.I. & Alongi, D.M., eds). Co~stal Estuarine
Studies 41, American Geophysical Union, Washington, D.C., 251-292.
Alongi, D.M. 1991 The role of intertidal mud banks in the diagenesis and export of
dissolved and particulate material from the Fly Delta, Papua New Guinea.
Journal Experimental Marine Biology and Ecology 149, 81-107.
Alongi. D.M. 1994 T~o r0!e of bc-:::~eria in nutrient cycling in tropical mangrove and
other coastal benthic ecosystem. Hydrobiologia 285,19-32.
247

ChapterS
Alongi, D.M. 1996 The dynamics of benthic nutrient pools and f1uxes in tropical
mangrove forest. Journal of Marine Research 54, 123-148.
Alongi, D.M. 1988 Bacterial productivity and microbial biomass in tropical
mangrove sediments. Microbial Ecology 15,59-79.
Alongi, D.M., Sasekumar, A., Tirendi, F. & Dixon, P. 1998 The influence of
standage on benthic decomposition and recycling of organic matter in
managed mangrove forests of Malaysia. Journal Experimental Marine
Biology and Ecology 225, 193-217.
Andrieux-Loyer, F. & Aminot, A. 2001. Phosphorus Forms related to sediment grain
size and geochemical characteristics in French coastal areas. Estuarine,
Coastal and Shelf Science 52, 617-629.
Atkinson, M.J. 1987 Low phosphorus sediments in a hyper saline marine bay.
Estuarine, Coastal and Shelf Science 24,335-347.
Balchand, A.N. & Nair, S.M. 1994 Fractionation of phosphorus in the sediments of
a tropical estuary. Env;ronmental Geology 23,284-294.
Baldwin, S.D. 1996 The phosphorus compounds in a diverse series of Australian
sediments. Hydrobiologia 335, 63-73.
Bostrom, B., Anderson, J.M., Fleischerand, S. & Janson, M. 1988 Exchange of
phosphorus across the sediment-water interface. Hydrobiologia 170, 229-244.
Boto, K.G. 1988 The phosphorus cycle. In Mangrove Microbiology (Agate, AD.,
Subramanian, CV. & Vanucci, M., eds). UNDEP/UNESCO regional project
(RAS/86/1988), New Delhi, pp. 85-100.
*Boyle, EA, Collier, R, Dengler, A.T., Edmond, J.M., Ng, A.C. & Stallard, RF.
1974 On the chemical mass-balance in estuarie~. Geochimica et
Cosmochimica Acta 38,1719-1728.
Boyle, E.A., Edmond, J.M. & Sholkovitz E.R 1977 The Mechanism of iron removal
in estuaries. Geochimica et Cosmochimica Acta 41, 1313-1324.
Brunskill, G.J., Zagorskis, I. & Pfitzner, J. 1998 Carbon burial rates in sediments of
the Herbert River region of the Great Barrier Reef continental shelf, Nort~
Queensland, Australia. In CO2 Fixation and Storage in Coastal Ecosystems,
248

Fractiollatioll of PJlOsphonls ill Sedimfllt Cores
Phase 1 collected reports Report 4 (Ayukai, T., ed.). Australian Institute of
Marine science, Townsville, pp 1-20.
Carreira,-RS. & De-L.RWagener,-A. 1998 Speciation of sewage derived
phosphorus in coastal sediments from Rio de Janeiro, Brazil. Marine Pollution
Bulletin 36, 818-827
Chang, S.C. & Jackson M.L. 1957 Fractionation of soil phosphorus. Soil science
84,133-144.
Chester, R 2000 Sediment Interstitial Waters and Diagenesis. In Marine
Geochemistry. 11 Edition. Blackwell Science, pp 357-404.
Clough, B.F., Boto, K.G. & Attiwill, P.M. 1983 Mangrove and Sewage: a re-evaluation.
In Tasks for vegetation science, Vol. 8. (Teas, H.J., ed.) Dr. W. JL'lk Publishers,
The Hague. (17), 151-161.
Comeau, Y., Hali, K.J., Hanrock, RE.W. & Oldham, W.K. 1986 Biochemical model
for enhanced biological phosphorus removal. Water 20,1511-1521.
Crosby, SA, Millward, G.E., Butler, E.I., Turner, D.R, Whitfield, M. 1984 Kinetics
of phosphate adsorption by iron oxyhydroxides in aqueous system.
Estuarine, Coastal and Shelf Science, 257-270.
Davelaar, D. 1993 Ecological significance of bacterial polyphosphate metabolism in
sediments. Hydrobiologia 253,179-192.
*De Graft Bierbrauwer-Wiirtz, I.M. & Golterman, H.L. 1989 Fosfaatfracties in de
bodem van een aantal Nederlandse meren. (in Dutch, with English
summary). H20: 411-414.
De Groot, C.J. & Golterman, H.L. 1990 Sequential fractionation of sediment
phosphate. Hydrobiologia 192, 143-149.
De Groot, C.J. & Golterman, H.L. 1993 On the presence of organic phosphate in
some Camargue sediments: evidence for the importance of phytate.
Hydrobiologia 252, 117-126.
De Groot, K.J. & Fabre, A.C. 1993 The impact of desiccation of a freshwater marsh
(G8rrin <>s Nord. Camargue, France) on the sediment-water-vegetation
interactions. Part 3: The fractional composition and the phosphate
adsorption characteristics of the sediment. Hydrobiologia 252,105-116.
249

ChapterS
De Haan, H. 1992 Impacts of environmental changes on the biogeochemistry of
aquatic humic substances. Hydrobiologia 229,59-71.
De Jonge, V.N. & Villerius, L.A 1989 Possible role of carbonate dissolution in
estuarine phosphate dynamics. Limnology and Oceanography 34, 332-340.
De Kanel, J. & Morse, J.W. 1978 The chemistry of orthophosphate uptake from sea
water on to calcite and aragonite. Geochimica et Cosmochimica Acta 42,
1335-1340.
DePinto, J.v., Young, T.C., Martin, S.C. 1981 Algal available phosphorus in
suspended sediments from lower Great Lakes tributaries. Journal of Great
Lakes Research 7,311-325.
Espejo, D.A., Serrano, L., TOja, J. 1999 Changes in sediment phosphate
composition of seasonal ponds during filling. Hydrobiologia 392, 21-28.
Fabre, A 1988 Experimental studies on some factors influencing phosphorus
solubilization in connection with drawdown of a reservoir. Hydrobiologia 159,
153-158.
Fabre, A.C. 1992 Inorganic phosphate in exposed sediments of the river Garonne.
Hydrobiologia 228, 3742.
Fabre, A., Fr. Fromard & Trichon, V. 1999 Fractionation of phosphate in sediments
of four representative mangrove stages (French Guiana). Hydrobiologia
392,13-19
Fabre, A, Qotbi, A., Dauta, A. & Baldy, V. 1996 Relation between algal available
phosphate in the sediments of the river Garrone and chemically determined
fractions. Hydrobiologia 335, 43-48.
Francko, D.A. 1986 Epilemnetic phosphorus cycling: influence of humic materials
and iron on coexisting major mechanisms. Canadian Journal of Fisheries
and Aquatic Sciences 43,302-310.
Froelich, P.N., Klinkhanmu, G.P., Beudu, M.L., Luedtke, N.A., Heath, G.R., Cullen, D.,
Dauphion, P., Hanmond, D., Hartman, B. & Maynard, V. 1979 Early oxidation of
organic matter in pelagic sediments of the eastem equatorial Atlantic: suboxic
diagenesis. Geochimica et Cosmochimica Acta 43,1075-1090.
250

Fractiollatioll of Phosphorus in Sediment Cores
Gachter, R.J., Meyer, J.S. & Mares, A. 1988 Contribution of bacteria to release and
fixation of phosphorus in lake sediments. Limnology and Oceanography 33,
1542-1558.
Goedkoop, W. & Petterson, K. 2000 Seasonal changes in sediment phosphorus
forms in relation to sedimentation and benthic bacterial biomass in Lake
Erken. Hydrobiologia 431 : 41-50.
*Golterman H.L. & Sooman, A. 1988 Sequential extraction of iron-phosphate and
calcium phosphate from sediments by Chelating agents. Verh. Int. Ver.
Limonol. 23, 904-909.
Golterman, H.L. 1995 The labyrinth of nutrient cycles and buffers in wetlands:
results based on research in the CamarGue (Southern France).
Hydrobiologia 315, 39-58.
Golterman, H.L. 1996 Fractionation of sediment phosphate with chelating
compounds: a simplificaiion and comparison with other methods.
Hydrobiologia 335, 87-95.
Golterman, H.L. 1998 The distribution of phosphate over iron-bound and calcium
bound phosphate in stratified sediments. Hydrobiologia 364,75-81.
Golterman, H.L., Paing, J., Serrano, L. & Gomez, E. 1998 Presence of and
phosphate release from polyphosphates or phytate phosphate in lake
sediments. Hydrobiologia 364,99-104.
Greenwood, N.N. & Earnshaw, A. 1C97 Phosphorus. In Chemistry of the Elements.
Pergamon Press, New York, pp. 545-555.
Hedges, J.I., Clark. WA & Cowie G.L. Cowie. 1988 Organic matter sources to the
water column and surficial sediments of a marine bay. Limnology and
Oceanography 33, 1116-1136.
Hedley, M.J., Stewart, J.W.S. & Chauhan S.S. 1982 Changes in inorganic and organic
soil phosphorus fractions induces by cultivation practices and by laboratory
incubations. Soil Science Society of America Jouma/46, 970-976.
Hesse, P.R. 1963 Phosphorus relationships in mangrove swamp mud with
particular reference to aluminium toxicity. Plant and soil 19, 205-218.
251

ChapterS
Hieltjes, A.H.M. & Lijklema, L. 1980 Fractionation of inorganic phosphates in
calcareous sediments. Journal of. Environmental Quality 9,405-407.
Holmboe. N., Kristensen, E. & Anderson, F.O. 2001 Anoxic Decomposition in
sediments from a tropical mangrove forest and the temperate Wadden sea;
implications of Nand P addition experiments. Estuarine, Coastal and Shelf
Science 53,125-140.
*Hupfer, M. & Uhlmann, D. 1991 Microbially mediated phosphorus exchange
across the mud-water interface. Verh 'Internat Verein Limnol 24, 2999-3003.
Hupfer, M., Gachter, R & Rugger, H. 1995 Polyphosphate in lake sediments: 31 p NMR
spectroscopy as a tool for its identification. Limnologyand Oceanography 40,
610-617.
*Ingraham J.L., Maaloe, O. & Neidhardt, F.C. 1983 Growth of the Bacterial Cell,
Sinauer, Sunderland, 435 pp.
Istvanovics. 1988 Seasonal variation of phosphorus release from sediments of
shallow lake Balaton. Water Research 22,1473-1481.
Jensen, H.S. & Thamdrup, B. 1993 Iron-bound phosphorus in marine sediments as
measured by bicarbonate-dithionate extraction. Hydrobiologia 253, 47-59.
Jensen, H. S. & Anderson, F.O. 1992 Importance of temparature, nitrate and pH for
phosphate release from aerobic sediments of four shallow eutrophic lakes.
Limnology and Oceanography 37,577-589.
Jensen, H.S., McGalathy, K.J., Marino, R & Howarth, RW. 1998 Forms and
availability of sediment phosphorus in carbonate sand of Bermuda seagrass
beds. Limnology and Oceanography 43, 799-810.
Jones, RI., Shaw, P.J. & De Haan, H. 1993 Effects of dissolved humic substances
on the speciation of iron and phosphate at different pH and ionic strength.
Environmental Science and Technology 27,1052-1059.
Joseph, P.M. 2001 Distributional characteristics of phosphate and some trace
metals in the interstitial waters of riverine, estuarine, and mangrove systems.
M.Phil. dissertation submitted to Cochin University of Science and
Technology, Cochin 16, 49pp.
252

Fractionatio1l of Phosphorus in Sedime1lt Cores
Kairesalo, T., Tuominen, T., Harikainen, K. & Rankinen, K. 1995 The role of
bacteria in the nutrient exchange between sediment and water in a flow
through system. Microbial Ecology 29,1219-144.
Kitano, Y., Okumara, M. & Idogaki, M. 1978 Uptake of phosphate ions by calcium
carbonate. Geochemicaljourna/12, 29-37.
*Kouwe, FA & Golterman, H.L. 1976 Rol van bodemfosfaten in het
eutrophieringsproces. (In Dutch) H20 9, 84-86.
Koch, M.S., Benz, RE. & Rudnick, D.T. 2001 Solid phase phosphorus pools in
highly organic carbonate sediments of Northeastern Florida Bay. Estuarine
Coastal and Shelf Science 52, 279-291.
Kristensen, E. 1990 Characterization of biogenic organic matter by stepwise
thermogravimetry (STG). Biogeochemistry 9, 135-159.
Kristensen, E., Jensen, M.H., Banta, G.T., Hansen, K., Holmer, M. & King, G.M.
1998 Transformation and transport of inorganic nitrogen in sediments of a
Southeast Asian mangrove forest. Aquatic Microbial Ecology 15,165-175.
Lijklema, L. 1977 The role of iron in the exchange phosphate between water and
sediments. In Interactions between sediments and freshwater (Golterman,
H.G., ed). Dr. W. Junk Publishers, The Hague: 313-317.
Lopez, P., Uuch, X., Vidal, M. & Morgui, J.A. 1996 Adsorption of phosphorus on
sediments of the Balearic Islands (Spain) related to their composition.
Estuarine, Coastal and Sheff Science, Coastal and Shelf Science 42,185-196.
Mc Glathery, K.J., Mariand, R, Howarth, RW. 1994 Variable rates of phosphate
uptake by shallow marine carbonate sediment: Mechanisms and ecological
significance. Biogeochemistry 25,127-146.
Mesnage, V. & Picot, B. 1995 The distribution of phosphate in sediments and its
relation with eutrophication of a mediterranian coastal lagoon. Hydrobiologia
297,29-41.
Mesnage, V., Bonneville, S., Laignel, B., Lefebvre, D., Dupont, J.P. & Mikes, D.
2002 Filling of a wet land (Seine estuary, France): natural eutrophication or
anthropogenic processes? A sedimentological and geochemical study of
wetland organic sediments. Hydrobiologia 475/476, 423-435.
253

Min, L., Shiyuan, X., Lijun, H. & Dongni, O. 2001 Phosphorus forms in sediments
and their distribution in the Yangtze estuary and coastal areas. Marine
Science Bulletin 3, 55-62.
*Morel, F.M.M. & Hering, J.G. (eds) 1993 Principles and applications of Aquatic
Chemistry, John Wiley and Sons, Inc., New York.
Morse, J.W. 1986 The surface chemistry of calcium carbonate minerals in natural
waters: An overview. Marine Chemistry 20,91-112.
Noges, P. & Kisand, A. 1999 Horizontal distribution of sediment phosphorus in
shallow eutrophic lake Vortsjarv (Estonia). Hydrobiologia 408/409,167-174.
Ostrofsky, M.L. 1987 Phosphorus species in the sacrificial sediments of lakes of
Eastern North America. Canadian Journal of Fisheries and Aquatic Sciences
44, 960-966.
Paludan, C. & Morris, J.T. 1999 Distribution and speciation of phosphorus along a
salinity gradient in intertidal marsh sediments. Biogeochemistry 45, 197-221.
Pardo, P., Lopez-Sanchez, J.F. & Rauret, G. 1998 Characterisation, validation and
comparison of three methods for the extraction of phosphate from
sediments. Analytica Chimica Acta 376,183-195.
Petterson, K., Bostrom, B. & Jacobsen, O.-S. 1988 Phosphorus in sediments
specification and analysis. Hydrobiologia 170, 91-101.
*Patrick, W.H. & Mahapatra, I.C. 1968 Transformation and availability to rice of
nitrogen and phosphorus in waterlogged soils. Advances in Agronomy 20,
323-359.
Ramanathan, A.L. 1997 Sediment characteristics of Pichavaram mangrove
environment, south east cost of India. Indian Jornal of Marine Sciences 26,
319-322.
Reddy, K.R., Kadlec RH, Flaig, E. & Gale, P.M. 1999 Phosphorus retention in
streams and wetlands: A review. Critical. Rev. Environmental Science and
Technology 29, 1-64.
Rlppey, B. 1977 The behaviour of phosphorus and ;;ilicon in unJi:'~ul u~d core:; UI Lough Neagh sediments. In Interactions between sediments and freshwater
(Golterman, H.L., ed). Or. W. Junk Publishers, The Hague: 348-353.
254

Fractionatioll of Phosphonls ill Sediment Cores
Ruttenburg, K.C. 1992 Development of sequential extraction method for different
forms of phosphorus in marine sediments. Limnology and Oceanography 37,
1460-1482.
Ruttenburg, K.C. & Berner, RA 1993 Authigenic apatite formation and burial in
sedimentsfrom non-upwelling continental margin environments. Geochimica
et Cosmochimica Acta 57, 991-1007.
Scholander, P.F., Van Dam, L. & Scholander, S.1. 1955 Gas exchange in the roots
of mangroves. American Journal of Botany 42, 92-98.
Selig, U. & Schlungbaum, G. 2002 Longitudinal patterns of phosphorus and
phosphorus binding in sediment of a low land lake-river system.
Hydrobiologia 472,67-76.
Siljestrom, PA & Clemente, L.E. 1990 Geomorphology and soil evolution of a
moving dune system in South-West Spain (Donana National Park). J. Arid
Envir. 18, 139-150.
·Silva, CAR, Lacerda, L.D., Silva, L.F.F. & Rezende, C.E. 1991 Forest structure
and biomass distribution in a red mangrove stand, Septia Bay, Rio de
Janeiro. Revista Brasileira de Botanica 14, 21-25.
Silva CAR & Mozeto, AA 1997 Release and retention of phosphorus in
mangrove sediments: Sepetiba Bay, Brazil In Mangrove Ecosystem Studies
in Latin America and Africa (Kjerfve, B., Lacerda, L.D. & Diop, E.H.S., eds).
United Nations Educational Publisher, The Hague, 179-190.
Silva, CAR, Mozeto, AA & Ovalle, A.RC. 1998 Distribution and fluxes as
macrodetritus of phosphorus in red mangroves, Sepetiba Bay, Brazil.
Mangroves and Salt Marshes 2,37-48.
Silva CAR & Sampio, L.S. 1998 Speciation of phosphorus in a tidal flood plain
forest in the Amazon estuary. Mangroves and Salt Marshes 2,51-57.
·Sinke, A.J.C. & Cappenberg, T.E. 1988 Influence of bacterial processes on the
phosphorus release from sediments in eutrophic Loosdrecht Lakes, The
Netherlands. Arch Hydrobiol Beih Ergebn Limnol 30, 5-13.
Smith Ill, T.J., Boto, K.G., Frusher, S.D. & Giddins, RL. 1991 Keystone species
and mangrove forest dynamics: the influence of burrowing crabs on soil
255

ChapterS
nutrient status and forest productivity. Estuarine, Coastal and Shelf Science
33,419-432.
·Stumm, W & and Leckie, J.O. 1970 Phosphate exchange with sediments; its role
in the productivity of surface waters, In advances in water pollution research.
Pergammon Press, New York, pp 1-16.
Stumm, W. & Morgan, J.J. 1981 Aquatic Chemistry An introduction emphasizing
chemical equilibria in natural waters (200 edn.). Wiley interscience. pp. 625-640.
Suess, E. 1973 Interaction of organic compounds with calcium carbonate - 11.
Organo-carbonate association in recent sediments. Geochimica et
Cosmochimica Acta 37, 2435-2447.
Sundareshwar, P.V. & Morris, J.T. 1999 Phosphorus sorption characteristics of
intertidal marsh sediments along an estuarine salinity gradient. Limnology
and Oceanography 44, 1693-1701.
Suzumura M. & Kamatani A. 1995 Mineralization of inositol hexaphosphate in
aerobic and anaerobic marine sediments: Implications for the phosphorus
cycle. Geochimica et Cosmochimica Acta 59,1021-1026.
Tam, N.F.Y. & Wong, Y.S. 1994 Nutrient and heavy metal retention in mangrove
sediment receiving waste water. Water Science Technology 29, 193-200.
Tam, N.F.Y. & Wong, Y.S. 1995 Mangrove soils as sink for wastewater-borne
pollutants. Hydrobiologia 295, 231-241.
Tam, N.F.Y. & Wong, Y.S. 1996 Retention of wastewater-borne nitrogen and
phosphorus in mangrove soils. Environmental Technology 17, 851-859.
Tornblom, E. & Rydin, E. 1998 Bacterial and phosphorus dynamics in profoundal
Lake Erken sediments following the deposition of diatoms: a laboratory
study. Hydrobiologia 364,55-63.
Vaithiyanathan, P., Jha, P.K. & Subramanian, V. 1993 Phosphorus distribution in
the sediments of the Hooghly (Ganges) Estuary, India. Estuarine Coastal
and Shelf Science 37, 603-614.
Wafar, S., U:-:towaie, A.G. & Wafar, M. 1997 Litter fall and oJnergy flux ill cl
ma"ngrove ecosystem. Estuarine, Coastal and Shelf Science 44,111-124.
256

Fractionation of Phosphorus in Sediment Cores
Waiter, L.M. & Morse, J.W. 1984 Reactive surface area of skeletal carbonates
during dissolution: effect of grain size. Journal of Sedimentary Petrology 54,
1081-1090.
Warra, T., Janson, M., Petterson, K. 1993. Phosphorus composition and release in
sediment bacteria of the genus Psudemonas during anaerobic and aerobic
conditions. Hydrobiologia 253, 131-140.
Wentzel, M.C., Lotter, L.H., Ekama, G.A., Loewenthal, RE. & Marais, G.v.R, 1991
Evaluation of biochemical models for biological excess phosphorus removal.
Water Science and Technology 23,567-574.
White D., Davis, W., Nickels, J. & Bobbie R 1979 Determination of the sedimentary
microbial biomass by extradable lipid phosphate. Oecologia 40,51-62.
Williams, J.D., Shear, H. & Thomas, RL. 1980 Availability to Scendesmus
quadricauda of different forms of phosphorus in sedimentary materials from
the Great Lakes. Limnology and Oceanography 25, 1-11.
Williams, J.D.H., Jaquet, J.M. & Thomas, RL. 1976 Forms of phosphorus in the
surfacial sediments of lake Erie. Journal of the Fisheries Research Board of
Canada 33, 413-429.
Williams, J.D.H., Syers J.K., Harris, RF. & Armstrong D.E. 1971 Fractionation of
soil inorganic phosphate in calcareous lake sediments. Soil Sci. Soc. Am.
Proc. 35, 250-255.
Wong, Y.S., Lan, C.Y. & Chen, G.Z. 1995 Effect of wastewater discharge on
nutrient contamination of mangrove soils and plants. In Asia-Pacific
Symposium on Mangrove Ecosystems (Wong, Y.S. and Tam, N.F.,Y., eds).
Kluwer Academic publishers, The Netherlands, pp. 243-254.
*Yen, T.F. 1999 Environmental Chemistry, Chemical Principles for Environmental
Proccesses. Prentice-hall, Inc., New Jersey.
Young, T.C., DePinto, J.v., Martin, S.C. & Bonner, J. 1985 Algal available
particulate phosphorus in the Great Lakes basin. Journal of Great Lakes
Research 11, 434-446.
* Not referred in original
257

Chapter 6
SUMMARY The spatial and temporal distribution of nitrogen and phosphorus in
mangrove fringed creek waters and sediments were investigated with a view to
determine the variability of phosphorus speciation in water column as well as in
sediments. General hydrographic features and sediment characteristics were also
investigated to ascertain the influence of these factors on phosphorus speciation.
Monthly observations were mape during the period December 1999 to December
2000. Three mangrove-fringe~ creeks around Cochin estuary were selected
according to plant density. Station 1 was located near the terminus of a 5-7 feet
wide canal. It is about 1 km distant from adjoining estuarine water body. Station 2,
represented a carefully preserved mangrove habitat inside the premises of Kerala
Agricultural University campus. Station 3, Aroor is located on the southern part of
Cochin estuary while Station 1 and Station 2 were located in an island in Cochin
estuary.
Surface water and sediment cores to a depth of 20cm were collected at
monthly intervals. Without much of compaction sediment cores were taken out from
the corer and fractionated into five layers at depths 2cm, 4cm, 6cm, 10cm and
20cm. General hydrographic features were noted. Surface and core sediments
were analysed for basic sediment characteristics as well as for total elemental
concentrations of carbon, nitrogen and phosphorus. Phosphorus fractionations
were carried out by sequential extraction with chelating compounds.
The annual mean values of salinity, recorded a minimum of 11 .28 x 10-3 at Station
3 and maximum of 18.41 x 10⁻³ at Station 2. Station R recorded a mean salinity

Chapter 6
value of 11.26 x 10⁻³• High salinity values at Station 1 and Station 2 indicated that
no real flushing took place at two Stations according to the tidal dynamics of the
estuary. On the other hand Station 3 exhibited salinities that were similar to Station
R. Remarkably higher salinities at Station 1 and Station 2 during pre-monsoon
might be due to isolation of the head of the. creek from near shores. The isolation
resulted in low fresh water discharge, in turn a maximum salinity regime found at
the head of the creek. Low pH v~lues were recorded at Station 3, while all other
Stations recorded alkaline pH values. During pre-monsoon season Station 1 also
exhibited a low pH, probably due to microbial activity in surface waters. Water
temperatures were found to vary within normally expected ranges at all the
stations. The lowest annual mean value of 29.1°C recorded at Station 1, 29.5°C at
Station 2, and 30.2°C at Station 3. A clear seasonal variation was found at all three
stations. As expected, the maximum temperature was recorded during pre
monsoon at all stations. Suspended sediments associated with river influx and
plant litter may contribute to the large amount of TSS at the creek waters under
study area. The maximum concentrations of TSS varied between 150.13mgL-1 and
360.80mgL -1 at the three mangrove-fringed creek waters as against the 88.41 mgL-\
the maximum TSS concentration exhibited at Station R. The annual mean POC
concentrations at three mangrove-fringed Stations were found to be 7 .19mgL-\
6.85mgL -1, and 5.06mgL -1 respectively. At Station R an annual mean value of
4.19mgL -1 was recorded. Bacterial density, phytoplankton productivity as well as
the presence of fine sediment in particulate matter resulted in an elevated
concentration of POC in mangrove creek waters.
Uptake by trees and microorganisms and by sorption on to the sediment
matrix considerably reduces nitrate concentrations in mangrove forests, which in
turn make it an effective sink for nutrients. Significantly higher concentrations of
nitrate-N were recorded at Station R than the mangrove fringed creek waters. A
general trend of nitrite nitrogen distribution showed minimum values during pre
monsoon at Station 1 and Station 2. The maximum value recorded at Station 1
during monsoon and during pre-monsoon at Station 3 might be due to the bacterial
activity in surface water. The annual mean ammonium concentrations recorded at
Stations 1, 2, 3 and R were 13.28IJmoIL-1, 32.901Jmo1L -1, 11.541Jmo1L -1, and
14.111Jmo1L -1 respectively. Remarkably high concentration at Station 2, rnay be
due to the localized regeneration from sediments.
260

SU11I11Ianj
The N:P ratio at mangrove-fringed creek waters were varied between 1.36
and 5.70 and Station R showed an annual mean value of 4.48. The significantly
lowered ratio at Station 1 and Station 2 could be due to an enhanced concentration
of DIP. The above ratios suggest that the mangrove-fringed creeks of Cochin
estuary represent an anthropogenically altered ecosystem.
The annual mean values of DIP showed a variation from 1.51 ~mol L-1
(Station 3) to 10.70~mol L-1 (Station 2). Station R recorded an annual mean value
of 2.07~mol L-1. Remarkably higher concentration of DIP was found during
monsoon at Station 1 and decrease of the same occurred during post-monsoon at
Station 1. The relationship between seasonal pattern of phosphate in water and
flux of pho~phate from sediments is an evidence for the regeneration of benthic
phosphate affects water column DIP concentrations. The high concentration of DIP
at Station 2, during pre-monsoon may be as a result of the evapotranspiration. The
DIP concentrations recorded at Station 3 and Station R were similar during the
study period. The DOP concentrations in surface waters showed a variation from
0.01 ~moIL-1 at Station 3 to 11.96~moIL-1 at Station 1. The minimum and maximum
DOP concentrations recorded at Station R were 0.13 ~moIL-1 and 3.23~moIL-1
respectively.
Particulate phosphorus concentration found to vary between 0.49~moIL-1 at
Station 2 and 55.40~moIL-1 at Station 2 in creek waters. However at Station R, PP
concentrations varied from 0.58~moIL-1 to 8.40~moIL-1. Seasonal variations showed
maximum concentrations of PP during monsoon at all Stations except at Station R,
where maximum concentration was found during pre-monsoon. The distributions of
particulate phosphorus depend on the suspended sediment brought in by the river
discharge and not on the particulate matter formed during the estuarine mixing. Low
concentrations of TP were observed during post-monsoon at all Stations. The annual
mean concentrations of TP showed maximum value at Station 2 and a minimum
value at Station R. TP concentrations indicated phosphorus loading in the water
column of mangrove creeks (Station 1 and Station 2) than Station 3 and estuarine
reference Station. Station 1 recorded relatively higher TP concentration during
monsoon and pre-monsoon. Phosphorus may enter a water body through the
inflows, precipitation, dry fallout and from the sediments, and it may be removed by
sedimentation and through the outtlow.
261

Cllapter 6
Concentrations of nitrate, nitrite and ammonium showed significant
difference between Stations (ANOVA). Significantly higher concentrations of nitrate
and nitrite were recorded at Station R, while Station 2, recorded higher
concentrations of ammonium. Contrary to the inorganic nitrogen species, DIP and
DOP concentrations exhibited significantly higher concentrations at Stations 1 and
2 than at Stations 3 and R. At the mangrove creek waters, TSS concentrations
showed significant positive correlations with POC, DIP, TP, PP and ammonium
concentrations, while no such correlations could be observed at Station R.
Correlation analysis of ammonium with other parameters showed significant
positive correlation with TSS, DIP, PP and TP. However, dissolved ammonium
levels were found to be negatively correlated with dissolved oxygen.
Analysis of rei;ltive composition of each form of phosphorus revealed that the
pp concentrations were greater than DIP concentrations which in turn was greater
than DOP at all stations except at Station 1; where phosphorus was partitioned into
about 34.5% PP, 48.4% DIP and 17.1% DOP. The observed high percentage of DIP
at Station 1 during the present study may be resulted from the high fraction of iron
bound phosphate in the sediment. Anderson and Jensen (1992) have shown that
Fe-bound P, when present in significant proportions in the sediment, may be a major
source for internal P loading in shallow, eutrophic lakes, just as it may be in deeper,
stratified lakes. At Station 2 the relative composition of each form of phosphorus
observed were 51.4% PP, 39.3% DIP and 10.5% DOP while Station 3, recorded the
percentage composition of PP, DIP and DOP as 65.4%, 21.2% and 13.4%
respectively. The reference Station gave a composition with 61.3% PP, 26.7% DIP
and 21 % DOP. Differences in speciation of phosphorus in water column among the
studied area can be ascribed to local characteristics, such as extent of fresh water in
put, land run-off, tidal amplitude and productivity of biota.
Textural studies indicated the nature of surface sediment to be sandy mud,
sandy silt and muddy sand at Stations 1, 2 and 3 respectively. The well-developed
mangroves at Station 1 and Station 2 support the root system of mangroves, which
has a dense grid of vertical pnuematophores and arial roots. This structure traps
floating detritus and reduces tidal flew, eventually creating conditions where
suspended clay and silt particles settle, whereas the lack of vegetation as well as
tidal influence and impact of waves remove finer fractions (silt + clay) of the
sediment.
262

SUllllllanj
The mean moisture percentages recorded higher values at Station 1 and
Station 2. The spatial and seasonal variation in moisture content could be
attributed to the variation of organic matter and grain size of the sediment.
Generally, higher pH values were observed at Station 1 and Station 2, while lower
pH values were recorded at Station 3. Minimum pH values were recorded during
pre-monsoon or post-monsoon at all Stations and maximum values were recorded
during monsoon season.
The concentrations of TOe in surface sediments of Station 1 and Station 2
were very high when compared with that of Station 3. The prevalent
hydrodynamics at Station 1 and Station 2 and the presence of well developed
mangrove roots retained fine fraction of surface sediment. The results indicate that
Station 1 and Station 2 were composed of organic rich surface sediment, capable
of trapping nutrients. Similarly TN concentrations, recorded a minimum of 0.97mg
g-1 at Station 3 and maximum concentration of 4.90mg g-l was recorded at Station2.
The seasonal variation of TN concentratioQ showed maximum concentrations
during pre-monsoon and minimum concentrations during monsoon at all Stations.
The seasonal variations may be attributed to the variation in TOe concentrations
as well as with the adsorb~d ammonium present in the sediment, since
exchangeable ammonium was found to be positively correlated with TN
concentrations. The concentrations of TP recorded were similar at Station 1 and
Station 2, were varied from 1.12mg g-1 to 2.10mg g-1 but sediments of Station 3
were significantly lower, ranging from, 0.49mg g-1 to 0.80mg g-1. Remarkable
spatial variation with higher values at first two Stations might be attributed to
different hydrodynamic regime. Station 3 was marked by the overbearing of coarse
fraction, which inhibits accumulation of phosphorus in sediments. The maximum
salinity at Station 2 may cause precipitation of dissolved phosphorus and hence a
maximum concentration was recorded during pre-monsoon. The cycling of
phosphorus in the studied area is highly dynamic at least at first two Stations,
where the sediments act as an efficient sink for phosphorus as far as an aerobic
environment prevailed.
The exchangeable inorganic nutrient concentrations were found to be low in
other mangrove ecosystem due to plant intake and solubility of these in surface
waier. Excnangeabie ammonium concentrations in surface sediments varied
between O.08j..1mol g-1 (Station 3) and 0.84 j..Imol g-1 (Station 1 and Station 2), while
263

Clzapter 6
exchangeable nitrate concentration ranged between 3.29 nmolg-1 (Station 3) to
64.31 nmolg-1 (Station 1). A regular tidal incursion at Station 3 may remove
ammonium from the sediment as it is soluble in water. Seasonal variations were
found with comparatively higher values during pre-monsoon and post monsoon at
Station 1 and Station 2.
The C/N ratios of surface sediments were ranged between 16.57 and 35.32
at all Stations. However at Station 2, surface sediments exhibited a C/N variation of
16.57 and 28.18, which indicated an origin of mangrove detritus at this site. The
high C/N ratios observed at Station 1 and Station 3, during the present
investigation may be attributed to the accumulated organic carbon at Station 1, and
humic derived nitrogeneous organic matter (biogenic origin) at Station 3. Relatively
lower ratic's observed at Station 2, indicate a mangrove detrital origin. The
mangrove detritus were associated with the tight coupling between microbial
mineralization and assimilation in organic sediments of the studied mangrove area.
The low N:P ratios (1.50 to 3.27) observed in the study area were due to
comparatively high concentration of TP. N:P ratio can be taken as an index of the
extent of extraneous influence on a productive water body, since the nitrogen if
produced is autochthonous, variation in N:P depend on phosphorus which is
mostly external. These ratios observed during the present study indicated an
abiogenic origin of phosphorus in the mangrove fringed creek sediments.
The C/P ratios varied between 34.68 (Station 2, monsoon) and 68.00
(Station 2, post-monsoon). The observed C/P ratio revealed that the accumulated
phosphorus load in creek waters could be reduced by the mangrove plants and
associated micro-organisms. However to arrive at the cause of deviation from
Redfield stoichiometry requires more information on the kind of litter produced in
this area, and also on the influence of microbes on carbon, nitrogen and
phosphorus dynamics in this particular ecosystem. Outwelling of mangrove litter
significantly influences sediment concentrations of TOC, TN and stoichiometric
ratios of C:N:P (Alongi, 1990).
Grain size analysis of core sediments recorded similar observation as that of
surface grain size analysiS at all Stations except in 4-6 cm layer at Station 1 and in
10-20 cm layer at Station 2. The major textural facies in sediment core at Station 1
was sandy mud with a mud layer at 4-6 cm interval. However sediment core at
Station 2 was predominantly composed of sandj mud sediment with an
264

SUllllllanj
intercalation of 10 cm thick muddy sand was recorded at a depth of about 10cm
from the surface. According to Flach and Heip(1996), a homogeneous distribution
pattern of grain size in the vertical column of sediment suggests a constant mixture
by bioturbation effects.
The moisture percentage in sediment cores varied between 29.40% (Station
3) and 61.76% (Station 2). Generally mOistl!re percentage decreased down the
core at all Stations. The moisture percentage showed a significant positive
correlation with organic carbon. The annual mean values of moisture showed
identical percentage at Station 1 and Station 2 due to the similar textural attributes
at these stations, while less moisture percentage were recorded at Station 3, due
to predominant muddy sand nature of the sediment. Seasonal variation in pH
values in core sediments recorded the maximum values during monsoon while
minimum values were recorded during pre-monsoon at Station 1 and 2. However a
remarkable decrease was noticed beyond 10cm depth at the same Stations. All
other depths showed an increase in pH values with an increase in depth during all
three seasons. The three mangrove locations showed pH values as that of an
alkaline nature of sediment up to 20cm of depth with an exceptions during pre
monsoon at Station 1 and Station 3. The annual variation of pH values in core
sediments showed a general increase down the core at all Stations indicated an
alkaline condition in sediment till 20cm of depth.
TOe concentration in the sediment cores varied between as low as 10.62mg
gol (Station 3) and as high as 140.23mg gol (Station 1). Remarkably higher TOe
concentrations were observed at Station 1 and Station 2 compared with Station 3.
Generally highest values of TOe observed at the top and lowest contents recorded
at 20-30 cm layer may be attributed to the particles loosened and suspended by
the wave action during inundation of the forest and flushed into the creek and
deposit as a silt layer on the sediment surface. Litterfall in the forest f10cr
accounted for about 45% of the total detritus in a mangrove area. However
subsurface increases in TOe concentration were found only at Station 1 and
Station 2, suggesting an accumulation of organic carbon in subsurface sediment.
Higher values of TN concentrations were recorded during all seasons at Station 1
and Station 2 than at Station 3. Nitrogen fixation by cyanobacteria and
heterotrophic bacteria which are abundant on all inhabitable surfaces in mangrove
ecosystem, mineralization processes associated with the ammonium assimilation
265

Chapter 6
by microphyto benthos and plants, the production of mucopoly saccharide
exudates by bacteria and their incorporation into humic compounds enhance the
TN concentrations in surface sediment. Also TN correlated positively with TOC and
negatively with sediment C/N ratio at 0-2 and 2-4cm depth This indicated that
decrease in C:N ratio was mainly due to the increased organic nitrogen in the
sediment. It is possible that the increase in TN and thus decrease in C/N ratio in
the sediment may be partly attributed to the increase of chlorophyll-containing
labile materials.
The minimum and maximum values of exchangeable nitrate recorded were
2:11I.lmolg·1 (Station 3) and 90.67I.lmolg-1 (Station 2) respectively. Comparatively
higher values were recorded at Station 1 and Station 2 than at Station 3. A general
par ern of exchangeable nitrate concentrations, with an increase in sub-surface
sediment followed by a gradual decrease dOwn the core was noticed at all Stations
except at Station 3. Active growth of plants might cause the decrease of this
nutrient with depth. Alternatively tidal incursions can also remove nitrate at Station
3 where tidal influence is maximum.
The ammonium concentrations varied between 0.081.lmol g-1 (Station 3) and
0.841.lmol g-1 (Station 1). Higher ammonium concentrations were noticed at Station 2
than other Stations may be attributed to high organic carbon and clay as they provide
greater surface area for adsorption of the cations. Annual variation in depth pattern
showed an increase in exchangeable ammonium concentrations with an increase in
depth at Station 1 and Station 2. The ammonium concentration increases with depth
in the anaerobic soil, indicating denitrification beyond rhizopheres.
TP concentrations were similar at Stations 1 and 2. The overall picture of the
annual variation followed the general pattern of decreasing phosphorus
concentration with increasing depths at Station 1 and Station 3, except at 10-20 cm
depth at Station 1. Associated with the high silt and clay percentage, a significantly
high concentration of TP was recorded at the first two stations. The present
observation indicated the sediments at Station 1 and Station 2 were better nutrient
sinks than at Station 3 due to its ability to immobilize phosphorus in an oxidised
sediment-water interface. TP concentrations were high in surface and subsurface
sediments indicated the contribution of below ground roots in maintaining oxidised
surface sediment. The oxidative reactions would limit the desorption of phosphate
266

Sllllllllanj
into overlying water, since most of the phosphorus being bound to non-reactive
metals, particularly as iron and manganese oxyhydroxides.
The C/N ratios recorded at Station 1 and 3 were remarkably higher than at
the other two Stations. C/N ratio varied from 19.09 (2-4cm) to 36.16 (10-20cm),
15.61 (4-6cm) to 38.33 (10-20cm), and 10.48 (4-6cm) to 56.62 (10-20cm) at
Station 1, Station 2 and Station 3 respectively. Annual variations in depth profile
showed a general pattern of a sub-surface decrease followed by a remarkable
increase beyond 10 cm depth at all stations. The fringing mangrove Station 1, have
high C:N ratios indicating an accumulation of carbon relative to nitrogen; this
carbon probably originates from debris washed on to strand lines. The C/N ratio
fluctuated during monsoon season when fresh water discharge was greater and
this indicated that besides mangroves and associated biota, terrigenous organic
matter brought in by fresh water discharge continuously added detritus to the
mangrove ecosystem also varied the stoichiometric ratios at these sites. N:P
ratios in core sediments showed a gradual decrease down the core may be
attributed to the decrease of TN, since only TN concentrations showed a significant
decrease with increasing depth (App.16). The" highest N:P ratios were observed in
surfacel subsurface sediment. at all Stations, where TN concentrations showed
significantly higher values. The value of NIP ratio ranged between 0.82 and 4.47
and were far below the N:P ratio of planktons, indicating the abiogenic nature of
phosphorus in the studied area.
The minimum and maximum C/P ratios observed in sediment cores were
25.67 (Station 3) and 83.22 (Station 2) respectively. Generally a sub-surface
increase in C/P ratios was observed at Station 1 and Station 3. The decrease in
C/P ratios beyond 10cm depth may be associated with minimum concentrations of
TOC in this layer. The high organic carbon as well as relatively high C/P ratio
observed at Station 1 and 3 indicted that a major portion of the phosphorus in
sediment undergoes bacterial mineralisation. Further more it was also established
that mangrove leaf litter found to harbour a large population of bacteria that appear
to be highly productive.
Fractionation of phosphorus was carried out using the EDTA method
(Golterman, 1996). The study on vertical variation of phosphorus fractions in
sediments indicated that the variation of phosphorus forms with depth was
susceptible to multifactor influences such as sedimentary environment, early
267

Cltapter6
diagenesis, grain sizes and anthropogenic activities. Depth profiles of P fraction
were examined to provide information on P diagenesis as a function of various
storage forms.
Sum of phosphorus fractions were si~ilar at Station 1 (1482~gg-I_1855 ~gg-l) and at Station 2 (1361~gg-1 - 1792 ~gg-l) but concentration were lower at Station 3
(483~gg-I_7 41 ~gg-\ It reflects large spatial difference of phosphorus due to
different geographical and geomorphological locations. These results indicate the
occurrence of trapping mechanism for phosphorus in the mangrove ecosystem.
The denser vegetation seen at Station 1 and Station 2 (as compared to Station 3)
facilitates trapping of sediment and nutrients discharged to these creeks from
nearby systems. It appears that very high phosphate adsorption ~apacity exist in
the sediments of Station 1 and Station 2 in accordance with the amount of iron
bound phosphorus fraction while the major fraction obtained at Station 3 was
organically bound phosphorus and calcium-bound inorganic phosphorus.
The W-IP concentrations recorded a general increase down the core may be
attributed to the elevated phosphate levels in interstitial water of the sediment.
Desorption of phosphorus into pore water may be attributed to the anaerobic
conditions prevail in the bottom layers of the sediment. Unlike W-IP, WOP fraction
showed a general decrease with increasing depth. The Fe-IP fraction showed
general decrease down the core at these Stations except at Station 2, where a
subsurface maximum was recorded. Seasonal variations in Fe-IP were found at
three stations with maximum during post-monsoon and minimum recorded during
pre-monsoon at all three Stations .. The Fe:P ratio in sediments found to vary from
9.08 (Station 3) to 14.26 (Station 1). Thus, based on Fe:P ratios, the sediments
had a high capacity for binding phosphate to iron. Unlike the inorganic fraction, the
concentrations of Fe-OP were similar during three seasons other than the
exception~lIy higher values at Station 2. The concentrations of Ca-IP showed an
erratic behavior down the core at Station 1 and Station 2. The overall picture of the
annual variation followed the general pattern at Station 3 with decreasing
concentration down the core. Variation of Ca-IP in the study area confirmed the
influence of sedir1ent texture in its distribution. Ca-OP concentration showed a
decrease with the increase in depth except at 6-10 cm depth. The Ac-OP fraction
exhibited a general decrease in concentration down the core. A reversal of this
trend was observed at depths beyond 10 cm at Station 1 and 6-10 cm depth at
268

Sllllllllanj
Station 2. The Ac-OP fraction mainly consisted of fresh organic matter, which
decreases with increasing depth. The exceptionally high values recorded at
6-10cm depth at Station 2 may be due to occasional presence of root particles in
sediment core. Alk-OP generally decreases down the core except at Station 2
where a subsurface increase was found. NaOH, extract the humic bound
phosphates and poly phosphates associated with bacteria. Therefore the general
decrease down the core may be attributed to the decrease in bacterial biomass
with increase in sediment depth. Generally R9P concentration showed a decrease
down the core. However the ROP fraction found to concentrate in subsurface
sediment at Station 2 and Station 3.
The speciation of phosphorus in the mangrove ecosystems showed
preferences of one form of phosphorus or the other with changing salinity. At
Station 1, Fe-IP fractions were observed as the abundant fraction of phosphorus at
all depths and ranged between 345.68I-1gg-1 and 495.36I-1gg-1. W-OP recorded a
minimum with values ranging between 7.18I-1gg-1 and 13.28I-1gg-1. Other major
fractions found were Ca-IP (246.35I-1gg-1 and 362.04I-1gg-1) and Alk-OP (263.98I-1gg-
1 to 372.89I-1gg-\ All other fractions gave intermediate values to those of W-OP
and A1k-OP.
Similar to Station 1, Station 2 core sediments also were generally composed
of Fe-IP as the major fraction at all depths except at 6-10 and 10-20 cm depths.
Fe-IP at this Station ranged between 282.63I-1gg-1and 477.99I-1gg-1. W-OP recorded
minimum concentrations. (4.75I-1gg-1 to 8.90I-lgg-1). Other major fractions at this site
were Ca-lP, which ranged from 266.66I-1gg-1 to 442.21I-1gg-1 and Alk-OP, which
ranged from 237.741199-1 to 301.48I-1gg-1.
Fractionation of sediment cores at Station 3 gave an entirely different pattern
from that of Station 1 and Station 2. The major fraction at this site was Alk-OP. This
fraction showed a variation from 133.42I-1gg-1 to 183.94I-1gg-1. The minimum
concentration fraction was also different from the other two Stations. Here W-IP
showed minimum concentration at this site, which varied from 1.70I-lgg-1 to
7.081199-1. The other major fractions obtained were Fe-IP (52.41 to 102.761199-1)
Ca-OP (50.61 to 99.15I-1gg-1) and Ac-OP (69.10 to 93.63I-1gg-\ It was reported that
the added excess DIP was efficiently taken up by the sediment particles and
primarily retrieved in the easily exchangeable and iron bound fractions and the
mangrove sediment was thus found to act as a phosphorus sink. Thus Stations 1
269

Chapter 6
and 2 sediments which comprise majority of Fe-IP fractions may act as a
phosphorus sink.
It has been established that sediment characteristics could serve as the
basis to assume phosphorus species in sediments and ultimately predict potential
rates of internal phosphorus loading. The water exchangeable fraction showed
significant positive correlation with percentage of silt, clay, and TOC concentrations
in 0-2 and 2-4 cm layers. The Fe-bound phosphorus was found as, positively
correlated with percentages of silt, clay, organic carbon and iron content at all
depths except 6-10 cm layer. No significant correlation was exhibited by Ca-bound
phosphorus at 0-2, 2-4, and 10-20 cm layers. This fraction showed negative
relationship with total organic carbon, iron content and in somE"; depths, with
r·ercentage of clay. Correlation analysis showed that a similar mechanism
governed the phosphorus speciation at 0-2 and 2-4 cm layers. These layers remain
oxygenated layers at all seasons. The 4-6, 6-10 and 10-20cm layers may become
anoxic and this could influence the amount of different species of phosphorus
present. The concentrations of different fractions indicated a trapping mechanism
operating for phosphorus in the mangrove ecosystem. At Station 1 and Station 2,
denser vegetation was seen compared to Station 3, which facilitates trapping of
nutrients discharged to this creeks from nearby systems. Also, Station 1 and
Station 2 appear to be the sites with high sedimentation. Therefore the causes of
chemical differences among the first two Stations and the third Station can ascribe
to sedimentation, through which the system can act as a sink of suspended matter.
Fabre et al., (1999) found that the difference in the major form of phosphorus at
different mangrove sites in French Guiana were due to the sedimentation pattern at
each sites and also the ability of these sites to function as a sink for suspended
matter. Influences of biotic processes like bioturbation, plant uptake and
transpiration and root zone decomposition are some factors which affect the
mobilization of P in wetlands. The order of abundance of each fraction at various
depths gave an indication of bioturbation in the studied area. At Stations 1 and 2,
the order of abundance was similar in the first three layers, which indicated
bioturbation at this site, while Station 3 showed different order of abundance in
these layers. The statistical ANOVA carried out between station, fraction and
depth, showed significant difference in concentrations of phosphorus exi~t between
Station, and between fraction and not between depths. Among fractions, Fe-IP
270

SlltIllllanj
fractions recorded significantly higher concentrations followed by Ca-IP
concentrations and Alk-OP concentra.tions.
REFERENCES
Alongi, D.M. 1990 Effect of mangroves detrital outwelling on nutrient regeneration
and oxygen fluxes in coastal sediments of the central great barrier reef
lagoon. Estuarine, Coastal and Shelf Science 31,581-598.
Anderson, F.O. & Jensen, H.S. 1992 Regeneration of inorganic phosphorus and
nitrogen from seston in a fresh water sediment, Hydrobiologia, 228, 71-81.
Flach, E. & Heip C. 1996 Vertical distribution of macroloobenthos within the
sediments on the continental slope of the Cogan Spur area (NE Atlantic).
Marine Ecology Progress Series 141,55-66.
271