interroll holding ag inspired by efficiency · worldwide network of 31 companies with around 1,600...
TRANSCRIPT
Solid sales growth in the americas by 20.4 % And asia-Pacific by 27.8 %
RiSe in eBitDa margin to 14.3 %
Us acqUisition Portec SucceSSfully integRAted
inteRRoll sUBsiDiary in italy eStAbliShed
inte
rr
oll
an
nU
al
reP
or
t2
013 annUal rePort 2013
insPireD By efficiencyInterroll Holding AG Via Gorelle 3 | 6592 Sant’Antonino | Switzerland www.interroll.com
© In
terr
oll H
oldi
ng A
G
highlights 2013
1
C o n t e n t s
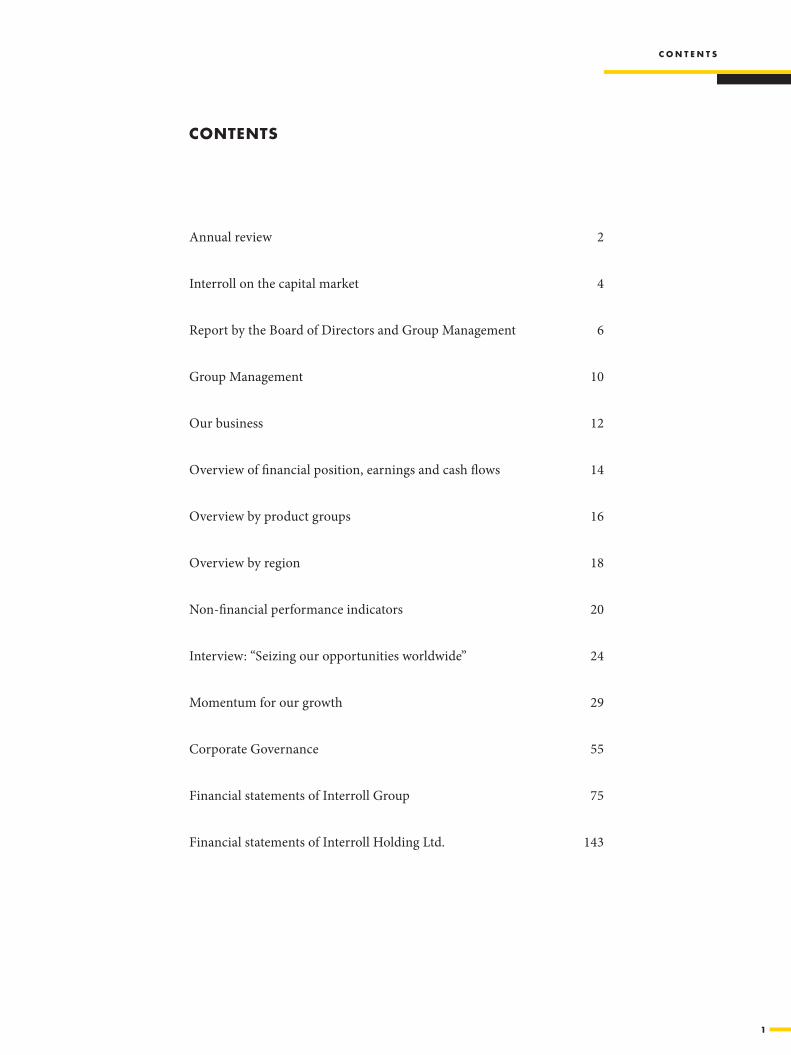
Contents
Annual review 2
Interroll on the capital market 4
Report by the Board of Directors and Group Management 6
Group Management 10
Our business 12
Overview of financial position, earnings and cash flows 14
Overview by product groups 16
Overview by region 18
Non-financial performance indicators 20
Interview: “Seizing our opportunities worldwide” 24
Momentum for our growth 29
Corporate Governance 55
Financial statements of Interroll Group 75
Financial statements of Interroll Holding Ltd. 143

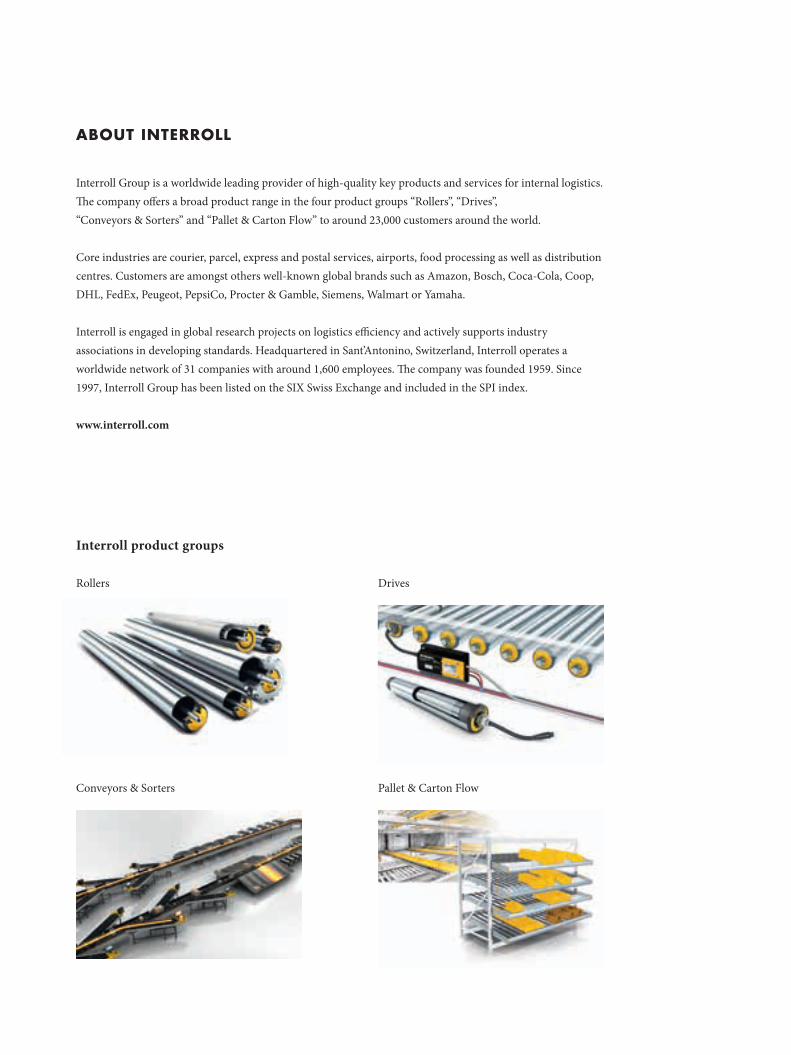
aBoUt interroll
Interroll product groups
Rollers
Conveyors & Sorters
Drives
Pallet & Carton Flow
Key figUres
in CHF million, if not stated differently 2013 2012 2011 2010 2009
Incoming orders/net salesTotal incoming orders 318.8 302.6 288.7 285.2 238.9
Drives 109.4 99.3 95.1 97.9 82.9Rollers 75.4 80.4 83.2 79.2 73.3Conveyors & Sorters 71.2 69.3 42.8 52.1 33.6Pallet & Carton Flow 60.3 58.1 50.8 53.9 44.3Total net sales 316.3 307.2 271.9 283.1 234.0
ProfitabilityEBITDA 45.4 41.1 36.2 35.8 18.8in % of net sales 14.3 13.4 13.3 12.6 8.0EBITA 34.0 30.3 25.7 24.8 8.0in % of net sales 10.7 9.9 9.5 8.8 3.4EBIT 27.2 24.8 20.4 20.4 3.1in % of net sales 8.6 8.1 7.5 7.2 1.3Net profit 20.5 19.4 18.2 14.4 5.7in % of net sales 6.5 6.3 6.7 5.1 2.4
Cash flowOperating cash flow 44.5 38.2 14.5 18.7 20.4in % of net sales 14.1 12.4 5.3 6.6 8.7Free cash flow 5.0 30.2 –5.6 –8.5 –6.0in % of net sales 1.6 9.8 –2.1 –3.0 –2.6
Total investments/capital expenditure 39.8 10.6 19.6 26.4 22.9
Balance sheet (31.12.)Total assets 258.2 227.6 239.2 211.3 215.7
Goodwill 16.0 9.0 9.0 9.3 11.0
Net financial assets (debts) 20.2 8.7 –17.6 –12.9 –4.2Gearing (net debt/equity) – – 0.12 0.10 0.03Indebtedness factor (net debt/cash flow) – – 1.21 0.69 0.20Equity 187.2 157.6 143.3 127.5 133.0Equity ratio (equity in % of assets) 72.5 69.3 59.9 60.3 61.7Return on equity (in %) 11.9 12.8 13.4 11.1 4.3
Other key figuresRONA (Return on Net Assets, in %) 12.2 12.6 9.9 10.4 1.6Average number of employees 1 488 1 420 1 340 1 255 1 206Net sales per employee (in thousands CHF) 213 216 203 226 194Productivity (Added value/total personnel expenses) 1.95 1.92 1.77 1.98 1.66
Interroll Group is a worldwide leading provider of high-quality key products and services for internal logistics. The company offers a broad product range in the four product groups “Rollers”, “Drives”, “Conveyors & Sorters” and “Pallet & Carton Flow” to around 23,000 customers around the world.
Core industries are courier, parcel, express and postal services, airports, food processing as well as distribution centres. Customers are amongst others well-known global brands such as Amazon, Bosch, Coca-Cola, Coop, DHL, FedEx, Peugeot, PepsiCo, Procter & Gamble, Siemens, Walmart or Yamaha.
Interroll is engaged in global research projects on logistics efficiency and actively supports industry associations in developing standards. Headquartered in Sant’Antonino, Switzerland, Interroll operates a worldwide network of 31 companies with around 1,600 employees. The company was founded 1959. Since 1997, Interroll Group has been listed on the SIX Swiss Exchange and included in the SPI index.
www.interroll.com
contact
If you have any questions regarding Interroll Group or would like to be included in our distribution list, please contact the Investor Relations Team:
Petra Müller Head of PR & Investor Relations Phone: +41 91 850 25 21 E-Mail: [email protected]
financial calenDar 2014
Preliminary Financial Figures 2013 24 January 2014
Publication Annual Report 2013 and Balance Sheet Press Conference 21 March 2014
Annual General Assembly 9 May 2014
Publication Half-Year Report 2014 8 August 2014
f i n a n c i a l c a l e n D a r | c o n t a c t

2
Q1|2013Thailand Major order for a modern dynamic storage system by Red Bull
Innovation Magnetic speed controller introduced to the market
Switzerland Coop benefits from space and energy-saving dynamic storage system in Pearlwater Mineralquellen bottling centre
Q2|2013Italy Opening of new Interroll subsidiary
RussiaDaifuku placed major order for a modern sorter
GermanyInternational in-house exhibition attended by Ex-Formula-1 driver Heinz-Harald Frentzen in Wermelskirchen was highly successful
A n n u A l R e v i e w
AnnuAl Review
3
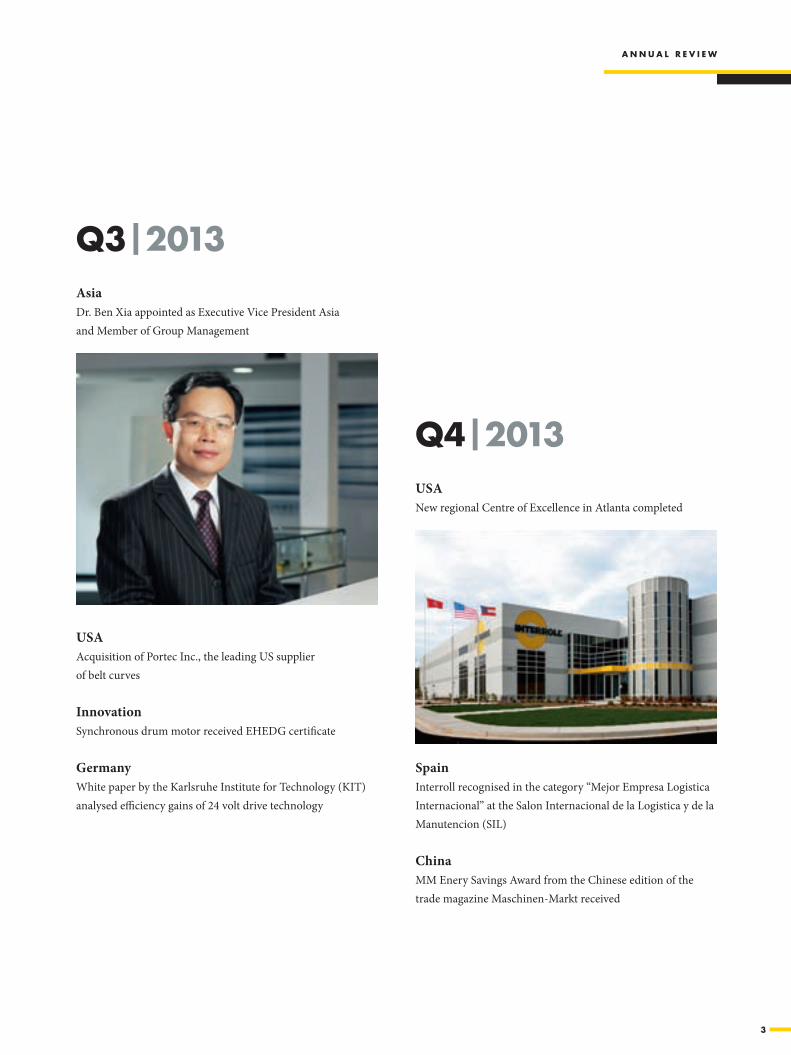
Q3|2013Asia Dr. Ben Xia appointed as Executive Vice President Asia and Member of Group Management
USA Acquisition of Portec Inc., the leading US supplier of belt curves
Innovation Synchronous drum motor received EHEDG certificate
GermanyWhite paper by the Karlsruhe Institute for Technology (KIT) analysed efficiency gains of 24 volt drive technology
Q4|2013USA New regional Centre of Excellence in Atlanta completed
Spain Interroll recognised in the category “Mejor Empresa Logistica Internacional” at the Salon Internacional de la Logistica y de la Manutencion (SIL)
ChinaMM Enery Savings Award from the Chinese edition of the trade magazine Maschinen-Markt received
A n n u A l R e v i e w

4
50.15 % 500
42.64 % 475
35.14 % 450
27.63 % 425
20.12 % 400
12.61 % 375
5.11 % 350
0 % 325
2013
i n t e R R o l l o n t h e C A p i t A l m A R k e t
inteRRoll on the CApitAl mARket
Volatility a major feature of international equity marketsTaken overall, the European financial markets experienced positive growth from the beginning of the year, even though there were occasional reversals. On the one hand, equity mar-kets were bolstered by the monetary policy of the US Federal Reserve (FED). On the other, occasionally weak economic data from some European countries depressed the mood.
But while some European stock markets were only moving sideways, there were significant gains on the Swiss equity market in 2013. From the beginning of the year, the SMI Index rose by around 20%.
Forward momentum for Interroll stockInterroll shares experienced a very strong upward trend in 2013. They opened in January at CHF 333.00 and rose significantly over the course of the year. The closing price on
30 December 2013 was CHF 490.00. The stock was therefore 47.1% up on the 2012 year-end price. This excellent perfor-mance reflects the company’s fundamentally sound position.
Based on these figures, Interroll shares clearly outperformed the SPI Index, which on 30 December 2013 stood at 7,838 points, just 24.6% above the 2012 year-end figure of 6,290 points.
Stable shareholder structureAround 26% of Interroll shares are held by the founding family Specht and another main shareholder. As at 31 Decem-ber 2013, members of the Group management held a total of 2.3% of the shares. Information about the significant share-holders can be found on page 148. Based on the SIX defini-tion, the company’s free-float is around 56%.
Geographical distribution of the identified shareholder base as per stock register in % as at 31 December 2013
Switzerland 68.5%
EMEA region excluding Switzerland 30.2%
Rest of world 1.3%
Shareholder structure in % as at 31 December 2013
Fixed shareholdings 44%
Free-float 56%
Share price performance Interroll © Swissquote
Interroll share SPI/SXGE Share price on 28.12.2012: CHF 333,– Share price on 30.12.2013: CHF 490,–
Feb. Mar. Apr. May Jun. Jul. Aug. Sep. Oct. Nov. Dec.
5
i n t e R R o l l o n t h e C A p i t A l m A R k e t
Active investor relations workIn 2013, we continued to pursue our goal of raising the profile of Interroll globally and consolidating and developing the perception of Interroll as an attractive growth stock. Through continuous and reliable communication with institutional and private investors as well as analysts, we are committed to supporting Interroll’s strategic orientation, which is geared to sustainable growth and sustainable margins. Our aim is to increase confidence in our stock and to achieve a realistic and fair valuation.
Those interested in our company’s performance can register on our website www.interroll.com (Investor Relations section) for our mailing list or request our standard publications. We also publish information about Interroll’s share performance. Financial reports and presentations are available for down-load and all key financial market dates and details of contact persons can also be found here.
Stock market launch: 1997 | Stock exchange: SIX Swiss Exchange | Market segment: Main Standard | Indices: SPI
ISIN: CH0006372897 | Security symbol: INRN | Security number: 637289
* The distribution out of reserves from capital contributions in the year under review is proposed by the Board of Directors to the annual general assembly on 9 May 2014.
2013 2012 2011 2010 2009
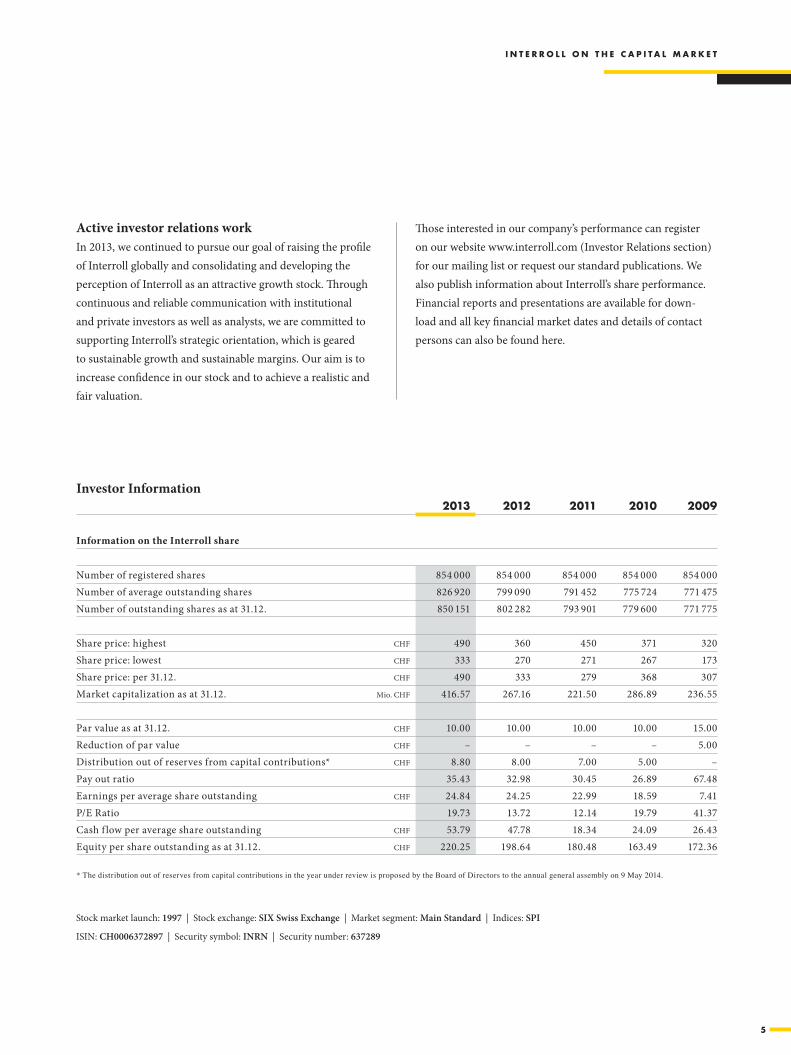
Information on the Interroll share
Number of registered shares 854 000 854 000 854 000 854 000 854 000Number of average outstanding shares 826 920 799 090 791 452 775 724 771 475Number of outstanding shares as at 31.12. 850 151 802 282 793 901 779 600 771 775
Share price: highest CHF 490 360 450 371 320Share price: lowest CHF 333 270 271 267 173Share price: per 31.12. CHF 490 333 279 368 307Market capitalization as at 31.12. Mio. CHF 416.57 267.16 221.50 286.89 236.55
Par value as at 31.12. CHF 10.00 10.00 10.00 10.00 15.00Reduction of par value CHF – – – – 5.00Distribution out of reserves from capital contributions* CHF 8.80 8.00 7.00 5.00 –Pay out ratio 35.43 32.98 30.45 26.89 67.48Earnings per average share outstanding CHF 24.84 24.25 22.99 18.59 7.41P/E Ratio 19.73 13.72 12.14 19.79 41.37Cash f low per average share outstanding CHF 53.79 47.78 18.34 24.09 26.43Equity per share outstanding as at 31.12. CHF 220.25 198.64 180.48 163.49 172.36
Investor Information
6
R e p o R t b y t h e b o A R d o f d i R e C t o R s A n d G R o u p m A n A G e m e n t
RepoRt by the boARd of diReCtoRs And GRoup mAnAGement
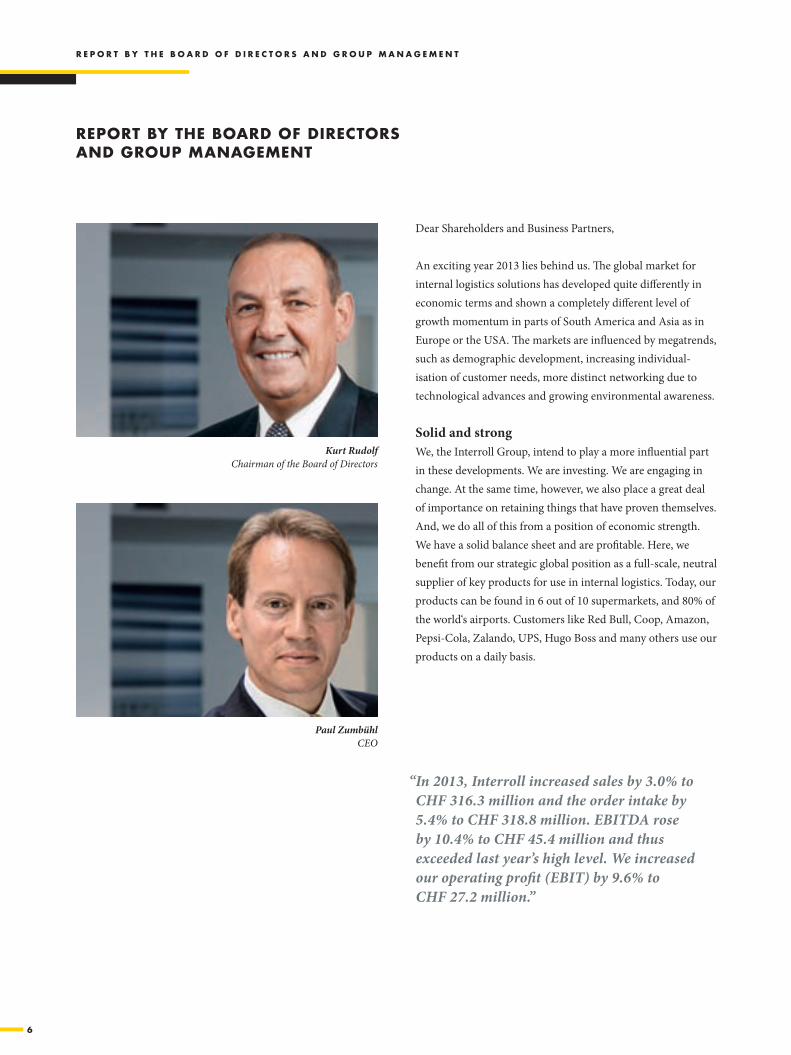
Kurt Rudolf Chairman of the Board of Directors
Paul Zumbühl CEO
Dear Shareholders and Business Partners,
An exciting year 2013 lies behind us. The global market for internal logistics solutions has developed quite differently in economic terms and shown a completely different level of growth momentum in parts of South America and Asia as in Europe or the USA. The markets are influenced by megatrends, such as demographic development, increasing individual-isation of customer needs, more distinct networking due to technological advances and growing environmental awareness.
Solid and strongWe, the Interroll Group, intend to play a more influential part in these developments. We are investing. We are engaging in change. At the same time, however, we also place a great deal of importance on retaining things that have proven themselves. And, we do all of this from a position of economic strength. We have a solid balance sheet and are profitable. Here, we benefit from our strategic global position as a full-scale, neutral supplier of key products for use in internal logistics. Today, our products can be found in 6 out of 10 supermarkets, and 80% of the world‘s airports. Customers like Red Bull, Coop, Amazon, Pepsi-Cola, Zalando, UPS, Hugo Boss and many others use our products on a daily basis.
“ In 2013, Interroll increased sales by 3.0% to CHF 316.3 million and the order intake by 5.4% to CHF 318.8 million. EBITDA rose by 10.4% to CHF 45.4 million and thus exceeded last year’s high level. We increased our operating profit (EBIT) by 9.6% to CHF 27.2 million.”

7
R e p o R t b y t h e b o A R d o f d i R e C t o R s A n d G R o u p m A n A G e m e n t
Growing profitablyWe concluded financial year 2013 with solid earnings, increasing our sales by 3.0% to CHF 316.3 million and our order intake by 5.4% to CHF 318.8 million. EBITDA rose by 10.4% to CHF 45.4 million and thus exceeded last year’s high level. Furthermore, we managed to significantly increase our EBITDA margin of 13.4% to 14.3%. We increased our operat-ing profit (EBIT) by 9.6% to CHF 27.2 million.
Due to our strong net earnings, we will be proposing an increased distribution of reserves from capital contributions of CHF 8.80 (2012: CHF 8.00) to you, dear shareholders, at our Annual General Meeting on 9 May 2014 for financial year 2013. We would thus like you to have a share in the company’s success without sacrificing the funds that will be needed to fuel our future growth.
We will continue to pay close attention to maintaining a strong balance sheet and a solid financial condition. Our goal is a high level of equity with sufficient liquidity. Here, we would like to point to our net financial assets of CHF 20.2 million despite having paid for the Portec acquisition, ongoing investments and the dividend.
Strengthening our international presenceThe year 2013 has shown that we are able to partially compen-sate for negative developments in individual markets thanks to our broad diversification into various customer segments and regional markets. In addition, we have taken advantage of the opportunity to further improve our market position through the Portec acquisition in the USA and by setting up a new sub-sidiary in Italy. We also now cover Portugal on our own.
Last year, we made a good deal of progress in pursuing many of the areas that we had referred to in our Annual Report 2012.
Acquisition of Portec gives us access to a new group of customersFor example, we put our second regional US Centre of Excel-lence in Atlanta into operation as planned. This has allowed us to further complement our dynamic storage solution and other conveyor technology product lines that we manufacture locally. Moreover, we have taken yet another strategic step in this important market with the acquisition of Portec. Portec not only extends our offerings with respect to highly efficient belt curves and other conveyor solutions, but also provides us with access to new groups of customers, particularly in the USA.
Harmonizing processes worldwideWe also implemented our new, global SAP process platform at our site in China as planned. As in 2012, continued imple-mentation of SAP also ranked among our most important strategic projects in 2013. By harmonising processes and data, we are able to serve our customers even more efficiently and roll out new products on a global basis. By doing so, we increased our productivity and strengthened our market position relative to our competition.
“ Today, our products can be found in 6 out of 10 supermarkets, and 80% of the world‘s airports. Customers like Red Bull, Coop, Amazon, Pepsi-Cola, Zalando, UPS, Hugo Boss and many others use our products on a daily basis.”
8
R e p o R t b y t h e b o A R d o f d i R e C t o R s A n d G R o u p m A n A G e m e n t
OutlookThe economic environment will remain challenging in 2014. We will need to prepare ourselves to face tougher global com-petition and rising demands from our customers. Nevertheless, our outlook for the future remains optimistic.
At the international level, our growth will continue to be fuelled by several sources. On the one hand, we will continue to benefit from the dynamics of economies above all in the Asia-Pacific region. Therefore, we are planning to continue expanding our sales activities in this region. Furthermore, our goal is to continue to grow organically, but also to strengthen our market position through acquisitions when occasions arise.
And, not to forget: our largest product introduction in the history of Interroll – our new, global module platform for conveyor technology – is scheduled for 2014.
“ Our strong growth in America and the Asia-Pacific region lowers our dependence on the European market. We see excellent chances of generating more than half of our business outside Europe only a few years from now.”
“ The global availability of our products, our proven quality and our short delivery times as well as our ever stronger presence in the important economic regions of the world and ultimately our leading market and technology position in the field of internal logistics will continue to form the basis of our success in the future as well.”
The fact that we have received six orders from Red Bull in Thailand, three of which in 2013 alone, also deserves special mention. We signed our largest pallet flow order with this customer that is worth around CHF 6.5 million at the begin-ning of 2013 and this distribution centre had already been put into operation at the end of the year. The repeat orders from Red Bull show how satisfied they are with our solutions.
Dr. Ben Xia joined the Group management team in July 2013. With him, a distinguished expert on material handling has taken over management of our Asian business. We plan to continue expanding our business activities in Asia and benefit from the above-average development in these markets. Dr. Xia will concentrate primarily on expanding our market position in the core industries airports, distribution centres, postal and courier services and the consumer goods industry while lev-eraging the growth potential in China, North Asia, Thailand, Indonesia and the Philippines.
All in all, our Company continues to rest on a strong and solid foundation. And we want this to stay that way. With that in mind, let us now take a look to what the future has in store for us.
9
R e p o R t b y t h e b o A R d o f d i R e C t o R s A n d G R o u p m A n A G e m e n t
Kurt Rudolf Chairman of the Board of Directors
Paul Zumbühl CEO Chief Executive Officer
Basis of further growthThe global availability of our products, our proven quality and our short delivery times as well as our ever stronger presence in the important economic regions of the world and ultimately our leading market and technology position in the field of internal logistics will continue to form the basis of our success in the future as well. We intend to continue driving Interroll’s growth on this basis in the future. Our successful cooperation with the ten largest system integrators in the world and our understanding of customer demands in the regional markets will generate additional revenue. Even if these orders are handled by our partners, they often result out of the fact that customers, such as Amazon, Red Bull and Walmart rely on proven Interroll products and specify them. We are interna-tionally recognised as an expert in the field of internal logistics and our expertise is appreciated whenever new approaches to internal logistics need to be developed and customers must make decisions.
Our strong growth in America and the Asia-Pacific region low-ers our dependence on the European market. We see excellent chances of generating more than half of our business outside Europe only a few years from now.
Owing our thanks to our employees, customers and shareholdersHere, we continue to count on the know-how and dedication of our employees. We would like to thank all of our employees for contributing to Interroll’s continued market success and growth. We also thank our customers, suppliers and investors for their trust in our company.
Our thanks also go out to you, dear shareholders, for your loyalty. We will continue to develop our strategy in a consistent manner and convince you of our performance.
Sant’Antonino, 21 March 2014

1010
Dr. Christoph Reinkemeier Executive Vice President Global Sales & Service
Tim McGill Executive Vice President Americas
Paul Zumbühl Chief Executive Officer (CEO)
G R o u p m A n A G e m e n t

1111
Dr. Ben Xia Executive Vice President Asia
Dr. Ralf Garlichs Executive Vice President Products & Technology
Daniel Bättig Chief Financial Officer (CFO)
Jens Karolyi Vice President Corporate Marketing
G R o u p m A n A G e m e n t

12
o u R b u s i n e s s
Leading supplier of products to attractive end-marketsWe are a global market leader and technological front runner in key products and services for internal logistics – from totes and cartons to pallets and loose goods. Within our four product groups – Rollers (conveyor rollers), Drives (motors and drives for conveyors), Conveyors & Sorters (conveyor and sorter systems) and Pallet & Carton Flow (dynamic storage) – we supply some 23,000 customers around the world with high-quality products and solutions that in many cases are critical to efficient operations.
The Interroll Group has a market reputation centred around decades of expertise, high added value for customers, global availability of consistently high-quality products and fast delivery times. This combination forms the basis for strong customer satisfaction and provides the foundation for success in our business over the long term.
Our “Global Sales & Service” division consistently markets our entire product range according to the needs of our customer groups – Original Equipment Manufacturers (OEMs), system integrators and end customers – and is responsible for 18 own sales and service units worldwide. Meanwhile, our Products & Technology division comprises seven global Centres of Excellence, four regional Centres of Excellence and three other production sites; it is responsible for research and development,
ouR business
product management as well as global purchasing. Committed to maintaining a global presence that is unique in our industry, we are strongly positioned in virtually all key markets with our Cen-tres of Excellence in Europe, the USA and Asia. For more details, please refer to our Corporate Governance report on page 60.
We create added value through our experience, technological expertise and talent for innovationAs a strategic partner to our customers, we deliver solutions that meet their application requirements through a global product platform. In doing so, we draw on our expertise and in-depth knowledge of the needs of the market. We apply sub-stantial understanding of products and deep know-how of pro-duction technology and guarantee exceptionally fast delivery times. System integrators on the other hand have experience in project management and knowledge of material flows at end user companies.
Creating benefits for the end user is our central priority, and our products deliver a return on investment after two years on average. This is one of the reasons why they are often specified by the end user.
Our power of innovation is substantiated and our prominent technological position within the global market is secured by more than 341 active patents and utility models around the world.
Original equipment manufacturer/
system integratOrinterrOll end user*
Delivery of products for internal logistics
Orders for Interroll
Marketing activity, also aiming at being specified by end user
Delivery of overall systems
Orders for Original Equipment Manufacturer (OEM)/ system integrator
* In particular: – Courier, express, parcel – Airport logistics – Food processing industry – Distribution
13
o u R b u s i n e s s
We are focused on the core industries of courier, express and other postal services, airports, food processing and distribution as well as branches of industry that require internal logistics. Our products include easy-to-integrate drive solutions such as drum motors for belt conveyors, conveyor rollers and direct current (DC) drive rollers for roller conveyors, zero- energy flow storage modules for compact pallet/tote storage systems at distribution centres, crossbelt sorters and belt curves.
Megatrends favour the long-term deployment of our products and solutionsCustomer requirements continue to progress at pace within our various markets. Change is driven on the one hand by evolving needs such as greater product diversity, less packaging and simpler operation of products in the conveying process; on the other hand, megatrends like globalisation and urbani-sation, more pronounced networking, rising mobility and the greater differentiation of our customers and their clients within our defined target markets continually present us with new challenges. Against this backdrop, we are proactively sup-porting customers with a broad range of proven, tailor-made solutions; at the same time we are enhancing existing products and investing in the development of new products. Please refer to the section 'Momentum for our growth' on page 29 of this report.
Our success factors are a global presence, proven reliability and a talent for innovationOur aim is to expand our presence within existing markets while moving into emerging markets that offer attractive growth potential. In emerging markets, we perceive opportu-nities for growth stemming from the burgeoning buying power of the middle class, the resultant rise in industrial production, increasing automation and the greater need for investment in the logistics area. To capitalise on this potential, we are utilising the production and marketing presence we have steadily built up throughout these markets over recent years (see section 'Operational management structure' on page 58). Among the emerging market nations, we focus mainly on China, Southeast Asia and Brazil.
Successful organic growth and selective acquisitions to raise valueWe are pursuing a strategy of organic growth and incorpo-rating targeted acquisitions. To boost organic growth, we are continually seeking to expand application solutions for existing clients while identifying and securing new customers and geographical markets (see section 'Momentum for our growth' on page 29).
Select acquisitions aimed at complementing internal growth are another integral feature of our expansion strategy for the long term. We keep a close eye on the market for internal logistics and apply strict criteria as we identify and evaluate possible acquisition targets. All companies previously acquired were quickly incorporated into the Interroll Group, where they began making consistent contributions to our sales and earnings figures from the outset. Future acquisitions will consolidate Interroll's regional presence, expand our product portfolio, improve access to customers and help to unlock synergies. We are well placed to benefit from the fragmentation of the market.
We are continually optimising our production processes and cost structuresOur strategic goals are to position ourselves as the clear tech-nological front runner and global market leader in internal logistics, while steadily increasing market share. In pursuing these aims, we achieve high profitability and strengthen our cash flow. We support and monitor progress through a wide range of measures that include cost discipline and continual improvements to processes across all functions and regions. In 2006, we introduced the Interroll Production System (IPS) on the basis of Kaizen, the management method inherited from the Japanese automobile industry. The integrated approach of Kaizen draws together the whole workforce and every aspect of a company that impacts the bottom line – including logis-tics, safety, quality, costs, technology and the environment. It also takes account of suppliers and customers. Under this dynamic concept, profitability is enshrined as part of the pro-cess. Over the long term, we want to maintain and expand our healthy margin. To remain competitive, we will also continue to pursue the Cost Fitness Programme that we launched in 2013.
14
2009
234.0283.1
2010
271.9
2011
307.2
2012
316.3
2013
2009
5.7
14.4
2010
18.2
2011
20.5
2013
19.4
2012
R e v i e w o f t h e f i n A n C i A l y e A R
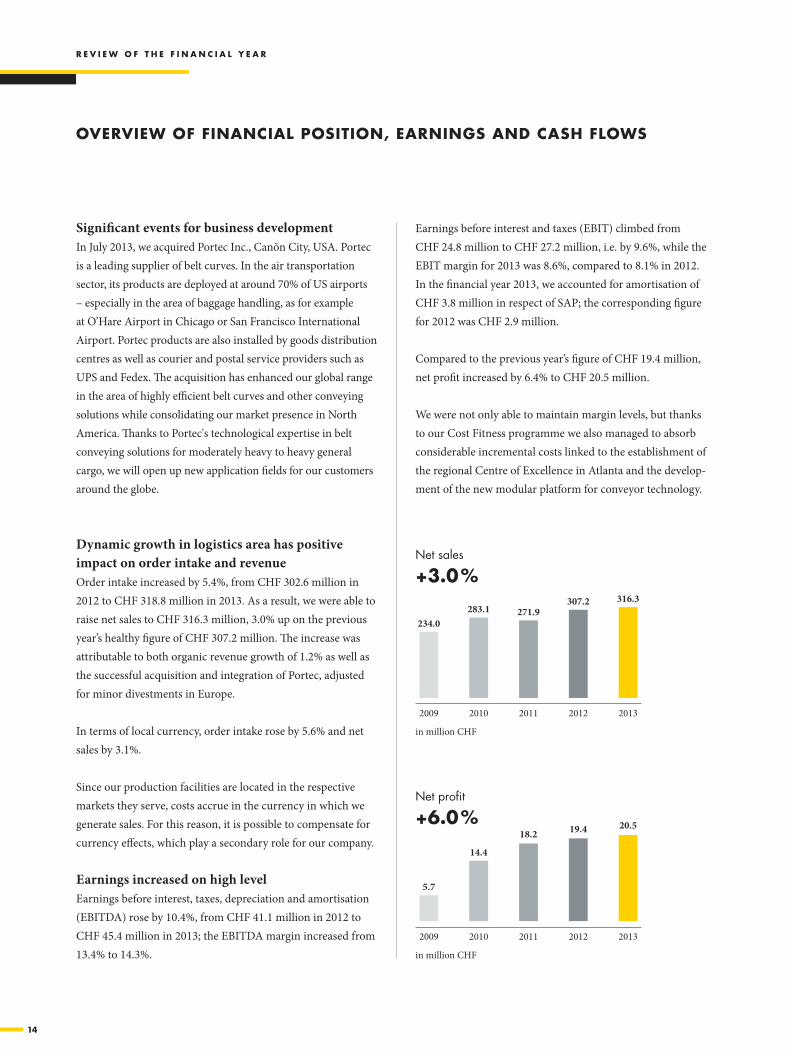
Significant events for business developmentIn July 2013, we acquired Portec Inc., Canõn City, USA. Portec is a leading supplier of belt curves. In the air transportation sector, its products are deployed at around 70% of US airports – especially in the area of baggage handling, as for example at O’Hare Airport in Chicago or San Francisco International Airport. Portec products are also installed by goods distribution centres as well as courier and postal service providers such as UPS and Fedex. The acquisition has enhanced our global range in the area of highly efficient belt curves and other conveying solutions while consolidating our market presence in North America. Thanks to Portec's technological expertise in belt conveying solutions for moderately heavy to heavy general cargo, we will open up new application fields for our customers around the globe.
Dynamic growth in logistics area has positive impact on order intake and revenue Order intake increased by 5.4%, from CHF 302.6 million in 2012 to CHF 318.8 million in 2013. As a result, we were able to raise net sales to CHF 316.3 million, 3.0% up on the previous year’s healthy figure of CHF 307.2 million. The increase was attributable to both organic revenue growth of 1.2% as well as the successful acquisition and integration of Portec, adjusted for minor divestments in Europe.
In terms of local currency, order intake rose by 5.6% and net sales by 3.1%.
Since our production facilities are located in the respective markets they serve, costs accrue in the currency in which we generate sales. For this reason, it is possible to compensate for currency effects, which play a secondary role for our company.
Earnings increased on high level Earnings before interest, taxes, depreciation and amortisation (EBITDA) rose by 10.4%, from CHF 41.1 million in 2012 to CHF 45.4 million in 2013; the EBITDA margin increased from 13.4% to 14.3%.
Earnings before interest and taxes (EBIT) climbed from CHF 24.8 million to CHF 27.2 million, i.e. by 9.6%, while the EBIT margin for 2013 was 8.6%, compared to 8.1% in 2012. In the financial year 2013, we accounted for amortisation of CHF 3.8 million in respect of SAP; the corresponding figure for 2012 was CHF 2.9 million.
Compared to the previous year’s figure of CHF 19.4 million, net profit increased by 6.4% to CHF 20.5 million.
We were not only able to maintain margin levels, but thanks to our Cost Fitness programme we also managed to absorb considerable incremental costs linked to the establishment of the regional Centre of Excellence in Atlanta and the develop-ment of the new modular platform for conveyor technology.
oveRview of finAnCiAl position, eARninGs And CAsh flows
in million CHF
Net sales
+3.0 %
in million CHF
Net profit
+6.0 %
15
2009
20.4 18.7
2010
14.5
2011
44.5
2013
38.2
20122009
13361.7%
127.560.3%
2010
143.359.9%
2011
187.2 72.5%
2013
157.669.3%
2012
2009
3.11.3%
2010
20.47.2%
2011
20.47.2%
2012
24.88.1%
2013
27.28.6%
2009
18.88.0%
2011
36.213.3%
2010
35.812.6%
2012
41.113.4%
2013
45.414.3%
R e v i e w o f t h e f i n A n C i A l y e A R
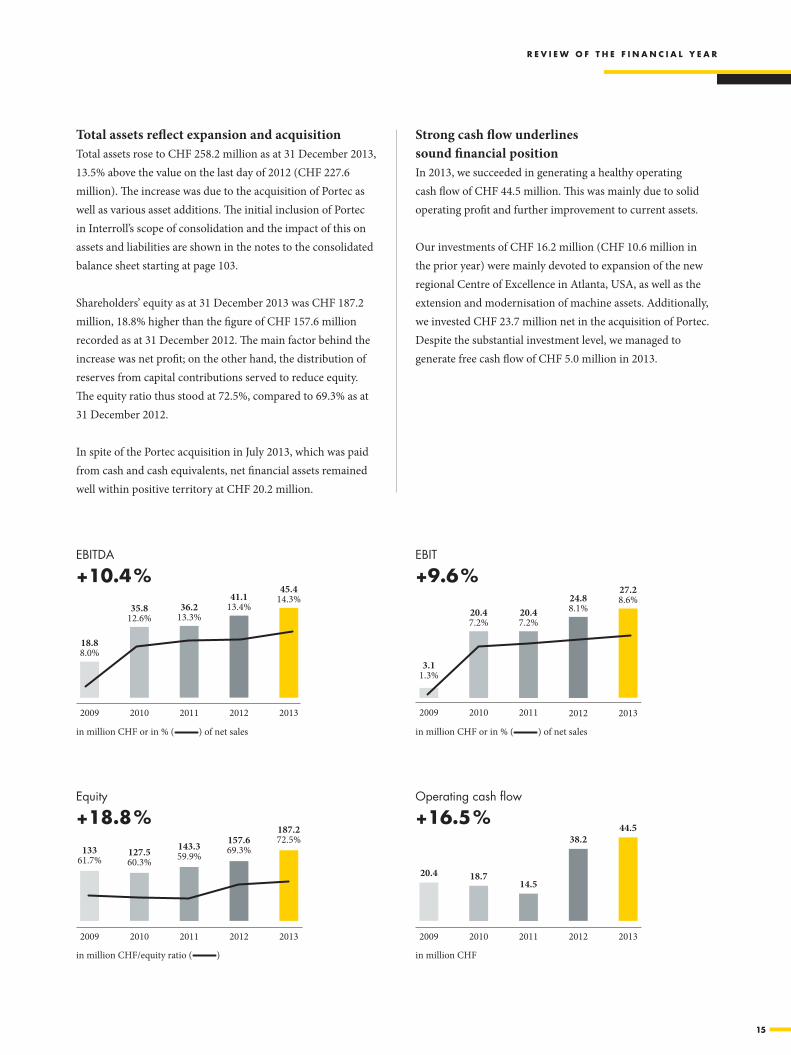
Total assets reflect expansion and acquisitionTotal assets rose to CHF 258.2 million as at 31 December 2013, 13.5% above the value on the last day of 2012 (CHF 227.6 million). The increase was due to the acquisition of Portec as well as various asset additions. The initial inclusion of Portec in Interroll’s scope of consolidation and the impact of this on assets and liabilities are shown in the notes to the consolidated balance sheet starting at page 103.
Shareholders’ equity as at 31 December 2013 was CHF 187.2 million, 18.8% higher than the figure of CHF 157.6 million recorded as at 31 December 2012. The main factor behind the increase was net profit; on the other hand, the distribution of reserves from capital contributions served to reduce equity. The equity ratio thus stood at 72.5%, compared to 69.3% as at 31 December 2012.
In spite of the Portec acquisition in July 2013, which was paid from cash and cash equivalents, net financial assets remained well within positive territory at CHF 20.2 million.
Strong cash flow underlines sound financial positionIn 2013, we succeeded in generating a healthy operating cash flow of CHF 44.5 million. This was mainly due to solid operating profit and further improvement to current assets.
Our investments of CHF 16.2 million (CHF 10.6 million in the prior year) were mainly devoted to expansion of the new regional Centre of Excellence in Atlanta, USA, as well as the extension and modernisation of machine assets. Additionally, we invested CHF 23.7 million net in the acquisition of Portec. Despite the substantial investment level, we managed to generate free cash flow of CHF 5.0 million in 2013.
in million CHF or in % ( ) of net sales
EBITDA
+10.4 %
in million CHF or in % ( ) of net sales
EBIT
+9.6 %
in million CHF
Operating cash flow
+16.5 %
in million CHF/equity ratio ( )
Equity
+18.8 %
16
o v e R v i e w b y p R o d u C t G R o u p
oveRview by pRoduCt GRoup
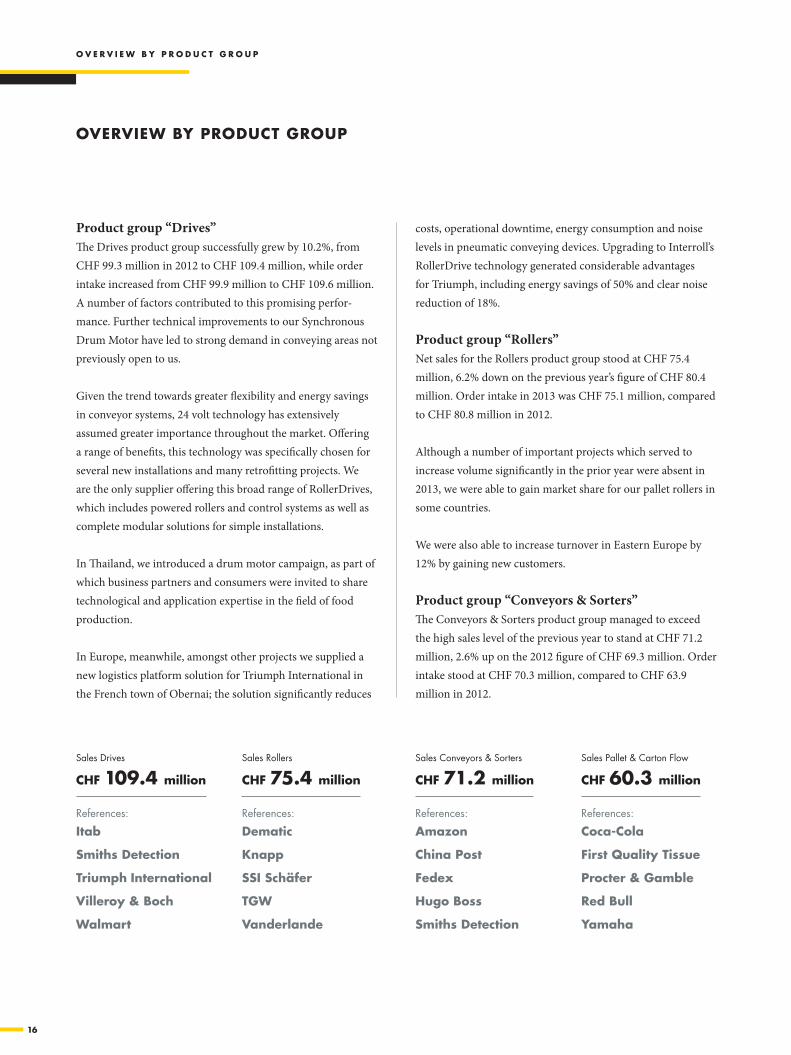
Product group “Drives”The Drives product group successfully grew by 10.2%, from CHF 99.3 million in 2012 to CHF 109.4 million, while order intake increased from CHF 99.9 million to CHF 109.6 million. A number of factors contributed to this promising perfor-mance. Further technical improvements to our Synchronous Drum Motor have led to strong demand in conveying areas not previously open to us.
Given the trend towards greater flexibility and energy savings in conveyor systems, 24 volt technology has extensively assumed greater importance throughout the market. Offering a range of benefits, this technology was specifically chosen for several new installations and many retrofitting projects. We are the only supplier offering this broad range of RollerDrives, which includes powered rollers and control systems as well as complete modular solutions for simple installations.
In Thailand, we introduced a drum motor campaign, as part of which business partners and consumers were invited to share technological and application expertise in the field of food production.
In Europe, meanwhile, amongst other projects we supplied a new logistics platform solution for Triumph International in the French town of Obernai; the solution significantly reduces
costs, operational downtime, energy consumption and noise levels in pneumatic conveying devices. Upgrading to Interroll’s RollerDrive technology generated considerable advantages for Triumph, including energy savings of 50% and clear noise reduction of 18%.
Product group “Rollers”Net sales for the Rollers product group stood at CHF 75.4 million, 6.2% down on the previous year’s figure of CHF 80.4 million. Order intake in 2013 was CHF 75.1 million, compared to CHF 80.8 million in 2012.
Although a number of important projects which served to increase volume significantly in the prior year were absent in 2013, we were able to gain market share for our pallet rollers in some countries.
We were also able to increase turnover in Eastern Europe by 12% by gaining new customers.
Product group “Conveyors & Sorters”The Conveyors & Sorters product group managed to exceed the high sales level of the previous year to stand at CHF 71.2 million, 2.6% up on the 2012 figure of CHF 69.3 million. Order intake stood at CHF 70.3 million, compared to CHF 63.9 million in 2012.
Sales Conveyors & Sorters
Chf 71.2 million
References:
Amazon
China post
fedex
hugo boss
smiths detection
Sales Drives
Chf 109.4 million
References:
itab
smiths detection
triumph international
villeroy & boch
walmart
Sales Rollers
Chf 75.4 million
References:
dematic
knapp
ssi schäfer
tGw
vanderlande
Sales Pallet & Carton Flow
Chf 60.3 million
References:
Coca-Cola
first Quality tissue
procter & Gamble
Red bull
yamaha

17
o v e R v i e w b y p R o d u C t G R o u p
This performance was attributable to a clear trend towards automation, driven mainly by e-commerce and ergonomics in the working environment. The more goods are sold online, the more flexibility and speed are needed by trading companies. Company management teams are thus required to improve ergonomic and safety conditions at work with a view to min-imising unproductive incidents. We have received promising orders for our sorters not just from Europe and the USA but also from Japan, Russia, Brazil, Korea and China.
In June 2013, for example, we received an order from the Japanese logistics supplier Daifuku for an ultra-modern sort-ing system in Russia comprising a crossbelt sorter and other materials handling technology. The order value was EUR 1.7 million.
Product group “Pallet & Carton Flow”In the Pallet & Carton Flow product group, net sales increased by an encouraging 3.8% to stand at CHF 60.3 million (2012: CHF 58.1 million); order intake increased from CHF 58.1 million to CHF 63.9 million.
Early in 2013, we concluded our biggest pallet flow order to date, as Red Bull in Thailand invested CHF 6.5 million in pallet flow technology to expand its regional distribution centre. In total, we secured three pallet flow orders from Red Bull in Thailand in 2013.
In Korea, meanwhile, we received an order regarding a distri-bution centre for noodle dishes from a new client.
In undertaking the installation of a complex logistical solution, we successfully negotiated a challenging construction phase to the utmost satisfaction of our client Swiss Pearlwater despite initial difficulties with the project.
Pallet flow revenue also expanded markedly by nearly 50% in the USA.
Sales by product
groups
Drives 35% Rollers 24% Conveyors & Sorters 22% Pallet & Carton Flow 19%
18
o v e R v i e w b y R e G i o n
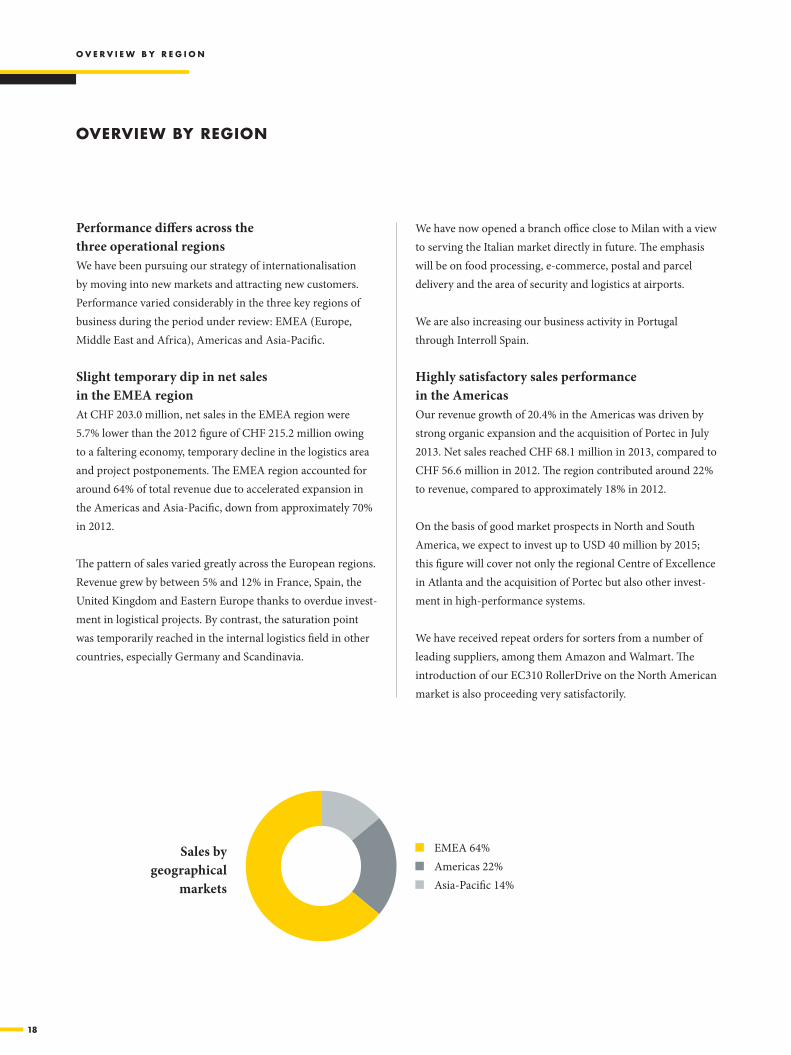
Performance differs across the three operational regionsWe have been pursuing our strategy of internationalisation by moving into new markets and attracting new customers. Performance varied considerably in the three key regions of business during the period under review: EMEA (Europe, Middle East and Africa), Americas and Asia-Pacific.
Slight temporary dip in net sales in the EMEA region At CHF 203.0 million, net sales in the EMEA region were 5.7% lower than the 2012 figure of CHF 215.2 million owing to a faltering economy, temporary decline in the logistics area and project postponements. The EMEA region accounted for around 64% of total revenue due to accelerated expansion in the Americas and Asia-Pacific, down from approximately 70% in 2012.
The pattern of sales varied greatly across the European regions. Revenue grew by between 5% and 12% in France, Spain, the United Kingdom and Eastern Europe thanks to overdue invest-ment in logistical projects. By contrast, the saturation point was temporarily reached in the internal logistics field in other countries, especially Germany and Scandinavia.
We have now opened a branch office close to Milan with a view to serving the Italian market directly in future. The emphasis will be on food processing, e-commerce, postal and parcel delivery and the area of security and logistics at airports.
We are also increasing our business activity in Portugal through Interroll Spain.
Highly satisfactory sales performance in the Americas Our revenue growth of 20.4% in the Americas was driven by strong organic expansion and the acquisition of Portec in July 2013. Net sales reached CHF 68.1 million in 2013, compared to CHF 56.6 million in 2012. The region contributed around 22% to revenue, compared to approximately 18% in 2012.
On the basis of good market prospects in North and South America, we expect to invest up to USD 40 million by 2015; this figure will cover not only the regional Centre of Excellence in Atlanta and the acquisition of Portec but also other invest-ment in high-performance systems.
We have received repeat orders for sorters from a number of leading suppliers, among them Amazon and Walmart. The introduction of our EC310 RollerDrive on the North American market is also proceeding very satisfactorily.
oveRview by ReGion
EMEA 64% Americas 22% Asia-Pacific 14%
Sales by geographical
markets
19
o v e R v i e w b y R e G i o n
Through the acquisition of Portec, we are expanding our client base and offering a wider range of products for the airports and parcels sector. Integration of the former Portec organisation will also improve customer service for Inter-roll clients on the west coast while opening up cross-selling opportunities for customers whose needs were not fully met by Portec in the past.
In the past financial year, we overhauled our sales and distri-bution structure in the USA. The field service division was strengthened, user know-how was purposely expanded and customer proximity was improved. We also implemented our global marketing strategy; please refer to the ‘Marketing’ section on page 21.
Net sales up significantly in Asia-Pacific regionThe Asia-Pacific region remains critical to our growth potential. The rise in living standards in these emerging markets has led to more pronounced consumption and thus increased demand for appropriate internal logistics. Net sales amounted to CHF 35.3 million in 2012, rising by 27.8% in 2013 to stand at CHF 45.2 million; the proportion of total sales was around 14% in 2013, compared to approximately 12% in the previous year.
Once again, our prominent technological position and the growth of Asian markets have been a major driving force behind our expansion. Interroll companies in Korea, Thailand, China and Singapore have improved their market positions by taking significant orders. The performance of the regional Centre of Excellence in the Chinese city of Suzhou was further enhanced by establishing global processes and programmes aimed at promoting skills. SAP has been in operation in all Asian organisations since 1 April 2013; the final step was the go-live at Interroll China.
In Thailand, we secured three dynamic storage orders from Red Bull in 2013, bringing the total number of orders com-pleted for Red Bull to six since 2009. Please refer to the section ‘Overview by product group’ on page 17.
Dr. Ben Xia, an expert in materials handling with a proven track record in this field, has been running our businesses in Asia since 1 July 2013. Under his leadership, business activity will be promoted and organisational structures will be optimised in anticipation of future requirements in Asia.
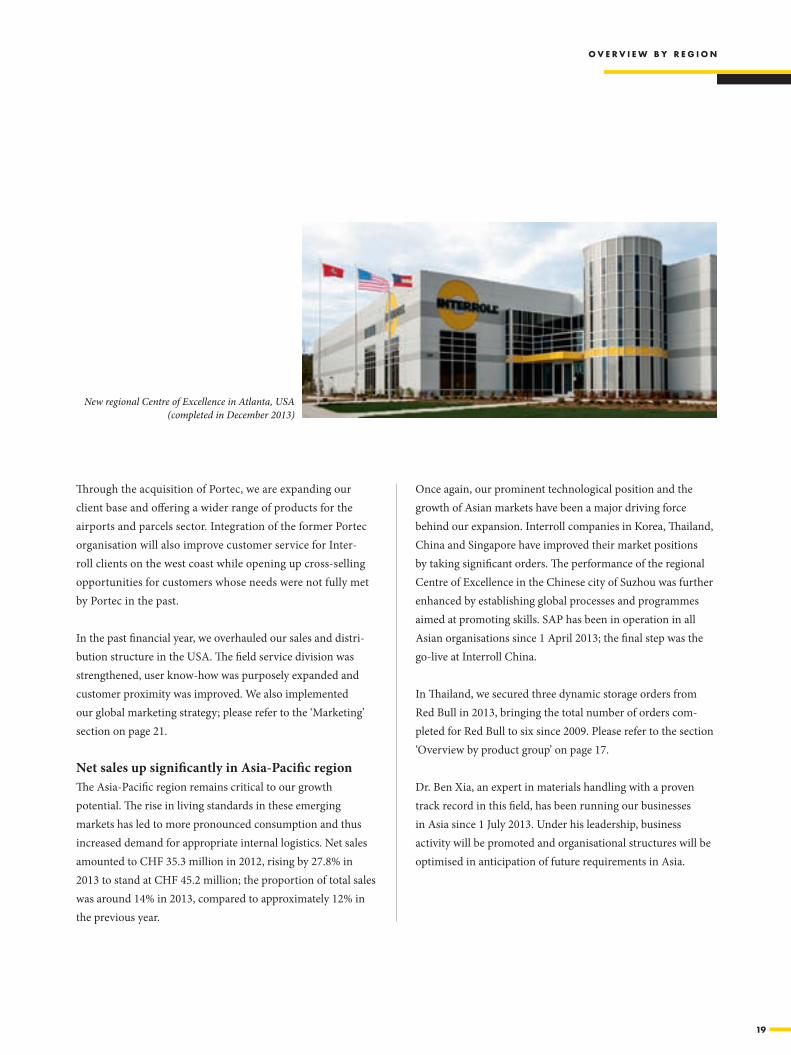
New regional Centre of Excellence in Atlanta, USA (completed in December 2013)
20
n o n - f i n A n C i A l p e R f o R m A n C e i n d i C A t o R s
Research and developmentOur customers are constantly facing new challenges (see section 'Megatrends favour the long-term deployment of our products and solutions' on page 13). Intense research activity and the development of new products and solutions are essen-tial elements in helping our clients to meet their specific needs, whether they be more efficient assembly, easier transport of commodity units, less packaging, space savings, flexible and load-dependent system control at various speeds, fast response times, energy savings or low maintenance costs. Modular, scal-able systems are key prerequisites. As an international market leader, we are involved in global research projects in the field of logistical efficiency; moreover, we actively support indus-trial associations in developing standards. For this reason, we attach great importance to full compliance with current legal regulations and to anticipating the product development requirements of the future.
The Interroll Research Centre (IRC) in Wassenberg, Germany, concentrates on 'Innovation Pure'. Working closely with the Interroll Centres of Excellence, the Global Product Manage-ment team and the sales department, it develops new products, processes and technologies that deliver critical efficiency at key points in internal logistical systems. Its focus ranges from energy efficiency, hygiene and new materials to noise reduction and decentralised intelligence.
Innovation is very important to us, which is why we invest some 3% of revenue in research and development – and intend to carry on doing so. To safeguard our innovations and main-tain the competitive advantage we have earned, we consistently register new industrial property rights around the world.
Important developments in 2013 included:
The magnetic speed controller for our pallet flow products is integrated into the roller conveyor module, thereby regu-lating the speed of pallets weighing up to 1,250 kg. The pat-ented magnetic solution prevents wear and the overheating of brakes while ensuring a higher throughput.
Our 24 volt conveyor technology is centrally oder decen-trally controlled by our Conveyor Control technology. Our 'Gateway', an interface to fieldbuses that can be used to control a wide range of functions in a conveyor system, is a useful addition to our conveyor control product family. Since fieldbuses can be used in controlling Interroll mate-rials handling solutions as well as other external compo-nents, this addresses the wish expressed by customers for greater automation in their overall systems.
To keep pace with increasing automation in the deep-freeze area, we have expanded our conveyor rollers and RollerDrives to include a special version for freezers. A new kind of interlocking connection ensures the conveyor rollers and RollerDrives operate reliably at temperatures as low as -28 degree Celsius and that conveyor systems can be deployed without limitation.
Our Centre of Excellence in Sinsheim has developed a new global 'conveyor platform'. It addresses additional cus-tomer requirements by offering very high flexibility, ultra-fast delivery times and extremely quiet operation. The new platform, which will be gradually rolled out worldwide, and which will enable us to improve our worldwide market position in the area of internal logistics, will be unveiled at the CeMAT fair in Hanover in the second quarter of 2014.
To gain a deeper understanding of the two leading drive systems (24 volt and 400 volt technology), we lent our support to a Karlsruhe Institute of Technology (KIT) study overseen by Professor Furmans. In the case of the 24 volt technology that we utilise, the conveyor only operates as needed; in the case
non-finAnCiAl peRfoRmAnCe indiCAtoRs
21
n o n - f i n A n C i A l p e R f o R m A n C e i n d i C A t o R s
of conventional 400 volt technology with geared motors, the conveyor runs continuously. Having compared the two sys-tems, the study concluded that 24 volt technology can reduce the energy requirement by approximately 30%; energy savings of as much as 50% can be achieved by using conveyors with an accumulating function.
EmployeesBy devoting their skills and their passion for internal logistics on a daily basis, our employees are of fundamental impor-tance to the success of our company. We set high standards in terms of commitment, performance and conduct. For many years, annual performance reviews have served to maintain a consistent dialogue with staff. By agreeing on personal targets and communicating openly, we encourage entrepreneurship amongst our employees while ensuring that they hold a stake in the success of the Group and its future prosperity.
Low fluctuation level points to employee satisfactionAs our low fluctuation rate in the Interroll companies world-wide testifies, our staff are highly motivated and exceptionally committed to the company and its success.
Strategic investment in trainingBack in 2008, we founded the Interroll Academy. By promoting the advancement of staff members, the internal training centre is playing a key role in helping the Interroll Group implement its long-term growth strategy.
The Academy utilises a mix of traditional teaching and Inter-net-based instruction methods, a combination of training approaches that ensures that the knowledge acquired is retained and applied to practical situations. All sales repre-sentatives and technicians not only receive training on our products but are also familiarised with customer requirements and applications. In this way, they are able to offer clients effective support.
Fitness training based on 'one-piece flow' principleWe believe it is important to look after our health – which is
why in 2013, at our biggest site in Wermelskirchen, we set up a fitness group open to all staff members (both past and present). The fitness sessions are already attended on a regular basis by around half of the workforce; they take the form of circuit training and utilise a balanced blend of strength and stamina building equipment. Technically speaking, the sessions take the form of cardio training as the circulatory system is boosted alongside all the key muscle groups.
MarketingOur marketing activities are aimed at supporting the sale of our products and enhancing our brand image around the world. We believe it is very important for our campaigns to reach out not just to our direct clients but also to end customers.
In 2013, we were represented through our own booth at 21 trade fairs around the world, showcasing the products and solutions that we supply to various industries.
We further developed the marketing programme in place since 2011 and also implemented it in the USA and Asia. This involved the effective implementation of marketing campaigns aimed at highlighting Interroll innovations in select growth markets and clearly distinguishing ourselves from the com-petition; the campaigns were created in Europe before being transferred to the regions. In 2013, the marketing focus was on the e-commerce, distribution and food processing sectors. Campaigns are always linked to ambitious local sales targets. For the year in question, we can point to a highly positive impact: taken together, countries in which the campaigns were introduced saw revenue increase by 50% more compared to the other countries.

22
n o n - f i n A n C i A l p e R f o R m A n C e i n d i C A t o R s
To present the customer benefits of our portfolio in a credible fashion, more research and consultancy projects were under-taken with universities and other institutes in 2013. The pro-jects, which clearly underlined the competitive advantages of technology supplied by Interroll, included a partnership with Professor Furmans of the Karlsruhe Institute of Technology (see page 52) and our collaboration with the consultancy firm Intralenco. Other international contacts have been estab-lished in Italy, the USA and China, and these will be extended over the year ahead.
Once again, the Sauber F1 Team formed part of our market-ing plans in the context of sports sponsoring in 2013; this was achieved within a manageable budget roughly equivalent to the task of planning two large-scale trade fairs for Interroll. Joint appearances at international conferences, an in-house exhibition aimed at a global audience and the organisation of several management workshops by the teams have again
demonstrated that aligning ourselves with a Formula 1 team captures the attention of customers and the media. Both companies stand for a clear focus and outstanding process management. The value of media reporting is almost equal to the sponsoring budget.
We monitor the influence of marketing on the success of the company very closely. Aside from analysing press coverage and the impact of trade shows and the Internet, we obtain assessments from sales directors around the world regard-ing the contribution of the marketing team to company prosperity.
We plan to push ahead with our marketing strategy that has already proved to be successful. In particular, we will seek to improve our positioning in the areas of sustainability, inno-vation and the presentation of competitive advantages while highlighting user benefits for end customers.
.
Interroll is a “Promotional Partner” of the Sauber F1 team
23
n o n - f i n A n C i A l p e R f o R m A n C e i n d i C A t o R s
SustainabilityWe believe reconciling the impact of our business activity with the expectations and needs of society is a key responsi-bility. In a globalised world, the challenge is to accommodate the rising tide of goods traffic and the increasing movement of persons without impacting unnecessarily on resources. More and more companies are taking environmental pro-tection into consideration; they are utilising resources more efficiently and conserving energy while demanding the same of their suppliers. As a leader in innovation and technology, we are well placed to respond to this market environment. By implementing sustainable measures aimed at conserving resources, we can help our customers to reduce their costs and thus brighten their competitive prospects.
New materials handling technology saves energyAccording to calculations of the Fraunhofer Institute for Material Flow and Logistics (IML) in Dortmund, optimising drive technology can cut energy consumption by almost a third. This applies not only to new systems but also to retro fits, where best possible utilisation of time, space, staff resources, energy and materials can be achieved in a short period of time.
Efficiency-optimised drives, lightweight components across the board and material combinations with low rolling resist-ance offer easy ways to achieve double-digit decreases in energy consumption.
Our EC310 RollerDrive, for example, is capable of reducing a system's energy consumption by as much as 30%. The energy efficient drive guarantees ideally coordinated operational procedures for zero-pressure accumulation conveyors on both straight conveyor sections and curves.
By deploying our RollerDrives, it is possible to set up an intelligently controlled conveyor system subdivided into zones without significantly altering the basic construction of the system. Assuming medium throughputs of 600 to 1,000 containers per hour, a system modernised in this way con-
sumes up to 50% less energy than a conventional system in which a geared motor runs continuously (i.e. independently of the throughput). Operation according to need and the fact that no additional drive mechanism is required also serve to suppress the noise level of the system considerably. Further-more, since the drives are in operation much less than those of conventional systems while delivering the same conveyor output, the effects of wear are minimised. Please refer to the section 'Research and development' on page 20.
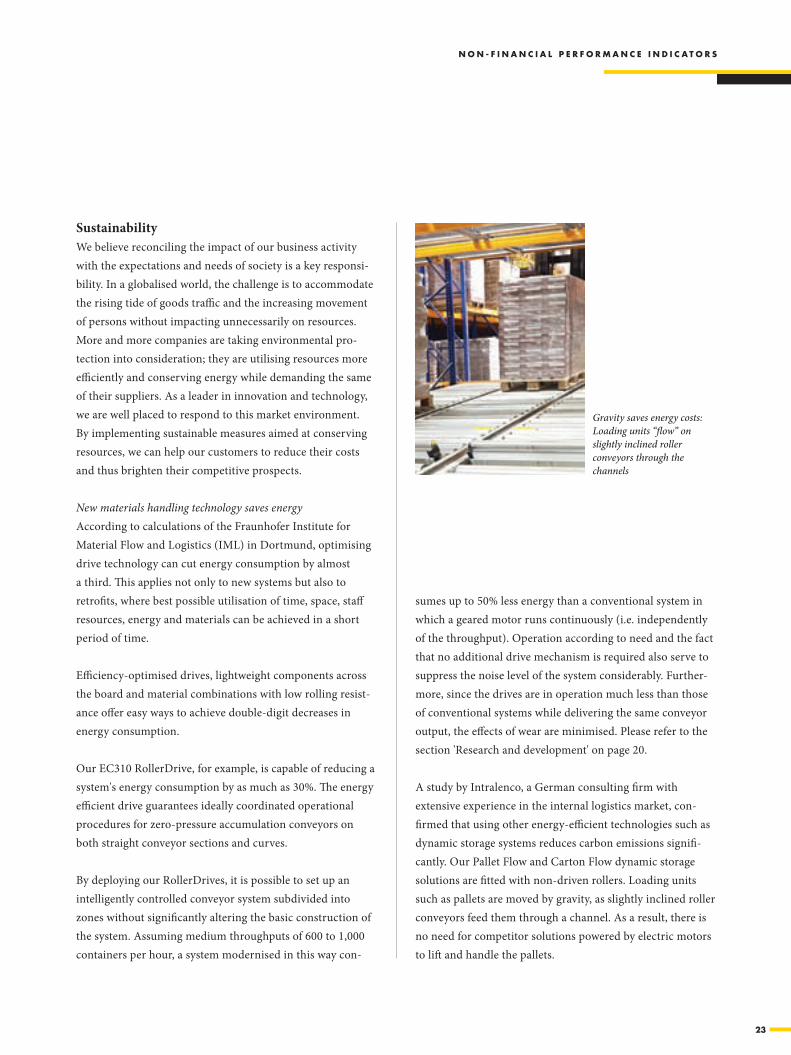
A study by Intralenco, a German consulting firm with extensive experience in the internal logistics market, con-firmed that using other energy-efficient technologies such as dynamic storage systems reduces carbon emissions signifi-cantly. Our Pallet Flow and Carton Flow dynamic storage solutions are fitted with non-driven rollers. Loading units such as pallets are moved by gravity, as slightly inclined roller conveyors feed them through a channel. As a result, there is no need for competitor solutions powered by electric motors to lift and handle the pallets.
Gravity saves energy costs: Loading units “flow” on slightly inclined roller conveyors through the channels

24
i n t e R v i e w
“ seizinG ouR oppoRtunities woRldwide”
The Interroll Group is maintaining its pattern of profitable growth. For some time, the conveyor technology manufacturer has been setting its sights more and more on the Asian and American markets. We spoke to Chief Financial Officer Daniel Bättig and Dr. Christoph Reinkemeier, Executive Vice President Global Sales & Service at the Swiss Group, about international strategies, new business opportunities and financial strength.
Mr. Bättig, Dr. Reinkemeier, financial year 2013 saw marked increases once again in sales in the Americas and the Asia-Pacific region, in earnings and, above all, in the cash flow of the Interroll Group. Will Interroll be able to maintain this momentum in the future?
Daniel Bättig: Yes, all managers who are responsible for the busi-ness activities of the Interroll Group firmly believe that this is the case. Together with our workforce of around 1,600 employees around the globe, we are pulling out all the stops to ensure that we continue this successful course in the years to come. In this regard, our strategy focuses clearly on organic growth. At the same time, we intend to look into acquisitions that match our strategic outlook.
Dr. Reinkemeier: As regards generating further profitable growth – particularly in Asia and the Americas – 2013 was a very important financial year, and not just in terms of our key performance indicators. Not only did we succeed in winning many new customers for our products and services, securing important follow-up orders and thus confirming the trust that our business partners have in us, we also laid strategic foundations and reached commercial milestones with a view to leveraging our growth potential even more effectively in the future. Above all, we enhanced our product platform around the globe, for instance by standardising our RollerDrive tech-nology at an improved technical level worldwide. In addition, by setting up an internal customer information system, we laid the cornerstone for an international Key Account Manage-ment system. This will help us to respond quickly to customer expectations and needs worldwide.
25
i n t e R v i e w
What are the special features that characterise the further internationalisation of Interroll?
Dr. Reinkemeier: Needless to say, internationality has been one of Interroll’s key strengths for decades. Traditionally, our home market here in Switzerland does not even account for two percent of our total sales. At present, our efforts are not geared towards stepping up internationalisation at any price. Rather, our main focus is on raising our profile within the markets – and setting ourselves clearly apart from the competition. Our outlook is based on the need to meet the different customer demands that exist in the various regions. This regional outlook is achieved by having our own sales and support organisation directly in the markets. Direct selling is the only way to achieve a “climate of excellence” in our relationship with our customers. Even when it comes to our products and services, quality alone
is no longer sufficient – not by a long shot. This trend can also be seen to have a particular momentum in emerging markets. We will continue to tap into this potential with a view to providing reliable and extensive solutions exper-tise for our customers.
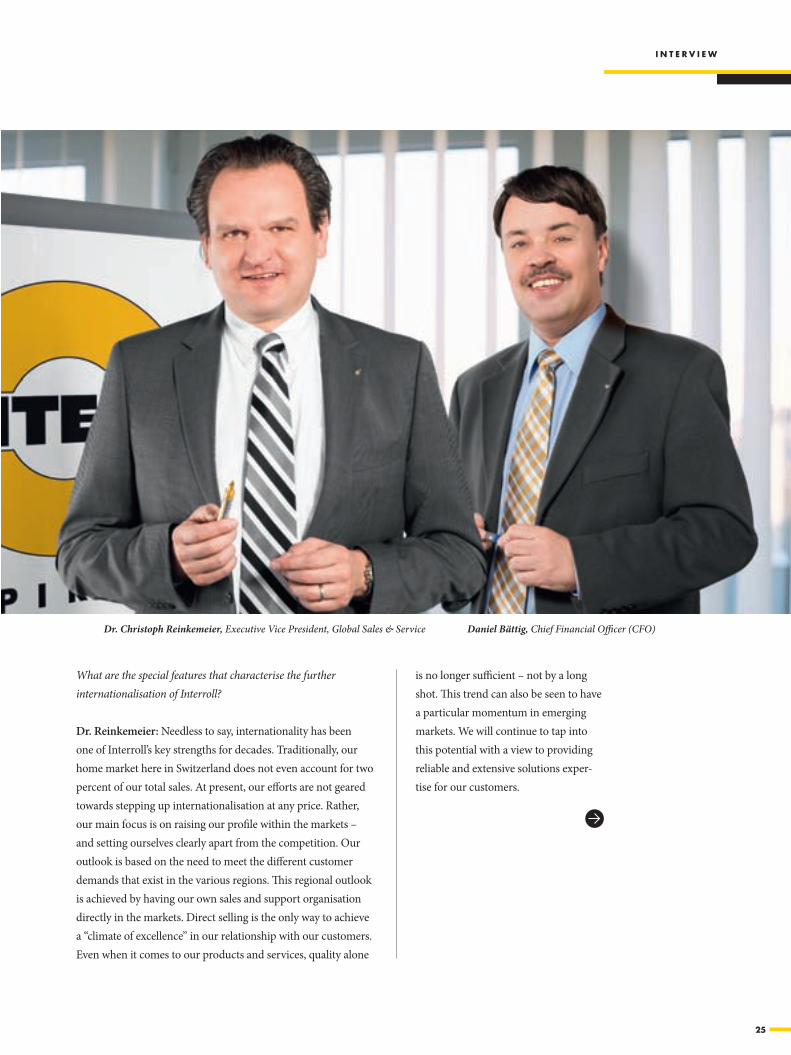
Dr. Christoph Reinkemeier, Executive Vice President, Global Sales & Service Daniel Bättig, Chief Financial Officer (CFO)
26
Daniel Bättig
i n t e R v i e w
Daniel Bättig: This is why we have been focusing particular attention on Asia and the Americas for some time. At present, these continents only account for a third of our Group sales. However, the commercial significance of these regions means that there is still enormous potential there. Because of this, we intend to gradually increase the share of sales attributable to these markets to over 50 percent of our Group sales in the coming years.
Doesn't this strategy also mean that Interroll will have to deal with increased requirements and more complex processes?
Daniel Bättig: Without doubt. This is also one of the reasons why we are harmonising and standardising our processes worldwide – for instance by implementing SAP at 23 subsidi-aries so far. In this way, we not only become more productive
overall, but also lay the foundations for maximising the advan-tages of a global presence in the future. Our strategy consists of centralising the respective product development activities at our global Centres of Excellence and decentralising value creation in the relevant production area within the individual regions. To achieve this, we need – figuratively speaking – a nervous system that provides a reliable connection between the head and the hand. This allows us to ensure that the service we provide anywhere in the world is as good, as reliable and as fast as Interroll’s customers have come to expect.
Dr. Reinkemeier: We have standardised our operational struc-tures and processes in order to prime them for the demands and complexity of global business. For years, our globally implemented Interroll Production System (IPS) has allowed us to ensure the highest product and process quality. At the same time, we are investing in a new conveyor platform that will reduce our delivery time enormously while opening up entirely new business opportunities. Beside this, we are providing train-
ing and internal know-how certifi-cation to our sales staff in order to pack an even harder punch on the sales front. This is because we have observed that, in addition to our direct customers, more and more end customers are expecting us to provide comprehensive solutions expertise in addition to our product and application know-how.
Is this internationalisation drive also the reason for the acquisi-tion of the US company Portec Inc. in mid-2013?
Daniel Bättig: Yes, that was a further milestone in continu-ing our internationalisation strategy. In the recent past, we have already stepped up our presence in Asia significantly by expanding our regional Centre of Excellence in Suzhou, China. With our plant in Atlanta, Georgia, we are also building a new regional Centre of Excellence for dynamic storage solutions and subsystems. The Portec acquisition meets all the criteria that we specify for acquisitions. This acquisition creates value. It makes an immediate contribution to our business activity and, with its location in the Western USA, fits with our geo graphical expansion plans. In addition, the acquisition increases and improves our range of products – as
“We finance our internationalisation from our cash flow. This financial strength gives us a clear
advantage over our competitors.”
27
Dr. Christoph Reinkemeier
i n t e R v i e w
well as strengthens our position in the airport business, one of the main sectors in which Interroll operates successfully worldwide.
Dr. Reinkemeier: In 2013, besides acquiring Portec, we paved the way for further organic growth in key markets around the world. For instance, we set up a subsidiary of our own in Italy and are working the Portuguese market directly via our company in Spain. This means that we now have direct access to these markets. Our production, sales and service companies around the world allow us to maintain a very close dialogue with our customers. Incidentally, this direct market access not only benefits us, but also – and above all – our customers. Ulti-mately, customers in all markets expect the same high quality, reliability and speed from Interroll.
How does this international strategy set Interroll apart from its competitors?
Dr. Reinkemeier: First of all, internationalisation allows companies to become less dependent on developments in individual economic regions. In our market environment, however, internationalisation gives us another key competitive advantage: with this strategy, we have developed into the only
international supplier of logistics systems to offer this broad spectrum of products. For the most part, our competitors are only active on a local or regional level or have a smaller pro-
extent from worldwide growth trends – such as globalisation, urbanisation and digital networking. Owing to the size of our company and our access to global markets, we are in a position to invest more in technologies and product innovations than smaller, local competitors with lower order volumes.
As an international company, we are able to achieve higher economies of scale than local competitors and can follow inter-national customers virtually anywhere and offer them better service worldwide as well. A prime example of this can be seen in our projects for PepsiCo, which we regularly serve in the Americas, Asia and Europe – and for which we implemented a major project in Russia recently.
Such an international business outlook requires investments. Can Interroll afford this strategy?
Daniel Bättig: Yes. Interroll has enjoyed financial solidity for years. This means that the expenditure required to safeguard and drive our future development can be financed through our cash flow, rather than having to be financed by banks and other lenders of capital. In the past year, we repaid our last long-term bank liabilities. This means that our business decisions do not have to take into account external interests, such as those of financial markets. This year, for example, the Portec takeover and our investments in infrastructural projects, such as the construction of the new Atlanta plant, were all financed by cash inflows from current business operations. This self- financing and our high equity ratio give us a clear advantage over our competitors. With this strategy, we create lasting value – i.e. we ensure that our shareholders, who have a long-term outlook, will continue to reap the rewards of their investment in Interroll well into the future.
duct portfolio. This gives us the opportunity to benefit to a great

28
R u b R i k
29
momentum foR ouR GRowth
ClimAte ChAnGe High energy efficiency protects the environment 48
GlobAlisAtionMore people and goods in motion 30
netwoRkinGThe whole world at a click 42
uRbAnisAtionThe flow of goods will continue to rise 36
3030
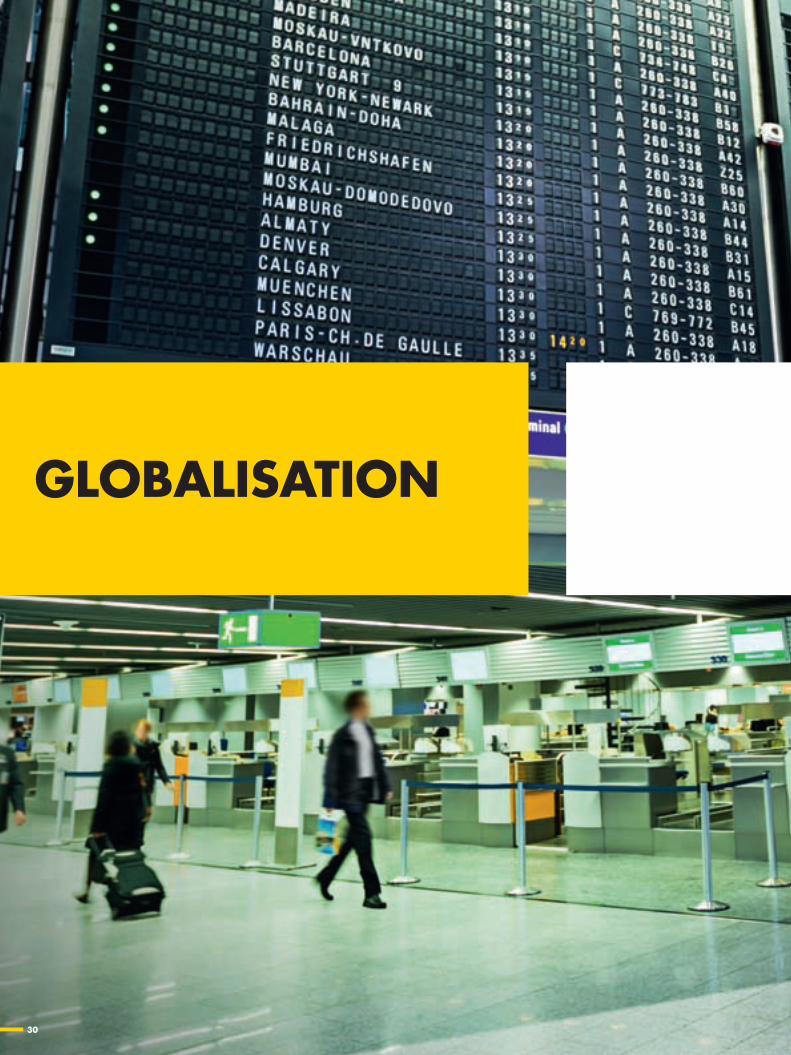
GlobAlisAtion
3131
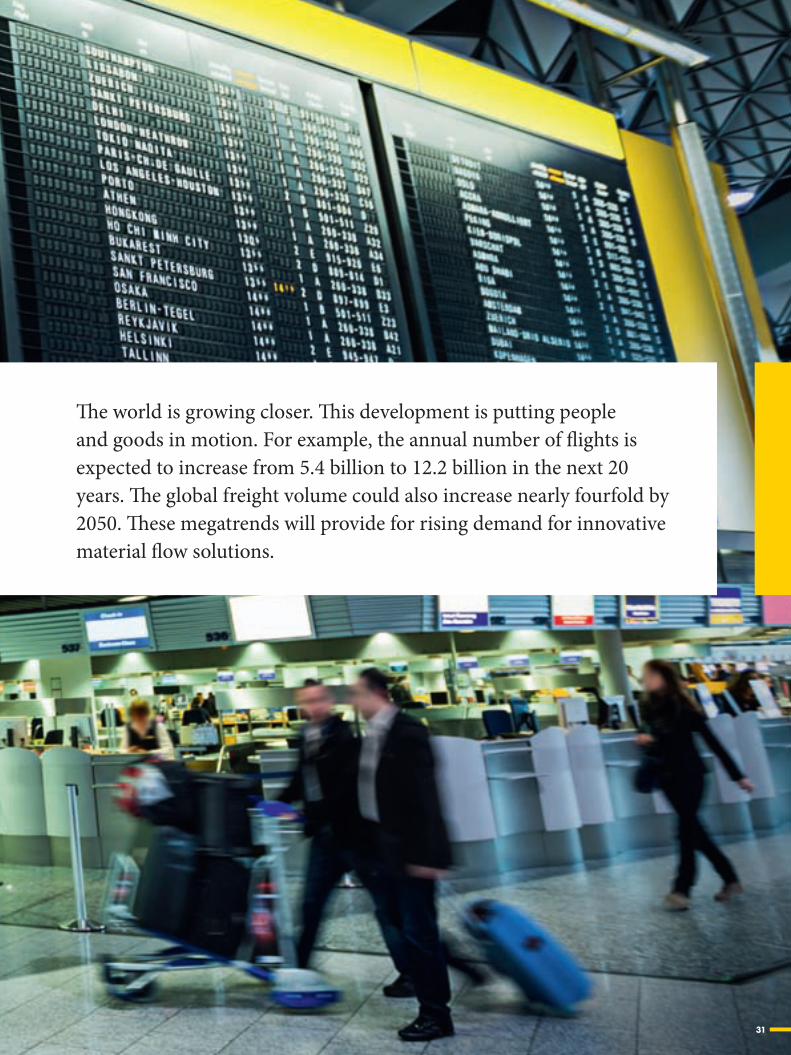
The world is growing closer. This development is putting people and goods in motion. For example, the annual number of flights is expected to increase from 5.4 billion to 12.2 billion in the next 20 years. The global freight volume could also increase nearly fourfold by 2050. These megatrends will provide for rising demand for innovative material flow solutions.
32
G l o b A l i s A t i o n
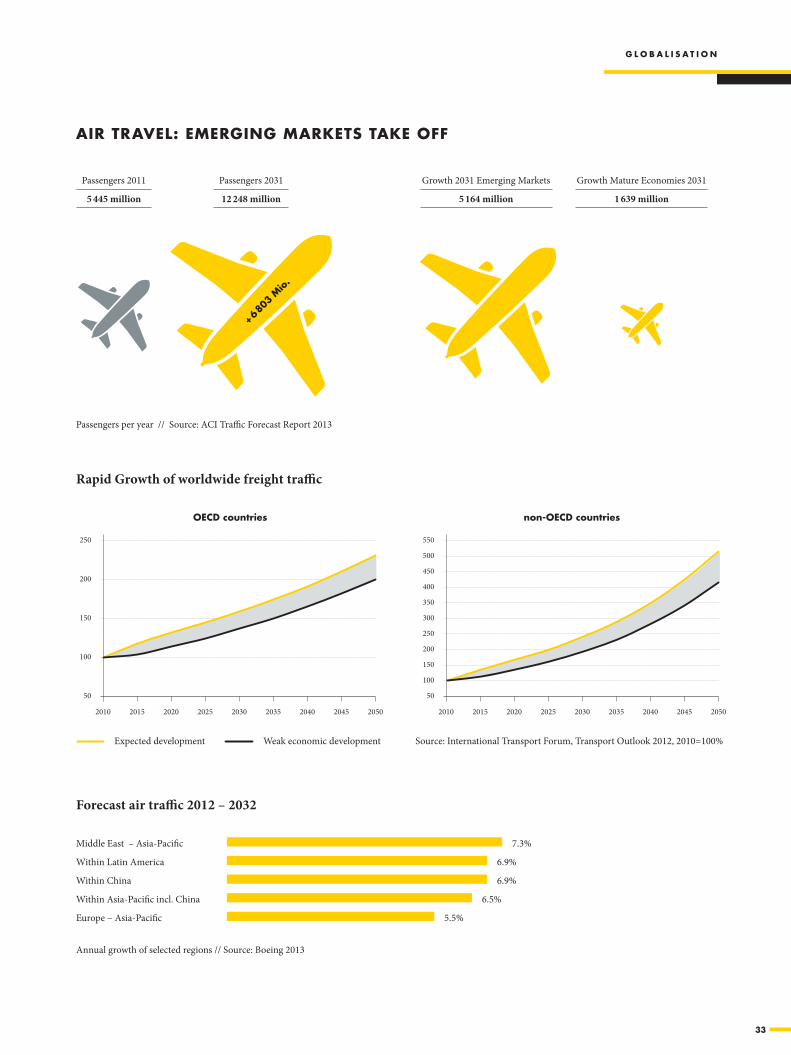
Globalisation is eliminating trade barriers and borders. High rates of growth can thus be expected in air traffic, which plays a central role
in international travel. According to the 2013 ACI Traffic Forecast Report, the annual number of passengers is expected to increase by around 125 percent by 2031.
In addition, most products or services have long been offered worldwide and many companies are expanding into new markets. The International Transport Forum (ITF) therefore expects an increase in global freight volume of up to 230 per-cent within the OECD countries by 2050. An increase of up to 550 percent is even forecasted for the remaining countries.
Cross-border competition requires efficient material flowBut the increase in freight traffic is not the only reason that additional investments in more efficient distribution ware-houses and centres are necessary. Competition is increasing in a global economy in which suppliers everywhere can take over new markets. So it is all the more important for compa-nies to organise their processes efficiently and to keep their costs under control – this is the only way to bring about the necessary preconditions for holding and expanding market positions.
In the area of internal logistics, Interroll helps its customers and users to stay ahead of the increasingly fierce competition. Our RollerDrives, which facilitate particularly efficient solu-tions with respect to material flow, are one example. These driven conveyor rollers based on 24 volt technology can usu-ally reduce operating costs significantly while considerably increasing material flow efficiency compared to conventional 400 volt driven conveyor systems.
Intelligent control saves up to 50 percent energyWhile central gear motors provide the power for entire lines with conven-tional conveyor technology, Roller-Drive solutions are designed decen-trally by Interroll. They are made up of independent segments powered by RollerDrives with integrated 24 volt motors. The intelligent Interroll ConveyorControl solution also always ensures that only those segments that are currently conveying unit loads are driven. Thanks to the ConveyorCon-trol system's modular design, new systems can be easily configured to meet customer-specific requirements or existing systems can simply be reconfigured. Depending on the mate-rial throughput, energy savings of up to 50 percent can be achieved.
moRe people And Goods in motion
33
+ 6 80
3 m
io.
250
200
150
100
2010 2015 2020 2025 2030 2035 2040 2045 2050
50
550
500
450
400
350
300
250
200
150
100
2010 2015 2020 2025 2030 2035 2040 2045 2050
50
G l o b A l i s A t i o n
Passengers per year // Source: ACI Traffic Forecast Report 2013
Source: International Transport Forum, Transport Outlook 2012, 2010=100% Expected development Weak economic development
Rapid Growth of worldwide freight traffic
oeCd countries non-oeCd countries
AiR tRAvel: emeRGinG mARkets tAke off
Passengers 2011
5 445 million
Passengers 2031
12 248 million
Growth 2031 Emerging Markets
5 164 million
Growth Mature Economies 2031
1 639 million
Forecast air traffic 2012 – 2032
Middle East – Asia-Pacific 7.3%
Within Latin America 6.9%
Within China 6.9%
Within Asia-Pacific incl. China 6.5%
Europe – Asia-Pacific 5.5%
Annual growth of selected regions // Source: Boeing 2013

34
G l o b A l i s A t i o n
Significant cost advantages during continuous operationsInterroll RollerDrives offer other advantages besides their energy-efficient basic concept. A feedback system delivers the energy that is generated during braking to other drive units.
Because brushless 24 volt drives require less maintenance due to how they are built, this lowers the costs for repairs and maintenance. Furthermore, the motors are in operation con-siderably less often, yet provide the same conveying capacity. This minimises the effects of wear, of course. Because 24 volt drives generate less heat, the costs of regulating the room temperature are much lower. RollerDrive solutions from Interroll are not only ideally suited for use in the original equipment used in modern logistics systems, but also repre-sent an ideal choice with retrofit projects. In most cases, the existing main drives, including the redirection station and
Rollerdrive: the intelligent drive solution
Today, Interroll ranks as the world's leading manufacturer of motordriven 24 volt conveyor rollers. These RollerDrives offer advantages not only in terms of energy consumption, but are also far superior to traditional solutions in terms of their design, installation, noise development, maintenance and safety. RollerDrives can be used to rebuild entire conveyor systems or to incrementally modernise existing systems.
A RollerDrive system operates decentrally: the respective drives are located directly inside the individual conveyor zones. This means these segments can be switched on and off independently of each other. In other words, movement only takes place when goods actually need to be moved.
Furthermore, the many different conveying parameters in the individual zones, for instance the running speed, braking, rolling direction or performance speed of RollerDrives can be changed with the help of an intelligent control solution called the ConveyorControl. This system is much more userfriendly than complex programmable controls (PLC). And users require no programming skills. It can be operated simply by a mouse click on the graphic user interface of a software program that runs on commercially available Windows computers.
“Innovative 24 volt drives and drum motors from Interroll facilitate an extremely efficient
material flow. This is how we help our customers and system users to master the
challenges of globalised competition.”Dr. Christoph Reinkemeier, Executive Vice President
Global Sales & Service at Interroll Group
35
G l o b A l i s A t i o n
back-up rollers, only need to be dis-assembled. The new RollerDrives can then be installed in the existing con-veyor frame. Based on the experiences of many leading system integrators, this represents an extremely effective way to increase the performance of many older systems. In fact, this modernisation measure often pays off in only a few months.
Efficient conveyor solutions for airports Interroll solutions also score high with respect to their high perfor-mance and efficiency in places where people and their luggage need to be transported as safely and comfortably as possible. For this reason, these systems are already used at many airports all over the world today. And, by the way, they are not only used in the area of check-in and security, where drum motors, conveyor rollers, redirection drums and Intelliveyor conveyor modules ensure a smooth flow of materials. They are also used quite successfully in conveying and sorting baggage, freight handling, and catering.
Through the acquisition of Portec Inc. in 2013, Interroll managed to significantly strengthen its position in this field. Portec with its main headquarters in Colorado, USA, has ranked among the leading suppliers in the area of belt curves for decades. Their products are used not only by airports, but also by many distribution centres, and courier and postal service providers.
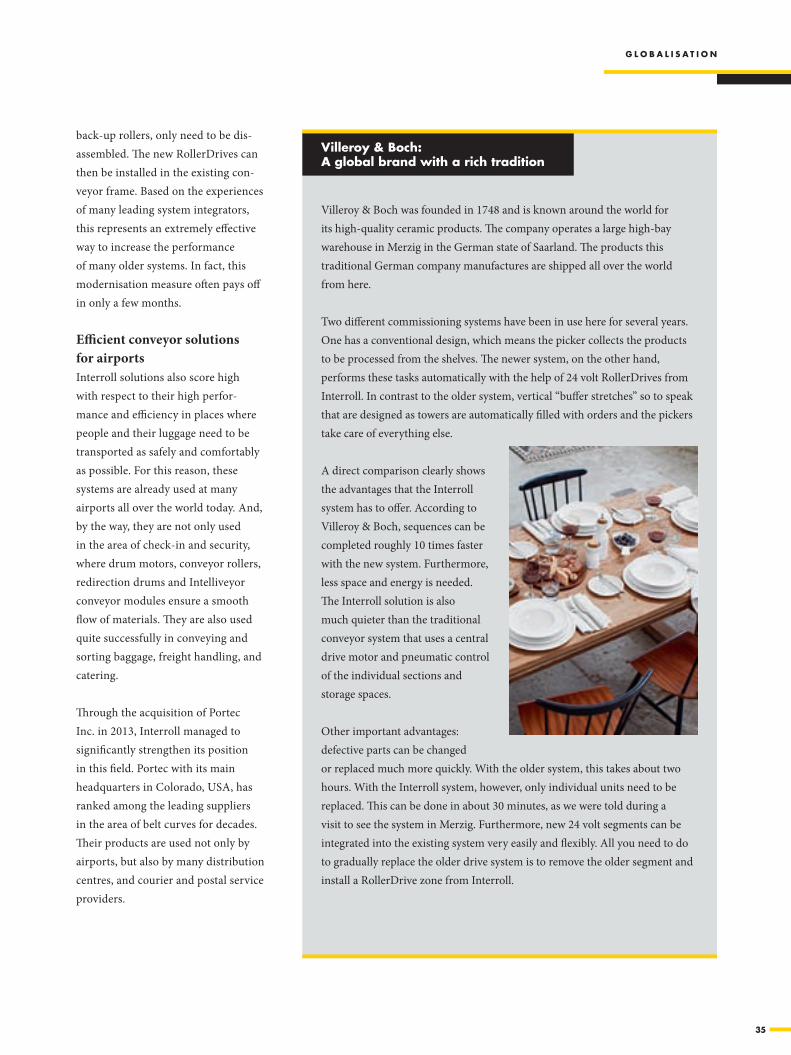
Villeroy & Boch was founded in 1748 and is known around the world for its high-quality ceramic products. The company operates a large high-bay warehouse in Merzig in the German state of Saarland. The products this traditional German company manufactures are shipped all over the world from here.
Two different commissioning systems have been in use here for several years. One has a conventional design, which means the picker collects the products to be processed from the shelves. The newer system, on the other hand, performs these tasks automatically with the help of 24 volt RollerDrives from Interroll. In contrast to the older system, vertical “buffer stretches” so to speak that are designed as towers are automatically filled with orders and the pickers take care of everything else.
A direct comparison clearly shows the advantages that the Interroll system has to offer. According to Villeroy & Boch, sequences can be completed roughly 10 times faster with the new system. Furthermore, less space and energy is needed. The Interroll solution is also much quieter than the traditional conveyor system that uses a central drive motor and pneumatic control of the individual sections and storage spaces.
Other important advantages: defective parts can be changed or replaced much more quickly. With the older system, this takes about two hours. With the Interroll system, however, only individual units need to be replaced. This can be done in about 30 minutes, as we were told during a visit to see the system in Merzig. Furthermore, new 24 volt segments can be integrated into the existing system very easily and flexibly. All you need to do to gradually replace the older drive system is to remove the older segment and install a RollerDrive zone from Interroll.
villeroy & boch: A global brand with a rich tradition

3636
uRbAnisAtion
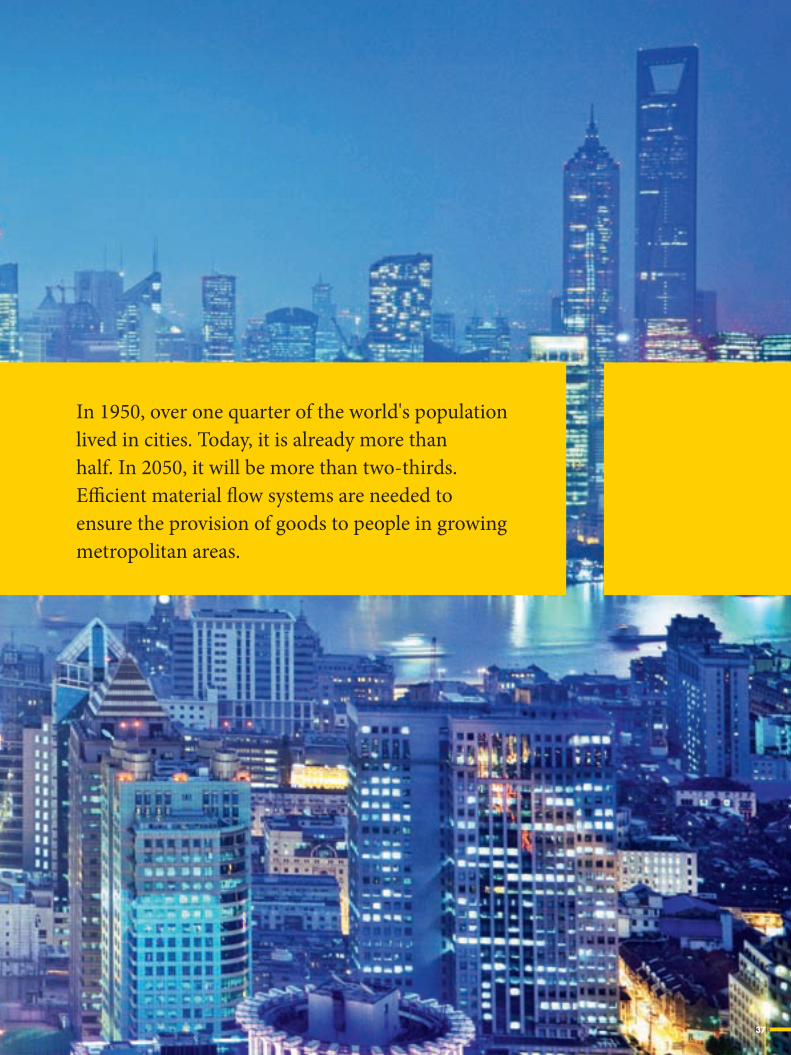
3737
In 1950, over one quarter of the world's population lived in cities. Today, it is already more than half. In 2050, it will be more than two-thirds. Efficient material flow systems are needed to ensure the provision of goods to people in growing metropolitan areas.
38
u R b A n i s A t i o n
The concentration of the world's population in metropolitan regions continues unabated. Whereas in 1950 only 28.8 percent of all people
were city dwellers, today it is already more than 50 percent. According to estimates by the United Nations' Department of Economic and Social Affairs, this number will increase to 68.7 percent by the year 2050.
This global urbanisation requires continuous efforts in order to ensure the provision of metropolitan areas with food and daily necessities. But there are other factors causing the requirements in internal logistics to become ever more complex.
Consumers want choiceAmong other things, the volume of goods is growing along with the ever-greater concentration of more and more people in increasingly congested spaces. In developing nations, the middle class and the demand for goods and services are also growing along with the cities. The desire for more variety within individual groups of products is also growing.
Retail businesses are also becoming more diverse. For instance, the times are long gone in which any given product can only be found in supermarkets. In addition, specialty stores with a limited range of products and major department stores provide all the daily necessities, while e-commerce retailers and a multitude of smaller sales outlets provide for the needs of consumers. This intricacy has given rise to highly complex distribution chains through which the internal logistical processes are also becoming increasingly elaborate.
Metropolitan areas require professional internal logisticsAs a globally operating and well-known supplier with a broad range of products, Interroll has specialised for many years in providing key products that are optimally tailored to the vari-ous needs of modern, internal logistics. For instance, Interroll offers a broad range of conveyor rollers, RollerDrives, drum motors and corresponding control systems. The product range also includes sorters, flow storage systems and other solutions that provide the basis for realising an especially efficient flow of material.
Drum motors as innovative drive solutions Drum motors from Interroll are not only extremely durable, reliable and low on maintenance; special attention was also given to making them as energy efficient as possible during their development. They also meet the highest demands for hygiene.
One fundamental constructional advantage that Interroll drum motors offer is that they take up significantly less space than conventional drive motors. No further expensive, failure-prone parts, such as chains, v-belts, clutches, bearings, support constructions, or other special protective devices are needed to operate the drum motor. The entire drive unit, including the bearings, is found inside the drum capsule. The drives also meet the requirements of the international protec-tion classes IP66 and IP69k.
the flow of Goods will Continue to Rise
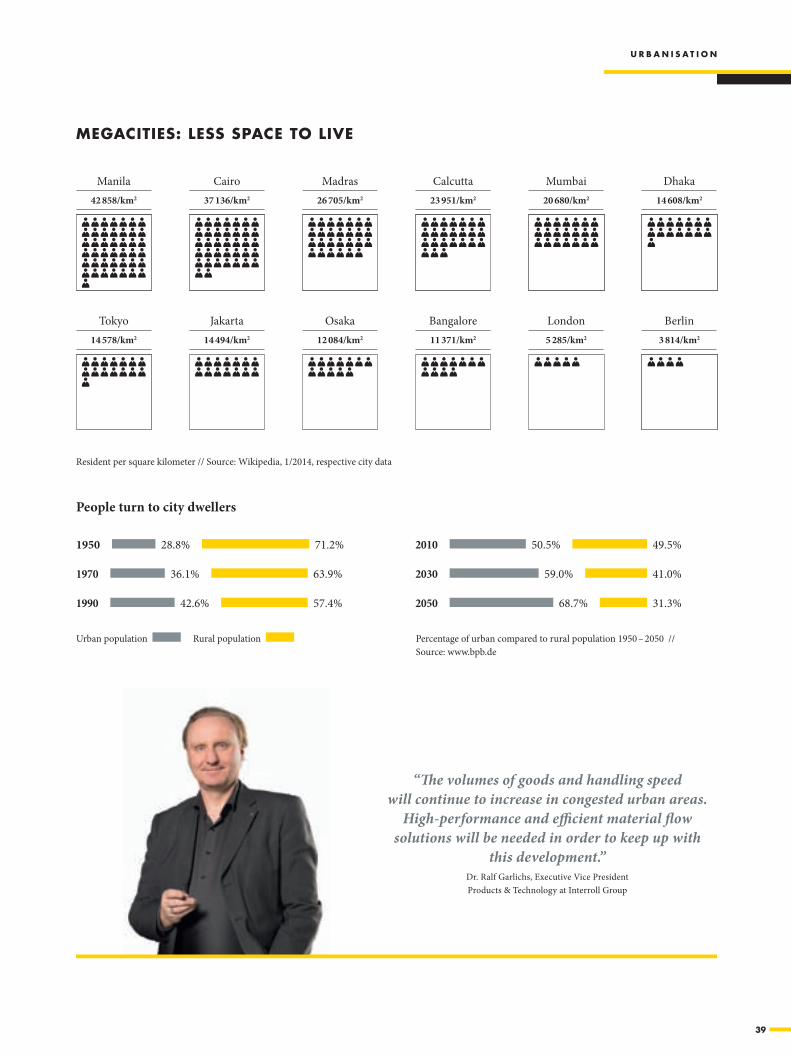
39
1950 28.8% 71.2%
1970 36.1% 63.9%
1990 42.6% 57.4%
2010 50.5% 49.5%
2030 59.0% 41.0%
2050 68.7% 31.3%
u R b A n i s A t i o n
Percentage of urban compared to rural population 1950 – 2050 // Source: www.bpb.de
Urban population Rural population
People turn to city dwellers
“The volumes of goods and handling speed will continue to increase in congested urban areas.
High-performance and efficient material flow solutions will be needed in order to keep up with
this development.”Dr. Ralf Garlichs, Executive Vice President Products & Technology at Interroll Group
meGACities: less spACe to live
Resident per square kilometer // Source: Wikipedia, 1/2014, respective city data
Tokyo 14 578/km2
Cairo37 136/km2
Jakarta 14 494/km2
Madras26 705/km2
Osaka 12 084/km2
Calcutta23 951/km2
Bangalore 11 371/km2
Mumbai 20 680/km2
London 5 285/km2
Berlin 3 814/km2
Dhaka 14 608/km2
Manila 42 858/km2

40
u R b A n i s A t i o n
market leader on drives for check-out desks
inteRRoll ensuRes An effiCient flow of Goods
Six out of ten of the world’s supermarkets rely on drum motors from Interroll. For good reason: Interroll offers drum motors and conveyer rollers that are specially designed for conveyor applications in supermarkets and meet these demands just perfectly.
For example, a ready to install cassette system can be used as a drive for conveyer belts at checkout desks and other equipment at a supermarket, such as reverse vending machines. The Interroll cassette system is equipped with a patented rapid clamping system for deflection rollers that makes it much easier to install and change a conveyer belt.
Fast working and energyefficient solutions can be developed to meet all needs thanks to the wide range of equipment that spans from mounting supports and nondriven rollers to preassembled, ready to install conveyer cassettes.
1 2
3
prOducers
dealers
distributiOn centre
E-commerce
Specialist retailer
Supermarket
Conveying, distributing, sorting: Interroll products for internal logistics are used throughout the supply chain

41
u R b A n i s A t i o n
Quick and easy to clean To start with this means that, even under the most difficult sur-rounding conditions, no soil, dust or water is able to penetrate into the drive and cause failures. Furthermore, special models also withstand the effects of high pressure cleaning. This shortens the cleaning cycles and thus significantly lowers the operating costs.
Hygiene the number one priority According to an estimate from the World Health Organization (WHO), even in industrial nations, roughly 30 percent of the population is afflicted by food-related diseases. Nevertheless, this not only poses a risk to people’s health and lives, the outbreak of diseases due to contaminated food can dismantle companies or affect the performance of entire economies.
Interroll pays particularly close attention to hygiene require-ments with its product development. Interroll drum motors for the food industry stand up to even intensive cleaning processes in which high-pressure, steam or chemicals are used without breaking down.
For example, synchronous drum motors from Interroll meet the material requirements that the USDA/FDA and the EU ordinance EG 1935/2004 make on use in the area of food. Only recently, they were certified as the only drum motors for use in hygienic industrial applications by the European Hygienic Engineering & Design Group (EHEDG) following in-depth testing.
82 percent overall efficiency The compact design is also conducive to extremely energy-effi-cient operation. For example, synchronous drum motors from Interroll achieve overall efficiency of 82 percent (motor: 89 percent, translation: 92-95 percent).
They therefore rank among the highest performance and most energy-efficient conveyer belt drives that have ever been devel-oped. Synchronous drum motors from Interroll also require only very little maintenance compared to other asynchronous drives. And they require about 40 percent less energy and release significantly less heat than gear motors that have a worm gear drive.
Because waste heat is so low with drum motors, less energy is needed to cool the rooms that these types of conveyer solutions are operated in. This represents an important cost factor, par-ticularly when it comes to processing foods and in deep freeze environments.
Virto Group, a company based in Spain, ranks among the leaders in the food industry, particularly when it comes to frozen vegetables. Since 2010, the company has been operating the most technologically advanced production centre in the world in Extre madura in Southern Spain to manufacture spinach, tender beet and chard leaves.
Interroll drum motors not only ensure a reliable and efficient material flow around the clock at the produc-tion centre in Ulbasa Ultracongelados, thanks to how they are built, but also meet the highest demands for hygiene in the area of foods. These drives even stand up to intensive cleaning processes using high pres-sure and steam without the risk of a breakdown. In comparison with gear motors, they significantly lower operating costs due to shorter cleaning times and lower water consumption.
Quality vegetables

42
netwoRkinG

43
At the beginning of 2000, around 300 million people owned a computer with Internet access. At the beginning of last year, this figure had already increased to over 2.7 billion – not even counting the mobile Internet. Online trading has also become more important as a result of this global networking. The world of internal logistics will face significant changes in the years to come because of this trend.
44
n e t w o R k i n G
Most people take the Internet for granted. Never-theless, the World Wide Web as we know it today is only about 20 years old. During this period, the
number of users has grown at a breath-taking pace. Even now, more than 200,000 new households connect with the Internet for the first time each day.
But the Internet has not only fundamentally changed how information is exchanged and personal relationships are main-tained. Companies too recognized early the possibilities global networking has to offer and gradually started shifting their business processes to virtual space. Retailers are also faced with challenges that were completely unknown just decades ago.
Internal logistics has changed from being a cost to become a competitive factor With the emergence of e-commerce, consumer expectations have risen, not only with respect to being able to choose from a greater variety of products. Consumers have also become more demanding with respect to how quickly orders are processed and products are delivered. This acceleration in processes has fundamentally changed the importance of internal logistics. It has long changed from being a cost factor and become a com-petitive factor and even an important differentiation instru-ment in competing. Companies that fall behind will lose their customers relatively quickly and eventually go out of business. Solutions from Interroll have been helping companies to meet these higher demands for years now. For example, material handling solutions that feature crossbelt sorters are capable of processing extremely large quantities of bulk goods and huge product varieties. Depending on what needs to be shipped, they can be used to transport and discharge cargo that weighs only 50 grams or up to about 35 kg – in other words, as much as 70 percent of the packages that companies like Amazon need to deliver.
Dependable, quiet and compact Crossbelt carriers that feature a patented drive make up the heart of these sorting solutions. They are based on a sim-ple mechanical principle, require no special control IT, and contain only very few wear parts. Sorters from Interroll can therefore easily be put to continuous use for ten years with only minimal maintenance. Besides virtually silent operation of under 68 dBA on average, one of the lowest values in the industry, they are also known for how little space they take up. For instance, a vertical sorter equipped with a crossbelt carrier 400 x 400 millimetres in size requires stand space only 1.7 meters in width. More space can even be saved by centrally integrating the outfeed transport path for containers that are already full between the upper and the lower tower, something unique in the marketplace to date.
Integrated processing of returns Because of the continued success of Internet trade, companies must also deal with more returned products. For instance, the return rate with clothing can exceed 50 percent at times. Crossbelt sorters from Interroll are also an excellent choice when it comes to performing these tasks. With a modular system design that includes intelligent sorting technology, both incoming and outgoing shipments can be processed.
The pace will continue to pick up in the area of e-commerce in the years to come. One of the reasons lies in mobile use of the Internet via smartphones. This makes spontaneous purchases from mail-order companies possible. But only those companies who have access to a high-performance material flow solution will be able to benefit from these new business opportunities.
the whole woRld At A CliCk
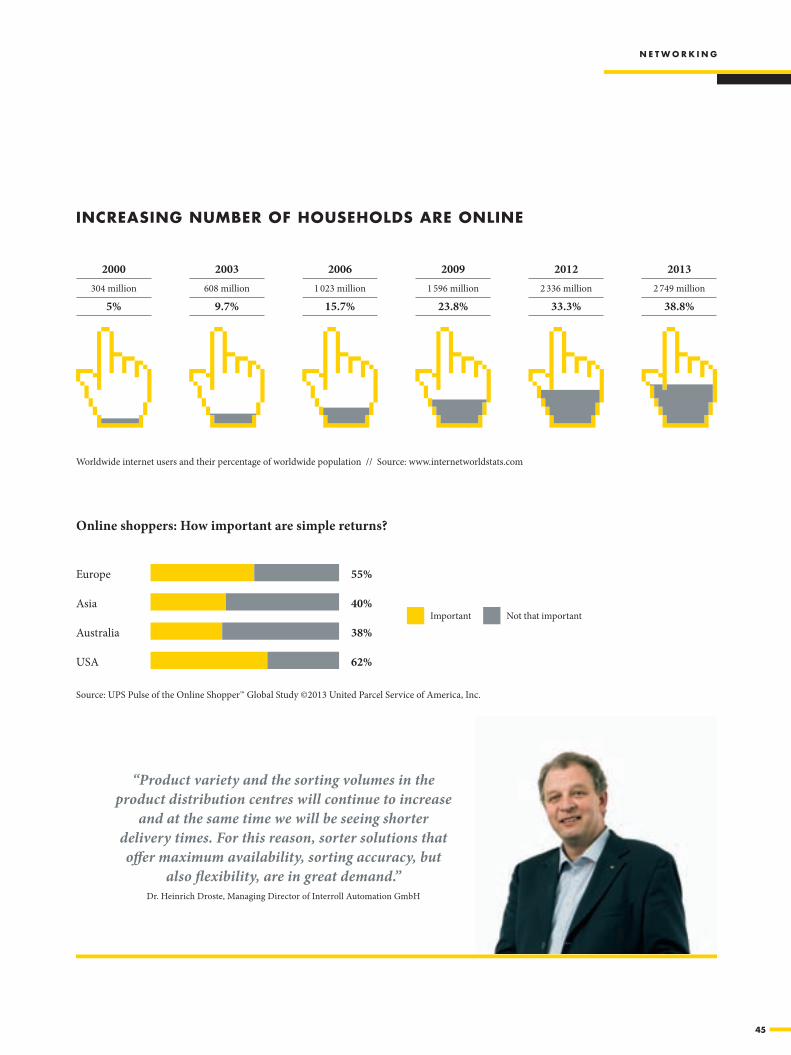
45
n e t w o R k i n G
Europe 55%
Asia 40%
Australia 38%
USA 62%
Source: UPS Pulse of the Online Shopper™ Global Study ©2013 United Parcel Service of America, Inc.
Online shoppers: How important are simple returns?
inCReAsinG numbeR of households ARe online
Worldwide internet users and their percentage of worldwide population // Source: www.internetworldstats.com
2000304 million
5%
2003608 million
9.7%
20061 023 million
15.7%
20091 596 million
23.8%
20122 336 million
33.3%
20132 749 million
38.8%
“Product variety and the sorting volumes in the product distribution centres will continue to increase
and at the same time we will be seeing shorter delivery times. For this reason, sorter solutions that offer maximum availability, sorting accuracy, but
also flexibility, are in great demand.”Dr. Heinrich Droste, Managing Director of Interroll Automation GmbH
Important Not that important

46
n e t w o R k i n G
hiGh potentiAl in upCominG mARkets
Latin America
$ 45.98 billion
22.1%
33.0%
Middle East & Africa
$ 27.00 billion
31.0%
31.3%
Asia-Pacific
$ 388.75 billion
23.1%
44.6%
$ E-commerce sales Sales growth 2013 compared to previous year Percentage of online buyers compared
to Internet usersSource: eMarketer
North America
$ 419.53 billion
12.5%
72.0%
Western Europe
$ 291.47 billion
14.0%
72.3%
Middle & Eastern Europe
$ 48.56 billion
20.9%
41.6%
dhl relies on sorters from interroll
The multichannel mailorder company HSE24 ships its entire range of products via the DHL logistics centre in Greven, Germany, from diamond necklaces to cosmetics and healthcare products, but also even LCD televisions. A highperformance material flow solution is essential to ensuring rapid delivery of the products ordered and processing returns swiftly.
Crossbelt sorters from Interroll perform the most important function in processing returns. After the parcels that have been returned have been transported to the logistics centre, they are automatically sorted here for repackaging or reconditioning.
47
n e t w o R k i n G
interview
What challenges does the logistics industry need to prepare itself for in the future?The most important future trends in logistics include individualization, sustainability and urbanization. The complexity will increase exponentially, and with it, the demands that are placed on problem-solving expertise. More than ever before, companies will have to leverage the full logistics potential in order to stand up to global competition.
How will they be able to do this?The question is how do we convert these challenges into innovations? At the efficiency cluster LogistikRuhr, we have been conducting research on innovations and products that will allow for 100 percent performance to be achieved with only 75 percent of the current resources. This is a beginning, but in order to become a driver of innovation, logistics will have to assume more leadership responsibility in developing new technologies in the future.
How can logistical structures be improved?I see the greatest potential in standardization of software and methods. Here, cloud computing opens up completely new dimensions in cross-company collaboration as well as double digit synergy potential.
Industry 4.0 is the keyword in the production environment …Now, following the steam engine, assembly line production, and automation on the basis of IT systems, we are experiencing the fourth industrial revolution. Things will connect autonomously and set themselves in motion in order to organize their own route within the supply chain. The fourth industrial revolution will change our economy faster than all of the revolutions that preceded it.
Prof. Dr. Michael ten Hompel, Fraunhofer Institute of Material Flow and Logistics (IML), Dortmund
Every company that is actively involved in the supply chain will have to face this challenge. This explains why not just ship-ping companies, but also express, courier, and package service providers all over the world rely on sorting solutions from Inter-roll. For example, Interroll has installed these types of systems in the distribution centres of DHL, UPS and Amazon, but also Chinese Post and Zalando.
Economical and future-proof Due to the high price pressures in Internet trade, the operating costs of the systems used in internal logistics will also play an increasingly important role. Because sorting represents one of the most costly activities in internal logistics, next to pick-ing, high-performance sorting solutions are becoming increasingly important also from a cost perspective.
The capital recovery times (return on investment, ROI) of two years on average for Interroll solutions are significantly shorter than those of competitive solutions. This represents a key advantage, especially in an environment dominated by fast-changing offers and product portfolios. In addition, mechanical sorters from Interroll save up to 50 percent energy in comparison with the linear motors used in other sorting systems.
Furthermore, Interroll guarantees not only outstanding ongoing support and fast delivery of spare parts, solutions from Interroll are also constantly further developed. Users can therefore be sure that they will own a highly competitive solution in the future as well.
“We are currently experiencing the fourth industrial revolution”

48
ClimAte ChAnGe

49
The demand for energy will continue to grow. According to the forecasts of the International Energy Agency (IEA), the annual demand for energy on our planet could well increase by around one third by 2035. Higher energy efficiency is therefore becoming more and more important in protecting the environment.
50
C l i m A t e C h A n G e
hiGh eneRGy effiCienCy pRoteCts the enviRonment
The human race needs energy – for living, every-day care, transportation, economic development, and to improve people's living conditions.
Nevertheless, energy is still largely produced from fossil fuels, and this, in turn, releases the greenhouse gas carbon diox-ide. According to calculations from the International Energy Agency (IEA) in Paris, global CO2 emissions could be reduced by another 23 percent by 2035.
Internal logistics have an important contribution to make here Increasing energy efficiency can be considered one of the most important measures in counteracting the environmental effects this development is expected to have. According to an IEA study, for example, the world's projected energy consumption could be reduced by 17 to 33 percent by 2050 by improving the energy efficiency of buildings, transportation and industrial processes. Internal logistics must also face up to this challenge that will be accompanied by stricter regulations and threshold values in the years to come. Energy-efficient solutions from Interroll will help to master this challenge.
Modernization measures pay off Companies must not even invest in completely rebuilding their warehouse systems in order to benefit from the effi-ciency advantages that innovative Interroll technologies offer. Targeted modernization of the existing equipment usually rep-resents an economical alternative that increases performance and yet saves resources.
Carrying out these types of retrofit measures opens up signif-icant savings effects. Depending on the industry, warehouse systems are technologically obsolete anyway or at least in need of replacement due to the wear and tear of everyday use after seven to ten years. Besides the disorders that take place
more and more often, this results in high repair costs and, even more importantly, unnecessarily high energy consumption. Significant savings can be achieved rather quickly with retrofitting.
Further advantages: there is no need for operations to be shut down during retrofitting. In fact, in most cases, the existing installation can be gradually equipped with more modern com-ponents. Furthermore, lower energy costs can have a positive effect on bank ratings when it comes to taking out loans. Rising or highly volatile energy costs have an effect on the yield and therefore could lead to a downgrade in the credit rating if interest rates rise.

51
1 600
1 400
1 200
1 000
800
600
400
200
0
1990 2011 2020 2025 2030 2035
20 000
16 000
12 000
8 000
4 000
0
C l i m A t e C h A n G e
eneRGy effiCienCy: the hidden eneRGy souRCe
In million tons oil equivalent (Mtoe). Comparison of energy consumption in 2010 of eleven industrial countries with energy quantity which was reduced in the same year due to the efficiency improvements initiated in 1974. The countries are Australia, Denmark, Finland, France, Germany, Italy, Japan, the Netherlands, Sweden, the United Kingdom and the United States. Source: IEA 2013 // Source: IEA 2013
Mto
e
Oil Electricity Gas Coal Other Avoided energy consumption
Million tons oil equivalent (Mtoe), without tightened measures for climate protection // Source: IEA 2013
Worldwide energy demand 1990 – 2035
Mto
e
Firm, low maintenance and efficient: Interoll Drum Motors have a total efficiency of up to 82 percent
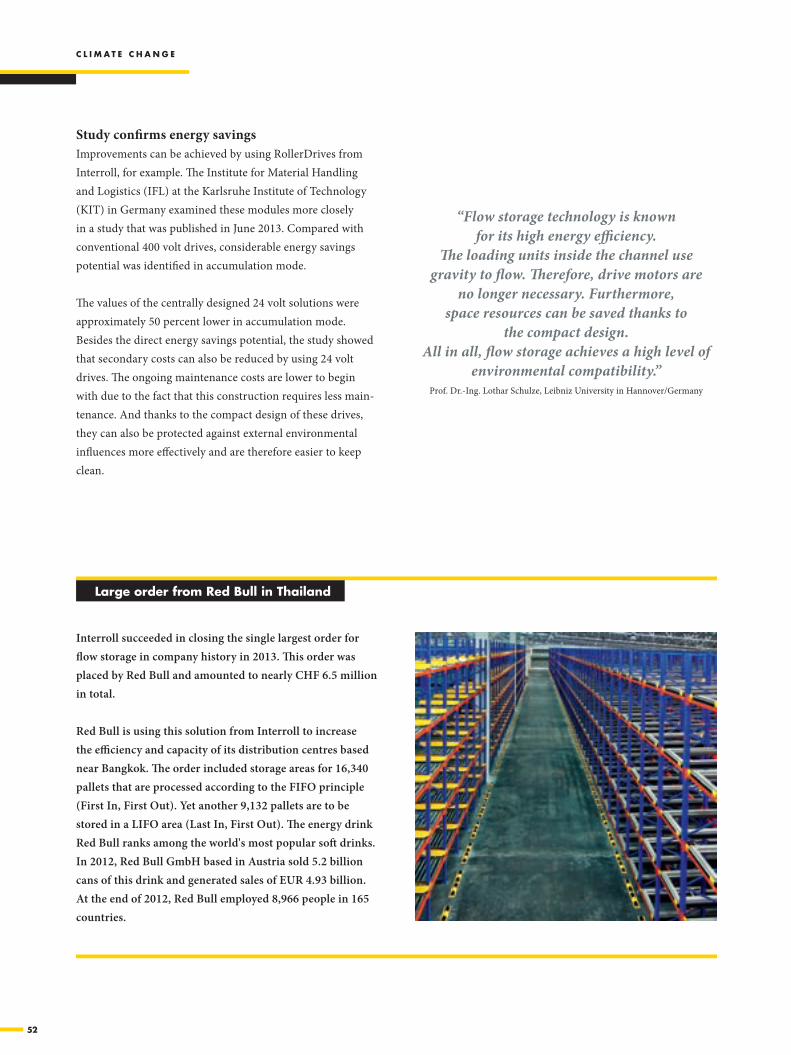
52
C l i m A t e C h A n G e
Study confirms energy savings Improvements can be achieved by using RollerDrives from Interroll, for example. The Institute for Material Handling and Logistics (IFL) at the Karlsruhe Institute of Technology (KIT) in Germany examined these modules more closely in a study that was published in June 2013. Compared with conventional 400 volt drives, considerable energy savings potential was identified in accumulation mode.
The values of the centrally designed 24 volt solutions were approximately 50 percent lower in accumulation mode. Besides the direct energy savings potential, the study showed that secondary costs can also be reduced by using 24 volt drives. The ongoing maintenance costs are lower to begin with due to the fact that this construction requires less main-tenance. And thanks to the compact design of these drives, they can also be protected against external environmental influences more effectively and are therefore easier to keep clean.
large order from Red bull in thailand
Interroll succeeded in closing the single largest order for flow storage in company history in 2013. This order was placed by Red Bull and amounted to nearly CHF 6.5 million in total.
Red Bull is using this solution from Interroll to increase the efficiency and capacity of its distribution centres based near Bangkok. The order included storage areas for 16,340 pallets that are processed according to the FIFO principle (First In, First Out). Yet another 9,132 pallets are to be stored in a LIFO area (Last In, First Out). The energy drink Red Bull ranks among the world's most popular soft drinks. In 2012, Red Bull GmbH based in Austria sold 5.2 billion cans of this drink and generated sales of EUR 4.93 billion. At the end of 2012, Red Bull employed 8,966 people in 165 countries.
“Flow storage technology is known for its high energy efficiency.
The loading units inside the channel use gravity to flow. Therefore, drive motors are
no longer necessary. Furthermore, space resources can be saved thanks to
the compact design. All in all, flow storage achieves a high level of
environmental compatibility.”Prof. Dr.-Ing. Lothar Schulze, Leibniz University in Hannover/Germany
53
C l i m A t e C h A n G e
Synchronous drum motors stand out thanks to their extremely high efficiency The drum motors from Interroll represent yet another example of the highest possible energy efficiency. They were designed especially for use in belt conveyors and connected conveyor systems. And synchronous drum motors are particularly economical when it comes to how they use the energy they are supplied with. They achieve overall efficiency of 82 percent. Compared with gear motors that have worm gear drives, they require roughly 40 percent less energy and emit significantly less heat.
Gravity facilitates the flow of goods When it comes to storage systems, Interroll relies on proven dynamic storage products. And this technology has brought a roughly 35 percent increase in capacity within the same amount of space for Procter & Gamble in Crailsheim, Ger-many, for example. Flow storage utilizes the effect of inclined planes during the flow of goods. The loading units are placed on slightly tilted roller beds and thus are able to move in the desired direction on their own due to gravity. In contrast to other solutions, there is no need to supply power to these drive systems. Furthermore, the transport routes for forklift trucks can be shortened by up to 80 percent.
According to a study conducted by the consulting firm Intralenco, significant advantages result with pallet ware-houses that have medium to high handling capacities in com-parison with competitive solutions. This study is based on a detailed calculation that takes energy consumption, the initial purchase price, installation costs, space usage, personnel usage, and depreciation into account. The bottom line is that flow storage can deliver monthly savings of up to 28 percent per pallet space compared to competitive solutions.
A study conducted by the Leibniz University in Hannover, Germany, in 2012 under the scientific direction of Prof. Dr.-Ing. Lothar Schulze in cooperation with the Southeast Uni-versity in Nanjing, China, also confirms that flow storage is known for its high energy efficiency. According to this study, flow storage systems also achieve a high degree of environ-mental compatibility.
interview
Will the subject of energy consumption continue to become more important in the area of internal logistics?Every company that transports goods needs energy, and this will cost more in the long term. Competitive pressure alone is already forcing companies to save money. Nevertheless, energy efficiency is no longer only a cost concern. Today, legislators, consumers, and the companies themselves are paying more and more attention to protecting the environment.
Can Interroll benefit from this development?Yes. Our solutions help companies to stand up to these challenges. And if achieving an efficient flow of goods is the main objective, then our innovative solutions are able to demonstrate their full potential. The same can be said, by the way, for our 24 volt drives, drum motors, sorters, and flow storage.
How efficient are these systems?Our drives achieve efficiency rates of up to 82 percent. With sorters, we mechanically convert the actuator movement into a transverse movement with practi-cally no friction losses. And with our flow storage, we refrain from using any additional energy whatsoever and rely on gravity instead.
So, what developments will we be seeing in the future?We will be focusing more closely on sustainability as a whole. After all, energy efficiency is only one concern. For this reason, we are currently looking more closely at how we can realize an entirely closed life cycle with our products.
Dr. Ralf Garlichs, Executive Vice President Products & Technology at Interroll Group
“Energy efficiency is no longer only a cost concern”


C o r p o r a t e G o v e r n a n C e C o n t e n t s
55
Corporate GovernanCe
Contents
1 Introduction 56
2 Group structure and shareholders 56
3 Capital structure 57
4 Operational management structure 58
5 Board of Directors 61
6 Internal organisation 64
7 Competence regulations 65
8 Information and control instruments 65
9 Group Management 66
10 Compensation system of the Board of Directors 69
11 Compensation system Group Management 69
12 Shareholders’ Participation Rights 72
13 Change in control and defence measures 73
14 Auditor 73
15 Information Policy 74
56
I n t r o d u C t I o n
G r o u p S t r u C t u r e a n d S h a r e h o l d e r S C o r p o r a t e G o v e r n a n C e
1 IntroduCtIon
Base of the corporate governance reportThe corporate governance report 2013 of the Interroll Group refers to the official guideline of the SIX Swiss Exchange on Corporate Governance, best practice related to the hustler initiative as well as to the reg-ulations of the “Swiss code of best practice for corporate governance”.
Cross referencesIn order to minimise repeated comments, certain sections cross refer to other sections, especially to the financial report.
Compensation reportThe compensation report is part of the financial statements of Interroll Holding Ltd.
2 Group StruCture and ShareholderS
Group structureThe operational management structure is disclosed in chapter 4 of this report.
Mother company and stock listingThe mother company of the Group, Interroll Holding Ltd., is domiciled in Sant’Antonino/TI, Switzerland. Its registered shares are traded in the main segment of the SIX Swiss Exchange under the security number 637289. Further notes to the listing can be found in chapter “Interroll on the Capital Market” on page 4 of the annual report.
Consolidation rangeSubsidiaries belonging to the consolidation range of the Interroll Group are disclosed in note 8.4 of the Group’s financial statements. There are no other equity instruments publicly traded expect those of Interroll Holding Ltd.
Significant shareholdersAll significant shareholders holding a reportable participation are disclosed in note 3.6 (“Significant shareholders”) of the financial statements of Interroll Holding Ltd.
Cross shareholdingsThe Interroll Group does neither maintain capital nor voting rights with other entities.
57
C o r p o r a t e G o v e r n a n C e C a p I t a l S t r u C t u r e
3 CapItal StruCture
Share capital and voting rights The share capital of Interroll Holding Ltd. amounts to CHF 8.5 million and is made up of 854 000 fully paid registered shares with a par value of CHF 10 each. Each share has one voting right.
Authorised or conditional capitalThere is no authorised or conditional capital.
Other equity or participation instrumentsFurthermore, there are no other equity-like instruments such as profit sharing rights or participation certificates.
Changes in capitalIn the year under review, the share capital remained unchanged at CHF 8.5 million.
Limitations on transferability and nominee rightsInformation about limitations on transferability and other nominee rights of the shareholders is disclosed in chapter 12 (“Shareholders’ participation rights”) of this report on the corporate governance.
Convertible bonds and optionsThere are no convertible bonds outstanding. In 2006, the Board of Directors approved a management share option plan. Further information on this plan is disclosed in chapter 7.1 of the notes to the financial statements of the Interroll Group. The option plan ceased as per 30 September 2013.
Further information on the shareholders’ equityAdditional information on the equity is disclosed in the financial statements of the Group (see 1.5 – “Consolidated statement of changes in equity”) and in the respective notes.
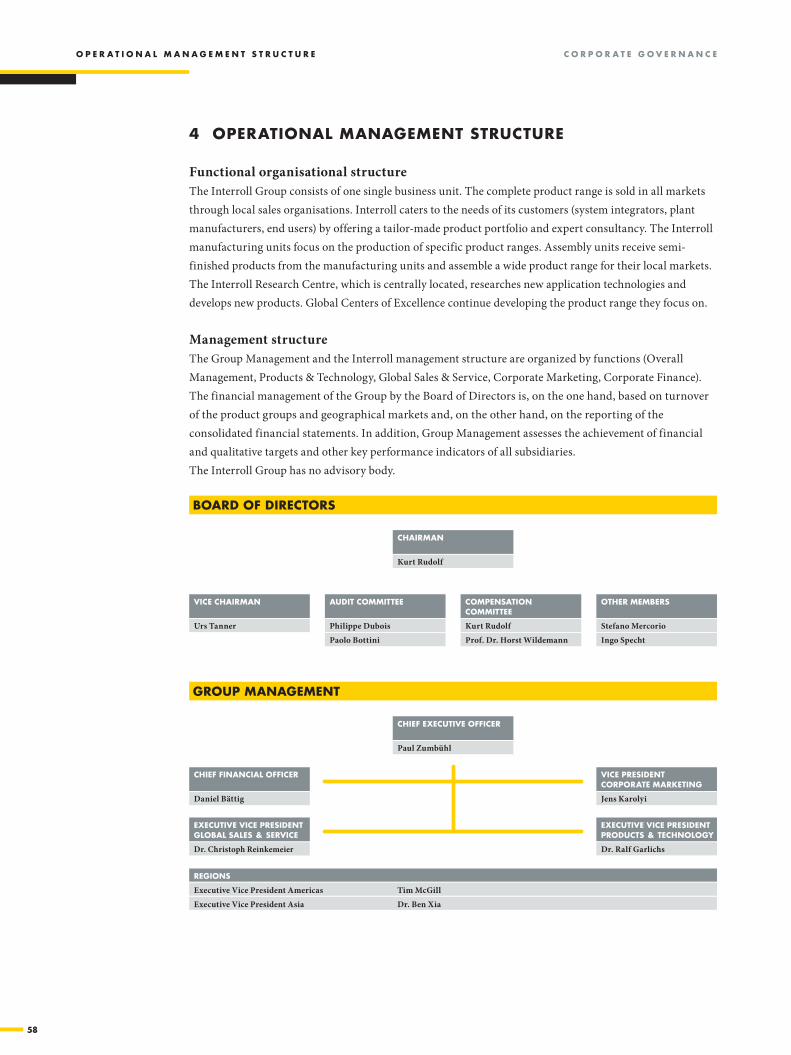
58
o p e r a t I o n a l M a n a G e M e n t S t r u C t u r e C o r p o r a t e G o v e r n a n C e
4 operatIonal ManaGeMent StruCture
Functional organisational structureThe Interroll Group consists of one single business unit. The complete product range is sold in all markets through local sales organisations. Interroll caters to the needs of its customers (system integrators, plant manufacturers, end users) by offering a tailor-made product portfolio and expert consultancy. The Interroll manufacturing units focus on the production of specific product ranges. Assembly units receive semi- finished products from the manufacturing units and assemble a wide product range for their local markets. The Interroll Research Centre, which is centrally located, researches new application technologies and develops new products. Global Centers of Excellence continue developing the product range they focus on.
Management structureThe Group Management and the Interroll management structure are organized by functions (Overall Management, Products & Technology, Global Sales & Service, Corporate Marketing, Corporate Finance). The financial management of the Group by the Board of Directors is, on the one hand, based on turnover of the product groups and geographical markets and, on the other hand, on the reporting of the consolidated financial statements. In addition, Group Management assesses the achievement of financial and qualitative targets and other key performance indicators of all subsidiaries.The Interroll Group has no advisory body.
Board of dIreCtorS
ChaIrMan
Kurt Rudolf
audIt CoMMIttee
Philippe Dubois
Paolo Bottini
CoMpenSatIon CoMMIttee
Kurt Rudolf
Prof. Dr. Horst Wildemann
other MeMBerS
Stefano Mercorio
Ingo Specht
vICe ChaIrMan
Urs Tanner
Group ManaGeMent
ChIef exeCutIve offICer
Paul Zumbühl
vICe preSIdent Corporate MarketInG
Jens Karolyi
exeCutIve vICe preSIdentproduCtS & teChnoloGy
Dr. Ralf Garlichs
ChIef fInanCIal offICer
Daniel Bättig
exeCutIve vICe preSIdentGloBal SaleS & ServICe
Dr. Christoph Reinkemeier
reGIonS
Executive Vice President Americas Tim McGill
Executive Vice President Asia Dr. Ben Xia

59
C o r p o r a t e G o v e r n a n C e o p e r a t I o n a l M a n a G e M e n t S t r u C t u r e
The Interroll Research Centre (IRC) develops in close cooperation with the Centres of Excellence, Global Product Management and Global Sales new products, techniques and technologies.
Functional unit Managed by Company
Research & Development Helmut Maiwald Interroll Holding GmbH, Wermelskirchen (DE)
Global Product Management Dietmar Hager Interroll Holding GmbH, Wermelskirchen (DE)
The seven Interroll Centres of Excellence are responsible worldwide for product development, strategic purchasing and the application and development of production technologies for specific product ranges. Furthermore, they produce for the European markets and supply semi-finished goods to group companies overseas. The global Centres of Excellence of the Interroll Group are managed by the following persons:
Products Managed by Company
Rollers, RollerDrives Armin Lindholm Interroll Engineering GmbH, Wermelskirchen (DE)
Industrial Drum Motors Dr. Hauke Tiedemann Interroll Trommelmotoren GmbH, Baal (DE)
Supermarket products Dr. Anders-Staf Hansen Interroll Joki A/S, Hvidovre (DK)
Flow storage products Bertrand Raymond Interroll SAS, La Roche-sur-Yon (FR)
Conveyor modules Michael Kuhn Interroll Automation GmbH, Sinsheim (DE)
Subsystems Dr. Heinrich Droste Interroll Automation GmbH, Sinsheim (DE)
Techno polymers Ingo Specht Interroll AG, Sant’Antonino (CH)
Interroll reSearCh Centre (IrC), GloBal produCt ManaGeMent
GloBal CentreS of exCellenCe
Holding Global Centers of Excellence Sales/Production Agents/Distributors

60
o p e r a t I o n a l M a n a G e M e n t S t r u C t u r e C o r p o r a t e G o v e r n a n C e
Regional Centres of Excellence (RCoE)Regional Centres of Excellence produce for the Americas and Asia-Pacific. These centres take over the full product programme of the global Centres of Excellence and serve the regional sales and service subsidiaries with finished products and the assembly sites with unfinished goods.
Production companies and local assembliesGuided by the production processes and production technology by the Interroll Centres of Excellence, local production companies manufacture and assemble products for regional markets. They concentrate on specific product groups within the full product range.
Sales and service subsidiariesInterroll sales companies concentrate on specific market and customer segments offering the full range of Interroll products and 24-hour repair service.
Management of the operational subsidiariesThe management of above companies was delegated to the following persons:
WorldWIde SaleS and produCtIon CoMpanIeS
Function Region/country Managed by Company
Sales, service Central Europe O. Schopp Interroll Fördertechnik GmbH, Wermelskirchen (DE)
Europe Middle East Africa
Sales, service France G. Calvez Interroll SAS, Saint-Pol-de-Léon (FR)
Sales, service Northern Europe E. Kaiser Interroll Nordic A/S, Hvidovre (DK)
Sales, service Great Britain, Ireland Ch. Middleton Interroll Ltd., Corby (GB)
Sales, service Iberic peninsula R. Rovira Interroll España SA, Cerdanyola del Vallès (ES)
Sales, service Czech Rep., Balcany, Hungary F. Ratschiller Interroll CZ s.r.o., Breclav (CZ)Sales, service Poland, Russia, Ukraine F. Ratschiller Interroll Polska sp.z.o.o., Warsaw (PL)Sales Turkey, Middle East F. Ratschiller Interroll Lojistik Sistemleri Ticaret Limited, Istanbul (TR)Sales, assembly, service Africa H. Campbell Interroll SA (Proprietary) Ltd., Johannesburg (ZA)
RCoE, sales, service North America R. Keely Interroll Corporation, Wilmington/NC (US)
Americas Sales, production, service North America S. Cwiak Interroll Automation LLC, Jeffersonville (US)
RCoE, Sales, production, service North America M. Oropeza Interroll Engineering West, Cañon City Inc. (US)
Production North America C. Parsons Interroll Dynamic Storage, Inc., Hiram/Atlanta (US)
Sales, production, service North America S. Gravelle Interroll Canada Ltd., Newmarket/Toronto (CA)
Sales, production North and South America S. Gravelle Interroll Components Canada Ltd., Concord/Toronto (CA)
Sales, assembly, service Brazil, Argentina D. Hahn Interroll Logística Ltda., Jaguariuna/São Paulo (BR)
RCoE, sales, service China S. Foong Interroll (Suzhou) Co. Ltd., Suzhou (CN)
Asia- Pacific
Sales, service South Korea N. Kim Interroll Korea Corp. Seoul (KR)
Sales, service Japan G. W. Seng Interroll Japan Co. Ltd., Tokyo (JP)
Sales, assembly, service Thailand N. Grisorn Interroll (Thailand) Co. Ltd., Panthong (TH)
Sales, service Singapore, South East Asia G. W. Seng Interroll (Asia) Pte. Ltd., Singapore (SG)
Sales, assembly, service Australia P. Cieri Interroll Australia Pty. Ltd., Melbourne (AU)
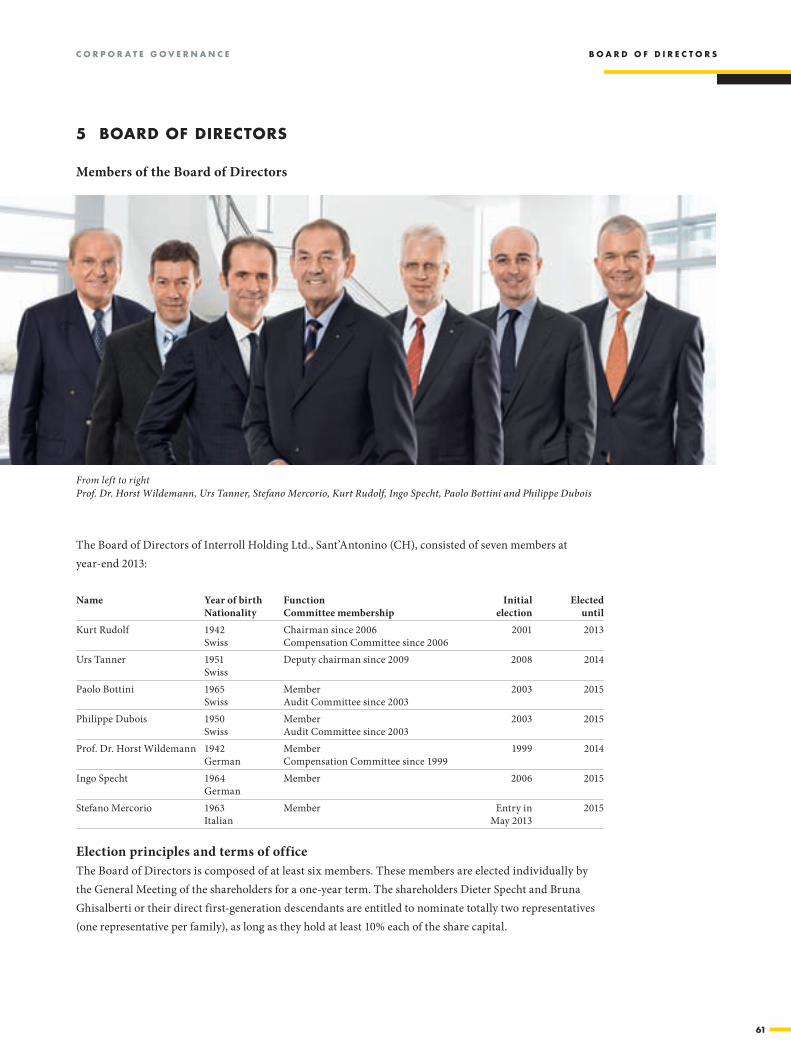
61
C o r p o r a t e G o v e r n a n C e B o a r d o f d I r e C t o r S
5 Board of dIreCtorS
Members of the Board of Directors
From left to right Prof. Dr. Horst Wildemann, Urs Tanner, Stefano Mercorio, Kurt Rudolf, Ingo Specht, Paolo Bottini and Philippe Dubois
The Board of Directors of Interroll Holding Ltd., Sant’Antonino (CH), consisted of seven members at year-end 2013:
Name Year of birthNationality
FunctionCommittee membership
Initial election
Elected until
Kurt Rudolf 1942 Swiss
Chairman since 2006 Compensation Committee since 2006
2001 2013
Urs Tanner 1951 Swiss
Deputy chairman since 2009 2008 2014
Paolo Bottini 1965 Swiss
Member Audit Committee since 2003
2003 2015
Philippe Dubois 1950 Swiss
Member Audit Committee since 2003
2003 2015
Prof. Dr. Horst Wildemann 1942 German
Member Compensation Committee since 1999
1999 2014
Ingo Specht 1964 German
Member 2006 2015
Stefano Mercorio 1963Italian
Member Entry in May 2013
2015
Election principles and terms of officeThe Board of Directors is composed of at least six members. These members are elected individually by the General Meeting of the shareholders for a one-year term. The shareholders Dieter Specht and Bruna Ghisalberti or their direct first-generation descendants are entitled to nominate totally two representatives (one representative per family), as long as they hold at least 10% each of the share capital.
62
B o a r d o f d I r e C t o r S C o r p o r a t e G o v e r n a n C e
Professional background and vested interests of the Board of Directors
Kurt Rudolf Dipl.-Ing. ETHCurrent activitiesSince 2014: Member of the Board of Trustees of the Olle Larsson-Rosenquist Trust, Zug (CH)Professional background1996–2013: Member of the Board of Directors of the Medela Group, Zug (CH)1986–1990: CEO Portescap Group, La Chaux-de-Fonds (CH)1982–1985: Managing Director of LGZ Landis & Gyr Zug Ltd., Zug (CH)
Urs Tanner Executive MBA, University St.Gallen (CH)AMP, Harvard (US)Current activitiesSince 2012: Co-owner of Halcyon Associates Inc., Monson (US)Since 2010: Member of the Board of Directors of Belimed Ltd., Zug (CH)Since 2007: Member of the Board of Directors of Plaston Ltd., Widnau (CH)Since 1995: Member of the Board of Directors of Medela Group, Zug (CH)Professional background1995–2007: CEO of Medela Group, Baar (CH)1983–1994: Managing Director of Tool & Plastics, Mikron Group, Biel (CH)1967–1983: Management positions at Styner + Bienz (Adval Tech), Niederwangen (CH)
Paolo Bottini Lic. iur., lawyerTax specialist (Eidg. dipl.) Current activitiesSince 2011: Managing Partner of Bär & Karrer, Zurich (CH)Professional background2002–2010: Partner and Director of Bär & Karrer, Lugano (CH)2000–2001: Partner of Bär & Karrer, Lugano (CH)1996–2000: Associate of Bär & Karrer, Lugano (CH)
Philippe Dubois Lic. iur. and lic. oec.Current activitySince 2002: Independent management and financial consultant for M&A, corporate finance and management coaching, Zurich (CH)Professional background1999–2001: Senior Investment Banking positions at Bank Julius Bär, Zurich (CH)1982–1999: UBS Warburg (also responsible for the IPO of Interroll), Zurich (CH)

63
C o r p o r a t e G o v e r n a n C e B o a r d o f d I r e C t o r S
Prof. Dr. Horst Wildemann Prof. of university Dr. Dr. h. c. mult.Honorary professor at the universities of Klagenfurt, Passau and Cottbus (DE)Award of the first class cross merit of the Federal Republic of GermanyAward of the order of merit of BavariaDipl.-Ing. in mechanical engineering and Dipl.-Kfm. in business administration at the universities of Aachen and Cologne (DE) and also of the universities of Southern California and Indianapolis (US)Member of the Logistic Hall of Fame (since 2004)Current activitiesSince 2009: Chairman of the board of Directors, Möhlenhoff GmbH, Salzgitter (DE)Since 2008: Chairman of the board of Directors, IWIS-Ketten GmbH, Munich (DE)Since 2008: Chairman of the board of Directors, Rudolf GmbH, Geretsriet (DE)Since 2007: Chairman of the board of Directors, Pinta Elements GmbH, Munich (DE)Since 2007: Member of the Board of Directors, Sick AG, Waldkirch (DE)Since 2000: Member of the Board of Directors, Hamberger Industriewerke GmbH, Stephanskirchen (DE)Since 1998: Chairman of the Board of Directors, Grosshaus GmbH, Lennestadt (DE)Since 1996: Member of the Board of Directors, Zeppelin GmbH, Friedrichshafen (DE)Since 1988: Professor ordinarius for management, production and logistics, Technische Universität München, Munich (DE)Since 1980: Managing Director of TCW Consulting GmbH, Munich (DE)
Ingo Specht (executive member)Professional qualification as Industrial Business Manager, Chamber of Commerce and Industry Cologne (DE)Current activitySince 2007: Managing Director of Interroll Ltd., Sant’Antonino (CH)Professional background2010: Head of Corporate Marketing, Interroll (Schweiz) Ltd., Sant’Antonino (CH)2003–2007: Head of Corporate IT, Interroll Management LTD., Sant’Antonino (CH)1998–2002: Vice President Corporate Development, Interroll (Schweiz) AG, Sant’Antonino (CH)1993–1997: Owner and managing director of Luxis, Locarno (CH)1986–1993: Deputy Managing Director of Interroll LTD., Sant’Antonino (CH) Stefano MercorioDegree in economics from the University of Bergamo (IT)Current activity Since 1995: Legal Auditor in ItalySince 1990: Founder and Senior Partner of “Studio Castellini Mercorio & Partners”, Milan (IT)Since 1987: Dottore Commercialista “Albo dei Dottori Commercialisti e degli Esperti contabili
di Bergamo” (IT)
Marco Ghisalberti left the Board of Directors in May 2013.

64
6 Internal orGanISatIon
Constitution and comittees of the Board of DirectorsThe Board of Directors consists of the Chairman, the Deputy Chairman and the other Members. The Board of Directors is assisted by two permanent committees within the areas of auditing (Audit Committee) and remuneration policy (Compensation Committee).
Audit CommitteeThe Audit Committee receives the audit reports prepared by the local external auditors and of the Group auditor. It prepares the respective reporting on them to the Board of Directors. In particular, it satisfies itself that the Group companies are also being audited on a regular basis. The Audit Committee mandates the internal audit department to execute internal audits and revises respective audit reports.
At least once a year, the Audit Committee also commissions a report on audits undertaken and planned as well as on any proposals to improve the auditing function. The Audit Committee submits its proposals to the Board of Directors for decision.
Compensation CommitteeThe Compensation Committee submits its proposals for the salary and bonus of the CEO, the members of Group Management, and the compensation of the Board of Directors to the Board of Directors for decision. At the beginning of the year, it defines the targets to be attained for bonus payments to become applicable. In addition, the Compensation Committee is responsible for establishing the terms of the share ownership scheme.
Mode of collaboration of the Board of Directors and its committeesThe Board of Directors meets as often as business requires, but at least four times per year. The meetings are convened by the Chairman of the Board of Directors. Each member of the Board of Directors may demand that a meeting be convened, specifying the item on the agenda to be discussed. The CEO participates in the meetings of the Board of Directors. The Executive Vice Presidents of the respective functional units and the Vice Presidents of the Corporate Functions as well as other members of the management are invited to attend meetings when necessary.
The Board of Directors is deemed quorate if an absolute majority of its members is present in person. Resolutions are adopted on the basis of an absolute majority of votes present. In the event of an equal division of votes, the Chairman casts the deciding vote. All resolutions are recorded in the minutes.
Both committees of the board meet as necessary. Any member is entitled to convene committee meetings. In the business year 2013 the Board of Directors met on five occasions, the Audit Committee three times and the Compensation Committee twice for regular scheduled meetings.
I n t e r n a l o r G a n I S a t I o n C o r p o r a t e G o v e r n a n C e

65
C o M p e t e n C e r e G u l a t I o n S
C o r p o r a t e G o v e r n a n C e I n f o r M a t I o n a n d C o n t r o l I n S t r u M e n t S
7 CoMpetenCe reGulatIonS
Statutory base for the competence regulationsAll basic competences and tasks of the organs are lined out in the articles of association of Interroll Holding Ltd. Responsibilities and duties that cannot be transferred to third parties are defined in these articles.
Responsibility of the Board of DirectorsThe Board of Directors is responsible for the Group’s strategy and governs the overall management, super- vision and control over the operational management of the Interroll Group. The Board of Directors has exercised its statutory authority to delegate management to third parties who need not be shareholders (Group Management).
Management and organisational regulationsIn the provisions of the organisational regulations, the Board of Directors has delegated the management of ongoing business to a Chief Executive Officer (CEO). The CEO is responsible for the overall management of the Interroll Group and for all matters not falling under the purview of another governing body, as specified by law, the Articles of Association or the organisational regulations. In particular, the CEO is responsible for the operational management of the company as a whole. Competences and controls are specified within a set of organisational regulations.
8 InforMatIon and Control InStruMentS
Reporting to the Board of DirectorsAt each meeting, the CEO informs the Board of Directors of the course of business, the principal events within the Group and the discharge of duties delegated to the Group Management.
Management information systemThe Management Information System (MIS) of the Interroll Group consolidates the balance sheet, income statement and cash flow statement, as well as financial data pertaining to the subsidiary companies, on a monthly basis and compares the current figures with those of the previous year and the budget. On the basis of the quarterly financial statements, the budget is assessed in the form of a forecast as to whether it is attainable with regard to each entity and also for the consolidated group. The financial reports are discussed during the meetings of the Board of Directors.
Internal audit and control instrumentsOn behalf of the Audit Committee, internal audits are performed annually at selected subsidiary companies. The focal points of the audit are defined according to the risk profile of the respective entity. The reports of the Audit Committee are discussed with the local management.
Extraordinary occurrences and decisions of material importance, as specified in the organisational regulations, are immediately brought to the attention of all members of the Board of Directors in writing.

66
G r o u p M a n a G e M e n t C o r p o r a t e G o v e r n a n C e
9 Group ManaGeMent
The Group Management of Interroll Group had the following members as at end of 2013:
Name Year of birthNationality
Function Member since
Paul Zumbühl 1957 Swiss
Chief Executive Officer (CEO) January 2000
Daniel Bättig 1964Swiss
Chief Financial Officer (CFO) Entry in March 2013
Dr. Ralf Garlichs 1962 German
Executive Vice President Products & Technology July 2006
Dr. Ch. Reinkemeier 1966 German
Executive Vice President Global Sales & Service January 2011
Jens Karolyi 1970 German
Vice President Corporate Marketing January 2011
Tim McGill 1955 English
Executive Vice President Americas January 2011
Dr. Ben Xia 1966Chinese
Executive Vice President Asia Entry in June 2013
Professional background and vested interests of the Group Management
Paul ZumbühlDipl.-Ing., Lucerne university of applied sciences, Lucerne (CH) MBA, Joint University Program of the univ. in Boston, Berne, Shanghai AMP, Kellogg Business School of Northwestern University, Chicago (US) Marketing Management Diploma (Eidg. Dipl.)Current activitySince 2000: Chief Executive OfficerFurther activitiesSince 2009: Member of the Board of Directors, Looser Holding AG, Arbon (CH)Since 2007: Member of the Board of Directors, Schlatter Holding AG,
Zurich (CH)Professional background1994–1999: CEO of Mikron Plastics Technology and member of the Executive
Management Board, Mikron Group, Biel (CH)1988–1994: Managing Director and further management positions at Sarna Group, Sarnen (CH)1984–1987: Sales Manager/Engineer at SYMALIT AG, Lenzburg (CH)
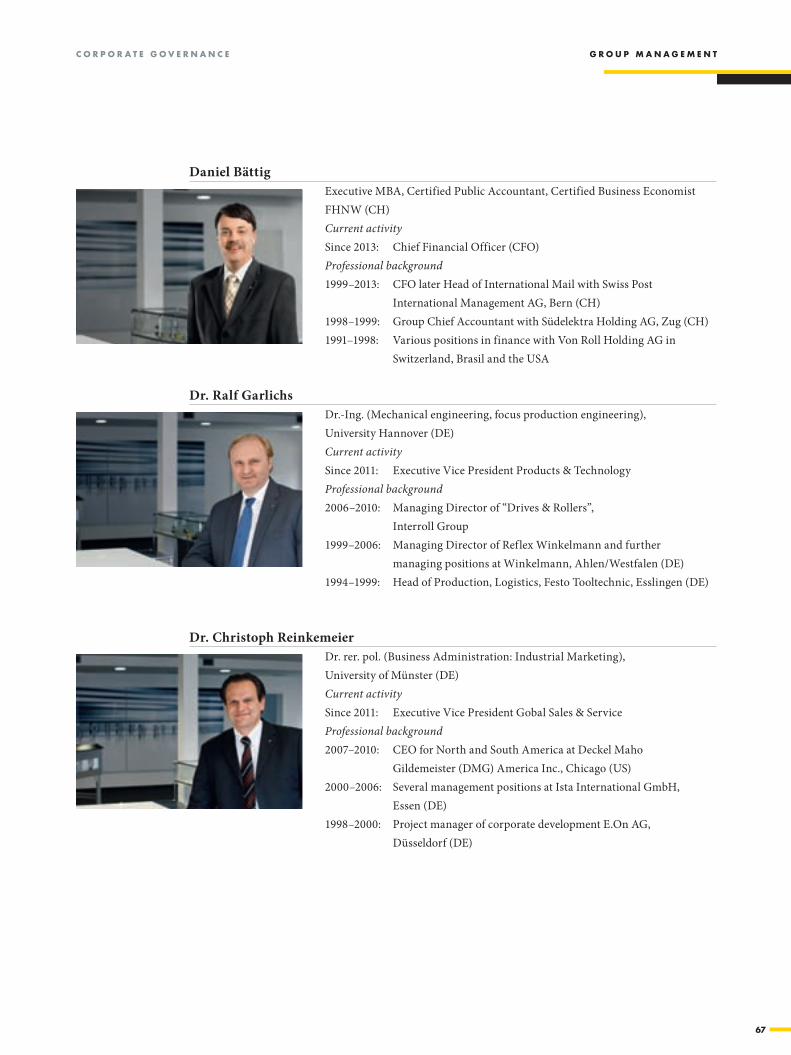
67
C o r p o r a t e G o v e r n a n C e G r o u p M a n a G e M e n t
Daniel BättigExecutive MBA, Certified Public Accountant, Certified Business Economist FHNW (CH)Current activitySince 2013: Chief Financial Officer (CFO)Professional background1999–2013: CFO later Head of International Mail with Swiss Post International Management AG, Bern (CH)1998–1999: Group Chief Accountant with Südelektra Holding AG, Zug (CH)1991–1998: Various positions in finance with Von Roll Holding AG in
Switzerland, Brasil and the USA
Dr. Ralf GarlichsDr.-Ing. (Mechanical engineering, focus production engineering), University Hannover (DE)Current activitySince 2011: Executive Vice President Products & TechnologyProfessional background2006–2010: Managing Director of “Drives & Rollers”,
Interroll Group1999–2006: Managing Director of Reflex Winkelmann and further
managing positions at Winkelmann, Ahlen/Westfalen (DE)1994–1999: Head of Production, Logistics, Festo Tooltechnic, Esslingen (DE)
Dr. Christoph ReinkemeierDr. rer. pol. (Business Administration: Industrial Marketing), University of Münster (DE)Current activitySince 2011: Executive Vice President Gobal Sales & ServiceProfessional background2007–2010: CEO for North and South America at Deckel Maho
Gildemeister (DMG) America Inc., Chicago (US) 2000–2006: Several management positions at Ista International GmbH,
Essen (DE) 1998–2000: Project manager of corporate development E.On AG,
Düsseldorf (DE)
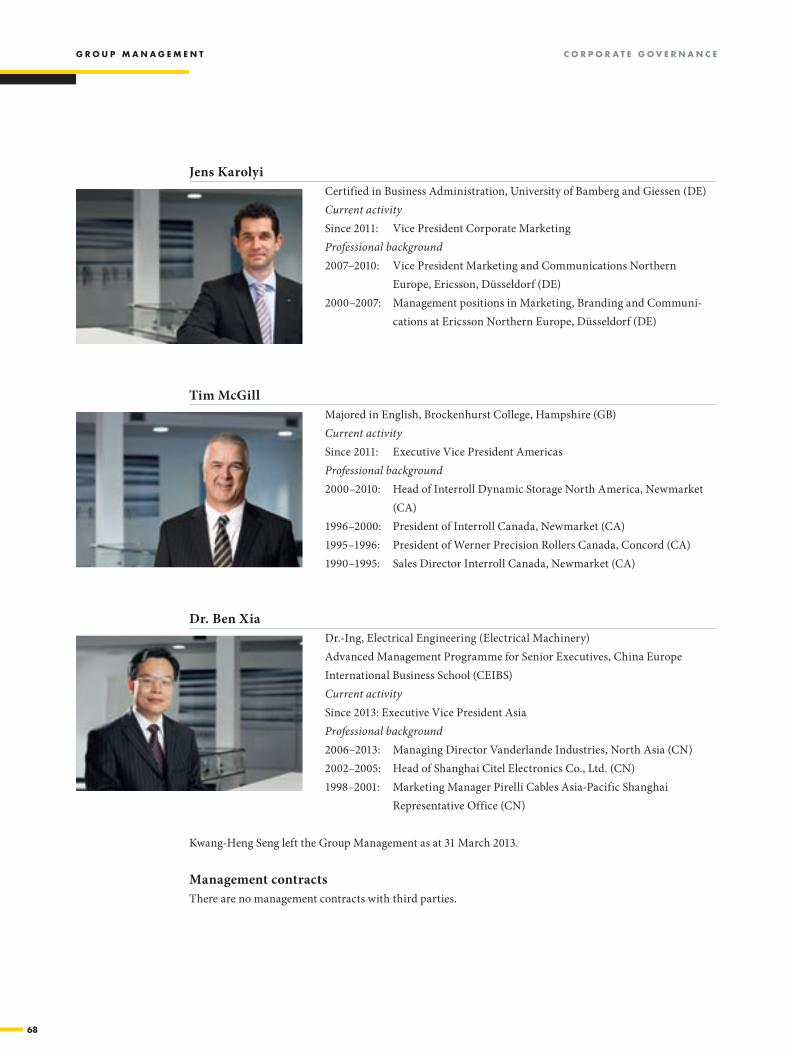
68
G r o u p M a n a G e M e n t C o r p o r a t e G o v e r n a n C e
Jens KarolyiCertified in Business Administration, University of Bamberg and Giessen (DE)Current activitySince 2011: Vice President Corporate MarketingProfessional background2007–2010: Vice President Marketing and Communications Northern
Europe, Ericsson, Düsseldorf (DE)2000–2007: Management positions in Marketing, Branding and Communi-
cations at Ericsson Northern Europe, Düsseldorf (DE)
Tim McGillMajored in English, Brockenhurst College, Hampshire (GB)Current activitySince 2011: Executive Vice President AmericasProfessional background2000–2010: Head of Interroll Dynamic Storage North America, Newmarket
(CA)1996–2000: President of Interroll Canada, Newmarket (CA)1995–1996: President of Werner Precision Rollers Canada, Concord (CA)1990–1995: Sales Director Interroll Canada, Newmarket (CA)
Dr. Ben XiaDr.-Ing, Electrical Engineering (Electrical Machinery)Advanced Management Programme for Senior Executives, China Europe International Business School (CEIBS)Current activitySince 2013: Executive Vice President AsiaProfessional background2006–2013: Managing Director Vanderlande Industries, North Asia (CN)2002–2005: Head of Shanghai Citel Electronics Co., Ltd. (CN)1998–2001: Marketing Manager Pirelli Cables Asia-Pacific Shanghai
Representative Office (CN)
Kwang-Heng Seng left the Group Management as at 31 March 2013.
Management contractsThere are no management contracts with third parties.
69
C o M p e n S a t I o n S y S t e M o f t h e B o a r d o f d I r e C t o r S
C o r p o r a t e G o v e r n a n C e C o M p e n S a t I o n S y S t e M G r o u p M a n a G e M e n t
10 CoMpenSatIon SySteM of the Board of dIreCtorS
Method used to determine the level of compensation of the Board of DirectorsEvery year, the Board of Directors determines the level of total compensation for its members, at its discre-tion and depending on the workload and responsibilities of its members, taking into account the new regu-lations on excessive compensation in listed stock companies. No separate compensation is paid for member-ship in committees. Extraordinary efforts that go beyond the normal duties of the Board of Directors may additionally be compensated. All remuneration paid to members of the Board of Directors of Interroll Holding Ltd. by Interroll Holding Ltd. and the subsidiaries over which it has direct or indirect control is decisive in determining the annual total remuneration.
Components of the compensation of the Board of DirectorsThe total remuneration of the Board of Directors is exclusively paid in cash. It comprises no variable ele-ments. All social security contributions are made by the employer.
No loans or advances were granted to members of the Board of Directors by Interroll Holding Ltd. and its subsidiaries in the two reporting years.
11 CoMpenSatIon SySteM Group ManaGeMent
Powers to specify the remuneration of Group Management and principlesAt the Remuneration Committee’s request, the Board of Directors decides every year on the total remu ne r -ation of the Group Management, subject to approval by the General Meeting from 2015 onwards. The Remuneration Committee works out the CEO’s total remuneration. The CEO works out the total remu-neration of the other members of the Group Management (including former members of the Group Man-agement) and submits his proposal to the Remuneration Committee every year for approval by the Board of Directors.
In determining the annual total remuneration, all remuneration paid to members of the Group Manage-ment by Interroll Holding Ltd. and the subsidiaries over which it has direct or indirect control is decisive, irrespective of whether global or local activities for one or more subsidiaries in Switzerland or abroad (based on a separate contract of employment) of the respective member of the Group Management are com-pensated.
The Group Management’s actions must always focus on achieving a long-term sustained increase in value rather than pursuing short-term profit maximisation. The composition of total remuneration for the members of the Group Management in general and the CEO in particular is based on this aim.
Elements of the total remuneration of the Group Management and criteria for determining the remunerationFor each Group Management member an individual remuneration agreement exists, the projected total re-muneration, which is based on the criteria specified below for determining the remuneration and market conditions in the relevant country.
70
C o M p e n S a t I o n S y S t e M G r o u p M a n a G e M e n t C o r p o r a t e G o v e r n a n C e
The projected total remuneration per annum may be exceeded as a result of an excellent performance.
Remuneration is determined on the basis of key criteria, such as global responsibility in the relevant role, in-dividual actual performance contributing to the Group’s long-term strategic development, the complexity of the area of responsibility and the personal results achieved on behalf of the Group. Similarly, any additional local roles fulfilled in one or more subsidiaries are also taken into account, including the relevant respon-sibilities and individual actual performance contributing to their operational and strategic development.
External consultants may additionally be involved in determining the structure and level of remuneration on a case-by-case basis.
Overview of total remuneration for the Group ManagementTotal remuneration for each Group Management member comprises a fixed and a variable remuneration component. The variable remuneration component includes a bonus and/or the allocation of shares with a blocking period of several years.
The fixed remuneration component of total remuneration is contractually stipulated and generally remains unchanged for three to four years if the job does not change. Adjustments may be made on the basis of the assessment of individual performance and in the event of changes to the area of responsibility.
The share of variable remuneration varies, depending on the roles of the members of the Group Man agement, and amounts to up to approx. 60% for members in an operating managerial role and to up to approx. 30% for members in a centralised holding role of the projected total remuneration.
In the reporting year, the variable share in relation to total remuneration of the Group Management amounted to approx. 33%.
The starting point for the variable remuneration of members of the Group Management includes the meas-urable sustained financial success of the company, measured in terms of the 3-year plan (rather than the annual budget) and compared with the previous year, as well as the individual, strategically relevant, meas-urable targets agreed each year with the members of the Group Management. They relate, for example, to new products, gaining market share, developing new markets, successful strategic projects and other per-sonal targets.
Using the plan for several years as the basis of variable remuneration motivates members of the Group Man-agement to think long-term. It means that the relative improvement is measured compared to the previous year and short-term cost-cutting is prevented in the areas of market development, innovation etc. which could hamper the long-term development of Interroll. Based on these considerations, members of the Group Management receive a share of their remuneration in the form of Interroll shares, which are blocked for sale for a period of four years.

71
C o r p o r a t e G o v e r n a n C e C o M p e n S a t I o n S y S t e M G r o u p M a n a G e M e n t
The company’s financial success is measured in terms of five key figures: operating profit, operating profit margin, gross margin, sales growth and the return on capital, with a different weighting depending on the roles of the members of the Group Management. The Remuneration Committee may deviate from the agreement in favour of an Group Management member if failure to achieve specific targets was solely attributable to external factors, or if an exceptional one-off performance was delivered. In the two re-porting years, no deviation from the agreement occurred.
Individual targets impact on the variable remuneration component of Group Management members in an operating managerial role by up to approx. one third and by up to approx. two thirds for Group Management members in a centralised managerial role.
Allotment of shares and management stock option planThe Interroll shares granted as part of fixed (CEO) and variable remuneration to members of the Group Management are blocked for four to a maximum of six years, in order to ensure the sustainable long-term development of the Interroll Group. The blocking period is aimed at motivating the Group Management to perform its duties in the interests of the Interroll Group’s long-term sustainable development rather than short-term profit optimisation.
Based on their commitment and influence, the Group Management members are to participate long term in the Group’s increased value and also share the business risk as shareholders (and equity co-investors). In this sense, the share plan for the Group Management represents a long-term performance incentive and is intended to promote identification with and loyalty to Interroll in the long run.
Group Management members and a further forty employees, who have already been entrusted with man-agement duties for the Interroll Group since 2006, were given the opportunity to participate in a management stock option plan. The term of this stock option plan ended on 30 September 2013. Each option entitled the holder to subscribe to one Interroll registered share. The exercise price was CHF 323 per share. Cash com-pensation for the difference between the market price on the exercise date and the exercise price was not available. In financial year 2013, no new stock option plan was introduced, and the existing option plan ceased as per 30 September 2013.
Other remunerationThe regulations on expenses and pensions are specified in the applicable local employment terms and con-ditions as well as the relevant statutory and prevailing market conditions of the countries concerned, in par-ticular Germany, the USA and China as well as Switzerland.
In Switzerland, each Group Management member contributes a quarter to a third of the “savings element” to the pension fund. The rest is paid by the employer.
A company car and mobile phone are made available to the members of the Group Management for busi-ness and private use. Alternatively, the corresponding amount is paid as a monthly flat rate. The maximum permitted limits in terms of the value of company cars are regulated in-house.
No other remuneration in the form of significant benefits in kind is made. Further details regarding other remuneration are provided in section 13 – Change in control clauses.
72
C o M p e n S a t I o n S y S t e M G r o u p M a n a G e M e n t
S h a r e h o l d e r S ’ p a r t I C I p a t I o n r I G h t S C o r p o r a t e G o v e r n a n C e
Valuation of the total compensation of the Group ManagementCompared with the previous year, the total remuneration of the Group Management decreased. The main reasons for this change were unfilled posts and the appointment of two new members of the Group Manage-ment for less than twelve months. An adjustment to the fixed salary of one Group Management member was made compared with the previous year. No significant changes occurred in respect of the variable remuner-ation component.
Loans to officersIn the current year and the previous year, Interroll Holding Ltd. and its subsidiaries did not grant loans and advances to members of the Group Management.
12 ShareholderS’ partICIpatIon rIGhtS
Representation and restriction of voting rights Rights governing shareholder participation are in accordance with the requirements specified within the Swiss Code of Obligations. Each share issued has one vote. A shareholder’s voting rights are restricted to a maximum of 5% of the total number of votes. Individual nominees, however, are entitled to exercise more than 5% of the total votes if they disclose the identity of the beneficiaries they represent and if the respective beneficiaries as a whole do not exercise more than 5% of the voting rights. This restriction of voting rights does not apply to the founding families, insofar as the individual families hold at least 10% of the share capital.
Registered shares of nominees that exceed 2% of the shares outstanding are only listed in the Register as shares furnished with voting rights if the nominee has provided written consent to the possible disclosure of names, addresses and shareholdings of those persons for whom the said nominee holds 0.5% or more of the shares outstanding.
Statutory quorumSubject to contrary statutory or legal provisions, the General Meeting of Shareholders is quorate irrespective of the number of shareholders present and the shares represented by proxy.
Convocation of General Meeting of Shareholders The invitation to the General Meeting of Shareholders is issued at least twenty days prior to the Meeting and is legally effective upon inclusion in the Company’s chosen vehicle of communication (“Schweizerisches Handelsamtsblatt”). In addition, the Board of Directors sends a written invitation to those registered shareholders listed in the share register.

73
C h a n G e I n C o n t r o l a n d d e f e n C e M e a S u r e S
C o r p o r a t e G o v e r n a n C e a u d I t o r
Agenda and registration in the share registerThe invitation to the General Meeting of Shareholders shall include all items on the agenda as well as all motions put forward by the Board of Directors and, if applicable, by the shareholders who have called for a General Meeting or the inclusion of an item on the agenda. No resolutions shall be passed on motions relating to items which have not been announced in the requisite manner, with the exception of those motions relating to the convocation of an Extraordinary Meeting of Shareholders or the execution of a special audit. No entries are made into the share register less than ten days prior to a General Meeting of Shareholders up to the day subsequent to the General Meeting of Shareholders.
13 ChanGe In Control and defenCe MeaSureS
Obligation to make an offerThere are no statutory regulations regarding opting up and opting out.
Change in control clausesThere are no agreements for severance pay, other agreements and plans in the event of a change in control or upon termination of a contract of employment. The notice periods for members of the Group Management range from three to twelve months. For one member of the Group Management, the twelve-month period will start on 1 January 2016.
14 audItor
Duration of the mandate and term of office of the lead auditor With decision of the general assembly of 10 May 2013, Interroll Holding Ltd. has appointed PricewaterhouseCoopers (PwC) for another term of one year as its auditing company. PwC is the Group Auditor of Interroll Group since 2011. Mr. Patrick Balkanyi is the lead auditor with audit responsibility since 2012.
Audit fees The audit fees charged by PwC to subsidiaries of Interroll Group in the business year 2013 amounted to CHF 0.4 million. The audit fees charged by PwC in 2012 amounted to CHF 0.4 million.
Additional fees charged by PwC In 2013, PwC branch offices charged a total of CHF 0.02 million for tax and other consulting services (fees for such services charged in 2012: CHF 0.04 million).
Supervisory and control instruments pertaining to the auditThe Audit Committee is responsible for evaluating the external audit. The external auditors prepare an audit report to be submitted to the Board of Directors. At least two consultations are held each year between the external auditors and the Audit Committee. Material findings for each entity (Management Letters) as well as for the consolidated accounts are presented in the “Comprehensive Auditor’s Report to the Board of Directors” which is discussed in detail.

74
I n f o r M a t I o n p o l I C y C o r p o r a t e G o v e r n a n C e
15 InforMatIon polICy
Contact personInterroll is committed to providing swift, transparent and simultaneous information for all stakeholders. To ensure that, the CEO is available as a direct contact person.
Published reports on the course of businessInterroll Group publishes comprehensive financial results twice a year: for the first half and for the financial year as a whole. In addition to the financial results that are carried out in accordance with IAS/IFRS, shareholders and financial markets are regularly kept informed of significant changes and developments.
Source of informationFurther relevant information and financial reports are available from www.interroll.com reports can be downloaded as PDF documents from www.interroll.com. Shareholders recorded in the share register may request to receive the Annual Report in printed form and register for automatic submission of the annual report with the Investor Relations department.
75
I n t e r r o l l G r o u p f I n a n C I a l r e p o r t : C o n t e n t S
fInanCIal report of Interroll Group
Contents
1 Consolidated financial statements of Interroll 76
1.1 Consolidated statement of financial position 76
1.2 Consolidated income statement 77
1.3 Consolidated statement of comprehensive income 78
1.4 Consolidated statement of cash flows 79
1.5 Consolidated statement of changes in equity 80
Notes to the financial statement of Interroll Group 81
2 General information to the financial statements 81
3 R isk management 99
4 Changes to the scope of consolidation 103
5 Operating segments 106
6 Notes to the consolidated statement of financial position 107
7 Notes to the consolidated income statement 130
8 Other disclosures to the financial statements 137
9 Report of the statutory auditor 141

76
f I n a n C I a l r e p o r t : S t a t e M e n t o f f I n a n C I a l p o S I t I o n I n t e r r o l l G r o u p
1.1BSt20:aC70
1 ConSolIdated fInanCIal StateMentS of Interroll
1.1 Consolidated statement of financial position
in thousands CHFsee
notes* 31.12.2013 in % 31.12.2012 in % 01.01.2012 in %restated 1) restated 1)
aSSetS
Property, plant and equipment 6.1 83 266 76 828 82 107 Intangible assets 6.3 53 054 39 152 40 687 Financial assets 732 890 932 Deferred tax assets 7.6 3 387 2 838 960 Total non-current assets 140 439 54.4 119 708 52.6 124 686 52.1
Non-current assets held for sale 6.2 – – 950 Inventories 6.5 38 119 35 595 45 100 Current tax assets 706 741 528 Trade and other accounts receivable 6.6 58 164 57 439 57 654 Cash and cash equivalents 6.7 20 797 14 109 10 522 Total current assets 117 786 45.6 107 884 47.4 114 754 47.9
Total assets 258 225 100.0 227 592 100.0 239 440 100.0
eQu It y and l IaB I l I t I eS
Share capital 8 540 8 540 8 540 Share premium 13 739 20 427 26 630 Reserve for own shares –1 641 –17 670 –21 018 Translation reserve –45 454 –44 319 –43 856 Retained earnings 211 916 190 659 173 010 Non-controlling interests 145 – –Total equity 6.10 187 245 72.5 157 637 69.3 143 306 59.9
Non-current financial liabilities 6.12 253 5 025 5 271 Deferred tax liabilities 7.6 5 071 2 300 2 441 Pension liabilities 6.15 2 824 3 469 1 179 Provisions 6.14 5 902 5 322 5 256 Total non-current liabilities 14 050 5.4 16 116 7.1 14 147 5.9
Current financial liabilities 6.12 320 396 22 850 Current tax liabilities 7.6 9 831 9 068 9 264 Trade and other accounts payable 6.16 46 779 44 375 49 873 Total current liabilities 56 930 22.0 53 839 23.7 81 987 34.2
Total liabilities 70 980 27.5 69 955 30.7 96 134 40.1
Total liabilities and shareholder’s equity 258 225 100.0 227 592 100.0 239 440 100.0
* See notes to the consolidated financial statements.1) See remarks regarding restatement in chapter 2.1 (IAS 19R).

77
I n t e r r o l l G r o u p f I n a n C I a l r e p o r t : I n C o M e S t a t e M e n t
1.2plt20:Z50
1.2 Consolidated income statement
in thousands CHF see notes* 2013 in % 2012 in %restated 1)
Sales 316 334 100.0 307 155 100.0
Material expenses –131 878 –41.7 –128 056 –41.7 Personnel expenses 7.1 & 6.15 –94 131 –29.8 –89 692 –29.2
Increase/(Decrease) in work in progress, finished products and own goods capitalized –771 –0.2 –5 951 –1.9 Other operating expenses 7.3 –52 516 –16.6 –52 798 –17.2 Other operating income 7.4 8 341 2.6 10 456 3.4 Operating result before depreciation and amortisation (EBITDA) 45 379 14.3 41 114 13.4
Depreciation 6.1 –11 389 –3.6 –10 824 –3.5 Amortisation 6.3 –6 799 –2.1 –5 469 –1.8 Operating result (EBIT) 27 191 8.6 24 821 8.1
Finance expenses –1 689 –0.5 –1 304 –0.4 Finance income 145 0.0 540 0.2 Finance result, net 7.5 –1 544 –0.5 –764 –0.2
Result before income taxes 25 647 8.1 24 057 7.8
Income tax expense 7.6 –5 041 –1.6 –4 683 –1.5
Result 20 606 6.5 19 374 6.3
Result attributable to: – Non-controlling interests 62 0.0 – – – Owners of Interroll Holding Ltd. 20 544 6.5 19 374 6.3
1.2plt54:y60
Values per share (in CHF)Non-diluted earnings (result) per share 6.11 24.84 24.25 Diluted earnings (result) per share 6.11 24.71 24.21 Distribution out of reserves from capital contributions 8.00 7.00
* See notes to the consolidated financial statements.1) See remarks regarding restatement in chapter 2.1 (IAS 19R).

78
f I n a n C I a l r e p o r t : S t a t e M e n t o f C o M p r e h e n S I v e I n C o M e I n t e r r o l l G r o u p
1.2plt62:Z89
1.3 Consolidated statement of comprehensive income
in thousands CHF see notes* 2013 in % 2012 in %restated 1)
Result 20 606 19 374
Other comprehensive incomeItems that will not be reclassified to income statementRemeasurement of pension liabilities 6.15 903 –2 194 Income tax on items that will not be reclassified –182 469 Total items that will not be reclassified to income statement 721 –1 725
Items that may be reclassified subsequently to income statementCurrency translation differences –1 144 –463 Income tax on items that may be reclassified – –Total items that may be reclassified subsequently to income statement –1 144 –463
Other comprehensive income –423 –2 188
Comprehensive income 20 183 17 186
Result attributable to: – Non-controlling interests 62 – – – Owners of Interroll Holding Ltd. 20 121 6.4 17 186 5.6
* See notes to the consolidated financial statements.1) See remarks regarding restatement in chapter 2.1 (IAS 19R).

79
I n t e r r o l l G r o u p f I n a n C I a l r e p o r t : S t a t e M e n t o f C a S h f l o W S
1.4Cflt20:x64
1.4 Consolidated statement of cash flows
in thousands CHF see notes* 2013 2012restated 1)
Result 20 606 19 374
Depreciation, amortisation and impairment 6.1 & 6.3 18 188 16 293 Loss/(gain) on disposal of tangible and intangible assets 6.2, 7.3 & 7.4 206 –1 260 Financing result, net 7.5 1 544 734 Income tax expense 7.6 5 041 4 689 Changes in inventories –2 870 8 678 Changes in trade and other accounts receivable 3 580 181 Changes in trade and other accounts payable 1 380 –5 137 Changes in provisions, net 6.14 1 256 181 Income tax paid –5 855 –6 597 Personnel expenses on share based payments 7.1 1 012 964 Other non-cash income 396 76 Cash flow from operating activities 44 484 38 176
Acquisition of property, plant and equipment 6.1 –14 444 –6 564 Acquisition of intangible assets 6.3 –1 641 –4 082 Acquisition of financial assets –129 –20 Proceeds from disposal of property, plant and equipment 6.2 75 2 580 Settlement of loans receivable 288 42 Acquisition of subsidiaries, net of cash acquired 4 –23 739 –Interests received 154 102 Cash flow from investing activities –39 436 –7 942
Distribution out of reserves from capital contributions –6 520 –5 594 Purchase of own shares –143 –Sale of own shares 14 988 1 750 Proceeds from financial liabilities 469 49 Repayment of financial liabilities –5 815 –22 502 Interests paid –407 –276 Cash flow from financing activities 2 572 –26 573
Translation adjustments on cash and cash equivalents –932 –74 Change in cash and cash equivalent 6 688 3 587
Cash and cash equivalent at 1 January 14 109 10 522 Cash and cash equivalent at 31 December 6.7 20 797 14 109
* See notes to the consolidated financial statements. 1) See remarks regarding restatement in chapter 2.1 (IAS 19R).

80
f I n a n C I a l r e p o r t : S t a t e M e n t o f C h a n G e S I n e Q u I t y I n t e r r o l l G r o u p
1,5eQuItyu20:aC55
1.5 Consolidated statement of changes in equity
in thousands CHF see notes*Share
CapitalShare
premium
reServe for own
ShareStranSlation
reServeretained
earningS
non- Controlling
intereStS total eQuIty
Balance at 31 December 2011 8 540 26 630 –21 018 –43 856 172 989 143 285 Restatement 21 21 Balance at 1 January 2012 8 540 26 630 –21 018 –43 856 173 010 143 306
Result1) 19 374 19 374 Other comprehensive income, net of taxes1) –463 –1 725 –2 188 Total comprehensive income1) –463 17 649 17 186 Distribution from reserves from capital contributions, net –5 594 – –5 594 Share based payments 7.1 –320 1 284 964 Sale of own shares incl. tax effects 6.10 –289 2 064 1 775 Balance at 31 December 2012 8 540 20 427 –17 670 –44 319 190 659 157 637
Result 20 544 62 20 606 Other comprehensive income, net of taxes –1 144 721 –423 Total comprehensive income –1 144 21 265 62 20 183 Distribution from reserves from capital contributions, net –6 521 – –6 520 Share based payments 7.1 –114 1 127 1 013 Sale of own shares incl. tax effects 6.10 –52 15 045 14 992 Purchase of own shares incl. tax effects 6.10 –143 –143 Acquisition of non-controlling interests 4 83 83
Balance at 31 December 2013 8 540 13 740 –1 641 –45 463 211 924 145 187 245
* See notes to the consolidated financial statements.1) See remarks regarding restatement in chapter 2.1 (IAS 19R).

I N T E R R O L L G R O U P G E N E R a L I N f O R m a T I O N T O T h E f I N a N c I a L s T a T E m E N T s
81
2 General InforMatIon to the fInanCIal StateMentS
2.1 Convention of preparation
General notes to the convention of preparationThe 2013 consolidated financial statements of Interroll Group are based on the annual financial statements of Interroll Holding Ltd., Sant’Antonino and its subsidiaries as of 31 December 2013, drawn up according to uniform Group accounting principles. The consolidated financial statements present a true and fair view of the financial position, results of operations and cash flows in accordance with the International Financial Reporting Standards (IFRS) and comply with Swiss law.
The consolidated financial statements are based on historical cost except for marketable securities, investments not involving significant influence and derivative financial instruments, which are stated at fair value.
The preparation of financial statements in conformity with IFRS requires management to make judgments, estimates and assumptions that affect the application of policies and reported amounts of assets and liabilities, income and expenses. These judgments, estimates and assumptions are based on historical experience and other factors that are believed to be reasonable under the given circumstances. Actual results may differ from these estimates.
The estimates and underlying assumptions are reviewed on an ongoing basis. Revisions to accounting estimates are recognised in the period in which the estimate is revised if the revision affects only that period or in the period of the revision and future periods if the revision affects both current and future periods.
Judgments made by management in the application of IFRS that have a significant effect on the consolidated financial statements and estimates with a significant risk of material adjustment in the next years are dis-closed under “2.2 – Critical accounting estimates and judgments”.
G e n e r a l I n f o r m a t I o n t o t h e f I n a n c I a l s t a t e m e n t s I n t e r r o l l G r o U P
82
New and amended IAS/IFRS standards and interpretations coming into effect in 2013The Group’s results are in line with IAS/IFRS standards and interpretations. Thus, the Group regularly monitors the amendments and new standards published by the International Accounting Standards Board (IASB). In the course of the business year 2013, the following amended standards and interpretations were enacted:
– Amendment of IAS 1 (effective as per 1.7.2012, presentation of other comprehensive income) – Amendment of IAS 7 (effective as per 1.1.2013, netting of financial assets with financial liabilities) – New: IFRS 10 (effective as per 1.1.2013, consolidated financial statements) – New: IFRS 11 (effective as per 1.1.2013, joint arrangements) – New: IFRS 12 (effective as per 1.1.2013, disclosure of interests in other entities) – Amendments of IFRS 10, 11, 12 (effective as per 1.1.2013, consolidated financial statements) – New: IFRS 13 (effective as per 1.1.2013, fair value measurement) – Amendment of IAS 19 (effective as per 1.1.2013, employee benefits) – Amendment of IAS 27 (effective as per 1.1.2013, separate financial statements) – Amendment of IAS 28 (effective as per 1.1.2013, investments in associates and joint ventures) – Amendment of IAS 36 (effective as per 1.1.2014, but already adopted by 1.1.2013, information on the recoverable amount of non-financial assets)
– Annual improvement project 2011 (effective as per 1.1.2013)
The application of these new and amended standards and interpretations have no significant effect on the consolidated financial statements of the Interroll Group results, with the exception of IAS 1, IFRS 13 and IAS 19 (amended) as follows:
IAS 1, Presentation of other comprehensive incomeThe standard requires companies to divide the items presented in other comprehensive income into two categories – depending on whether they are posted in the future on the income statement (so-called “recycling”) or not. The presentation of comprehensive income in 2013 was adapted to the new rules.
IFRS 13, Fair value measurementThe standard describes how the fair value shall be determined and expands related disclosures. The infor-mation in Section 6.8 Financial instruments has been amended according to the new rules.
IAS 19, Employee BenefitsThe principle effects of adopting IAS 19 (amended) on the financial statements of Interroll Group are as follows:
– Elimination of the corridor method: in future, actuarial gains and losses (new “Remeasurements”) are to be captured at the event of the occurrence in other comprehensive income.
– Calculation of pension costs: The annual cost of defined benefit pension plans include now the net interest expense or the income calculated on the net position of the plan using the discount rate for the de fined benefit obligations.
– Past service costs are recognised immediately in profit or loss at the event of the occurrence. – Risk sharing: The new provision on the sharing of risk between the employees and the employer has an impact on the defined benefit obligation and the distribution of the service cost.
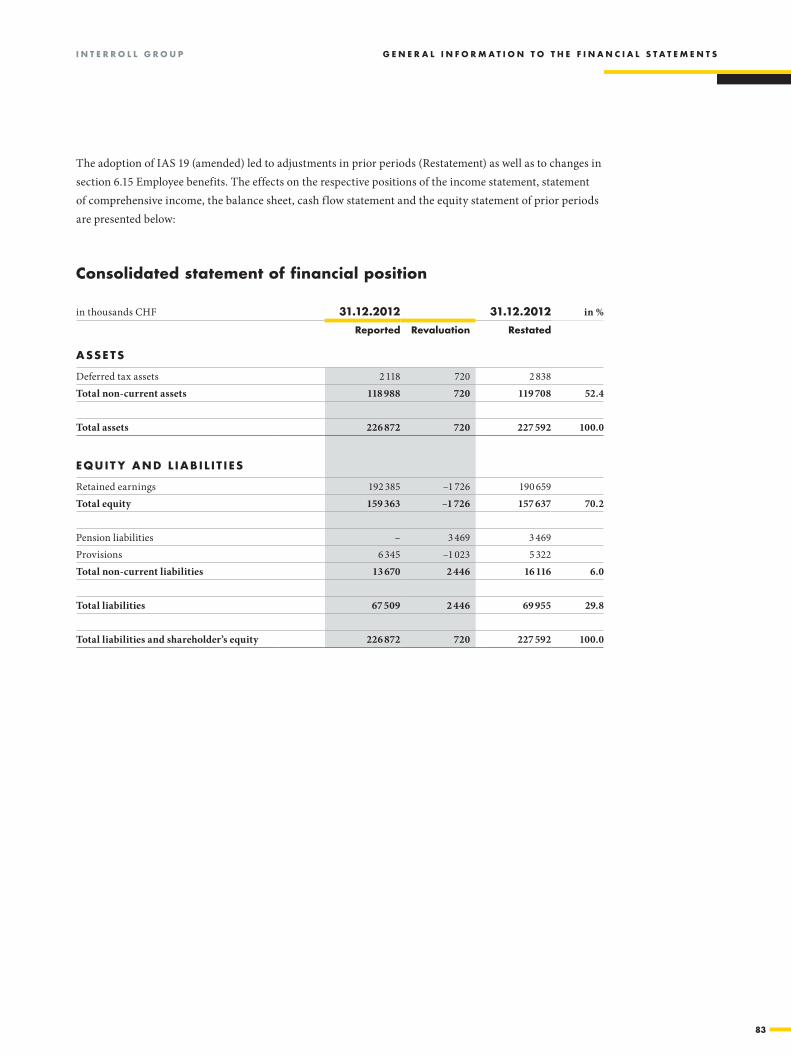
I N T E R R O L L G R O U P G E N E R a L I N f O R m a T I O N T O T h E f I N a N c I a L s T a T E m E N T s
83
The adoption of IAS 19 (amended) led to adjustments in prior periods (Restatement) as well as to changes in section 6.15 Employee benefits. The effects on the respective positions of the income statement, statement of comprehensive income, the balance sheet, cash flow statement and the equity statement of prior periods are presented below:
1.1BS annext22:Z66
Consolidated statement of financial position
in thousands CHF 31.12.2012 31.12.2012 in %
reported revaluation restated
aSSetS
Deferred tax assets 2 118 720 2 838Total non-current assets 118 988 720 119 708 52.4
Total assets 226 872 720 227 592 100.0
eQu It y and l IaB I l I t I eS
Retained earnings 192 385 –1 726 190 659Total equity 159 363 –1 726 157 637 70.2
Pension liabilities – 3 469 3 469Provisions 6 345 –1 023 5 322Total non-current liabilities 13 670 2 446 16 116 6.0
Total liabilities 67 509 2 446 69 955 29.8
Total liabilities and shareholder’s equity 226 872 720 227 592 100.0
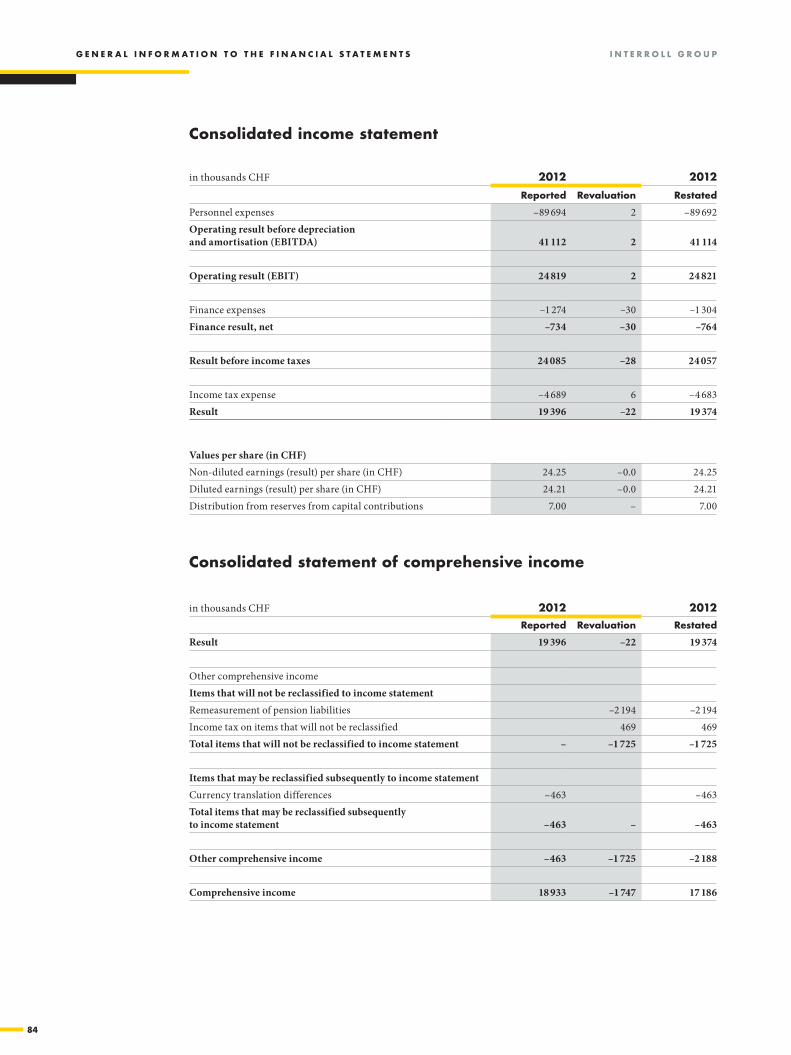
G e n e r a l I n f o r m a t I o n t o t h e f I n a n c I a l s t a t e m e n t s I n t e r r o l l G r o U P
84
1.2pl annext20:Z45
Consolidated income statement
in thousands CHF 2012 2012
reported revaluation restated
Personnel expenses –89 694 2 –89 692Operating result before depreciation and amortisation (EBITDA) 41 112 2 41 114
Operating result (EBIT) 24 819 2 24 821
Finance expenses –1 274 –30 –1 304Finance result, net –734 –30 –764
Result before income taxes 24 085 –28 24 057
Income tax expense –4 689 6 –4 683Result 19 396 –22 19 374
1.2pl annext47:Z50
Values per share (in CHF)Non-diluted earnings (result) per share (in CHF) 24.25 –0.0 24.25 Diluted earnings (result) per share (in CHF) 24.21 –0.0 24.21 Distribution from reserves from capital contributions 7.00 – 7.00
1.2pl annext52:Z69
Consolidated statement of comprehensive income
in thousands CHF 2012 2012reported revaluation restated
Result 19 396 –22 19 374
Other comprehensive incomeItems that will not be reclassified to income statementRemeasurement of pension liabilities –2 194 –2 194Income tax on items that will not be reclassified 469 469Total items that will not be reclassified to income statement – –1 725 –1 725
Items that may be reclassified subsequently to income statementCurrency translation differences –463 –463Total items that may be reclassified subsequently to income statement –463 – –463
Other comprehensive income –463 –1 725 –2 188
Comprehensive income 18 933 –1 747 17 186

I N T E R R O L L G R O U P G E N E R a L I N f O R m a T I O N T O T h E f I N a N c I a L s T a T E m E N T s
85
Future new or revised IAS/IFRS standards and interpretationsThe following new or revised standards and interpretations were enacted before the balance sheet date but will come into force later. Interroll does not early adopt these standards and interpretations in its consolidated financial statements:
– Amendment to IAS 19 (effective as of 1/7/2014, employer benefits: employee contributions) – Amendment to IAS 32 (effective as of 1/1/2014, Offsetting financial assets with financial liabilities) – New: IFRS 9 (effective date open, Financial Instruments) – Amendment to IAS 39 (effective as of 1/1/2014, novation of derivatives and continuation of hedge accounting)
Group Management currently analysis potential effects of other new or amended standards and interpre-tations on the consolidated financial statement. Interroll Group closely follows discussions on IAS/IFRS standards and checks potential effects on group financial statement or disclosure requirements. At the moment being, the Group expects only minor impacts in the presentation of the financial statements and no material impact on the annual financial statements.
1.4Cfl annexu20:aB38
Consolidated statement of cash flows
in thousands CHF 2012 2012reported revaluation restated
Result 19 396 –22 19 374
Other non-cash income 54 22 76Cash flow from operating activities 38 176 – 38176
1.5eQuIty annext100:x110
Consolidated statement of changes in equity
in thousands CHF 2012 2012 reported revaluation restated
Balance as per 1 January 2012 143 285 21 143 306 Result 19 396 –22 19 374 Other comprehensive income –463 –1 725 –2 188 Comprehensive income 18 933 –1 747 17 186 Other equity changes –2 855 – –2 855 Total equity as per 31 December 2012 159 363 –1 726 157 637

G e n e r a l I n f o r m a t I o n t o t h e f I n a n c I a l s t a t e m e n t s I n t e r r o l l G r o U P
86
2.2 Critical accounting estimates and judgments
When preparing the consolidated financial statements, Group Management and the Board of Directors must make estimates and assumptions concerning the future. The resulting accounting estimates have an impact on the Group's assets, liabilities, income and expenses. Also, these estimates have an impact on the presentation of financial statments. Estimates made are assessed continuously and principally underlie historical experiences and other factors. The resulting accounting estimates can, by definition, deviate from the actual outcome.
The estimates and assumptions that have a significant risk of causing a material adjustment to the carrying amount of assets and liabilities within the next financial years are discussed below:
a) Income tax expense The Holding company and its subsidiaries are subject to income taxes in various countries. Significant
judgment is required in determining the required worldwide provision for current and deferred income taxes and the realization of tax losses carried forward. There are many transactions and calculations made for which the final tax determination is uncertain in the year under review. In case final tax assess-ments or tax audits of such matters are different from the amounts that were initially recorded, such dif-ferences may materially impact income tax expenses of the current period. The assessment of deferred tax assets is done with reference to business plans. Capitalised effects of losses carried forward are subject to annual review. Losses carried forward are only capitalised if they are usable within the next three years under valid fiscal law in respective countries. The relevant figures are outlined in note 7.6.
b) Recoverable amount of goodwill, patents and licenses The assessment of the recoverable amount of goodwill and other intangible assets is, by definition,
subject to uncertainties regarding expected future cash flows. It requires making assumptions and calculating parameters, whose adequacy will only turn out in the future. We refer to comments made under note 6.3 that also includes the relevant carrying amounts.
c) Provisions Liabilities from warranty are a result of the operational business of the Group. These provisions are ac-
crued at balance sheet date based on historical experience. The actual cash flow can be lower or higher or specific requests can be covered by insurance. The assessment of provisions and pension liabilities is, by definition, subject to uncertainties regarding future cash flows. It requires making assumptions and determining parameters, whose adequacy will only become clear in the future. We refer to comments made under notes 6.14 and 6.15, which also in-clude the relevant carrying amounts.

I N T E R R O L L G R O U P G E N E R a L I N f O R m a T I O N T O T h E f I N a N c I a L s T a T E m E N T s
87
2.3 principles of consolidation and valuation
General notes to the principles of consolidationThe consolidated financial statements of Interroll Holding Ltd. include the parent company’s financial statements and the financial statements of all directly or indirectly held Swiss and foreign subsidiaries where the parent company holds more than 50% of the voting rights or effectively exercises control through other means.
The full consolidation method is applied, whereby the assets, liabilities, income and expenses are fully incorporated. The proportion of the net assets and net income attributable to minority shareholders is presented separately as minority interest in the consolidated statement of financial position, the consoli-dated income statement and the consolidated statement of comprehensive income.
Accounts payable to, accounts receivable from, income and expenses between the companies included in the scope of consolidation are eliminated. Intercompany profits included in inventories of goods produced are also eliminated.
Subsidiaries acquired during the year are included in the consolidated financial statements from the date on which control is obtained, while subsidiaries sold are excluded from the consolidated financial statements from the date on which control is given up. The capital consolidation at acquisition date is effected on the purchase method. The acquisition price for a business combination is defined by the sum of assets and liabilities acquired or incurred, measured at fair value, and of the sum of equity instruments issued. Trans-action costs related to a business combination are expensed. The goodwill resulting from such business combination is to be recognised as an intangible asset. It corresponds to the excess of the sum of the acquisi-tion price, the amount of non-controlled interests of the entity acquired, the fair value of equity instruments held already held before over the balance of assets, liabilities and contingent liabilities at fair value. For the valuation of non-controlled interests there are options per transaction. Either the non-controlled interests is valued at fair value or based on the proportion of the net assets acquired at fair value related to the non-controlled interests. An eventual negative goodwill is immediately recognised in the income statement after review of the fair value of the net assets acquired and eliminated against the purchase price. The goodwill is subject to a yearly impairment test or even before if indications for an early impairment test exist.
Changes in the amount of holding which do not result in a loss of control are considered to be transactions with equity holders. Any difference between the acquisition price paid respectively the consideration re-ceived and the amount, by which the non-controlled interests value is adjusted, is recognised in the equity.
G e n e r a l I n f o r m a t I o n t o t h e f I n a n c I a l s t a t e m e n t s I n t e r r o l l G r o U P
88
Investments in associates are investments where the parent company is either (directly or indirectly) entitled to 20% to 50% of the voting rights or has considerable influence through other means. Investments in associates are accounted for by applying the Equity Method. Under this method, the investment is initially recorded at the purchase price and subsequently increased or decreased by the share of the associate’s profits or losses incurred after the acquisition, adjusted for any impairment losses. The Group’s share of results of associates is recognised in the income statement and in the statement of comprehensive income under share of profit and loss of associates. Goodwill included in the purchase price, representing any excess of consideration over the Group’s share in net assets of the associate, is recognised as part of the investment’s carrying amount. Dividends received during the year reduce the carrying amount of such investments.
Investments of which the Group does not hold a significant position of voting rights or of which the Group holds less than 20%, are not consolidated but stated at their estimated fair value. Such investments are presented under financial assets at their estimated fair value. Any fair value adjustments are recognised in retained earnings. Fair value adjustments are recycled through the income statement at the date of disposal.
Foreign currency translationThe consolidated financial statements are presented in Swiss Francs (CHF). All assets and liabilities of the consolidated foreign subsidiaries are translated using the exchange rates prevailing at the closing date. Income, expenses and cash flows are translated at the average exchange rates for the year under review. The foreign currency translation differences resulting from applying different translation rates to the state-ment of financial position, the income statement and the statement of comprehensive income are added to or deducted from the line translation reserve of the equity. The same principle is applied for those resulting from the translation of the subsidiaries’ opening net asset values at year end rates and those arising from long term intercompany loans (net investment approach).
Transactions in consolidated entities where the transaction currency is different from the functional currency of the entity are recorded using exchange rates prevailing at the time of the transaction. Gains or losses arising on settlement of these transactions are included in the income statement. Monetary assets and liabilities denominated in foreign currencies are translated using the exchange rates prevailing at year end (closing date). Any gains or losses resulting from this translation are also recognised in the income statement.
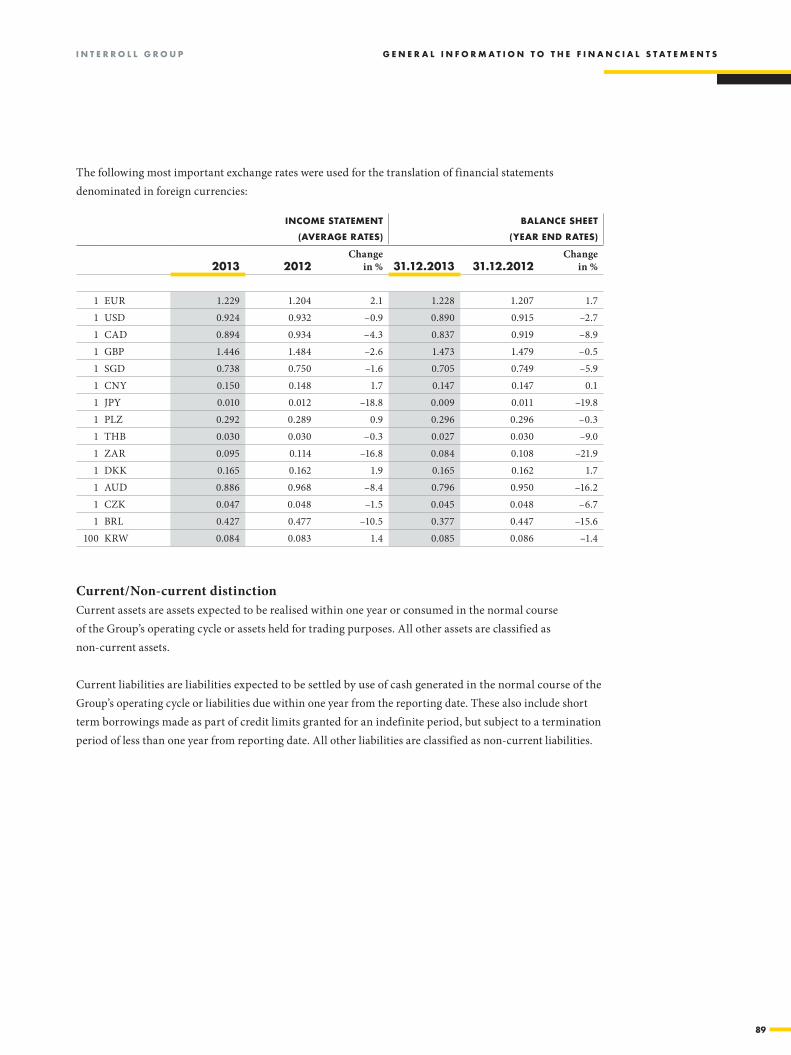
I N T E R R O L L G R O U P G E N E R a L I N f O R m a T I O N T O T h E f I N a N c I a L s T a T E m E N T s
89
The following most important exchange rates were used for the translation of financial statements denominated in foreign currencies:
Current/Non-current distinctionCurrent assets are assets expected to be realised within one year or consumed in the normal course of the Group’s operating cycle or assets held for trading purposes. All other assets are classified as non-current assets.
Current liabilities are liabilities expected to be settled by use of cash generated in the normal course of the Group’s operating cycle or liabilities due within one year from the reporting date. These also include short term borrowings made as part of credit limits granted for an indefinite period, but subject to a termination period of less than one year from reporting date. All other liabilities are classified as non-current liabilities.
2,3fx-rateSt20:aa37
InCoMe StateMent
(averaGe rateS)
BalanCe Sheet
(year end rateS)
2013 2012Change
in % 31.12.2013 31.12.2012Change
in %
1 EUR 1.229 1.204 2.1 1.228 1.207 1.7 1 USD 0.924 0.932 –0.9 0.890 0.915 –2.7 1 CAD 0.894 0.934 –4.3 0.837 0.919 –8.9 1 GBP 1.446 1.484 –2.6 1.473 1.479 –0.5 1 SGD 0.738 0.750 –1.6 0.705 0.749 –5.9 1 CNY 0.150 0.148 1.7 0.147 0.147 0.1 1 JPY 0.010 0.012 –18.8 0.009 0.011 –19.8 1 PLZ 0.292 0.289 0.9 0.296 0.296 –0.3 1 THB 0.030 0.030 –0.3 0.027 0.030 –9.0 1 ZAR 0.095 0.114 –16.8 0.084 0.108 –21.9 1 DKK 0.165 0.162 1.9 0.165 0.162 1.7 1 AUD 0.886 0.968 –8.4 0.796 0.950 –16.2 1 CZK 0.047 0.048 –1.5 0.045 0.048 –6.7 1 BRL 0.427 0.477 –10.5 0.377 0.447 –15.6
100 KRW 0.084 0.083 1.4 0.085 0.086 –1.4
G e n e r a l I n f o r m a t I o n t o t h e f I n a n c I a l s t a t e m e n t s I n t e r r o l l G r o U P
90
Segment reportingSince 1 January 2011, Interroll Group consists of one single business unit. The complete product range is sold in all markets through the respective local sales organisation. The customer groups being OEM’s (original equipment manufacturers), system integrators and end users are taken care of by tailor-made product offerings and differentiated consulting levels. The Interroll manufacturing units focus on the production of specific product ranges. Assembly units receive semi-finished products from the manufacturing units and assemble a wide product range for their local markets. The Interroll Research Center, which is centrally located, develops new application technologies and new products for all product groups. The manufacturing units continuously refine the current product ranges they are focused on.
Group Management and the Interroll management structure are organised by functions (Overall Man - agement, Products & Technology, Global Sales & Service, Corporate Marketing and Corporate Finance). The financial management of the Group by the Board of Directors is effected on one hand by turnover of the product groups and geographical markets and on the other hand by the reporting of the consolidated finan-cial statements. Group Management additionally assesses the achievement of financial and qualitative targets of all legal entities.
Based on the current management structure, financial reporting to the chief operating decision makers is carried out in one reportable segment which is equal to the consolidated statements of the Group.

I N T E R R O L L G R O U P G E N E R a L I N f O R m a T I O N T O T h E f I N a N c I a L s T a T E m E N T s
91
Statement of cash flowsThe statement of cash flows presents, net of any foreign exchange rate effects, cash flows during the year classified by operating, investing and financing activities, thereby providing information about the changes of cash and cash equivalents during the reporting period. Cash equivalents are held for the purpose of meet-ing the Group’s short term cash commitments rather than for investment or any other purposes. The effect of foreign exchange rate changes on cash and cash equivalents in foreign currencies is disclosed separately.
Net cash from operating activities is determined using the indirect method, whereby the net result for the year is adjusted for:
a) effects of transactions of non-cash nature;
b) deferrals or accruals of past or future operating cash receipts or payments;
c) items of income or expense associated with investing or financing cash flows.
ImpairmentsThe carrying value of long term non-financial assets except assets from retirement benefits and assets from deferred taxes are assessed at least once a year. If indications for an impairment exist, a calculation of the recoverable amount is performed (impairment test). For goodwill, other intangible assets with an indefi-nite useful lifetime and intangible assets which are not yet available for use, the recoverable amount is calcu-lated regardless of the existence of indications of a decrease in value. If the carrying value of such an asset or the cash generating unit to which such an asset belongs is to exceed the recoverable amount, an adjustment is recognised through the income statement. Impairments on a cash generating unit or a group of cash generating units are first adopted on the goodwill and are thereafter proportionally split onto the other assets of the unit (or the Group).
The recoverable amount is the higher value of fair value less selling costs and value in use. The estimated future discounted cash flows are evaluated to determine the value in use. The discounting rate applied corresponds to a pre-tax rate which reflects the risk related to the assets. If an asset does not largely gener-ate independent cash flows, the recoverable amount of the cash generating unit is calculated to which the asset concerned belongs to.
Impairments on the remaining assets are reversed if the estimations made in the calculation of the recoverable amount have changed and either has resulted in a reduction of the impairment amount or no impairment is required anymore. An appreciation in value of the goodwill may not be performed.
G e n e r a l I n f o r m a t I o n t o t h e f I n a n c I a l s t a t e m e n t s I n t e r r o l l G r o U P
92
Derivative financial instrumentsDerivatives financial instruments are stated at fair value. The method of recognising gains or losses depends on the type of the underlying transaction. The Group designates certain transactions with derivatives as either hedges of the fair value of recognised assets or liabilities (fair value hedges); or hedges of highly probable forecasted financial transactions (cash flow hedges). The Group documents at the inception of the transaction the relationship between hedging instruments and hedged items within the context of its risk management objective and strategy. The Group also documents its assessment of the effectiveness of the derivatives at acquisition and during its term in relation to both, the values hedged or also in view of future cash flows.
Changes in fair value are recognised as follows:
a) Fair value hedges Changes in the fair value of derivatives designated and qualified as fair value hedges are recorded in the
income statement, together with any changes in the fair value of the hedged assets or liabilities.
b) Cash flow hedges Changes in fair value of derivatives designated and qualified as cash flow hedges are recognised in equity.
Amounts accumulated in equity are recycled to the statement of comprehensive income in the periods when the hedged item will affect profit or loss. When a hedging instrument expires or is sold, or when a hedge no longer meets the criteria for hedge accounting, any cumulative gain or loss existing in equity at that time remains in equity and is recognised when the initial transaction is ultimately recognised in the income statement. When a forecast transaction is no longer expected to occur, the cumulative gain or loss that was reported in equity is immediately transferred to the income statement.
c) Other securities or financial instruments Certain derivatives do not qualify for hedge accounting. Changes in the fair value of such hedging instru-
ments are recognised immediately in the income statement. The fair value of derivatives traded in public markets is based on quoted market prices at the balance sheet date. The quoted market price used for financial assets is the current bid price; the appropriate quoted market price for financial liabilities is the current ask price. The fair value of derivatives which are not traded publicly (for example, “over-the-counter” derivatives) is determined by a valuation provided by the financial institution from whom the derivative has been acquired.
I N T E R R O L L G R O U P G E N E R a L I N f O R m a T I O N T O T h E f I N a N c I a L s T a T E m E N T s
93
2.4 accounting principles: statement of financial position
Property, plant and equipmentProperty, plant and equipment are stated at cost less accumulated depreciation and any impairment losses. Non-current assets acquired by way of finance leases are recognised at the lower of the present value of future minimum lease payments and fair value, and depreciated accordingly. The related leasing liabilities are presented at their present value.
Depreciation is recognised on a straight-line basis over the estimated useful life and considering a potential residual value. The following useful economic life terms apply to the Group's main asset categories:
Buildings 25 yearsMachinery 10 yearsVehicles 5 yearsOffice machines and furniture 5 yearsTools and moulds 5 yearsIT infrastructure 3 years
Components of major investments in fixed assets with different estimated useful lives are recognised separately and depreciated accordingly. Estimated useful lives and estimated residual values are revised on a yearly basis as per reporting date and resulting adjustments are recorded in the income statement.
Assets under construction which completion has not yet been concluded or which cannot be used yet are capitalised based on incurred costs as per closing date. Respective depreciation is recognised when the construction can be used.
Interests directly related to the acquisition or construction of property, plant and equipment is capitalised and allocated to the related asset.
G e n e r a l I n f o r m a t I o n t o t h e f I n a n c I a l s t a t e m e n t s I n t e r r o l l G r o U P
94
Intangible assetsIntangible assets include goodwill, intangible assets purchased in the course of business combinations (patented and unpatented technology, customer relationship), licenses and patents and similar rights acquired from third parties as well as software acquired from third parties. These assets are stated at cost value and are are amortised on a straight-line basis over the following, expected useful life time:
Standard software 3 yearsERP software 8 yearsCustomer relationship 5–10 yearsPatents, technology and licenses 6 years
Acquired customer relationship are customer values identified within the scope of IFRS 3. They are amor-tised based on their estimated melt off being a period of 5 –10 years. In markets in which Interroll holds a solid market position, customer value is amortised over 10 years. A shorter amortisation period is defined in markets with stiff competition.
Patents and technical know-how are amortised over their expected useful life. In view of the innovative market and competition environment the amortisation period has been determined to be 6 years.
Furthermore, intangible values acquired within business combinations may be identified. Such result from individual contractual agreements. These values are amortised over the period deviated from the contractual agreement.
Goodwill and intangible assets with an indefinite useful life are allocated to specific cash generating units in order to allow the identification of possible impairment. Such impairment tests are carried out on a yearly basis and any impairment is recognised in the income statement. Goodwill arising from the acquisition of a foreign entity is attributed to that entity’s net assets and reported in the functional currency of that entity being translated to the Group’s reporting currency at the year end rate.
Financial assetsFinancial assets mainly comprise loans receivable that are stated at amortised cost less any valuation allowance. The recognition of interest income is based on the effective interest rate method. Moreover, this item includes investments of less than 20%. They are stated at their estimated fair value. Any fair value adjustments are recognised in the equity and are recycled in the income statement only at the date of disposal or when impairment arises.
I N T E R R O L L G R O U P G E N E R a L I N f O R m a T I O N T O T h E f I N a N c I a L s T a T E m E N T s
95
Non-current assets held for saleTangible assets or a group of assets are classified as “non-current assets held for sale” if their carrying value will most probably be realised in a divestment transaction rather than by being used in the normal course of business. Such assets are brought actively onto market and should be sold within one year. Non-current assets held for sale are presented at the recoverable amount, which is the lower of book value or fair value less costs to sell.
InventoriesInventories are stated at the lower of cost (purchase price or Group production cost) and net realisable value. The cost of inventories is calculated using the weighted average method. Production overheads are allocated to inventories on a proportional basis. Slow moving goods and obsolete stocks are impaired. Intercompany profits included in inventories are eliminated by affecting net result.
Trade and other accounts receivableTrade and other accounts receivable are stated at amortised cost, generally equalling nominal value. The amount of valuation adjustments corresponds to the difference between the carrying amount and the net present value of the future estimated cash flow. The valuation adjustments include individual impair-ment for specifically identified positions, where indication exists that the outstanding amount might not be fully recovered.
Lump sum impairment covers expected losses that cannot be excluded based on historical data and payment statistics. As soon as sufficient evidence is available that the receivable will definitively not be recovered, the related amount is directly written off and offset with the specific individual impairment respectively.
Marketable securitiesMarketable securities are stated at their fair value as of balance sheet date. Unrealised gains and losses are included in the financial result.
Cash and cash equivalentsCash and cash equivalents include cash on hand, postal and bank accounts, as well as credit balances payable on demand and deposits with a residual maturity of not more than 90 days at acquisition date. These balances are stated at nominal value.

96
G e n e r a l I n f o r M a t I o n t o t h e f I n a n C I a l S t a t e M e n t S I n t e r r o l l G r o u p
Shareholders’ equityShareholders’ equity is categorised as follows:
a) Share capital The share capital contains the fully paid in registered shares.
b) Share premium Share premium comprises payments from shareholders that exceed the par value as well as realised
gains/losses including tax on transactions with own shares.
c) Reserve for own shares The acquisition price of own shares is disclosed as a reduction of shareholders’ equity. Realised gains and
losses on transactions with own shares are recognised in share premium. Compensation and cash inflows resulting from the issue and subsequent possible exercise of share options are credited to the Groups’ reserves.
d) Translation reserve Translation reserve consists of accumulated translation differences resulting from translation of group
subsidiaries’ financial statements with a functional currency other than Swiss Franc and of equity-alike intercompany loans. The changes in currency differences is presented in the consolidated statement of comprehensive income.
e) Retained earnings Retained earnings contain not distributed profits.
Financial liabilitiesLoans payable and overdrafts are stated at amortised cost. The recognition of interest expenses is based on the effective interest rate method.
ProvisionsProvisions relate to product warranties and impending losses whose amount and timing is uncertain. They are recognised if the Group has an obligation based on past occurrences at balance sheet date or a cash drain is probable and can be reliably determined. The amounts recognised represent management’s best estimate of the expenditure that will be required to settle the obligation. Providing the effect is material, long-term provisions are discounted.
I N T E R R O L L G R O U P G E N E R a L I N f O R m a T I O N T O T h E f I N a N c I a L s T a T E m E N T s
97
Retirement benefitsThe Group sponsors pension plans according to the national regulations of the countries in which it operates. All significant pension plans are operated through pension funds that are legally independent from the Group. Generally, they are funded by employees’ and employers’ contributions. The foreign pension schemes are normally defined contribution plans whereby the pension expense for a period equals the companies’ contributions during that period. The Swiss and French pension schemes have certain characteristics of a defined benefit plan; the financial impact of this plan on the consolidated financial state-ments is determined based on the Projected Unit Credit Method.
Trade accounts payableTrade accounts payable are stated at amortised cost, generally equalling nominal value.
2.5 accounting principles: income statement
Revenue recognition, income from servicesRevenue is generally recognised upon delivery (transfer of risk and use), depending on the size and the complexity of the order, when technically approved by the customer. The Group establishes appropriate warranty provisions relating to rendered services in order to cover expected claims. Services which the Interroll Group performs in direct relation to its core products sold are recognised upon delivery in net sales. The Group performs services to third parties in connection with administrative tasks and freight. Furthermore, the Group grants distribution licenses to selected franchisees. Revenue resulting from these services are disclosed as other operating income in the income statement.
Material expensesMaterial expenses include all costs of raw materials and consumables used, goods purchased and third- party manufacturing, processing or conversion of the Group’s products (services purchased).
Product developmentExpenditure on research and development is only capitalised when the cumulative recognition criteria of IAS 38 are met. Expenses for product development include wages and salaries, material costs, depreciation of technical equipment and machinery dedicated to research and development, as well as proportional overhead costs. Such expenses are included in the respective line item of the income statement.

98
Employee participation plansCertain employees participate in equity based compensation plans of Interroll Holding Ltd. All equity based compensation granted to these employees is valued at fair value at grant date and recognised as personnel expense over the period until vesting date. The fair value is calculated on the basis of the Binomial method. Discounts granted to beneficiaries on the unconditional purchase of Interroll shares are recognised in the income statement at grant date. Cash inflows resulting from equity based participation plans are recognised as an increase in equity. Cash compensated participation plans are recognised as other liabilities and are valued at fair value at balance sheet date.
Operating lease expensesProperty, plant and equipment that are held under operating leases are not recognised on the statement of financial position. The operating lease expense is recognised in the income statement on a straight-line basis over the lease contract period. Operating lease obligations depending on revenues are estimated and accrued as they become due.
Financial resultInterest expenses on loans and finance lease liabilities are recognised as financial expenses, whereas interest income on financial assets is recognised in financial income, both on an accrual basis. Moreover, the financial result includes foreign exchange gains and losses arising from the translation of items of the statement of financial position and transactions in foreign currencies as well as changes in fair value of financial instruments.
Income tax expenseCurrent income taxes are calculated on the statutory results of the Group companies at the enacted or substantively enacted tax rate. They also include adjustment charges and credit notes issued on previous years’ results.
Changes in deferred taxes are generally recognised in the income tax position, unless the underlying transaction has been directly recognised in the other comprehensive income. In such case the related income tax is also directly recognised in the statement of comprehensive income or in equity. Temporary differences resulting from initial recognition of assets and liabilities are not recognised in the income statement. Temporary differences on the participation value of subsidiaries are not recognised if it is probable that the temporary differences will not go into reverse in the foreseeable future.
Deferred taxes are calculated using local enacted or substantively enacted tax rates. The future benefits of tax loss carry-forwards are recognised as an asset if it is probable that future taxable profits will be available to realise such benefits.
G e n e r a l I n f o r M a t I o n t o t h e f I n a n C I a l S t a t e M e n t S I n t e r r o l l G r o u p

99
3 rISk ManaGeMent
3.1 operational and strategic risk management
Risk management on group level supports strategic decision making. Operational and strategic risk management coordinates and monitors risks arising from the economic activities of the Group.
A systematic operational and strategic risk analysis is performed annually by Group Management. In an annual strategy meeting, Group Management discusses and analysis such risks. The Board of Directors is regularly informed in a uniform manner with the nature, scope, assessment and counteractive measures of the risks.
3.2 financial risk management
General information to the financial risk management of Interroll GroupThe Group’s activities expose it to a variety of financial risks: market risk (currency risk, interest rate risk and price risk), credit risk, liquidity risk and cash flow risk. The Group’s risk management program focuses on the unpredictability of financial markets and seeks to minimize potential adverse effects on Group’s financial performance.
The Board of Directors has the supreme responsibility for risk management. The Board of Directors appoints thereto the Audit Committee, who is responsible for the development and the supervision of the risk management principles. The Audit Committee reports regularly to the Board of Directors.
The principles established for risk management are geared to identify and analyse those risks that may impact the Group, to define adequate limits and to perform controls over the risks and their adherence to. The risk management principles and the related procedures are regularly verified in order to consider changing market conditions and operations of the Group. The target is to develop management regulations and management processes and a disciplined and constructive control environment through existing training and guidelines ensuring a disciplined and conscious handling of risks.
The Audit Committee supervises management in the control of compliance with principles and processes. Their adequacy is permanently verified in respect of the risks that the Group is exposed to. The Audit Committee is supported in this respect by the internal audit department.
I n t e r r o l l G r o u p r I S k M a n a G e M e n t

100
r I S k M a n a G e M e n t I n t e r r o l l G r o u p
Financial risk management is carried out by the central treasury department. Group Treasury identifies, evaluates and reduces financial risks in close co-operation with the Group’s operating units and reports at regular intervals to the Audit Committee.
The following sections provide a summary of the scope of individual risks and on the targets, principles and processes implemented for measuring, monitoring and hedging financial risks. Additional information on the financial risks is included in the notes to the consolidated financial statements (see note “6.9 – Financial risks”).
Market RiskMarket risks to which Interroll Group is exposed to can be summarised into the following three main risk categories:
a) Currency risk exposure The Group operates internationally and is exposed to foreign exchange risks arising from various curren-
cies. Foreign exchange risks arise from future commercial transactions and from recognised assets and liabilities. To manage its foreign exchange risk arising from future commercial transactions and recog-nised assets and liabilities, the Group operates an internal monthly “netting” process. Net exposure resulting from assets and liabilities recognised is partially reduced using forward currency contracts. Such contracts are entered into only with high-credit-quality financial institutions. Furthermore, the decen-tralised structure of the Group contributes to a substantial reduction of foreign currency exchange risks.
b) Interest rate risk Financial assets and liabilities contain interest bearing loans at either a fixed or a variable rate. Relating
interest risks are disclosed in 6.9.
c) Price risk The Group is exposed to raw material price changes (steel, copper, technical polymers) as well as to price
changes on financial liabilities and assets. Raw material price risks are not hedged while risks from finan-cial assets and liabilities may partially or fully reduced using derivative financial instruments (as described in 2.3 – Principles of consolidation and valuation, section “derivative financial instruments”).
101
Credit RiskThe risk of default is the risk to incur a financial loss when a customer or a counterparty to a financial in-strument does not fulfill its legal obligation. The default risk at Interroll exists on trade and other accounts receivable and on cash and cash equivalents.
Customers exceeding EUR 5 000 credit limit are verified for their creditworthiness before the order is executed. The creditworthiness verification is also based on the credit information database provided by an international service provider leading in this sector. Their software allows determining a credit limit per single customer, based on specifically determined calculation formulas. The calculation formulas have been defined by Interroll Group.
Accumulation of credit risks in trade and other accounts receivable is limited due to numerous customers and their worldwide location. The extent of credit risks is mainly determined by the individual characteris-tics of each single customer. The risk evaluation includes an assessment of the creditworthiness by con-sidering the customer’s financial situation, its credit history and other factors. Sales and revenue from services are performed only with customers whose credit worthiness is proved through the above process. A credit limit is defined for each customer. These limits are verified at least once a year.
Interroll invests its funds in short term deposits at a multitude of banks with whom long standing rela-tionships exist. Such deposits have a maturity date shorter than twelve months. Likewise, transactions with derivative financial instruments are entered into only with major financial institutions. Interroll does not hold material open positions with these institutions.
The maximum credit risk from financial instruments corresponds to the balance sheet amount of each single financial asset. There are no guarantees or other liabilities that could increase the risk over the corresponding amount in the statement of financial position.
Liquidity RiskLiquidity risk is the risk that the Group cannot fulfil its financial obligations on time.
Prudent liquidity risk management implies maintaining sufficient cash and marketable securities, the availability of funding through an adequate amount of committed credit facilities and the ability to close market positions at any time. Due to the dynamic nature of the underlying business, Group Treasury aims to ensure funding by keeping committed credit limits available.
I n t e r r o l l G r o u p r I S k M a n a G e M e n t

102
3.3CapitalMGtt20:v51
3.3 Capital risk management
Objectives and principles of capital managementIt is the objective of Interroll Group to safe-guard its going concern by the definition and adherence to a strong base of equity. Such equity level is defined based on the operational and balance sheet risk of the Group. Refunding of the Group shall be adapted to the asset structure and allow further growth of the business. The distribution of a regular portion of the profits shall be made possible based on the realisation of an appropriate return on equity.
Equity ratio targets and pay-out ratioBased on above targets and principles, Group Management aims at a long-term equity ratio of approximately 50 %. The ordinary pay-out ratio corresponds to about 30 % of net profits. This ratio may deviate depending on the general economic outlook and the planned future investment activities.
Key figures to capital managementThe following table discloses some essential key figures in regards to capital risk management. Further notes can be found in the inbounds of the annual report.
in million CHF, if not stated differently 2013 2012
Total assets 258.2 227.6Net financial assets 20.2 8.7Gearing (net debts/equity) n/a n/a
Operating cash flow 44.5 38.2Indebtedness factor (net debt/cash flow) n/a n/a
Equity 187.2 157.6Equity ratio (equity in % of assets) 72.5 69.3
Result 20.5 19.4Return on equity (in %) 11.9 12.8
Non-diluted earnings per share (in CHF) 24.84 24.25Distribution per share (in CHF) 8.80 8.00Pay out ratio (in %) 35.4 33.0
Debt CovenantsDetermined debt covenants for comitted credit lines over CHF 40 million demand an equity ratio of at least 35 % (see 6.9 Financial risks – Credit facilities and debt covenants)
r I S k M a n a G e M e n t I n t e r r o l l G r o u p

103
4ChanGeranGet20:t31
4 ChanGeS In the SCope of ConSolIdatIon
Changes in business year 2013
New companiesInterroll’s business activities in Italy were conducted by the newly formed Interroll Italia S.r.l. in Rho near Milano since June 2013. Previously, Interroll was represented in the Italian market by Rulmeca. The new company was consolidated as from 1 July 2013. Furthermore, as from November 2013 Interroll started with a new company in Atlanta/USA. The effects of the establishment of these new companies had no material impact on the Interroll Group’s consolidated financial statements in the 2013 reporting year.
AcquisitionsAs at 10 July 2013, 100 % of the shares in the Portec Group International, Inc. in Cañon City, USA were acquired for a purchase price of CHF 25.3 million, providing control over the Portec Group. The company produces belt curves and primarily sells to customers from the airport, postal services and logistics sectors in the USA, Europe and Asia-Pacific. At the same time, 100 % of the shares in Portec Inc., Cañon City, USA, and 60 % of the shares in Portec Asia Ltd., Hong Kong, China, were also acquired. The value of the net assets acquired totalled CHF 17.9 million. Goodwill amounted to CHF 7.4 million. It is not expected that the goodwill will be deductible for income tax purposes. Intangible assets amounting to CHF 13.0 million mainly comprised customer relationships, trademarks and patents. The purchase price allocation was not final as at the reporting date of 31 December 2013. It is expected that Interroll’s presence in US airports will be strengthened, in particular, following this acquisition. In addition, cost savings as a result of synergies are anticipated. The goodwill amounting to CHF 7.4 million resulted from the customer base and major synergies expected from the integration of Portec Group into Interroll.
I n t e r r o l l G r o u p C h a n G e S t o t h e S C o p e o f C o n S o l I d a t I o n
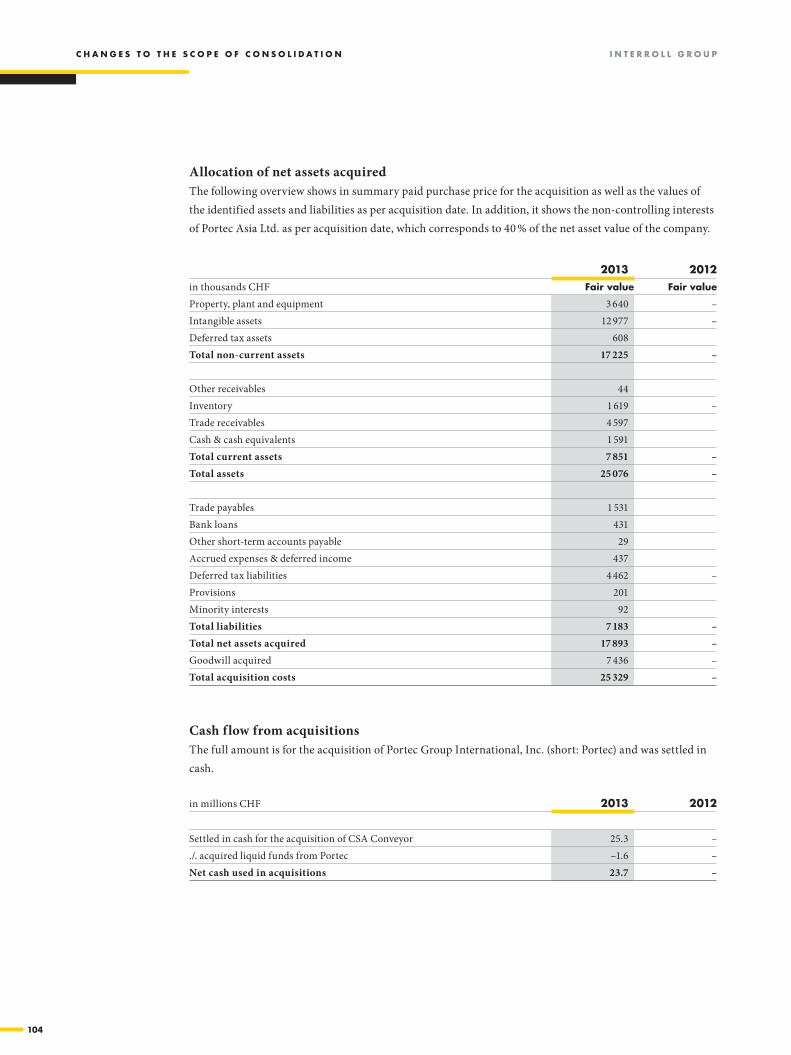
104
C h a n G e S t o t h e S C o p e o f C o n S o l I d a t I o n I n t e r r o l l G r o u p
Allocation of net assets acquiredThe following overview shows in summary paid purchase price for the acquisition as well as the values of the identified assets and liabilities as per acquisition date. In addition, it shows the non-controlling interests of Portec Asia Ltd. as per acquisition date, which corresponds to 40 % of the net asset value of the company.
4ChanGeranGet33:v58
2013 2012in thousands CHF fair value fair value
Property, plant and equipment 3 640 –Intangible assets 12 977 –Deferred tax assets 608 Total non-current assets 17 225 –
Other receivables 44 Inventory 1 619 –Trade receivables 4 597 Cash & cash equivalents 1 591 Total current assets 7 851 –Total assets 25 076 –
Trade payables 1 531 Bank loans 431 Other short-term accounts payable 29 Accrued expenses & deferred income 437 Deferred tax liabilities 4 462 –Provisions 201 Minority interests 92 Total liabilities 7 183 –Total net assets acquired 17 893 –Goodwill acquired 7 436 –Total acquisition costs 25 329 –
Cash flow from acquisitionsThe full amount is for the acquisition of Portec Group International, Inc. (short: Portec) and was settled in cash.
in millions CHF 2013 2012
Settled in cash for the acquisition of CSA Conveyor 25.3 –./. acquired liquid funds from Portec –1.6 –Net cash used in acquisitions 23.7 –
4ChanGeranGet60:v67
105
I n t e r r o l l G r o u p C h a n G e S t o t h e S C o p e o f C o n S o l I d a t I o n
4ChanGeranGet69:t113
Further notes to acquisitionsAcquisition-related expenses of CHF 0.24 million were stated under consultancy expenses in the profit and loss account for financial year 2013. The fair value of trade receivables amounted to CHF 4.6 million. The gross amount of trade receivables due totalled CHF 4.9 million. Of this amount, it is expected that CHF 0.3 million will be irrecoverable. Since 10 July 2013, Portec Group has made a contribution totalling CHF 8.6 million to Interroll Group’s sales revenue. Its share in the profit for the same period of time amounted to CHF 0.5 million. Had Portec Group already been consolidated from 1 January 2013, sales revenue of CHF 327.9 million and a profit of CHF 21.3 million would have been reported in Interroll Group’s profit and loss account.
Changes in business year 2012In the previous year, there was no acquisition of subsidiaries or business activities respectively. There were also no payments due from previous acquisitions.
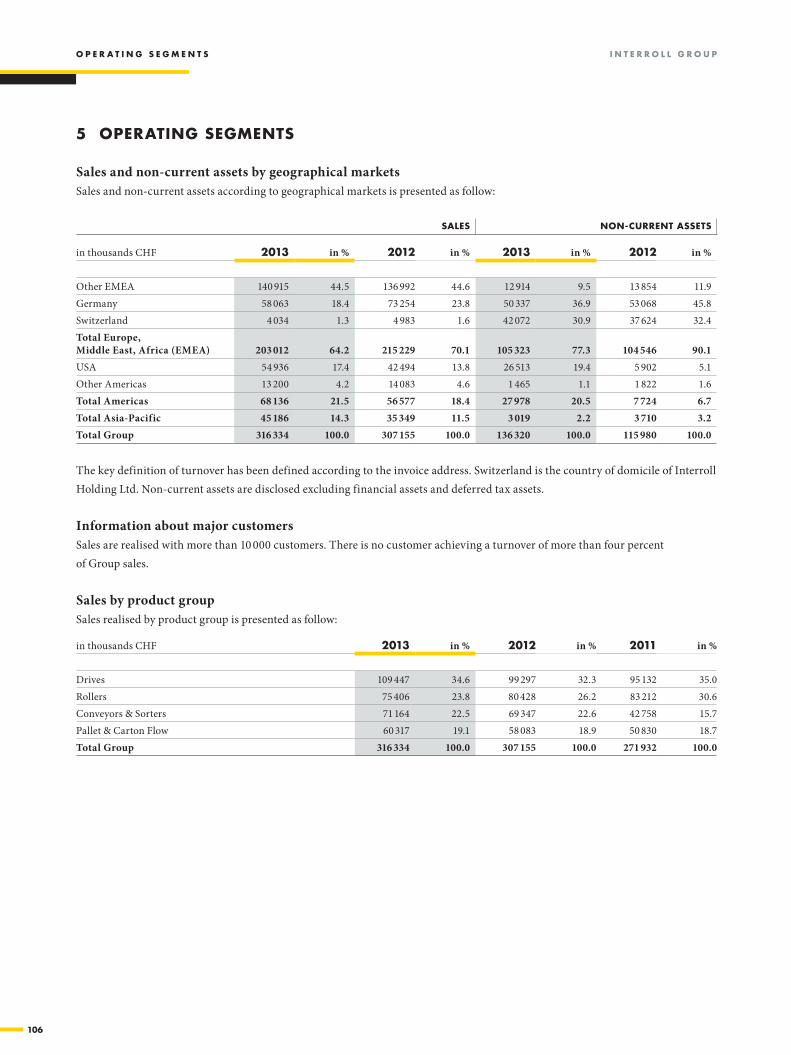
106
o p e r a t I n G S e G M e n t S I n t e r r o l l G r o u p
5SeGMentSa20:I39
5 operatInG SeGMentS
Sales and non-current assets by geographical marketsSales and non-current assets according to geographical markets is presented as follow:
SaleS non-Current aSSetS
in thousands CHF 2013 in % 2012 in % 2013 in % 2012 in %
Other EMEA 140 915 44.5 136 992 44.6 12 914 9.5 13 854 11.9 Germany 58 063 18.4 73 254 23.8 50 337 36.9 53 068 45.8 Switzerland 4 034 1.3 4 983 1.6 42 072 30.9 37 624 32.4 Total Europe, Middle East, Africa (EMEA) 203 012 64.2 215 229 70.1 105 323 77.3 104 546 90.1 USA 54 936 17.4 42 494 13.8 26 513 19.4 5 902 5.1 Other Americas 13 200 4.2 14 083 4.6 1 465 1.1 1 822 1.6 Total Americas 68 136 21.5 56 577 18.4 27 978 20.5 7 724 6.7 Total Asia-Pacific 45 186 14.3 35 349 11.5 3 019 2.2 3 710 3.2 Total Group 316 334 100.0 307 155 100.0 136 320 100.0 115 980 100.0
The key definition of turnover has been defined according to the invoice address. Switzerland is the country of domicile of Interroll Holding Ltd. Non-current assets are disclosed excluding financial assets and deferred tax assets.
5SeGMentSt41:Z54
Information about major customersSales are realised with more than 10 000 customers. There is no customer achieving a turnover of more than four percent of Group sales.
Sales by product groupSales realised by product group is presented as follow:
in thousands CHF 2013 in % 2012 in % 2011 in %
Drives 109 447 34.6 99 297 32.3 95 132 35.0 Rollers 75 406 23.8 80 428 26.2 83 212 30.6 Conveyors & Sorters 71 164 22.5 69 347 22.6 42 758 15.7 Pallet & Carton Flow 60 317 19.1 58 083 18.9 50 830 18.7 Total Group 316 334 100.0 307 155 100.0 271 932 100.0
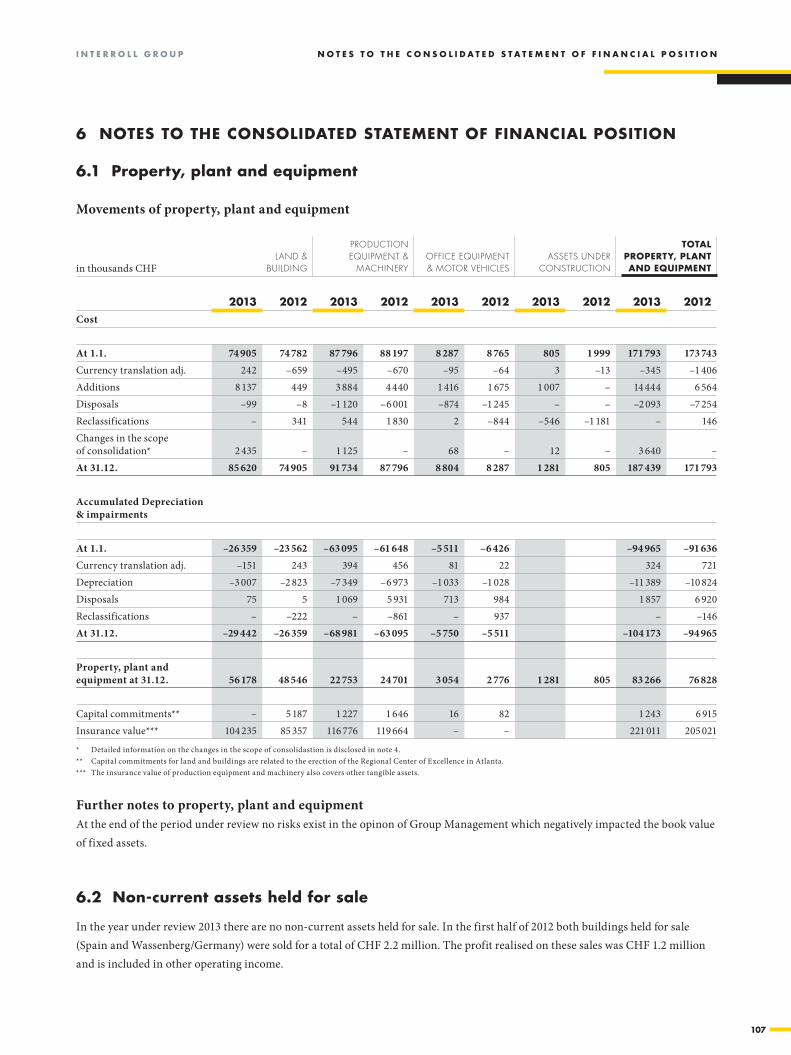
107
I n t e r r o l l G r o u p n o t e S t o t h e C o n S o l I d a t e d S t a t e M e n t o f f I n a n C I a l p o S I t I o n
* Detailed information on the changes in the scope of consolidastion is disclosed in note 4.** Capital commitments for land and buildings are related to the erection of the Regional Center of Excellence in Atlanta.*** The insurance value of production equipment and machinery also covers other tangible assets.
6 noteS to the ConSolIdated StateMent of fInanCIal poSItIon
6.1tanGIBleaSSetSt20:ad48
6.1 property, plant and equipment
Movements of property, plant and equipment
in thousands CHFland &
Building
produCtion equipment &
maChineryoffiCe equipment & motor vehiCleS
aSSetS under ConStruCtion
total property, plant and eQuIpMent
2013 2012 2013 2012 2013 2012 2013 2012 2013 2012Cost
At 1.1. 74 905 74 782 87 796 88 197 8 287 8 765 805 1 999 171 793 173 743 Currency translation adj. 242 –659 –495 –670 –95 –64 3 –13 –345 –1 406 Additions 8 137 449 3 884 4 440 1 416 1 675 1 007 – 14 444 6 564 Disposals –99 –8 –1 120 –6 001 –874 –1 245 – – –2 093 –7 254 Reclassifications – 341 544 1 830 2 –844 –546 –1 181 – 146 Changes in the scope of consolidation* 2 435 – 1 125 – 68 – 12 – 3 640 –At 31.12. 85 620 74 905 91 734 87 796 8 804 8 287 1 281 805 187 439 171 793
Accumulated Depreciation & impairments
At 1.1. –26 359 –23 562 –63 095 –61 648 –5 511 –6 426 –94 965 –91 636 Currency translation adj. –151 243 394 456 81 22 324 721 Depreciation –3 007 –2 823 –7 349 –6 973 –1 033 –1 028 –11 389 –10 824 Disposals 75 5 1 069 5 931 713 984 1 857 6 920 Reclassifications – –222 – –861 – 937 – –146 At 31.12. –29 442 –26 359 –68 981 –63 095 –5 750 –5 511 –104 173 –94 965
Property, plant and equipment at 31.12. 56 178 48 546 22 753 24 701 3 054 2 776 1 281 805 83 266 76 828
Capital commitments** – 5 187 1 227 1 646 16 82 1 243 6 915 Insurance value*** 104 235 85 357 116 776 119 664 – – 221 011 205 021
6.1tanGIBleaSSetSt50:u526.1tanGIBleaSSetSt54:t58
Further notes to property, plant and equipmentAt the end of the period under review no risks exist in the opinon of Group Management which negatively impacted the book value of fixed assets.
6.2 non-current assets held for sale
In the year under review 2013 there are no non-current assets held for sale. In the first half of 2012 both buildings held for sale (Spain and Wassenberg/Germany) were sold for a total of CHF 2.2 million. The profit realised on these sales was CHF 1.2 million and is included in other operating income.
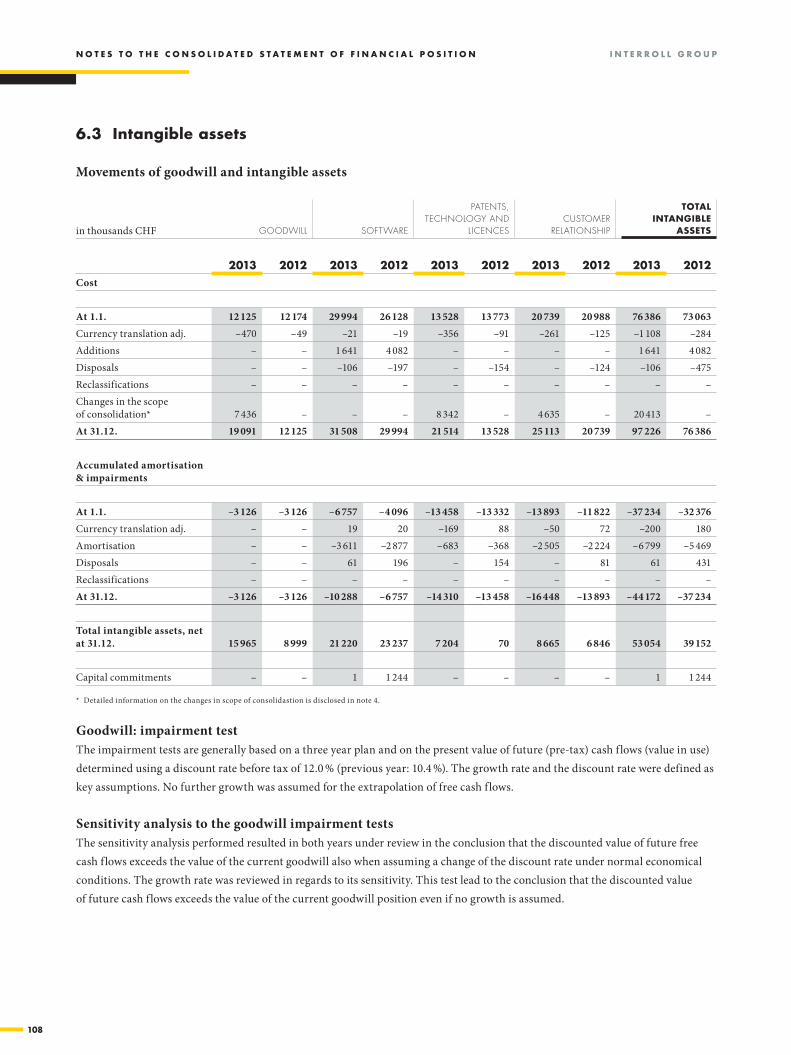
N O T E S T O T H E C O N S O L I D A T E D S T A T E M E N T O F F I N A N C I A L P O S I T I O N I N T E r r O L L g r O u P
108
6.2IntanGIBleaSSetSt20:ad47
t48:u48t52:t56
6.3 Intangible assets
Movements of goodwill and intangible assets
in thousands CHF goodwill Software
patentS, teChnology and
liCenCeSCuStomer
relationShip
total IntanGIBle
aSSetS
2013 2012 2013 2012 2013 2012 2013 2012 2013 2012Cost
At 1.1. 12 125 12 174 29 994 26 128 13 528 13 773 20 739 20 988 76 386 73 063 Currency translation adj. –470 –49 –21 –19 –356 –91 –261 –125 –1 108 –284 Additions – – 1 641 4 082 – – – – 1 641 4 082 Disposals – – –106 –197 – –154 – –124 –106 –475 Reclassifications – – – – – – – – – – Changes in the scope of consolidation* 7 436 – – – 8 342 – 4 635 – 20 413 – At 31.12. 19 091 12 125 31 508 29 994 21 514 13 528 25 113 20 739 97 226 76 386
Accumulated amortisation & impairments
At 1.1. –3 126 –3 126 –6 757 –4 096 –13 458 –13 332 –13 893 –11 822 –37 234 –32 376 Currency translation adj. – – 19 20 –169 88 –50 72 –200 180 Amortisation – – –3 611 –2 877 –683 –368 –2 505 –2 224 –6 799 –5 469 Disposals – – 61 196 – 154 – 81 61 431 Reclassifications – – – – – – – – – – At 31.12. –3 126 –3 126 –10 288 –6 757 –14 310 –13 458 –16 448 –13 893 –44 172 –37 234
Total intangible assets, net at 31.12. 15 965 8 999 21 220 23 237 7 204 70 8 665 6 846 53 054 39 152
Capital commitments – – 1 1 244 – – – – 1 1 244
* Detailed information on the changes in scope of consolidastion is disclosed in note 4.
Goodwill: impairment testThe impairment tests are generally based on a three year plan and on the present value of future (pre-tax) cash flows (value in use) determined using a discount rate before tax of 12.0 % (previous year: 10.4 %). The growth rate and the discount rate were defined as key assumptions. No further growth was assumed for the extrapolation of free cash flows.
Sensitivity analysis to the goodwill impairment testsThe sensitivity analysis performed resulted in both years under review in the conclusion that the discounted value of future free cash flows exceeds the value of the current goodwill also when assuming a change of the discount rate under normal economical conditions. The growth rate was reviewed in regards to its sensitivity. This test lead to the conclusion that the discounted value of future cash flows exceeds the value of the current goodwill position even if no growth is assumed.
I n t e r r o l l g r o u p n o t e S t o t H e C o n S o l I D A t e D S t A t e M e n t o F F I n A n C I A l p o S I t I o n
109
6.2IntanGIBleaSSetSt58:t67
SoftwareOut of the accumulated acquisition costs, CHF 27.9 million (previous year: CHF 26.7 million) relate to the setup, design and introduction of SAP. In the year under review the additions to this process management system amount to CHF 2.7 million (previous year: CHF 3.8 million). Capital commitments for software are related to the investment and development of SAP.
SAP was launched mid 2011 for the two Centers of Excellence for Drum Motors and Rollers/RollerDrive as well as for all European sales and service subsidiaries. Development costs incurred until that date in the amount of CHF 19.5 million were capitalised mid 2011 and are subject to amortisation over 8 years. In the third quarter of 2012, SAP was also launched in the Center of Excellence for Supermarket Products, in the Regional Center of Excellence for Rollers and Drum Motors in the USA as well as in several sales subsidiaries in Asia-Pacific. Respective development costs of CHF 6.9 million were capitalised and are subject to amorti-sation over 8 years since October 2012. During the reporting period SAP became active with Interroll China and the launch in the Competence Center Automation was designed. Respective development costs of CHF 0.5 million were capitalised in December 2013 and are subject to amortisation over 8 years. Further developments to introduce this ERP in other production sites were undertaken already and respective invest-ments amounted to CHF 1.0 million. No amortisation has been recognised so far on these amounts.
Patents and licensesPatents and licenses are normally amortised on a straight line basis over 6 years. At year end 2013, due to the acquistion of Portec, an amortisation term of additional 6 years remains on the major portion of patents and licenses. A review if indicators exist that point towards an impairment of patents and licenses was per-formed. There are no signs that would indicate an impairment of this value.
Customer relationshipCustomer relationship is normally amortised on a straight line basis over 10 years. At year end 2013, an amortisation term of additional 7 years remains on the major portion of customer relationship. A review if indicators exist that point towards an impairment of customer relationship was performed. There are no signs that would indicate an impairment of this value.

N O T E S T O T H E C O N S O L I D A T E D S T A T E M E N T O F F I N A N C I A L P O S I T I O N I N T E r r O L L g r O u P
110
6.4Inventoryt20:v43
6.5 Inventories
Detailed overview on the positions belonging to the inventory
in thousands CHF 31.12.2013 31.12.2012
Raw materials 27 050 24 879 Work in progress 12 001 11 824 Finished products 969 1 097 Valuation allowance –1 901 –2 205 Total inventory, net 38 119 35 595
No inventory was pledged in both years under review.
Developement of valuation allowance on inventory
in thousands CHF 2013 2012
Balance per 1.1. –2 205 –1 886 Currency translation adjustment 56 36 Additions –583 –734 Reductions 831 379 Total valuation allowance on inventory per 31.12. –1 901 –2 205
The addition of valuation allowances is due to slow or non moving items within the inventory. The reduction of valuation allowance on inventory is related to sale or scrap of items, as well as to a reassessment of the valuation allowance affecting the consolidated income statement of the Group.
6.3aSSetpledGedt20:v28
6.4 assets pledged or assigned
in thousands CHF 31.12.2013 31.12.2012
Land & buildings 1 317 1 299 Trade receivables 161 593 Total assets pledged or assigned 1 478 1 892
These assets are pledged respectively assigned to local credit lines granted (see liquidity risk in note 6.9).
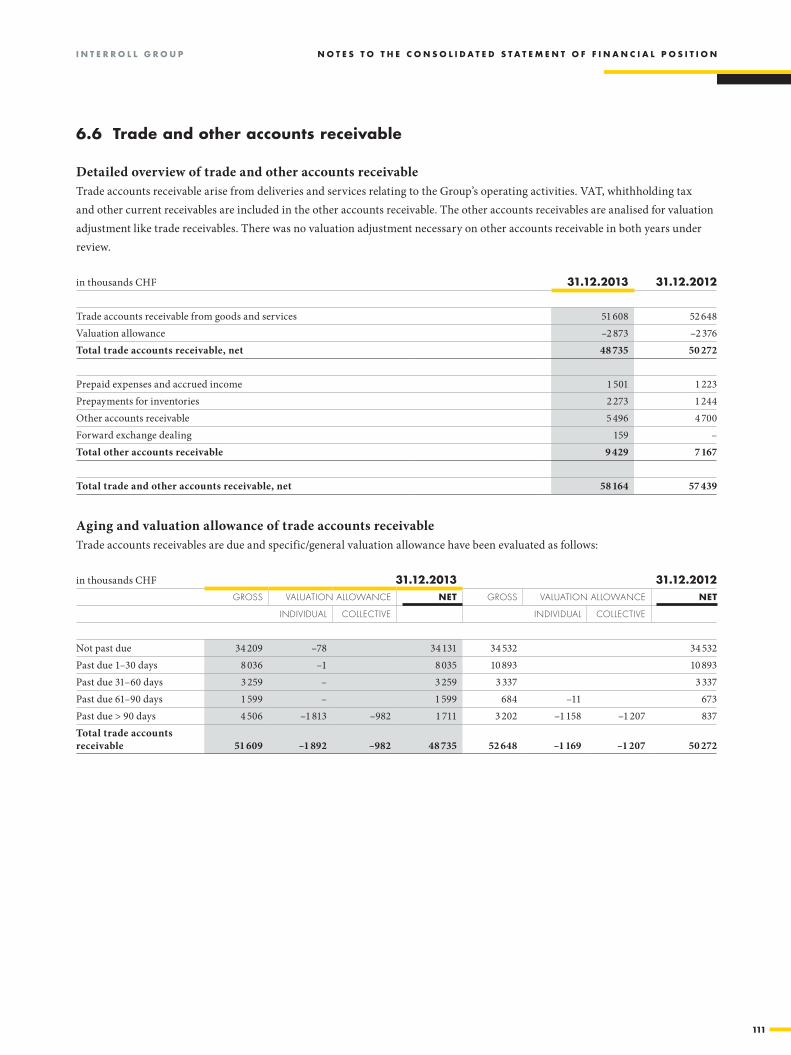
I n t e r r o l l g r o u p n o t e S t o t H e C o n S o l I D A t e D S t A t e M e n t o F F I n A n C I A l p o S I t I o n
111
6.6 trade and other accounts receivable
Detailed overview of trade and other accounts receivableTrade accounts receivable arise from deliveries and services relating to the Group’s operating activities. VAT, whithholding tax and other current receivables are included in the other accounts receivable. The other accounts receivables are analised for valuation adjustment like trade receivables. There was no valuation adjustment necessary on other accounts receivable in both years under review.
in thousands CHF 31.12.2013 31.12.2012
Trade accounts receivable from goods and services 51 608 52 648 Valuation allowance –2 873 –2 376 Total trade accounts receivable, net 48 735 50 272
Prepaid expenses and accrued income 1 501 1 223 Prepayments for inventories 2 273 1 244 Other accounts receivable 5 496 4 700 Forward exchange dealing 159 –Total other accounts receivable 9 429 7 167
Total trade and other accounts receivable, net 58 164 57 439
6.5tradereCeIvaBlet20:x36
6.5tradereCeIvaBlet40:aB52
Aging and valuation allowance of trade accounts receivableTrade accounts receivables are due and specific/general valuation allowance have been evaluated as follows:
in thousands CHF 31.12.2013 31.12.2012groSS valuation allowanCe net groSS valuation allowanCe net
individual ColleCtive individual ColleCtive
Not past due 34 209 –78 34 131 34 532 34 532 Past due 1–30 days 8 036 –1 8 035 10 893 10 893 Past due 31–60 days 3 259 – 3 259 3 337 3 337 Past due 61–90 days 1 599 – 1 599 684 –11 673 Past due > 90 days 4 506 –1 813 –982 1 711 3 202 –1 158 –1 207 837 Total trade accounts receivable 51 609 –1 892 –982 48 735 52 648 –1 169 –1 207 50 272

N O T E S T O T H E C O N S O L I D A T E D S T A T E M E N T O F F I N A N C I A L P O S I T I O N I N T E r r O L L g r O u P
112
6.5tradereCeIvaBlet55:Z70
Development of the individual and collective valuation allowance of trade accounts receivableThe valuation allowance on trade accounts receivable from third parties developed as follows:
in thousands CHF 2013 2012valuation allowanCe valuation allowanCe
total individual ColleCtive total individual ColleCtive
At 1.1. –2 376 –1 169 –1 207 –2 407 –1 191 –1 216 Currency translation adjustment 243 264 –21 11 2 9 Additions –1 557 –1 557 –655 –655 Alllowance used 581 581 242 242 Allowance reversed 236 –10 246 433 433 At 31.12. –2 873 –1 891 –982 –2 376 –1 169 –1 207
During the year under review, an amount of CHF 0.6 million (previous year: CHF 0.2 million) relating to irrecoverable trade recei-vables was written off. Currently, no other risks are identifiable in the net trade accounts receivable. Sales are broadly diversified across geographical and industrial markets. Thus, the risk of unexpected losses from trade receivables is assessed to be low.
6.5tradereCeIvaBlet73:x84
Currencies in trade accounts receivableTrade accounts receivable reported in CHF are denominated from the following currencies:
in thousands CHF 31.12.2013 31.12.2012in % in %
EUR 23 105 44.8 25 051 47.6 USD 10 046 19.5 7 798 14.8 CNY 6 244 12.1 4 755 9.0 THB 938 1.8 4 324 8.2 DKK 2 181 4.2 2 325 4.4 all other currencies 9 094 17.6 8 395 16.0 Total trade accounts receivable, gross 51 608 100.0 52 648 100.0
6.5tradereCeIvaBlet87:x97
Regional break down of trade accounts receivableTrade accounts receivable can be broken down into the following geographical areas:
in thousands CHF 31.12.2013 31.12.2012in % in %
Europe, Middle East, Africa 28 725 55.7 31 212 59.3 Americas 10 865 21.0 9 276 17.6 Asia-Pacific 12 018 23.3 12 160 23.1 Total trade accounts receivable, gross 51 608 100.0 52 648 100.0
At average, trade accounts receivable are 57 days outstanding (DSO). The respective value is for Europe 54, for Americas 58 and for Asia 69. In the previous year, the DSO was 53 for the Group, for Europe 45, for Americas 64 and for Asia 93.
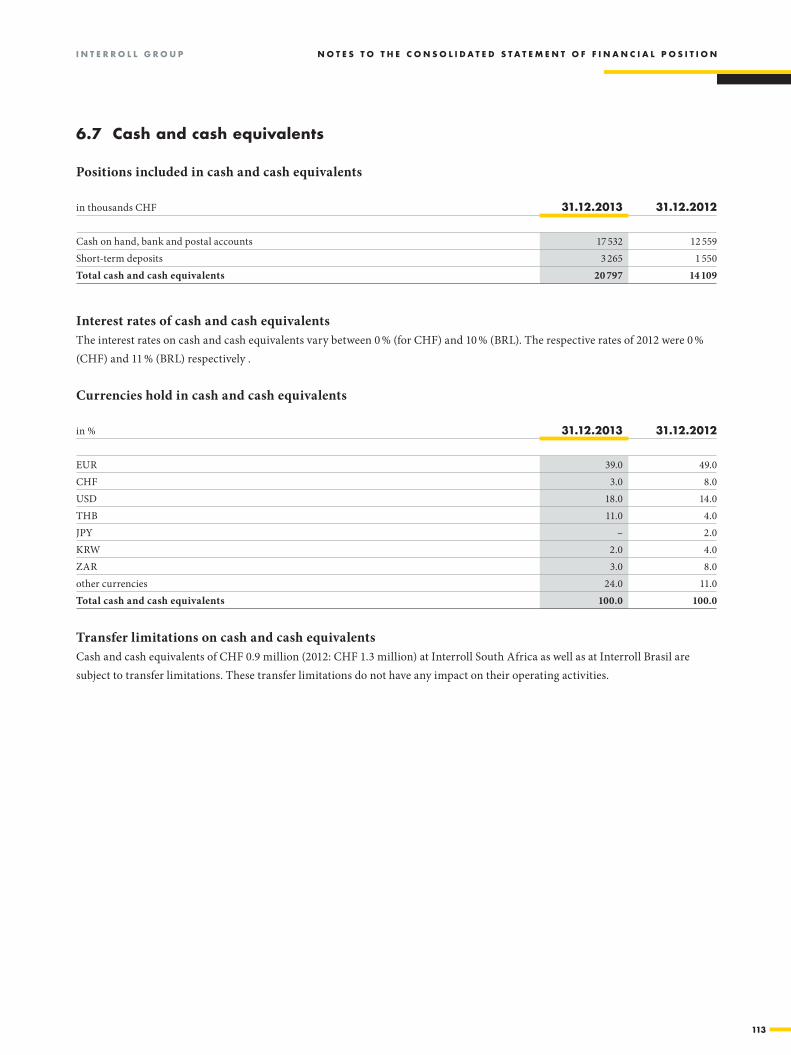
I n t e r r o l l g r o u p n o t e S t o t H e C o n S o l I D A t e D S t A t e M e n t o F F I n A n C I A l p o S I t I o n
113
6.6CaSht20:v48
6.7 Cash and cash equivalents
Positions included in cash and cash equivalents
in thousands CHF 31.12.2013 31.12.2012
Cash on hand, bank and postal accounts 17 532 12 559 Short-term deposits 3 265 1 550 Total cash and cash equivalents 20 797 14 109
Interest rates of cash and cash equivalentsThe interest rates on cash and cash equivalents vary between 0 % (for CHF) and 10 % (BRL). The respective rates of 2012 were 0 % (CHF) and 11 % (BRL) respectively .
Currencies hold in cash and cash equivalents
in % 31.12.2013 31.12.2012
EUR 39.0 49.0 CHF 3.0 8.0 USD 18.0 14.0 THB 11.0 4.0 JPY – 2.0 KRW 2.0 4.0 ZAR 3.0 8.0 other currencies 24.0 11.0 Total cash and cash equivalents 100.0 100.0
Transfer limitations on cash and cash equivalentsCash and cash equivalents of CHF 0.9 million (2012: CHF 1.3 million) at Interroll South Africa as well as at Interroll Brasil are subject to transfer limitations. These transfer limitations do not have any impact on their operating activities.
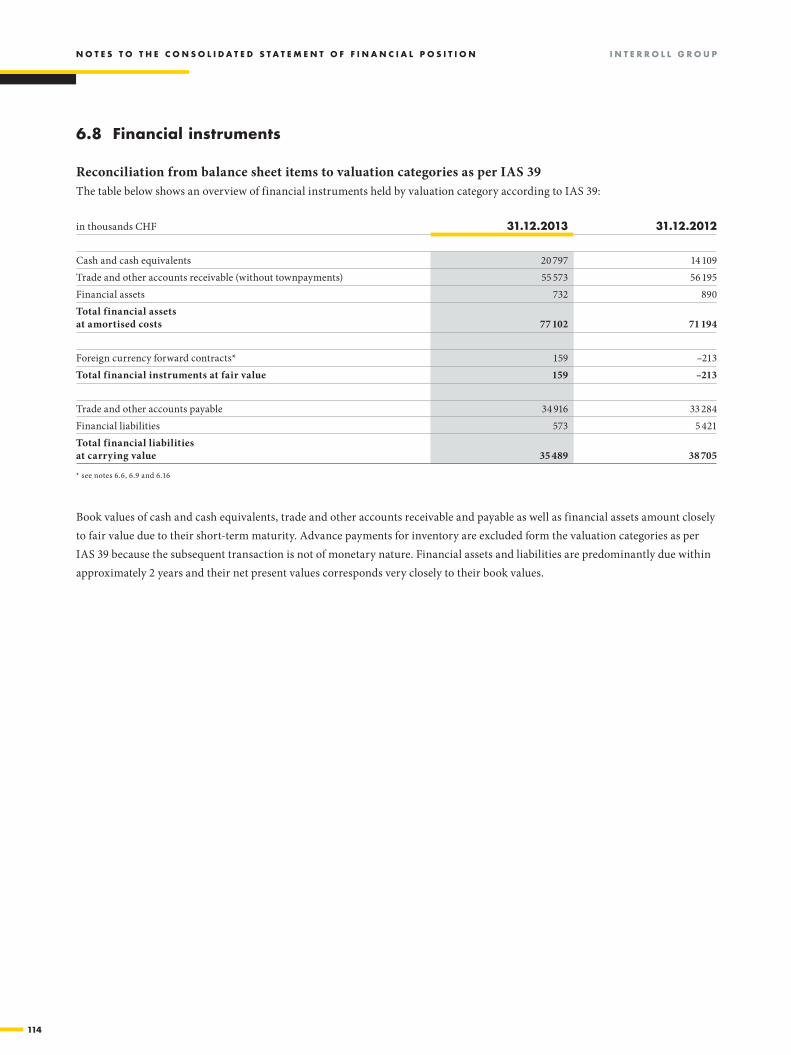
N O T E S T O T H E C O N S O L I D A T E D S T A T E M E N T O F F I N A N C I A L P O S I T I O N I N T E r r O L L g r O u P
114
6.8 financial instruments
Reconciliation from balance sheet items to valuation categories as per IAS 39The table below shows an overview of financial instruments held by valuation category according to IAS 39:
in thousands CHF 31.12.2013 31.12.2012
Cash and cash equivalents 20 797 14 109 Trade and other accounts receivable (without townpayments) 55 573 56 195 Financial assets 732 890 Total financial assets at amortised costs 77 102 71 194
Foreign currency forward contracts* 159 –213 Total financial instruments at fair value 159 –213
Trade and other accounts payable 34 916 33 284 Financial liabilities 573 5 421 Total financial liabilities at carrying value 35 489 38 705
* see notes 6.6, 6.9 and 6.16
Book values of cash and cash equivalents, trade and other accounts receivable and payable as well as financial assets amount closely to fair value due to their short-term maturity. Advance payments for inventory are excluded form the valuation categories as per IAS 39 because the subsequent transaction is not of monetary nature. Financial assets and liabilities are predominantly due within approximately 2 years and their net present values corresponds very closely to their book values.
6.7fInanCIalInStruMentSt20:v40
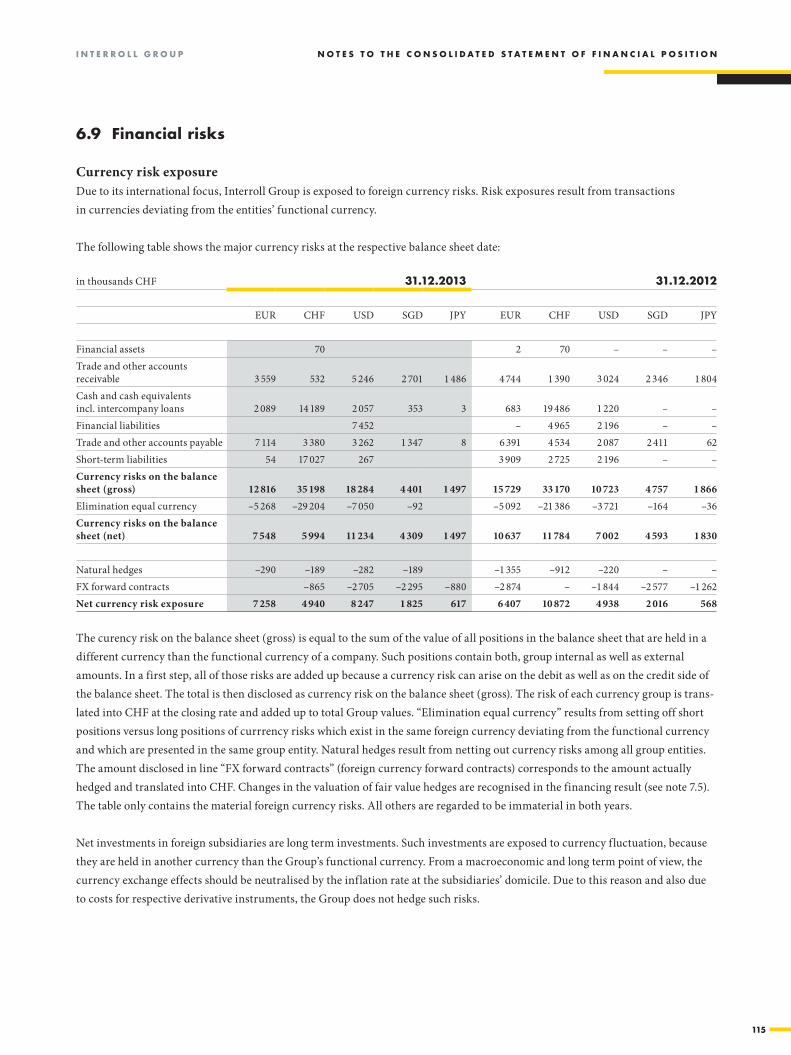
I n t e r r o l l g r o u p n o t e S t o t H e C o n S o l I D A t e D S t A t e M e n t o F F I n A n C I A l p o S I t I o n
115
6.8fInanCIalrISkSt20:ad44
6.9 financial risks
Currency risk exposureDue to its international focus, Interroll Group is exposed to foreign currency risks. Risk exposures result from transactions in currencies deviating from the entities’ functional currency.
The following table shows the major currency risks at the respective balance sheet date:
in thousands CHF 31.12.2013 31.12.2012
EUR CHF USD SGD JPY EUR CHF USD SGD JPY
Financial assets 70 2 70 – – –Trade and other accounts receivable 3 559 532 5 246 2 701 1 486 4 744 1 390 3 024 2 346 1 804Cash and cash equivalents incl. intercompany loans 2 089 14 189 2 057 353 3 683 19 486 1 220 – –Financial liabilities 7 452 – 4 965 2 196 – –Trade and other accounts payable 7 114 3 380 3 262 1 347 8 6 391 4 534 2 087 2 411 62Short-term liabilities 54 17 027 267 3 909 2 725 2 196 – –Currency risks on the balance sheet (gross) 12 816 35 198 18 284 4 401 1 497 15 729 33 170 10 723 4 757 1 866Elimination equal currency –5 268 –29 204 –7 050 –92 –5 092 –21 386 –3 721 –164 –36Currency risks on the balance sheet (net) 7 548 5 994 11 234 4 309 1 497 10 637 11 784 7 002 4 593 1 830
Natural hedges –290 –189 –282 –189 –1 355 –912 –220 – –FX forward contracts –865 –2 705 –2 295 –880 –2 874 – –1 844 –2 577 –1 262Net currency risk exposure 7 258 4 940 8 247 1 825 617 6 407 10 872 4 938 2 016 568
The curency risk on the balance sheet (gross) is equal to the sum of the value of all positions in the balance sheet that are held in a different currency than the functional currency of a company. Such positions contain both, group internal as well as external amounts. In a first step, all of those risks are added up because a currency risk can arise on the debit as well as on the credit side of the balance sheet. The total is then disclosed as currency risk on the balance sheet (gross). The risk of each currency group is trans-lated into CHF at the closing rate and added up to total Group values. “Elimination equal currency” results from setting off short positions versus long positions of currrency risks which exist in the same foreign currency deviating from the functional currency and which are presented in the same group entity. Natural hedges result from netting out currency risks among all group entities. The amount disclosed in line “FX forward contracts” (foreign currency forward contracts) corresponds to the amount actually hedged and translated into CHF. Changes in the valuation of fair value hedges are recognised in the financing result (see note 7.5). The table only contains the material foreign currency risks. All others are regarded to be immaterial in both years.
Net investments in foreign subsidiaries are long term investments. Such investments are exposed to currency fluctuation, because they are held in another currency than the Group’s functional currency. From a macroeconomic and long term point of view, the currency exchange effects should be neutralised by the inflation rate at the subsidiaries’ domicile. Due to this reason and also due to costs for respective derivative instruments, the Group does not hedge such risks.

N O T E S T O T H E C O N S O L I D A T E D S T A T E M E N T O F F I N A N C I A L P O S I T I O N I N T E r r O L L g r O u P
116
6.8fInanCIalrISkSt46:aa65
achtung kopfzeile
Foreign currency forward contractsThe Group prepares regularly a rolling forecast of foreign currency cash flows. 0–50 % of such budgeted, future foreign currency flows may be hedged through forward contracts. At the end of the year under review, there were no open cash flow hedges held by the Group.
The notional amount corresponds to the hedged balance sheet risk, translated into CHF. With derivative financial instruments, the Group hedges normally 50–100 % of its net currency risks on the balance sheet.
The following table shows the contractual and fair values of the foreign currency forward contracts held by the Group:
in thousands CHF 31.12.2013 31.12.2012
Hedged currency Sell/Buy maturity
notional amount in Chf fair value Sell/Buy
notional amount in Chf fair value
USD USD/CAD Feb–14 1 202 –35 USD/CAD 1 224 17 USD USD/CHF Feb–14 1 503 16 USD/CHF 620 5 SGD SGD/EUR Feb–14 1 245 30 SGD/EUR 1 413 –13 SGD JPY/SGD Feb–14 1 050 56 JPY/SGD 1 164 –100 EUR EUR/CHF Feb–14 865 –4 EUR/CHF 5 749 12 EUR CHF/EUR Feb–14 – – CHF/EUR 2 874 –4 JPY JPY/EUR Feb–14 880 71 JPY/EUR 1 262 –131 CNY CNY/EUR Feb–14 1 723 25 CNY/EUR 654 –THB THB/EUR Feb–14 – – THB/EUR 640 1 Total FX forward contracts* 159 –213
* see note 6.16

I n t e r r o l l g r o u p n o t e S t o t H e C o n S o l I D A t e D S t A t e M e n t o F F I n A n C I A l p o S I t I o n
117
6.8fInanCIalrISkSt67:Z90
Sensitivity analysis of the currency risk exposureAs per year end, a sensitivity analysis was carried out in respect to financial instruments. The sensitivity analyses calculates the ef-fect of FOREX – changes on the major currency pairs within the Group. These risks particularly result from different currencies between costs for production and invoicing currency to the customers. Assumed currency fluctuations would have the following effects on the foreign currency positions in the balance sheet:
in thousands CHF 31.12.2013 31.12.2012
CURRENCY PAIREUR
vs. CHFCHF
vs. USDCAD
vs. USDEUR
vs. CHFCHF
vs. USDCAD
vs. USD
Financial assets 70 – – 70 – –Trade and other receivables –1 361 879 2 183 –1 396 338 1 765Cash and cash equiv. incl. IC-loans 13 069 367 989 19 464 368 809Financial liabilities – – – 4 965 – –Trade and other payables 1 645 – 1 360 2 255 –200 638Short-term and current liabilities 17 027 – – 2 725 2 196 –Gross exposure per currency pair 30 450 1 246 4 532 28 083 2 702 3 212Risks opposing each other –23 558 – –2 721 –19 892 –1 412 –1 276FX forward contracts –865 –1 503 –1 202 –2 875 – –1 224Net FX exposure per currency pair 6 027 –257 609 5 316 1 290 712
Currency change in % 2 1 4 2 6 5Effect on the result (+/–) 121 3 24 532 129 71Income tax expense at 20.1 % –24 –1 –5 –107 –26 –14Net FX exposure after income taxes 97 2 19 425 103 57
Analogously to the currency risk analyis, the net risks of currency pairs are summed up. The position “Risks opposing each other” is a result of netting out those risks that are contrary to each other. The disclosed amount in line “FX forward contracts” equals the total of hedged currency risks of a currency pair. It is also deducted from the gross risk as it deviates linearly with the fluctuation of the currency. The income taxes are calculated in line with the applicable rate for an ordinary taxed entity in Switzerland (see note 7.6).
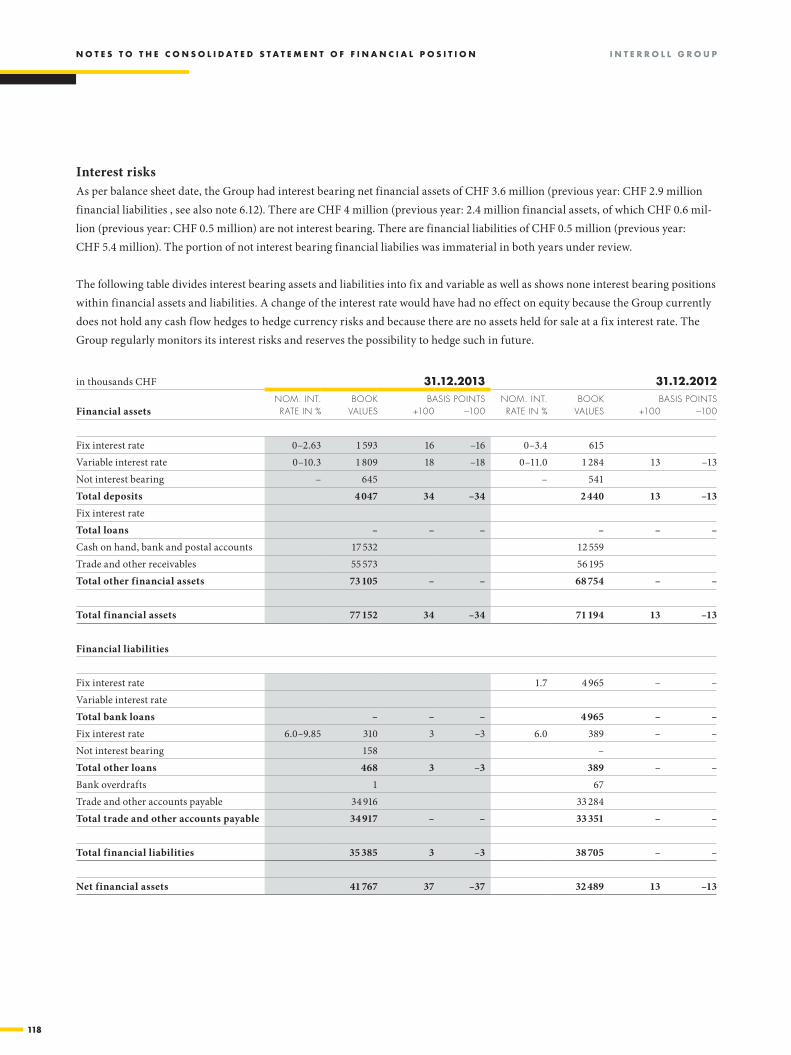
N O T E S T O T H E C O N S O L I D A T E D S T A T E M E N T O F F I N A N C I A L P O S I T I O N I N T E r r O L L g r O u P
118
6.8fInanCIalrISkSt92:t94
Interest risksAs per balance sheet date, the Group had interest bearing net financial assets of CHF 3.6 million (previous year: CHF 2.9 million financial liabilities , see also note 6.12). There are CHF 4 million (previous year: 2.4 million financial assets, of which CHF 0.6 mil-lion (previous year: CHF 0.5 million) are not interest bearing. There are financial liabilities of CHF 0.5 million (previous year: CHF 5.4 million). The portion of not interest bearing financial liabilies was immaterial in both years under review.
The following table divides interest bearing assets and liabilities into fix and variable as well as shows none interest bearing positions within financial assets and liabilities. A change of the interest rate would have had no effect on equity because the Group currently does not hold any cash flow hedges to hedge currency risks and because there are no assets held for sale at a fix interest rate. The Group regularly monitors its interest risks and reserves the possibility to hedge such in future.
6.8fInanCIalrISkSt96:aB126
in thousands CHF 31.12.2013 31.12.2012nom. int. Book BaSiS pointS nom. int. Book BaSiS pointS
Financial assets rate in % valueS +100 –100 rate in % valueS +100 –100
Fix interest rate 0–2.63 1 593 16 –16 0–3.4 615 Variable interest rate 0–10.3 1 809 18 –18 0–11.0 1 284 13 –13Not interest bearing – 645 – 541 Total deposits 4 047 34 –34 2 440 13 –13Fix interest rateTotal loans – – – – – –Cash on hand, bank and postal accounts 17 532 12 559 Trade and other receivables 55 573 56 195 Total other financial assets 73 105 – – 68 754 – –
Total financial assets 77 152 34 –34 71 194 13 –13
Financial liabilities
Fix interest rate 1.7 4 965 – –Variable interest rateTotal bank loans – – – 4 965 – –Fix interest rate 6.0–9.85 310 3 –3 6.0 389 – –Not interest bearing 158 –Total other loans 468 3 –3 389 – –Bank overdrafts 1 67 Trade and other accounts payable 34 916 33 284 Total trade and other accounts payable 34 917 – – 33 351 – –
Total financial liabilities 35 385 3 –3 38 705 – –
Net financial assets 41 767 37 –37 32 489 13 –13

I n t e r r o l l g r o u p n o t e S t o t H e C o n S o l I D A t e D S t A t e M e n t o F F I n A n C I A l p o S I t I o n
119
6.8fInanCIalrISkSt128:u141
Sensitivity analysis of interest risksInterest sensitivity is only calculated on interest bearing items of the balance sheet. No effect is calculated on items bearing interests at a fixed rate. As per above analysis, the Group’s annual result would have chan-ged slightly by CHF 0.04 million in case of an interest rate being one percentage point higher or lower. In the previous year, an increase of the interest rate of one percentage point, would have changed the Group’s result only slightly. The result would have improved with an interest reduction of one percentage point by CHF –0.01 million in the previous year. For certain interest bearing positions, the interest rate is already lower than one percent. Therefore, the effect of the reduction was only calculated up to the current interest rate being lower than 1.0 %.
Liquidity riskThe Group carries out a complete liquidity planning on a quarterly basis. The Group holds liquidity reserves in form of committed and uncommitted credit lines in order to comply with an unexpected and extraordi-nary liquidity demand.
Credit facilities and debt covenantsThe amount of unused credit facilities as per end of the reporting year amounted to CHF 80.6 million (previous year: CHF 77.4 million).
In the year under review, the committed credit lines for an amount of CHF 40.0 million which were agreed upon in 2009 were extended with the same conditions for another duration of 3 years. They ensure the funding of the future investment programme and serve generally for the business financing. The Group always complied with the agreed debt covenants which are the following:
EBITDA: net interest costs = min. 4.0Net debt: EBITDA = max. 3.0 Equity: total assets = min. 35 %
The ageing of the financial liabilities is disclosed in note 6.12 (see “Ageing of financial liabilities”).
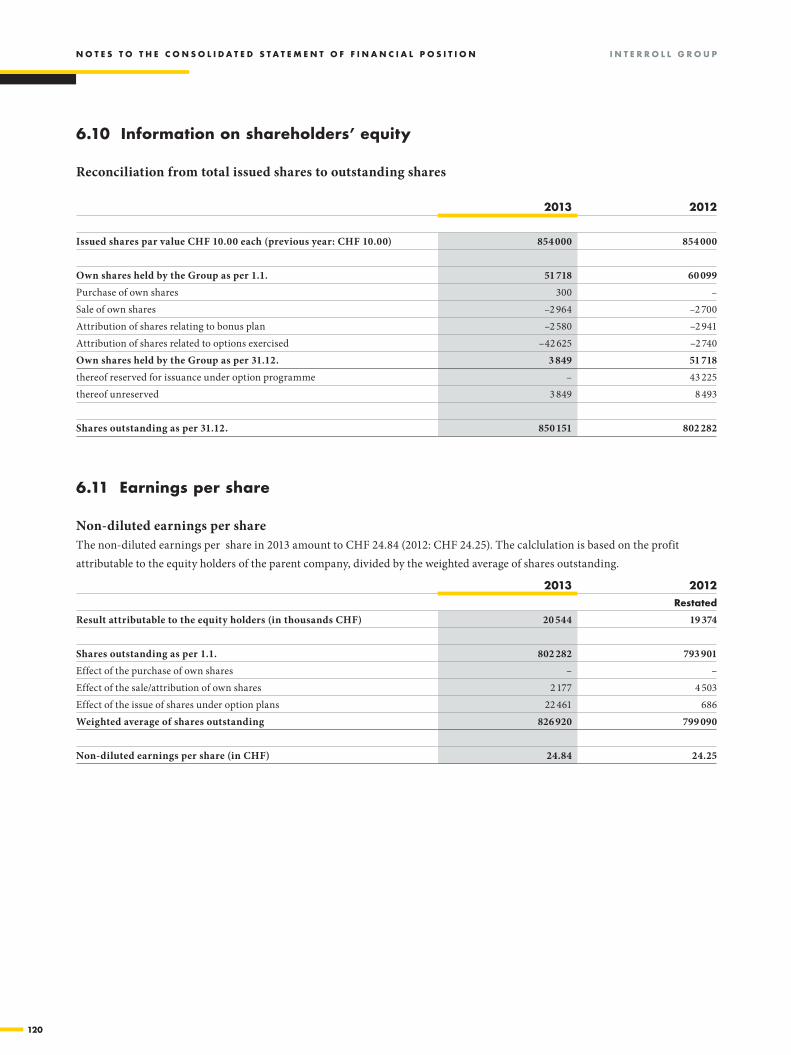
N O T E S T O T H E C O N S O L I D A T E D S T A T E M E N T O F F I N A N C I A L P O S I T I O N I N T E r r O L L g r O u P
120
6.9InfoeQuItyt20
6.10 Information on shareholders’ equity
6.9InfoeQuItyt22:v37
Reconciliation from total issued shares to outstanding shares
2013 2012
Issued shares par value CHF 10.00 each (previous year: CHF 10.00) 854 000 854 000
Own shares held by the Group as per 1.1. 51 718 60 099 Purchase of own shares 300 –Sale of own shares –2 964 –2 700 Attribution of shares relating to bonus plan –2 580 –2 941 Attribution of shares related to options exercised –42 625 –2 740 Own shares held by the Group as per 31.12. 3 849 51 718 thereof reserved for issuance under option programme – 43 225 thereof unreserved 3 849 8 493
Shares outstanding as per 31.12. 850 151 802 282
6.10epSt20:v36
6.11 earnings per share
Non-diluted earnings per shareThe non-diluted earnings per share in 2013 amount to CHF 24.84 (2012: CHF 24.25). The calclulation is based on the profit attributable to the equity holders of the parent company, divided by the weighted average of shares outstanding.
2013 2012restated
Result attributable to the equity holders (in thousands CHF) 20 544 19 374
Shares outstanding as per 1.1. 802 282 793 901 Effect of the purchase of own shares – –Effect of the sale/attribution of own shares 2 177 4 503 Effect of the issue of shares under option plans 22 461 686 Weighted average of shares outstanding 826 920 799 090
Non-diluted earnings per share (in CHF) 24.84 24.25
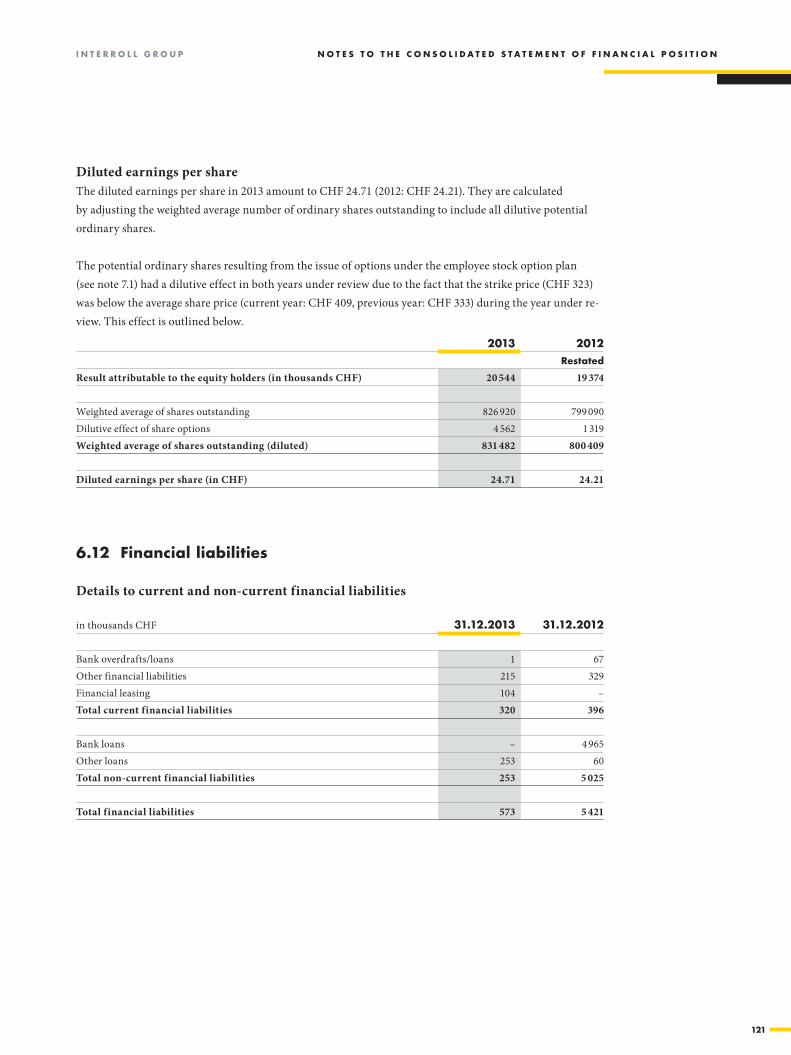
I n t e r r o l l g r o u p n o t e S t o t H e C o n S o l I D A t e D S t A t e M e n t o F F I n A n C I A l p o S I t I o n
121
6.10epSt38:v51
Diluted earnings per shareThe diluted earnings per share in 2013 amount to CHF 24.71 (2012: CHF 24.21). They are calculated by adjusting the weighted average number of ordinary shares outstanding to include all dilutive potential ordinary shares.
The potential ordinary shares resulting from the issue of options under the employee stock option plan (see note 7.1) had a dilutive effect in both years under review due to the fact that the strike price (CHF 323) was below the average share price (current year: CHF 409, previous year: CHF 333) during the year under re-view. This effect is outlined below.
2013 2012restated
Result attributable to the equity holders (in thousands CHF) 20 544 19 374
Weighted average of shares outstanding 826 920 799 090 Dilutive effect of share options 4 562 1 319 Weighted average of shares outstanding (diluted) 831 482 800 409
Diluted earnings per share (in CHF) 24.71 24.21
6.11fInanCIallIaBIlItIeSt22:v35
6.12 financial liabilities
Details to current and non-current financial liabilities
in thousands CHF 31.12.2013 31.12.2012
Bank overdrafts/loans 1 67 Other financial liabilities 215 329 Financial leasing 104 –Total current financial liabilities 320 396
Bank loans – 4 965 Other loans 253 60 Total non-current financial liabilities 253 5 025
Total financial liabilities 573 5 421
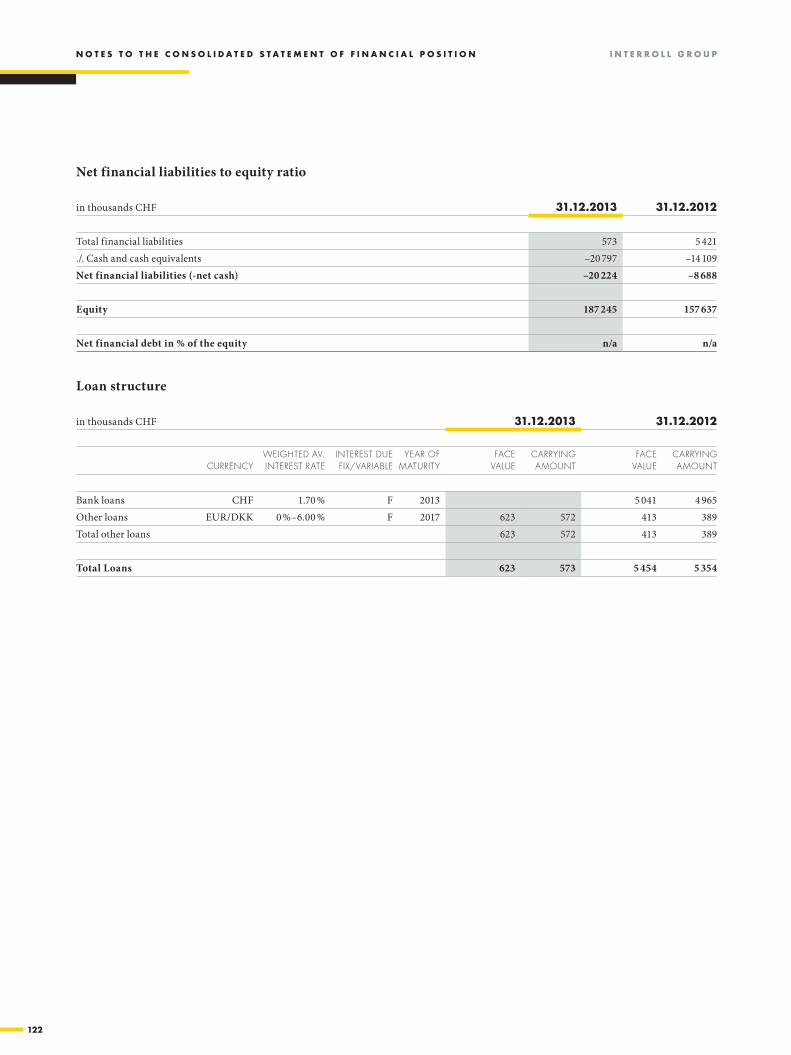
N O T E S T O T H E C O N S O L I D A T E D S T A T E M E N T O F F I N A N C I A L P O S I T I O N I N T E r r O L L g r O u P
122
6.11fInanCIallIaBIlItIeSt37:v47
Net financial liabilities to equity ratio
in thousands CHF 31.12.2013 31.12.2012
Total financial liabilities 573 5 421 ./. Cash and cash equivalents –20 797 –14 109 Net financial liabilities (-net cash) –20 224 –8 688
Equity 187 245 157 637
Net financial debt in % of the equity n/a n/a
6.11fInanCIallIaBIlItIeSt52:aB66
Loan structure
in thousands CHF 31.12.2013 31.12.2012
CurrenCyweighted av. intereSt rate
intereSt due fix/variaBle
year of maturity
faCe value
Carrying amount
faCe value
Carrying amount
Bank loans CHF 1.70 % F 2013 5 041 4 965 Other loans EUR/DKK 0 %–6.00 % F 2017 623 572 413 389 Total other loans 623 572 413 389
Total Loans 623 573 5 454 5 354

I n t e r r o l l g r o u p n o t e S t o t H e C o n S o l I D A t e D S t A t e M e n t o F F I n A n C I A l p o S I t I o n
123
6.11FINANCIALLIABILITIEST71:Z90
Ageing of financial liabilitiesThe financial liabilities as per 31 December 2013 are due as follows:
in thousands CHF Book valueFace value
(undiscounted)within
6 months
within 6–12
monthswithin
1–2 yearswithin
2–5 years
Bank loans Other loans 572 623 110 211 302 Bank overdrafts 1 1 1 Trade/other accounts payable* 34 916 34 916 34 916 Total financial liabilities 35 489 35 540 35 027 211 – 302
* An ageing analysis is not readily available. Based on past experience, it can be reliably assumed that the full amount is due within less than 6 months.
The financial liabilities as per 31 December 2012 were due as follows:
in thousands CHF Book valueFace value
(undiscounted)within
6 months
within 6–12
monthswithin
1–2 yearswithin
2–5 years
Bank loans 4 965 5 041 5 041 Other loans 389 413 413 Bank overdrafts 67 67 67Trade/other accounts payable* 33 497 33 497 33 497 Total financial liabilities 38 918 39 018 33 564 5 041 413 –
* An ageing analysis is not readily available. Based on past experience, it can be reliably assumed that the full amount is due within less than 6 months.
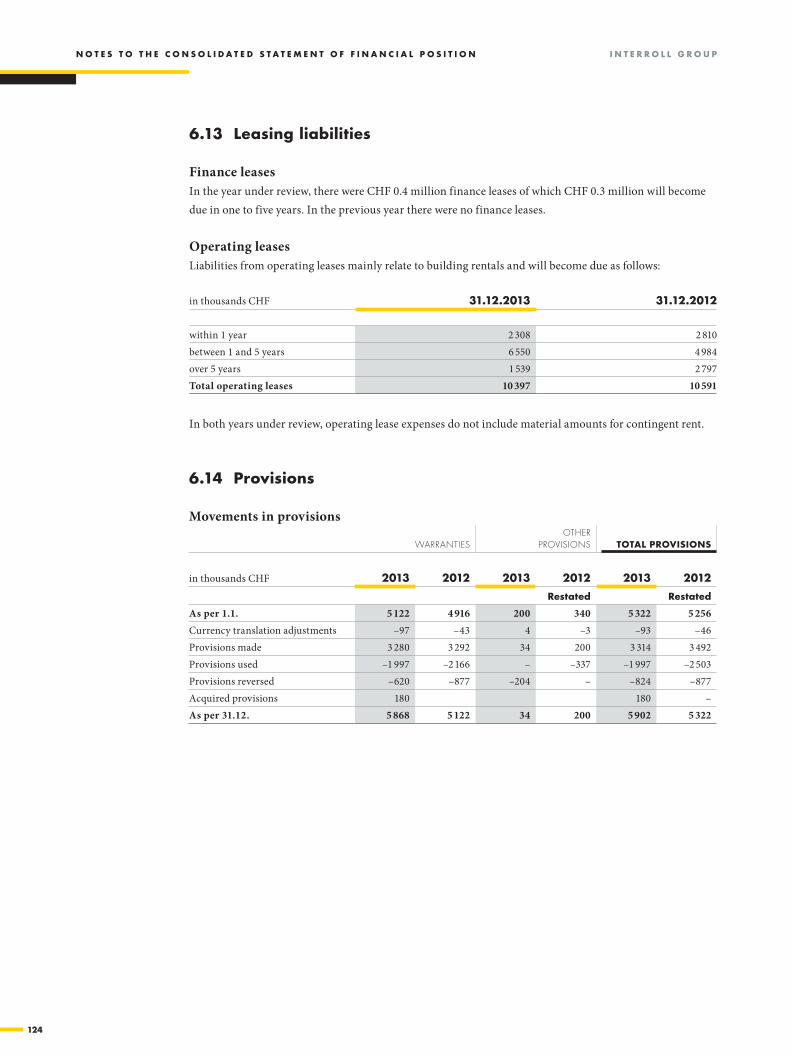
N O T E S T O T H E C O N S O L I D A T E D S T A T E M E N T O F F I N A N C I A L P O S I T I O N I N T E r r O L L g r O u P
124
6.12leaSeSt20:t23
6.13 leasing liabilities
Finance leasesIn the year under review, there were CHF 0.4 million finance leases of which CHF 0.3 million will become due in one to five years. In the previous year there were no finance leases.
6.12leaSeSt27:v37
Operating leasesLiabilities from operating leases mainly relate to building rentals and will become due as follows:
in thousands CHF 31.12.2013 31.12.2012
within 1 year 2 308 2 810between 1 and 5 years 6 550 4 984over 5 years 1 539 2 797Total operating leases 10 397 10 591
In both years under review, operating lease expenses do not include material amounts for contingent rent.
6.13provISIonSt20:Z33
6.14 provisions
Movements in provisions
warrantieSother
proviSionS total provISIonS
in thousands CHF 2013 2012 2013 2012 2013 2012
restated restated
As per 1.1. 5 122 4 916 200 340 5 322 5 256 Currency translation adjustments –97 –43 4 –3 –93 –46 Provisions made 3 280 3 292 34 200 3 314 3 492 Provisions used –1 997 –2 166 – –337 –1 997 –2 503 Provisions reversed –620 –877 –204 – –824 –877 Acquired provisions 180 180 –As per 31.12. 5 868 5 122 34 200 5 902 5 322
I n t e r r o l l g r o u p n o t e S t o t H e C o n S o l I D A t e D S t A t e M e n t o F F I n A n C I A l p o S I t I o n
125
6.13provISIonSt35:t39
Warranty provisionsThe Group companies normally grant a 24-month warranty. The warranty provision is recognised based on past experience as well as on specific projects. The warranty provision corresponds to roughly 1.9 % (previous year: 1.7 %) of net sales. The increase in the percentage of sales is a consequence of more warranty cases for certain product groups. In absulute terms, the warranty was only increased due to the higher sales volumes.
Data from the past indicates that between 30 % and 50 % of the warranty provision will be used in the subsequent year.
Other provisionsThe other provisions mainly include provision for litigation. In connection with the restatement related to IAS 19 pension liabilities were reclassified from other provisions to a separate balance sheet line
6.14IaS19t22:t26
6.15 pension obligations and pension costs
General information to the pension plans of the GroupThe pension costs for 2013 amounted to CHF 2.3 million (2012: CHF 1.6 million). Such costs consist of employer contributions relating to the defined contribution plans and pension costs relating to the defined benefit plans.
The pension plans in Switzerland and France are regarded as defined benefits plans in line with IAS 19. In 2012, 192 and in 2013, 201 employees participated in the defined benefit plans. The Swiss plan is outsour-ced to a collective foundation whereas the plan in France is outsourced to an insurance company. It can be assumed that the assets of both plans do not include Interroll shares.
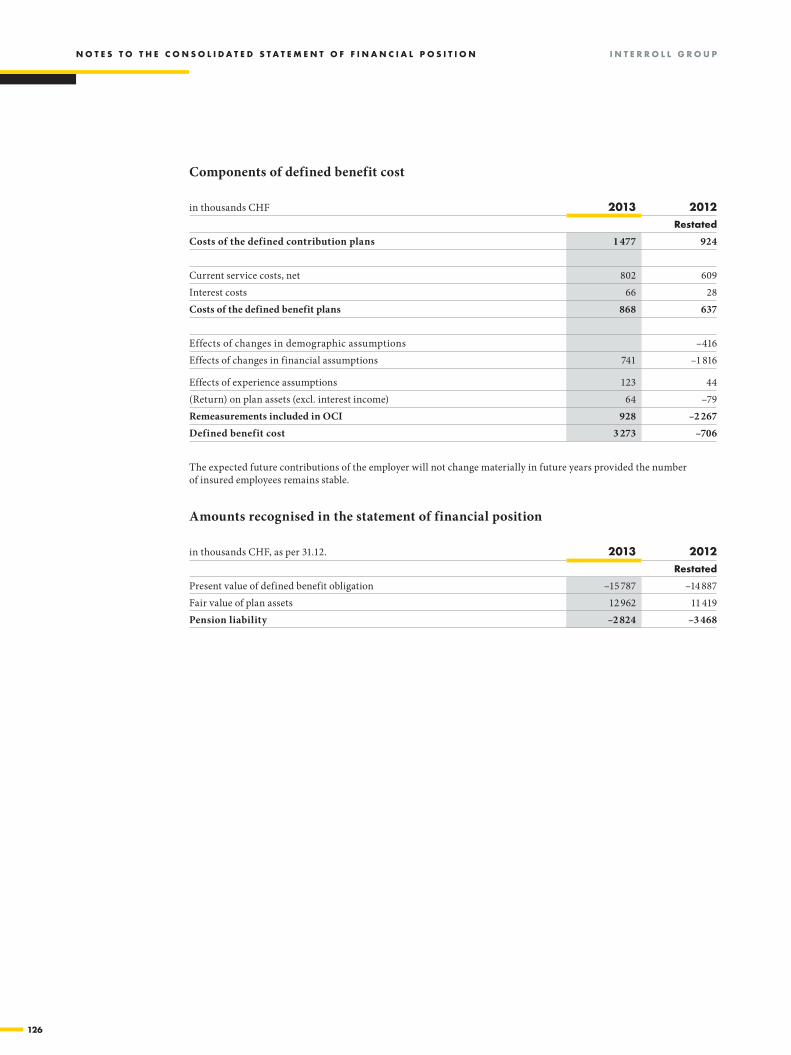
N O T E S T O T H E C O N S O L I D A T E D S T A T E M E N T O F F I N A N C I A L P O S I T I O N I N T E r r O L L g r O u P
126
6.14IaS19t28:v47
Components of defined benefit cost
in thousands CHF 2013 2012restated
Costs of the defined contribution plans 1 477 924
Current service costs, net 802 609 Interest costs 66 28 Costs of the defined benefit plans 868 637
Effects of changes in demographic assumptions –416 Effects of changes in financial assumptions 741 –1 816
Effects of experience assumptions 123 44 (Return) on plan assets (excl. interest income) 64 –79 Remeasurements included in OCI 928 –2 267 Defined benefit cost 3 273 –706
The expected future contributions of the employer will not change materially in future years provided the number of insured employees remains stable.
6.14IaS19t49:v55
Amounts recognised in the statement of financial position
in thousands CHF, as per 31.12. 2013 2012restated
Present value of defined benefit obligation –15 787 –14 887 Fair value of plan assets 12 962 11 419 Pension liability –2 824 –3 468

I n t e r r o l l g r o u p n o t e S t o t H e C o n S o l I D A t e D S t A t e M e n t o F F I n A n C I A l p o S I t I o n
127
6.14IaS19t65:v83
Roll forward of the defined benefit obligation
in thousands CHF 2013 2012restated
Benefit obligation as per 1.1. –14 888 –12 191Current service costs, net –802 –609Interest costs –302 –347Contributions from employees –393 –362Benefits funded/(paid), net –521 539Translation difference –9 6Insurance premiums 263 265Remeasurements
– Effects of changes in demographic assumptions – –416 – Effects of changes in financial assumptions 741 –1 816 – Effects of experience assumptions 123 44
Benefit obligation as per 31.12. –15 787 –14 887
6.14IaS19t85:v97
Roll forward of the present value of plan assets
in thousands CHF 2013 2012restated
Fair value of plan assets as per 1.1. 11 418 11 012Interest income 236 319Employer contributions 591 609Employee contributions 393 362Benefits funded/(paid), net 521 –539Insurance premiums –263 –265Translation difference 2 –1Remeasurements
– Income of plan assets 64 –79Fair value of plan assets as per 31.12. 12 962 11 418
6.14IaS19t99:v107
Investment categories
in % 2013 2012
Equity securities 3.0 1.4Debt securities 75.2 75.3Real estate 16.5 16.7Other investments 5.4 6.6Total Investments in % 100.0 100.0
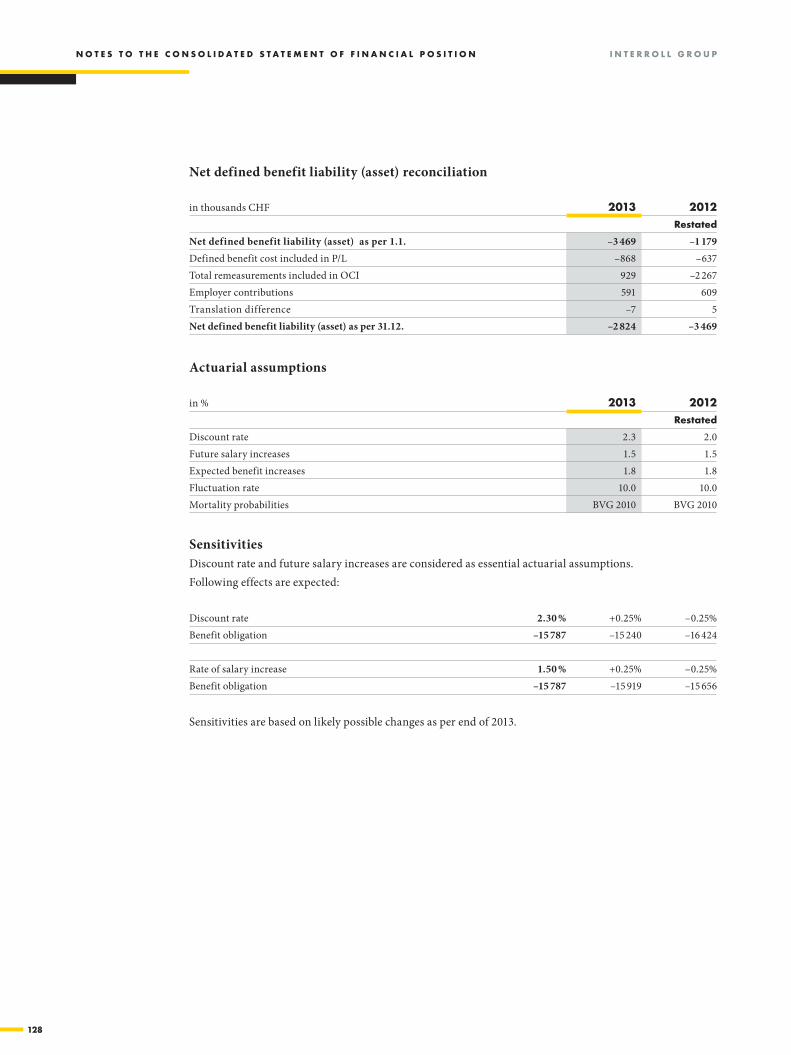
N O T E S T O T H E C O N S O L I D A T E D S T A T E M E N T O F F I N A N C I A L P O S I T I O N I N T E r r O L L g r O u P
128
6.14IaS19t109:v129
Net defined benefit liability (asset) reconciliation
in thousands CHF 2013 2012restated
Net defined benefit liability (asset) as per 1.1. –3 469 –1 179Defined benefit cost included in P/L –868 –637Total remeasurements included in OCI 929 –2 267Employer contributions 591 609Translation difference –7 5Net defined benefit liability (asset) as per 31.12. –2 824 –3 469
Actuarial assumptions
in % 2013 2012restated
Discount rate 2.3 2.0Future salary increases 1.5 1.5Expected benefit increases 1.8 1.8Fluctuation rate 10.0 10.0Mortality probabilities BVG 2010 BVG 2010
6.14IaS19t131:W143
SensitivitiesDiscount rate and future salary increases are considered as essential actuarial assumptions. Following effects are expected:
Discount rate 2.30 % +0.25% –0.25%Benefit obligation –15 787 –15 240 –16 424
Rate of salary increase 1.50 % +0.25% –0.25%Benefit obligation –15 787 –15 919 –15 656
Sensitivities are based on likely possible changes as per end of 2013.
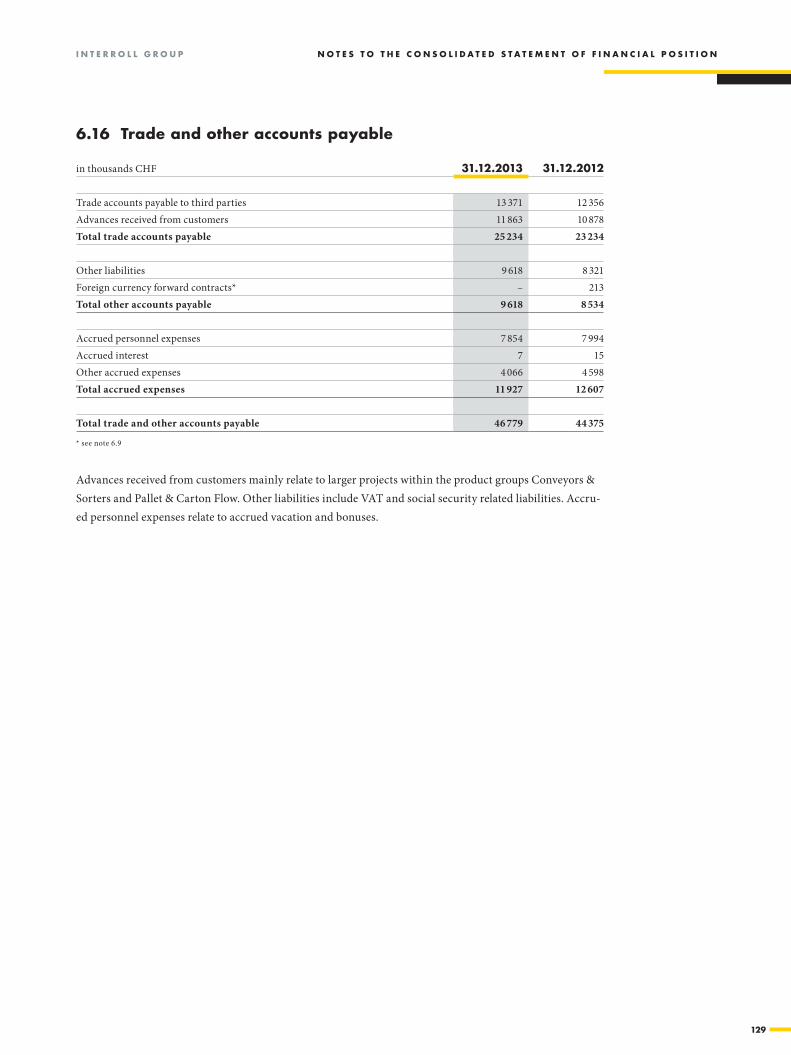
I n t e r r o l l g r o u p n o t e S t o t H e C o n S o l I D A t e D S t A t e M e n t o F F I n A n C I A l p o S I t I o n
129
6.15tradepayaBlet20:v40
6.16 trade and other accounts payable
in thousands CHF 31.12.2013 31.12.2012
Trade accounts payable to third parties 13 371 12 356 Advances received from customers 11 863 10 878 Total trade accounts payable 25 234 23 234
Other liabilities 9 618 8 321 Foreign currency forward contracts* – 213 Total other accounts payable 9 618 8 534
Accrued personnel expenses 7 854 7 994 Accrued interest 7 15 Other accrued expenses 4 066 4 598 Total accrued expenses 11 927 12 607
Total trade and other accounts payable 46 779 44 375
* see note 6.9
Advances received from customers mainly relate to larger projects within the product groups Conveyors & Sorters and Pallet & Carton Flow. Other liabilities include VAT and social security related liabilities. Accru-ed personnel expenses relate to accrued vacation and bonuses.
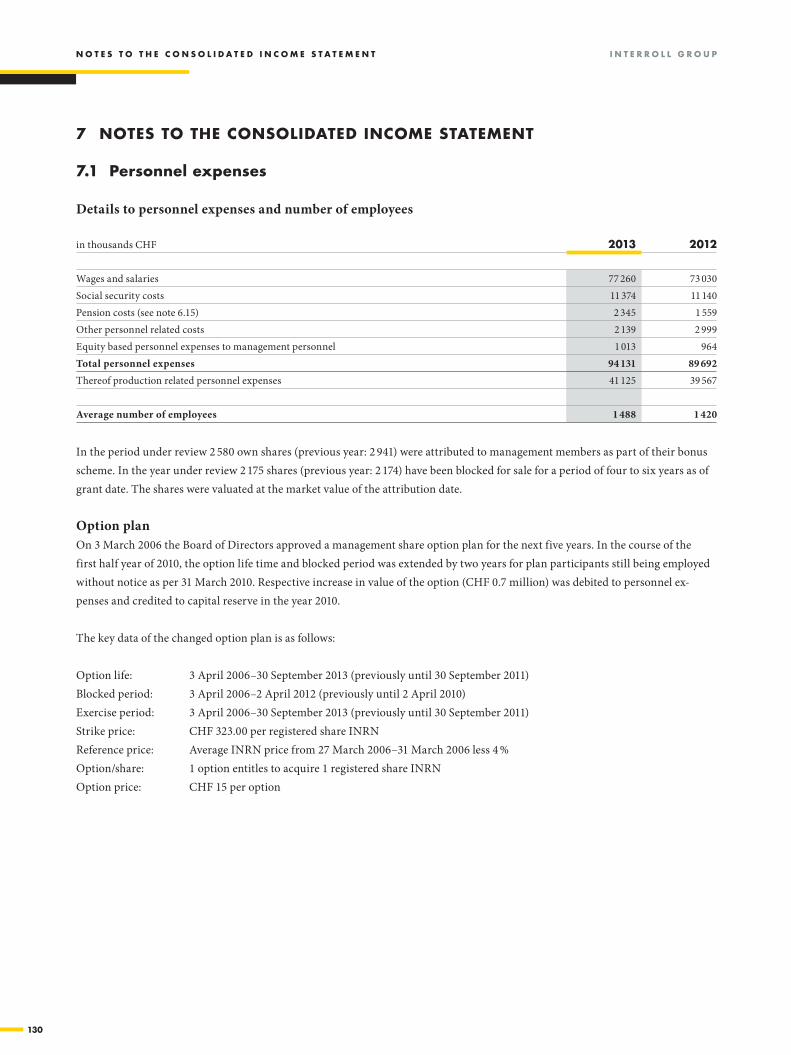
130
7 NOTES TO THE CONSOLIDATED INCOME STATEMENT
7.1PERSONNELU20:W36
7.1 Personnel expenses
Details to personnel expenses and number of employees
in thousands CHF 2013 2012
Wages and salaries 77 260 73 030 Social security costs 11 374 11 140 Pension costs (see note 6.15) 2 345 1 559Other personnel related costs 2 139 2 999Equity based personnel expenses to management personnel 1 013 964Total personnel expenses 94 131 89 692 Thereof production related personnel expenses 41 125 39 567
Average number of employees 1 488 1 420
In the period under review 2 580 own shares (previous year: 2 941) were attributed to management members as part of their bonus scheme. In the year under review 2 175 shares (previous year: 2 174) have been blocked for sale for a period of four to six years as of grant date. The shares were valuated at the market value of the attribution date.
7.1PERSONNELU38:V47
Option planOn 3 March 2006 the Board of Directors approved a management share option plan for the next five years. In the course of the first half year of 2010, the option life time and blocked period was extended by two years for plan participants still being employed without notice as per 31 March 2010. Respective increase in value of the option (CHF 0.7 million) was debited to personnel ex-penses and credited to capital reserve in the year 2010.
The key data of the changed option plan is as follows:
Option life: 3 April 2006–30 September 2013 (previously until 30 September 2011)Blocked period: 3 April 2006–2 April 2012 (previously until 2 April 2010)Exercise period: 3 April 2006–30 September 2013 (previously until 30 September 2011)Strike price: CHF 323.00 per registered share INRNReference price: Average INRN price from 27 March 2006–31 March 2006 less 4 %Option/share: 1 option entitles to acquire 1 registered share INRNOption price: CHF 15 per option
N O T E S T O T H E C O N S O L I D A T E D I N C O M E S T A T E M E N T I N T E R R O L L g R O U P
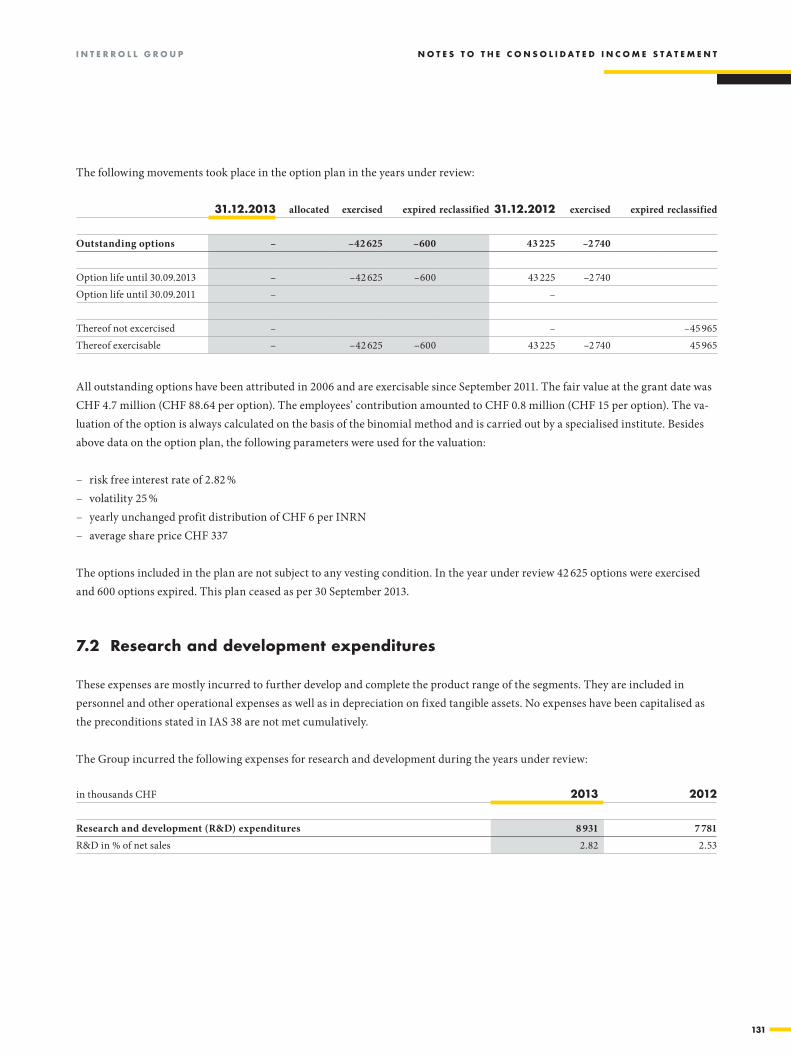
131
7.1perSonnela49:J59
The following movements took place in the option plan in the years under review:
31.12.2013 allocated exercised expired reclassified 31.12.2012 exercised expired reclassified
Outstanding options – –42 625 –600 43 225 –2 740
Option life until 30.09.2013 – –42 625 –600 43 225 –2 740 Option life until 30.09.2011 – –
Thereof not excercised – – –45 965 Thereof exercisable – –42 625 –600 43 225 –2 740 45 965
7.1perSonnelu61:u68
All outstanding options have been attributed in 2006 and are exercisable since September 2011. The fair value at the grant date was CHF 4.7 million (CHF 88.64 per option). The employees’ contribution amounted to CHF 0.8 million (CHF 15 per option). The va-luation of the option is always calculated on the basis of the binomial method and is carried out by a specialised institute. Besides above data on the option plan, the following parameters were used for the valuation:
– risk free interest rate of 2.82 % – volatility 25 % – yearly unchanged profit distribution of CHF 6 per INRN – average share price CHF 337
The options included in the plan are not subject to any vesting condition. In the year under review 42 625 options were exercised and 600 options expired. This plan ceased as per 30 September 2013.
7.2rdt20:v27
7.2 research and development expenditures
These expenses are mostly incurred to further develop and complete the product range of the segments. They are included in personnel and other operational expenses as well as in depreciation on fixed tangible assets. No expenses have been capitalised as the preconditions stated in IAS 38 are not met cumulatively.
The Group incurred the following expenses for research and development during the years under review:
in thousands CHF 2013 2012
Research and development (R&D) expenditures 8 931 7 781 R&D in % of net sales 2.82 2.53
I n t e r r o l l G r o u p n o t e S t o t h e C o n S o l I d a t e d I n C o M e S t a t e M e n t

132
7.3othereypenSeSt20:v36
7.3 other operating expenses
in thousands CHF 2013 2012
Production related expenses 7 121 6 719 Freight 8 238 7 706 Office, administration and IT services 6 463 8 493 Building costs 5 388 5 157 Travelling and transportation 5 297 5 153 Marketing 4 767 3 742 Consultancy, auditing and insurances 5 739 7 539 Provisions and allowances, net 2 354 2 219 Variable sales costs 2 486 2 267 Non-income taxes 1 776 504 Other expenses and services 2 681 3 299 Loss on disposal of property, plant and equipment/intangible assets 206 –Total other operating expenses 52 516 52 798
7.4otherInCoMet20:v28 7.4 other operating income
in thousands CHF 2013 2012
Income from commissions, licences and freight 7 869 8 250 Income from services 363 845 Government grants received 109 101 Gain on disposal of tangible and intangible assets – 1 260 Total other operating income 8 341 10 456
n o t e S t o t h e C o n S o l I d a t e d I n C o M e S t a t e M e n t I n t e r r o l l G r o u p
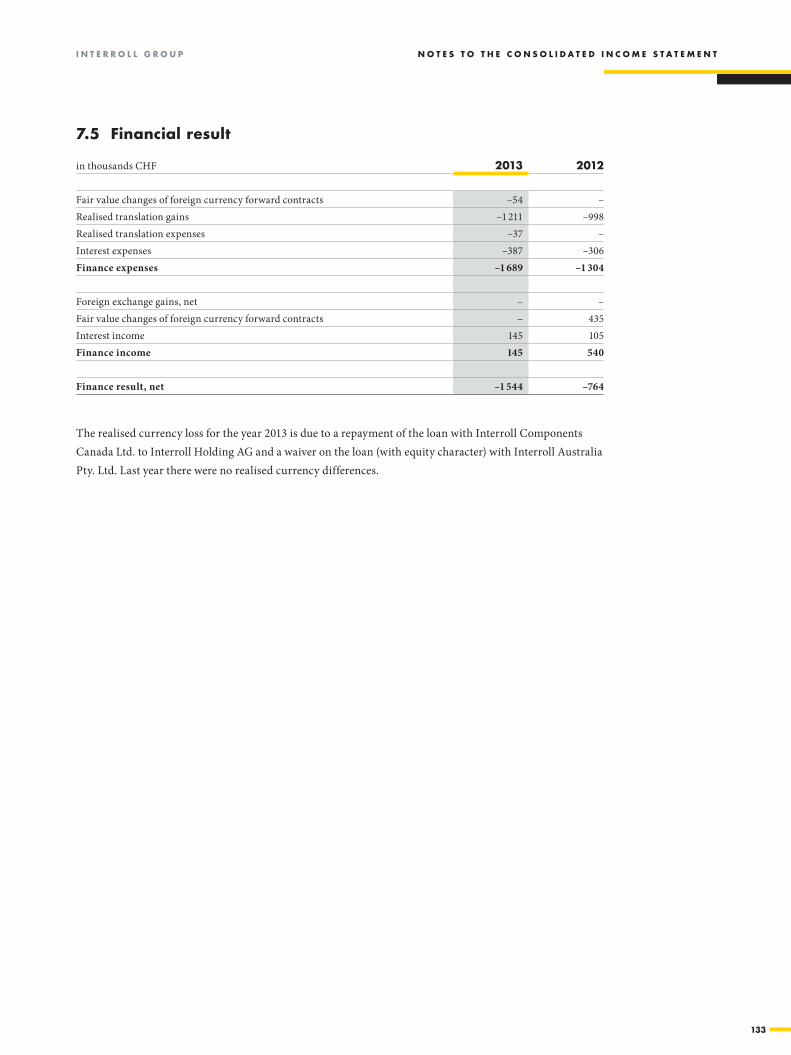
133
7.5fInanCIalreSultt20:v37
7.5 financial result
in thousands CHF 2013 2012
Fair value changes of foreign currency forward contracts –54 –Realised translation gains –1 211 –998 Realised translation expenses –37 –Interest expenses –387 –306 Finance expenses –1 689 –1 304
Foreign exchange gains, net – –Fair value changes of foreign currency forward contracts – 435 Interest income 145 105 Finance income 145 540
Finance result, net –1 544 –764
The realised currency loss for the year 2013 is due to a repayment of the loan with Interroll Components Canada Ltd. to Interroll Holding AG and a waiver on the loan (with equity character) with Interroll Australia Pty. Ltd. Last year there were no realised currency differences.
I n t e r r o l l G r o u p n o t e S t o t h e C o n S o l I d a t e d I n C o M e S t a t e M e n t
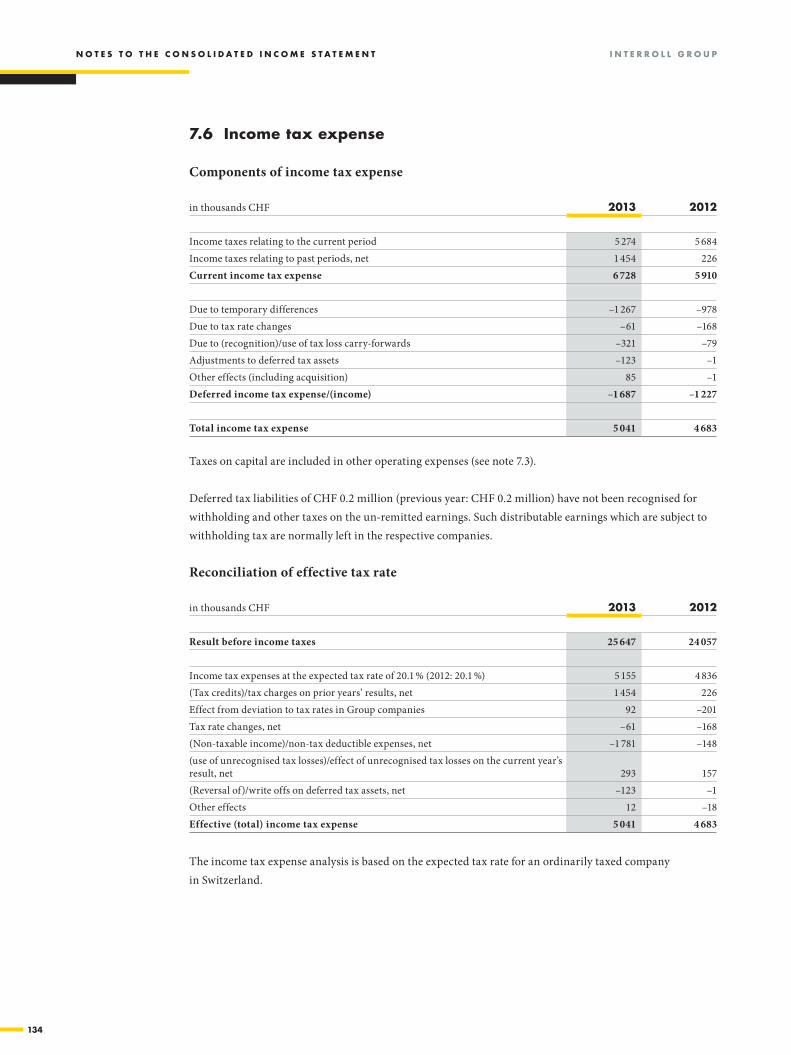
134
7.6taxt20:v40
7.6 Income tax expense
Components of income tax expense
in thousands CHF 2013 2012
Income taxes relating to the current period 5 274 5 684 Income taxes relating to past periods, net 1 454 226 Current income tax expense 6 728 5 910
Due to temporary differences –1 267 –978 Due to tax rate changes –61 –168 Due to (recognition)/use of tax loss carry-forwards –321 –79 Adjustments to deferred tax assets –123 –1 Other effects (including acquisition) 85 –1 Deferred income tax expense/(income) –1 687 –1 227
Total income tax expense 5 041 4 683
Taxes on capital are included in other operating expenses (see note 7.3).
Deferred tax liabilities of CHF 0.2 million (previous year: CHF 0.2 million) have not been recognised for withholding and other taxes on the un-remitted earnings. Such distributable earnings which are subject to withholding tax are normally left in the respective companies.
7.6taxt43:v59
Reconciliation of effective tax rate
in thousands CHF 2013 2012
Result before income taxes 25 647 24 057
Income tax expenses at the expected tax rate of 20.1 % (2012: 20.1 %) 5 155 4 836 (Tax credits)/tax charges on prior years’ results, net 1 454 226 Effect from deviation to tax rates in Group companies 92 –201 Tax rate changes, net –61 –168 (Non-taxable income)/non-tax deductible expenses, net –1 781 –148 (use of unrecognised tax losses)/effect of unrecognised tax losses on the current year’s result, net 293 157 (Reversal of)/write offs on deferred tax assets, net –123 –1 Other effects 12 –18 Effective (total) income tax expense 5 041 4 683
The income tax expense analysis is based on the expected tax rate for an ordinarily taxed company in Switzerland.
n o t e S t o t h e C o n S o l I d a t e d I n C o M e S t a t e M e n t I n t e r r o l l G r o u p

135
7.6taxt61:x81
Tax effects on and expiry dates of losses carried forward
in thousands CHF 31.12.2013 31.12.2012
not aCtIvated aCtIvated
not aCtIvated aCtIvated
Expiry:2013 448 –2014 186 – 492 –2015 – – – –2016 – – – –2017 30 – 925 –2018 and later 14 891 5 177 16 831 1 545 unlimited 9 108 – 7 701 797 Total 24 215 5 177 26 397 2 342
Tax benefit 7 903 1 767 8 904 759 Thereof unrecognisable –7 903 –8 904 Deferred tax assets from losses carried forward 1 767 759
A tax effect of CHF 1.4 million resulted from new tax losses carried forward of CHF 5.2 million in 2013 of which CHF 0.1 million were capitalised (previous year: new tax losses of CHF 4.6 million with a tax effect of CHF 1.3 million, whereof nil was capitalised).
Deferred tax assets on unused tax losses carried forward and based on temporary differencies are capita-lised in case it is probable that such assets can be set off against future taxable profits. Due to the probability to set off current tax losses carried forward against future profits in various subsidiaries, an amount of CHF 1.8 million has been capitalised in 2013 (2012: CHF 0.8 million). Interroll considers the future set off probable based on approved business plans. The majority of non-capitalised deferred tax assets on losses carried foward concern US-based subsidiaries. The applicable tax rate for both years under review is 39 %.
I n t e r r o l l G r o u p n o t e S t o t h e C o n S o l I d a t e d I n C o M e S t a t e M e n t
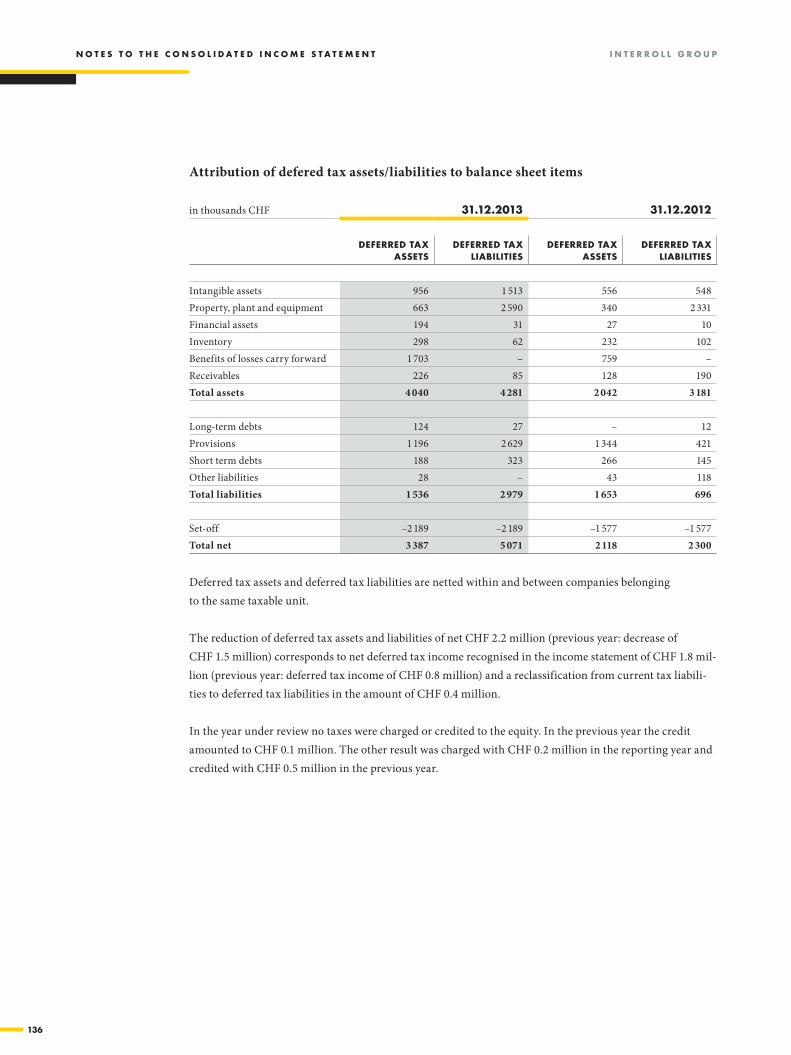
136
7.6taxt85:x110
Attribution of defered tax assets/liabilities to balance sheet items
in thousands CHF 31.12.2013 31.12.2012
deferred tax aSSetS
deferred tax lIaBIlItIeS
deferred tax aSSetS
deferred tax lIaBIlItIeS
Intangible assets 956 1 513 556 548 Property, plant and equipment 663 2 590 340 2 331 Financial assets 194 31 27 10 Inventory 298 62 232 102 Benefits of losses carry forward 1 703 – 759 –Receivables 226 85 128 190 Total assets 4 040 4 281 2 042 3 181
Long-term debts 124 27 – 12 Provisions 1 196 2 629 1 344 421 Short term debts 188 323 266 145 Other liabilities 28 – 43 118 Total liabilities 1 536 2 979 1 653 696
Set-off –2 189 –2 189 –1 577 –1 577 Total net 3 387 5 071 2 118 2 300
Deferred tax assets and deferred tax liabilities are netted within and between companies belonging to the same taxable unit.
The reduction of deferred tax assets and liabilities of net CHF 2.2 million (previous year: decrease of CHF 1.5 million) corresponds to net deferred tax income recognised in the income statement of CHF 1.8 mil-lion (previous year: deferred tax income of CHF 0.8 million) and a reclassification from current tax liabili-ties to deferred tax liabilities in the amount of CHF 0.4 million.
In the year under review no taxes were charged or credited to the equity. In the previous year the credit amounted to CHF 0.1 million. The other result was charged with CHF 0.2 million in the reporting year and credited with CHF 0.5 million in the previous year.
n o t e S t o t h e C o n S o l I d a t e d I n C o M e S t a t e M e n t I n t e r r o l l G r o u p
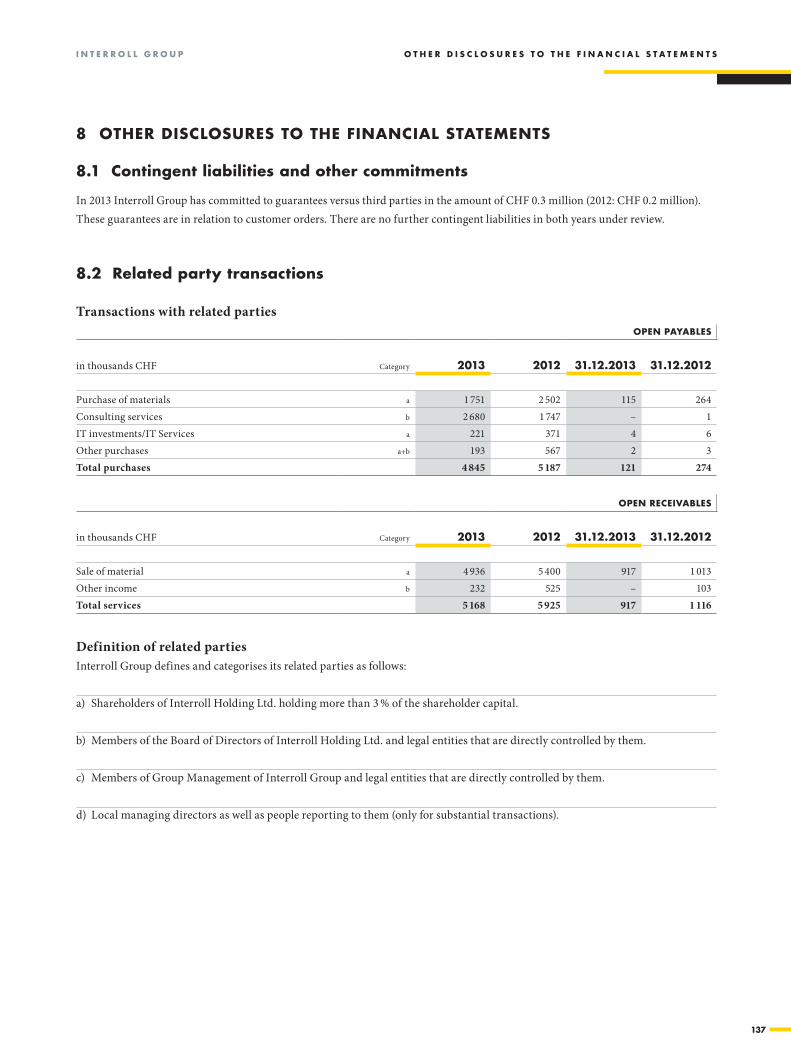
137
8 other dISCloSureS to the fInanCIal StateMentS
8.1ContInGentlIaBIlItIeSt22:t24
8.1 Contingent liabilities and other commitments
In 2013 Interroll Group has committed to guarantees versus third parties in the amount of CHF 0.3 million (2012: CHF 0.2 million). These guarantees are in relation to customer orders. There are no further contingent liabilities in both years under review.
8.2thIrdpartytranSatIonSt20:y388.2 related party transactions
Transactions with related partiesopen payaBleS
in thousands CHF Category 2013 2012 31.12.2013 31.12.2012
Purchase of materials a 1 751 2 502 115 264 Consulting services b 2 680 1 747 – 1 IT investments/IT Services a 221 371 4 6 Other purchases a+b 193 567 2 3 Total purchases 4 845 5 187 121 274
open reCeIvaBleS
in thousands CHF Category 2013 2012 31.12.2013 31.12.2012
Sale of material a 4 936 5 400 917 1 013 Other income b 232 525 – 103 Total services 5 168 5 925 917 1 116
8.2thIrdpartytranSatIonSt40:u45
Definition of related partiesInterroll Group defines and categorises its related parties as follows:
a) Shareholders of Interroll Holding Ltd. holding more than 3 % of the shareholder capital.
b) Members of the Board of Directors of Interroll Holding Ltd. and legal entities that are directly controlled by them.
c) Members of Group Management of Interroll Group and legal entities that are directly controlled by them.
d) Local managing directors as well as people reporting to them (only for substantial transactions).
I n t e r r o l l G r o u p o t h e r d I S C l o S u r e S t o t h e f I n a n C I a l S t a t e M e n t S

138
8.2thIrdpartytranSatIonSt47:v56
Total compensation to Board of DirectorsTotal compensation in the year 2013 to the Board of Directors of Interroll Holding Ltd. is CHF 0.54 million (2012: 0.51 million). The detailed disclosure on the compensation to and shares owned by the Board of Directors and Group Management required by Swiss law are included in the notes to the financial statements of Interroll Holding Ltd.
Total compensation to Group Management
in thousands CHF 2013 2012
Salaries incl. bonus 3 646 3 845 Post-employment benefits 541 595 Equity based compensation 867 913 Total compensation to Group Management 5 054 5 353
8.2thIrdpartytranSatIonSt58:t59
In the period under review as well as in the previous year no loans were granted. For a member of the Executive Management, which left the Group in the previous year a compensation of CHF 0.3 million was agreed in 2012. This compensation is included in the totals shown above.
The detailed disclosure of the compensation and equities held by the Group Management in line with Swiss law (OR) can be found in the notes to the financial statements of Interroll Holding Ltd.
o t h e r d I S C l o S u r e S t o t h e f I n a n C I a l S t a t e M e n t S I n t e r r o l l G r o u p
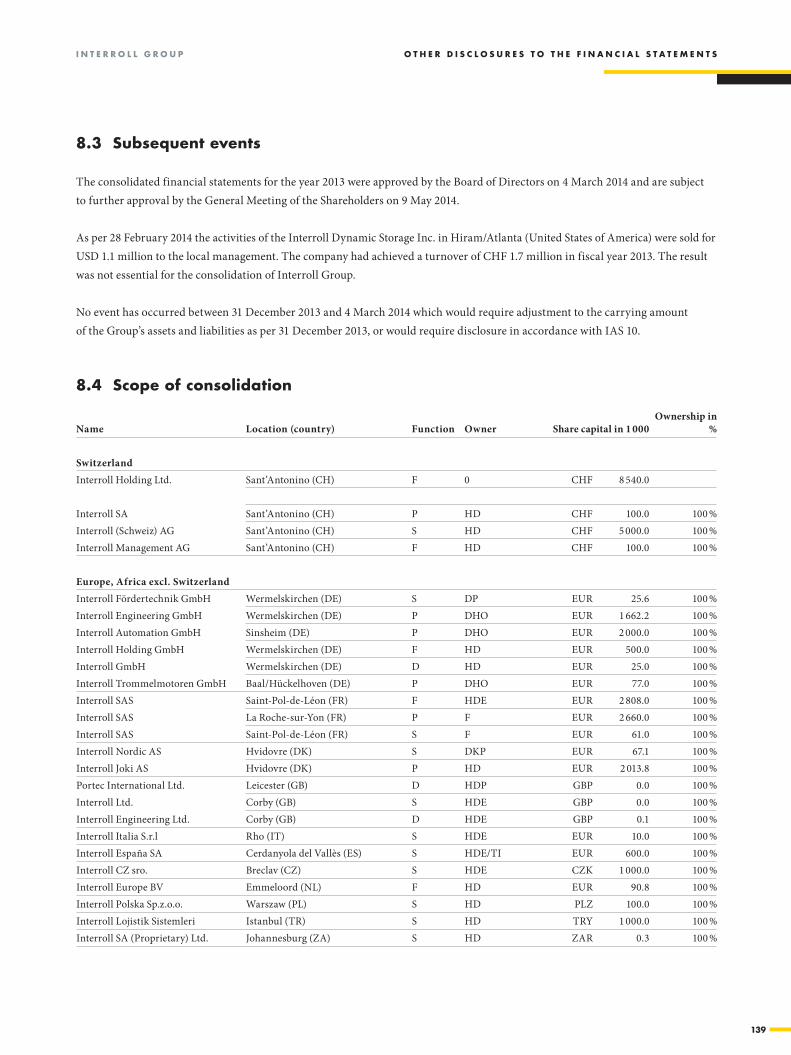
139
8.3latereventSt20:t24
8.3 Subsequent events
The consolidated financial statements for the year 2013 were approved by the Board of Directors on 4 March 2014 and are subject to further approval by the General Meeting of the Shareholders on 9 May 2014.
As per 28 February 2014 the activities of the Interroll Dynamic Storage Inc. in Hiram/ Atlanta (United States of America) were sold for USD 1.1 million to the local management. The company had achieved a turnover of CHF 1.7 million in fiscal year 2013. The result was not essential for the consolidation of Interroll Group.
No event has occurred between 31 December 2013 and 4 March 2014 which would require adjustment to the carrying amount of the Group’s assets and liabilities as per 31 December 2013, or would require disclosure in accordance with IAS 10.
8.4SCopet20:Z52
8.4 Scope of consolidation
Name Location (country) Function Owner Share capital in 1 000Ownership in
%
SwitzerlandInterroll Holding Ltd. Sant’Antonino (CH) F 0 CHF 8 540.0
Interroll SA Sant’Antonino (CH) P HD CHF 100.0 100 %Interroll (Schweiz) AG Sant’Antonino (CH) S HD CHF 5 000.0 100 %Interroll Management AG Sant’Antonino (CH) F HD CHF 100.0 100 %
Europe, Africa excl. SwitzerlandInterroll Fördertechnik GmbH Wermelskirchen (DE) S DP EUR 25.6 100 %Interroll Engineering GmbH Wermelskirchen (DE) P DHO EUR 1 662.2 100 %Interroll Automation GmbH Sinsheim (DE) P DHO EUR 2 000.0 100 %Interroll Holding GmbH Wermelskirchen (DE) F HD EUR 500.0 100 %Interroll GmbH Wermelskirchen (DE) D HD EUR 25.0 100 %Interroll Trommelmotoren GmbH Baal/Hückelhoven (DE) P DHO EUR 77.0 100 %Interroll SAS Saint-Pol-de-Léon (FR) F HDE EUR 2 808.0 100 %Interroll SAS La Roche-sur-Yon (FR) P F EUR 2 660.0 100 %Interroll SAS Saint-Pol-de-Léon (FR) S F EUR 61.0 100 %Interroll Nordic AS Hvidovre (DK) S DKP EUR 67.1 100 %Interroll Joki AS Hvidovre (DK) P HD EUR 2 013.8 100 %Portec International Ltd. Leicester (GB) D HDP GBP 0.0 100 %Interroll Ltd. Corby (GB) S HDE GBP 0.0 100 %Interroll Engineering Ltd. Corby (GB) D HDE GBP 0.1 100 %Interroll Italia S.r.l Rho (IT) S HDE EUR 10.0 100 %Interroll España SA Cerdanyola del Vallès (ES) S HDE/TI EUR 600.0 100 %Interroll CZ sro. Breclav (CZ) S HDE CZK 1 000.0 100 %Interroll Europe BV Emmeloord (NL) F HD EUR 90.8 100 %Interroll Polska Sp.z.o.o. Warszaw (PL) S HD PLZ 100.0 100 %Interroll Lojistik Sistemleri Istanbul (TR) S HD TRY 1 000.0 100 %Interroll SA (Proprietary) Ltd. Johannesburg (ZA) S HD ZAR 0.3 100 %
I n t e r r o l l G r o u p o t h e r d I S C l o S u r e S t o t h e f I n a n C I a l S t a t e M e n t S
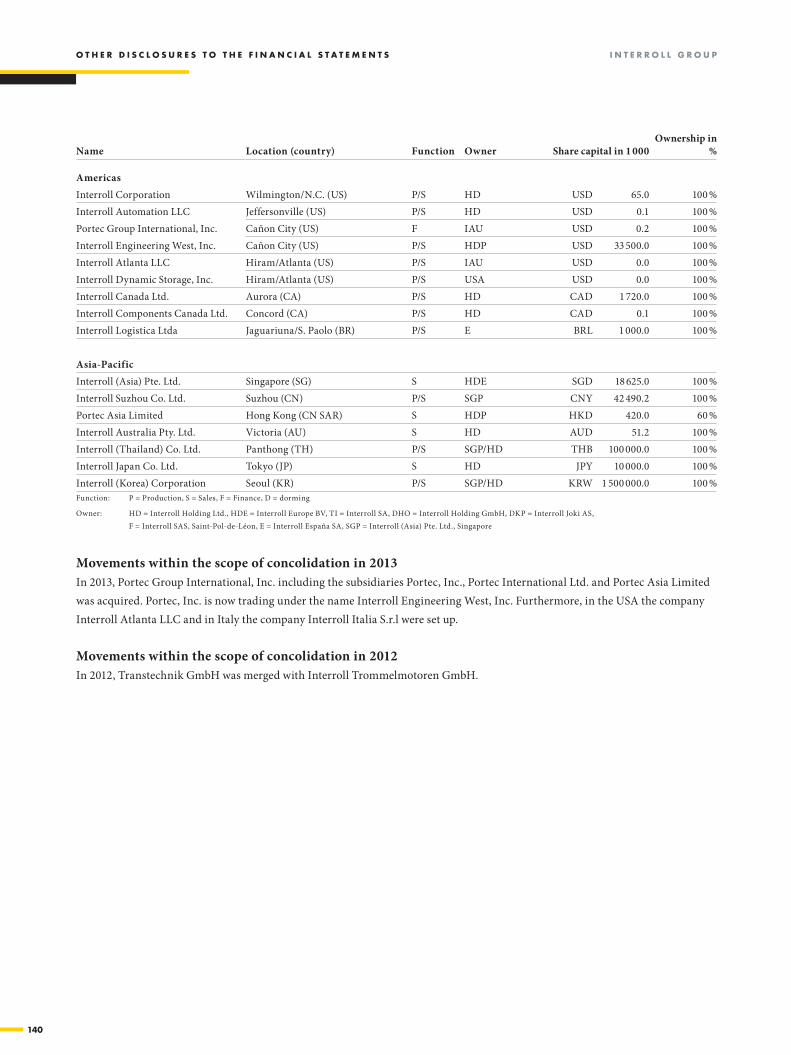
140
8.4SCopet22:Z22
Name Location (country) Function Owner Share capital in 1 000Ownership in
%
8.4SCopet54:Z72
AmericasInterroll Corporation Wilmington/N.C. (US) P/S HD USD 65.0 100 %Interroll Automation LLC Jeffersonville (US) P/S HD USD 0.1 100 %Portec Group International, Inc. Cañon City (US) F IAU USD 0.2 100 %Interroll Engineering West, Inc. Cañon City (US) P/S HDP USD 33 500.0 100 %Interroll Atlanta LLC Hiram/Atlanta (US) P/S IAU USD 0.0 100 %Interroll Dynamic Storage, Inc. Hiram/Atlanta (US) P/S USA USD 0.0 100 %Interroll Canada Ltd. Aurora (CA) P/S HD CAD 1 720.0 100 %Interroll Components Canada Ltd. Concord (CA) P/S HD CAD 0.1 100 %Interroll Logistica Ltda Jaguariuna/S. Paolo (BR) P/S E BRL 1 000.0 100 %
Asia-PacificInterroll (Asia) Pte. Ltd. Singapore (SG) S HDE SGD 18 625.0 100 %Interroll Suzhou Co. Ltd. Suzhou (CN) P/S SGP CNY 42 490.2 100 %Portec Asia Limited Hong Kong (CN SAR) S HDP HKD 420.0 60 %Interroll Australia Pty. Ltd. Victoria (AU) S HD AUD 51.2 100 %Interroll (Thailand) Co. Ltd. Panthong (TH) P/S SGP/HD THB 100 000.0 100 %Interroll Japan Co. Ltd. Tokyo (JP) S HD JPY 10 000.0 100 %Interroll (Korea) Corporation Seoul (KR) P/S SGP/HD KRW 1 500 000.0 100 %
8.4SCopet74:Z76
Function: P = Production, S = Sales, F = Finance, D = dorming
Owner: HD = Interroll Holding Ltd., HDE = Interroll Europe BV, TI = Interroll SA, DHO = Interroll Holding GmbH, DKP = Interroll Joki AS, F = Interroll SAS, Saint-Pol-de-Léon, E = Interroll España SA, SGP = Interroll (Asia) Pte. Ltd., Singapore
8.4SCopet78:t81
Movements within the scope of concolidation in 2013In 2013, Portec Group International, Inc. including the subsidiaries Portec, Inc., Portec International Ltd. and Portec Asia Limited was acquired. Portec, Inc. is now trading under the name Interroll Engineering West, Inc. Furthermore, in the USA the company Interroll Atlanta LLC and in Italy the company Interroll Italia S.r.l were set up.
Movements within the scope of concolidation in 2012In 2012, Transtechnik GmbH was merged with Interroll Trommelmotoren GmbH.
o t h e r d I S C l o S u r e S t o t h e f I n a n C I a l S t a t e M e n t S I n t e r r o l l G r o u p
141
I n t e r r o l l G r o u p r e p o r t o f t h e S t a t u t o r y a u d I t o r
9 report of the Statutory audItor
report of the statutory auditor to the General Meetingon the consolidated financial statements 2013
Report of the statutory auditor on the consolidated financial statementsAs statutory auditor, we have audited the consolidated financial statements of INTERROLL HOLDING LTD, which comprise the balance sheet, income statement, statement of comprehensive income, cash flow statement, statement of changes in equity and notes (pages 76 to 140), for the year ended 31 December 2013.
Board of Directors’ responsibilityThe Board of Directors is responsible for the preparation and fair presentation of the consolidated financial statements in accordance with the International Financial Reporting Standards (IFRS) and the require-ments of Swiss law. This responsibility includes designing, implementing and maintaining an internal con-trol system relevant to the preparation and fair presentation of consolidated financial statements that are free from material misstatement, whether due to fraud or error. The Board of Directors is further responsi-ble for selecting and applying appropriate accounting policies and making accounting estimates that are reasonable in the circumstances.
Auditor’s responsibilityOur responsibility is to express an opinion on these consolidated financial statements based on our audit. We conducted our audit in accordance with Swiss law and Swiss Auditing Standards as well as the Inter-national Standards on Auditing. Those standards require that we plan and perform the audit to obtain rea-sonable assurance whether the consolidated financial statements are free from material misstatement.
An audit involves performing procedures to obtain audit evidence about the amounts and disclosures in the consolidated financial statements. The procedures selected depend on the auditor’s judgment, including the assessment of the risks of material misstatement of the consolidated financial statements, whether due to fraud or error. In making those risk assessments, the auditor considers the internal control system relevant to the entity’s preparation and fair presentation of the consolidated financial statements in order to design audit procedures that are appropriate in the circumstances, but not for the purpose of expressing an opinion on the effectiveness of the entity’s internal control system. An audit also includes evaluating the appro-priateness of the accounting policies used and the reasonableness of accounting estimates made, as well as evaluating the overall presentation of the consolidated financial statements. We believe that the audit evi-dence we have obtained is sufficient and appropriate to provide a basis for our audit opinion.
142
r e p o r t o f t h e S t a t u t o r y a u d I t o r I n t e r r o l l G r o u p
OpinionIn our opinion, the consolidated financial statements for the year ended 31 December 2013 give a true and fair view of the financial position, the results of operations and the cash flows in accordance with the Inter-national Financial Reporting Standards (IFRS) and comply with Swiss law.
Report on other legal requirementsWe confirm that we meet the legal requirements on licensing according to the Auditor Oversight Act (AOA) and independence (article 728 CO and article 11 AOA) and that there are no circumstances incompatible with our independence.
In accordance with article 728a paragraph 1 item 3 CO and Swiss Auditing Standard 890, we confirm that an internal control system exists which has been designed for the preparation of consolidated financial statements according to the instructions of the Board of Directors.
We recommend that the consolidated financial statements submitted to you be approved.
PricewaterhouseCoopers AG
Patrick Balkanyi Martin GrafAudit expert Audit expertAuditor in charge
Zürich, 4 March 2014
143
I n t e r r o l l h o l d I n G l t d . f I n a n C I a l S t a t e M e n t S C o n t e n t S
fInanCIal StateMentS of Interroll holdInG ltd.
Contents
1 Financial statements of Interroll Holding Ltd. 144
2 General information to the financial statements 146
3 Notes to the financial statements 147
4 Other disclosures according to Swiss law 149
5 Proposed appropriation of available earnings 153
6 Report of the statutory auditor 154

F I N A N C I A L S T A T E M E N T S I N T E r r o L L H o L d I N g L T d .
144
1 fInanCIal StateMentS of Interroll holdInG ltd.
1.1 Balance sheetin thousands CHF see notes* 31.12.2013 31.12.2012
aSSetS
Cash and cash equivalents 1 361 701 Accounts receivable from subsidiaries 907 870 Other receivables from third party 278 340 Own shares 3.1 1 641 16 805 Total current assets 4 187 18 716
Investments 213 169 213 169 Loans to subsidiaries 3.3 19 298 11 953 Total non-current assets 232 467 225 122
Total assets 236 654 243 838
eQu It y and l IaB I l I t I eS
Trade and other accounts payable from subsidiaries 1 080 386 Trade and other accounts payable from third party 51 27 Accrued expenses 1 180 2 119 Total current liabilities 2 311 2 532
Loans from subsidiaries 3.4 – 4 094 Provision for loan assets and investment risks 3.5 110 771 110 771 Total non-current liabilities 110 771 114 865
Share capital 3.6 8 540 8 540 Legal reserves
– General legal reserve 5 209 5 209 – Share premium 7 501 14 022 – Reserve for own shares 3.6 1 641 17 671
Available earnings 100 681 80 999 Total shareholders’ equity 123 572 126 441
Total liabilities and equity 236 654 243 838
* See notes to the financial statements.
1.1-BSt20:W59
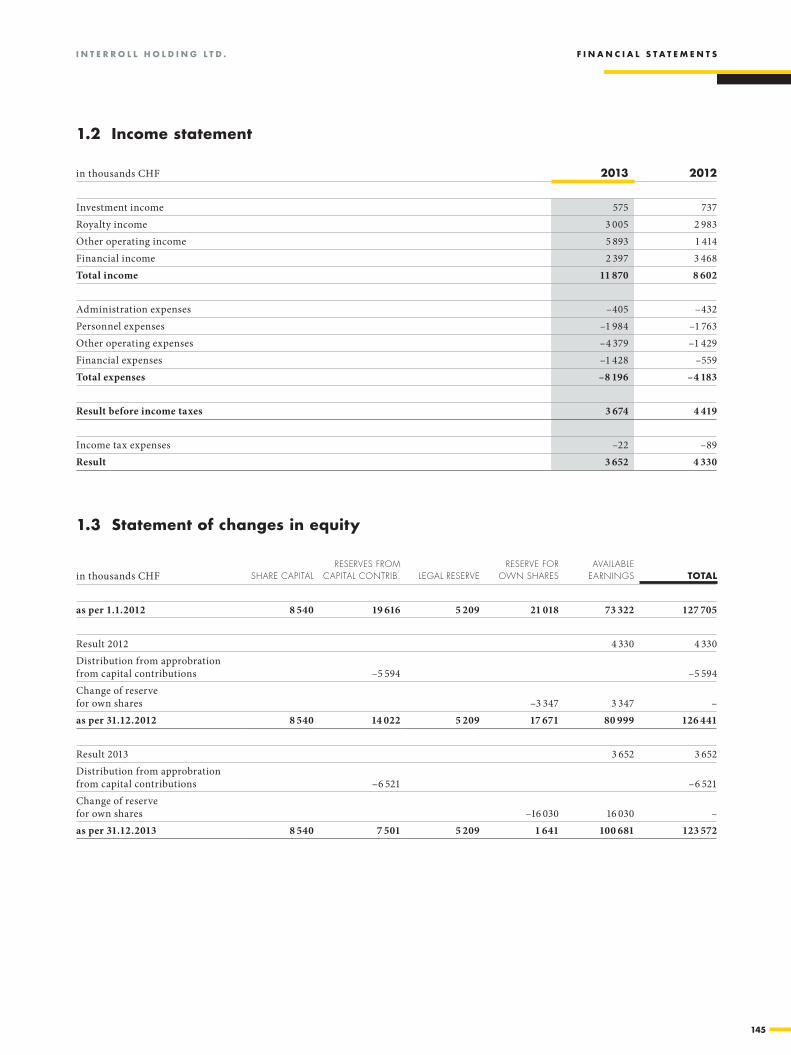
I n t e r r o l l H o l d I n g l t d . F I n A n C I A l S t A t e M e n t S
145
1.2 Income statement
in thousands CHF 2013 2012
Investment income 575 737 Royalty income 3 005 2 983 Other operating income 5 893 1 414 Financial income 2 397 3 468 Total income 11 870 8 602
Administration expenses –405 –432 Personnel expenses –1 984 –1 763 Other operating expenses –4 379 –1 429 Financial expenses –1 428 –559 Total expenses –8 196 –4 183
Result before income taxes 3 674 4 419
Income tax expenses –22 –89 Result 3 652 4 330
1.2-plt20:v40
1.3-eQuItyMovt20:Z351.3 Statement of changes in equity
in thousands CHF Share CapitalreServeS from
Capital ContriB. legal reServereServe for
own ShareSavailaBle
earningS total
as per 1.1.2012 8 540 19 616 5 209 21 018 73 322 127 705
Result 2012 4 330 4 330 Distribution from approbration from capital contributions –5 594 –5 594 Change of reserve for own shares –3 347 3 347 –as per 31.12.2012 8 540 14 022 5 209 17 671 80 999 126 441
Result 2013 3 652 3 652 Distribution from approbration from capital contributions –6 521 –6 521 Change of reserve for own shares –16 030 16 030 –as per 31.12.2013 8 540 7 501 5 209 1 641 100 681 123 572

146
2 General InforMatIon to the fInanCIal StateMentS
2.1 accounting policies
Current/non-current distinctionCurrent assets are assets expected to be realised or consumed in the normal course of the Company’s operating cycle or assets held for trading purposes. All other assets are classified as non-current assets.
Current liabilities are liabilities expected to be settled by use of cash generated in the normal course of the Company’s operating cycle or liabilities due within one year from the reporting date. All other liabilities are classified as non-current liabilities.
Foreign currency translationTransactions in foreign currencies are recorded using exchange rates prevailing at the time of the transaction. Gains or losses arising on settlement of these transactions are included in the current year’s income under financial income and financial expenses respectively. Monetary assets and liabilities denominated in foreign currencies are translated using the exchange rates prevailing at the balance sheet date. Any gains or losses resulting from this translation are also included in the current year’s income, except for unrealised gains which are deferred.
Accounting lawApplying the transitional provisions of the new accounting law, these financial statements have been prepared in accordance of the Swiss Code of Obligations effective until 31 December 2012.
2.2 principles of valuation
Cash and cash equivalents, accounts receivable and payableCash and cash equivalents are stated at nominal value. Accounts receivable are stated at nominal value less any valuation adjustment for credit risks. Accounts payable are stated at nominal value. Accounts receivable from Group companies arise from services provided by Interroll Holding Ltd. and related interest and royalties billed. These services are recognised on an accrual basis.
Own shares and optionsOwn shares and options to buy own shares are stated at the lower of cost and fair value.
LoansNon-current loans receivable are stated at nominal value less any valuation adjustments deemed necessary to reflect the credit risk. Non-current loans payable are stated at nominal value.
InvestmentsInvestments are stated at cost less any valuation adjustments deemed necessary to recognise a decline other than temporary in value (impairment). Additional provisions are recognised for general investment risks.
Accrued expensesAccrued expenses primarily relate to interest due on loans payable stated at nominal value and to accruals for the compensation of the Board of Directors.
G e n e r a l I n f o r M a t I o n t o t h e f I n a n C I a l S t a t e M e n t S I n t e r r o l l h o l d I n G l t d .

147
3 Notes to the FiNaNcial statemeNts
3.1oWNshaRest20:t31
3.1 own shares and options
Shares sold, acquired and held in the periods under reviewIn the year under review, the Company sold 2 964 own shares at an average price of CHF 409 (previous year: sale of 5 440 shares at an average price of CHF 321). In the year under review, the Company did acquire 300 shares (previous year: 0 shares). At year end 2013, the Company held 3 849 own shares at a book value of CHF 1.6 million (2012: 51 718 own shares at a book value of CHF 16.8 million).
Shares held to cover the option planAt year end 2013, there was no Management Option Plan any more. At year end 2012, there were 43 225 own shares reserved to cover the management option plan (see note 7.1 of the consolidated financial statements). In the year under review, 42 625 shares (2012: 2 740 shares) from the option plan were sold at the strike price of CHF 323 (2012: CHF 323).
Attribution of own shares to employees2 580 shares (previous year: 2 941 shares) at a carrying value of CHF 1 million (previous year: CHF 0.9 milli-on) were attributed to employees.
3.2 investments
An overview on the material investments either directly or indirectly held by Interroll Holding Ltd. can be found in the notes to the consolidated statements of the Interroll Group (see 8.4 – Scope of consolidation).
3.3loaNs_tot20:V273.3 loans to subsidiaries
The interest rates used were the following: lowest highest
In 2013 0.00 % 4.00 %In 2012 0.00 % 6.00 %
The loans due to Group companies are normally redeemable with a notification period of three months. As of year end, the total outstanding group loans amounted to CHF 19.3 million (2012: CHF 12 million). For CHF 2.8 million (previous year: CHF 2.8 million) a valuation allowance has been accounted for.
i N t e R R o l l h o l d i N g l t d . N o t e s t o t h e F i N a N c i a l s t a t e m e N t s
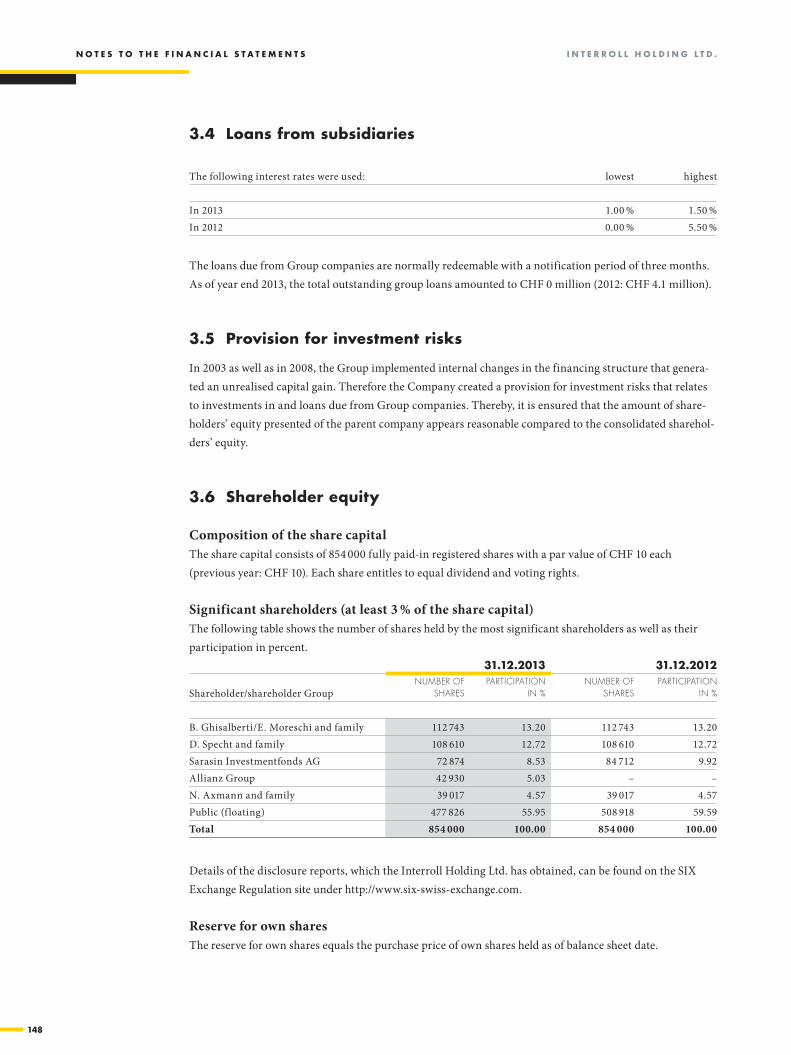
148
3.4loanS_froMt20:v29
3.4 loans from subsidiaries
The following interest rates were used: lowest highest
In 2013 1.00 % 1.50 %In 2012 0.00 % 5.50 %
The loans due from Group companies are normally redeemable with a notification period of three months. As of year end 2013, the total outstanding group loans amounted to CHF 0 million (2012: CHF 4.1 million).
3.5 provision for investment risks
In 2003 as well as in 2008, the Group implemented internal changes in the financing structure that genera-ted an unrealised capital gain. Therefore the Company created a provision for investment risks that relates to investments in and loans due from Group companies. Thereby, it is ensured that the amount of share-holders’ equity presented of the parent company appears reasonable compared to the consolidated sharehol-ders’ equity.
3.5InvrISkSt20:t22
3.6eQuItyt20:x36
3.6 Shareholder equity
Composition of the share capitalThe share capital consists of 854 000 fully paid-in registered shares with a par value of CHF 10 each (previous year: CHF 10). Each share entitles to equal dividend and voting rights.
Significant shareholders (at least 3 % of the share capital)The following table shows the number of shares held by the most significant shareholders as well as their participation in percent.
31.12.2013 31.12.2012
Shareholder/shareholder GroupnumBer of
ShareSpartiCipation
in %numBer of
ShareSpartiCipation
in %
B. Ghisalberti/E. Moreschi and family 112 743 13.20 112 743 13.20D. Specht and family 108 610 12.72 108 610 12.72Sarasin Investmentfonds AG 72 874 8.53 84 712 9.92Allianz Group 42 930 5.03 – –N. Axmann and family 39 017 4.57 39 017 4.57Public (f loating) 477 826 55.95 508 918 59.59Total 854 000 100.00 854 000 100.00
3.6eQuItyt39
Details of the disclosure reports, which the Interroll Holding Ltd. has obtained, can be found on the SIX Exchange Regulation site under http://www.six-swiss-exchange.com.
3.6eQuItyt43:t44
Reserve for own sharesThe reserve for own shares equals the purchase price of own shares held as of balance sheet date.
n o t e S t o t h e f I n a n C I a l S t a t e M e n t S I n t e r r o l l h o l d I n G l t d .
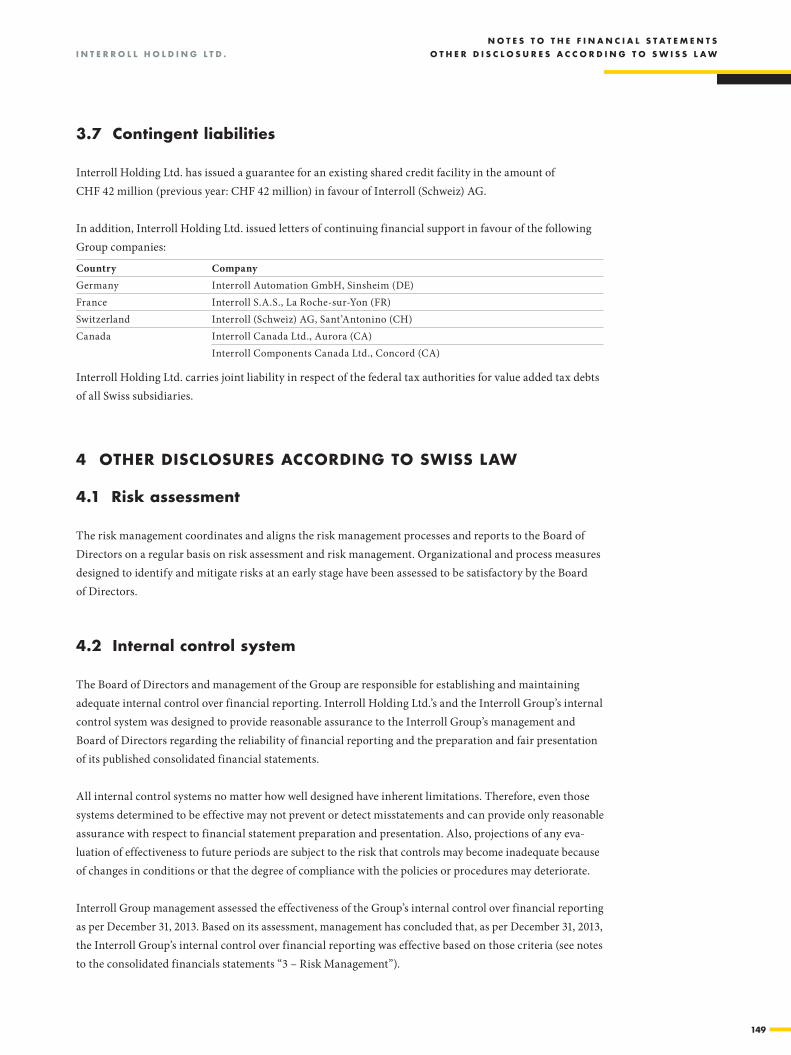
149
4 other dISCloSureS aCCordInG to SWISS laW
4.1 risk assessment
The risk management coordinates and aligns the risk management processes and reports to the Board of Directors on a regular basis on risk assessment and risk management. Organizational and process measures designed to identify and mitigate risks at an early stage have been assessed to be satisfactory by the Board of Directors.
4.2 Internal control system
The Board of Directors and management of the Group are responsible for establishing and maintaining adequate internal control over financial reporting. Interroll Holding Ltd.’s and the Interroll Group’s internal control system was designed to provide reasonable assurance to the Interroll Group’s management and Board of Directors regarding the reliability of financial reporting and the preparation and fair presentation of its published consolidated financial statements.
All internal control systems no matter how well designed have inherent limitations. Therefore, even those systems determined to be effective may not prevent or detect misstatements and can provide only reasonable assurance with respect to financial statement preparation and presentation. Also, projections of any eva-luation of effectiveness to future periods are subject to the risk that controls may become inadequate because of changes in conditions or that the degree of compliance with the policies or procedures may deteriorate.
Interroll Group management assessed the effectiveness of the Group’s internal control over financial reporting as per December 31, 2013. Based on its assessment, management has concluded that, as per December 31, 2013, the Interroll Group’s internal control over financial reporting was effective based on those criteria (see notes to the consolidated financials statements “3 – Risk Management”).
3.7ContIlIaBt20:u32
3.7 Contingent liabilities
Interroll Holding Ltd. has issued a guarantee for an existing shared credit facility in the amount of CHF 42 million (previous year: CHF 42 million) in favour of Interroll (Schweiz) AG.
In addition, Interroll Holding Ltd. issued letters of continuing financial support in favour of the following Group companies:
Country CompanyGermany Interroll Automation GmbH, Sinsheim (DE)France Interroll S.A.S., La Roche-sur-Yon (FR)Switzerland Interroll (Schweiz) AG, Sant’Antonino (CH)Canada Interroll Canada Ltd., Aurora (CA)
Interroll Components Canada Ltd., Concord (CA)
Interroll Holding Ltd. carries joint liability in respect of the federal tax authorities for value added tax debts of all Swiss subsidiaries.
n o t e S t o t h e f I n a n C I a l S t a t e M e n t S
I n t e r r o l l h o l d I n G l t d . o t h e r d I S C l o S u r e S a C C o r d I n G t o S W I S S l a W
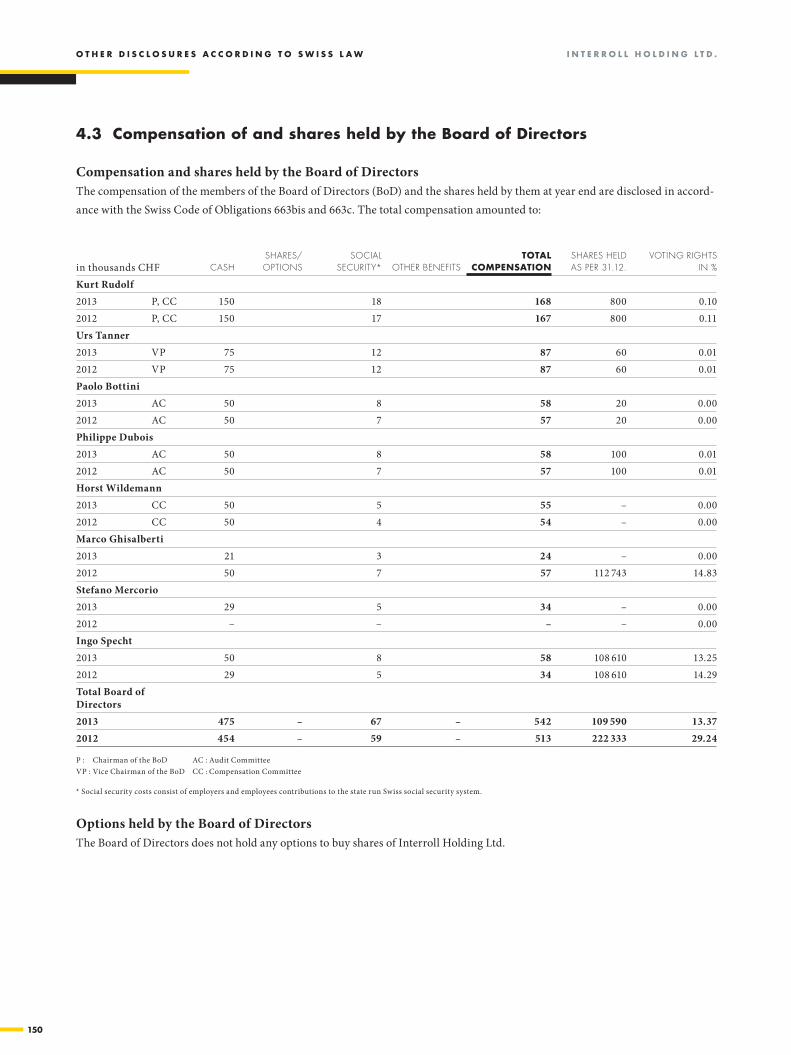
150
4.3 Compensation of and shares held by the Board of directors
Compensation and shares held by the Board of DirectorsThe compensation of the members of the Board of Directors (BoD) and the shares held by them at year end are disclosed in accord-ance with the Swiss Code of Obligations 663bis and 663c. The total compensation amounted to:
3.3CoMpBodt20:t23
in thousands CHF CaSh ShareS/optionS
SoCial SeCurity* other BenefitS
total CoMpenSatIon
ShareS held aS per 31.12.
voting rightS in %
Kurt Rudolf2013 P, CC 150 18 168 800 0.102012 P, CC 150 17 167 800 0.11Urs Tanner 2013 VP 75 12 87 60 0.012012 VP 75 12 87 60 0.01Paolo Bottini 2013 AC 50 8 58 20 0.002012 AC 50 7 57 20 0.00Philippe Dubois 2013 AC 50 8 58 100 0.012012 AC 50 7 57 100 0.01Horst Wildemann 2013 CC 50 5 55 – 0.002012 CC 50 4 54 – 0.00Marco Ghisalberti 2013 21 3 24 – 0.002012 50 7 57 112 743 14.83Stefano Mercorio 2013 29 5 34 – 0.002012 – – – – 0.00Ingo Specht 2013 50 8 58 108 610 13.252012 29 5 34 108 610 14.29Total Board of Directors2013 475 – 67 – 542 109 590 13.372012 454 – 59 – 513 222 333 29.24
3.3CoMpBodt24:aC51
P : Chairman of the BoD AC : Audit CommitteeVP : Vice Chairman of the BoD CC : Compensation Committee
* Social security costs consist of employers and employees contributions to the state run Swiss social security system.
Options held by the Board of DirectorsThe Board of Directors does not hold any options to buy shares of Interroll Holding Ltd.
3.3CoMpBodt52:x58
o t h e r d I S C l o S u r e S a C C o r d I n G t o S W I S S l a W I n t e r r o l l h o l d I n G l t d .
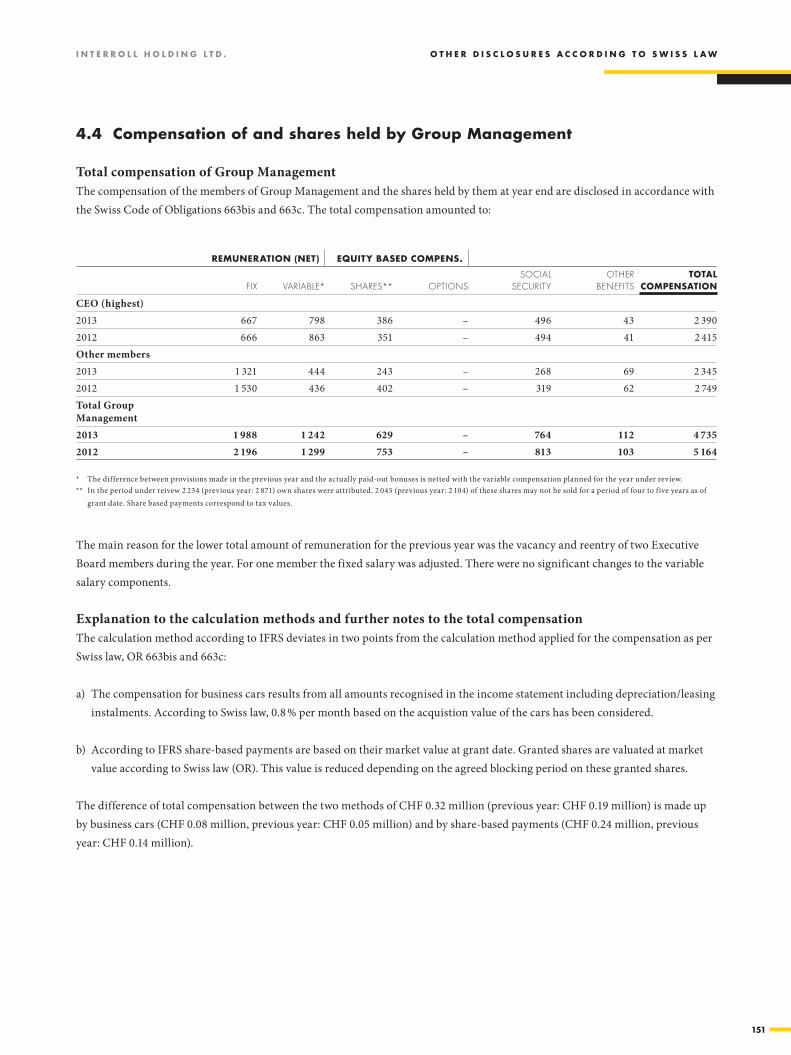
151
3.4COMPMGTT20:T22T23:AB33T35:U36
4.4 Compensation of and shares held by Group Management
Total compensation of Group ManagementThe compensation of the members of Group Management and the shares held by them at year end are disclosed in accordance with the Swiss Code of Obligations 663bis and 663c. The total compensation amounted to:
ReMUneRATiOn (neT) eqUiTy BAsed COMPens.
fix variable* ShareS** OptiOnS SOcial
Security Other
benefitS TOTAl
COMPensATiOn
CEO (highest)2013 667 798 386 – 496 43 2 390 2012 666 863 351 – 494 41 2 415 Other members2013 1 321 444 243 – 268 69 2 345 2012 1 530 436 402 – 319 62 2 749 Total Group Management2013 1 988 1 242 629 – 764 112 4 735 2012 2 196 1 299 753 – 813 103 5 164
* The difference between provisions made in the previous year and the actually paid-out bonuses is netted with the variable compensation planned for the year under review.** In the period under reivew 2 234 (previous year: 2 871) own shares were attributed. 2 045 (previous year: 2 104) of these shares may not be sold for a period of four to five years as of
grant date. Share based payments correspond to tax values.
The main reason for the lower total amount of remuneration for the previous year was the vacancy and reentry of two Executive Board members during the year. For one member the fixed salary was adjusted. There were no significant changes to the variable salary components.
Explanation to the calculation methods and further notes to the total compensationThe calculation method according to IFRS deviates in two points from the calculation method applied for the compensation as per Swiss law, OR 663bis and 663c:
a) The compensation for business cars results from all amounts recognised in the income statement including depreciation/leasing instalments. According to Swiss law, 0.8 % per month based on the acquistion value of the cars has been considered.
b) According to IFRS share-based payments are based on their market value at grant date. Granted shares are valuated at market value according to Swiss law (OR). This value is reduced depending on the agreed blocking period on these granted shares.
The difference of total compensation between the two methods of CHF 0.32 million (previous year: CHF 0.19 million) is made up by business cars (CHF 0.08 million, previous year: CHF 0.05 million) and by share-based payments (CHF 0.24 million, previous year: CHF 0.14 million).
3.4COMPMGTT37:U46
i n T e R R O l l H O l d i n G l T d . O T H e R d i s C l O s U R e s A C C O R d i n G T O s w i s s l A w
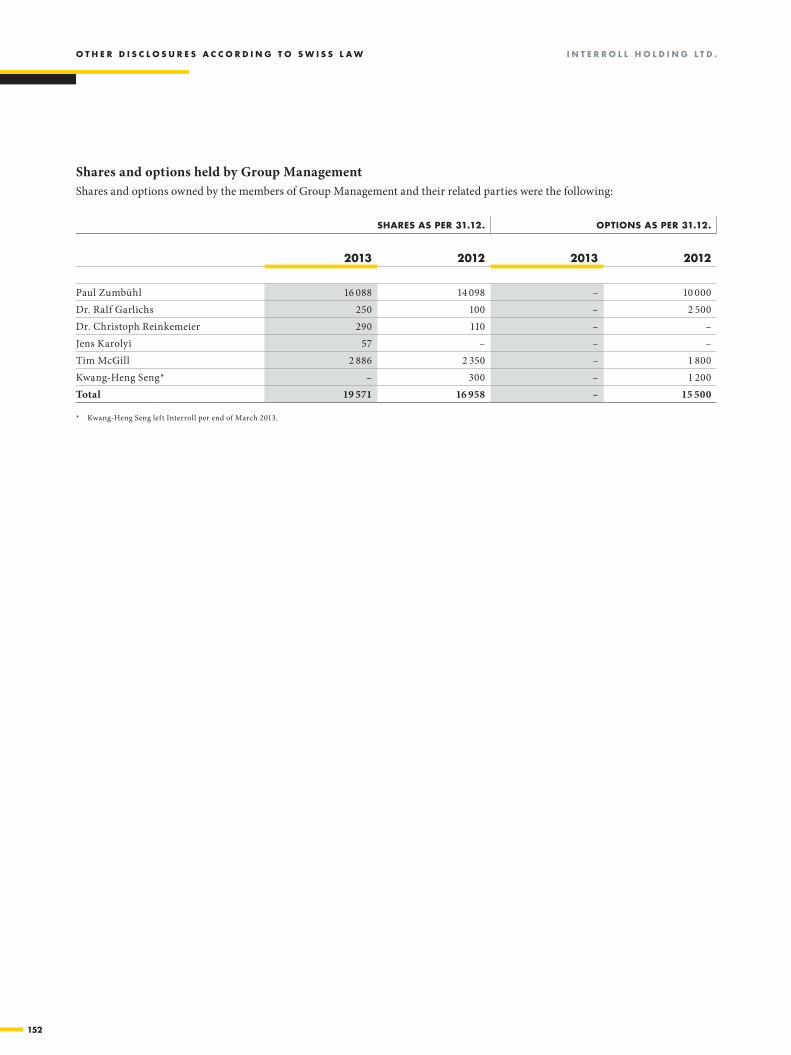
152
3.4CoMpMGtt49:y63t65:u67
Shares and options held by Group ManagementShares and options owned by the members of Group Management and their related parties were the following:
ShareS aS per 31.12. optIonS aS per 31.12.
2013 2012 2013 2012
Paul Zumbühl 16 088 14 098 – 10 000 Dr. Ralf Garlichs 250 100 – 2 500 Dr. Christoph Reinkemeier 290 110 – –Jens Karolyi 57 – – –Tim McGill 2 886 2 350 – 1 800 Kwang-Heng Seng* – 300 – 1 200 Total 19 571 16 958 – 15 500
* Kwang-Heng Seng left Interroll per end of March 2013.
o t h e r d I S C l o S u r e S a C C o r d I n G t o S W I S S l a W I n t e r r o l l h o l d I n G l t d .
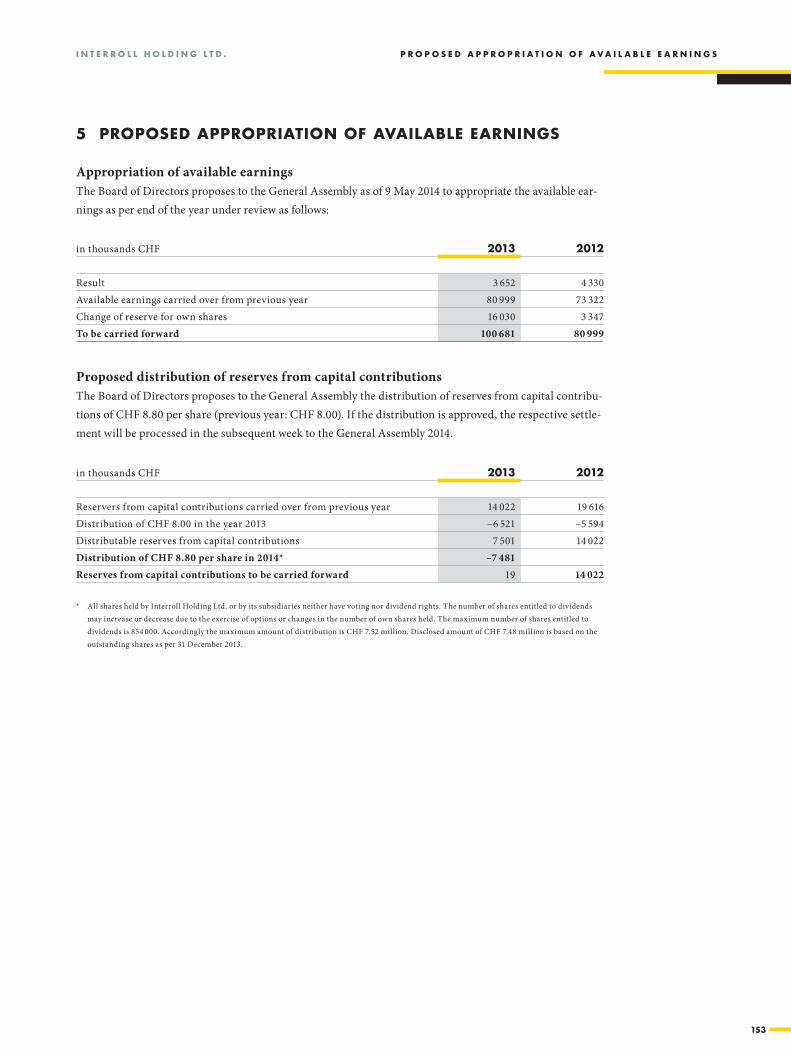
153
* All shares held by Interroll Holding Ltd. or by its subsidiaries neither have voting nor dividend rights. The number of shares entitled to dividends may increase or decrease due to the exercise of options or changes in the number of own shares held. The maximum number of shares entitled to dividends is 854 000. Accordingly the maximum amount of distribution is CHF 7.52 million. Disclosed amount of CHF 7.48 million is based on the outstanding shares as per 31 December 2013.
4VERWNDUNGPROFITT20:V44T45:U46
5 PROPOsED aPPROPRIaTION OF aVaIlablE EaRNINGs
Appropriation of available earningsThe Board of Directors proposes to the General Assembly as of 9 May 2014 to appropriate the available ear-nings as per end of the year under review as follows:
in thousands CHF 2013 2012
Result 3 652 4 330 Available earnings carried over from previous year 80 999 73 322 Change of reserve for own shares 16 030 3 347 To be carried forward 100 681 80 999
Proposed distribution of reserves from capital contributionsThe Board of Directors proposes to the General Assembly the distribution of reserves from capital contribu-tions of CHF 8.80 per share (previous year: CHF 8.00). If the distribution is approved, the respective settle-ment will be processed in the subsequent week to the General Assembly 2014.
in thousands CHF 2013 2012
Reservers from capital contributions carried over from previous year 14 022 19 616 Distribution of CHF 8.00 in the year 2013 –6 521 –5 594 Distributable reserves from capital contributions 7 501 14 022 Distribution of CHF 8.80 per share in 2014* –7 481 Reserves from capital contributions to be carried forward 19 14 022
I N T E R R O l l H O l D I N G l T D . P R O P O s E D a P P R O P R I a T I O N O F a V a I l a b l E E a R N I N G s
154
r e p o r t o f t h e S t a t u t o r y a u d I t o r I n t e r r o l l h o l d I n G l t d .
6 report of the Statutory audItor
report of the statutory auditor to the General Meetingon the financial statements 2013
Report of the statutory auditor on the financial statementsAs statutory auditor, we have audited the financial statements of INTERROLL HOLDING LTD, which com-prise the balance sheet, income statement and notes (pages 144 to 153), for the year ended 31 December 2013.
Board of Directors’ responsibilityThe Board of Directors is responsible for the preparation of the financial statements in accordance with the requirements of Swiss law and the company’s articles of incorporation. This responsibility includes design-ing, implementing and maintaining an internal control system relevant to the preparation of financial state-ments that are free from material misstatement, whether due to fraud or error. The Board of Directors is further responsible for selecting and applying appropriate accounting policies and making accounting esti-mates that are reasonable in the circumstances.
Auditor’s responsibilityOur responsibility is to express an opinion on these financial statements based on our audit. We conducted our audit in accordance with Swiss law and Swiss Auditing Standards. Those standards require that we plan and perform the audit to obtain reasonable assurance whether the financial statements are free from materi-al misstatement.
An audit involves performing procedures to obtain audit evidence about the amounts and disclosures in the financial statements. The procedures selected depend on the auditor’s judgment, including the assessment of the risks of material misstatement of the financial statements, whether due to fraud or error. In making those risk assessments, the auditor considers the internal control system relevant to the entity’s preparation of the financial statements in order to design audit procedures that are appropriate in the circumstances, but not for the purpose of expressing an opinion on the effectiveness of the entity’s internal control system. An audit also includes evaluating the appropriateness of the accounting policies used and the reasonableness of accounting estimates made, as well as evaluating the overall presentation of the financial statements. We believe that the audit evidence we have obtained is sufficient and appropriate to provide a basis for our audit opinion.
155
I n t e r r o l l h o l d I n G l t d . r e p o r t o f t h e S t a t u t o r y a u d I t o r
OpinionIn our opinion, the financial statements for the year ended 31 December 2013 comply with Swiss law and the company’s articles of incorporation.
Report on other legal requirementsWe confirm that we meet the legal requirements on licensing according to the Auditor Oversight Act (AOA) and independence (article 728 CO and article 11 AOA) and that there are no circumstances incompatible with our independence.
In accordance with article 728a paragraph 1 item 3 CO and Swiss Auditing Standard 890, we confirm that an internal control system exists which has been designed for the preparation of financial statements according to the instructions of the Board of Directors.
We further confirm that the proposed appropriation of available earnings comply with Swiss law and the company’s articles of incorporation. We recommend that the financial statements submitted to you be approved.
PricewaterhouseCoopers AG
Patrick Balkanyi Martin GrafAudit expert Audit expertAuditor in charge
Zürich, 4 March 2014
156
I M p r I n t
IMprInt
Editor:Interroll Holding Ltd. Via Gorelle 3 6592 Sant’Antonino, Switzerland Phone: +41 91 850 25 25 Fax: +41 91 850 25 05
Concept and design: Media Office Network Hans-Peter Ott, Dormagen (D) Jürgen Kosmalla, Köln (D)
Layout & DTP financial section: gateB AG | Communication Engineering, Steinhausen (CH)
Printing: Nastro & Nastro Srl, Germignaga (I)
Note on the annual report
This annual report is also available in German. If there are differences between the two, the German version takes priority.
Note on rounding
Please note that slight differences may arise as a result of the use of rounded amounts and percentages.
Forward-looking statements
This annual report contains certain future-oriented statements. Future-oriented statements include all statements which do not relate to historical facts and events
and contain future-oriented expressions such as “believe”, “estimate”, “assume”, “expect”, “forecast”, “intend”, “could” or “should” or expressions of a similar kind. Such
future-oriented statements are subject to risks and uncertainties since they relate to future events and are based on the company‘s current assumptions, which may
not in the future take place or be fulfilled as expected. The company points out that such future-oriented statements provide no guarantee for the future and that the
actual events including the financial position and profitability of the Interroll Group and developments in the economic and regulatory fundamentals may vary sub-
stantially (particularly on the down side) from those explicitly or implicitly assumed in these statements. Even if the actual assets for the Interroll Group, including its
financial position and profitability and the economic and regulatory fundamentals, are in accordance with such future-oriented statements in this annual report, no
guarantee can be given that this will continue to be the case in the future.
aBoUt interroll
Interroll product groups
Rollers
Conveyors & Sorters
Drives
Pallet & Carton Flow
Key figUres
in CHF million, if not stated differently 2013 2012 2011 2010 2009
Incoming orders/net salesTotal incoming orders 318.8 302.6 288.7 285.2 238.9
Drives 109.4 99.3 95.1 97.9 82.9Rollers 75.4 80.4 83.2 79.2 73.3Conveyors & Sorters 71.2 69.3 42.8 52.1 33.6Pallet & Carton Flow 60.3 58.1 50.8 53.9 44.3Total net sales 316.3 307.2 271.9 283.1 234.0
ProfitabilityEBITDA 45.4 41.1 36.2 35.8 18.8in % of net sales 14.3 13.4 13.3 12.6 8.0EBITA 34.0 30.3 25.7 24.8 8.0in % of net sales 10.7 9.9 9.5 8.8 3.4EBIT 27.2 24.8 20.4 20.4 3.1in % of net sales 8.6 8.1 7.5 7.2 1.3Net profit 20.5 19.4 18.2 14.4 5.7in % of net sales 6.5 6.3 6.7 5.1 2.4
Cash flowOperating cash flow 44.5 38.2 14.5 18.7 20.4in % of net sales 14.1 12.4 5.3 6.6 8.7Free cash flow 5.0 30.2 –5.6 –8.5 –6.0in % of net sales 1.6 9.8 –2.1 –3.0 –2.6
Total investments/capital expenditure 39.8 10.6 19.6 26.4 22.9
Balance sheet (31.12.)Total assets 258.2 227.6 239.2 211.3 215.7
Goodwill 16.0 9.0 9.0 9.3 11.0
Net financial assets (debts) 20.2 8.7 –17.6 –12.9 –4.2Gearing (net debt/equity) – – 0.12 0.10 0.03Indebtedness factor (net debt/cash flow) – – 1.21 0.69 0.20Equity 187.2 157.6 143.3 127.5 133.0Equity ratio (equity in % of assets) 72.5 69.3 59.9 60.3 61.7Return on equity (in %) 11.9 12.8 13.4 11.1 4.3
Other key figuresRONA (Return on Net Assets, in %) 12.2 12.6 9.9 10.4 1.6Average number of employees 1 488 1 420 1 340 1 255 1 206Net sales per employee (in thousands CHF) 213 216 203 226 194Productivity (Added value/total personnel expenses) 1.95 1.92 1.77 1.98 1.66
Interroll Group is a worldwide leading provider of high-quality key products and services for internal logistics. The company offers a broad product range in the four product groups “Rollers”, “Drives”, “Conveyors & Sorters” and “Pallet & Carton Flow” to around 23,000 customers around the world.
Core industries are courier, parcel, express and postal services, airports, food processing as well as distribution centres. Customers are amongst others well-known global brands such as Amazon, Bosch, Coca-Cola, Coop, DHL, FedEx, Peugeot, PepsiCo, Procter & Gamble, Siemens, Walmart or Yamaha.
Interroll is engaged in global research projects on logistics efficiency and actively supports industry associations in developing standards. Headquartered in Sant’Antonino, Switzerland, Interroll operates a worldwide network of 31 companies with around 1,600 employees. The company was founded 1959. Since 1997, Interroll Group has been listed on the SIX Swiss Exchange and included in the SPI index.
www.interroll.com
contact
If you have any questions regarding Interroll Group or would like to be included in our distribution list, please contact the Investor Relations Team:
Petra Müller Head of PR & Investor Relations Phone: +41 91 850 25 21 E-Mail: [email protected]
financial calenDar 2014
Preliminary Financial Figures 2013 24 January 2014
Publication Annual Report 2013 and Balance Sheet Press Conference 21 March 2014
Annual General Assembly 9 May 2014
Publication Half-Year Report 2014 8 August 2014
f i n a n c i a l c a l e n D a r | c o n t a c t

Solid sales growth in the americas by 20.4 % And asia-Pacific by 27.8 %
RiSe in eBitDa margin to 14.3 %
Us acqUisition Portec SucceSSfully integRAted
inteRRoll sUBsiDiary in italy eStAbliShed
inte
rr
oll
an
nU
al
reP
or
t2
013 annUal rePort 2013
insPireD By efficiencyInterroll Holding AG Via Gorelle 3 | 6592 Sant’Antonino | Switzerland www.interroll.com
© In
terr
oll H
oldi
ng A
G
highlights 2013