interpreting the voice of the customer: …facultyresearch.london.edu/docs/05-705.pdf · 2...
TRANSCRIPT
* This work was supported by the MIT Center for Innovation in Product Development under NSF Cooperative Agreement Number EEC-9529140. The authors would like to thank David Bell at Xerox PARC, John Carroll, Abbie Griffin, John Hauser, Robert Klein at AMS, Drazen Prelec and JoAnne Yates for their helpful comments, and Debbie Shoap and Drazen Prelec for collaborating with us on the marketing research projects reported here.
INTERPRETING THE VOICE OF THE CUSTOMER:
CATEGORIZATION BY GROUPS AND INDIVIDUALS*
Rebecca W. Hamilton Assistant Professor of Marketing
3456 Van Munching Hall Robert H. Smith School of Business
University of Maryland College Park, MD 20742
E-mail: [email protected] Phone: 301-405-8270 Fax: 301-405-0146
Nader T. Tavassoli Associate Professor of Marketing
London Business School London NW1 4SA
U.K. E-mail: [email protected]
Phone: +44 (0)20 7706 6733 Fax: +44 (0)20 7724 1145
Centre for Marketing Working Paper No. 05-705
August 2005
2
Interpreting the Voice of the Customer: Categorization by Groups and Individuals
Abstract
Capturing the voice of the customer and translating customer needs into product features
have become systematic steps in the product development process at thousands of firms
worldwide. Some of the most popular techniques used to interpret the voice of the customer,
such as customer sorts and affinity diagrams, are based on the process of categorization. The
underlying assumption is that these techniques elicit the categorizers’ tacit knowledge and
theories about the relationships among customers needs in an unbiased manner. Building on
recent research on categorization, we question this assumption and test the effects of two
moderating variables on the categorization of customer needs. First, we test whether participants
categorize customer needs differently when working individually or as part of a group. Second,
we test whether participants’ prior experience using a technique affects the way they categorize
customer needs. Two experiments confirm that these moderators systematically contribute to
variations in category structures: the breadth of categories created and relationships identified
among categories.
3
Introduction
A strong customer orientation is perceived to be a critical success factor for product
development in organizations around the world (Christiano, Liker and White 2000). Customer-
oriented firms serve customers more effectively by providing products that better meet their
needs (Griffin and Hauser 1993) and capturing the voice of the customer and translating
customer needs into product features have become systematic steps in the product development
process at thousands of firms worldwide (Christiano et al. 2000).
Customer needs are “a description, in the customer’s own words, of the benefit to be
fulfilled by the product or service” (Griffin and Hauser 1993, p. 4) and dozens of needs are often
identified for a single product. Once customer voices have been recorded during focus groups
and interviews, the customer needs must be interpreted and structured so that they can be
translated into product features and marketing messages. To interpret and structure the customer
needs, organizations often rely on categorization techniques such as the customer sort technique
and the affinity diagram technique (Urban and Hauser 1993). While the mechanics of the
techniques differ,1 the goal of these techniques is to identify common elements among the
customer needs, and the underlying assumption is that they elicit the categorizer’s tacit
knowledge and theories about the relationships among customer needs in an unbiased manner.
An important distinction between these techniques is that affinity diagrams have
traditionally been created by groups (Burchill and Brodie 1997, Shiba, Graham and Walden
1993) whereas customer sorts have traditionally been based on the inputs of individual customers
(Griffin and Hauser 1993). While the outputs of these two techniques have been compared in
past research (Griffin 1989, Griffin and Hauser 1993), previous comparisons have not isolated
the effect of the social context (individual vs. group) from the effect of the respondent population
(customers vs. product development teams). Isolating the effect of social context is particularly
important because, in practice, the two techniques are used somewhat interchangeably by
individuals and groups. Groups may perform customer sorts when the number of available
respondents is very low, when there is significant time pressure, or when it is difficult to
1 In the customer sort technique (e.g., the Vocalyst® method) previously identified customer needs are printed on a deck of index cards that individual customers divide into categories. Data from the individual sorts are combined across customers and cluster analyzed to create a hierarchical category structure. In the affinity diagram technique (e.g., the KJ Diagram or the Language Processing™ Method, see Figure 1), customer needs are written on self-stick notes and a hierarchical category structure is created on a poster-sized sheet of paper by a group of participants working together.
4
motivate respondents.2 Conversely, the Center for Quality of Management argues that the
affinity diagram technique has “tremendous application for individual use” (Center for Quality of
Management 1996, p. 8) and several practitioners we talked to at organizations such as the QFD
Institute, Sun Microsystems, and Total Quality Engineering, Inc. reported using affinity diagrams
individually.
We, therefore, examine the effect of social context on the category structures created.
We examine the effects of categorizing customer needs individually or in a group setting and
prior experience in an individual or group setting on the breadth of categories created and the
hierarchical relationships defined among categories. This is an important area for research
because these variables are often ones that managers can control: managers can assign people to
work individually or in groups and decide whether people are trained individually or in groups.
We find that the categories defined by participants reflect the social context in addition to
participants’ tacit knowledge and understanding of the relationships among customer needs. This
kind of variation is a theoretically novel insight and unanticipated by voice of the customer
techniques.
Categorizing Customer Needs
The affinity diagram and the customer sort techniques are both based on classical
categorization tasks from psychology where participants are instructed to sort items based on
their perceived similarity (Tversky 1977). Team members creating an affinity diagram are asked
to group the needs “based on similarity of meaning” (Center for Quality of Management 1996, p.
39), while individuals using the customer sort technique are asked to group customer needs
based on whether they “fit with” or are “similar to” other needs (Griffin 1989). This shared basis
allows us to theoretically investigate the effect of social context on categorization using a
practically relevant application.
One way to conceptualize the voice of the customer process is to imagine that each
customer need being categorized has several dimensions. Not all of the dimensions are physical
features: some of the dimensions might be perceptual, some taxonomic and others thematic, and
the dimensions may not be independent. While some of these dimensions may be unique to one
customer need, other dimensions will be common to two or more needs. The greater the number
and the greater the salience of dimensions shared by two customer needs, the higher their
2 Personal communication with Robert Klein, Applied Marketing Science.
5
perceived similarity and the higher the likelihood that they will be grouped together as part of the
same category (Tversky 1977).
Recent research on categorization has moved away from the view that concepts within
the same category have certain objective features in common which are necessary conditions for
category membership (Cohen and Basu 1987). Instead, the content of the categories created
reflects categorizers’ theories about the world and past experiences (Murphy and Medin 1985,
Medin 1989) as well as their expertise (Johnson and Mervis 1997). For example, landscapers and
landscape architects categorize the same trees differently because of their different interests,
even though they are categorizing the same physical objects (Medin et al. 1997). Similarly,
Griffin and Hauser (1993) observed that affinity diagrams created by product development teams
reflected the way the product was designed and engineered, while the results from customer sorts
reflected the way customers used the product. Indeed, voice of the customer techniques are
designed to leverage differences in categorization across individuals, believing that differences in
the categories defined are subjective and informative rather than objective or inherent in the
customer needs being categorized. In other words, categorization provides information because
there are multiple ways to categorize the same set of items.
As customers group needs into categories they need to decide which needs to group
together and how many needs to combine into a single category. Consider, for example,
customer needs for a car such as “I don’t want to hear the engine running,” “very little noise
from the road,” “I can play my CDs,” and “music should have a full, rich sound.” The first two
needs might be combined into a category described as “interior of the car should be quiet”
whereas the second two might be combined into a category described as “car should have a high-
quality audio system.” Alternatively, they could all be combined into a single broad category
described as “I want music to sound great in my car.” In an affinity diagram, a third option
would be to develop a hierarchical category structure where the first two narrower categories are
combined into a higher-level category described as “I want music to sound great in my car.”
While information about both fine distinctions and broad similarities is likely to be
valued by the product development effort, categorization forces a tradeoff between these two
kinds of information. Making fine distinctions among customer needs requires ignoring
similarities among them (narrow categories), but focusing on broader similarities among the
needs requires ignoring distinctions among them (broad categories). More narrowly defined

6
categories can provide a better basis for linking customer need dimensions to specific product
features. If categories are defined too broadly, the product development effort can miss out on
important distinctions. On the other hand, if categories are defined too narrowly, the product
development effort may become focused on specific and potentially disjointed needs. As a result,
product engineers might not think about exterior noise in conjunction with the car’s sound
system. If customer needs are grouped into broader categories, or if multiple categories are
subsequently combined into higher-level categories, the product development effort might
become more integrative. The performance of the sound system, for example, might be viewed
as partially dependent on the reduction of exterior noise. Moreover, the product’s positioning and
marketing can be designed to focus on higher-level needs, mentioning themes rather than
specific product features.
In the absence of systematic biases due to variations in the task given to the participants,
this tradeoff should reflect the mental model of the categorizer. However, if the same
categorizers make this tradeoff differently in some contexts relative to others, the category
structures they create will reflect both their mental models of the content domain and the context.
Therefore, it is important to understand the effects of task characteristics on categorization.
Categorization by Groups and Individuals
Recent research on categorization has shown that the way individuals categorize concepts
is quite flexible, depending not only on their intuitive theories about the relationships among
concepts, but also on factors such as variations in task instructions and primes observed prior to
categorization (Blaye and Bonthoux 2001). For example, Lindman (1976) showed that after
participants had completed a priming task to identify similarities between items, they created
fewer (broader) categories for the same number of objects than a control group who had not
completed the priming task. In contrast, participants who had identified differences between
items identified more (narrower) categories for the same number of objects than the control
group. Blaye and Bonthoux (2001) demonstrated that showing five-year-olds a picture of an
object in either a taxonomic context (e.g., a fish with other animals) or thematic context (e.g., a
fish with a fishing pole) often induced them to change their mode of categorization from
taxonomic to thematic, or vice versa. Task characteristics can, therefore, have a biasing effect on
categorization.
Effects of Social Context
7
Social context is one of the most important but ignored task characteristics with respect to
categorization. Most of the research on categorization has used individuals or ignored the effect
of social context, and it is not known whether groups or individuals create systematically
different category structures. If all group members perceive the same relationships among the
items being categorized, a group should create the same category structure as the individual
group members. However, cross-functional product development teams are often constructed
specifically because the members have different levels of expertise or divergent perspectives
(Madhavan and Grover 1998) and group members may have different beliefs about the
relationships among items.
Heterogeneity in beliefs across group members about the salience of various dimensions
of customer needs should lead to the identification of more potential bases of similarity for
groups than for any one individual. On the surface, it may therefore appear that the likelihood of
combining any two needs into a category would be higher in a group than individual setting.
However, research using individuals has shown that the larger the number of dimensions used to
determine category membership, the more restrictive the criteria for category membership, and
the narrower the categories will be on average (Tversky 1977). Conversely, the smaller the
number of dimensions used to determine category membership, the broader the categories will
be. For example, grouping customer needs for a car based on their contribution to passengers’
safety alone will create broader categories on average than grouping them based on both their
contribution to passengers’ safety as well as their comfort. Therefore, we propose that
heterogeneity in beliefs across group members will reduce breadth of the categories created
precisely because of additional bases of similarity identified. As a result, categories created by
groups should be narrower and contain fewer customer needs than categories formed by
individuals.
To illustrate this argument further, consider the process of grouping customer needs into
categories. On the one hand, group members may agree that two needs are similar even if they
disagree about which dimension they share. For example, one group member may group the
needs “interior of the car should be quiet” and “there should be good back support” based on
safety because they both contribute to the driver’s alertness. Another group member may do so
because they provide comfort. In fact, previous research found that groups and individuals do not
perform differently when making pairwise similarity ratings (Hinsz et al. 1988). However, an
8
important difference between pairwise similarity ratings and categorization is that similarity
ratings allow group members to agree on a rating but for different reasons. It is the consideration
of multiple items simultaneously that causes this heterogeneity to become limiting. For example,
when the person who used safety as the basis for grouping the needs “interior of the car should
be quiet” and “there should be good back support” subsequently proposes to add the need “I
want to be able to continue to steer while applying the breaks,” this should be met by resistance
from the group member who had used comfort as the bases for grouping the same two needs and
initiate a discussion about the basis for putting the first two customer needs into the same
category.
In other words, a category structure created by a group requires communication among
group members to coordinate and integrate their contributions (Hirokawa and Johnston 1989)
and is the result of individuals coming to consensus over how to integrate their individual mental
representations (Carley 1986). Although individuals working independently can create a
category structure based on their own ideas about the similarity between concepts (Gardner and
Schoen 1962), categories created by a group cannot be based on connections that are only
meaningful to one of the group members. Because the goal of creating a category structure as a
group is to reflect a shared understanding of the relationships among items (Massey and Wallace
1996), group members must come to an agreement over which needs to combine into which
categories. This idea is paralleled in research on information use which suggests that, for
information to be the focus of attention in a group, there has to be a duplication in the
distribution of that information, thereby providing social validation of the accuracy and value of
this information (Stewart and Stasser 1995). The process of making tacit knowledge explicit in
groups should, therefore, reinforce the effect of heterogeneity in mental models on differences in
the way groups and individuals categorize customer needs. We therefore predict that:
Hypothesis 1: Individuals will categorize more integratively than groups.
Hypothesis 1 predicts that individuals will include more customer needs in each category,
creating broader categories on average. The same logic applies to generating the hierarchical
category structure of the affinity diagram. Hierarchical categorization is the process of iteratively
grouping categories at higher and higher levels of abstraction, providing the ability to specify
more different levels of relationship among the customer needs. Distinctions can be made using
lower-level categories, while broader similarities can be identified using higher-level categories.
9
In a sense, this turns the binary scale of category membership (same category vs. different
category) into a multi-valued scale, allowing the categorizer to convey more information. Based
on the above reasoning, individuals creating affinity diagrams should identify more hierarchical
relationships among categories by combining first-level categories into higher-level categories
than groups.
Effects of Prior Experience
Will individuals and groups always create systematically different category structures?
Because people tend to draw on past experiences when solving new problems seeing examples of
category structures with particular characteristics may influence the category structures people
create. People tend to incorporate features of examples they have seen into their creative
solutions to new problems (Marsh, Landau and Hicks 1996). For example, individuals who were
shown other people’s drawings before creating their own drawings were more likely to
incorporate features from these examples than individuals who were not shown others’ drawings,
an effect referred to as “unconscious plagiarism” (Marsh et al. 1996). Similarly, prior experience
with a technique may create expectations about the breadth or depth of categories to be created,
affecting the cutoff points used to determine category membership and leading to differences in
the category structures created. Thus, individuals may categorize in ways similar to groups when
their prior experience was in a group setting, and vice versa.
This carry-over effect may be especially prevalent with the affinity diagram technique,
because it provides a visual model of the category structure. If individuals and groups create
different category structures, prior experience working either individually or in a group may
leave participants with a different mental model of the appropriate category structure that they
carry with them to the next task. Prior experience using the affinity diagram technique may
create expectations about how the finished structure should look when using the same technique
again. Participants might create individual diagrams with group-like characteristics if their
previous experience with a technique was in a group. Similarly, a group might create a diagram
with individual-like characteristics if each of the group members had previously used the
technique individually. This issue is particularly relevant because participants are often trained
individually for group applications, and vice versa.
A related concept of ‘transfer’ between tasks performed in sequence has been
investigated in the organizational training literature (for a review, see Goldstein 1993).

10
Expectations for future performance appear to be especially influenced by factors such as the
visibility of output from a prior task (Hackman and Morris 1975). Thus, while previous studies
have not found evidence for transfer effects that are specific to learning tasks individually or in a
group (e.g., Laughlin and Sweeney 1982), the tasks examined did not involve the creation of
visual artifacts. In contrast, memory of the visible output from a previous task, such as an affinity
diagram, may have a particularly strong impact because it serves as an external cue. Thus, if
individuals and groups create different physical artifacts, as predicted by Hypothesis 1, their
previous experiences may affect their future performance. We therefore predict that there will be
structural similarities between a previous diagram created and a subsequent diagram created,
even across content domains. More formally,
Hypothesis 2: Previous experience creating affinity diagrams in a group or individual
setting will have carryover effects on the structure of subsequent diagrams created.
Hypothesis Testing
We tested our hypotheses using two techniques often used in practice, the customer sort
technique (e.g., the Vocalyst® method) and the affinity diagram technique (e.g., the KJ Diagram
or Language ProcessingTM Method). In study 1, we use the customer sort technique to test
Hypothesis 1, whether individuals systematically create broader categories than groups when
categorizing the same set of customer needs. In study 2, we use the affinity diagram technique to
test Hypothesis 1 as well as Hypothesis 2, whether previous experience creating a diagram either
individually or as part of a group has a systematic effect on the creation of subsequent affinity
diagrams. Finally, in a follow-up study, we examine a mechanism that may be responsible for the
effect of prior experience on categorization.
Study 1: Customer Sorts by Individuals and Groups
Method
Sixty-one paid undergraduate student participants were asked to sort customer needs for
food storage containers as part of a product development effort. Participants were randomly
assigned to conditions, with forty-four participants assigned to eleven groups of four participants
each and seventeen participants participating individually. Following procedures developed by
Griffin (1989, Griffin and Hauser 1993), participants were given instructions for the task and an
envelope of cards pre-printed with the customer needs. The 48 customer needs used were a
subset of the needs for food storage containers (i.e., picnic baskets) collected by Griffin (1989).
11
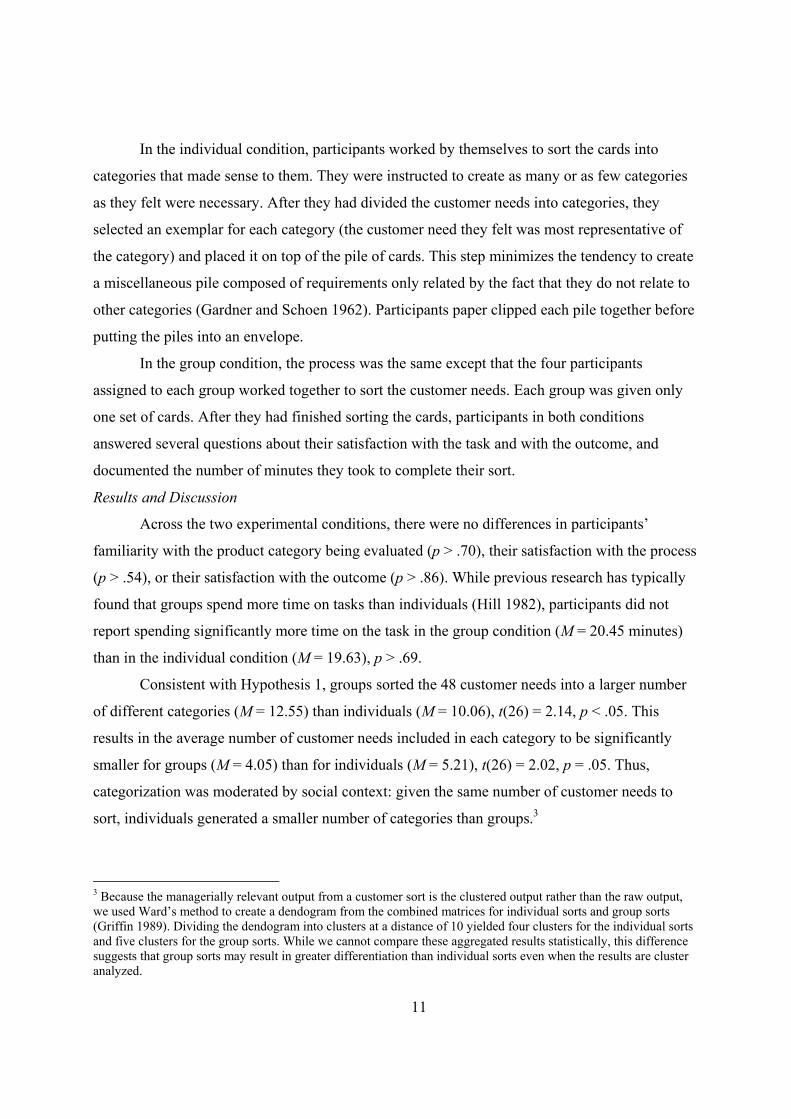
In the individual condition, participants worked by themselves to sort the cards into
categories that made sense to them. They were instructed to create as many or as few categories
as they felt were necessary. After they had divided the customer needs into categories, they
selected an exemplar for each category (the customer need they felt was most representative of
the category) and placed it on top of the pile of cards. This step minimizes the tendency to create
a miscellaneous pile composed of requirements only related by the fact that they do not relate to
other categories (Gardner and Schoen 1962). Participants paper clipped each pile together before
putting the piles into an envelope.
In the group condition, the process was the same except that the four participants
assigned to each group worked together to sort the customer needs. Each group was given only
one set of cards. After they had finished sorting the cards, participants in both conditions
answered several questions about their satisfaction with the task and with the outcome, and
documented the number of minutes they took to complete their sort.
Results and Discussion
Across the two experimental conditions, there were no differences in participants’
familiarity with the product category being evaluated (p > .70), their satisfaction with the process
(p > .54), or their satisfaction with the outcome (p > .86). While previous research has typically
found that groups spend more time on tasks than individuals (Hill 1982), participants did not
report spending significantly more time on the task in the group condition (M = 20.45 minutes)
than in the individual condition (M = 19.63), p > .69.
Consistent with Hypothesis 1, groups sorted the 48 customer needs into a larger number
of different categories (M = 12.55) than individuals (M = 10.06), t(26) = 2.14, p < .05. This
results in the average number of customer needs included in each category to be significantly
smaller for groups (M = 4.05) than for individuals (M = 5.21), t(26) = 2.02, p = .05. Thus,
categorization was moderated by social context: given the same number of customer needs to
sort, individuals generated a smaller number of categories than groups.3
3 Because the managerially relevant output from a customer sort is the clustered output rather than the raw output, we used Ward’s method to create a dendogram from the combined matrices for individual sorts and group sorts (Griffin 1989). Dividing the dendogram into clusters at a distance of 10 yielded four clusters for the individual sorts and five clusters for the group sorts. While we cannot compare these aggregated results statistically, this difference suggests that group sorts may result in greater differentiation than individual sorts even when the results are cluster analyzed.
12
Study 2: Effects of Prior Experience on Affinity Diagrams
In our second study, we test Hypothesis 1 again using the affinity diagram technique. In
addition, we test Hypothesis 2 by having participants create a series of two affinity diagrams. We
do so by having participants create a series of two affinity diagrams, one individually and one as
part of a four-person group. In one experimental condition, participants created an individual
diagram first followed by a group diagram. In a second condition, participants created a group
diagram first followed by an individual diagram. In a third control condition, participants created
two diagrams individually.
Method
Participants. One hundred twenty-five MBA students participated in two replications of
the experiment, with 48 students participating in the first replication and 77 students participating
in the second replication. In both cases, participants were customers or potential customers of the
service under consideration. Participants were paid for their participation.
Stimuli. To increase the relevance of the task for the participants, we ran this experiment
as two real market research projects. We collaborated with two organizations that provided
services used by the participants and agreed to incorporate participant input into their decision
making processes. We ran two successive replications of the experiment using the same design
but focusing on different services. For the first replication, participants considered customer
requirements for two parts of the course selection system used by MBA students. For the second
replication, participants considered improvements in two areas of an MBA major. We provided
participants with customer needs identified during previously conducted customer interviews,
allowing us to control for the set of customer needs available to the participants. Customer voices
were transcribed and pretested to create a set of 24 customer needs for each replication.
Following the method described by Burchill and Brodie (1997), eight customers were
interviewed for the first replication and 17 customers were interviewed for the second
replication.
Procedure. At the beginning of each 90-minute session, the process for creating an
affinity diagram was described to participants. Following this introduction, participants created
two affinity diagrams, one individually and one as part of a four-member team. For each
diagram, participants were given a set of self-stick labels describing customer needs, markers
and poster paper to diagram their conceptualization of student requirements for the service.
13
Participants were free to choose whether to include a need in the affinity diagram, how many
categories to create out of related needs, and whether to combine lower-level categories into
higher-level categories.
Participants who completed their first diagram individually completed their second
diagram as part of a four-member team, and vice versa. To disentangle exposure to the diagram
topic and exposure to a particular diagram structure, participants considered a distinct topic for
each diagram (for a similar manipulation, see Kim 1997). The topics of the diagrams were
counterbalanced so that half of the participants in each condition created individual diagrams for
a topic and half of the participants created group diagrams for that topic. Participants had the
same amount of time (30 minutes) to complete each of their two diagrams. After completing
each diagram, each participant wrote his or her proposed recommendation, allowing us to
measure the degree of consensus within the group, and answered a few questions about the
exercise (e.g., “I am satisfied with the proposed recommendation”; 1=disagree, 7=agree).
Dependent measures. Our experimental procedure resulted in the creation of a concrete
artifact, a poster-sized sheet of paper, which allowed us to capture the number of customer needs
included in the diagram, the average category size, and the degree of hierarchy. Average
category size was computed by dividing the number of customer needs included in the diagram
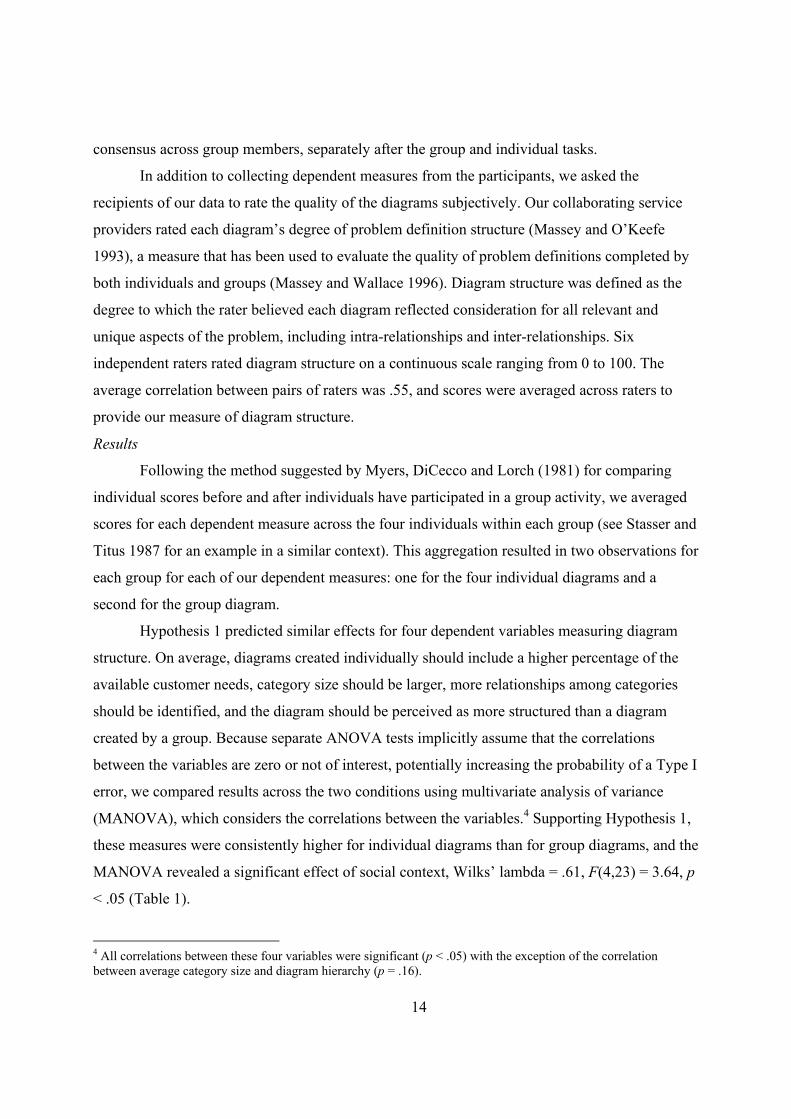
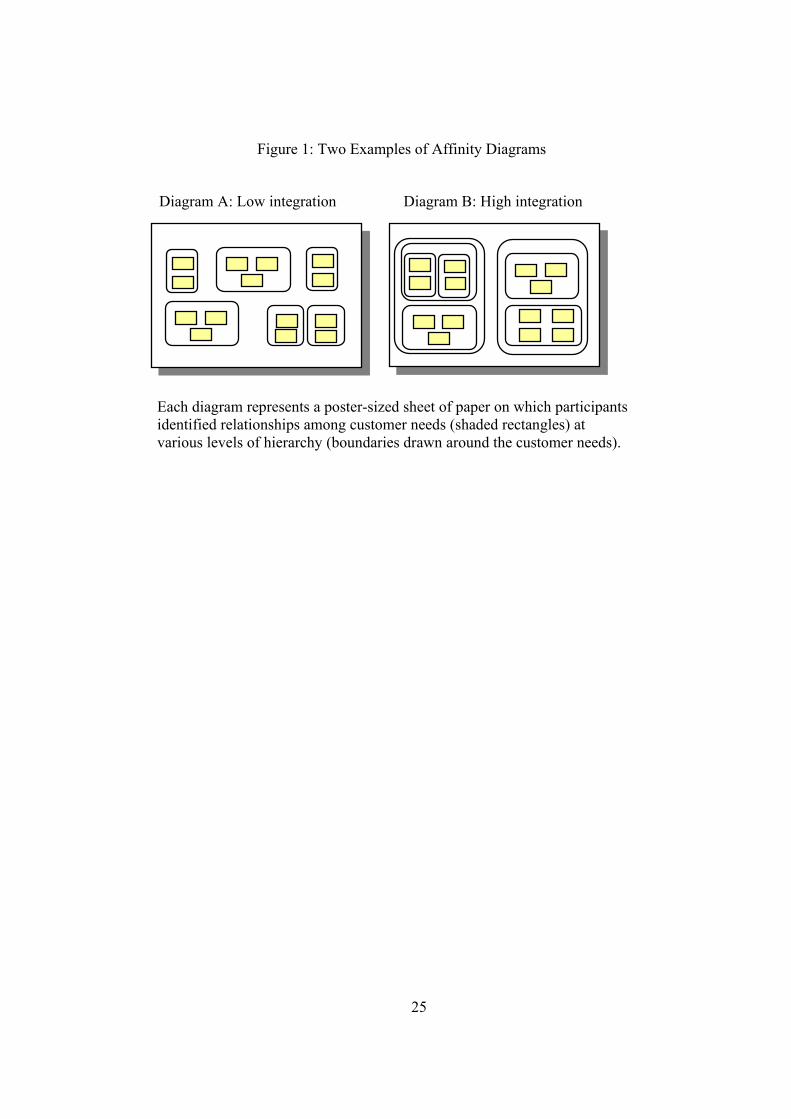
by the number of first-level categories defined. For example, in Figure 1, average category size is
equal to 14/6 for Diagram A (14 needs divided by 6 first-level categories) and 14/5 for Diagram
B. Analogous to the measure for average category size, we operationalized the degree of
hierarchy by counting the number of categories defined above the first level (i.e., categories of
categories) and dividing this number by the number of first-level categories available to be
categorized. For example, in Diagram B there are five first-level categories, two second-level
categories, and one third-level category. For this diagram, the degree of hierarchy is computed as
(2+1)/5.
After completing each diagram, participants were asked to make a recommendation to the
service provider and to rate their satisfaction with the recommendation on a seven-point scale.
The free-form recommendations were content analyzed by two independent raters by assigning
up to four of ten thematic codes defined for each diagram topic. There was 92% agreement in the
initial ratings and inconsistencies were resolved by discussion. We summed the pair-wise
matches in content codes across the four individuals in each group to compute our measure of
14
consensus across group members, separately after the group and individual tasks.
In addition to collecting dependent measures from the participants, we asked the
recipients of our data to rate the quality of the diagrams subjectively. Our collaborating service
providers rated each diagram’s degree of problem definition structure (Massey and O’Keefe
1993), a measure that has been used to evaluate the quality of problem definitions completed by
both individuals and groups (Massey and Wallace 1996). Diagram structure was defined as the
degree to which the rater believed each diagram reflected consideration for all relevant and
unique aspects of the problem, including intra-relationships and inter-relationships. Six
independent raters rated diagram structure on a continuous scale ranging from 0 to 100. The
average correlation between pairs of raters was .55, and scores were averaged across raters to
provide our measure of diagram structure.
Results
Following the method suggested by Myers, DiCecco and Lorch (1981) for comparing
individual scores before and after individuals have participated in a group activity, we averaged
scores for each dependent measure across the four individuals within each group (see Stasser and
Titus 1987 for an example in a similar context). This aggregation resulted in two observations for
each group for each of our dependent measures: one for the four individual diagrams and a
second for the group diagram.
Hypothesis 1 predicted similar effects for four dependent variables measuring diagram
structure. On average, diagrams created individually should include a higher percentage of the
available customer needs, category size should be larger, more relationships among categories
should be identified, and the diagram should be perceived as more structured than a diagram
created by a group. Because separate ANOVA tests implicitly assume that the correlations
between the variables are zero or not of interest, potentially increasing the probability of a Type I
error, we compared results across the two conditions using multivariate analysis of variance
(MANOVA), which considers the correlations between the variables.4 Supporting Hypothesis 1,
these measures were consistently higher for individual diagrams than for group diagrams, and the
MANOVA revealed a significant effect of social context, Wilks’ lambda = .61, F(4,23) = 3.64, p
< .05 (Table 1).
4 All correlations between these four variables were significant (p < .05) with the exception of the correlation between average category size and diagram hierarchy (p = .16).

15
Though several of the individual contrasts failed to reach significance, the overall pattern
of results for the first diagram suggests that whether a diagram is created by an individual or by a
group affects its structure. Simple comparisons show that, for the first diagram, individuals used
a higher percentage of the available customer needs in their diagrams (M = .86) than did
interactive groups (M = .65), F(1,26) = 15.60, p < .001. Average category size was directionally
higher for individual diagrams (M = 3.29) than for interactive group diagrams (M = 2.97),
F(1,26) = 1.38, p < .30. Individual diagrams were directionally more hierarchical (M = .40) than
interactive group diagrams (M = .30), p < .20. The average (normalized) structure ratings for
individual diagrams (M = .20) were directionally higher than the ratings for interactive group
diagrams (M = -.27), F(1,26) = 2.62, p < .20.
Hypothesis 2 predicted that prior experience with the first diagrams participants created
would influence the structure of their second diagrams, and that these expectations would
attenuate differences between groups and individuals. We tested Hypothesis 2 by assessing the
degree to which there was a transfer of experience effect between the first and second diagrams.
Following the technique used by Laughlin and Sweeney (1977) to examine transfer across
individual and group tasks, we defined two sequences in which diagrams were created,
individual-group and group-individual. We isolated the sequence effect and the effect of
group/individual context using a repeated-measures MANOVA with social context as a repeated
factor and sequence as a between-participant factor. As predicted, the MANOVA revealed a
significant main effect of sequence, Wilks’ lambda = .44, F(4,23) = 7.38, p < .001 (Table 1).
This significant sequence effect indicates that participants were systematically affected by their
prior experiences.
Structural measures of the diagrams were consistently higher when individual diagrams
were created first and group diagrams were created second than when group diagrams were
created first and individual diagrams were created second. To test Hypothesis 2 for each of the
dependent measures, we ran a repeated measures GLM in which social context was a repeated
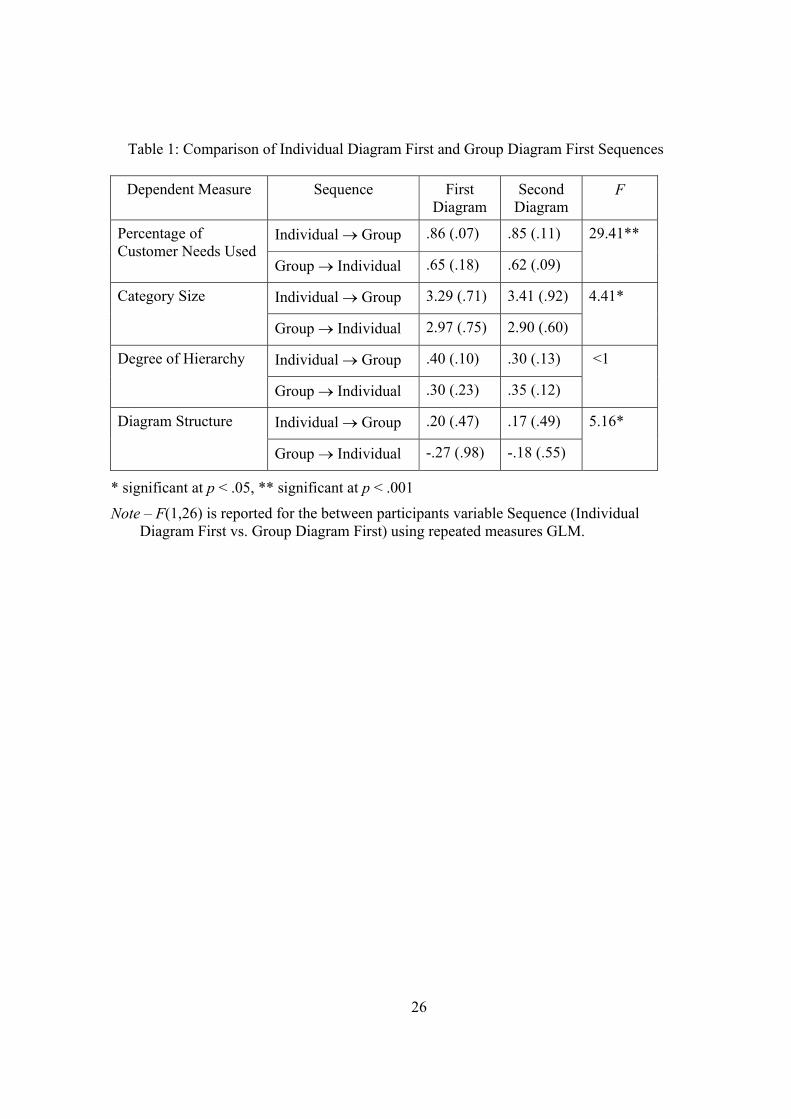
factor and sequence was a between-participant factor. The percentage of customer needs
included in each diagram was larger when individual diagrams were created first and group
diagrams were created second than when group diagrams preceded individual diagrams, F(1, 26)
= 29.41, p < .001, and no other effects were significant. Similarly, average category size was
greater for both diagrams when individual diagrams were created first and group diagrams were

16
created second than when group diagrams preceded individual diagrams, F(1, 26) = 4.41, p <
.05, and no other effects were significant. Diagram structure was rated higher by the users of the
data for both diagrams when individual diagrams preceded group diagrams than when group
diagrams preceded individual diagrams, and only the between-participant main effect for
sequence was significant, F(1, 26) = 5.16, p < .05. In contrast to the other three dependent
variables and our predictions, the within-participant main effect of group/individual context was
significant for the degree of hierarchy, F(1,26) = 5.30, p < .05, indicating that individual
diagrams were more hierarchical than group diagrams regardless of the sequence in which
diagrams were created. In this analysis, the between-participant main effect for sequence (group
diagram first vs. individual diagram first) was not significant, p > .63.
We also examined other managerially relevant variables. Reasons often cited for using
teams is that group performance of a task may lead to higher consensus, coordination of
activities, or better mutual understanding of a problem among group members via the
development of shared mental models (Larson and Christensen 1993). Supporting these claims,
consensus was systematically higher among recommendations written after participants had
created a group diagram (M = 6.78) than after the same four participants had created diagrams
individually (M = 4.89). The within-participant main effect for social context was significant,
F(1, 25) = 4.89, p < .05, and no other effects, including the between-participants main effect for
sequence, were significant, all ps > .25.
Group member satisfaction is another important criterion for team effectiveness
(Hackman 1987). It is interesting to note that regardless of the sequence in which diagrams were
created, satisfaction with final recommendations was significantly higher after completing
individual diagrams (M = 5.73) than after completing group diagrams (M = 5.19), F(1,24) = 4.20,
p < .05, with no significant interactions for other variables.
Discussion
Study 2 demonstrated that category structure does not emerge entirely from the concepts
themselves, but that it is sensitive to contextual factors. As in study 1, groups and individuals
created systematically different category structures when they completed their first affinity
diagram. However, participants’ expectations about the category structure, formed as they
completed their first affinity diagram, seemed to systematically affect the structure of the second
affinity diagram they completed. These results are particularly interesting because they suggest

17
that the effect of social context can be dominated by the participants’ expectations about the
structure of the finished diagram.
It is important to note that although the sequence in which the diagrams were created had
a significant effect on diagram structure, order per se – whether diagrams were created first or
second – cannot explain these results. We see very different trends for group and individual
diagrams produced second relative to diagrams produced first. Results in the two test conditions
can be compared with the results of the control condition, in which participants created two
individual diagrams. In the control condition, there was no difference in the percentage of
customer needs included in the first (M = .87) and second diagrams (M = .89), p > .53.
Moreover, the percentage of available customer needs included in the first diagram by
individuals in the control condition (M = .85) did not differ from the percentage of customer
needs included in the first diagram by individuals in the test condition (M = .83), t(14) =.43 , p >
.67. In contrast, the percentage of customer needs individuals in the control condition included in
their second diagram (M = .89) was significantly greater than the percentage of customer needs
individuals in the group-individual test condition included in their second diagrams (M = .63),
t(14) = 4.21, p < .001. The other three structural measures show the same pattern, suggesting that
the structure of affinity diagrams is experience dependent rather than order dependent.
We proposed that the visual outputs from the first affinity diagram, even though no
longer available for inspection, would facilitate the transfer across social contexts (Hackman and
Morris 1975). In order to explicitly test the premise that a visual model alone could bias
participants’ outputs, we recruited an additional 36 paid MBA students who individually
participated in a follow-up study. All participants were given identical written instructions for
completing their diagrams, explicitly informing them that they could include as many customer
needs as they thought were relevant, and that they could include as many customer needs as they
wanted to include in each category. However, half of the participants were provided with a visual
example of an affinity diagram that was low in integration (Figure 1, Diagram A) – diagrams
using fewer of the available customer needs, including fewer customer needs in each category,
and identifying fewer relationships among categories – whereas half were provided with a high
integration example (Figure 1, Diagram B). The visual example was for a shaving cream and the
affinity diagram was created using 20 needs for improvement in an MBA major.
We found that participants who observed the high integration model created diagrams

18
that included a higher percentage of the available customer needs (M = 86% vs. 75%), defined
broader categories (M = 3.95 vs. M = 3.03), and identified more hierarchical relationships among
categories (M = .40 vs. M = .27) than participants who observed the low integration model.
Across these dependent measures, a MANOVA revealed a significant effect of the model
observed, Wilks’ lambda = .74, F(3,32) = 3.67, p < .05. These results, therefore, support the
notion that a visual example alone can create expectations that bias participants’ outputs.
General Discussion
The results of two studies suggest that the process of categorizing concepts in a group
setting and expectations about the structure can change the information transmitted by
individuals via the category structure. Categorization behavior is sensitive to contextual factors,
such as working individually or in a group and prior experience working individually or in a
group. These factors often vary across applications of voice of the customer techniques that are
based on the classical process of categorization (Tversky 1977). Our findings therefore provide
novel theoretical implications with direct practical relevance. When using both the customer sort
technique (study 1) and the affinity diagram technique (study 2), groups had a tendency to
categorize less integratively, creating narrower categories and identifying fewer relationships
among categories. This may appear surprising, given that group heterogeneity should lead to the
identification of additional bases of similarity. However, as we argue, it is this very
heterogeneity across group members (Tversky 1977), reinforced by the need to achieve group
consensus (Carley 1986, Massey and Wallace 1996), that should limit category breadth.
Study 2 and its follow-up study further suggest that category structure may not emerge
entirely from customer needs themselves, but also from the participants’ mental models of the
desired category structure. In study 2, prior experience in a group induced individuals to create a
second category structure that had group-like characteristics, and vice versa. Those who had
previously created a diagram individually produced more highly integrated affinity diagrams
when they worked as part of a group. Those who had previously created a diagram as part of a
group produced less integrated affinity diagrams when they worked individually. These findings
suggest that under certain conditions, expectations about category structure may dominate the
effects of social context. Our follow-up study suggests that this effect may have been facilitated
by the visual nature of the outputs created.
It is worth noting that a limitation of our findings is that the effect of prior experience
19
was observed in a single experimental session. The effect of delay would be a valuable topic for
future research. Interestingly, in a previous study, participants’ conformity to the examples they
had seen increased rather than decreased relative to the no delay condition when there was a one
day delay between seeing examples and drawing their own pictures (Marsh et al. 1996).
Conclusions and Managerial Implications
The results from voice of the customer techniques are inputs to product design,
interfunctional planning and communications, and marketing communications. The category
structures created using these techniques are often used as a basis for assigning responsibilities in
the product development process (Griffin and Hauser 1993) and people naturally begin to
communicate using the category labels assigned in group settings (Markman and Makin 1998).
Results of customer sorts and affinity diagrams also may be used to design customer research
and communications. Voice of the customer techniques may highlight perceived interactions
among the features of a product or indicate the level of abstraction at which consumer perceive
product benefits. For example, they may identify quality dimensions as perceived by customers.
Thus, differences in the way customer needs are interpreted can have a significant effect on the
way products are designed and marketed.
An important conclusion from our research is that variation in social context and
environmental cues can bias the customer’s voice. Our findings suggest that managers should
consider the social context both when training people to use these techniques and when
interpreting the results from voice of the customer techniques, and they should carefully choose
the visual examples used to train people to create affinity diagrams. The structure of affinity
diagrams – the size of the categories and the number of hierarchical levels – is important because
this structure influences how people talk about the results and how tasks are assigned. When
affinity diagrams are used as inputs to downstream processes, the size of the categories affects
variables such as the number of judgments required in prioritizing the customer needs.5 There is
also some indication that the number of categories created in a customer sort is important to
managers. Before the results are cluster analyzed, the number of categories created are often used
to weight the input of individual respondents (Griffin and Hauser 1993).
While it is unclear whether broad or narrow categorization provides more important
information to the product development effort, it is clear that more hierarchical category
5 Personal communication with Richard Zultner, QFD Institute.
20
structures provide more information. If narrow categories that identify distinctions among
customer needs are grouped into higher-level categories that identify broad similarities among
the needs, both perceived similarities and perceived differences can be conveyed by the category
structure. Of particular interest, then, is the finding that both examples of high integration
category structures and prior individual experience creating affinity diagrams seem to increase
the degree of hierarchy in the diagrams created.
To interpret the voice of the customer with clarity, it is important to understand the
moderating factors that can affect the results of voice of the customer techniques. It is clear that
the categorization of customer needs is sensitive to whether the categorization is performed
individually or in a group and to the examples observed prior to categorization. It is therefore
possible to leverage the opportunities these moderating factors present. If learning to use a
categorization technique individually or as part of a group has lasting effects on the use of the
technique, managers might consider training teams individually to retain individual-like traits in
team settings, or vice versa. Using individual training for a group application may, for example,
lead to a highly integrated categorization of customer needs while maintaining a high degree of
consensus and buy-in among group members. The results of our follow-up to study 2 also
suggest that after observing diagrams with particular structural characteristics, people have a
tendency to replicate these structural characteristics when categorizing customer needs, even
when the topics are unrelated. Thus, selecting and presenting examples of desired category
structures represents a second control variable.
Finally, when designing and evaluating new techniques, it is important to understand the
factors that make the existing techniques effective. Since voice of the customer techniques were
introduced to manufacturing firms over twenty years ago, there has been a proliferation of
methods for applying these techniques, and it is likely that new techniques will continue to be
introduced. For example, the trend toward virtual teams suggests that product development teams
may have an increasing desire to aggregate inputs from individual members in the future. As
technology makes it possible for product development teams to collaborate in new ways, new
product development tools may replace those currently used. For example, a representative of
BaRaN Systems emphasized that their software program Affinity Diagram for ExcelTM allows
team members to create hierarchies in spreadsheet form and then email them to another team
member for aggregation into a team-level hierarchy. Knowing that groups and individuals

21
categorize customer needs differently is an important consideration in evaluating the costs and
benefits of using such a technique.

22
References
Blaye, Agnes and Francoise Bonthoux (2001). “Thematic and Taxonomic Relations in
Preschoolers: The Development of Flexibility in Categorization Choices,” Journal of
Developmental Psychology, 19, 395-412.
Burchill, Gary and Christine H. Brodie (1997). Voices into Choices: Acting on the Voice of the
Customer. Madison, WI: Joiner Associates, Inc.
Carley, Kathleen (1986). “An Approach for Relating Social-Structure to Cognitive Structure,”
Journal of Mathematical Sociology, 12(2), 137-189.
Center for Quality of Management (1996). The Language Processing Method. Cambridge, MA:
Center for Quality of Management.
Christiano, John J., Jeffrey K. Liker and Chelsea C. White (2000). “Customer-Driven Product
Development Through Quality Function Deployment in the U.S. and Japan,” Journal of
Product Innovation Management, 17, 286-308.
Cohen, Joel B. and Kunal Basu (1987). “Alternative Models of Categorization: Toward a
Contingent Processing Approach,” Journal of Consumer Research, 13(March), 455-472.
Gardner, Riley W. and Robert A. Schoen (1962). “Differentiation and Abstraction in Concept
Formation,” Psychological Monographs, 76.
Goldstein, Irwin L. (1993). Training in Organizations: Needs Assessment, Development, and
Evaluation. Pacific Grove, CA: Brooks/Cole Publishing Co.
Griffin, Abbie (1989). Functionally Integrating New Product Development, Unpublished
doctoral dissertation, Massachusetts Institute of Technology.
Griffin, Abbie and John R. Hauser (1993). “The Voice of the Customer,” Marketing Science, 12,
1-27.
Hackman, J. Richard (1987). “The Design of Work Teams,” in Handbook of Organizational
Behavior, J. W. Lorsch (ed.), Englewood Cliffs, NJ: Prentice-Hall.
Hackman, J. Richard and Charles G. Morris (1975). “Group Tasks, Group Interaction Process,
and Group Performance Effectiveness: A Review and Proposed Integration,” in Advances
in Experimental Social Psychology, L. Berkowitz (ed.), New York: Academic Press.
Hill, Gayle W. (1982). “Group Versus Individual Performance: Are N+1 Heads Better Than
One?” Psychological Bulletin, 91(3), 517-539.
Hinsz, Verlin B., David A. Vollrath, Dennis H. Nagao and James H. Davis (1988). “Comparing
23
the Structure of Individual and Small Group Perceptions,” International Journal of Small
Group Research, 4, 159-68.
Hirokawa, Randy Y. and Dierdre D. Johnston (1989). “Toward a General Theory of Small Group
Decision Making: Development of an Integrated Model,” Small Group Behavior, 20(4),
500-523.
Johnson, Kathy E. and Carolyn B. Mervis (1997). “Effects of Varying Levels of Expertise on the
Basic Level of Categorization,” Journal of Experimental Psychology: General, 126(3),
248-277.
Kim, Peter H. (1997). “When What You Know Can Hurt You: A Study of Experiential Effects
on Group Discussion and Performance,” Organizational Behavior and Human Decision
Processes, 69, 165-177.
Larson, James R. Jr. and Caryn Christensen (1993). “Groups as Problem-Solving Units: Toward
a New Meaning of Social Cognition,” British Journal of Social Psychology, 32, 5-30.
Laughlin, Patrick R. and James D. Sweeney (1977). “Individual-to-Group and Group-to-
Individual Transfer in Problem Solving,” Journal of Experimental Psychology: Human
Learning and Memory, 3, 246-254.
Lindman, Ralf (1976). “Einstellung as a Determinant of Equivalence Range,” Perceptual and
Motor Skills, 42(2), 522.
Madhavan, Ravindranath and Rajiv Grover (1998). “From Embedded Knowledge to Embodied
Knowledge: New Product Development as Knowledge Management,” Journal of
Marketing, 62, 1-12.
Markman, Arthur B. and Valerie S. Makin (1998). “Referential Communication and Category
Acquisition,” Journal of Experimental Psychology: General, 127(4), 331-354.
Marsh, Richard L., Joshua D. Landau and Jason L. Hicks (1996). “How Examples May (and
May Not) Constrain Creativity,” Memory & Cognition, 24(5), 669-680.
Massey, Anne P. and Robert M. O’Keefe (1993). “Insights from Attempts to Validate a Multi-
Attribute Model of Problem Definition Quality,” Decision Sciences, 24, 106-125.
Massey, Anne P. and William A. Wallace (1996). “Understanding and Facilitating Group
Problem Structuring and Formulation: Mental Representations, Interaction, and
Representation Aids,” Decision Support Systems, 17, 253-274.
Medin, Douglas L. (1989). “Concepts and Conceptual Structure,” American Psychologist,
24
44(12), 1469-1481.
Medin, Douglas L., Elizabeth B. Lynch, John D. Coley and Scott Atran (1997). “Categorization
and Reasoning Among Tree Experts: Do All Roads Lead to Rome?” Cognitive
Psychology, 32(1), 49-96.
Murphy, Gregory L. and Douglas L. Medin (1985). “The Role of Theories in Conceptual
Coherence,” Psychological Review, 92(3), 289-316.
Myers, Jerome L., Joseph V. DiCecco, Robert F. Lorch (1981). “Group Dynamics and Individual
Performances: Pseudogroup and Quasi-F Analyses,” Journal of Personality and Social
Psychology, 40, 86-98.
Shiba, Shoji, Alan Graham and David Walden (1993). A New American TQM: Four Practical
Revolutions in Management. Portland, OR: Productivity Press.
Stasser, Garold and William Titus (1987). “Effects of Information Load and Percentage of
Shared Information on the Dissemination of Unshared Information During Group
Discussion,” Journal of Personality and Social Psychology, 53, 81-93.
Stewart, David D. and Garold Stasser (1995). “Expert Role Assignment and Information
Sampling During Collective Recall and Decision Making,” Journal of Personality and
Social Psychology, 69, 619-628.
Tversky, Amos (1977). “Features of Similarity,” Psychological Review, 84, 327-352.
Urban, Glen L. and John R. Hauser (1993). Design and Marketing of New Products. Englewood
Cliffs, NJ: Prentice-Hall.
25
Figure 1: Two Examples of Affinity Diagrams
Diagram A: Low integration Diagram B: High integration
Each diagram represents a poster-sized sheet of paper on which participants identified relationships among customer needs (shaded rectangles) at various levels of hierarchy (boundaries drawn around the customer needs).
26
Table 1: Comparison of Individual Diagram First and Group Diagram First Sequences
Dependent Measure Sequence First Diagram
Second Diagram
F
Individual → Group .86 (.07) .85 (.11) Percentage of Customer Needs Used
Group → Individual .65 (.18) .62 (.09)
29.41**
Individual → Group 3.29 (.71) 3.41 (.92) Category Size
Group → Individual 2.97 (.75) 2.90 (.60)
4.41*
Individual → Group .40 (.10) .30 (.13) Degree of Hierarchy
Group → Individual .30 (.23) .35 (.12)
<1
Individual → Group .20 (.47) .17 (.49) Diagram Structure
Group → Individual -.27 (.98) -.18 (.55)
5.16*
* significant at p < .05, ** significant at p < .001
Note – F(1,26) is reported for the between participants variable Sequence (Individual Diagram First vs. Group Diagram First) using repeated measures GLM.