interpolation methods for the calibration of rainfall- runoff models … · ·...
TRANSCRIPT
Interpolation methods for the calibration of rainfall-runoff models in ungauged basins
V.T.G. Boulomytis a,b, A.C. Zuffo b, and M.A. Imteaz a
a Department of Civil & Construction Engineering, Swinburne University of Technology, Hawthorn, VIC, Australia, and b School of Civil Engineering, Architecture and Urban Design, State University of Campinas,
Campinas, Brazil. Email: [email protected]
Abstract: Meteorological data are essential for the calibration of rainfall-runoff models and the acquisition of reliable outcomes. The rainfall spatial and temporal variability is not easily detected when the number of rain gauges is insufficient or when they are improperly distributed. In addition, the effect of orographic rain near mountainous areas or other local phenomena may not be effectively assessed in a large-scale approach, or by geostationary satellites, such as the Tropical Rainfall Measuring Mission (TRMM). Remote sensing and geoprocessing techniques have been widely used for the spatial analysis of rainfall data, which may come from similar or different sources and formats (vector or raster). Data are commonly integrated and processed by the use of interpolation methods in geographic information systems (GIS). The aim of this study was to achieve properly distributed rainfall data for the calibration of a rainfall-runoff model. The study area is located in the Juqueriquere River Basin, Caraguatatuba municipality, on the northern coastline of Sao Paulo, Brazil. The area is not properly gauged and is influenced by orographic rainfalls due to the nearness to the Serra do Mar Mountains. The analysed precipitation was on the 17th of March, 2013, when the downstream area of the basin was flooded. Data from different sources were assembled to ideally represent the entire area, including the Data Collecting Platform (PCD) 32521, the rain gauges EMQAR1 and EMQAR2 and TRMM. Using GIS techniques and spatial analysis, tests were done for the most intense rainfall period data sets using assorted multivariate interpolators (inverse distance weighting, spline, and kriging). The statistical analysis revealed that the best performance was for the kriging method, taking into consideration the lowest standard deviation for the sample processing. Thus, it was the chosen technique for the rainfall interpolation. A map with rainfall data was generated for the basin with the mean precipitation of every 3h, which was then integrated with the 11 subbasin maps. A 24h period was processed, starting at 3 a.m. (17 to 18 of March 2013), totalling 88 maps with mean precipitation values, and a 24h rainfall hydrograph for each subbasin. The proposed methodology provided more reasonable and well-distributed rainfall data than each separate collecting device, which could not detect the local effect of the orographic rain on the plains in the downstream area.
Keywords: Interpolation, rainfall-runoff models, kriging, calibration, statistical analysis
22nd International Congress on Modelling and Simulation, Hobart, Tasmania, Australia, 3 to 8 December 2017 mssanz.org.au/modsim2017
1670
Boulomytis et al., Interpolation methods for the calibration of rainfall-runoff models in ungauged basins
1. INTRODUCTION
The meteorological data processing is essential for the rainfall/runoff modelling. A model can only provide reliable runoff outcomes when rainfall input data have the same quality. Besides the spatial and temporal variability of precipitation, orographic rainfalls may also affect the randomness of local events, especially if the rain gauges are not properly distributed or historical data is not available.
For technical reasons, it is very common for rain gauges to be in accessible locations, near urbanised areas, not providing representative spatial data for large basins. Recently, interpolation techniques have been applied to maximize the spatial and temporal representativeness of these local rain gauges towards the entire basin. Many studies combine vectorial data from rain gauges with the raster data of TRMM using spatial analysis (Collischon et al. 2007, Huffman et al. 2007, Pereira et al. 2013, and Rozante et al. 2010), where rainfall data are limited or the number of rain gauges is not sufficient to represent the basin (Rahman et al. 2011).
Several interpolators have been widely used in geographic information systems for spatial analysis, such as the Inverse Distance Weighted (IDW), spline and kriging. The IDW is a deterministic interpolation method, used to calculate new values by the average values of the neighbourhood points of each cell. The shorter distance the point is from the central point of the cell, the more influential it will be in the interpolation process. The spline method is also deterministic and is based on minimising the curvature between points by the use of mathematical equations, resulting in a smoother surface passing through the exact cell point.
Kriging is an advanced statistical interpolation method that generates a new surface from the initial cell points. As for the IDW, it is based on the distance between the cell points and their predicted location, but also on their general spatial distribution in the cell (Bohling 2005 and Dubrule 1983).
There are two types of kriging models: ordinary and universal (or with a trend). The ordinary is the default method, where the mean value is not known. When the data follow a dominant trend, the universal method might be used, which is modelled by a polynomial function. By subtracting the polynomial from the set of points, the random errors are autocorrelated until the model is fit. It is also important to fit the data into an empirical semi variogram, which shows the autocorrelation of the predicted points, similar to a regression analysis that fits a line into a set of points. The predictions are evaluated to see if the variances are positive. Different mathematical models are used for the selection of the empirical semivariograms, such as the circular, spherical, exponential, Gaussian and linear (Bohling 2005, Dubrule 1983 and Oliver 1990).
The purpose of this study was to interpolate the local data of a PCD and two rain gauges with the TRMM data, in order to achieve a rainfall specific hydrograph for each sub-basin, in 3h intervals for the 24h event (between 3 am of 17th and 18th of March 2013).
2. MATERIAL AND METHODS
2.1. Study area
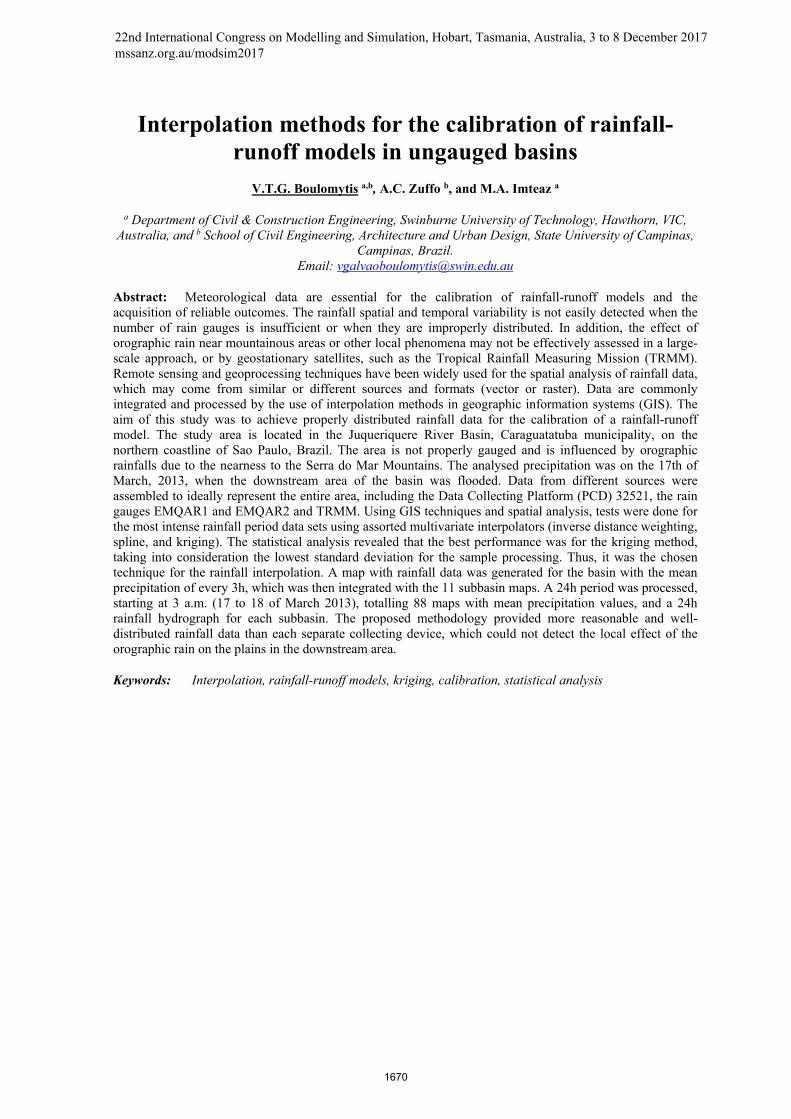
The study area corresponds to the upstream sector of the Juqueriquere River Basin in the municipality of Caraguatatuba, Sao Paulo, Brazil. It comprehends the area of 358.87 km², divided into 11 sub-basins (Boulomytis et al. 2017) (Figure 1).
Figure 1. Study area, Caraguatatuba, SP, Brazil (Source: Adapted from Boulomytis et al. 2017).
1671
Boulomytis et al., Interpolation methods for the calibration of rainfall-runoff models in ungauged basins
The weather is tropical and rainy, especially in the summer. The average annual temperature is 25º C, and the average annual precipitation is 1652.8 (between 1977 and 2015). There is a significant influence of orographic rain in the plains, as they are surrounded by Serra do Mar mountains, with an altitude of up to 1,327 m. The available rainfall data is not well distributed, covering just part of the downstream area.
2.2. Proposed methodology
The event on the 17th of March 2013 caused severe floods in the plains of the Juqueriquere river basin, especially in the upstream area. For calibration purposes of rainfall/runoff models, it would be an ideal event, as local farmers recorded the water level of several flood locations.
During the event, the available rainfall records referred to the PCD 32521 (accumulative every 3 hours), and the EMQAR1 and EMQAR2 rain gauges (accumulative every hour). However, the distribution of these stations could only cover the downstream areas of the basin, and the rainfall data from the rain gauges were very discrepant. Even though the EMQAR1 and EMQAR2 rain gauges were only 8 km distant from each other, the accumulative precipitation of the event was 247.20 mm and 134.00 mm, respectively. Whilst the precipitation of the EMQAR1 rain gauge represented a 42-year return period, the data from the EMQAR2 rain gauge was equivalent to a 3-year return period, according to the IDF equation of Caraguatatuba (Department of Water and Electric Energy of the State of Sao Paulo – DAEE 2016), for the E2-046 rain gauge located in the same basin.
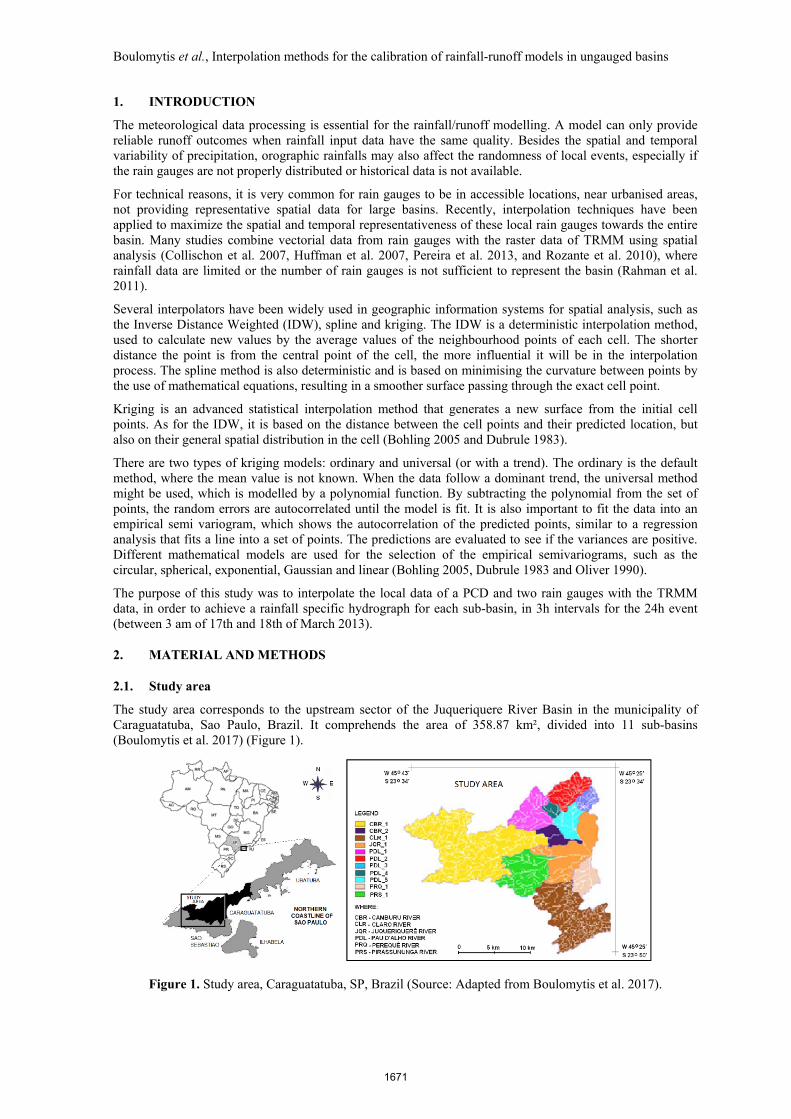
Thus, the TRMM data (accumulative every 3 hours) were interpolated with the accumulative data of the other stations using spatial analysis at ArcGIS v.10 software. The TRMM grid and the other stations are shown in Figure 2.
Figure 2. Spatial distribution of the TRMM grid, PCD and rain gauges.
For the statistic analysis, the six samples that represented the most intense rainfall periods were tested with the following interpolators: Inverse Distance Weighting (IDW), spline, and kriging. The samples were chosen from the total population of 8 groups (each one with a 3h period) and had 65,511 points to be interpolated from the TRMM grid, the PCD and the rain gauges.
The chosen interpolator was the one that had the majority of lower standard deviations. Similar statistic analyses were employed by Chen & Liu (2012), Githungo et al. (2016), Haberlandt (2006), Rahman et al. (2011), and Wagesho et al. (2013).
The data of every 3 hours was interpolated, resulting in a map per sub-basin. The total of 8 maps was built for the 11 sub-basins regarding the 24h event, totalizing 88 maps. From the mean value of each map, we could build a rain hydrograph for every sub-basin, providing the necessary information for future hydrological modelling.
3. RESULTS AND DISCUSSION
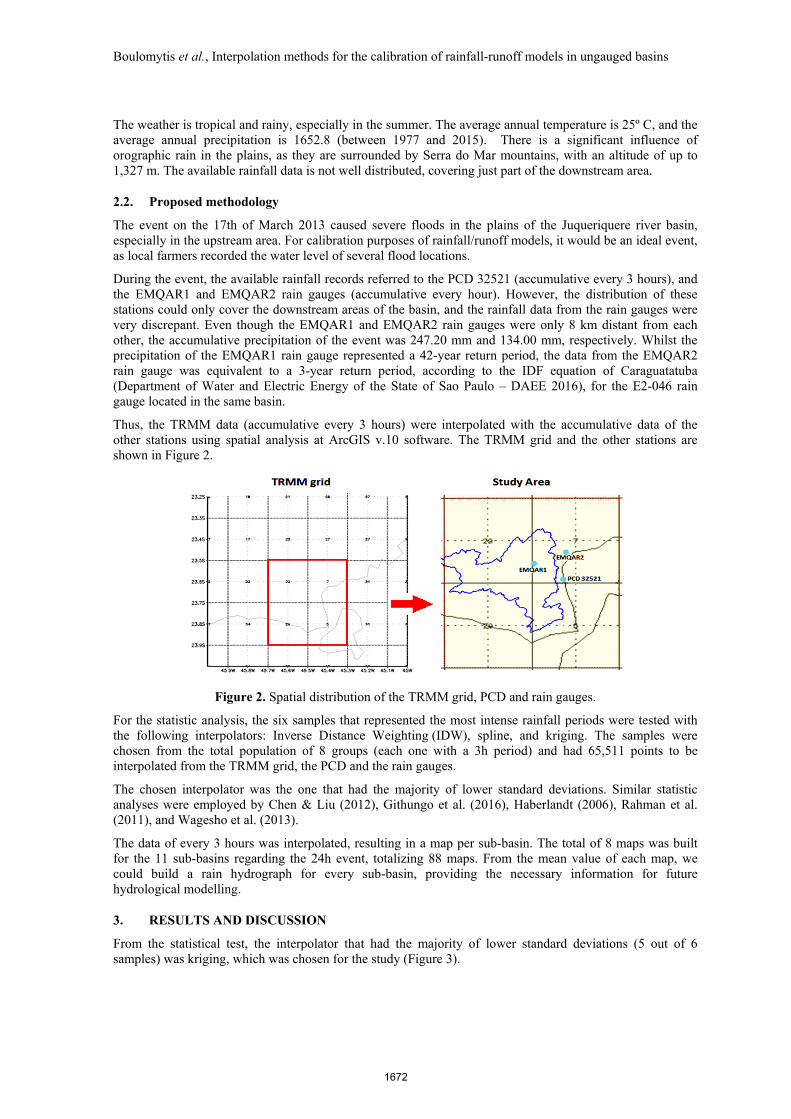
From the statistical test, the interpolator that had the majority of lower standard deviations (5 out of 6 samples) was kriging, which was chosen for the study (Figure 3).
1672
Boulomytis et al., Interpolation methods for the calibration of rainfall-runoff models in ungauged basins
Figure 3. Statistic analysis of the interpolators.
The ordinary kriging was developed in a spherical model as it was the model that best fit into the empirical semi variogram for the largest distances within the cell range.
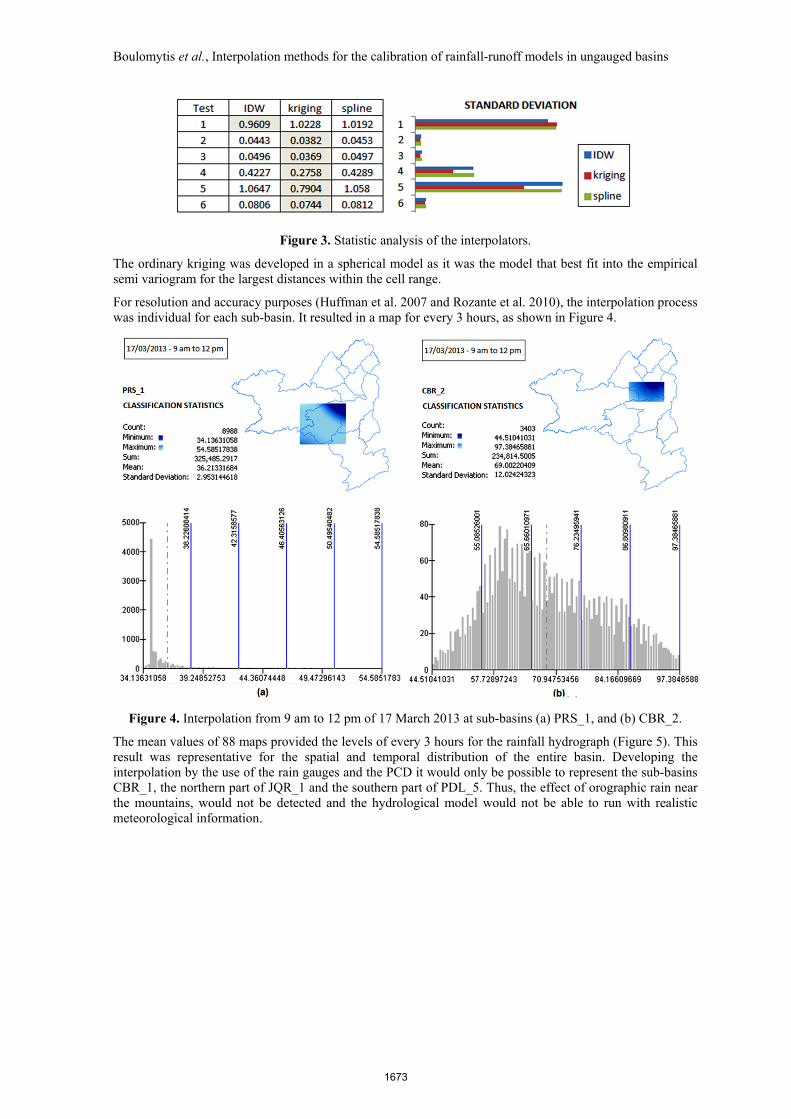
For resolution and accuracy purposes (Huffman et al. 2007 and Rozante et al. 2010), the interpolation process was individual for each sub-basin. It resulted in a map for every 3 hours, as shown in Figure 4.
Figure 4. Interpolation from 9 am to 12 pm of 17 March 2013 at sub-basins (a) PRS_1, and (b) CBR_2.
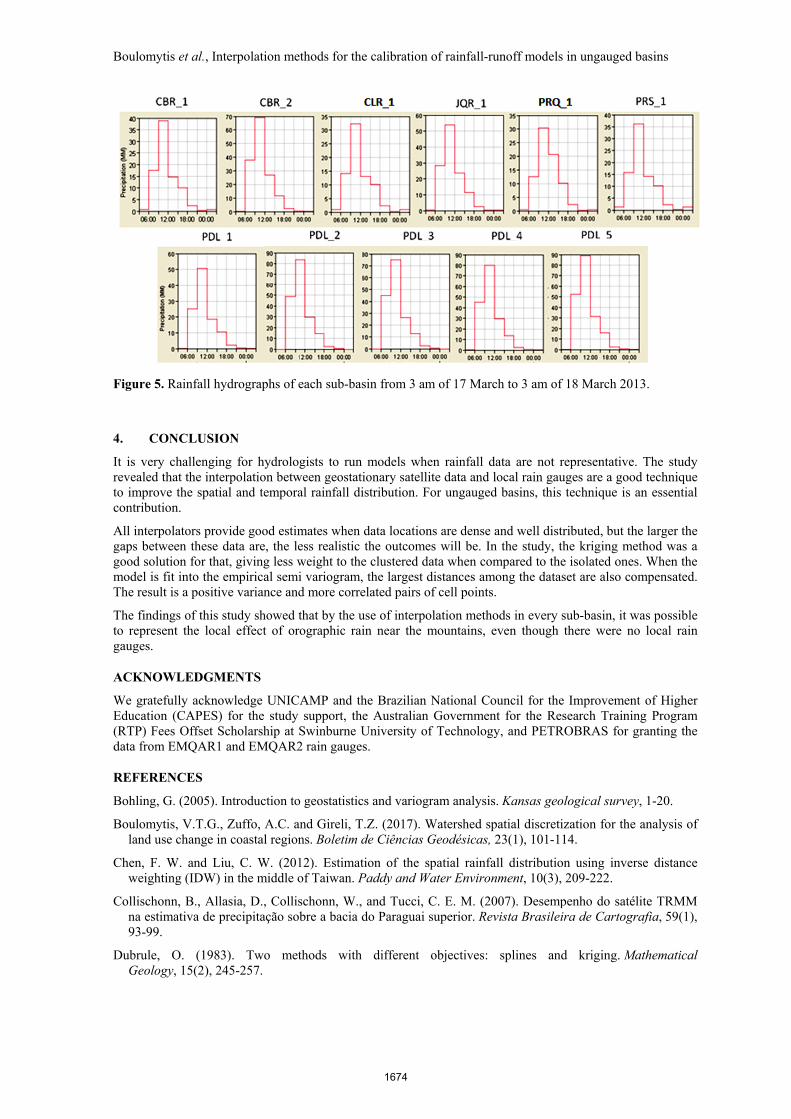
The mean values of 88 maps provided the levels of every 3 hours for the rainfall hydrograph (Figure 5). This result was representative for the spatial and temporal distribution of the entire basin. Developing the interpolation by the use of the rain gauges and the PCD it would only be possible to represent the sub-basins CBR_1, the northern part of JQR_1 and the southern part of PDL_5. Thus, the effect of orographic rain near the mountains, would not be detected and the hydrological model would not be able to run with realistic meteorological information.
1673
Boulomytis et al., Interpolation methods for the calibration of rainfall-runoff models in ungauged basins
Figure 5. Rainfall hydrographs of each sub-basin from 3 am of 17 March to 3 am of 18 March 2013.
4. CONCLUSION
It is very challenging for hydrologists to run models when rainfall data are not representative. The study revealed that the interpolation between geostationary satellite data and local rain gauges are a good technique to improve the spatial and temporal rainfall distribution. For ungauged basins, this technique is an essential contribution.
All interpolators provide good estimates when data locations are dense and well distributed, but the larger the gaps between these data are, the less realistic the outcomes will be. In the study, the kriging method was a good solution for that, giving less weight to the clustered data when compared to the isolated ones. When the model is fit into the empirical semi variogram, the largest distances among the dataset are also compensated. The result is a positive variance and more correlated pairs of cell points.
The findings of this study showed that by the use of interpolation methods in every sub-basin, it was possible to represent the local effect of orographic rain near the mountains, even though there were no local rain gauges.
ACKNOWLEDGMENTS
We gratefully acknowledge UNICAMP and the Brazilian National Council for the Improvement of Higher Education (CAPES) for the study support, the Australian Government for the Research Training Program (RTP) Fees Offset Scholarship at Swinburne University of Technology, and PETROBRAS for granting the data from EMQAR1 and EMQAR2 rain gauges.
REFERENCES
Bohling, G. (2005). Introduction to geostatistics and variogram analysis. Kansas geological survey, 1-20.
Boulomytis, V.T.G., Zuffo, A.C. and Gireli, T.Z. (2017). Watershed spatial discretization for the analysis of land use change in coastal regions. Boletim de Ciências Geodésicas, 23(1), 101-114.
Chen, F. W. and Liu, C. W. (2012). Estimation of the spatial rainfall distribution using inverse distance weighting (IDW) in the middle of Taiwan. Paddy and Water Environment, 10(3), 209-222.
Collischonn, B., Allasia, D., Collischonn, W., and Tucci, C. E. M. (2007). Desempenho do satélite TRMM na estimativa de precipitação sobre a bacia do Paraguai superior. Revista Brasileira de Cartografia, 59(1), 93-99.
Dubrule, O. (1983). Two methods with different objectives: splines and kriging. Mathematical Geology, 15(2), 245-257.
1674

Boulomytis et al., Interpolation methods for the calibration of rainfall-runoff models in ungauged basins
Githungo, W., Otengi, S., Wakhungu, J. and Masibayi, E. (2016). Infilling Monthly Rain Gauge Data Gaps with Satellite Estimates for ASAL of Kenya. Hydrology, 3(4), 40.
Haberlandt, U. (2007). Geostatistical interpolation of hourly precipitation from rain gauges and radar for a large-scale extreme rainfall event. Journal of Hydrology, 332(1), 144-157.
Huffman, G.J., Adler R.F., Bolvin D.T., Gu G., Nelkin E.J., Bowman K.P., Hong Y., Stocker E.F., and Wolff D.B. (2007). The TRMM Multi-satellite Precipitation Analysis (TMPA): Quasi-Global, Multiyear, Combined-Sensor Precipitation Estimates at Fine Scale. Journal of Hydrometeorology, 8(1), 38-55.
Oliver, M. A. and Webster, R. (1990). Kriging: a method of interpolation for geographical information systems. International Journal of Geographical Information System, 4(3), 313-332.
Pereira, G., Silva, M. E. S., Moraes, E. C. and Cardozo, F. S. (2013). Avaliação dos dados de precipitação estimados pelo satélite TRMM para o Brasil. Revista Brasileira de Recursos Hídricos, 18(3), 139-148.
Rahman, M., Singh Arya, D., Goel, N.K., and Mitra, A.K. (2012). Rainfall statistics evaluation of ECMWF model and TRMM data over Bangladesh for flood related studies. Meteorological Applications, 19(4), 501-512.
Rozante, J. R., Moreira, D. S., de Goncalves, L. G. G. and Vila, D. A. (2010). Combining TRMM and surface observations of precipitation: technique and validation over South America. Weather and Forecasting, 25(3), 885-894.
Wagesho, N., Goel, N. K. and Jain, M. K. (2013). Temporal and spatial variability of annual and seasonal rainfall over Ethiopia. Hydrological Sciences Journal, 58(2), 354-373.
1675