internationalisation, trade and foreign direct · pdf file112 john howe 2. aggregate trends in...
TRANSCRIPT

Internationalisation, Trade and ForeignDirect Investment
John Howe
1. IntroductionThe process of internationalisation or ‘globalisation’ involves a thorough transformation
of the Australian economy from being inward looking and protectionist, to beingexternally oriented in both trade and investment. The process has been helped along bythe liberalisation of capital markets and the removal of barriers to trade, but other factorssuch as technological advances and innovations may have also motivated these changes.
Australia is not alone in pursuing policies consistent with increased internationalintegration over the past decade. A feature of the world-wide process of globalisationis the increase in both trade and foreign direct investment (FDI) flows that have beenobserved in OECD countries. In fact, the widespread nature of globalisation suggests thatit would have been very difficult for a country like Australia to stand against the tide.Moreover, successful resistance could have proven very costly.
Globalisation presents many opportunities for Australia. Taking advantage of theseopportunities requires the effective exploitation of Australia’s comparative advantagesin skilled labour, resources and technology. Increasingly, this exploitation occurs notonly through trade, but through foreign direct investment.
Investment overseas by Australian firms allows them to exploit their comparativeadvantage in technology, and the provision of services, on a global scale. In doing so, italso exposes firms to new technologies, new management and new ways of doing things.Similarly, FDI in Australia exposes Australian firms, particularly in the service industries,to greater competition and should provide valuable demonstration effects. Traditionally,FDI flows have been between Australia and the OECD. In the future, however, FDIpatterns are likely to follow the change in trade patterns towards Asia.
The paper examines trends in both FDI and trade over the past decade, but emphasisesthe behaviour of FDI flows. Section 2 sets out the trends in aggregate FDI and trade.Section 3 examines recent trends in the structure of trade and FDI with a view toassessing the role of FDI in the process of making Australia a more internationally-oriented economy. It looks at the composition of FDI and trade at a regional level, a broadindustry level and, finally, within the manufacturing sector. Section 4 then discussessome issues that have emerged, or may emerge, in relation to increased FDI flows.
112 John Howe
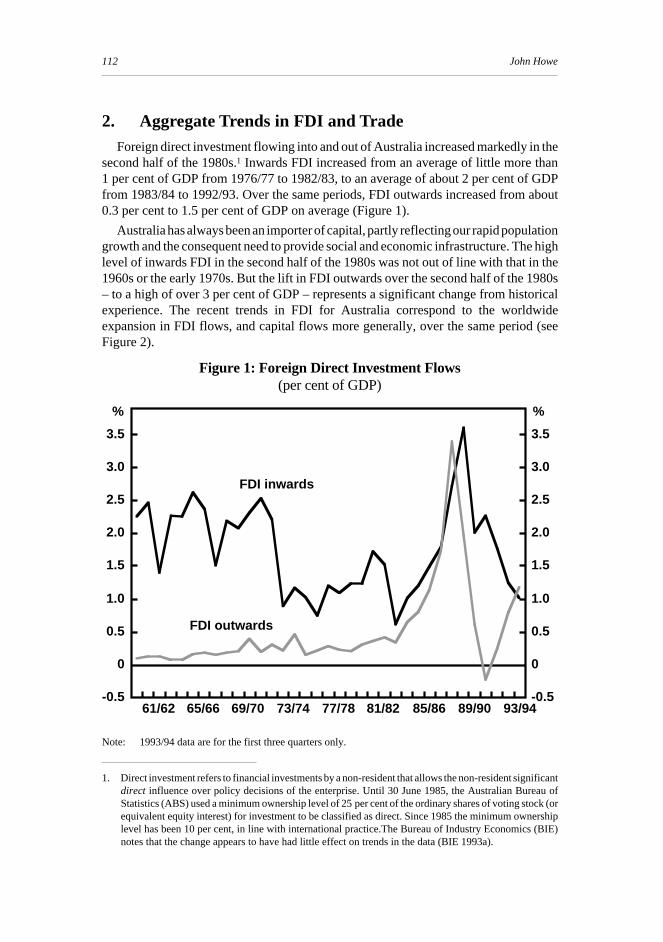
2. Aggregate Trends in FDI and TradeForeign direct investment flowing into and out of Australia increased markedly in the
second half of the 1980s.1 Inwards FDI increased from an average of little more than1 per cent of GDP from 1976/77 to 1982/83, to an average of about 2 per cent of GDPfrom 1983/84 to 1992/93. Over the same periods, FDI outwards increased from about0.3 per cent to 1.5 per cent of GDP on average (Figure 1).
Australia has always been an importer of capital, partly reflecting our rapid populationgrowth and the consequent need to provide social and economic infrastructure. The highlevel of inwards FDI in the second half of the 1980s was not out of line with that in the1960s or the early 1970s. But the lift in FDI outwards over the second half of the 1980s– to a high of over 3 per cent of GDP – represents a significant change from historicalexperience. The recent trends in FDI for Australia correspond to the worldwideexpansion in FDI flows, and capital flows more generally, over the same period (seeFigure 2).
1. Direct investment refers to financial investments by a non-resident that allows the non-resident significantdirect influence over policy decisions of the enterprise. Until 30 June 1985, the Australian Bureau ofStatistics (ABS) used a minimum ownership level of 25 per cent of the ordinary shares of voting stock (orequivalent equity interest) for investment to be classified as direct. Since 1985 the minimum ownershiplevel has been 10 per cent, in line with international practice.The Bureau of Industry Economics (BIE)notes that the change appears to have had little effect on trends in the data (BIE 1993a).
Note: 1993/94 data are for the first three quarters only.
Figure 1: Foreign Direct Investment Flows(per cent of GDP)
61/62 65/66 69/70 73/74 77/78 81/82 85/86 89/90 93/94-0.5
0
0.5
1.0
1.5
2.0
2.5
3.0
3.5
-0.5
0
0.5
1.0
1.5
2.0
2.5
3.0
3.5
FDI inwards
FDI outwards
% %

113Internationalisation, Trade and Foreign Direct Investment
Figure 2: External Assets and Liabilities of the Non-Official Sector(Australia and the OECD; per cent of GDP)
Note: Excluding financial institutions. Australian external assets and liabilities are calculated at marketvalue, while those of the OECD are at book value.
Source: Rider (1994).
2. Not surprisingly, these changes in inward OECD stocks of capital were matched by changes in outwardstocks of FDI and total assets since the OECD comprises the vast bulk of the world capital market. Muchof the data reflect intra-OECD investments.
3. However, this may partly reflect difficulties in estimation of FDI flows under more liberal capital markets(see Appendix B).
1984 1991 1984 19910
10
20
30
40
50
0
10
20
30
40
50FDI assets
Total external assets
FDI liabilities
Total external liabilities
%OECD Australia
%
It has been argued, for example by Froot (1991), that the traditional theories of FDIflows that focus on firm-specific and locational advantages (see Appendix A), do notfully explain periodic surges in FDI such as occurred over the second half of the 1980s.
Additional explanations usually focus on the coincidence of several factors. Wideningexternal imbalances among OECD countries would have established the conditions foroffshore investment. Figure 2 shows that, for the OECD, changes in FDI played thelessor role in the growth of private sector liabilities, accounting for about one-third of thetotal change in non-official external liabilities from 1984 to 1991.2 In contrast, forAustralia, non-official FDI liabilities accounted for about 50 per cent of the change inexternal liabilities over the same period. This reflects a lower share of FDI flows inforeign investment than had been the case in the previous two decades.3

114 John Howe
Australia’s external deficits and our depreciating exchange rate in the 1980s may havecontributed to the increases in FDI liabilities in Australia in the 1980s. But these factorsfail to explain why Australia increased FDI asset holdings over the period (from about4 per cent of GDP in 1984 to about 10 per cent of GDP now, a level which is not far belowthe OECD average).
Financial liberalisation enabled significant outwards FDI flows to occur for the firsttime in many OECD countries, including Australia. This was particularly important inthe case of Japan where, by world standards, liberalisation coincided with a relativelylow cost of equity and a very strong currency. These factors made foreign assetsrelatively cheap to acquire.4 Such an explanation can be reconciled with traditional FDItheories. For example, acquisitions of foreign firms by Japanese firms would haveimproved market access in areas where they believed they held competitive advantages.Similarly, Australian investors may have been responding to first-time opportunities toinvest offshore, except that in this case the offshore investments were largely financedusing overseas borrowing (Bullock, Grenville and Pease 1992).
Rapid technological progress and innovations were also very important. First,innovations in corporate financing and improvements to information technology madeit easier, and less risky, to acquire foreign assets through mergers and acquisitions (whichincreased markedly over the period as a means of conducting FDI). Second, in somecases, technological advances have led to development and production costs that arebeyond the financial resources of even the largest firms.5 This has created incentives forthe formation of alliances, and the international rationalisation of production and R&D.Third, a firm that has developed a technological edge may often invest overseas throughFDI, rather than trade in the technology (e.g. through licensing), thereby retaining thebenefits of the technological edge for a longer period (see Appendix A).
In fact, the widespread moves towards deregulation in the 1980s were probably aninevitable consequence of the telecommunications and computer revolution and theglobalisation process itself. Even if they had wanted to maintain tight boundaries aroundtheir economies, governments would have found it very difficult to detect, let alonecontrol, many international financial transactions as electronic banking and otherinnovative financial services and practices became widespread.
Policy changes – including those in the areas of tax, competition policy andmicroeconomic reform – may also help to explain part of the increased FDI flows in thesecond half of the 1980s. However, the reverse can also be argued: policy changes mayhave been driven by the increased mobility of capital (and embodied technology andmanagement skills). If this is the case, it tends to raise the costs of policy failure ifinvestment opportunities are missed.
4. Japan increased outwards FDI at over 60 per cent per annum between 1985 and 1989 (UNCTC 1991).Germany (FRG) also increased its outwards FDI rapidly over the period and was exposed to influencessimilar to those of Japan.
5. Consider, for example, technological advances in fields such as large passenger aircraft, microprocessors,telecommunications switching stations, satellites and pharmaceuticals.

115Internationalisation, Trade and Foreign Direct Investment
The role that we are ascribing to technological change here is not universally acceptedas an explanator of the surge in FDI in the 1980s. For example, Froot (1991) argues thatby lowering transaction costs, technical progress would have reduced the need for firmsto extend their boundaries through FDI. On balance, the sort of surge in FDI that wasexperienced in the second half of the 1980s may never be fully explained by anyparticular theory of FDI. Nonetheless, the factors that traditional FDI theories wouldpredict as being important clearly played a role. Indeed, Figure 3 shows a relatively closecorrelation between inwards FDI (relative to GDP), corporate profitability and GDPgrowth. At the aggregate level this is consistent with the market-based and supply-sidedeterminants of location for FDI that are predicted by the traditional theory (as outlinedin Appendix A). Whether the theory helps to explain trends at a more disaggregated levelis addressed in Section 3.
Complementing the technological incentives to openness on the financial side was thereasonably widespread dismantling of trade barriers, as governments became convincedof the benefits of freer trade in goods and services. Figure 4 shows the increase in tradeintensity for both Australia and the OECD since the early 1980s. Figure 5 shows therelationship between growth in exports and total-factor productivity (TFP) that hashelped to motivate the shift towards greater international integration of OECD countriesin recent years.
Figure 3: Inwards FDI Flows, Corporate Profitability and GDP Growth
60/61 64/65 68/69 72/73 76/77 80/81 84/85 88/89 92/930
2
4
6
8
10
12
14
16
0
0.5
1.0
1.5
2.0
2.5
3.0
3.5
4.0
% %
Share of private corporate profits in GDP at factor cost (LHS)
GDP growth (LHS)
Inwards FDI as a share of GDP at factor cost (RHS)
Note: GDP growth is a centred three-year-moving average annual growth rate.

116 John Howe
Figure 4: Trade Intensity: Australia and the OECD Average(per cent of GDP)
Source: EPAC (1993).
Figure 5: Growth in Exports and Efficiency(OECD 1960-1991)
•
••
• •
••
•
•
•
•
•
••
•
•
0
0.5
1.0
1.5
2.0
2.5
3.0
3.5
4.0
4.5
5.0
0 0.5 1.0 1.5 2.0 2.5 3.0 3.5
Gro
wth
in e
xpor
ts/G
DP
(%
p.a
.)
TFP growth (% p.a.)
Japan
SpainItaly
France
NetherlandsDenmark
SwedenSwitzerland
Canada
Germany
Austria
Belgium
NZ
UKAustralia
US
71/72 74/75 77/78 80/81 83/84 86/87 89/90 92/9320
25
30
35
40
45
20
25
30
35
40
45
OECD
Australia
% %
Note: Trade intensity is exports plus imports relative to GDP (all in constant prices).

117Internationalisation, Trade and Foreign Direct Investment
3. Trends in the Structure of Trade and FDIIn this section we examine the recent trends in the structure of trade and FDI, inwards
and outwards, with a view to establishing whether they have been consistent withbuilding on competitive advantages that we already have, and/or the perceived requirementto improve competitiveness in the domestic economy.6 We generally show patterns ofFDI and trade together in order to shed some light on whether there is any systematicrelationship between the two.
The issue of the effects of FDI on trade and industry structure has been discussed ina number of recent publications, and a summary of the debate is presented in theaccompanying box.7 However, little has been done empirically to address this question.One reason for this is the paucity of data, particularly in respect of FDI by Australiancompanies overseas. Also, the data that are available are aggregated by industry.8 Theseproblems are equally pressing here and we are forced to take a qualitative approach toanalysing the impact of FDI at a disaggregated level. That said, if there are systematiceffects on trade and industry structure associated with FDI flows, the effects should beappearing at the level of aggregation that we examine here.
3.1 Regional Composition of Trade and FDI
Over the past decade, the Asian and East Asian economies have increased inimportance as both a market for our exports and as a supplier of our imports (Figure 6).Within this change there has also been a shift in the direction of trade from Japan towardsthe more rapidly growing East Asian economies. Australia’s experience in this regard issimilar to that of most developed countries as world attention switched towards therapidly growing East Asian economies over the period.
On the other hand, the strong increase in both inwards and outwards FDI over the pastdecade has been dominated by OECD countries that are our ‘traditional’ trading partners.Japan has accounted for the bulk of changes in inwards FDI but has been well supportedby North America, New Zealand, the UK and other OECD countries. Outwards FDI hasfollowed a similar pattern, except in the case of Japan, which generally discouragesinwards FDI.
The reliance on OECD countries as a source of FDI is generally explicable in termsof the technological superiority of these countries with respect to production, managementand marketing. If FDI is reflecting firm-specific advantages, we would mostly expect tofind them in these countries. Also, as noted in Section 2 the coincidence of financial
6. With respect to traded sectors this would mean adding value to commodities, and creating potential forniche markets for more elaborately transformed manufactures and certain service industries. For non-traded areas it means reducing costs or increasing productivity. Non-traded areas are, however, notfocussed on here.
7. See OECD (1991, 1992a), BIE (1993a) and EAAU (1994), for a more detailed discussion.
8. There are no data available on manufacturing trade classified by ASIC industry before the early 1980s.TheFDI data for the manufacturing sector are only reported at the 2-digit ASIC level for manufacturingindustries used in this paper. It is, therefore, impossible to obtain a match-up of FDI and trade data priorto the early 1980s. Moreover, in recent years, there are significant gaps in FDI data at the 2-digit ASIClevel, due mainly to confidentiality problems.

118 John Howe
FDI: Its Links with Trade and Industry Structure
Concerns about the impact of FDI on trade usually centre on whether FDI iscomplementing potential gains from trade or whether it may be displacing trade, suchthat the benefits derived from FDI would have been available anyway. One reason forthis concern is that FDI is itself trade in factors of production. For example,management expertise, technology and organisational know-how might be traded foraccess to markets, raw materials or cheaper labour. But this view is based on the notionthat international factor and goods markets operate perfectly. In this case, FDI flowswould not be necessary. Given imperfect markets, FDI should complement trade ingoods and services (Markusen 1983). But, as noted by the East Asia Analytical Unit(EAAU), FDI can, in the short term at least, have trade-displacing or trade-enhancingeffects depending on the circumstances involved (EAAU 1994). As is also pointed outby the EAAU, the equilibrium effects will generally counter any short-run effects ofFDI on trade.
For example, an FDI project by an Australian company in Asia that generated anenormous increase in the export of Aus-widgets will inevitably displace otherpotential exporters. The magnitude of this effect would be subject to effects on theexchange rate which, in turn, may ultimately depend on how the additional exportincome is spent. Transition is important because it may be obvious that eventuallyresources would have been directed into Aus-widgets, but the FDI would still bebeneficial if it enabled the economy to be restructured. The same argument can bemade in the case of FDI that displaced exports. In both cases, the Australian economywill benefit if the export enhancing (or displacing) activity generates a better structurefor the domestic economy in terms of longer-run growth.
On this basis, the key determinant of whether FDI is good for the economy or notis ultimately determined by its effects on the structure of the economy. The impact ontrade is important because it allows us to obtain some insights into whether or not weare getting the right sort of structure. (Although trade-enhancing FDI is clearlyconsistent with the aim of better integration in world markets.)
In general, we might expect to find a cross-country investment portfolio thatreflects the competitive advantages held by the host country in each location. To anextent, this is what we do see. (Australia, for example, has never found difficulty inattracting FDI into areas of mining.) But it is also clear that the location of FDIresponds to factors other than underlying competitive advantages, including a raft ofgovernment policies. The behaviour of firms involved with FDI flows will also havea bearing on the structural impact of FDI. Border protection in Australia after WorldWar II is an example of a policy-based distortion. Allegations that FDI firms usemarket power and behave strategically in the interests of the home country is anexample of a distortion that would arise from the FDI investors.
To focus on the effects of FDI on trade alone would risk missing the point that therestructuring and globalisation of the Australian economy are ultimately aimed atcreating the conditions for longer-term growth and increased wealth, not a better tradeperformance per se. Stronger growth and improved trade performance are of course inter-linked for the economy as a whole, but not necessarily for each sector, industry, or firm.

119Internationalisation, Trade and Foreign Direct Investment
liberalisation, low costs of equity and very strong currencies in Japan and some Europeancountries meant that Australia was bound to increase its sourcing of FDI from these areas.Finally, a number of East Asian economies, including Korea and Taiwan, have discouragedoutflows of capital (World Bank 1993).
Australia was not alone in directing the bulk of its outwards FDI towards OECDmarkets as worldwide flows of FDI in the 1980s were concentrated in Europe, Japan andthe US (UNCTAD 1993). One explanation for the disproportionate amount of outwardsFDI flowing to OECD countries is that these economies comprise the vast bulk of theworld market. It is logical for companies which perceive themselves to have a competitiveedge to take that edge into the large markets first. Another is that investors focussed onculturally-close markets as potential locations in their initial phase of investing offshore
Figure 6: Changes in Australia’s Trade and FDI by Region,1982 to 1992
Note: NIEs include Hong Kong, Korea, Singapore and Taiwan for trade. Singapore is included in theASEAN countries for FDI.
US & Canada
United Kingdom
Japan
New Zealand
Other OECD
ASEAN
NIEs
Other Asia (inc China)
Pacific & South America
Other
-8 -6 -4 -2 0 2 4 6 8 10Change in percentage share of Australia's trade (1982 to 1992)
Export share
Import share
Panel A: Change in trade shares
US & Canada
United Kingdom
Japan
New Zealand
Other OECD
ASEAN
NIEs (less Singapore)
Other Asia (inc China)
Pacific & South America
-1 0 1 2 3 4Change relative to GDP (percentage points) (1982 to 1992)
FDI liabilities
FDI assets
Panel B: Change in FDI assets and liabilities

120 John Howe
(see, for example, Yetton, Davis and Swan (1991)). Also, the EAAU (1994) argues thatlack of information about institutional changes (including lower protection) and aboutgrowth prospects in Asia may have played an important role in low Australian FDIinvestment in that region.
Whatever the reason for the lack of FDI flows corresponding to the regional focus oftrade in the past decade, it appears that it may be reversed in the future. Access Economicsestimate that over 50 per cent of the value of current and planned outwards FDI projectsare expected to be located in Asia (including PNG) (Access Economics 1994). Abouthalf of these projects are in the mining industry, 10 per cent in manufacturing, andservices comprise the rest.
3.2 Composition of Trade and FDI by Industry
At a broad industry level we again observe little correspondence between recenttrends in trade and FDI. Figure 7 shows that manufacturing comprises the bulk of ourtrade whereas services dominate FDI assets and liabilities. The changes over the pastdecade have emphasised the difference, with manufacturing increasing its share of trade,and the service sector its share of FDI.
The strong performance of the manufacturing sector in exports over the past decadepartly reflects a continuation of the long-run reduction in the terms of trade forcommodities (particularly for mining products in the 1980s).9 But manufacturingexports have also grown more rapidly than agriculture and mining exports in volumeterms. At the same time, manufacturing imports have increased as a share of total importsand the trade deficit in manufacturing has not improved by much (BIE 1994). Some mayview these results with concern, arguing that a reduction in the manufacturing tradedeficit is essential to Australia’s economic future. But the real issue is whether or notAustralia is making the best possible use of its resources. We should expect a trade deficitin manufacturing in a country that generates surpluses through the export of naturalresources. In addition, the correspondence of increases in exports and imports suggestsincreased specialisation and restructuring within the manufacturing sector, which isconsistent with the globalisation process.
The domination of FDI flows by the service sector is a relatively recent phenomenon.In the 1950s and 1960s, manufacturing and mining were more highly represented. Thischange in the composition of FDI happened almost everywhere reflecting the increasedimportance of services as a component of national product in most industrial countries(OECD 1992a). Also, the non-tradeable nature of much of the service sector means thatfirms with competitive advantages in Australia are unable to reap the benefits throughtrade, but they can through FDI. The increase in the service sector share in the 1980smainly reflects financial liberalisation and the attendant world-wide increases in FDI inthe finance, property and business service sector.
9. The manufacturing sector here is defined on the Australian Standard Industrial Classification (ASIC)basis. It includes very early-stage processing of agricultural and mining products such as wool scouringand minerals processing.

121Internationalisation, Trade and Foreign Direct Investment
Figure 7: Share of Australia’s Trade and FDI by Industry,1982 and 1992
(in current prices)
Panel A: Industry share of trade
Panel B: Industry share of FDI assets and liabilities
Share in total imports Share in total exports
Agriculture
Mining
Manufactures
Services
10 30 50
1992
1982
Agriculture
Mining
Manufactures
Services
10 30 50
Share in total FDI liabilities Share in total FDI assets
1992
1982
%
%
%
%
70 50 30 10
50 30 10
Note: The industries are classified according to ASIC. The manufacturing sector, therefore, includesearly-stage processing of agricultural and mining products.
The decline in the relative importance of Australia’s manufacturing sector in FDIinflows partly reflects the trend decline in manufacturing production relative to GDP inmost developed countries. The BIE (1993a) concluded that it may also be due to changesin Australia’s trade policies away from import replacement (and border protection). Theremoval of trade barriers over the past decade and increased mobility of capital mighthave been expected to be associated with significant disinvestment in the less competitivemanufacturing sector. But the manufacturing sector largely maintained its share of FDIliabilities (and assets), despite the fact that it was a period of enormous growth in bothinwards and outwards FDI. The correspondence of increased inwards and outwards FDI

122 John Howe
in manufacturing is consistent with increased specialisation in production. Moreimportantly, it appears that, the opportunity to disinvest domestically in manufacturinghas not been taken up. This probably reflects the substantial supply-side improvementsin Australia’s manufacturing sector over the decade, as well as reductions in companytax rates and measures to increase international links (such as partnerships for developmentand the ‘Factor f’ program).
Figure 8 confirms that most of the FDI in service industries has been directed into thenon-traded areas of finance, property and business, and wholesale and retail services.This is not to say that investment in these areas cannot contribute to improved trade.Outputs from these industries are often embedded in traded goods and services.Improvements to productivity through technology transfer and organisational innovationsin these industries that result from FDI can play an important role improvingcompetitiveness more generally.
There is little doubt that FDI in the wholesale and retail sector has generally improvedefficiency in Australia. The experience in finance, property and business has been moremixed. Much of the FDI flows into this sector in the 1980s were responding to – andhelped to fuel – the asset price boom in property. Foreign (and domestic) investors haveexperienced substantial losses in the subsequent fallout. Similarly, some of the Australianinvestments offshore in this sector have not performed well. Transmission of the asset
Note: In current prices. EGW is electricity, gas and water.
Figure 8: Share of FDI Assets and Liabilities in Services by Industry,1982 and 1992
Construction
Wholesale & retail
Transport & storage
& business
Finance, property
& communication recreation,
EGW, community,
0 20 40 60
Share in total services FDI assetsShare in total services FDI liabilities
1992
1982
% 60 40 20

123Internationalisation, Trade and Foreign Direct Investment
price boom was a major source of instability in the Australian (and world) economy overthe past decade. However, any deleterious effects, including those on industry structure,are likely to be unwound through the restructuring of corporate balance sheets andinvestment portfolios.
The fact that over 50 per cent of FDI assets and liabilities are accounted for bylow-trade service industries is an important counter to those who argue that we shouldbe concerned about trade displacement of FDI. Much of the increase of trade in serviceshas been accounted for by tourism, but the FDI in this sector (included in EGW etc. inFigure 8) has not been a significant portion of total FDI in services. Also, if we areconcerned about FDI flows distorting domestic production towards low-value-addedactivity, we would generally not look to the service industries for evidence. Theseindustries tend to have higher wages than manufacturing and agriculture. Agricultureattracts very little FDI flows (Figure 7). It follows that if we are to get an appreciationof the impact of FDI on trade and industry structure we need to focus attention on themanufacturing sector.
In order to examine the impact of FDI flows on the structure of the domesticmanufacturing industry we need to get some idea of where Australia’s competitivestrengths lie, and where changes in competitiveness have occured. One way to do this isby measuring revealed comparative advantage by industry in the manufacturing sector.10
The OECD (1993) calculated a set of revealed comparative advantages (RCAs) formanufacturing industries in a sample of 13 OECD countries. As defined by the OECD,an industry’s RCA is its share in the country’s exports as a ratio of the average share inexports of that industry for all the countries in the sample. The set of OECD RCAs showthe export orientation for a country, by industry, relative to the wider OECD area. If anindustry’s RCA is greater than unity, then that industry’s export orientation exceeds theOECD average. This is interpreted as reflecting a relative (revealed) advantage held bythat industry in international trade.
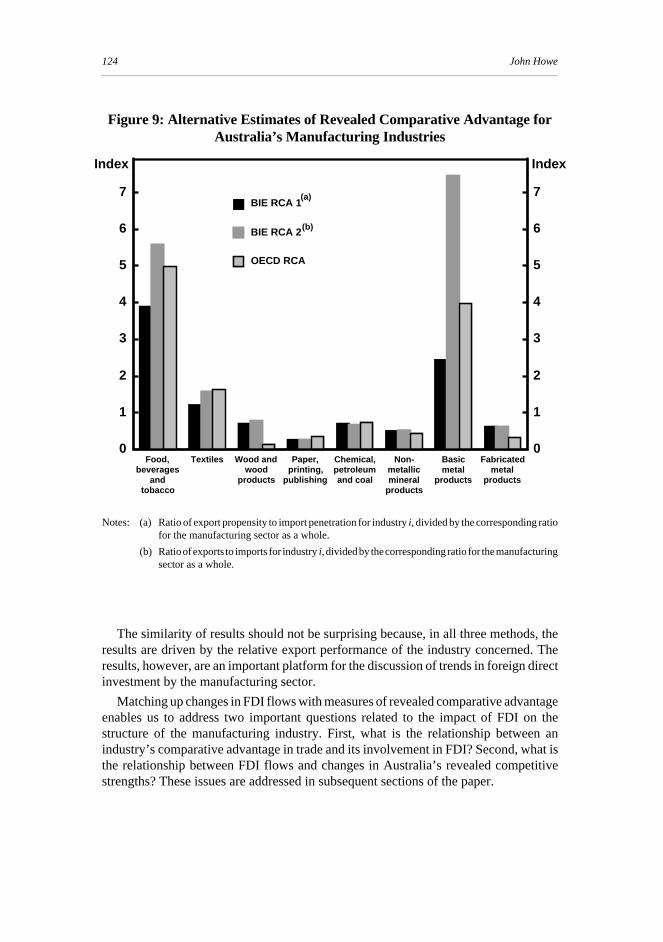
The BIE has also been monitoring the relative trade orientation of industries inAustralia’s manufacturing sector using estimates of export propensity and importpenetration (BIE 1993b, 1993c). It is possible to draw comparisons with the OECDestimates of RCAs for Australia’s manufacturing industries using the BIE estimates oftrade orientation. One measure involves scaling the BIE measures of trade orientation foreach industry by the trade orientation of the manufacturing sector as a whole. A secondmethod is to scale the exports to imports ratio of each industry with the ratio of exportsto imports of the total manufacturing sector. Figure 9 compares results using thesemethods with those generated by the OECD for a comparable sample of manufacturingindustries. It is clear from the figure that the alternative approaches yield similar resultsacross most industries. There is some difference in the relative magnitudes of RCAs,particularly for Basic Metal Products. Nonetheless, the same conclusions aboutcomparative advantage within the Australian manufacturing sector would be drawnusing any of the three measures shown.
10. Such measures are, however, imperfect because industries are not internally homogeneous with respectto factors of production, marketing, or the general business climate. Nevertheless, they do provide ageneral guide as to which industries are most competitive in world markets.
124 John Howe
The similarity of results should not be surprising because, in all three methods, theresults are driven by the relative export performance of the industry concerned. Theresults, however, are an important platform for the discussion of trends in foreign directinvestment by the manufacturing sector.
Matching up changes in FDI flows with measures of revealed comparative advantageenables us to address two important questions related to the impact of FDI on thestructure of the manufacturing industry. First, what is the relationship between anindustry’s comparative advantage in trade and its involvement in FDI? Second, what isthe relationship between FDI flows and changes in Australia’s revealed competitivestrengths? These issues are addressed in subsequent sections of the paper.
Figure 9: Alternative Estimates of Revealed Comparative Advantage forAustralia’s Manufacturing Industries
Notes: (a) Ratio of export propensity to import penetration for industry i, divided by the corresponding ratiofor the manufacturing sector as a whole.
(b) Ratio of exports to imports for industry i, divided by the corresponding ratio for the manufacturingsector as a whole.
Food, beverages
and tobacco
Textiles Wood and wood
products
Paper, printing,
publishing
Chemical, petroleum and coal
Non-metallic mineral
products
Basic metal
products
Fabricated metal
products
0
1
2
3
4
5
6
7
0
1
2
3
4
5
6
7BIE RCA 1
BIE RCA 2
OECD RCA
(a)
(b)
Index Index

125Internationalisation, Trade and Foreign Direct Investment
3.3 FDI Orientation and the Structure of the ManufacturingIndustry
Figure 10 shows the relationship between an industry’s competitiveness in 1982 andsubsequent changes in its FDI orientation. The horizontal axis shows the RCA for eachindustry. Industries with a high RCA are located to the right of the mid-point of this axis,and low-RCA industries to the left. The figure shows that in 1982, the Food, Beveragesand Tobacco, and Basic Metal Products industries had the highest RCA’s. Theseindustries generate large surpluses by adding value to primary products and (followingthe methodology established by the BIE (1993b)) can be classified as the ‘export group’of Australian manufacturing industries. Moving left along the horizontal axis, anothergrouping can be characterised as the ‘intra-industry trade’ group. To a degree, intra-industry trade is a feature of all twelve manufacturing industries. However, it is mostapparent in Textiles, and Chemicals, Petroleum and Coal products industries.11
A third group of industries can be characterised as being ‘low-trade’ as they have bothlow import penetration and export propensity, due to a high level of natural protectionfrom import competition (BIE 1993b). These industries include Fabricated MetalProducts, Non-Metallic Mineral Products, and Wood and Wood Products. They areprimarily geared towards the domestic market and are generally competitive in thatmarket.
The final set of industries, including Clothing and Footwear, Transport and Equipment,Other Machinery and Equipment, Miscellaneous Manufacturing, and Paper and PaperProducts suggest themselves as primarily import industries. This group has beengenerally characterised as being internationally uncompetitive through cost disadvantages,particularly in the early 1980s.
The vertical axis of Figure 10 shows the changes in orientation of FDI in the 1980sby industry while holding the index of comparative advantage fixed in 1982.12
The low-trade group, Chemicals, Petroleum and Coal (an intra-industry group) andtwo import-group industries (Transport Equipment and Miscellaneous Manufacturing)increased relative holdings of FDI liabilities from 1980 to 1988.13 For the latter, this maybe somewhat surprising given the reduction in border protection over the period (andpromises of continued reduction into the 1990s). The inwards FDI in these industries istherefore probably unrelated to prospects of border protection. It is much more likely tobe due to the fact that these industries are focussed primarily on the Australian marketand to microeconomic reforms that have improved profitability in these industries over
11. The Wood and Wood Products industry has a high degree of intra-industry trade, but this characteristicis dominated by the low amount of trade in this industry, hence its allocation to the ‘low-trade’ group.
12. The choice of 1988 as the year for assessing the change in FDI orientation reflects the lack of a completeset of FDI data by manufacturing sector beyond that year. However, 1988 has the advantage of coincidingwith the very rapid growth of FDI flows in the second half of the 1980s, and it avoids the effects of therecession at the end of the decade.
13. It is worth noting that the industries more likely to invest offshore in 1982, (i.e. had a ratio of FDI assetsto liabilities greater than the ratio for all manufacturing of 25 per cent) were the relatively low-tradedFabricated Metals and Non-Metallic Minerals industries.The rationale for low-traded industries to investoffshore is market driven, as described in Appendix A.

126 John Howe
Figure 10: Changes in FDI Orientation and RevealedComparative Advantage
14. The shift offshore by the Paper and Paper Products industry may have been partly motivated by a limiteddomestic market, and diminishing investment opportunities because of heightened environmentalconcerns in Australia. Also, the Textiles industry may have seen a reversal recently with inwards FDI inwool processing (BIE 1994).
Note: FDI orientation is the share of FDI assets by industry in total FDI assets for manufacturing, dividedby the corresponding share for liabilities. The vertical axis shows the change in each industry’spropensity to hold FDI assets relative to FDI liabilities (scaled by the ratio of FDI assets to FDIliabilities for all manufacturing). Where data points are greater than zero, industries have increasedoffshore orientation by more than manufacturing as a whole. The RCA index is the share of exportsby industry in total manufacturing exports divided by the corresponding share for imports. Where datapoints are greater than zero on the RCA axis, industries have an export orientation greater than thatof manufacturing as a whole. The numbers in brackets show the effective rate of assistance by industryin 1981/82 (IAC 1985).
•••
•
•
•• •
••
•
•
-4
-3
-2
-1
0
1
2
3
4
-3 -2 -1 0 1 2 3
Cha
nge
in F
DI o
rient
atio
n (1
980
to 1
988)
Log of revealed comparative advantage index (1982)
Food, beverages &tobacco (9)
Wood & products (14)
Basic metals (11)
Transport equipment(71)
Misc Manufacturing (27)Fabricated metals (31)
Non-metallic minerals (4) Chemical, petroleum& coal (14)
Other machinery &equipment (21)
Textiles (54)
Paper products (25)
Clothing & footwear(204)
the past decade. Government policies aimed at enhancing links with foreign investorssuch as Partnerships for Development, and the ‘Factor f’ program for pharmaceuticalsmay also have helped to attract inwards FDI.
The propensity to move offshore from 1980 to 1988 was most apparent in lesscompetitive industries (Clothing and Footwear, Paper and Paper Products, and OtherMachinery and Equipment). Textiles, which is allocated here to the ‘intra-industry trade’group, also suffers from severe cost disadvantages in certain areas, and has been highlyprotected in the past. There is little doubt that moves offshore in these industries reflectthe cost disadvantages of locating certain stages of manufacturing in Australia.14 For

127Internationalisation, Trade and Foreign Direct Investment
example, according to the Textiles Clothing and Footwear Development Authority(TCFDA 1993), much of the investment offshore in clothing and footwear has beendirected to China in the area of low-value-added clothing manufactures (where labourcosts are estimated to be 4 per cent of those in Australia).
However, the industry has been able to retain some competitive elements withinAustralia. The domestic industry has restructured to focus more on low-volumeproduction, incorporating greater design content, higher quality, and higher prices(TCFDA 1993). Restructuring under these circumstances may well have enabledAustralia to hold onto these competitive areas of the industry. Furthermore, it may helpto generate competitive advantages in design and marketing in future, as these aspectsof the industry will not be weighed down by high relative costs in lower value-addingstages of production.
That said, there are likely to be substantial costs associated with adjustment for peoplewho find themselves out of work because of measures to improve productivity andrelocate production. The government has provided assistance for industries in transitionin order to lower the costs of adjustment and enhance restructuring of domesticproduction towards more competitive parts of the industry. Specific measures includeassistance with lowering the costs of upgrading capital stock, and more recently throughthe Import Credit Scheme which offers duty credits on exports, and the OverseasAssembly Scheme which provides preferential treatment of Australian fabrics assembledoverseas.
The experience of the Food, Beverages and Tobacco industry over the 1980s is moreproblematical. In some cases, the offshore investment, for example by major beverageproducers in Europe and North America, has been clearly market driven. In other cases,there has been cost-based restructuring of this industry along similar lines to that ofclothing and footwear. This process has, however, been helped along by Asian governmentsoffering investment incentives for agri-food producers to move operations to Asia. Howimportant these enticements have been is difficult to assess but two factors are worthconsidering.
First, the offshore FDI in these industries may have occurred at any event. The Asianmarket is extremely large and fast growing which would be a strong incentive for entryby Australian producers of food and beverages. Marketing success in these industries isoften associated with intangibles such as trademarks, strong cultural identification withthe product, and leading-edge packaging and promotions. Competitive advantagesassociated with production may not always be readily transferable to marketing anddistribution, as there may be significant imposts on the traded product arising fromtransport costs, duties and interest cost of capital tied to goods in transit.15 The nature ofthe products suggests that much of the offshore FDI in the 1980s may have come aboutthrough a legitimate desire to capture additional markets based on competitive strengthsdeveloped in Australia.
Second, there has been quite strong FDI investment in Australia in the Food,Beverages and Tobacco industry reflecting, among other things, Australia’s competitive
15. These factors were found to be especially significant for 25 manufacturing investors in the UK surveyedby Edwards (1994).

128 John Howe
advantage in agriculture, and location advantages in infrastructure and close proximityto the large Asian market (BIE 1994). More recently, there have been reports of strongJapanese investment in Australia in the food industry.16 In fact, in 1992, the Food,Beverages and Tobacco industry had a lower propensity to invest offshore comparedwith manufacturing as a whole (although this change may be related to the economicdownturn).
On balance, it seems unlikely that the increased orientation towards offshore FDI bythe Food, Beverages and Tobacco industry would have negative effects on the structureof the domestic industry. Indeed, overseas investment in this industry probably enhancesintra-industry trade and creates jobs in higher value-added areas (such as managementand technical services), as firms strive to maintain competitive advantages. It is true thatthere is a risk that overseas operations may develop to such an extent that we eventuallybecome relatively less competitive in these areas. However, that would imply more rapidinnovation, greater efficiency, and improved products on the part of the offshoreoperations. In such circumstances, rather than increased imports, we would likely seemore FDI inwards in Australia and the catch-up process would be reversed.
Finally, it is worth noting that many manufacturing industries in Australia increasedFDI liabilities, as well as FDI assets, in the 1980s (see Figure 11). This, of itself, isindicative of restructuring within industries. The net effect may be very small in termsof changes in the FDI orientation measure used here, but the implied restructuring canhave strong positive effects for the industries concerned. Also, while the discussion herehas focussed on the shift offshore following financial liberalisation, it is worth noting thatFDI assets were still only about 50 per cent of FDI liabilities in manufacturing in 1992(up from 25 per cent in 1980). The continued flow of inwards FDI to Australianmanufacturing by itself suggests that the industry has significant marketing and productionadvantages for foreign investors.
3.4 Changes in FDI Orientation and Trade Performance byIndustry
Apart from effects on industry structure, one concern about large changes in FDIflows is the impact on trade. This section examines the association between changes inFDI orientation from 1980 to 1988 and changes in manufacturing trade by industry overthe past decade or so.
Figure 12 shows the change in orientation of FDI over the period 1980 to 1988,alongside changes in the share of manufactured exports by industry from 1982 to 1992.If an industry has increased its propensity to hold FDI assets relative to liabilities(compared to the average for manufacturing as a whole) it will be in the positive half ofthe vertical axis. Industries that increased their relative share in exports will be in thepositive half of the horizontal axis.
The data shown in Figure 12 suggest that the change in outwards orientation of FDIdoes not appear to be systematically associated with changes in export shares. In some
16. See, for example, the article entitled ‘Manufacturing Lures Japanese Investment’ in the AustralianFinancial Review, 5 July 1994. Data in this article were drawn from the Australia-Japan EconomicInstitute.

129Internationalisation, Trade and Foreign Direct Investment
Figure 11: Changes in FDI Stocks Relative to Sales of Domestic Productby Manufacturing Industry, 1982 to 1988
Food, beverages and tobacco
Textiles
Clothing and footwear
Wood and wood products
Paper, printing, publishing
Chemical, petroleum and coal
Non-metallic mineral products
Basic metal products
Fabricated metal products
Transport equipment
Other machinery and equipment
Miscellaneous manufacturing
All manufacturing
-5 0 5 10 15 20 25
Change in FDI assets
Change in FDI liabilities
%%
industries (notably Clothing and Footwear) a shift towards holding more offshore assetscorresponds with very strong growth in exports. As noted earlier, both the Textiles andClothing and Footwear industries shifted less competitive later-stage processing plantsoffshore over the period. This meant increased intra-industry trade as Australian firmsincreased the export of early-stage products to offshore plants. The consequent growthin imports of the more highly processed products is particularly apparent for clothing andfootwear products (Figure 13).
In fact, if there is any systematic relationship between FDI flows and trade it may liein a positive correlation between the change in the volume of trade and total FDI(Figure 14). The figure suggests a very tenuous degree of complementarity between thetwo variables. More definitive results might emerge if comparisons could be made overa longer period of time, but the necessary data are not available.
Exports by industries that increased holdings of FDI liabilities also rose quitedramatically over the period (Figure 12). Much of this increase represents greaterproduct differentiation and specialisation in these industries. Not surprisingly, theseindustries did not increase imports to the same extent as those industries which tendedto shift production offshore (Figure 13).
The stand-out industry in Figures 12 and 13 is the Food, Beverages and Tobaccoindustry which increased its outwards FDI orientation significantly from 1980 to 1988and experienced sluggish growth in exports, and a more rapid growth in imports, relative

130 John Howe
Figure 12: Changes in FDI Orientation and Changes inIndustry Share of Exports
••
•
•
•
• ••
••
•
•
-3
-2
-1
0
1
2
3
-1.0 -0.5 0 0.5 1.0 1.5
Cha
nge
in F
DI o
rient
atio
n (1
980
to 1
988)
Change in industry share of exports (1982 to 1992)
Food, beverages &tobacco
Wood products
Basic metals
Transport equipment
Miscellaneous
Fabricated metals
Non-metallic mineralsChemical etc
Other machinery& equipment
Textiles
Paper products
Clothing & footwear
Note: The vertical axis is the same as that shown in Figure 10. It shows the change in each industriespropensity to hold offshore FDI assets relative to liabilities between 1980 and 1988. Industries locatedon the positive side of the horizontal axis have increased their share of exports of manufactures overthe period. The fact that just two industries are located on the negative side of the horizontal accesscan be explained by the very large share of the food, beverages and tobacco industry in manufacturedexports (being 37 per cent in 1982 and 26 per cent in 1992). Industry export shares are in naturallogarithms.
to other industries. There may be a suggestion that the shift in FDI orientation has beenharmful for this industry.
On the imports side it is probable that Australia’s demand for imported (highlydifferentiated) food and beverages reflects changes in the structure of our population andgreater competition from Asian producers, along with the well-known effects of ECagricultural subsidies.
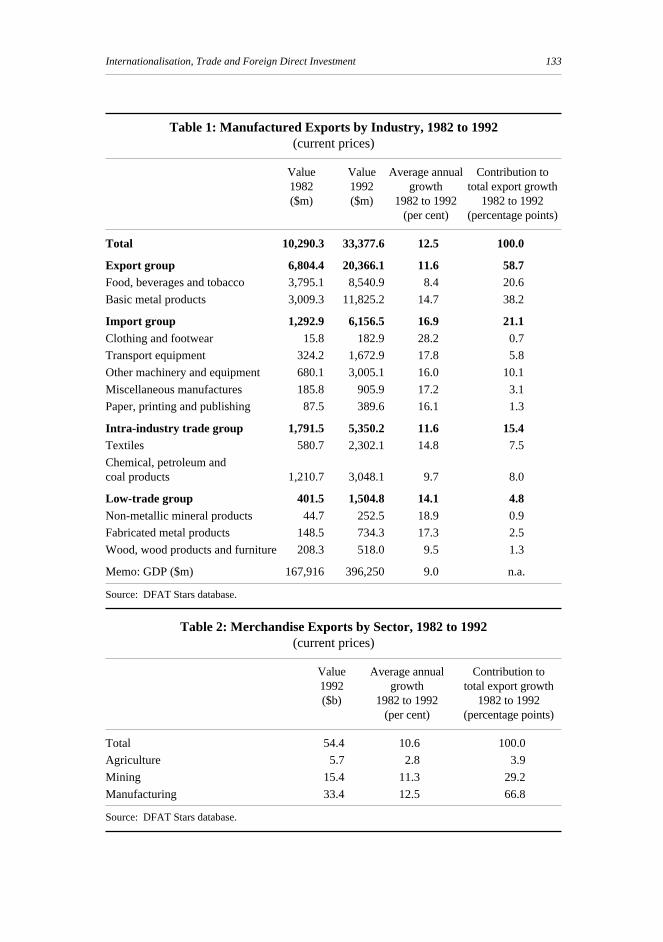
On the exports side we need to place the relatively poor performance of Food,Beverages and Tobacco over the past decade in the context of the very strong performanceof all other manufacturing industries over the period. Table 1 shows the growth inmanufactured exports for manufacturing industries at the 2-digit ASIC level between1982 and 1992, classified according to the trade groups used in this paper. It is true thatexports by the Food, Beverages and Tobacco industry grew slower than average over thepast decade. But nominal growth of exports from food, beverages and tobaccomanufacturers was still a very respectable 8.4 per cent per year between 1982 and 1992,

131Internationalisation, Trade and Foreign Direct Investment
Figure 13: Changes in FDI Orientation and Changes inIndustry Share of Imports
••
•
•
•
• • •
••
•
•
-3
-2
-1
0
1
2
3
-0.2 -0.1 0 0.1 0.2 0.3
Cha
nge
in F
DI o
rient
atio
n (1
980
to 1
988)
Change in industry share of imports (1982 to 1992)
Food, beverages& tobacco
Wood products
Basic metals
Transport equipment
Miscellaneous
Fabricated metals
Non-metal minerals
Chemical etc
Other
Textiles
Paper products
Clothing & footwear
Note: The vertical axis is the same as that shown in Figures 10 and 12. It shows the change in each industry’spropensity to hold offshore FDI assets relative to liabilities between 1980 and 1988. Industries locatedon the positive side of the horizontal axis have increased their share of imports of manufactures overthe period. Industry import shares are in natural logarithms.
which was only marginally below nominal GDP growth. In fact, exports of food,beverages and tobacco products grew much more quickly than did exports of theagricultural products from which they are made (see Table 2). Moreover, since worlddemand for early stage manufactured foodstuffs is probably linked quite closely to thedemand for primary produce (EPAC 1988), the slow growth in agricultural exports maysuggest a primary reason for the relative decline in exports of food, beverage and tobaccomanufactures.
Virtually every other manufacturing industry experienced export growth well inexcess of GDP growth over the period 1982 to 1992. Perhaps the most notable featurebeing the rapid export growth from those industries that started from a position of beingleast competitive – the ‘import group’ (Table 1). The impressive export performance ofthe import-group industries over the past decade is encouraging as it suggests Australiais able to successfully compete in niche markets for more highly value-added products.17
17. Many of these industries receive export assistance, be it explicitly or implicitly. However, the impact ofthese programs on export growth from these industries is unclear, although in some cases it is believed tobe significant (see IC (1993)). Of course, the ultimate test of the viability of these industries will be whenthis assistance is removed.

132 John Howe
Figure 14: Changes in Shares of Total FDI Stocks andTrade Share
•
• •
•
••
•
•
•
•
•
•
-0.20
-0.15
-0.10
-0.05
0
0.05
0.10
0.15
0.20
0.25
0.30
0.35
-1.5 -1.0 -0.5 0 0.5 1.0 1.5
Cha
nge
in s
hare
of t
rade
(19
82 to
199
2)
Change in share of FDI stocks (1980 to 1988)
Food, beverages & tobaccoWood & wood products
Basic metals products
Transport equipment
Miscellaneous manufactures
Fabricated metals
Non-metal minerals
Chemicals etc
Other machinery & equipment
Textiles
Paper etc
Clothing & footwear
Note: The vertical axis shows the change in trade intensity (exports plus imports) for each industry relativeto the change for total manufacturing. The horizontal axis shows the change in total FDI stocks (assetsplus liabilities) for each industry relative to the change for total manufacturing. All shares are innatural logarithms.
It is consistent with the findings of the recent Emerging Exporters study (McKinsey andCo. 1993).18 In fact, the results may even indicate a wider export success for nichemarketing of import group industries than that suggested by McKinsey and Co. (1993),which focussed on the performance of selected firms from all manufacturing industries.
On balance, therefore, the decline in share of food, beverage and tobacco exports doesnot appear to be due to an increased propensity for investment offshore. It is more likelyto be a consequence of shifts in world demand and the very strong export performanceby other manufacturing industries.
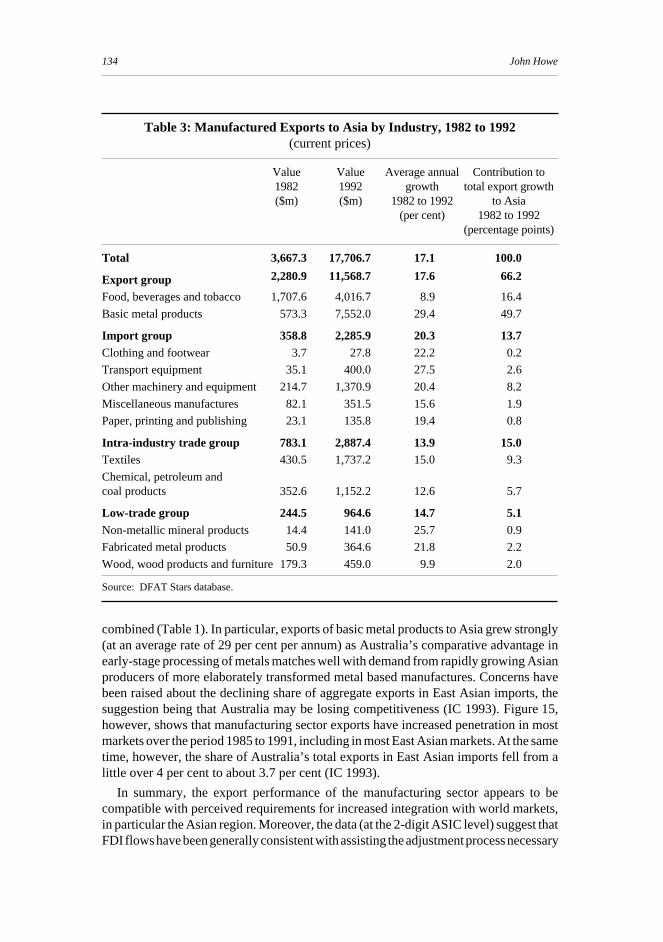
Another encouraging aspect of the performance of Australia’s manufacturing exportsfrom 1982 to 1992 is the very strong growth in exports to Asia (see Table 3). The growthrate of exports in all manufacturing industries (with the exception of miscellaneousmanufactures) from 1982 to 1992 was greater for Asia (Table 3) than for all regions
18. The AMC/McKinsey study found that many low-trade firms are competing successfully in areas such asproduct design, customer service, and timeliness, thereby overcoming the disadvantage posed by high unitlabour costs and the distances between Australia and its export markets. Although encouraging, it shouldbe noted that these firms remain the exception rather than the rule.They do, however, indicate that potentialexists for Australian manufacturing to develop world-competitive firms in niche markets.
133Internationalisation, Trade and Foreign Direct Investment
Table 1: Manufactured Exports by Industry, 1982 to 1992(current prices)
Value Value Average annual Contribution to1982 1992 growth total export growth($m) ($m) 1982 to 1992 1982 to 1992
(per cent) (percentage points)
Total 10,290.3 33,377.6 12.5 100.0
Export group 6,804.4 20,366.1 11.6 58.7Food, beverages and tobacco 3,795.1 8,540.9 8.4 20.6
Basic metal products 3,009.3 11,825.2 14.7 38.2
Import group 1,292.9 6,156.5 16.9 21.1Clothing and footwear 15.8 182.9 28.2 0.7
Transport equipment 324.2 1,672.9 17.8 5.8
Other machinery and equipment 680.1 3,005.1 16.0 10.1
Miscellaneous manufactures 185.8 905.9 17.2 3.1
Paper, printing and publishing 87.5 389.6 16.1 1.3
Intra-industry trade group 1,791.5 5,350.2 11.6 15.4Textiles 580.7 2,302.1 14.8 7.5
Chemical, petroleum andcoal products 1,210.7 3,048.1 9.7 8.0
Low-trade group 401.5 1,504.8 14.1 4.8Non-metallic mineral products 44.7 252.5 18.9 0.9
Fabricated metal products 148.5 734.3 17.3 2.5
Wood, wood products and furniture 208.3 518.0 9.5 1.3
Memo: GDP ($m) 167,916 396,250 9.0 n.a.
Source: DFAT Stars database.
Table 2: Merchandise Exports by Sector, 1982 to 1992(current prices)
Value Average annual Contribution to1992 growth total export growth($b) 1982 to 1992 1982 to 1992
(per cent) (percentage points)
Total 54.4 10.6 100.0
Agriculture 5.7 2.8 3.9
Mining 15.4 11.3 29.2
Manufacturing 33.4 12.5 66.8
Source: DFAT Stars database.
134 John Howe
Table 3: Manufactured Exports to Asia by Industry, 1982 to 1992(current prices)
Value Value Average annual Contribution to1982 1992 growth total export growth($m) ($m) 1982 to 1992 to Asia
(per cent) 1982 to 1992(percentage points)
Total 3,667.3 17,706.7 17.1 100.0
Export group 2,280.9 11,568.7 17.6 66.2
Food, beverages and tobacco 1,707.6 4,016.7 8.9 16.4
Basic metal products 573.3 7,552.0 29.4 49.7
Import group 358.8 2,285.9 20.3 13.7Clothing and footwear 3.7 27.8 22.2 0.2
Transport equipment 35.1 400.0 27.5 2.6
Other machinery and equipment 214.7 1,370.9 20.4 8.2
Miscellaneous manufactures 82.1 351.5 15.6 1.9
Paper, printing and publishing 23.1 135.8 19.4 0.8
Intra-industry trade group 783.1 2,887.4 13.9 15.0Textiles 430.5 1,737.2 15.0 9.3
Chemical, petroleum andcoal products 352.6 1,152.2 12.6 5.7
Low-trade group 244.5 964.6 14.7 5.1Non-metallic mineral products 14.4 141.0 25.7 0.9
Fabricated metal products 50.9 364.6 21.8 2.2
Wood, wood products and furniture 179.3 459.0 9.9 2.0
Source: DFAT Stars database.
combined (Table 1). In particular, exports of basic metal products to Asia grew strongly(at an average rate of 29 per cent per annum) as Australia’s comparative advantage inearly-stage processing of metals matches well with demand from rapidly growing Asianproducers of more elaborately transformed metal based manufactures. Concerns havebeen raised about the declining share of aggregate exports in East Asian imports, thesuggestion being that Australia may be losing competitiveness (IC 1993). Figure 15,however, shows that manufacturing sector exports have increased penetration in mostmarkets over the period 1985 to 1991, including in most East Asian markets. At the sametime, however, the share of Australia’s total exports in East Asian imports fell from alittle over 4 per cent to about 3.7 per cent (IC 1993).
In summary, the export performance of the manufacturing sector appears to becompatible with perceived requirements for increased integration with world markets,in particular the Asian region. Moreover, the data (at the 2-digit ASIC level) suggest thatFDI flows have been generally consistent with assisting the adjustment process necessary

135Internationalisation, Trade and Foreign Direct Investment
Note: Market penetration by Australia’s manufactured exports is the share of Australia’s manufacturingexports in each country’s manufacturing imports on a broad economic category basis.
US
Can
ada
Mex
ico
Japa
n NZ
Brun
ei
Indo
nesi
a
Mal
aysi
a
Philip
pine
s
Thai
land
Hon
g Ko
ng
Kore
a
Sing
apor
e
Taiw
an
0
2
4
6
8
10
12
14
16
18
0
2
4
6
8
10
12
14
16
18
1985
1991
% %
Figure 15: Penetration of Markets by Australia’s Manufactured Exports
for a better trade performance. The lack of FDI investment in Asia (relative to total FDIassets) may have meant slower growth of exports to Asia than would otherwise be thecase (IC 1993). However, the growth in exports to Asia has been impressive and with FDIoutflows from Australia’s manufacturing sector to Asia set to increase (see AccessEconomics (1994)), this constraint is likely to become less important.
That said, the very strong performance of some of the less competitive ‘import group’industries is partly due to government assistance with restructuring aimed at loweringcosts, promoting exports, and improving links with multinational companies. A morecomplete assessment of the underlying strength in these industries awaits the unwindingof restructuring assistance measures.
Finally, it needs to be remembered that manufacturing sector imports also grew verystrongly over the past decade, and imports exceeded exports by more than $28 billion in1992. The fact that imports exceed exports in manufacturing is not surprising. Thegeneration of strong export growth relies on Australia’s ability to produce specialisedgoods for niche markets. This takes time and involves increased imports as intra-industrytrade expands.
3.5 Intra-Industry Trade
Throughout the discussion of recent trends in Australia’s trade and FDI, mention hasbeen made of signs that intra-industry trade has increased over the past decade. A
136 John Howe
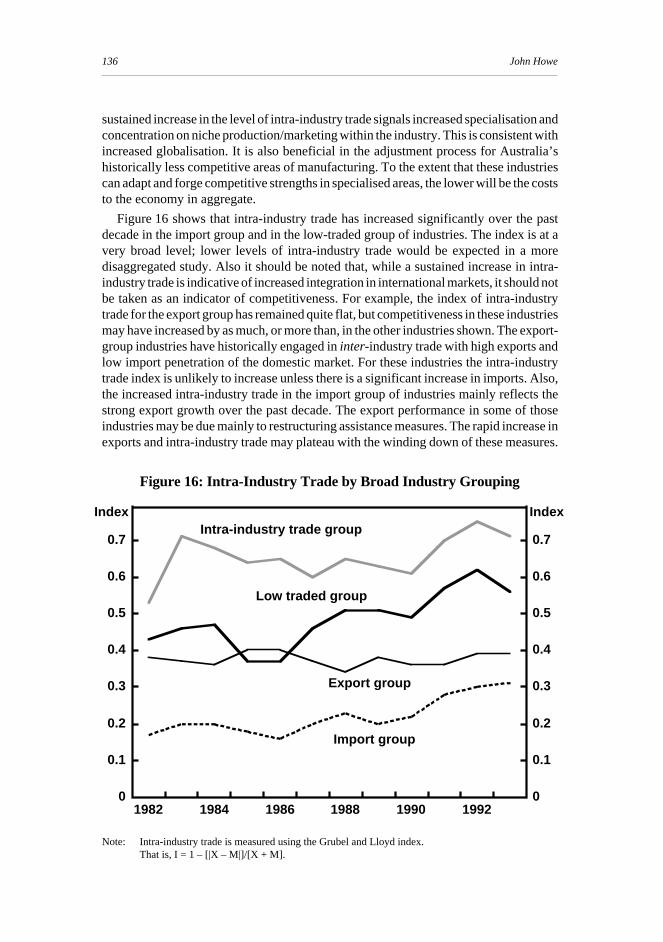
sustained increase in the level of intra-industry trade signals increased specialisation andconcentration on niche production/marketing within the industry. This is consistent withincreased globalisation. It is also beneficial in the adjustment process for Australia’shistorically less competitive areas of manufacturing. To the extent that these industriescan adapt and forge competitive strengths in specialised areas, the lower will be the coststo the economy in aggregate.
Figure 16 shows that intra-industry trade has increased significantly over the pastdecade in the import group and in the low-traded group of industries. The index is at avery broad level; lower levels of intra-industry trade would be expected in a moredisaggregated study. Also it should be noted that, while a sustained increase in intra-industry trade is indicative of increased integration in international markets, it should notbe taken as an indicator of competitiveness. For example, the index of intra-industrytrade for the export group has remained quite flat, but competitiveness in these industriesmay have increased by as much, or more than, in the other industries shown. The export-group industries have historically engaged in inter-industry trade with high exports andlow import penetration of the domestic market. For these industries the intra-industrytrade index is unlikely to increase unless there is a significant increase in imports. Also,the increased intra-industry trade in the import group of industries mainly reflects thestrong export growth over the past decade. The export performance in some of thoseindustries may be due mainly to restructuring assistance measures. The rapid increase inexports and intra-industry trade may plateau with the winding down of these measures.
Figure 16: Intra-Industry Trade by Broad Industry Grouping
Note: Intra-industry trade is measured using the Grubel and Lloyd index.That is, I = 1 – [|X – M|]/[X + M].
1982 1984 1986 1988 1990 19920
0.1
0.2
0.3
0.4
0.5
0.6
0.7
0
0.1
0.2
0.3
0.4
0.5
0.6
0.7Intra-industry trade group
Low traded group
Export group
Import group
IndexIndex

137Internationalisation, Trade and Foreign Direct Investment
4. Some Issues Arising from FDI FlowsThe data presented in Sections 2 and 3 confirm that a feature of the process of
internationalisation or globalisation in Australia is increased foreign direct investmentand trade. Also, the cyclical nature of FDI suggests that FDI, both outwards and inwards,may be set to increase once recovery becomes more widespread. For example, on theoutwards FDI side, Access Economics (1994) has estimated that as of March 1994, about25 per cent of the value of projects to which Australian companies are committed (or areconsidering) would be directed offshore, compared with a figure of about10 per cent just one year ago.
Greater caution following the debt overhang in the 1980s may see increased flows ofinwards FDI (equity) in the 1990s (Whitelaw and Howe 1992). In addition, theimportance of profitability in attracting FDI (Figure 3) and the current high levels ofprofitability, along with our geographical and trade links with the fast-growing Asianeconomies may help to attract FDI into Australia.
In theory, FDI can generate ‘win-win’ benefits similar to those generated throughtrade. FDI inwards can contribute to investment, import spillover benefits, increasecompetition domestically, and provide access to world markets. FDI outwards cangenerate high returns for domestic investors, export management expertise and know-how, enable the purchase of foreign technologies, and expand the market for internationallycompetitive domestic firms. Yet, the benefits of FDI are sometimes qualified.
Not everyone will welcome high levels of FDI flows. Setting aside ‘cultural’arguments, typical concerns about FDI inflows in this context include: the potential tobias domestic production towards relatively low-value-added or low-growth industries;concerns about excessive market power of multinational enterprises (MNEs) (especiallyin certain industries such as the media); and beliefs that MNEs contribute to currentaccount deficits, both through policies that are biased against net exporting and throughundesirable capital inflows (that subsequently drive current account deficits, throughservicing requirements).19 It is also argued that outwards FDI can have negative effectson the structure of the domestic economy. In addition, there is a concern that outwardsFDI may reduce domestic investment, exports and employment opportunities.20
The consensus among economists, however, is that such problems are either illusory,overstated or should be addressed directly rather than intervening in capital markets (andrisking the loss of benefits associated with FDI, among other things).
4.1 FDI Flows and Industry Structure
It has been argued that FDI inwards can bias domestic production by displacinginvestment in strategic domestic activities such as research and development. Testingthis hypothesis is beyond the scope of this paper. However, it should be noted that ifsomething untoward were happening in this area, it would be likely to have implicationsfor the conduct of domestic industry policy, rather than for capital market arrangements.
19. These sentiments appear to be more prevalent in the US where residents may have been surprised by theinflux of FDI into that country in recent years (Graham and Krugman 1989). But with the strong flow ofFDI into Australia recently, these issues may resurface. For an Australian perspective see Jones (1992).
20. Such concerns explain the restrictions placed on outwards FDI in Australia until the 1980s. See BIE (1984).

138 John Howe
Another example of distortionary behaviour by FDI investors is alleged discriminatorycommercial policies that distort domestic production (for example, procurement that isbiased towards imports from the home market and export franchises). It is by no meansclear that there are problems here. For example, the sourcing of inputs from the homecountry may be based on sound commercial considerations because home suppliers holdadvantages (technological or otherwise) needed by the affiliate. Also, such advantagesmay diminish over time as suggested by MITI (1992). In fact, this issue may be morecritical for Japanese FDI into the US than for Australia. Drysdale (1993) presentsevidence to suggest that, in 1990, Japanese affiliates in Australia exported a greaterpercentage of total sales back to Japan than for investments in North America andEurope, while maintaining a fairly average ratio of imports in total purchases.
In addition, the discussion in Section 3 suggested that recent trends in the directionand composition of Australia’s manufacturing trade have been consistent with perceivedneeds to create a more externally-oriented industry, focussing on production and exportof more highly differentiated products for niche markets. Exports from industries basedon adding value to mining resources have also grown strongly over the period, whereasexports of manufactures based on agricultural products have been relatively subdued.FDI flows, both inwards and outwards, appear to have been consistent with the industryrestructuring needed to underpin a better trade performance.
Problems with multinational enterprises exercising market power also reflect more ondomestic competition policies than on the behaviour of MNEs. In fact, there is a widelyheld view that industry concentration is not a problem as long as new firms can enterrelatively easily. Unrestricted threat of entry by foreign investors may therefore bepositive for domestic competition. Also, foreign investors can increase domesticcompetition through the use of new technology and management/workplace practices.Competition among potential suppliers to the foreign company may also be enhanced.
Concerns about alleged abuse of market power and strategic behaviour favouring thehome market by FDI investors will remain. However, the analysis in this paper suggeststhat if there are problems in this area, they do not appear to have been very systematic,or the effects are so small as to have little or no impact at more aggregate levels. The likelyanswer is that abuses of market power by FDI investors proceed along similar lines asabuses by domestic investors – that is, on a case by case basis. It is worth noting that inthe presence of factor-market imperfections, any investment (by domestic or foreigninvestors) is capable of distorting industry structure and trade.21 The practical solutionis to improve the operation of the appropriate market, through industry or competitionpolicy. Should there be a specific instance of distortion-creating behaviour by FDIinvestors (in or out) there would probably be little or no implication for aggregate policygoverning FDI flows.
4.2 FDI and the Current Account
Arguments that foreign companies influence the current account (in any direction)ignore the fact that current account deficits arise through domestic saving being less thaninvestment, both of which are thought to be driven by more fundamental factors than the
21. For example, domestic investors could shepherd domestic labour into low-value-added activities if theinvestment is aimed at extracting rents through the exploitation of market power.The rents may be retainedin the domestic economy but that is unlikely to help with obtaining the best industry or trading structure.

139Internationalisation, Trade and Foreign Direct Investment
structure of external finance. On this view, to the extent that there are any effects of MNEintervention in trade flows, they would eventually be unwound by changes in the realexchange rate.22 Also, inwards FDI appears to respond to fundamentals governingAustralia’s investment climate (including growth and profitability), rather than tochanges in the aggregate financing requirement. Attempts to address the current accountdeficit through intervention in FDI flows would involve a high risk that adjustment maycome about at a substantial cost to growth (through lower investment).
A coincident increase in both FDI inwards and outwards, such as we saw in the 1980s,may see a continuation of the dominant role for what is often regarded as more‘footloose’ portfolio and other capital in financing the current account deficit. Figure 17shows that the increase in outwards FDI meant that in net terms, FDI flows were very lowin the 1980s. There is a suggestion that portfolio and other inflows helped to financeoffshore FDI investment (Bullock, Grenville and Pease 1992).
If this happened again in the 1990s, net external debt would probably continue to growin importance relative to equity in net external liabilities. Although this may help toalleviate concerns about ‘selling off the farm’, it may create renewed concern aboutexposure of the domestic economy to external shocks, and the costs of adjustmentassociated with increasing external debt.
On the basis of research by Kearney (1992) and Carmichael (1992), EPAC (1992)concluded that increased capital mobility has not been a source of greater macroeconomicinstability, although the view is not universal (Schubert 1992). The potentially adverseconsequences of capital market failures continue to be of concern to policy makers,although there is general recognition that there is little to be gained through directgovernment intervention in capital markets. To the extent that increasing external debt(or portfolio equity) creates problems, it reflects inadequate domestic saving rather thaninappropriate external financial structures. Debate about a role for government ininfluencing the level of foreign debt rightly focus on its role in promoting domesticsaving. See FitzGerald (1993), Whitelaw and Howe (1992) and Collins (in this Volume)for a discussion of these issues.
4.3 FDI Outflows and Domestic Investment
It is sometimes argued that outwards FDI may reduce domestic investment, exportsand employment opportunities. For example, using a cross-country study of OECDcountries, Feldstein (1994a) estimated that each $1 of outward FDI from the US reducesthe domestic capital stock by about 20 to 40 cents. The implication is that export potentialis shifted offshore. This view relies on the existence of impediments to internationalcapital flows which mean that expansion of domestic capital stock is reliant on domesticsaving.23
22. See Graham and Krugman (1989), Forsyth (1990) and EPAC (1993) for an Australian perspective on this.
23. In other words, outwards FDI shifts domestic saving offshore and domestic investors cannot access foreignsaving to finance the implied increase in domestic investment opportunities.The importance of domesticsaving for capital stock expansion is underlined by the widely held view that high rates of domestic savinghave been an important factor in strong growth in the developing Asian economies. But capital marketsare still regulated in these countries. For example, many of these countries have discouraged FDI as asource of capital, and high domestic saving may have been a more important source of finance for themthan is the case in the developed countries. Also, World Bank (1993) found that per capita GDP growthwas more likely to be leading to high rates of saving in the rapidly growing East Asian economies ratherthan the other way around.

140 John Howe
Figure 17: Net FDI, Portfolio and Other Inflows(per cent of GDP)
60/61 64/65 68/69 72/73 76/77 80/81 84/85 88/89 92/93-1
0
1
2
3
4
5
-1
0
1
2
3
4
5
%%
Net portfolio and other inflow
Net FDI inflow
Note: Net non-official borrowing is the upper line on this stacked figure. It is equal to net FDI plus netportfolio and other capital inflows.
The notion that outwards FDI causes permanently higher unemployment requiresdomestic labour-market rigidities which impede adjustment to full employment (followingany dislocation of jobs directly related to the offshore investment). Although correctionof these rigidities may involve some short-term pain, their existence means that therewould be high welfare costs associated with any economic shock – and policy shouldaddress them directly. Governments can help with the adjustment through programsaimed at reducing costs for the employees concerned, but impeding the flow of FDIoffshore is likely to be counter-productive.
However, if outwards FDI lowers domestic investment (as claimed by Feldstein) itcould lead to lower capital per worker domestically, reduced productivity growth andlower real wages. There are several points that mitigate such concerns.
First, there may be differing impacts of outwards FDI on a large country that is a worldleader in many production technologies (such as the US) compared with smaller, moreopen, countries that import technology, like Australia.
Second, country-specific studies have generally found that there is no reduction in theaggregate capital stock due to outwards FDI. Blomstrom and Kokka (1994), in aliterature review of the issue for Sweden found that outwards FDI in that countrystimulated domestic exports and investment. The result is based on the view that thesubsidiary captures a greater market share than otherwise possible, and the exports of

141Internationalisation, Trade and Foreign Direct Investment
finished products that are displaced are offset by Swedish exports of intermediate goodsand related products. Lipsey and Weiss (1981) and Lipsey (1994) have drawn similarconclusions based on US data.
Although data constraints have not enabled econometric studies of the effects ofoutwards FDI on exports and capital stock in Australia, most reports that have addressedthe issue suggest that we should not be too concerned about possible negative impacts.The BIE (1984), Yetton et al. (1991), McKinsey and Co. (1993), and Edwards (1994) allconcluded that outwards FDI was in net terms complementary to Australian exports.Thomsen and Nicholaides (1991) drew the same conclusion for Japanese outwards FDI.The OECD (1992b) suggests that for Japan a 1 per cent increase in the stock of outwardFDI is associated with a 0.65 per cent increase in private capital stock in the domesticmarket.
Third, there are data which do not appear to support the notion that outwards FDI issystematically harmful for export growth, or for growth in capital stock per worker.Figure 18 suggests that changes in the trend rate of growth in exports between 1970-1984and 1984-1991 across a sample of OECD countries is not strongly correlated with thechange in holdings of FDI assets over the same periods.
Note: The changes in outwards FDI and export growth relate to the periods 1984-91 and 1970-84. For FDIthe change refers to the increase in FDI stocks from 1984 to 1991 less the increase from 1970 to 1984.The change in real export growth refers to the change in the trend rate of growth in exports from 1984to 1991 less the trend rate of growth from 1970 to 1984. Exports are in volumes. FDI stocks arenominal relative to GDP. The sources of data for FDI stocks from 1970 to 1984 are Sinn (1990) and,from 1984 to 1991, Rider (1994). The export data are drawn from the OECD.
Figure 18: Changes in Outwards FDI and Export Growth in OECDCountries
Switzerland
Australia
Finland
Sweden
•
••
•
•
•
•
•
••
••
•
•
•
•
•
-5
-3
-1
1
3
5
7
9
11
-4 -2 0 2 4 6 8 10 12 14
Cha
nge
in tr
end
expo
rt g
row
th (
% p
.a.)
Change in outwards FDI stocks (% of GDP)

142 John Howe
Figure 19 suggests that those countries which increased FDI outwards the most after1984 tended to experience a lower trend reduction in capital deepening in the businesssector than on average.24 This implies that rather than reducing capital per worker,outwards FDI may help to increase it. One explanation is that outwards FDI from OECDcountries may be biased towards labour-intensive industries such that domestic capitalintensity is increased by the outflow. An example of this in Australia is the shift offshoreof parts of the clothing and footwear industry – which has hardly made a strongcontribution to exports. If this is the case, it is consistent with the finding elsewhere inthis Volume (see Fahrer and Pease) that pursuit of productivity improvements have beenthe important factor in reducing employment opportunities for relatively unskilledworkers in the 1980s.
Fourth, increases in the capital stock are not necessarily ‘good’ per se. It is rates ofreturn that matter. Feldstein (1994b) found that, although outwards FDI reducesdomestic investment, it is welfare enhancing for US residents as long as the after-tax rate
24. Trend growth in capital per worker (capital deepening) declined in most OECD countries in the 1980s asthe general increases in real unit labour costs in the 1970s were unwound.
Figure 19: Changes in Outwards FDI and Growth of Capital per Workerin OECD Countries
•
•
•
• •
•
••
•
• •
•
•
•
••
•
-7
-6
-5
-4
-3
-2
-1
0
1
2
-4 -2 0 2 4 6 8 10 12 14Cha
nge
in tr
end
grow
th in
cap
ital p
er w
orke
r (%
p.a
.)
Change in outwards FDI stocks (% of GDP)
Spain
Australia
Note: FDI outwards is the same as for Figure 18. Capital per worker is business sector capital stock relativeto total employment. The data are drawn from the OECD Outlook Database. The change in trendgrowth of capital per worker is determined in the same way as export growth in Figure 18.

143Internationalisation, Trade and Foreign Direct Investment
of return on the investment exceeds the after-tax cost of foreign borrowing used tofinance the investment. This is based on the assumption that debt capital raised by foreignsubsidiaries cannot be imported by the parent company to finance additional investmentin the US – that is, it is an additional source of capital that is unavailable to domestic USinvestors.
Finally, the level of the domestic capital stock is determined by FDI inwards as wellas outwards. Australia has always been able to raise sufficient capital to maintain aninvestment rate well above the OECD average and this continued during, and after, thelarge increase in outwards FDI in the 1980s. If we have a problem, it is that we have beenunable to use our capital stock as efficiently as our competitors – our capital productivityis about 10 per cent lower than the OECD average.25 The internationalisation of theeconomy appears to be helping to get the right structure of domestic investment (seeSection 3), and it should also help to improve the quality of investment throughembedded efficiency improvements. If we get these things right, we will almost certainlyget right the amount of aggregate investment.
4.4 FDI Inflows and Domestic Investment
Figure 20 suggests that FDI investors, in aggregate, may be somewhat more sensitiveto (or in a better position to react to) changes in the domestic climate than domesticinvestors. It shows that the relative decline in importance of FDI as a component ofprivate business investment corresponds quite closely with the decline in companyprofitability seen in the mid 1970s. In other words, the data suggest that the allocationof foreign (or international) saving by multinational companies is more mobile than thatof domestic saving. Alternatively, if the new growth theories which ascribe a key role forinvestment are correct, it is consistent with FDI inwards helping to drive economicgrowth in Australia.
Either way, the data suggest that FDI investors in Australia play an important role indisciplining domestic economic management. This discipline may even go beyond thatwhich multinational enterprises impose on private sector competitors and potentialsuppliers of goods and services to the MNEs. It adds weight to Kasper’s (1992)arguments that the more immobile factors of production, such as government andworkers, must create an attractive environment for investment. Moreover, it supports theview that we need to focus our attention on getting the climate for domestic investmentright as the best means of attracting international capital. (See BIE (1993a) among manyothers.)
As is the case in most OECD countries, in the second half of the 1980s much was doneto improve the domestic investment climate. That this is bearing fruit for Australia issuggested by recent improvements in perceptions about Australia’s competitive position,as monitored by the IMD/World Economic Forum (1993),26 especially in relation to the
25. It has been argued that this may be due to relative prices in Australia favouring less productive dwellinginvestments, compared with equipment (Dowrick 1994).Whitelaw (1994), however, argues that relativelyhigh prices of equipment in Australia is a byproduct of lower efficiency growth.
26. Especially in relation to the executive opinion survey contained in that report.

144 John Howe
Figure 20: Share of FDI in Private Business Investment andCorporate Profitability
68/69 72/73 76/77 80/81 84/85 88/89 92/930
4
8
12
16
20
0
5
10
15
20
25
Share of company profits in GDP(at factor cost) (LHS)Share of FDI in private businessinvestment (RHS)
% %
27. In this sense, the process of globalisation has probably increased competition among governments inproviding a suitable economic climate for investment.
government’s performance in enhancing competitiveness and progress oninternationalisation.
An FDI investor will clearly ascribe different weights to the various factors thatdetermine location, depending on the characteristics of the project. It would be usefulfrom a policy point of view to have a better idea of the relative importance of thecontributing factors governing FDI flows in Australia, so that policy may be concentratedin certain areas. But, it needs to be borne in mind that location is determined on a projectby project basis. For example, we might conclude that, in general, unit labour costs mayreceive little weight as a locational determinant for a higher-wage country such asAustralia (especially with the abundance of cheaper and productive labour nearby inAsia). However, in the specific case, it may be the critical determinant of the choicebetween Australia and another similar OECD country. Also, the increased mobility ofcapital, and embodied technology and management skills, has meant that the costs ofpolicy failure are potentially high.27
Finally, the internationalisation of the economy gives cause for optimism that thenecessary changes are occuring to allow Australia to reap the full benefit of its recources.FDI plays a central role in this process. The challenge for govenment is to create the

145Internationalisation, Trade and Foreign Direct Investment
climate to encourage high and profitable investment. Amongst other things this requires:ensuring appropriate taxation arrangements; enhancing the efficiency of economic andsocial infrastructure; improving the quality of human capital and technological capability;containing production costs; encouraging flexible workplace practices; and ensuringstable economic management. The process of internationalisation increases the benefitsof getting these policies right.

146 John Howe
Appendix A: Motivations and Locational Determinants ofDirect Investment
The decision to invest abroad is generally thought to be motivated by differentialreturns on investment and the need for portfolio diversification. But, these factors alonefail to explain the distinction between ‘portfolio and other’ investment which does notrequire control over the host country assets, and FDI investment, which does (IMF 1991;Harris 1994).28 In a perfect world there is no reason for choosing to exercise this control.The various explanations for the decision to invest directly in another economy havetherefore come to rely on market imperfections of one sort or another.
The eclectic framework developed by Dunning (1988) combines three strands oftheory on FDI – industrial organisation, internalisation theory, and location theory.29 Itsuggests that a firm will engage in FDI only if:
• the firm possesses ownership advantages (e.g. patents, trademarks, managementskills, and exclusive access);
• there are market imperfections such that it is more profitable for the firm thatpossesses ownership advantages to use them itself, rather than to sell or lease themto foreign firms; and
• it is profitable for the firm to utilise its advantages in conjunction with some factorinputs outside its home country.
The first two conditions establish the reasons that a firm may want to invest abroad.The third provides an insight into the issue of why certain locations are chosen overothers.
Country advantages as locations for direct investment can take several forms.Table A1 shows the results of a survey of econometric studies of the effects of host andhome-country characteristics on locational decisions by firms. Relatively little attentionhas been given to home-country characteristics to date, although Culem (1988) suggeststhat home characteristics relative to those in the host country can be influential in somecircumstances. The results suggest that important host characteristics include market-based criteria such as the existing industry concentration, sales, population, and GNP.Market size is intuitively important. Taking a firm-specific advantage and succeeding inthe US market, even if it were not growing much, would generate much larger profits thantaking the same advantage to a rapidly growing Tuvalu (population 10,000). On the otherhand, growth prospects are clearly important for assessing future demand.
The more policy-based variables capable of influencing the locational decisions ofmultinationals include trade-related measures (depending on the orientation of theinvestments), tax-related measures, transport infrastructure, and economic management.Skill levels, technological capability, and unit input costs are also shown to be keydeterminants of location.
28. In fact, differential returns and portfolio diversification are regarded as satisfactory explanations for‘portfolio and other’ investment.
29. Other theories, such as the product cycle and strength of currency, are regarded as unsatisfactory in somecrucial areas (IMF 1991).

147Internationalisation, Trade and Foreign Direct Investment
Another approach, that may have some application in Australia, is the process-oriented model of Johanson and Vahlne (1977) which suggests that initially companiesfocus on culturally close markets as potential locations, but more distant markets areconsidered as companies gain more experience (Yetton et al. 1991). Proximity andhaving the same language relative to the home country are also important according toVeugelers (1991).
The information in the following table is drawn from a background paper byHarris (1994) which presents results from a survey of econometric studies (in some casesusing data drawn from companies and in others using aggregate statistics), of the effectsof host and home-country characteristics on locational decisions by firms.
Table A1: Locational Determinants of Direct Investment
Variable Reference Effect Comment
Host countryvariables:Population Ondrich and Wasylenko (1993) Positive State study
Land area Coughlin et al. (1991) Positive State study
Bartik (1985) Positive State study
Per capita income Woodward and Rolfe (1993) Positive Developing countries
Coughlin et al. (1991) Positive State study
GDP (corrected Veugelers (1991) Positive Intra-OECD FDIfor openness)
GNP Culem (1988) Positive Inter-industrialisedcountries. Resultsvary by sample.US FDI in EC
Scaperlanda and Balough (1983) Positive US FDI in EC
Lunn (1980) Positive
Change in GNP Culem (1988) Positive Inter-industrialisedcountries. Generallysignificant butvaries with lag
Lunn (1980) Varies US FDI in EC
Acceleration in Lunn (1980) Positive US FDI in ECGNP
GNP growth Culem (1988) Positive Inter-industrialisedrelative to home countries.
Generally significant
Predicted sales Scaperlanda and Balough (1983) Positive US FDI in EC.Generally significant

148 John Howe
Variable Reference Effect Comment
Predicted sales Scaperlanda and Balough Positive US FDI in EC.growth (1983) Generally significant
Non-tariff barrier Jeon (1992) Positive Developed countries
Free trade zone Woodward and Rolfe (1993) Positive Export-orientedinvestment. Developingcountries
Trade barrier Culem (1988) Positive Inter-industrialisedcountries. Resultsvary by sample.US FDI in EC.Generally significant
Scaperlanda and Balough Positive US FDI in EC(1983)
Lunn (1980) Negative
Interest rate Culem (1988) Positive Inter-industrialisedrelative to rest countries. Oftenof world significant
Corporate and Luger and Shetty (1985) Negative Results vary bypersonal tax industry.
State study
Corporate tax Ondrich and Wasylenko (1993) Negative State study
Bartik (1985) Negative State study
Tax holiday length Woodward and Rolfe (1993) Positive Developing countries
Restrictions on Woodward and Rolfe (1993) Negative Developing countriesprofit repatriation
Transport Coughlin et al. (1991) Positive State studyinfrastructure
Expenditure on Ondrich and Wasylenko (1993) Positive State studyhigher education
Promotional Coughlin et al. (1991) Positive State studyexpenditure toattract MNEs
Effort index Luger and Shetty (1985) Positive State study
Political stability Woodward and Rolfe (1993) Positive Developing countries(rating)
Exchange rate Woodward and Rolfe (1993) Positive Developing countriesdevaluation
Inflation rate Woodward and Rolfe (1993) Negative Developing countries
Jurisdiction deficit Ondrich and Wasylenko (1993) Negative State study
User charges Ondrich and Wasylenko (1993) Negative State study

149Internationalisation, Trade and Foreign Direct Investment
Variable Reference Effect Comment
Manufacturing Ondrich and Wasylenko (1993) Positive State studyconcentration
Woodward and Rolfe (1993) Positive Developing countries
Coughlin et al. (1991) Positive State study
Bartik (1985) Positive State study
Luger and Shetty (1985) Positive State study
Carlton (1983) Positive State study
Wage rate Woodward and Rolfe (1993) Negative Developing countries
Coughlin et al. (1991) Negative State study
Bartik (1985) Negative State study
Luger and Shetty (1985) Negative State study
Unit labour cost Culem (1988) Negative Inter-industrialisedcountries
ULC relative to Culem (1988) Varieshome country
Technological Neven and Siotis (1993) Positive Manufacturing FDIcapability in EC
Labour skill Luger and Shetty (1985) Positive One of three industries.(White-collar State studyproportion)(Number of Carlton (1983) Positive One of three industries.engineers) State study
Workers’ Bartik (1985) Positive State studycompensationinsurance rate
Unionisation rate Coughlin et al. (1991) Positive State study
Bartik (1985) Negative State study
Unemployment rate Coughlin et al. (1991) Positive State study
Ratio of actual Carlton (1983) Positive Results vary byrate to average industry.over several years State study
Transport costs Woodward and Rolfe (1993) Negative Developing countriesas proportionof export value
Energy prices Carlton (1983) Negative State study
Investment to GDP Veugelers (1991) Negative Intra-OECD FDI
Same language Veugelers (1991) Positive Intra-OECD FDI
Neighbour Veugelers (1991) Positive Intra-OECD FDI
Neighbour x size Veugelers (1991) Positive Intra-OECD FDI

150 John Howe
Variable Reference Effect Comment
Capital export Scaperlanda and Balough (1983) Varies US FDI in ECcontrol
Growth rate of Jeon (1992) Positive Developed countrieshome economy Jeon (1992) Negative Developing countries(lagged)
Wages in home Jeon (1992) Positive Developing countrieseconomy
Exports from Culem (1988) Varies Inter-industrialisedhome to host countries. Generallycountry, relative to significant andhome GNP positive(lagged)
Source: Harris (1994).

151Internationalisation, Trade and Foreign Direct Investment
Appendix B: The Structure of Private External BorrowingThe increasing importance of inwards FDI for Australia over the past few years
reflects a gradual return to the average contribution of inwards FDI to the gross financingrequirement of the non-official sector applying in the late 1960s and early 1970s(Figure B1). Some of the apparent relative decline in FDI flows inwards in the 1980smay, however, be illusory.
First, the blurring of distinctions between FDI and portfolio and other capitalinvestment due to innovations in financial intermediation makes it difficult to be tooprecise about the structure of corporate finance in the 1980s.
Second, some part of the debt classed as portfolio and other investment in Australiashould properly be ascribed to FDI. The reason for this is that FDI flows can be in theform of equity or borrowing. Any offshore borrowing that is attached to foreign equityshould, in principle, be allocated to FDI flows. Data from the ABS suggest thatborrowing overseas by foreign companies has historically been very low relative toequity inflows, suggesting that FDI investors gear up using debt raised locally (seeFigure B2). However, this may have changed following the liberalisation of capitalmarkets in the early 1980s.
It is not unreasonable to expect that FDI investors increased their borrowing anddebt/equity ratios along the same lines, or even more so, than domestic investorsfollowing financial liberalisation in the early 1980s. This, however, is not reflected inFigure B2 which shows that direct foreign borrowing levels relative to equity remained
60/61 64/65 68/69 72/73 76/77 80/81 84/85 88/89 92/930
10
20
30
40
50
60
70
80
90
0
10
20
30
40
50
60
70
80
90
% %
Figure B1: The Structure of Non-Official Inwards Investment(FDI flows relative to total capital inflow for Australia)

152 John Howe
low. It is likely, therefore, that FDI investors geared up in the 1980s using some of thedebt raised offshore by domestic banks – which is classified as portfolio and otherinvestment but is tied to FDI liabilities.
Figure B2: Structure of Inwards Level of FDI andImplied Debt/Equity Ratio
Equity relative to level of FDI
Debt equity ratio
1981 1983 1985 1987 1989 1991 19930
0.1
0.2
0.3
0.4
0.5
0.6
0.7
0.8
0.9
1.0
0
0.1
0.2
0.3
0.4
0.5
0.6
0.7
0.8
0.9
1.0

153Internationalisation, Trade and Foreign Direct Investment
ReferencesAccess Economics (1994), Australia in Asia, A Monthly Australian Corporate Brief on Economic
and Financial Developments March 1994, Access Economics Pty Ltd, Canberra.
Bartik, T.J. (1985), ‘Business Location Decisions in the United States: Estimates of the Effects ofUnionization, Taxes and Other Characteristics of States’, Journal of Business andEconomic Statistics, 3(1), pp. 14-22.
Blomstrom, M. and A. Kokka (1994), ‘Home Country Effects of Direct Foreign Investment:Evidence from Sweden’, NBER Working Paper No. 4639.
Bullock, M., S. Grenville and A. Pease (1992), ‘Capital Inflows’, The Regulation of CapitalInflow: Office of EPAC Seminar, Background Paper No. 17, AGPS, Canberra, pp. 2.1-2.31.
Bureau of Industry Economics (1984), ‘Australian Direct Investment Abroad: Effects on theAustralian Economy’, Research Report No.14, AGPS, Canberra.
Bureau of Industry Economics (1993a), ‘Multinationals and Governments Issues and Implicationsfor Australia’, Research Report No. 49, AGPS, Canberra.
Bureau of Industry Economics (1993b), Australian Industry Trends, May (18), AGPS, Canberra.
Bureau of Industry Economics (1993c), Australian Industry Trends, October (19), AGPS,Canberra.
Bureau of Industry Economics (1994), Australian Industry Trends, April (20), AGPS, Canberra.
Carlton, D.W. (1983), ‘The Location and Employment Choices of New Firms: An EconometricModel with Discrete and Continuous Endogenous Variables’, Review of Economics andStatistics, 65(3), pp. 440-449.
Carmichael, J. (1992), ‘Capital Inflow and Macroeconomic Stability Under Australia’s FloatingExchange System’, The Regulation of Capital Inflow: Office of EPAC Seminar, BackgroundPaper No. 17, AGPS, Canberra, pp. 4.1-4.10.
Coughlin, C.C., J.V. Terza and V. Arromdee (1991), ‘State Characteristics and the Location ofForeign Direct Investment within the United States’, Review of Economics and Statistics,73(4), pp. 675-683.
Culem, C.G. (1988), ‘The Locational Determinants of Direct Investments Among IndustrialisedCountries’, European Economic Review, 32(4), pp. 885-904.
Dowrick, S. (1994), ‘Impact of Investment on Growth: Externalities and Increasing Returns?’,Investment for Growth, EPAC Background Paper No. 39, AGPS, Canberra.
Drysdale, P. (1993), ‘Japanese Direct Foreign Investment in Comparative Perspective’, PacificEconomic Papers No. 223, Australia-Japan Research Centre, Canberra.
Dunning, J.H. (1988), ‘The Eclectic Paradigm of International Production: A Restatement andSome Possible Extensions’, Journal of International Business Studies, 19(1), pp. 1-31.
East Asia Analytical Unit (1994), Changing Tack, Australian Investment in South-East Asia,AGPS, Canberra.
Edwards, R. (1994), ‘Australia’s Foreign Direct Investment: Does it Cause Unemployment?’,Labour Economics and Productivity, 6(1), pp. 13-26.
EPAC (1988), Raw Materials Processing: Its Contribution to Structural Adjustment, AGPS,Canberra.
EPAC (1992), The Regulation of Capital Inflow: Office of EPAC Seminar, Background PaperNo. 17, AGPS, Canberra.
EPAC (1993), Medium Term Review: Opportunities for Growth, AGPS, Canberra.

154 John Howe
Feldstein, M. (1994a), ‘The Effects of Outbound Foreign Direct Investment on the DomesticCapital Stock’, NBER Working Paper No. 4668.
Feldstein, M. (1994b), ‘Taxes, Leverage and the National Return on Outbound Foreign DirectInvestment’, NBER Working Paper No. 4689.
FitzGerald, V.W. (1993), National Saving, A Report to the Treasurer, AGPS, Canberra.
Forsyth, P. (1990), ‘Competitiveness, Microreform and the Current Account Deficit’, Centre forEconomic Policy Research, Discussion Paper No. 228, The Australian National University.
Froot, K. (ed.) (1991), Foreign Direct Investment, The University of Chicago Press, Chicago andLondon.
Graham, E. and P. Krugman (1989), Foreign Direct Investment in the United States, Institute forInternational Economics, Washington, DC.
Harris, C. (1994), ‘Outward Investment by Australian Companies: Modelling Factors whichInfluence Locational Choice’, BIE Background Paper No. 2.
IMD/World Economic Forum (1993), World Competitiveness Report.
Industries Assistance Commission (IAC) (1985), Annual Report 1984-85, AGPS, Canberra.
Industry Commission (IC) (1993), Annual Report 1992-93, AGPS, Canberra.
International Monetary Fund (1991), ‘Determinants and Systematic Consequences of InternationalCapital Flows: A Study’, Occasional Paper No. 77, Research Department of the InternationalMonetary Fund, Washington, DC.
Jeon, Y. (1992), ‘The Determinants of Korean Direct Investment in Manufacturing Industries’,Weltwirtschaftliches Archiv, 128(3), pp. 527-542.
Johanson, J. and J. Vahlne (1977), ‘The Internationalization Process of the Firm: A Model ofKnowledge Development and Increasing Foreign Market Commitments’, Journal ofInternational Business Studies, 8(1), pp. 23-32.
Jones, E. (1992), ‘Direct Foreign Investment into Australia: Maximising the Benefits’ , TheRegulation of Capital Inflow: Office of EPAC Seminar, Background Paper No. 17, AGPS,Canberra, pp. 9.1-9.14.
Kasper, W. (1992), ‘How to Maximise the Benefits of Direct Foreign Investment’, The Regulationof Capital Inflow: Office of EPAC Seminar, Background Paper No. 17, AGPS, Canberra,pp. 8.1-8.17.
Kearney, C. (1992), ‘Capital Flows and Macroeconomic Equilibrium with Floating ExchangeRates’, The Regulation of Capital Inflow: Office of EPAC Seminar, Background PaperNo. 17, AGPS, Canberra, pp. 3.1-3.15.
Lipsey, R. (1994), ‘Outward Direct Investment and the U.S. Economy’, NBER Working PaperNo. 4691.
Lipsey, R. and M. Weiss (1981), Foreign Production and Exports in Manufacturing Industries,Review of Economics and Statistics, LXIII(4), pp. 488-494.
Luger, M.I. and S. Shetty (1985), ‘Determinants of Foreign Plant Start-Ups in the United States:Lessons for Policymakers in the Southeast’, Vanderbilt Journal of Transnational Law,18(2), pp. 223-245.
Lunn, J. (1980), ‘Determinants of U.S. Direct Investment in the EEC: Further Evidence’,European Economic Review, 13(1), pp. 93-101.
Markusen, J. (1983), ‘Factor Movements and Commodity Trade as Complements’, Journal ofInternational Economics, 14(3/4), pp. 341-356.
McKinsey and Co. (1993), Emerging Exporters: Australia’s High Value-Added ManufacturingExporters, Report for the Australian Manufacturing Council, June.

155Internationalisation, Trade and Foreign Direct Investment
MITI (1992), Vision for the Economy of the Asia-Pacific Region in the Year 2000, and TasksAhead, Report to the EPEC Ad Hoc Economic Group Meeting, August, Tokyo.
Neven, D. and G. Siotis (1993), ‘Foreign Direct Investment in the European Community: SomePolicy Issues’, Oxford Review of Economic Policy, 9(2), pp. 72-93.
OECD (1991), The Interrelationship of Trade and Foreign Direct Investment, Working Party ofthe Trade Committee.
OECD (1992a), ‘Foreign Direct Investment: Trends and Policies’, The OECD Observer, 176,pp. 9-13.
OECD (1992b), Long-Term Prospects for The World Economy, OECD, Paris.
OECD (1993), Manufacturing Performance: A Scoreboard of Indicators for OECD Countries,OECD, Paris.
Ondrich, J. and M. Wasylencko (1993), ‘Foreign Direct Investment in the United States: Issues,Magnitudes, and Location Choice of New Manufacturing Plants’, W.E. Upjohn Institute forEmployment Research, Kalamazoo, Michigan.
Rider, M. (1994), ‘External Assets and Liabilities of OECD and Developing Countries’,Reserve Bank of Australia, mimeo.
Scaperlanda, A. and R.S. Balough (1983), ‘Determinants of US Direct Investment in the EEC:Revisited’, European Economic Review, 21(3), pp. 381-390.
Schubert, J. (1992), ‘Portfolio Capital Flows and Macro-Economic Stability’, The Regulation ofCapital Inflow: Office of EPAC Seminar, Background Paper No. 17, AGPS, Canberra,pp. 5.1-5.7.
Sinn, S. (1990), Net External Asset Positions of 145 Countries: Estimation and Interpretation,Institut fuer Weltwirtschaft an der Universitaet Kiel, J.C.B. Mohr (Paul Siebeck) Tuebingen,Germany.
Textiles Clothing and Footwear Development Authority (TCFDA) (1993), Annual Report1992-93.
Thomsen, S. and P. Nicolaides (1991), The Evolution of Japanese Investment in Europe, HarvesterWheatsheaf, New York.
UNCTAD (1993), World Investment Report: Transnational Corporations and IntegratedInternational Production, United Nations, New York.
UNCTC (1991), Government Policies and Foreign Direct Investment, United Nations, New York.
Veugelers, R. (1991), ‘Locational Determinants and Ranking of Host Countries: An EmpiricalAssessment’, Kyklos, 44(3), pp. 363-382.
Whitelaw, R. and J. Howe (1992), Australia’s External Constraint in the 1990s, EPAC ResearchPaper No. 1, Union Offset Co. Pty Ltd, Canberra.
Whitelaw, R. (1994), ‘Investment and Economic Growth: A Critique of De Long and Summers’,Investment for Growth, EPAC Background Paper No. 39, pp. 39-55.
Woodward, D.P. and R.J. Rolfe (1993), ‘The Location of Export-Oriented Direct Investment inthe Caribbean Basin’, Journal of International Business Studies, 24(1), pp. 121-144
World Bank (1993), The East Asian Miracle, Economic Growth and Public Policy, OxfordUniversity Press, New York.
Yetton, P., J. Davis and P. Swan (1991), Export Myths and Strategic Realities, Report to theAustralian Manufacturing Council, AGSM Ltd, Australian Graduate School of Management.