international workshop „european wastewater …file/ewa_workshop_benchmarking_report_final.pdf ·...
TRANSCRIPT

The European Water Association and The German Association for Water, Wastewater and Waste
THE EUROPEAN WATER ASSOCIATION AND
THE GERMAN ASSOCIATION FOR WATER, WASTEWATER AND WASTE
INTERNATIONAL WORKSHOP „EUROPEAN WASTEWATER BENCHMARKING
REPORTING – DISCUSSION OF CURRENT ACTIVITIES AND CHANCES OF CROSS-NATIONAL COMPARISON”
HENNEF, GERMANY, DE 4TH JUNE 2009
REPORT DATED 31 JULY 2009
The European Water Association and The German Association for Water, Wastewater and Waste
Published and distributed by: European water Association e. V. Dipl.-Ing. Johannes Lohaus Secretary General Theodor-Heuss-Allee 17 D-53773 Hennef Phone: +49 2242 872 189 Fax: +49 2242 872 135 Email: [email protected] www.EWA-online.eu
The report is written by: Sabine Thaler, DWA, Hennef Editor/Layout: Boryana Dimitrova, DWA, Hennef
© EWA European Water Association 2009

The European Water Association and The German Association for Water, Wastewater and Waste
© All rights reserved 1
Benchmarking in Europe was the focal point of the EWA Workshop, which took place on 4th
June 2009 in Hennef. About 20 experts from 8 countries met for one day in the small city nearby Cologne to discuss current activities and chances of cross-national comparison in the field of benchmarking reporting. Benchmarking activities, which have started in several European countries, are still going on or were completed in the first cycle. Depending on different foci, sets of performance indicators have been developed, which are not comparable in most cases – although it may look like this at first sight. Nevertheless cross-national attempts to compare evaluation results in European countries are of great interest and already in progress. The objective of this workshop was to discuss existing approaches in Europe, differences and similarities of monetary, as well as nonmonetary key sets of performance indicators. Delegates from Austria, Czech Republic, Germany, Hungaria, Netherlands and Switzerland used the opportunity to present the activities in the field of waste water benchmarking in their home country. Benchmarking of large municipal waste water treatment plants in Austria Dr. Thomas Ertl from University of Natural Resources and Applied Life Sciences in Vienna gave a short overview of the Austrian benchmarking system, which had been developed between 1999 and 2004. Up to now, around 100 plants with a size between 2000 and one million population equivalents (PE) have been analysed. To identify the best practice and the benchmark first it was necessary to identify performance indicators, which enable the comparison between different treatment process schemes and operating modes. For this purpose four main and two support processes were defined (e. g. mains and auxiliary components such as carparks etc, see figure 1).
Figure 1: Process model for waste water treatment plants above 100000 PE Each main process is divided into sub-processes. All the relevant costs, such as yearly total, capital and operating costs, are allocated to these categories.
Influe
ntpu
mping
mech
anica
lpre-
treatm
ent
prima
ryse
dimen
tation
biolog
icaltr
eatm
ent
gase
ngine
exce
ssslu
dget
hicke
ning
stabil
isatio
n
sludg
edew
aterin
g
sludg
etrea
tmen
tand
dispo
sal
labora
torya
ndmo
nitori
ng
admi
nistra
tion
opera
tionb
uildin
gand
infras
tructu
re
works
hops
motor
pool
1.1 1.2 2.1 2.2 2.3 3.1 3.2 4.1 4.2 I.1 I.2 I.3 II.1 II.2Process 2 Process 3 Process 4 Support process I II
Waste water treatmentInfluent pumping
mech.pre-treatmentmechanical-
biological treatmentthickening
stabilisationfurther sludge treatment
and disposalobligatory
processesoptional
processes
Process 1

The European Water Association and The German Association for Water, Wastewater and Waste
© All rights reserved 2
Plants, which showed the lowest specific costs and in addition met the following criteria set the benchmark:
• full compliance with the effluent limits (Austrian emission standards), • compliance with defined data quality criteria (mass balance check, etc.), • typical characteristics of municipal waste water (e.g. COD/N ratio, no dominant
influence of industrial waste water). According to the design capacity (PE) waste water treatment plants were grouped to gain comparable process values. Following the timeline of a benchmarking year, the benchmarking process can be subdivided into three steps:
• data acquisition, • data processing, • exchange of experiences.
Data acquiring was organised with the help of an internet platform. The participants had to complete web forms. Also data transfer and communication with the participants were conducted via internet. The assessment of data quality was achieved by means of a rough plausibility check to ensure that data meet a feasible range. In case of operating data mass balances for COD, nitrogen, phosphorus and total solids were carried out. The appropriate measure for checking financial data is the variance analysis, which means to compare data input with the previous year value. In the end the results are summarised in a final report, which contains process performance indicators as well as interpretations of the determined values and conclusions regarding the performance improvement. The data processing is demonstrated in figure 2.
Figure 2. Methodology for the development of process indicators Individual consulting on site was provided in order to discuss potential data quality problems and explain the final draft report. Workshops were organised for the members of the several benchmarking groups, which served as a platform for exchange of experiences.

The European Water Association and The German Association for Water, Wastewater and Waste
© All rights reserved 3
Participants could learn more about the best practice and find solutions to improve their own processes. These meetings took place every year in another treatment plant. Since the first benchmarking cycle in 1999 altogether 112 wastewater treatment plants ran through the benchmarking procedure. They represent 42% of the total capacity of all waste water treatment plants bigger than 20000 PE in Austria (with the exception of Vienna). The total yearly costs varied from ca. 34.4 for the smaller plants to 35.5 € per PE (corresponding to the COD110) in case of the bigger ones. The proportion of the capital costs was 60% of the total costs. It is important to mention, that capital costs in Austria are standardised. Depreciation is based on the present values of replacement. Interest calculation is based on imputed rates. For wastewater treatment plants an artificial useful life of 30 years is considered. Artificial life time for machinery (20 years) and for instrumentation & control (10 years) is also taken into account.. Operating costs showed a range from 13.6 to 10.0 € per PE. About 50% to 65% of the operating costs are totally independent from the present COD-load, for example the personnel costs (36%). Another item, which should be mentioned, is the costs for sludge treatment and disposal. They represent more than 40%. It was striking, that plants with an optimal degree of design capacity utilisation worked most efficiently regarding the specific operating costs. The following figure 3 shows the operating costs classified in the above described processes.
Figure 3: Box Charts of process related specific operating costs
Operating costs [€/PE-COD110)
0,00,51,01,52,02,53,03,54,04,55,0
75%-Percentile 0,23,54,91,02,01,1Maximum 0,23,85,01,12,71,3Minimum 0,11,92,80,40,80,6Median 0,13,34,30,71,50,8
25%-Percentile 0,12,53,70,61,20,7Benchmark 0,11,92,80,72,70,9
optional support process
obligatoriy support process
sludge treatment disposal
thickening stabilisation
mechanical-biological treatment
inf. pumpingmech.pre-treatment

The European Water Association and The German Association for Water, Wastewater and Waste
© All rights reserved 4
It can be stated, that excellent treatment efficiency often coincides with low specific costs, but no clear correlation between treatment efficiency and operating costs was observed. Nevertheless, the quality of the staff is very important to guarantee successful results. Regarding the methodology it can be concluded, that continuous benchmarking is a powerful management tool. The comparison of benchmarks and especially the exchange of experiences help plant managers to optimise cost-efficiency. Besides decreasing costs, benchmarking offers the opportunity to prove excellent performance of treatment plant operation facing the public, as well as, the politicians or board members.
Performance indicators for wastewater services as a part of benchmarking in Germany The presentation of Prof. Andreas Schulz from Emschergenossenschaft/ Lippeverband in Essen deals with the starting of benchmarking in the field of water industry in Germany and points out the development of a well recordable set of performance indicators. In 1996/97 benchmarking methods were adopted by wastewater services for the first time. Starting points were initiatives of corporations to establish a management tool for improving processes by learning from other organisations. One important requirement was the strictly confidential handling of the data in order to identify processes to be improved, to simplify participation for small organisations and to allow a broad overview guaranteed through a high number of participants. In addition to process benchmarking comparison on the level of organisations, the so called corporate benchmarking has been carried out. Nowadays, considering the background of the Water Framework Directive (WFD), the first benchmarking-steps were made on the level of river basins. Already in 2005 six German associations of the water industry, namely ATT (Association of Drinking Water from Reservoirs), BDEW (Federal Association of the German Gas and Water Industries), DBVW (German Alliance of Water Management Associations), DVGW (German Technical and Scientific Association for Gas and Water), DWA (German Association for Water, Wastewater and Waste) and VKU (Association of local Utilities), established an agreement on the state of the art of benchmarking in the water sector. In a common statement they comprised how to do benchmarking, the objectives of benchmarking, how to deal with benchmarking data and last but not least, how to report publicly about the results. The last requirement was realised in the form of the “profile of the German water industry”, which has been published already two times. These first editions contained still mainly statistical data. But the aim is to present summarized and anonymous results from the benchmarking projects in this paper. To support especially small and middle-sized enterprises DWA and DVGW published a common topic paper “Guideline benchmarking for water and wastewater enterprises”. Another topic paper contains a sample of key performance indicators (PI), which meet the following criteria:
• consideration of existing PI-Systems (e.g. IWA), • possibility of integration in a profile of the water industry, • classification according to the five pillars security, quality, sustainability, economy and
customer service, • explanation of key PI‘s by context information respectively relationships,• pragmatic amount of time and effort for data collection (should not be much more
than round about 2 days). The intention of this publication was to ensure that systems of performance indicators, which are the basis of benchmarking in Germany, become compatible with each other.

The European Water Association and The German Association for Water, Wastewater and Waste
© All rights reserved 5
Furthermore, the system should gain acceptance in the group of smaller sized treatment plants, which have not the personnel resources to participate on time-consuming surveys. Total annual costs are divided in operating and capital costs. Operating costs consist of material, personnel and other operational expenditures. The material expenditures are made up from the following positions of the statement of loss and gain: expenses for raw, auxiliary and operating materials, for purchased goods and services. To personnel expenditures belong salaries and wages, social contributions and expenses for retirement benefits and support. Other operational expenditures - so far they are not extraordinary - gather all operational expenses, for which no definition exists within the framework of the structural regulation of the statement of loss and gain. Capital costs consist of depreciations and interest. Overall depreciations are immaterial assets of the fixed and tangible assets as well as activated expenditures for the start-up and expansion of business operations and at last assets from the floating assets. The interest paid is made up from interest and similar expenditures including those for associated companies. Economic efficiency is only one aspect of benchmarking. As mentioned above, the characteristics for assessment of efficiency of water supply and wastewater disposal can be allocated to five pillars. Examples are cited as follows:

The European Water Association and The German Association for Water, Wastewater and Waste
© All rights reserved 6
Table 1: Examples for asessment characteristics and key data
reliability - reliability of disposal - facility utilisation - central monitoring - fault management
- average sewer age [a] - 85% percentile degree of utilisation
wastewater treatment plants [%]
In several federal states of Germany benchmarking projects had already been finished in the first cycle and the second evaluation has started. Final reports are available in Bavaria, Baden-Württemberg, Rhineland-Palatinate, North Rhine-Westphalia, Lower Saxony and Mecklenburg-Western Pomerania. In Hessen, Thuringia, Schleswig-Holstein, Bremen, Hamburg and Berlin benchmarking activities are still in progress. Similar to Austria the collection of data is carried out with the help of an online-tool and also quality testing is organised centrally. This way of proceeding reduces the efforts for the participants and facilitates the attendance to benchmarking projects. In the following figure 4 only the grey areas are not involved in statewide benchmarking projects until now.
pillar possible assessment cha-aceristics
examlpes for key performance indi-cators
custumer service - complaints - service quality - public relations and
costumer information
- complaints about wastewater disposal per service connection [Number/DC]
sustainability - maintanance of substance
- resource protection - resource consumption - staff and social criteria
- conservation of value ratio (rehabilitation and maintenance ratio) wastewater collection and transport [%]
- Specific energy consumption wastewater disposal [kWh/PT]
- Energy production rate [%] economic efficiency - cost transparency
- cost analysis - investments - staff
- Specific total expenditure wastewater disposal [€/PT]
- Specific capital costs wastewater disposal [€/PT]
- Specific total revenues wastewater disposal [€/PT]
- Cost coverage (EU WFD) wastewater disposal [%]

The European Water Association and The German Association for Water, Wastewater and Waste
© All rights reserved 7
Figure 4: State-wide benchmarking-projects in the field of wastewater disposal (orange areas) in Germany
The goal is to show the development of performance indicators over the years in order to point out the achieved improvement.
Swiss wastewater management performance and cost indicators Olivier Chaix from MSCE SFIT and vice-president of VSA (Swiss Water Association) started his presentation with a question: How much does wastewater collection and treatment cost in Switzerland? Swiss wastewater management amounts only to 0.5% of the gross domestic product (2003) in Switzerland. The costs for wastewater management can be cited as follows: Table 2: Total annual costs of wastewater collection and treatment per inhabitant (I)
and per population equivalent (PT) Size of wastewater treat-ment plant
catchment area € / year / I € / year / PT
100 – 1000 PT 200 190
1'000 – 10000 PT 185 160
10'000 – 50000 PT 170 110
> 50000 PT 135 90
The main goal of benchmarking in Switzerland was to gain transparency in total costs. The project was supported by the Swiss environmental agency and the cantons.
Bayern Baden-Württemberg
Thüringen Sachsen
Hessen Rheinland-Pfalz
Saarland
Berlin Brandenburg
Sachsen-Anhalt
Niedersachsen
Nordrhein-Westfalen
Schleswig-Holstein
Mecklenburg-Vorpommern
Bremen
Hamburg
Berlin Bremen
Hamburg
State-wide benchmarking-projects in wastewater disposal (orange areas)
/ 2008
The European Water Association and The German Association for Water, Wastewater and Waste
© All rights reserved 8
The first step was the definition and normalisation of cost and performance indicators in the field of wastewater disposal. Not included in the scope were private systems and industrial wastewater treatment plants, which discharge directly in water bodies. The components of the Swiss performance indicator system are basically identical to the indicators and reference parameters the DACH+NL-group (common working group on benchmarking consisting of delegates from Germany [D], Austria [A], Switzerland [CH] and Netherlands [NL]) proposed (see below). But there are some exceptions:
• eight monetary performance indicators (instead of four), • two explicit replacement values (instead of only implicit), • one category for inhabitants: IWWTP (instead of three categories: Itotal, Isewer and IWWTP), • only one type sewer length: Lsewer (instead of three types: Lsewer, Lrehabilitated and
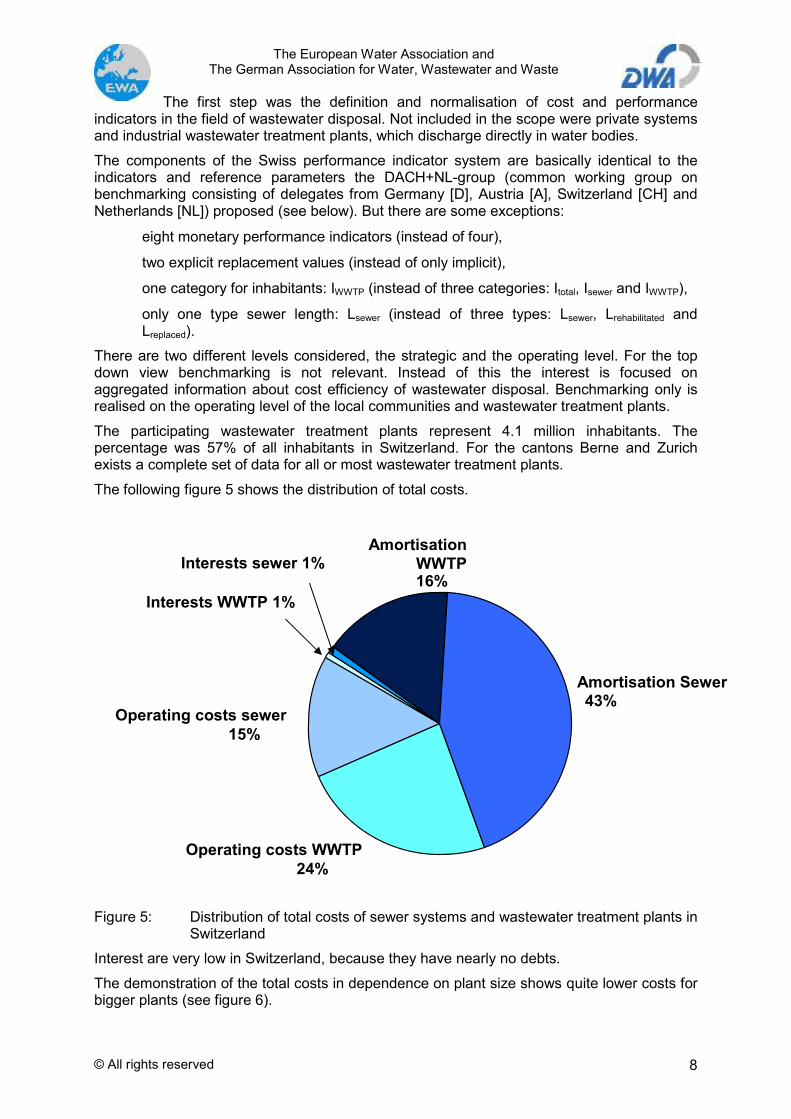
Lreplaced). There are two different levels considered, the strategic and the operating level. For the top down view benchmarking is not relevant. Instead of this the interest is focused on aggregated information about cost efficiency of wastewater disposal. Benchmarking only is realised on the operating level of the local communities and wastewater treatment plants. The participating wastewater treatment plants represent 4.1 million inhabitants. The percentage was 57% of all inhabitants in Switzerland. For the cantons Berne and Zurich exists a complete set of data for all or most wastewater treatment plants. The following figure 5 shows the distribution of total costs.
Figure 5: Distribution of total costs of sewer systems and wastewater treatment plants in Switzerland
Interest are very low in Switzerland, because they have nearly no debts. The demonstration of the total costs in dependence on plant size shows quite lower costs for bigger plants (see figure 6).
Amortisation Sewer 43%
AmortisationWWTP16%
Operating costs sewer15%
Operating costs WWTP24%
Interests WWTP 1%
Interests sewer 1%

The European Water Association and The German Association for Water, Wastewater and Waste
© All rights reserved 9
Figure 6: Total costs of wastewater treatment plants and sewerage network for the four plant size clases
It can be concluded that catchment areas with bigger wastewater treatment plants are more efficient - both in terms of costs and of pollution control. About 90% of total costs cannot be influenced in the short term by the operator, as they are linked to infrastructures with long life expectations. But cost reductions are still possible, mainly:
• by connecting small wastewater treatment plants catchment areas to bigger wastewater treatment plants (feasible immediately) and
• by replacing centralised wastewater treatment plants in low density areas with adapted decentralised systems (feasible in future, if adequately planned and supervised).
Performance and cost indicators for the comparison of wastewater disposal services on international scale Dr. Stefan Binggeli from INFRAconcept in Berne presented the results of DACH+NL group. This working group was established by the specialists associations of Germany (DWA), Austria (ÖWAV), Switzerland (VSA) and Netherlands (RIONED) with the aim to define a reliable and transparent system of cost and performance indicators. Nowadays, there are a large number of ongoing benchmarking projects. This results in a high amount of available data. Unfortunately, most of the performance and cost indicators used in those projects are not simply comparable in different countries. The task of the DACH+NL group therefore, was to define a system of aggregated key parameters for wastewater disposal with high political significance. The system had to be transparent, comprehensive and broadly applicable. The data should be easy to collect. Last but not least it should provide a transboundary overview. The DACH+NL-approach is based on existing values of process-benchmarking, corporate benchmarking projects and nation-wide or regional surveys. To keep the system simple and comprehensive the working group defined a very small amount of key-performance
0
50
100
150
200
250
300
350
100-1'000 1'000-10'000 10'000-50'000 >50'000
[CHF/EW/a] [CHF/EH/a]
[EW] [EH]
65 %48 %
44 %
43 %
35 % 52 % 56 % 57 %
ARA-Kosten
Kanalisations-Kosten
CoûtsSTEP
Coûtsréseau
costs Wastewater treatment plants
costs sewerage network
CHF/PT/Year
Population equivalent PT

The European Water Association and The German Association for Water, Wastewater and Waste
© All rights reserved 10
indicators to be used in the different projects. The DACH+NL-system should neither be considered as control instrument for the enforcing authorities, nor does it compete with benchmarking projects. Nevertheless it should encourage the parties concerned to provide even this small number of selected indicators. This is an important measure to avoid comparison of published data, which are calculated with completely different methods. The following table 3 contains four general cost indicators suggested by DACH+NL group, the operating costs per population equivalent and the capital costs of both – wastewater collection and wastewater treatment. Table 3: Monetary performance indicators
Operating Costs Capital Costs Total Costs
Wastewater collection € / PECODmean € / Lsewer
€ / PECODmean € / Lsewer
€ / PECODmean € / Lsewer
Wasterwater treatment € / PECODmean € / PECODcapacity
€ / PECODmean € / PECODcapacity
€ / PECODmean € / PECODcapacity
Sum € / PECODmean € / PECODmean € / PECODmean
Legend:PECODmean= Mean loading, expressed as population equivalents.
Spec. loading per PE = 120g COD per day. Lsewer = Total lenght of all public sewers systems PECODcapacity = Design capacity of a WWTP, expressed as population equivalents To describe international comparisons, best reference value is the mean loading, expressed as population equivalents. The group defined a unified specific loading per PE = 120g COD per day. The specific costs of wastewater treatment are directly connected to the size of the plant. If one wants to compare the overall costs for wastewater disposal e.g. in the canton of Berne in Switzerland with the federal state of Baden-Württenberg in Germany, it is not possible to compare simply the arithmetic mean values. Doing this would give too high importance to the large number of small wastewater treatment plants. Therefore it is absolutely necessary to compare weighted average values. Only weighted average values represent the true cost situation at regional scale. The comparison of the total costs of wastewater disposal at first sight seems to be very reliable. In Austria, Switzerland and Germany they range between 110 and 125 € per PECODmean. But in fact the regarded countries follow different paths to determine the capital costs. In Austria and Switzerland depreciation is based on the present values of replacement investment. In contrast the different federal states of Germany apply both, values of replacement, as well as initial values. Another aspect to be mentioned is that the life span considered for depreciation of sewers differs a lot. For example, Austria assumes an artificial span of useful life, which is set 40 years (as of 1999) respectively 80 years (as of 2004). In case of wastewater treatment plants it is 30 years and in Switzerland 33 years.
The European Water Association and The German Association for Water, Wastewater and Waste
© All rights reserved 11
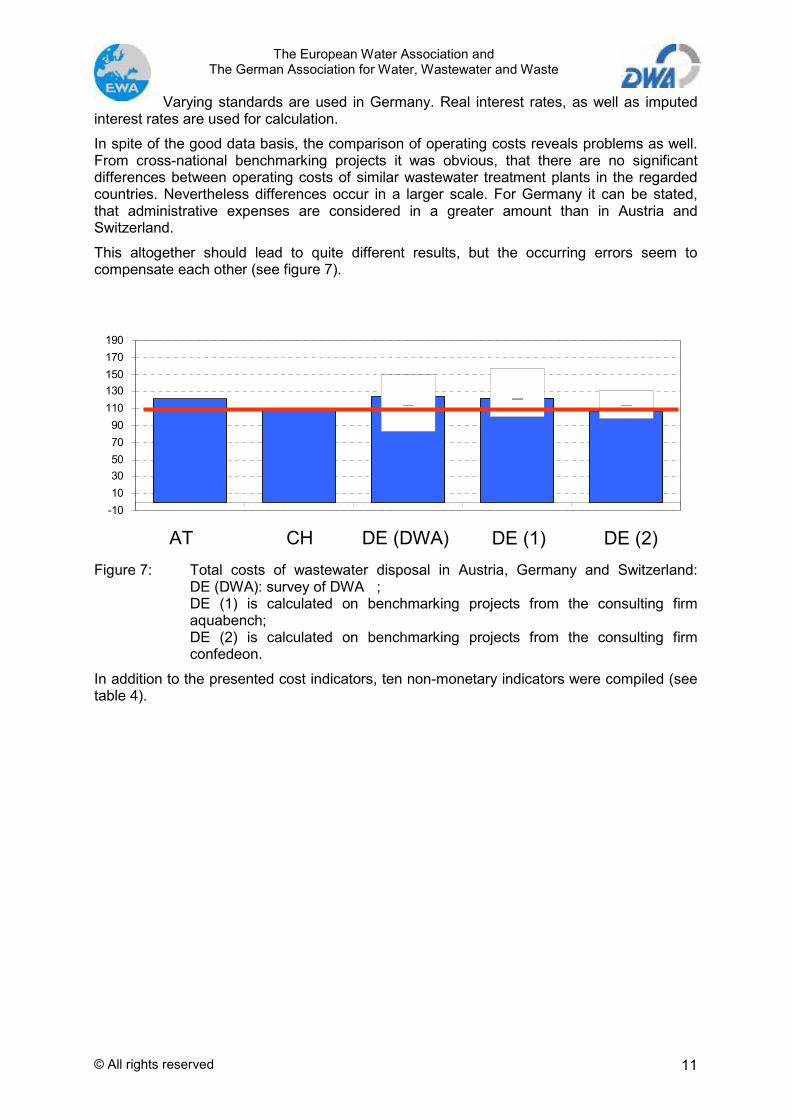
Varying standards are used in Germany. Real interest rates, as well as imputed interest rates are used for calculation. In spite of the good data basis, the comparison of operating costs reveals problems as well. From cross-national benchmarking projects it was obvious, that there are no significant differences between operating costs of similar wastewater treatment plants in the regarded countries. Nevertheless differences occur in a larger scale. For Germany it can be stated, that administrative expenses are considered in a greater amount than in Austria and Switzerland. This altogether should lead to quite different results, but the occurring errors seem to compensate each other (see figure 7).
Figure 7: Total costs of wastewater disposal in Austria, Germany and Switzerland:
DE (DWA): survey of DWA ; DE (1) is calculated on benchmarking projects from the consulting firm aquabench; DE (2) is calculated on benchmarking projects from the consulting firm confedeon.
In addition to the presented cost indicators, ten non-monetary indicators were compiled (see table 4).
Gesamtkosten ARA und Kanal pro EWCSB,m
-101030507090
110130150170190
AT CH DE (DWA) DE (1) DE (2)
The European Water Association and The German Association for Water, Wastewater and Waste
© All rights reserved 12
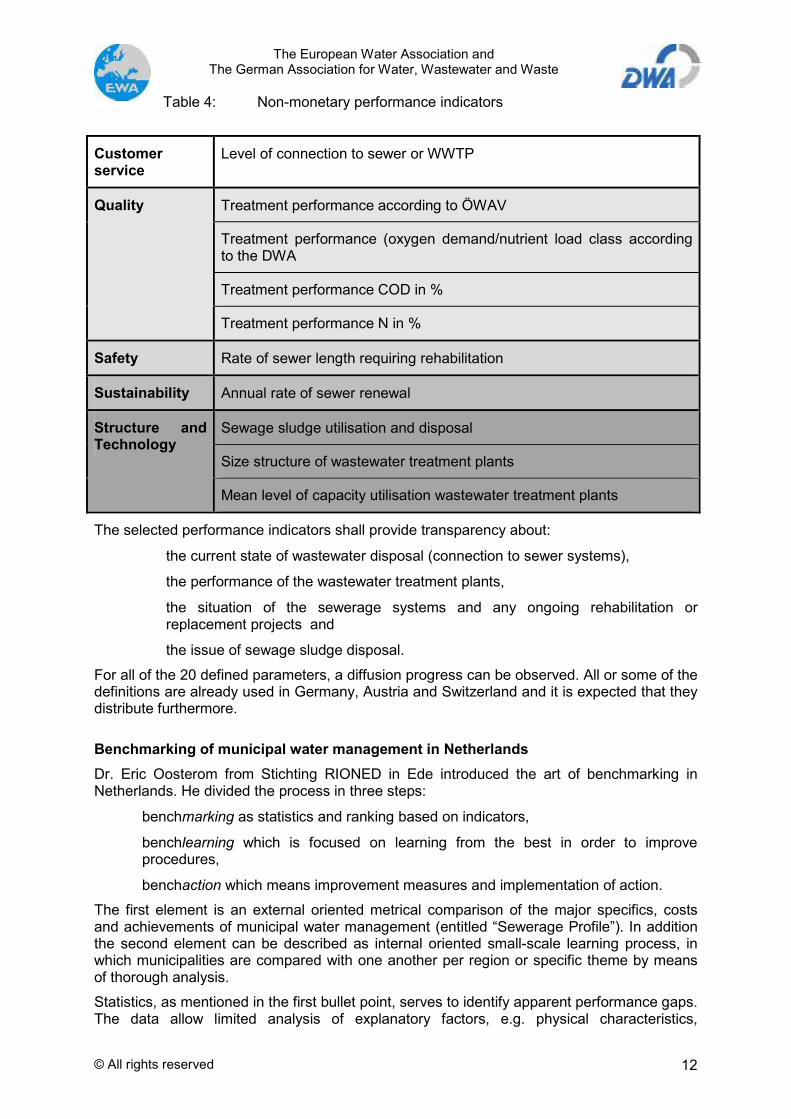
Table 4: Non-monetary performance indicators Customer service
Level of connection to sewer or WWTP
Treatment performance according to ÖWAV
Treatment performance (oxygen demand/nutrient load class according to the DWA
Treatment performance COD in %
Quality
Treatment performance N in %
Safety Rate of sewer length requiring rehabilitation
Sustainability Annual rate of sewer renewal
Sewage sludge utilisation and disposal
Size structure of wastewater treatment plants
Structure and Technology
Mean level of capacity utilisation wastewater treatment plants
The selected performance indicators shall provide transparency about: • the current state of wastewater disposal (connection to sewer systems), • the performance of the wastewater treatment plants, • the situation of the sewerage systems and any ongoing rehabilitation or
replacement projects and • the issue of sewage sludge disposal.
For all of the 20 defined parameters, a diffusion progress can be observed. All or some of the definitions are already used in Germany, Austria and Switzerland and it is expected that they distribute furthermore.
Benchmarking of municipal water management in Netherlands Dr. Eric Oosterom from Stichting RIONED in Ede introduced the art of benchmarking in Netherlands. He divided the process in three steps:
• benchmarking as statistics and ranking based on indicators, • benchlearning which is focused on learning from the best in order to improve
procedures, • benchaction which means improvement measures and implementation of action.
The first element is an external oriented metrical comparison of the major specifics, costs and achievements of municipal water management (entitled “Sewerage Profile”). In addition the second element can be described as internal oriented small-scale learning process, in which municipalities are compared with one another per region or specific theme by means of thorough analysis. Statistics, as mentioned in the first bullet point, serves to identify apparent performance gaps. The data allow limited analysis of explanatory factors, e.g. physical characteristics,

The European Water Association and The German Association for Water, Wastewater and Waste
© All rights reserved 13
geography, population, weather etc.. The collected statistical data concerned for example the length of the sewer system, the rate of not connected households and sewer taxes. The latter is calculated at 150 € per household and year in average. Because of the decreasing part of gravity sewer systems it can be expected, that sewer taxes will double within another ten years (see figure 8).
Figure 8. Future prospects: Sewerage taxes double every ten years Since 2004 around 190 municipalities, which represent 12 million people, participated in Dutch benchmarking. The following critical performance indicators have been revealed:
• quality and functioning e.g. inspection, hydraulics, condition, monitoring
• environmental efforts e.g. emission, efforts to improve water quality
• expenditure e.g. per capita: sewerage tax, capital costs, maintenance costs, cleaning costs
• organisational capacity activities, staff, plans, projects, realisation,…
• nuisance/ complaints contacts with customers, response time
• data management data accurate, up-to-date, complete, analysed
The goal was to move from only statistical data surveys to ranking of municipalities based on a few comparable performance indicators. The most difficult task was to find adequate non-monetary performance indicators.
The European Water Association and The German Association for Water, Wastewater and Waste
© All rights reserved 14
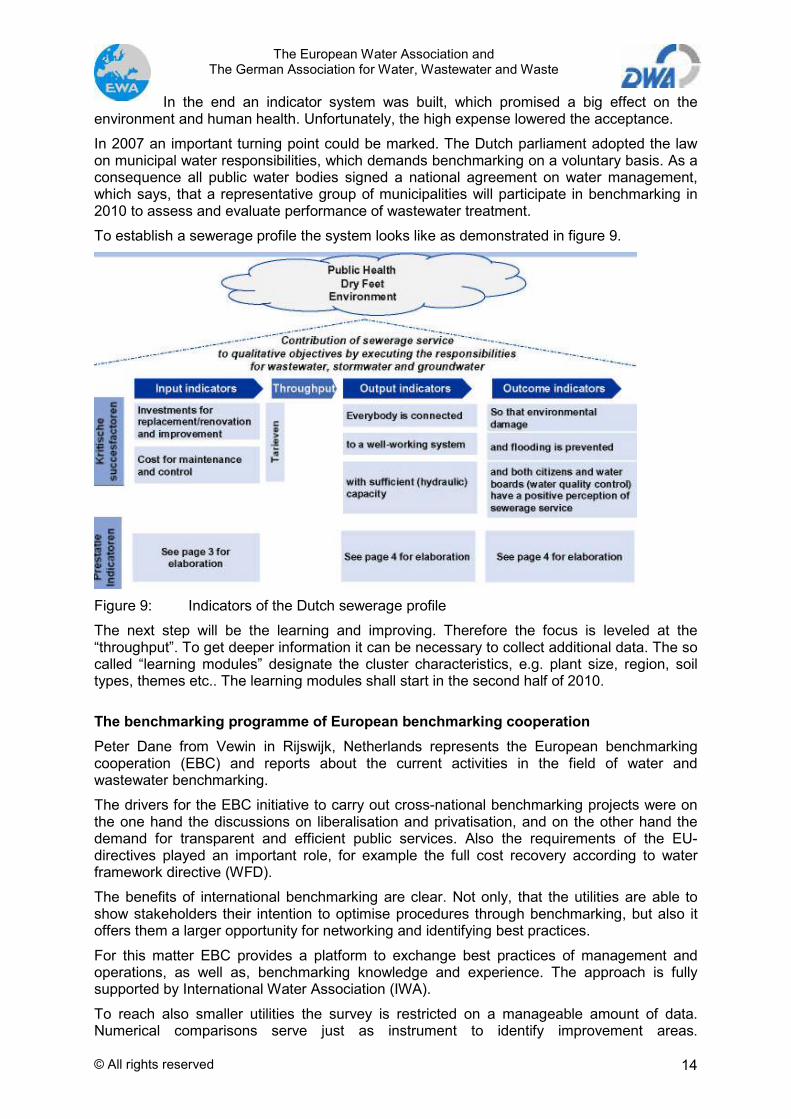
In the end an indicator system was built, which promised a big effect on the environment and human health. Unfortunately, the high expense lowered the acceptance. In 2007 an important turning point could be marked. The Dutch parliament adopted the law on municipal water responsibilities, which demands benchmarking on a voluntary basis. As a consequence all public water bodies signed a national agreement on water management, which says, that a representative group of municipalities will participate in benchmarking in 2010 to assess and evaluate performance of wastewater treatment. To establish a sewerage profile the system looks like as demonstrated in figure 9.
Figure 9: Indicators of the Dutch sewerage profile The next step will be the learning and improving. Therefore the focus is leveled at the “throughput”. To get deeper information it can be necessary to collect additional data. The so called “learning modules” designate the cluster characteristics, e.g. plant size, region, soil types, themes etc.. The learning modules shall start in the second half of 2010.
The benchmarking programme of European benchmarking cooperation Peter Dane from Vewin in Rijswijk, Netherlands represents the European benchmarking cooperation (EBC) and reports about the current activities in the field of water and wastewater benchmarking. The drivers for the EBC initiative to carry out cross-national benchmarking projects were on the one hand the discussions on liberalisation and privatisation, and on the other hand the demand for transparent and efficient public services. Also the requirements of the EU-directives played an important role, for example the full cost recovery according to water framework directive (WFD). The benefits of international benchmarking are clear. Not only, that the utilities are able to show stakeholders their intention to optimise procedures through benchmarking, but also it offers them a larger opportunity for networking and identifying best practices. For this matter EBC provides a platform to exchange best practices of management and operations, as well as, benchmarking knowledge and experience. The approach is fully supported by International Water Association (IWA). To reach also smaller utilities the survey is restricted on a manageable amount of data. Numerical comparisons serve just as instrument to identify improvement areas.

The European Water Association and The German Association for Water, Wastewater and Waste
© All rights reserved 15
Benchmarking is a management tool for continuous improvement and should preferably be embedded in the yearly business planning cycle. For performance assessment there can be chosen from three different participation levels:
• Basic level: only service quality data, finance and efficiency data in addition to context information are evaluated.
• Standard level: on this level the three remaining pillars, namely water quality, reliability and sustainability, are added.
• Advanced level: on this level the focus is directed on sustainability and economy. The numbers of the different sets of input variables, which are necessary to calculate the performance indicators, are shown in figure 10.
Figure 10: Sets of input variables and performance indicators for basic, standard and advanced level of benchmarking
In the latest pilot project, which was finished in 2008, about 30 water and wastewater utilities were involved. The first regular benchmarking round has started in 2008. Growing interest from utilities all over Europe can be observed. Up to now 41 participants from 18 different countries have joined the project. Among others, this is achieved through intermediates in the regarded countries, e.g. associations or regional networks. Even Israel, Singapore and Lima have expressed interest. Last but not least, cooperation with Canadian and Australian benchmarking initiatives is planned.
Waste water benchmarking – current activities in the Czech Republic Professor Jiri Wanner from institute of chemical technology in Prague showed that a significant part of the pollution of rivers in Czech Republic is caused by agriculture. The connection rate to the sewerage system and wastewater treatment plants in 2007 reached

The European Water Association and The German Association for Water, Wastewater and Waste
© All rights reserved 16
80.8%. Because of the high mountains it would be too much pumping effort to establish 100% of connection. Noteworthy is, that the number of owners of utilities (water supply and sewerage services) is considerably higher than the number of operators. Primarily four big groups, amongst them Veolia, are responsible for operating the plants. Benchmarking on the operating level is organised by the mentioned groups. In addition benchmarking is organised by the ministry of agriculture on national level, which is ruled by law. A lot of wastewater treatment plants are not using their full capacity. The actual load reaches only 50% of the design capacity. The consumption of electric power in kWh/PE depends on the size of the town and the part of industrial wastewater. The latter is less degradable; therefore the biogas production in m3/year/PE is reduced. Besides the benchmarking on the field of plant operation, all companies – depending on the size - are obliged to provide economic information to the ministry of agriculture. From totally 2000 operating companies 541 companies have fulfilled this obligation. The main purpose of the resulting benchmarking report is to make the data available to the public. This transparency allows the people to change to another company, if they are not content with the provided service. Only 150 companies supply 93% of the needed drinking water. The majority of companies represent a very low fraction of the market. In case of drinking water the price in the average amounts to 26.59 Kc per m3, in case of wastewater the fee is 22.67 Kc per m3.
Water and wastewater data and trends in Hungary Károly Kovács from MASZESZ in Hungary started his presentation with some basic data about water and wastewater services in Hungary. Regarding drinking water supply the connection rate reaches 97%, which meets the attempted goal. In case of wastewater there is still more work to be done. Only 57% of the inhabitants are connected to sewerage systems and wastewater treatment plants. The aim is to reach 87%. The book value of water and wastewater infrastructure is 3 billions €. The new investments reach 4 billions € and the replacement value corrected with depreciation is calculated with 14 billions €. The current prices can be cited as follows:
• drinking water: 0.9 €/ m3,• wastewater: 0.91 €/ m3.
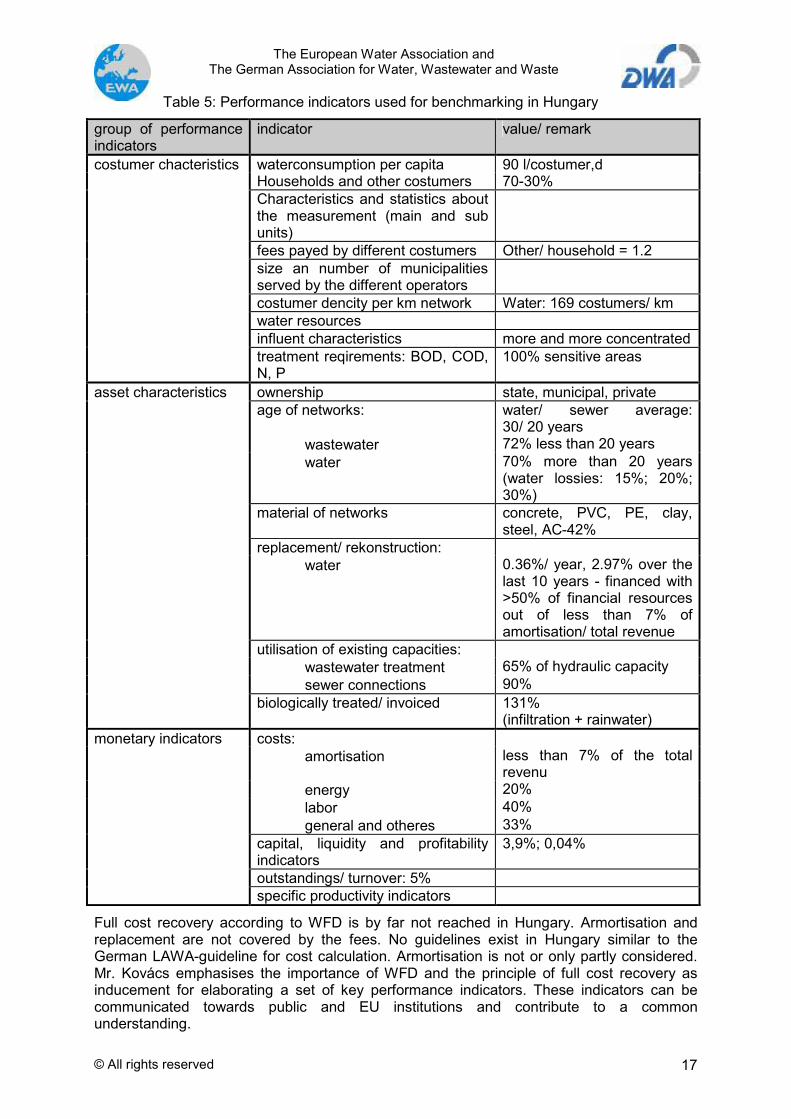
Benchmarking is practiced in Hungary since 2006. From totally 300 service providers 23 are involved in benchmarking. In the field of water supply they are 67% of the providers and in case of wastewater 35%. The so called Benchmarking Klub - an independent organisation - is responsible for the organising of projects. The Klub is operated by REKK CORVINUS UNI, Budapest. Already 238 different data have been collected. The used key sets of performance indicators are listed in table 5.
The European Water Association and The German Association for Water, Wastewater and Waste
© All rights reserved 17
Table 5: Performance indicators used for benchmarking in Hungary group of performance indicators
indicator value/ remark
waterconsumption per capita 90 l/costumer,d Households and other costumers 70-30% Characteristics and statistics about the measurement (main and sub units)
fees payed by different costumers Other/ household = 1.2 size an number of municipalities served by the different operators
costumer dencity per km network Water: 169 costumers/ km water resources influent characteristics more and more concentrated
costumer chacteristics
treatment reqirements: BOD, COD, N, P
100% sensitive areas
ownership state, municipal, private age of networks: water/ sewer average:
30/ 20 years • wastewater 72% less than 20 years • water 70% more than 20 years
(water lossies: 15%; 20%; 30%)
material of networks concrete, PVC, PE, clay, steel, AC-42%
replacement/ rekonstruction: • water 0.36%/ year, 2.97% over the
last 10 years - financed with >50% of financial resources out of less than 7% of amortisation/ total revenue
utilisation of existing capacities: • wastewater treatment 65% of hydraulic capacity • sewer connections 90%
asset characteristics
biologically treated/ invoiced 131% (infiltration + rainwater)
costs: • amortisation less than 7% of the total
revenu • energy 20% • labor 40% • general and otheres 33%
capital, liquidity and profitability indicators
3,9%; 0,04%
outstandings/ turnover: 5%
monetary indicators
specific productivity indicators Full cost recovery according to WFD is by far not reached in Hungary. Armortisation and replacement are not covered by the fees. No guidelines exist in Hungary similar to the German LAWA-guideline for cost calculation. Armortisation is not or only partly considered. Mr. Kovács emphasises the importance of WFD and the principle of full cost recovery as inducement for elaborating a set of key performance indicators. These indicators can be communicated towards public and EU institutions and contribute to a common understanding.
The European Water Association and The German Association for Water, Wastewater and Waste
© All rights reserved 18
Another point is, that sustainability of projects under preparation is not ensured in Hungary. The existing infrastructure has to be reevaluated in order to guarantee financial resources for renewal. The present forecast for future funding is not covering the present value of future replacement. The Deutsche Bundesstiftung Umwelt (DBU) finances a project with the aim to support cost benefit analysis on the basis of German LAWA-guidelines in Rumania, Bulgaria, Slovakia and Hungary. Mr. Kovács suggests to combine the outcomes of DACH+NL- and DBU-project.
Discussion about perspectives of a common European performance indicator system Benchmarking and the comparison of key performance indicators very often are not clearly distinguished. Although the comparison is the first step in the benchmarking process, it is important to point out, that benchmarking means learning from the best and - as a result - to transpose measures in order to optimise procedures. The original motive of benchmarking was business improvement. From the presentations it becomes obvious, that benchmarking is partly adopted as an official instrument by governmental organisations to gain more transparency. In other cases the impulse came from the companies and the process works on a voluntary basis to gain more efficiency. The different goals are achieved by quite the same methods. Because of this also items are mixed up, which can lead to misunderstanding. One important premise for comparing benchmarking results is “to speak the same language”, which means to agree on a uniform set of key performance indicators. Of course the different needs of the regarded countries have to be considered. Some performance indicators do make sense in one country and are useless in others. In several European countries the prices for water and wastewater are kept artificially low. So in the mind of the workshop participants in could be very helpful to adjust price calculation. Generally, they were on the opinion, that the DACH+NL-approach (see above) is an appropriate starting point for a European set of performance indicators. The work, which has already been done in other European countries – including the EBC’s benchmarking programme, should be taken into account. However, the DACH+NL-indicators are not sufficient to carry out complete benchmarking processes. Nevertheless, they are adequate for strategic positions facing politicians and public. The prospective EWA-system of performance indicators should give just proposals about performance indicators to make a contribution to good data quality. EWA should promote benchmarking in order to improve common understanding of benchmarking, as well as, key performance indicator systems. It is intended to work closely together with other European associations. A possible EWA-system also should contain references to the IWA-system for wastewater. It should be made very clear, what the real need and the final objective of the EWA-system would be. There is no intention to collect data and carry out benchmarking projects by means of EWA. EWA does not intend to publish benchmarking data. The data, which DACH+NL group put together, had already been published on national level. Everyone has access to these data, can make comparisons and draw his own conclusions, which may be wrong because of the great differences between the data bases. As a first step the delegates of the different countries settled on distributing the DACH+NL-set of key performance indicators in their home countries with the aim to provoke discussion. To support the discussion the DACH+NL report is available on EWA homepage (see: www.EWA-online.eu). We kindly ask interested persons to address their comments to [email protected]. Comments are also most welcome to the following question: what kind of indicators could produce reliable survey data in the different countries?

The European Water Association and The German Association for Water, Wastewater and Waste
© All rights reserved 19
Another Workshop will take place in 2010 to discuss the comments and decide about the further course of action.