international trade of bamboo and rattan 2012 -...
TRANSCRIPT

InternationalTrade of
Bamboo and Rattan2012
© 2014International Network for Bamboo and Rattan
Natural distribution of bamboo Natural distribution of rattan
International Network for Bamboo and Rattan
www.inbar.int
International Network for Bamboo and Rattan (INBAR)P. O. Box 100102-86Beijing 100102, P. R. China
Tel: 00 86 10 64706161Fax: 00 86 10 64702166 Email: [email protected]:// www.inbar.int
ISBN: 978-92-95098-44-2
Compiled and edited by Wu JunqiDesigned by Megan CaiProduced by Megan Cai, Andrew BentonAll photos by INBAR except: Cover furniture (Moso nternational BV), cover LED-bamboo (Dragon�y Design Center)

Contents
International Trade of Bamboo and Rattan 2012
Foreword 3Introduction 4Summary 61. General Trade Status of Bamboo and Rattan Products in the International Market 8
1.1 Trade trend of bamboo and rattan products 91.2 Trade �ow of bamboo and rattan products 11
2. Overview of the International Trade of Major Bamboo and Rattan Products 132.1 Bamboo and rattan raw materials 132.2 Bamboo shoots 162.3 Bamboo woven products 172.4 Rattan woven products 192.5 Industrialized bamboo products 212.6 Bamboo and rattan furniture products 24
3. Main Importers and Exporters of Bamboo and Rattan Products 273.1 China 273.2 EU 313.3 USA 383.4 Indonesia 413.5 Viet Nam 433.6 Philippines 443.7 Japan 463.8 Canada 473.9 Singapore 49
4. Bamboo and Rattan Trade of INBAR Member Countries 52
Annexes 561. INBAR member countries 562. Countries with estimated data 563. HS codes for bamboo and rattan commodities 574. Export value of main bamboo and rattan products in 2012 58

Contents
International Trade of Bamboo and Rattan 2012
Foreword 3Introduction 4Summary 61. General Trade Status of Bamboo and Rattan Products in the International Market 8
1.1 91.2
Trade trend of bamboo and rattan products Trade flow of bamboo and rattan products 11
2. Overview of the International Trade of Major Bamboo and Rattan Products 132.1 Bamboo and rattan raw materials 132.2 Bamboo shoots 162.3 Bamboo woven products 172.4 Rattan woven products 192.5 Industrialized bamboo products 212.6 Bamboo and rattan furniture products 24
3. Main Importers and Exporters of Bamboo and Rattan Products 273.1 China 273.2 EU 313.3 USA 383.4 Indonesia 413.5 Viet Nam 433.6 Philippines 443.7 Japan 463.8 Canada 473.9 Singapore 49
4. Bamboo and Rattan Trade of INBAR Member Countries 52
Annexes 561. INBAR member countries 562. Countries with estimated data 563. HS codes for bamboo and rattan commodities 574. Export value of main bamboo and rattan products in 2012 58

Foreword
International Trade of Bamboo and Rattan 2012
3
Bamboo and rattan are two of the most important Non-Timber Forest Products and play very important roles for local people in many rural areas. There are many traditional uses of bamboo and rattan in the major producing countries in Asia, Africa and Latin-America, where they are used for handicrafts, food, daily utensils, furniture, housing, paper, energy and more.
Today, the bamboo and rattan industries contribute signi�cantly to livelihood and economic development in many countries in the tropics and sub-tropics. For example, In China alone, the domestic bamboo sector is now worth US$ 19.5 billion per year and provides employment to 7.75 million people. In India, roughly 8.6 million people are also dependent on bamboo for their livelihood. In 2012, the domestic market for bamboo and rattan products in major producing countries was estimated at US$ 34.2 billion, with and additional US$ 2.5 billion of international trade in bamboo and rattan products.
INBAR recognizes that as fast developing sectors with the potential to support sustainable green growth, bamboo and rattan industries are gaining increasing global attention. This makes the need for reliable trade data ever more important. In 2007, a set of new codes for bamboo and rattan were introduced to the UN Harmonized System (HS) Codes and in 2017 this will be expanded to 24 codes. These speci�c bamboo and rattan HS codes make it possible to better identify and monitor the major bamboo and rattan products traded in the global market and provide more information on bamboo and rattan for use in statistics, legal regulations and tax duties. The new codes will give a better understanding of the supply chain of bamboo and rattan from a global perspective.
In this report, we focus on the international market of bamboo and rattan products to obtain a snap-shot of production and consumption of this sector. This is the �rst time INBAR has conducted such a detailed analysis of the global market of bamboo and rattan, and we intend to produce periodic reviews in the future.
Hans FriederichDirector General, INBAR

Introduction
The report
The aim of this �rst-ever assessment of the international trade in bamboo and rattan commodities is to map global bamboo and rattan trade ows, identify key markets and outline major trends. This report reviews the trade status in the global market, with a focus on those bamboo and rattan commodities with classi�ed individual UN HS codes. It contains data on exports and imports for 1992-2012. The review includes data appendices on total trade value for all reporting countries of UN Comtrade and contains 4 substantive chapters. The �rst chapter gives an overview of the global market of bamboo and rattan. The second chapter describes the trade status of each commodity, such as trend, market and ow. The third chapter gives an analysis on the key importers and exporter in the global market of bamboo and rattan commodities. In the end, a trade overview on bamboo and rattan commodities for INBAR member countries is provided in the forth chapter.
This report covers seven regions - Asia, Europe, Africa, North America, Central America, South America and Oceania. Note that as a trading body, data of the European Union1 includes external (to and from outside the EU) and internal trade (between EU member states). In the global trade ow data, the EU is considered as a whole.
The data
This analysis is primarily based on trade data provided by the UN Comtrade, which is the most comprehensive source providing annual data on international trade as reported by the exporting and importing countries, by quantity (kg) and value (US$). Data is presented up to and including 2012, and includes estimates for those countries that have not uploaded their data to the UN Comtrade database. The base year for analysis is taken as 2012, as reasonably reliable data for most countries were available for this year at the time of preparation.
Prior to 2007, there were 10, 6-digit HS codes covering bamboo and rattan commodities, including bamboo and rattan vegetable materials, woven products, furniture and seats, and bamboo shoots, only two of which were speci�ed for bamboo and rattan, the raw materials. Since 2007, there are altogether 16, 6-digit HS codes for bamboo and rattan commodities, covering 5 categories and 8 chapters, among of them 10 codes for bamboo, 4 for rattan, and 2 codes for mixed bamboo and rattan products. Please see code details on bamboo and rattan commodities identi�ed by the international market in table 1.
1 In this report, the “EU” includes 27 member countries, but not Croatia, which join the EU in 2013.
4 5
This report covers Asia, Europe, Africa, North America, Central America, South America and Oceania.
By January 2014, 79 countries had reported their trade data for 2007 to the UN Comtrade database, 111 for 2008, 129 for 2009, 136 for 2010,137 for 2011 and 25 for 2012. Some of the countries whose trade data with HS code 2007 are not available in UN Comtrade, some countries still report their trade using HS 1992 codes whilst others have not yet completed uploading their data. In these cases, trade data has been estimated based on their partner’s information.
Bamboo and rattan trade data based on the existing HS codes is usually underestimated for the following reasons: 1, the incomplete identi�cation of bamboo and rattan products in the Harmonized Coding System, which results in the non appearance of those bamboo and rattan product types that are not covered under speci�c individual HS codes - as they are classi�ed under non-bamboo or rattan headings and so do not show up; 2, not all the countries report their data to UN Comtrade in time each year, nor do all countries use the latest, 2007, codes. Therefore, due to the existing data limitations, trade analysis based on UN Comtrade trade data would underestimate the international bamboo and rattan trade and ignore some exporting or importing countries.
Category
Bamboo and rattan raw materials
Bamboo shoots
Bamboo woven products
Rattan woven products
Industrialized bamboo products
Bamboo and rattan furniture products
Product
Bamboo raw materialsRattan raw materialsBamboo shootsBamboo mats/screensBamboo plaits and plaiting materialsBamboo basketworkRattan mats/screensRattan plaits and plaiting materialsRattan basketworkBamboo charcoalBamboo ooringBamboo plywoodBamboo pulpBamboo paper-based articles
Bamboo and rattan seatsBamboo and rattan furniture
HS code 2007
140110140120200591460121460192460211460122460193460212440210440921441210470630482361
940151940381
Table 1 Main Bamboo and Rattan Products and Category
International Trade of Bamboo and Rattan 2012

2 Reported by the State Forestry Administration, China.3 Baksy, A. 2013. The Bamboo Sector in India – Supply chain structure, challenges and recommendations. CCS Working Paper #283
Summary
Global Market of Bamboo and Rattan
As two of the world’s most important non-timber forest resources, bamboo and rattan are not only integrally linked to the livelihoods of millions of people, but also provide humanity with numerous essential environmental services. Bamboos, widely distributed across Asia and the Paci�c, the Americas and the Caribbean, and Africa, cover an estimated area of 37 million hectares, equivalent to almost 4% of the world’s total forest coverage (FAO 2010). Rattan is also distributed across approximately 35 million hectares of natural forests, of which 29.2 million hectares are concentrated in Indonesia, Malaysia and other Southeast Asian countries. The global bamboo and rattan industries have developed very rapidly in recent decades, especially the bamboo sector. For example, in China, the national production value of bamboo industry increased to US$ 19.5 billion2 in 2012 from US$ 13.1 billion in 2010. In India, the bamboo industry is predicted expected to be about US$ 4.35 billion in 2015, a huge increase from US$ 34 million in 20033.
Based on the available data sources, the international trade of bamboo and rattan in 2012 was estimated at about US$ 2.5 billion, of which about US$ 600 million worth is not included in the United Nations Commodity Trade Statistics Database (UN Comtrade).
International Trade of Bamboo and Rattan Commodities
The main bamboo and rattan commodities traded in the international market are bamboo and rattan raw materials, bamboo shoots, bamboo woven products, rattan woven products, industrialized bamboo products, and bamboo and rattan furniture and seats. Industrialized bamboo products have been only recognized by the international market since 2007 when the current individual HS codes become e�ective.
Over the past decades, the international trade of bamboo and rattan has been increasing steadily. The export value of higher technology value-added bamboo and rattan products (such as engineered bamboo panels, bamboo furniture, etc.) increased faster than the traditional ones (such as, bamboo and rattan mats and screens, basketworks). Based on the UN Comtrade data, the world export of bamboo and rattan products reached its record high of US$ 2,557 million in 2008. Due to the global �nancial crisis, the value decreased sharply by about 25% in 2009. In 2012, the world export of bamboo and rattan commodities was about US$ 1,881 million, of which 29% was the industrialized bamboo products and 25% was bamboo woven products.
Conclusions
The international trade of bamboo and rattan commodities provides a picture of the distribution and �ow of bamboo and rattan products in world, both the producing and exporting areas and the consuming and importing areas.
Bamboo and rattan industries are drawing more and more attention from the world and bamboo and rattan trade seems so important both for developing countries that have bamboo and rattan resources, and for developed countries with advanced processing technologies.
Traditional bamboo and rattan commodities such as woven products, have occupied a considerable market share in the world. However, a large market potential for the newly developed bamboo and rattan products, especially engineered bamboo products, can be foreseen in the future.
The recognition of bamboo and rattan products at the international level is necessary and statistics need to be improved in the future, through cooperation between countries and international organizations, and by producing more speci�c individual HS codes to enable a better tracking of bamboo and rattan trade.
6 7
Most bamboo and rattan products are exported to the world from within Asia, accounting for 84% of the world exports in 2012 and Europe, Asia and North America collectively made up 93% of world imports.
The traditional bamboo and rattan producing countries with bamboo and rattan resources are the main exporters. They include China, Indonesia, Viet Nam, Philippines and Singapore, Thailand, Malaysia, Myanmar, and so on. The EU and the USA are also important exporters as they produce value added bamboo products with the raw materials and semi-processed products that they import. There is also noticeable trade between EU members. In 2012, China contributed about 66% of bamboo and rattan of the international market, followed by the EU with a market share of 11% and Indonesia, 9%.
The EU, the USA and Japan are the top three importers of bamboo and rattan products in the world. In 2012 they collectively accounted for 72% of the world total imports. Other signi�cant importers of BR products were Canada, Singapore, Australia, Russia and Korea.
Most INBAR members are traditional bamboo and rattan producers, such as China, Indonesia, Viet Nam, Philippines and Malaysia. In 2012, the export value of BR products from INBAR members to the world reached US$ 1,562 million, accounting for 83% of the world total, while the import valued at US$ 145 million, which accounted for 9% of world imports.
International Trade of Bamboo and Rattan 2012

Figure 1-1 World exports of bamboo and rattan products in 2012
(Unit: US$ million, %)
Figure 1-2 World exports of bamboo and rattan products during 1992-2006
(Unit: US$ million)
8 9
Bamboo and rattan products traded in the international market include bamboo and rattan raw materials, bamboo shoots, bamboo woven products, rattan woven products, industrialized bamboo products, bamboo and rattan furniture and seats.
In 2012, the total export value of BAMBOO AND RATTAN products was about US$ 1,881 million (Figure 1-1). The export of industrialized bamboo products and bamboo woven products was valued at US$ 539 million and US$ 476 million, accounting for 29% and 25% of the total export value respectively. It was followed by BAMBOO AND RATTAN furniture products (US$ 290 million, 15%) and bamboo shoots (US$ 276 million, 15%). A significant amount of rattan woven products have been exported as well, with a total export value of US$ 206 million, equivalent to an 11% share of total exports. The raw bamboo and rattan materials were the least exported commodities, worth about US$ 93 million (5% of the total exports).
1.1 Trade trend of bamboo and rattan products
1992-2006
Before 2007, the international market for BR products was dominated by BR raw materials, BR woven products and BR furniture, of which BR baskets and BR furniture accounted for 34% and 40% of the total exports. It was followed by BR seats and BR mats/screens, with a proportion of 13% and 9%. BR raw materials were the least traded products, constituting about 3% of the world total.
Based on UN Comtrade data, the international trade of BR products increased steadily between 1996 and 2006. The export value of bamboo and rattan products increased from US$ 1,299 million in 1992 to US$ 3,891 million4 in 2006, with an average annual growth rate of 12%, an average growth of US$ 172.8 million every year.
As shown in Figure 1-2, the export value of BR raw materials remained nearly unchanged from 1992 to 2006. Meanwhile, the export value of rattan raw materials decreased from the highest record of US$ 87 million in 1996 to US$ 41 million in 2006. During that period, the export value of BR woven products was steadily growing from US$ 604 million in 1992 to US$ 1,804 million in 2006, with an average annual growth rate of 12%. The export value of BR furniture increased by 19% annually, from US$ 403 million in 1992 to US$ 1,637 million in 2006, while the export value of BR seats only saw a 3% annual growth.
General Trade Status of Bamboo and Rattan
Products in the International Market1
4 The total export value of bamboo and rattan recorded with HS codes prior to 2007 may not re�ect the true values because, with the exception of the two codes for raw bamboo and raw rattan that were in use at the time, other bamboo and rattan products were normally included in broader categories such as wooden or plaiting materials and were not reported distinctly as bamboo or rattan.
International Trade of Bamboo and Rattan 2012

1.2 Trade �ow of bamboo and rattan products
Main trade regions
Asia is the main source of bamboo and rattan products. In 2012, the export value of bamboo and rattan products from Asia reached US$ 1,597 million, accounting for 85% of global export value. It was followed by Europe, with an export value of US$ 216 million, about 14% of Asia’s total, or 12% of global exports.
Europe is the main importing region of bamboo and rattan products, accounting for 43% of world imports, worth about US$ 679 million in 2012. In Asia and North America, the import value reached US$ 462 million and US$ 344 million respectively, accounting for 29% and 22% of the world total. Europe, Asia and North America collectively made up 93% of global imports.
Main exporters and importers
China is the largest producer and exporter of BR products. In 2012, China exported US$ 1,238 million worth BR products, which accounted for 66% of the world total. It was followed by the EU, with total export value of US$ 214 million, accounting for 11% of the world exports. The third largest exporter was Indonesia (US$ 176 million, 9%). The main exporters (China, the EU and Indonesia) together accounted for 87% of world BR exports. Vietnam, Philippines, USA, Singapore and Thailand were also important exporters of BR products.
10 11
2007-2012
According to UN Comtrade statistics, the global export value of bamboo and rattan products decreased by 25% or US$ 628 million, from US$ 2,509 million in 2007 to US$ 1,881 million in 20125, with an average annual decline rate of 6% (or US$ 126 million). It peaked at US$ 2,557 million in 2008. A�ected by the global �nancial crisis, the export value decreased sharply to US$ 1,809 million in 2009, then remained around US$ 1,900 million until 2012.
As shown in Figure 1-3, the world export of BR raw materials was valued at around US$ 100 million during 2007-2012, while the export value of bamboo shoots increased from US$ 223 million in 2007 to US$ 276 million in 2012. During that period, the export value of other BR products decreased as well, of which exports of BR furniture saw an annual decline of 10% (US$ 65 million) from US$ 645 million in 2007 to US$ 290 million in 2012. The export value of bamboo woven products reached its highest level of US$ 754 million in 2008, but decreased to US$ 476 million in 2012. The world export of rattan woven products saw a fall from US$ 284 million in 2007 to US$ 206 million in 2012. Export of industrialized bamboo products dropped from US$ 706 million in 2007 to US$ 400 million in 2010, then recovered to US$ 539 million in 2012.
In terms of proportion of total trade, bamboo and rattan raw materials and rattan woven products remained unchanged during 2007-2012, at about 5% and 11% respectively. The export volume of bamboo shoots remained unchanged but that of other products decreased, and so the proportion of bamboo shoots traded increased from 9% in 2007 to 15% in 2012. The share of bamboo woven products was unstable during that period, peaking at 30% in 2007, before falling again to 25%. The proportion of bamboo and rattan furniture generally dropped from 26% in 2007 to 15% in 2012 and the share of industrialized bamboo products showed a fall from 28% in 2007 down to a low of 20% in 2010, then picked up to 29% in 2012.
Figure 1-3 World exports of bamboo and rattan products during 2007-2012
(Unit: US$ million)
Figure 1-4 Trade of bamboo and rattan products in the regions in 2012
(Unit: US$ million)
5 14 new individual bamboo and rattan product HS codes approved by the WCO were adopted in 2007 giving a total of 16 currently in use, as shown in Table 1.
International Trade of Bamboo and Rattan 2012

12
The EU is the largest importer of bamboo and rattan products. In 2012, the import value of bamboo and rattan products to the EU was US$ 607 million, which accounted for 38% of the world total. It was followed by the USA (US$ 289 million, 18%). The third largest importer of bamboo and rattan products was Japan. Japan imported US$ 256 million worth of bamboo and rattan products in 2012, constituting 16% of the world total. The top three importers - the EU, the USA and Japan - collectively accounted for 72% of the world total imports. Other signi�cant importers of bamboo and rattan products were Canada, Singapore, Australia, Russia and Korea.
2.1 Bamboo and rattan raw materials
Overview of world trade in BR raw materials
In 2012, the export value of bamboo and rattan raw materials was US$ 92.8 million, which accounted for 5% of the world total of bamboo and rattan products, of which the export of bamboo raw materials was valued at US$ 69.4 million and US$ 23.4 million for rattan raw materials.
The export value of bamboo raw materials has been steadily growing from US$ 49.4 million in 2007 to US$ 69.4 million in 2012, while the export value of rattan raw materials decreased from US$ 60.3 million in 2007 to US$ 23.4 million in 2012. There was a sharp drop from US$ 61.1 million in 2011 to US$ 23.4 million in 2012.
There are 16 major bamboo and rattan product types traded in the international market, which can be classified into 6 categories according to their characteristics, including bamboo and rattan raw materials, bamboo shoots, bamboo woven products, rattan woven products, industrialized bamboo products, bamboo and rattan furniture products.
Figure 1-5 Key exporters and importers of bamboo and rattan products in 2012
(Unit: US$ million)
Overview of the International Trade of
Major Bamboo and Rattan Products2

14 15
Figure 2-1 Trade of bamboo and rattan raw materials during 2007-2012
(Unit: US$ million)
Figure 2-3 Main exporters and importers of bamboo raw materials in 2012
(Unit: US$ million)
Figure 2-2 Trade of bamboo raw materials in regions in 2012
(Unit: US$ million)
Trade of bamboo raw materials between the regions
Asia is the main production area of bamboo and rattan raw materials. In 2012, the world export value of rattan raw materials from Asia was US$ 78.6 million, accounting for 85% of world exports. Followed by Europe, its export value reached US$ 12.2 million, which accounted for 13% of the world total.
Asia and Europe are the main importing areas of bamboo and rattan raw materials. In 2012, Asia and Europe collectively imported US$ 64 million worth bamboo and rattan raw materials, which accounted for 40% of world total, followed by North America (US$ 22.1 million, 14%).
Main exporters and importers of bamboo raw materials
China is the largest exporter of bamboo raw materials. In 2012, the export value of bamboo raw materials from China reached US$ 48.2 million, accounting for 70% of the world total, followed by the EU (US$ 10.9 million, 16%).
Main exporters and importers of rattan raw materials
Singapore and China are the most important exporters and importers of rattan raw materials.In 2012, the export value of rattan raw materials from Singapore reached US$ 13.9 million, accounting for 60% of the world total. The total import value of rattan raw material to Singapore was US$ 10.2 million, which accounted for 20% of the global exports. China exported some US$ 3.7 million worth rattan raw material in 2012, accounting for 16% of the world total. The imports of rattan raw materials to China was valued at US$ 18.6 million, or 36% of the world total.
The EU is the largest importer of bamboo raw materials. In 2012, the EU imported some US$ 53.4 million worth bamboo raw materials, accounting for 50% of the world total, followed by USA, with an import value of US$ 16.5 million, which accounted for 15% of the global import value.
Figure 2-4 Main exporters and importers of rattan raw materials in 2012
(Unit: US$ million)
International Trade of Bamboo and Rattan 2012

16 17
Figure 2-5 Main exporters and importers of bamboo shoots in 2012
(Unit: US$ million)
Figure 2-6 World exports of bamboo woven products in 2007-2012
(Unit: US$ million)
2.2 Bamboo shoots
The term “bamboo shoots”mainly refers to preserved bamboo shoots.
Overview of world trade in bamboo shoots
In 2012, the global export value of bamboo shoots reached US$ 276 million, accounting for 15% of the world export of bamboo and rattan products. The export value of bamboo shoots has been growing steadily year by year. It remained around US$ 220 million before 2010 and rose to US$ 276 million in 2012.
Main exporters and importers of bamboo shoots
China is the largest exporter of bamboo shoots in the world. In 2012, the total export value of bamboo shoots from China reached US$ 240.9 million, which accounted for 87% of the total export market. It was followed by the EU (US$ 20.6 million, 8%) and Thailand (US$ 12 million, 4%).
Japan is the largest importer of bamboo shoots. In 2012, Japan imported some US$ 160.4 million worth of bamboo shoots, accounting for 59% of the world import of bamboo shoots. The EU and USA also are important importers of bamboo shoots. There was a US$ 55.2 million import value of bamboo shoots by the EU, and US$ 40.4 million by USA, respectively accounting for 20% and 15% of world import. Japan, EU and USA together make up 95% of the world total.
2.3 Bamboo woven products
Bamboo woven products include bamboo basketwork, bamboo mats/screens, as well as bamboo plaits and plaiting materials.
Overview of world trade in bamboo woven products
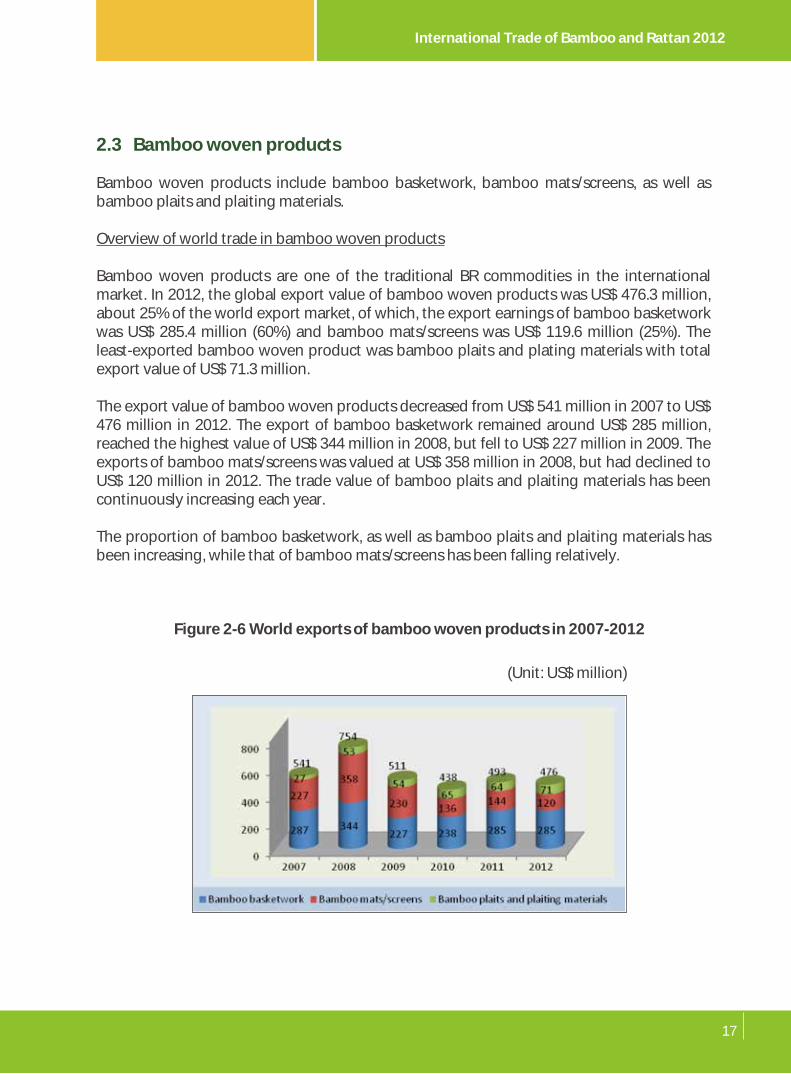
Bamboo woven products are one of the traditional BR commodities in the international market. In 2012, the global export value of bamboo woven products was US$ 476.3 million, about 25% of the world export market, of which, the export earnings of bamboo basketwork was US$ 285.4 million (60%) and bamboo mats/screens was US$ 119.6 million (25%). The least-exported bamboo woven product was bamboo plaits and plating materials with total export value of US$ 71.3 million.
The export value of bamboo woven products decreased from US$ 541 million in 2007 to US$ 476 million in 2012. The export of bamboo basketwork remained around US$ 285 million, reached the highest value of US$ 344 million in 2008, but fell to US$ 227 million in 2009. The exports of bamboo mats/screens was valued at US$ 358 million in 2008, but had declined to US$ 120 million in 2012. The trade value of bamboo plaits and plaiting materials has been continuously increasing each year.
The proportion of bamboo basketwork, as well as bamboo plaits and plaiting materials has been increasing, while that of bamboo mats/screens has been falling relatively.
International Trade of Bamboo and Rattan 2012
16 17
Figure 2-5 Main exporters and importers of bamboo shoots in 2012
(Unit: US$ million)
Figure 2-6 World exports of bamboo woven products in 2007-2012
(Unit: US$ million)
2.2 Bamboo shoots
The term “bamboo shoots”mainly refers to preserved bamboo shoots.
Overview of world trade in bamboo shoots
In 2012, the global export value of bamboo shoots reached US$ 276 million, accounting for 15% of the world export of bamboo and rattan products. The export value of bamboo shoots has been growing steadily year by year. It remained around US$ 220 million before 2010 and rose to US$ 276 million in 2012.
Main exporters and importers of bamboo shoots
China is the largest exporter of bamboo shoots in the world. In 2012, the total export value of bamboo shoots from China reached US$ 240.9 million, which accounted for 87% of the total export market. It was followed by the EU (US$ 20.6 million, 8%) and Thailand (US$ 12 million, 4%).
Japan is the largest importer of bamboo shoots. In 2012, Japan imported some US$ 160.4 million worth of bamboo shoots, accounting for 59% of the world import of bamboo shoots. The EU and USA also are important importers of bamboo shoots. There was a US$ 55.2 million import value of bamboo shoots by the EU, and US$ 40.4 million by USA, respectively accounting for 20% and 15% of world import. Japan, EU and USA together make up 95% of the world total.
2.3 Bamboo woven products
Bamboo woven products include bamboo basketwork, bamboo mats/screens, as well as bamboo plaits and plaiting materials.
Overview of world trade in bamboo woven products
Bamboo woven products are one of the traditional BR commodities in the international market. In 2012, the global export value of bamboo woven products was US$ 476.3 million, about 25% of the world export market, of which, the export earnings of bamboo basketwork was US$ 285.4 million (60%) and bamboo mats/screens was US$ 119.6 million (25%). The least-exported bamboo woven product was bamboo plaits and plating materials with total export value of US$ 71.3 million.
The export value of bamboo woven products decreased from US$ 541 million in 2007 to US$ 476 million in 2012. The export of bamboo basketwork remained around US$ 285 million, reached the highest value of US$ 344 million in 2008, but fell to US$ 227 million in 2009. The exports of bamboo mats/screens was valued at US$ 358 million in 2008, but had declined to US$ 120 million in 2012. The trade value of bamboo plaits and plaiting materials has been continuously increasing each year.
The proportion of bamboo basketwork, as well as bamboo plaits and plaiting materials has been increasing, while that of bamboo mats/screens has been falling relatively.
International Trade of Bamboo and Rattan 2012

18 19
Trade of bamboo woven products in the regions
Asia is the main production area of bamboo woven products, which exported some worth US$ 438.2 million to the world in 2012, which accounted for 92% of the world total.
Europe is the main importing area of bamboo woven products. In 2012, Europe imported US$ 126.3 million worth bamboo woven products, accounting for 42% of the total import of this sector. It was followed by North America (US$ 80.6 million, 27%) and Asia (US$ 68.8 million, 23%)
Main exporters and importers of bamboo woven products
China is the largest exporter of rattan woven products. In 2012, the export value of rattan woven products from China to the world reached US$ 103.3 million, about 50% of export market. It was followed by Indonesia which contributed about 23% to the world imports, worth US$ 46.4 million. China and Indonesia together made up about 73% of the global export of rattan woven products. In addition, Vietnam, Philippines and the EU were also signi�cant exporters of rattan woven products, with export values of around US$ 16.5 million each.
The EU is the largest importer of bamboo woven products. In 2012, about US$ 107.5 million worth of bamboo woven products were imported by the EU, accounting for 36% of the worlds import in this sector. This was followed by the USA, which contributed about 24% of the world import with total import value of US$ 70.3 million. The third largest importer was Japan, with an import value of US$ 36.6 million, which accounted for 12% of the import market. Besides, Korea, Russia, Australia and Canada were signi�cant importers of bamboo woven products as well.
Figure 2-7 Trade of bamboo woven products in regions in 2012
(Unit: US$ million)
Figure 2-8 Main exporters and importers of bamboo woven products in 2012
(Unit: US$ million)
Figure 2-9 World exports of rattan woven products in 2007-2012
(Unit: US$ million)
2.4 Rattan woven products
Rattan woven products include rattan basketwork, rattan mats/screens and rattan plaits and plaiting materials.
Overview of world trade in rattan woven products
The total export value of rattan woven products reached US$ 206.1 million in 2012, which accounted for 11% of the global export of bamboo and rattan products. As the main trade commodity of rattan, the export value of rattan basketwork was US$ 197.2 million, which contributed about 96% to the world exports of rattan woven products. However, the trade value of rattan woven products has been unstable in the past years, with an overall declining trend.
International Trade of Bamboo and Rattan 2012

20 21
Trade of rattan woven products between the regions
Asia is the main exporting area of rattan woven products, which made up 91% of global exports of rattan woven products, worth US$ 186.8 million in 2012. Second to Asia, Europe’s total export value of rattan woven products reached US$ 16.4 million, with a market share of 8%.
Europe is the main importer of rattan woven products. In 2012, Europe imported some US$ 93.7 million worth bamboo woven products, accounting for 53% of world imports. The second largest importer was North America, with a total import value of US$ 47.4 million, about 27% of market share. As the third largest importer, Asia contributed about 16% to the world total, with a total import value of US$ 29.2 million.
Main exporters and importers of rattan woven products
China is the largest exporter of rattan woven products. In 2012, the export value of rattan woven products from China to the world reached US$ 103.3 million, about 50% of export market. It was followed by Indonesia which contributed about 23% to the world imports, worthUS$ 46.4 million. China and Indonesia together made up about 73% of the global export of rattan woven products. In addition, Vietnam, Philippines and the EU were also signi�cant exporters of rattan woven products, with export values of around US$ 16.5 million each.
The EU is the largest importer of rattan woven products, with an import value of US$ 84.9 million in 2012, accounting for 48% of the import market. This was followed by the USA, with a total import value of US$ 43.1 million, 24% of the world import. The EU and USA together contributed 72% to the world import total of rattan woven products.
Figure 2-10 Trade of rattan woven products in regions in 2012
(Unit: US$ million)
2.5 Industrialized bamboo products
Industrialized bamboo products include bamboo �ooring, bamboo plywood, bamboo charcoal, bamboo paper-based articles and bamboo pulp.
Overview of world trade in industrialized bamboo products
The total export value of industrialized bamboo products in 2012 reached to US$ 538.5 million, which accounted for 29% of world exports of bamboo and rattan products. Bamboo �ooring valued at US$ 366.4 million with 68% of the exports of industrialized bamboo products, followed by bamboo plywood with a total export value of US$ 114.6 million (21%). The export value of bamboo charcoal, bamboo paper-based articles and bamboo pulp was relatively small, collectively about US$ 57 million.
The trade value of industrialized bamboo products has been unstable, having peaked at the highest record in 2007 and 2008, then declined to a lower level, but has slowly picked up again. The proportion of bamboo �ooring traded has been growing annually, while that of bamboo plywood decreased in the past years.
Figure 2-11 Main exporters and importers of rattan woven products in 2012
(Unit: US$ million)
International Trade of Bamboo and Rattan 2012

22 23
Trade of industrialized bamboo products between the regions
Asia is the main exporting area of industrialized bamboo products, with a total export value of US$ 427.2 million in 2012, accounting for 79% of the world exports. Europe contributed 12% to the world export, with a value of US$ 65.0 million. North America was another main exporting area, with an export value of US$ 20.5 million, 4% of the world export.
Bamboo flooring
China is the largest exporter of bamboo �ooring. The export of bamboo �ooring from China to the world was valued at US$ 333 million in 2012, about 91% of the world exports of bamboo �ooring. The EU is the largest importer of bamboo �ooring, with an import value of US$ 47 million in 2012, accounting for 44% of the world import of bamboo �ooring. It was followed by Canada, with an import value of US$ 19 million.
Bamboo plywood
As the largest exporter of bamboo plywood, China exported some US$ 65 million worth of bamboo plywood in 2012, accounting for 57% of the world export of bamboo plywood. It was followed by the EU, with an export value of US$ 30 million (26%). The largest importer of bamboo plywood is the EU, which contributed 30% of the world import of bamboo plywood in 2012, valued at US$ 41 million. Following with the EU, both Singapore and USA imported about a value of US$ 17 million respectively.
Europe is the main importer of industrialized bamboo products, importing US$ 159.2 million in 2012, accounting for 46% of world import. Asia and North America also were key importing areas, who contributed about 23% (US$ 80.2 million) and 19% (US$ 64.3 million) to the world import of this sector.
Figure 2-12 Exports of industrialized bamboo products during 2007-2012
(Unit: US$ million)
Figure 2-13 Trade of industrialized bamboo products in regions in 2012
(Unit: US$ million)
Main exporters and importers of industrialized bamboo products
As the largest exporter of industrialized bamboo products, China exported some US$ 412.6 million worth in 2012, about 77% of the world exports in this sector. It was followed by the EU, with a total export value of US$ 64.4 million (12%).
The largest importer of industrialized bamboo products is the EU. In 2012, the total import value of industrialized bamboo products from the world to the EU reached US$ 150.6 million, which accounted for 44% of the world import. As the second largest importer, the USA imported a total of US$ 37.9 million (11%) industrialized bamboo products. Other signi�cant importers were Canada, Singapore, India and Australia.
Figure 2-14 Main exporters and importers of industrialized bamboo products in 2012
(Unit: US$ million)
International Trade of Bamboo and Rattan 2012

24 25
Bamboo charcoal
Being the largest exporter of bamboo charcoal, China shared 28% in the world export market with an export value of US$ 12 million in 2012, followed by the EU and Nigeria who contributed about 23% (both valued at US$ 10 million) of the world export of bamboo charcoal. The largest importer of bamboo charcoal is the EU, in 2012, the import value of bamboo charcoal from the world to the EU reached US$ 9 million, accounting for 38% of the world import of this sector. It was followed by Japan (US$ 5 million, 20%) and Korea (US$ 4 million, 17%).
Bamboo pulp and paper-based articles
China is the largest exporter of bamboo pulp, exporting some US$ 2 million worth of pulp to the world in 2012, accounting for 52% of the world export. The largest importer of bamboo pulp is the EU. In 2012, the total import value of bamboo paper-based products from the world to the EU reached to US$ 33 million, about 87% of the import market of this sector.
The EU and the USA are the main producers and consumers of bamboo paper-based articles. In 2012, the total export value of bamboo paper-based articles from the EU to the world reached US$ 5 million, which accounted for 42% of the world export of bamboo charcoal. With a market share of 24% (US$ 3 million), the USA was the second largest exporter of bamboo paper-based articles in 2012. Meanwhile, with total import values of US$ 21 million (52%), the EU dominated the global import of bamboo paper-based articles. USA was the second largest importer, sharing 37% (US$ 15 million) of the import market.
2.6 Bamboo and rattan furniture products
Bamboo and rattan furniture products refer to bamboo and rattan seats and bamboo and rattan furniture.
Overview of world trade in bamboo and rattan furniture products
The global export value of bamboo and rattan furniture products was US$ 290.4 million in 2012, which accounted for 15% of the world export of bamboo and rattan products. Of this, bamboo and rattan seats valued at US$ 136.9 million and bamboo and rattan furniture valued at US$ 153.5 million.
The export value of bamboo and rattan furniture products fell from US$ 645.4 million in 2007 to US$ 290.4 million in 2012.
Trade of bamboo and rattan furniture and seats between the regions
Asia is the main exporting area of bamboo and rattan furniture products. In 2012, Asia exported a signi�cant amount of bamboo and rattan furniture products, accounting for 72% of the world export market, valued at US$ 210.3 million. Following Asia, Europe exported a value of US$ 71.4 million (25%). Together, Asia and Europe made up 97% of the global export of bamboo and rattan furniture products.
Europe is the main importing area of bamboo and rattan furniture products. With a total import value of US$ 178.9 million, Europe took 52% of the world imports of bamboo and rattan furniture products in 2012. The second largest importing area was North America (US$ 86.6 million, 25%). Asia ranked in the third place, importing US$ 51.2 million worth of products, about 15% of the import market of bamboo and rattan furniture products. The top three importing areas of bamboo and rattan furniture products (Europe, North America and Asia) accounted for 91% of the world exports of this sector.
Figure 2-15 Exports of bamboo and rattan furniture and seats during 2007-2012
(Unit: US$ million)
Figure 2-16 Trade of bamboo and rattan furniture and seats in regions in 2012
(Unit: US$ million)
International Trade of Bamboo and Rattan 2012
26
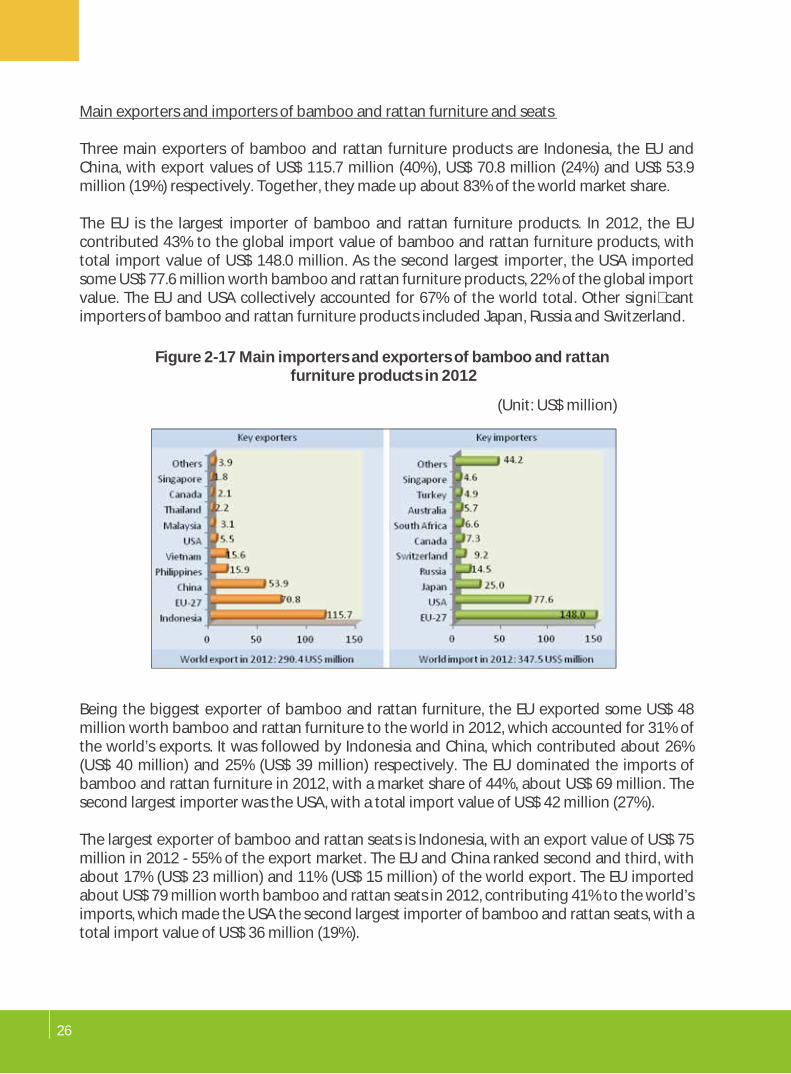
Main exporters and importers of bamboo and rattan furniture and seats
Three main exporters of bamboo and rattan furniture products are Indonesia, the EU and China, with export values of US$ 115.7 million (40%), US$ 70.8 million (24%) and US$ 53.9 million (19%) respectively. Together, they made up about 83% of the world market share.
The EU is the largest importer of bamboo and rattan furniture products. In 2012, the EU contributed 43% to the global import value of bamboo and rattan furniture products, with total import value of US$ 148.0 million. As the second largest importer, the USA imported some US$ 77.6 million worth bamboo and rattan furniture products, 22% of the global import value. The EU and USA collectively accounted for 67% of the world total. Other signi�cant importers of bamboo and rattan furniture products included Japan, Russia and Switzerland.
Being the biggest exporter of bamboo and rattan furniture, the EU exported some US$ 48 million worth bamboo and rattan furniture to the world in 2012, which accounted for 31% of the world’s exports. It was followed by Indonesia and China, which contributed about 26% (US$ 40 million) and 25% (US$ 39 million) respectively. The EU dominated the imports of bamboo and rattan furniture in 2012, with a market share of 44%, about US$ 69 million. The second largest importer was the USA, with a total import value of US$ 42 million (27%).
The largest exporter of bamboo and rattan seats is Indonesia, with an export value of US$ 75 million in 2012 - 55% of the export market. The EU and China ranked second and third, with about 17% (US$ 23 million) and 11% (US$ 15 million) of the world export. The EU imported about US$ 79 million worth bamboo and rattan seats in 2012, contributing 41% to the world’s imports, which made the USA the second largest importer of bamboo and rattan seats, with a total import value of US$ 36 million (19%).
Figure 2-17 Main importers and exporters of bamboo and rattan furniture products in 2012
(Unit: US$ million)
Main Importers and Exporters
of Bamboo and Rattan Products3
3.1 China
China is the major producer and exporter of BR products in the world. In 2012, the total export value of BR products from China reached to US$ 1,238 million, accounting for 66% of the world export, which made China the largest exporter of BR products. China is also the main importer of BR products. In 2012, the total import value of BR products to China was US$ 27 million, ranking it ninth.
The export value of bamboo and rattan product from China remained above US$ 1,100 million during 2007- 2008. There was a slight drop in 2009 due to the global economic downturn to US$ 1,043 million. In 2010, the export value further declined to US$ 1,022 million. Subsequently it has been increased, and reached US$ 1,238 million in 2012. The import value of bamboo and rattan products to China decreased from US$ 55 million in 2007 to US$ 27 million in 2012.
This section lists the top import and exporting countries of bambooand rattan products. Some important importers are also significantexporters, such as China, the EU and the USA.

26
Main exporters and importers of bamboo and rattan furniture and seats
Three main exporters of bamboo and rattan furniture products are Indonesia, the EU and China, with export values of US$ 115.7 million (40%), US$ 70.8 million (24%) and US$ 53.9 million (19%) respectively. Together, they made up about 83% of the world market share.
The EU is the largest importer of bamboo and rattan furniture products. In 2012, the EU contributed 43% to the global import value of bamboo and rattan furniture products, with total import value of US$ 148.0 million. As the second largest importer, the USA imported some US$ 77.6 million worth bamboo and rattan furniture products, 22% of the global import value. The EU and USA collectively accounted for 67% of the world total. Other signi�cant importers of bamboo and rattan furniture products included Japan, Russia and Switzerland.
Being the biggest exporter of bamboo and rattan furniture, the EU exported some US$ 48 million worth bamboo and rattan furniture to the world in 2012, which accounted for 31% of the world’s exports. It was followed by Indonesia and China, which contributed about 26% (US$ 40 million) and 25% (US$ 39 million) respectively. The EU dominated the imports of bamboo and rattan furniture in 2012, with a market share of 44%, about US$ 69 million. The second largest importer was the USA, with a total import value of US$ 42 million (27%).
The largest exporter of bamboo and rattan seats is Indonesia, with an export value of US$ 75 million in 2012 - 55% of the export market. The EU and China ranked second and third, with about 17% (US$ 23 million) and 11% (US$ 15 million) of the world export. The EU imported about US$ 79 million worth bamboo and rattan seats in 2012, contributing 41% to the world’s imports, which made the USA the second largest importer of bamboo and rattan seats, with a total import value of US$ 36 million (19%).
Figure 2-17 Main importers and exporters of bamboo and rattan furniture products in 2012
(Unit: US$ million)
Main Importers and Exporters
of Bamboo and Rattan Products3
3.1 China
China is the major producer and exporter of BR products in the world. In 2012, the total export value of BR products from China reached to US$ 1,238 million, accounting for 66% of the world export, which made China the largest exporter of BR products. China is also the main importer of BR products. In 2012, the total import value of BR products to China was US$ 27 million, ranking it ninth.
The export value of bamboo and rattan product from China remained above US$ 1,100 million during 2007- 2008. There was a slight drop in 2009 due to the global economic downturn to US$ 1,043 million. In 2010, the export value further declined to US$ 1,022 million. Subsequently it has been increased, and reached US$ 1,238 million in 2012. The import value of bamboo and rattan products to China decreased from US$ 55 million in 2007 to US$ 27 million in 2012.
This section lists the top import and exporting countries of bambooand rattan products. Some important importers are also significantexporters, such as China, the EU and the USA.

28 29
Figure 3-1 International trade of bamboo and rattan products of China during 2007-2012
(Unit: US$ million)
Figure 3-3 Exports of bamboo and rattan products from China and the world in 2012
(Unit: US$ million, %)
Figure 3-2 International export of Chinese bamboo and rattan products during 2007-2012
(Unit: US$ million)
The major BR products exported by China include industrialized bamboo products and bamboo woven products. These both accounted for about 30% of China’s export of BR products. Bamboo shoots are the third most signi�cant items exported. In 2012, their export value from China was US$ 240.9 million, 20% to the total export value of BR products from China, up from 14% in 2007.
Main bamboo and rattan products traded from and to China in 2012
As the major products exported from China, the export value of industrialized bamboo products and bamboo woven products was US$ 412.6 million and US$ 375.1 million respectively, accounting for 33% and 30% of the total exports of Chinese bamboo and rattan products in 2012. The export of bamboo shoots was valued at US$ 240.9 million, a proportion of 20%. The export value of industrialized bamboo products, bamboo woven products and bamboo shoots collectively reached US$ 1,029 million, which accounted for 83% of the export market of Chinese bamboo and rattan products.
As the major bamboo and rattan products for exporting, the total export value of bamboo �ooring, bamboo shoots and bamboo basketwork was US$ 332.8 million, US$ 240.9 million and US$ 204.1 million, respectively, accounting for 27%, 20% and 17% of total exports from China in 2012. Together, they made up 63% (US$ 778 million) of the total export value of Chinese bamboo and rattan products.
Bamboo and rattan raw materials are the main bamboo and rattan product imported by China. In 2012, the total import value of bamboo and rattan raw materials to China was US$ 21.4 million, 79% of China’s total imports of bamboo and rattan products, of which the import of rattan raw materials was valued at US$ 18.6 million, about 68% of total imports by China.
International Trade of Bamboo and Rattan 2012

30 31
Figure 3-4 Imports of bamboo and rattan products to China and the world in 2012
(Unit: US$ million, %)
Figure 3-6 Main exporters of bamboo and rattan products to China in 2012
(Unit: US$ million, %)
Figure 3-5 Main importers of bamboo and rattan products from China in 2012
(Unit: US$ million, %)
Industrialized bamboo products are a major bamboo and rattan product type imported into China. But the import value has been falling rapidly in the last few years and the proportion of industrialized bamboo products decreased from 40% in 2007 to 7% in 2012. The import value of rattan woven products has been increased yearly, from 1% in 2007 to 6% in 2012.
Major trade partners of China in 2012
The USA, the EU and Japan are the major export partners of China in terms of bamboo and rattan products. In 2012, China exported US$ 316.7 million, US$ 248.7 million and US$ 242.5 million worth bamboo and rattan products to the USA, the EU and Japan respectively. The total exports of Chinese bamboo and rattan products to these countries accounted for 65% of Chinese total exports of bamboo and rattan products, worth about US$ 808 million.
The USA is the largest importer of Chinese bamboo and rattan products, particularly bamboo �ooring and bamboo basketwork. In 2012, China shipped US$ 177 million and US$ 39.9 million worth of bamboo �ooring and bamboo basketwork to USA respectively, accounting for 56% and 13% of the total export value of bamboo and rattan products exported from China to USA.
The EU is the second largest importer of Chinese bamboo and rattan products, with major products of bamboo �ooring and rattan basketwork. The import value of bamboo �ooring and rattan basketwork from China to the EU reached US$ 47.2 million and US$ 43.3 million respectively, contributing 20% and 19% to the total import value from China to the EU.Other major products exported to the EU were bamboo basketwork (13%), bamboo plaits and plaiting materials (11%), and bamboo shoots (10%).
Japan is the third largest importer of Chinese bamboo and rattan products. Bamboo shoots are the major bamboo and rattan product exported from China to Japan, with a total export value of US$ 169.4 million in 2012, about 70% of the total exports from China to Japan. Bamboo basketwork exported from China to Japan in 2012 was about US$ 28.2 million, accounting for 12% of the total exports from China to Japan.
Indonesia is the largest import partner of Chinese BR products. China imported US$ 14.2 million worth BR products from Indonesia, which accounted for 52% of the total import value to China from the world. It was followed by Malaysia, with an import value of US$ 3.0 million (11%).
3.2 The EU
Europe is a signi�cant trader of BR products, both for the global export and import markets. The export and import value of BR products by the EU reached US$ 213.9 million and US$ 607 million in 2012, accounting for 11% and 38% of the world total respectively, which made the EU the second largest exporter and the biggest importer.
International Trade of Bamboo and Rattan 2012

32 33
Overall, the traded value of bamboo and rattan products by the EU has been decreasing, of which the import value decreased from US$ 1,071.1 million in 2007 to US$ 607 million in 2012, with an annual decline rate of 11%, US$ 77.3 million. The export value dropped as well, at an annual rate of 14% (US$ 47.1 million), from US$ 449.4 million in 2007 to US$ 213.9 million in 2012.
Two major bamboo and rattan products imported to the EU from the world include industrialized bamboo products and bamboo and rattan furniture products. In 2012, the EU imported US$ 150.6 million and US$ 148.0 million worth of industrialized bamboo products and bamboo and rattan furniture products, accounting for 25% and 24% of the total import value of the EU. In addition, bamboo woven products and rattan woven products are other signi�cant products imported by the EU.
As the major products exported from the EU, the export value of bamboo and rattan furniture products and industrialized bamboo products reached 71 million US$ and 64 US$ million, accounting for 33% and 30% of the total export of the EU bamboo and rattan products in 2012. The export of bamboo woven products valued at 30 US$ million, a proportion of 14%. The export value of bamboo and rattan furniture products, industrialized bamboo products and bamboo woven products collectively reached 165 US$ million, which accounted for 77% in the export market of the EU bamboo and rattan products.
Two major products exported from the EU to the world are bamboo and rattan furniture products and industrialized bamboo products, which contributed about 33% and 30% of the total export value of the EU, worth US$ 70.8 million and US$ 64.4 million respectively. In addition, bamboo woven products are also signi�cant products exported from the EU, with a market share of 14%.
Figure 3-7 International trade of bamboo and rattan products of EU during 2007-2012
(Unit: US$ million) Figure 3-9 Imports of bamboo and rattan products to the EU during 2007-2012
(Unit: US$ million)
Figure 3-10 Exports of bamboo and rattan products from EU and the world in 2012
(Unit: US$ million, %)
Figure 3-8 Exports of bamboo and rattan products from the EU during 2007-2012
(Unit: US$ million)
International Trade of Bamboo and Rattan 2012
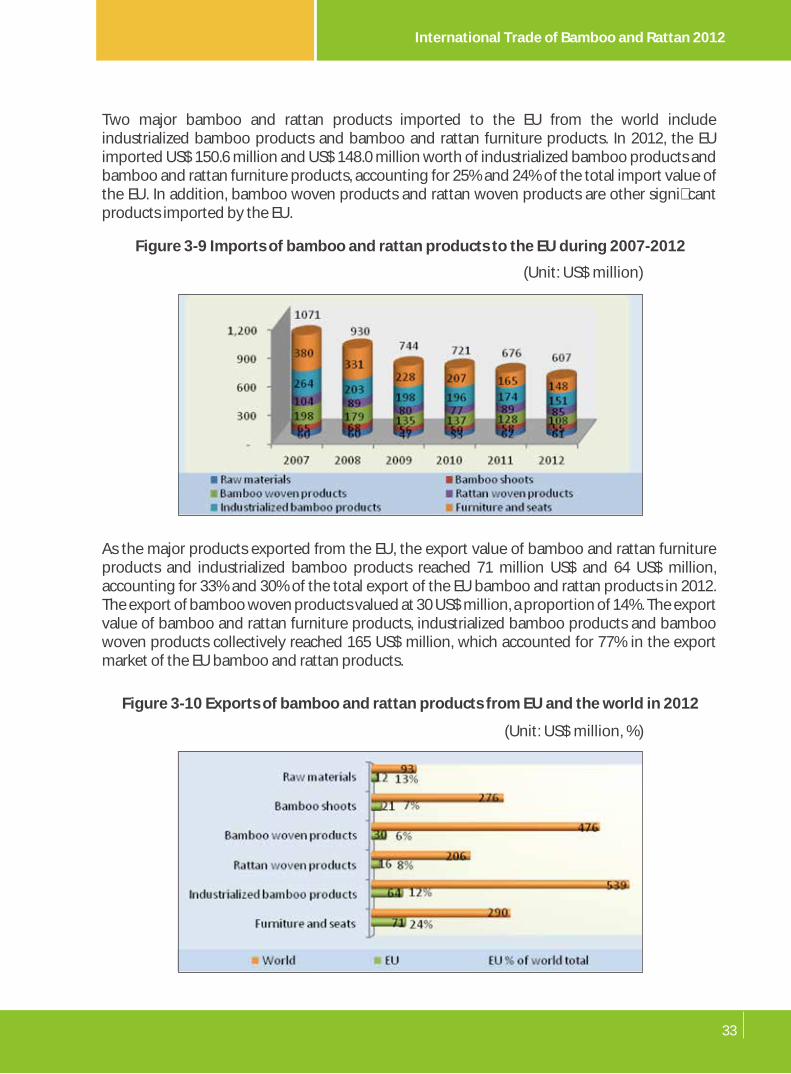
32 33
Overall, the traded value of bamboo and rattan products by the EU has been decreasing, of which the import value decreased from US$ 1,071.1 million in 2007 to US$ 607 million in 2012, with an annual decline rate of 11%, US$ 77.3 million. The export value dropped as well, at an annual rate of 14% (US$ 47.1 million), from US$ 449.4 million in 2007 to US$ 213.9 million in 2012.
Two major bamboo and rattan products imported to the EU from the world include industrialized bamboo products and bamboo and rattan furniture products. In 2012, the EU imported US$ 150.6 million and US$ 148.0 million worth of industrialized bamboo products and bamboo and rattan furniture products, accounting for 25% and 24% of the total import value of the EU. In addition, bamboo woven products and rattan woven products are other signi�cant products imported by the EU.
As the major products exported from the EU, the export value of bamboo and rattan furniture products and industrialized bamboo products reached 71 million US$ and 64 US$ million, accounting for 33% and 30% of the total export of the EU bamboo and rattan products in 2012. The export of bamboo woven products valued at 30 US$ million, a proportion of 14%. The export value of bamboo and rattan furniture products, industrialized bamboo products and bamboo woven products collectively reached 165 US$ million, which accounted for 77% in the export market of the EU bamboo and rattan products.
Two major products exported from the EU to the world are bamboo and rattan furniture products and industrialized bamboo products, which contributed about 33% and 30% of the total export value of the EU, worth US$ 70.8 million and US$ 64.4 million respectively. In addition, bamboo woven products are also signi�cant products exported from the EU, with a market share of 14%.
Figure 3-7 International trade of bamboo and rattan products of EU during 2007-2012
(Unit: US$ million) Figure 3-9 Imports of bamboo and rattan products to the EU during 2007-2012
(Unit: US$ million)
Figure 3-10 Exports of bamboo and rattan products from EU and the world in 2012
(Unit: US$ million, %)
Figure 3-8 Exports of bamboo and rattan products from the EU during 2007-2012
(Unit: US$ million)
International Trade of Bamboo and Rattan 2012

34 35
Bamboo and rattan furniture products, industrialized bamboo products and bamboo woven products are also the main bamboo and rattan products imported by the EU. In 2012, the import value of bamboo and rattan furniture products, industrialized bamboo products and bamboo woven products to the EU was 148 US$ million, 151 million US$ and 108 US$ million, respectively, accounting for 25%, 24% and 18% of the total import of the EU bamboo and rattan products in 2012.
Main BR products in external EU trade
In 2012, the EU exported some US$ 23.4 million worth bamboo and rattan furniture products to other countries in the international market, accounting for 47% of EU external exports, in which, bamboo and rattan furniture was valued at US$ 17.9 million. The export value of bamboo and rattan seats and rattan basketwork from the EU reached US$ 5.5 million and US$ 5.0 million, accounting for 11% and 10% of EU external exports respectively. Both bamboo shoots and bamboo basketwork was valued at US$ 4 million, 8% of external EU exports.
Compared to exports, external EU import trade of bamboo and rattan products is more evenly distributed. In 2012, Europe imported from the rest of world US$ 112.2 million and US$ 91.2 million worth of bamboo and rattan furniture products and bamboo woven products, which accounted for 27% and 22% of EU external imports. Imports of rattan basketwork, bamboo and rattan seats, bamboo basketwork, bamboo and rattan furniture, and bamboo raw materials were very similar, all above 10%, with import values of US$ 74.9 million (18% of EU external imports), US$ 59.7 million (14%), US$ 58.0 million (14%), US$ 52.5 million (13%) and US$ 46.0 million (11%) respectively.
External EU trade of bamboo and rattan products
In 2012, the export and import value of BR products of EU to and from the rest of world reached to US$ 50.1 million and US$ 413.5 million, accounting for 3% and 26% of the world exports and imports.
However, the export value of bamboo and rattan products for EU external trade decreased from US$ 104.6 million in 2007 to US$ 50.1 million in 2012, with an annual decline rate of 14%, about US$ 10.9 million annually. The value of bamboo and rattan products imported to the EU from the rest of world also shows a downturn from US$ 721.7 million in 2007 to US$ 413.5 million in 2012, an average annual decrease of 11%, or US$ 61.6 million every year.
Figure 3-11 Imports of bamboo and rattan products to EU and the world in 2012(Unit: US$ million, %)
Figure 3-13 Exports of bamboo and rattan products of the external EU trade in 2012(Unit: US$ million)
Figure 3-14 Imports of bamboo and rattan products of the external EU trade in 2012(Unit: US$ million)
Figure 3-12 The external EU trade of bamboo and rattan products during 2007-2012(Unit: US$ million)
International Trade of Bamboo and Rattan 2012

36 37
The export value of bamboo and rattan products traded between EU members decreased by 14% (US$ 36.2 million) annually, from US$ 344.8 million in 2007 to US$ 163.8 million in 2012. The import value of bamboo and rattan products traded in the EU internal market dropped from US$ 349.4 million in 2007 to US$ 193.5 million in 2012, with an average annual rate of minus 11% (US$ 31.2 million).
Main bamboo and rattan products in internal EU trade
Industrialized bamboo products and bamboo and rattan furniture products are two major bamboo and rattan products in the EU’s internal export market. The export value of these two major products was US$ 55.7 million and US$ 47.4 million in 2012, accounting for 34% and 29% of internal EU exports. Another important bamboo and rattan product, bamboo woven products, constituted 15%.
Figure 3-17 The internal EU trade of bamboo and rattan products during 2007-2012
(Unit: US$ million)
Figure 3-18 Exports of bamboo and rattan products of the internal EU trade in 2012
(Unit: US$ million, %)
Main partners of external EU trade
Switzerland, Norway and the USA are the main importers of EU external exports. In 2012, the EU exported US$ 12.7 million worth of bamboo and rattan products to Switzerland. Both Norway and the USA imported about US$ 6 million worth products from the EU.
Internal EU trade
The internal trade of BR products within the EU block was US$ 163.8 million (exports) and US$ 193.5 million (imports) in 2012, accounting for 9% and 12% of the world total of BR products respectively.
China is the largest exporter of bamboo and rattan products to the EU. China contributed 61% to the total value of bamboo and rattan products of external EU imports, valued at US$ 250.6 million. As the second largest exporter, Indonesia supplied US$ 99.2 million worth bamboo and rattan products for the EU in 2012, accounting for 24% of external EU imports.
Figure 3-15 Main exporters of bamboo and rattan products of the external EU trade in 2012
(Unit: US$ million, %)
Figure 3-16 Main importers of bamboo and rattan products of the external EU trade in 2012
(Unit: US$ million, %)
International Trade of Bamboo and Rattan 2012

38 39
Industrialized bamboo products are the major bamboo and rattan product type traded within the EU internal market, with import values of US$ 101.3 million (52%) in 2012. Bamboo and rattan furniture products and bamboo shoots are other signi�cant products traded within the EU, at about 15% of the total.
Main partners of internal EU trade
Within the EU’s internal market, the Netherlands is the biggest exporter of bamboo and rattan products. The Netherlands exported about US$ 44.5 million worth bamboo and rattan products to other EU members in 2012, which accounted for 27% of EU internal exports. It was followed by Belgium, Italy and Spain, with market shares of 14% (about US$ 22 million) each. Another important exporter of bamboo and rattan products in EU internal market is Germany, with a total export value of US$ 17.0 million (10%). Austria and Netherlands are the biggest importers of bamboo and rattan products, contributing about 21% (US$ 41.4 million) and 18% (US$ 34.0 million). Besides, Belgium, France, Germany and UK were also signi�cant importers in the EU internal trade market.
The overall trade in bamboo and rattan products in the USA shows a decreasing trend. The export value declined by 14% (US$ 7.2 million) annually, from US$ 67.2 million in 2007 to US$ 31.2 million in 2012. The import value to the USA dropped by 6% or US$ 21.8 million each year, from US$ 397.8 million in 2007 to US$ 288.6 million in 2012.
Main bamboo and rattan products traded to and from the USA in 2012
Industrialized bamboo products are the major BR products exported from USA. In 2012, the USA supplied about US$ 19.5 million of industrialized bamboo products to the world market, which accounted for 62% of USA total exports of BR products. The export value of bamboo �ooring and bamboo plywood was US$ 11.3 million and US$ 4.7 million, or 36% and 15% of USA total exports, respectively.
3.3 USA
The USA is the main importer and consumer of bamboo and rattan products. The export and import value of bamboo and rattan products to and from the USA was US$ 31.2 million and US$ 288.6 million in 2012, accounting for 2% and 18% of the world total. The USA is the second biggest importer and sixth largest exporter of bamboo and rattan products in the world.
Figure 3-19 Main exporters and importers of bamboo and rattan products of the internal EU trade in 2012
(Unit: US$ million)
Figure 3-20 International trade of bamboo and rattan products of the USA during 2007-2012
(Unit: US$ million)
Figure 3-21 Exports of bamboo and rattan products from the USA in 2012
(Unit: US$ million, %)
International Trade of Bamboo and Rattan 2012

40 41
On the other hand, the import value of bamboo and rattan products to the USA has remained relatively stable. The main imports of bamboo and rattan products to the USA are bamboo and rattan furniture products and bamboo woven products, with the total import value of US$ 77.6 million and US$ 70.3 million in 2012. The imports of bamboo basketwork was valued at US$ 60.1 million in 2012, or 21% of the USA’s total imports. Followed by bamboo and rattan furniture, rattan basketwork, bamboo shoots, and bamboo and rattan seats, the total import value was US$ 40 million (about 14% of USA total imports) respectively.
China is the biggest exporter of BR products to the USA, and exported about US$ 159.8 million worth products there in 2012, accounting for 55% of total USA imports of BR products. The imports of BR products to the USA from China composed bamboo basketwork, with a value of US$ 42 million, 26% of USA total import of BR products from China, bamboo and rattan furniture, a value of US$ 22 million and a proportion of 14%, and bamboo shoots, US$ 22 million and 14%.
3.4 Indonesia
Indonesia is a major producer and exporter of bamboo and rattan products, accounting for 9%, or US$ 175.7 million of world exports of bamboo and rattan products in 2012, which made it the third-largest exporter of bamboo and rattan products in the world.
Exports of bamboo and rattan products from Indonesia dropped with an average annual decline of 16% or US$ 47.0 million, from US$ 410.6 million in 2007 to US$ 175.7 million in 2012.
Main trade partners of the USA in 2012
China and Canada are the main destinations for American bamboo and rattan products. In 2012, China and Canada imported some US$ 10.3 million and US$ 9.6 million worth American bamboo and rattan products, constituting 33% and 31% of USA total exports.
In 2012, the USA exported about US$ 9.3 million worth of bamboo �ooring to China, or 91% of total exports of bamboo and rattan products from the USA to China. The export value of bamboo basketwork and bamboo plywood from the USA to Canada in 2012 was US$ 1.9 million and US$ 1.8 million, about 20% and 18% of total export value from USA to Canada.
Figure 3-22 Imports of bamboo and rattan products to the USA and the world in 2012
(Unit: US$ million, %)
Figure 3-24 Main exporters of bamboo and rattan products to USA in 2012
(Unit: US$ million, %)
Figure 3-25 International export of bamboo and rattan products from Indonesia during 2007-2012
(Unit: US$ million)Figure 3-23 Main importers of bamboo and rattan products from USA in 2012
(Unit: US$ million, %)
International Trade of Bamboo and Rattan 2012

42 43
Major bamboo and rattan products exported from Indonesia in 2012
Bamboo and rattan furniture products are the largest export item from Indonesia, with exports valued at US$ 75.2 million in 2012, a market share of 40% of the world export total of bamboo and rattan products.
Main trade partners of Indonesia in 2012
The EU is the major importer of Indonesian bamboo and rattan products. In 2012, Indonesia shipped about US$ 78.4 million worth bamboo and rattan products to the EU, a proportion of 45% of its total exports of bamboo and rattan products. Bamboo and rattan seats and rattan basketwork constituted about 42% (US$ 33.2 million) and 34% (US$ 26.8 million) of total exports of bamboo and rattan products from Indonesia.
Figure 3-26 Exports of bamboo and rattan products from Indonesia in 2012
(Unit: US$ million, %)
Figure 3-28 International export of bamboo and rattan products from Viet Nam during 2007-2012
(Unit: US$ million)
Figure 3-29 Exports of bamboo and rattan products from Viet Nam in 2012(Unit: US$ million, %)
Figure 3-27 Main importers of bamboo and rattan products from Indonesia in 2012
(Unit: US$ million, %)
3.5 Viet Nam
Viet Nam is another signi�cant producer and exporter of bamboo and rattan products. As the fourth largest exporter of bamboo and rattan products in the world, the total export value of bamboo and rattan products from Viet Nam reached US$ 85.6 million in 2012, about 5% of the world’s total.
However, the export value of bamboo and rattan products from Viet Nam had declined in the last few years, from US$ 126.1 million in 2007 to US$ 85.6 million in 2012, with an average annual decline of 8%, or US$ 8.1 million.
Exports of bamboo and rattan products from Viet Nam
Bamboo woven products dominated the export market of bamboo and rattan products in Vietnam, of which bamboo basketwork contributed 55% of total exports from Viet Nam to the world in 2012, worth US$ 47.4 million. It was followed by rattan basketwork, with total export value of US$ 16.7 million.
International Trade of Bamboo and Rattan 2012

44 45
Main trade partners of Viet Nam in 2012
The EU is the main importer of bamboo and rattan products from Viet Nam. In 2012, the total value of bamboo and rattan products exported to the EU from Viet Nam reached US$ 35.2 million, accounting for 41% of total exports from Viet Nam to the world, of which, the share of bamboo basketwork was 48%, or US$ 16.8 million.
Exports of bamboo and rattan products from the Philippines in 2012
Rattan woven products and bamboo and rattan furniture products are the major bamboo and rattan products exported from the Philippines to the world. In 2012, exports of rattan basketwork, bamboo and rattan seats, and bamboo and rattan furniture were valued at US$ 16.5 million (46% of the total exports of bamboo and rattan products from Philippines), US$ 9.3 million (26%) and US$ 6.7 million (19%), respectively. Collectively, the above three product types made up 90% of total exports of bamboo and rattan products from Philippines, worth about US$ 32 million.
Main trade partners of the Philippines
The USA is the main importer of bamboo and rattan products from Philippines. In 2012, the total value of bamboo and rattan products imported to the USA from the Philippines reached US$ 27.4 million, constituting about 76% of total exports from Philippines to the world. Rattan basketwork shares about 51% of total exports of bamboo and rattan products from the Philippines worth US$ 14.1 million. This is followed by bamboo and rattan seats, which constituted 27% of the total exports, with a value of US$ 7.4 million.
3.6 Philippines
As the �fth most important exporter of bamboo and rattan products in the world, the Philippines produces and exports a signi�cant amount of bamboo and rattan products. In 2012, the exports of bamboo and rattan products from the Philippines to the world was valued at US$ 36.0 million, about 2% of the world exports.
The export value of bamboo and rattan products from the Philippines decreased from US$ 63.8 million in 2007 to US$ 36.0 million in 2012, with an average annual decline of US$ 5.6 million (11%).
Figure 3-30 Main importers of bamboo and rattan products from Viet Nam in 2012
(Unit: US$ million, %)Figure 3-32 Exports of bamboo and rattan products from Philippines in 2012
(Unit: US$ million, %)
Figure 3-33 Main importers of bamboo and rattan products from Philippines in 2012
(Unit: US$ million, %)
Figure 3-31 International export of bamboo and rattan products of Philippines during 2007-2012
(Unit: US$ million)
International Trade of Bamboo and Rattan 2012
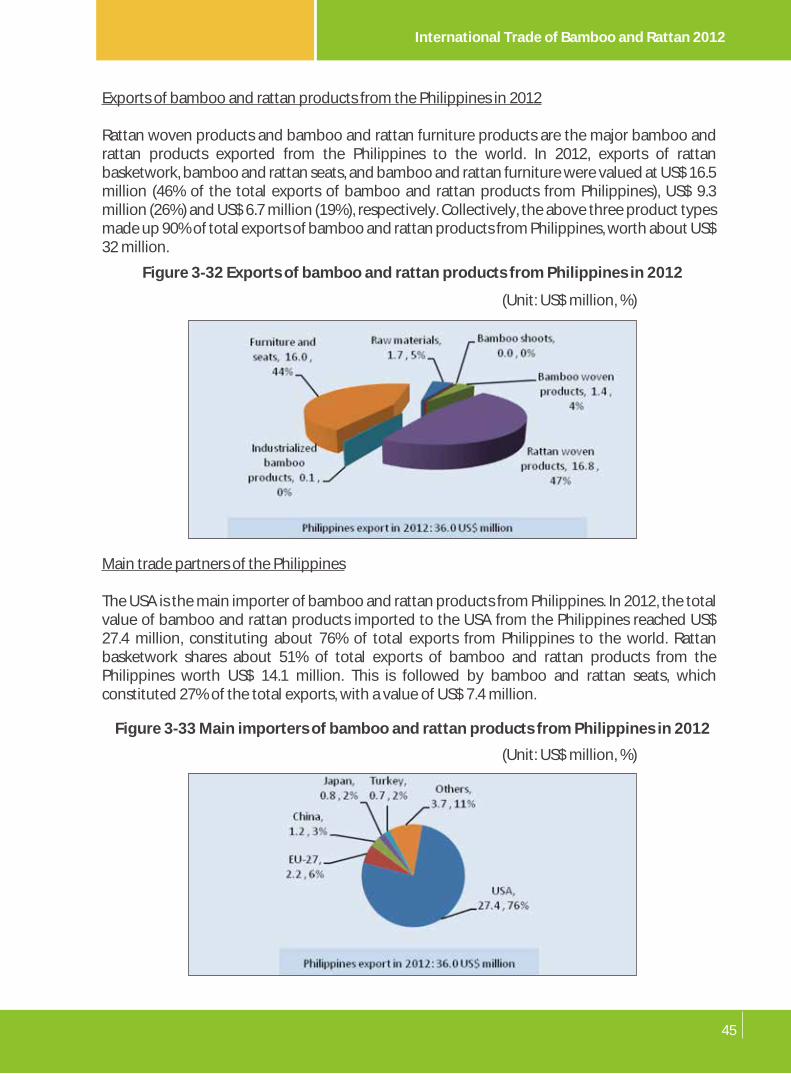
44 45
Main trade partners of Viet Nam in 2012
The EU is the main importer of bamboo and rattan products from Viet Nam. In 2012, the total value of bamboo and rattan products exported to the EU from Viet Nam reached US$ 35.2 million, accounting for 41% of total exports from Viet Nam to the world, of which, the share of bamboo basketwork was 48%, or US$ 16.8 million.
Exports of bamboo and rattan products from the Philippines in 2012
Rattan woven products and bamboo and rattan furniture products are the major bamboo and rattan products exported from the Philippines to the world. In 2012, exports of rattan basketwork, bamboo and rattan seats, and bamboo and rattan furniture were valued at US$ 16.5 million (46% of the total exports of bamboo and rattan products from Philippines), US$ 9.3 million (26%) and US$ 6.7 million (19%), respectively. Collectively, the above three product types made up 90% of total exports of bamboo and rattan products from Philippines, worth about US$ 32 million.
Main trade partners of the Philippines
The USA is the main importer of bamboo and rattan products from Philippines. In 2012, the total value of bamboo and rattan products imported to the USA from the Philippines reached US$ 27.4 million, constituting about 76% of total exports from Philippines to the world. Rattan basketwork shares about 51% of total exports of bamboo and rattan products from the Philippines worth US$ 14.1 million. This is followed by bamboo and rattan seats, which constituted 27% of the total exports, with a value of US$ 7.4 million.
3.6 Philippines
As the �fth most important exporter of bamboo and rattan products in the world, the Philippines produces and exports a signi�cant amount of bamboo and rattan products. In 2012, the exports of bamboo and rattan products from the Philippines to the world was valued at US$ 36.0 million, about 2% of the world exports.
The export value of bamboo and rattan products from the Philippines decreased from US$ 63.8 million in 2007 to US$ 36.0 million in 2012, with an average annual decline of US$ 5.6 million (11%).
Figure 3-30 Main importers of bamboo and rattan products from Viet Nam in 2012
(Unit: US$ million, %)Figure 3-32 Exports of bamboo and rattan products from Philippines in 2012
(Unit: US$ million, %)
Figure 3-33 Main importers of bamboo and rattan products from Philippines in 2012
(Unit: US$ million, %)
Figure 3-31 International export of bamboo and rattan products of Philippines during 2007-2012
(Unit: US$ million)
International Trade of Bamboo and Rattan 2012

46 47
3.7 Japan
As the third largest importer of bamboo and rattan products, Japan imported about US$ 256.2 million worth bamboo and rattan products in 2012, accounting for 16% of the world import.
Japan is a traditional consumer and importer of bamboo shoots. The import value of bamboo and rattan products to Japan from the world has been growing steadily since 2007, with an average annual growth of 2% (US$ 5.3 million), from US$ 299.5 million in 2007 to US$ 256.2 million in 2012.
3.8 Canada
As the fourth largest importer in the world, Canada is another important importer of BR products. The import value of BR products from the world to Canada reached US$ 45.6 million in 2012, accounting for 3% of the world total.
The import value of bamboo and rattan products by Canada decreased from US$ 72.1 million in 2007 to US$ 45.6 million in 2012, declining with an average annual rate of US$ 5.3 million or 9%.
Imports of bamboo and rattan products to Japan in 2012
As the largest importer of bamboo shoots, Japan imported about US$ 160 million of bamboo shoot from the international market, accounting for 59% to the world imports of bamboo shoot in 2012. Following bamboo shoots, bamboo woven products also have a big market in Japan, with import value of US$ 36.6 million, 14% of total import of bamboo and rattan products to Japan.
Main trade partners of Japan in 2012
China is the main supplier of bamboo and rattan products to Japan. In 2012, China shipped about US$ 213.0 million worth bamboo and rattan products to Japan, which made up 83% of the total imports of bamboo and rattan products to Japan from the world. Bamboo shoots constituted 77% of total exports from China to Japan, worth about US$ 158.4 million. Besides, Indonesia also provided some bamboo and rattan products to Japan. Its share in the import market of bamboo and rattan products to Japan was 11%, worth about US$ 27.7 million.
Figure 3-34 International import of bamboo and rattan products to Japan during 2007-2012
(Unit: US$ million)
Figure 3-36 Main exporters of bamboo and rattan products to Japan in 2012(Unit: US$ million, %)
Figure 3-37 International import of bamboo and rattan products to Canada during 2007-2012
(Unit: US$ million)
Figure 3-35 Imports of bamboo and rattan products to Japan in 2012
(Unit: US$ million, %)
International Trade of Bamboo and Rattan 2012

48 49
Imports of bamboo and rattan products to Canada
Industrialized bamboo products are the main bamboo and rattan products consumed by Canada. In 2012, the imports of industrialized bamboo products from the world to Canada were valued at US$ 22.6 million, which contributed about 49.7% to the total imports of Canada. Bamboo ooring constituted about 42% of total imports from the world to Canada, worth about US$ 19.0 million.
Major trade partners of Canada in 2012
In 2012, about 76% of bamboo and rattan products imported to Canada were supplied by China, worth US$ 34.6 million, of which bamboo ooring was valued at US$ 18.8 million, accounting for 54% of the total.
Figure 3-38 Main bamboo and rattan products imported by Canada in 2012(Unit: US$ million, %)
Figure 3-40 International trade of bamboo and rattan products of Singapore during 2007-2012
(Unit: US$ million)
Figure 3-39 Main exporters of bamboo and rattan products to Canada in 2012(Unit: US$ million, %)
3.9 Singapore
Singapore is also an important trade country of bamboo and rattan products in the world, as one of the leading trade transition ports in Asia. In 2012, Singapore's exports and imports of bamboo and rattan products was valued at US$ 20.4 million and US$ 37.9 million, about 1% and 2% of world total in this sector, which made it the seventh exporter and �fth importer.
The export value of bamboo and rattan products from Singapore to the world dropped by 8% annually, from US$ 31.4 million in 2007 to US$ 20.4 million in 2012, with an average annual decline of US$ 2.2 million.
The import value of bamboo and rattan products to Singapore from the world declined from US$ 54.3 million in 2007 to US$ 37.9 million in 2012, decreased by 7% or US$ 3.3 million annually.
Main bamboo and rattan products from and to Singapore
Bamboo and rattan raw materials are the major product exported from Singapore, of which rattan raw materials accounted for 68% of total exports of bamboo and rattan products from Singapore in 2012, worth US$ 13.9 million.
International Trade of Bamboo and Rattan 2012

50 51
Figure 3-41 Exports of bamboo and rattan products from Singapore in 2012
(Unit: US$ million, %)
Figure 3-42 Main bamboo and rattan products imported by Singapore in 2012
(Unit: US$ million, %)
Figure 3-43 Main importers of bamboo and rattan products from Singapore in 2012
(Unit: US$ million, %)
Figure 3-44 Main exporters of bamboo and rattan products to Singapore in 2012
(Unit: US$ million, %)
Industrialized bamboo products are by far the largest type of bamboo and rattan products imported by Singapore. In 2012, Singapore imported some US$ 17.1 million worth bamboo plywood, which contributed about 45% of the total imports of bamboo and rattan products to Singapore.
Malaysia and China are two major suppliers of bamboo and rattan products to Singapore, contributing about 38% and 34% of total imports of global bamboo and rattan products by Singapore respectively, with a value of US$ 14.2 million and US$ 13 million in 2012. Together Malaysia and China made up 72% of total imports of bamboo and rattan products by Singapore.
In 2012, the value of bamboo plywood and rattan raw materials shipped from Malaysia to Singapore was US$ 7.4 million and US$ 6.2 million respectively, contributed 52% and 43% to total imports from Malaysia to Singapore. China exported some US$ 7.1 million worth of bamboo plywood to Singapore in 2012, with a share of 55% of bamboo and rattan products from China to Singapore.
Main trade partners of Singapore in 2012
China is the main importer of bamboo and rattan products from Singapore, which constituted 18% of total exports of bamboo and rattan products from Singapore in 2012, worth US$ 3.6 million.
In 2012, China imported some US$ 3.5 million of rattan raw materials from Singapore, and dominated the export market of bamboo and rattan products from Singapore to China with a share of 99%.
International Trade of Bamboo and Rattan 2012

52 53
Bamboo and Rattan Trade of INBAR
Member Countries4INBAR has 39 INBAR member countries, including 16 from Africa, 11 from Asia, 7 from South America, 3 from Central America, 1 from North America, and 1 from Oceania. Of the members, China, Indonesia, Vietnam and Philippines are major exporters of bamboo and rattan products, while Canada, India, Chile, Panama, Colombia, Ecuador, Venezuela, Bhutan and Tanzania are major importers of bamboo and rattan products. The import and export trade value of bamboo and rattan products for INBAR members as below:
Table 4-1 International trade of bamboo and rattan products with INBAR members in 20126
(Unit: US$ thousands)
CountryExport Import
Value Rank in the world Value Rank in the world
6 Note: No data available for Cuba, Sierra Leone and Eritrea between 2007 and 2012.
ArgentinaBangladeshBeninBhutanBurundiCameroonCanadaChileChinaColombiaEcuador
6551818
3.750.18
104,085
631,237,599
21324
1,560205116
1,7130.33
7345,5665,265
27,2463,3012,560
41879938
117107
4269
3136
52296684957513531
4063
EthiopiaGhanaIndiaIndonesiaJamaicaKenyaMadagascarMalaysiaMozambiqueMyanmarNepalNigeriaPanamaPeruPhilippinesRwandaSenegalSri LankaSurinameTanzaniaTogoTongaUgandaVenezuelaViet Nam
1,2171,2552,157
175,66015
24980
6,49121
14139
9,819739163
35,9841047
1230.682.2
8.9514
1.527.77
85,600
1,562,444
1,880,517
9375103957739217
108115607927333472
11361654496
114894230
-
-
163422
24,1931,668
928448168
8,6137020
827319
4,7113,1703,033
44844
756695
1,40013337
1921,4863,344
144,893
1,599,663
2120163
693849126544589
25435
7456479186767089804
-
-
Main bamboo and rattan products traded with INBAR members
Most INBAR members are traditionally bamboo and rattan producers, such as China, Indonesia, Vietnam, Philippines and Malaysia. In 2012, the export value of bamboo and rattan products from INBAR members to the world reached US$ 1,562 million, accounting for 83% of the world total, while the import valued at US$ 145 million, which accounted for 9% of the world’s imports.
As shown in �gure 4-1, INBAR members contribute a big market share to the world exports of bamboo and rattan products. 92% of world exports of bamboo woven products and 89% of rattan woven products are supplied by INBAR members. 88% of bamboo shoot in the international market is provided by INBAR members, mainly from China as shown in �gure 3-3. 81% of industrialized bamboo products is exported from INBAR members. 72% of furniture products and 64% of raw materials in the exporting market are from INBAR members.
International Trade of Bamboo and Rattan 2012
INBAR member country exportsWorld exports

54 55
Figure 4-1 Exports of bamboo and rattan products from INBAR members in 2012
(Unit: US$ million, %)
Figure 4-2 Imports of bamboo and rattan products to INBAR members in 2012
(Unit: US$ million, %)
Figure 4-3 International trade of bamboo and rattan products of INBAR members during 2007-2012
(Unit: US$ million)As the major bamboo and rattan products imported to INBAR members, the import value of industrialized bamboo products was US$ 55.7 million, accounting for 38% of total imports to INBAR members, or 16% of the world’s imports. This was followed by bamboo and rattan raw materials, worth US$ 34.7 million, which accounted for 24% of total imports to INBAR members, or 22% of the world total. Industrialized bamboo products and bamboo and rattan raw materials together made up 62% of total imports to INBAR members, valued at US$ 90 million.
The share of other four major bamboo and rattan products in the import market is far less than industrialized bamboo products and bamboo and rattan raw materials, about 7% for bamboo woven products, 6% for bamboo and rattan furniture products, 4% for rattan woven products and 2% for bamboo shoots.
Trade trends of bamboo and rattan products with INBAR members
The export value of bamboo and rattan products from INBAR members decreased from US$ 1,828 million in 2007 to US$ 1,562 million in 2012, with an average annual decline of 3% (US$ 53.2 million), from its peak of US$ 1,985 million in 2008. Compared with the global trade of bamboo and rattan products, the decline rate of bamboo and rattan trade with INBAR members is relatively smooth than the global level.
The import value of bamboo and rattan products to INBAR members dropped as well, with an average annual fall of 6% (US$ 10.8 million), from US$ 199 million in 2007 to US$ 145 million, reached the highest level of US$ 293 million in 2008.
International Trade of Bamboo and Rattan 2012

56 57
7 Code 140190 was revised in HS 2002 no longer for bamboo and rattan, but as “Vegetable materials.
other than bamboos & rattans, of a kind used primarily for plaiting (e.g., reeds, rushes, osier, raffia,
cleaned/bleached/dyed cereal straw, & lime bark”.
Annexes
1. INBAR member countries
3. HS codes for bamboo and rattan commodities
2. Countries with estimated data
INBAR member countries (January 2014)
Area Country Quantity
16
11
10
Benin, Burundi, Cameroon, Eritrea, Ethiopia, Ghana, Kenya, Madagascar, Mozambique, Nigeria, Rwanda, Senegal, Sierra Leone, Togo, Uganda, Tanzania
Bangladesh, Bhutan, China, India, Indonesia, Malaysia, Myanmar, Nepal, Philippines, Sri Lanka, Viet Nam
Argentina, Chile, Colombia, Cuba, Ecuador, Jamaica, Panama, Peru, Suriname, Venezuela
Africa
Asia
Latin-America
North America Canada
Oceania Tonga
1
1
Countries with estimated trade data
Year Countries whose trade data were estimated by trade partners
Bangladesh, Benin, Burundi, Cameroon, Ecuador, Ethiopia, Ghana, India, Indonesia, Jamaica, Kenya, Malaysia, Mexico, Morocco, Mozambique, Nigeria, Panama, Peru, Philippines, Rwanda, Senegal, Sri Lanka, Suriname, Togo, Tonga, Uganda, Ukraine, United Arab Emirates, Tanzania, Venezuela, Vietnam, Yemen
Bahrain, Benin, Burundi, Cameroon, Ghana, India, Indonesia, Malaysia, Morocco, Mozambique, Nigeria, Philippines, Qatar, Rwanda, Suriname, Ukraine, Venezuela, Yemen
2007
2008
Barbados, Benin, Botswana, Burundi, Cameroon, Gabon, Ghana, Indonesia, Libya, Morocco, Mozambique, Oman, Philippines, Rwanda, Suriname, Ukraine, Venezuela
Barbados, Benin, Botswana, Cameroon, Indonesia, Iran, Libya, Morocco, Mozambique, Philippines, Qatar, Togo, Ukraine, Venezuela
2009
2010
Antigua and Barbuda, Barbados, Botswana, Cameroon, Morocco, Mozambique, Oman, Paraguay, Philippines, Venezuela2011
Antigua and Barbuda, Barbados, Botswana, Burundi, Cameroon, Mali, Mauritania, Morocco, Paraguay, Philippines, Togo
2012
HS codes for bamboo and rattan commodities
HS 1992 HS 2007
code
140110
140120
1401907
Preserved bamboo shoot
Bamboo mats and screens
Rattan mats and screens
Bamboo plaits and similar products
Rattan plaits and similar products
Rattans
Bamboo used primarily for plaiting
Rattan used primarily for plaiting
Vegetable materials nes, used primarily for plaiting
460120
460191
460210
940150
940380
940151
940381
Mats, matting and screens with cane, bamboo or similar materials
Plaited vegetable material articles with cane, bamboo or similar materials
Basketwork/wickerwork productswith cane, bamboo or similar materials
Seats of cane, osier, bamboo or similar materials
Furniture of cane, osier, bamboo or similar materials
Bamboo basketwork and wickerwork
Rattan basketwork and wickerwork
Bamboo charcoal
Bamboo �ooring
Bamboo plywood
Bamboo pulp
Bamboo paper-based articles
Bamboo and rattan seats
Bamboo and rattan furniture
Bamboos
Commodities Commodities
140120
200591
460121
460122
460192
460193
140110
code
460211
460212
440210
440921
441210
470630
482361
International Trade of Bamboo and Rattan 2012

58
4. Export value of main bamboo and rattan products in 2012
Export value of main bamboo and rattan products in 2012(Unit: US$ million)
HS code
ProductExport value
Category
140110
140120
200591
460121
460192
460211
460122
460193
460212
440210
440921
441210
470630
482361
940151
940381
Total world exports
Bamboo raw materials
Rattan raw materials
Bamboo shoots
Bamboo mats/screens
Bamboo plaits and plaiting materials
Bamboo basketwork
Rattan mats/screens
Rattan plaits and plaiting materials
Rattan basketwork
Bamboo charcoal
Bamboo �ooring
Bamboo plywood
Bamboo pulp
Bamboo paper-based articles
Bamboo and rattan seats
Bamboo and rattan furniture
Bamboo and rattan raw materials
Bamboo and rattan raw materials
Bamboo shoots
Bamboo woven products
Bamboo woven products
Bamboo woven products
Rattan woven products
Rattan woven products
Rattan woven products
Industrialized bamboo products
Industrialized bamboo products
Industrialized bamboo products
Industrialized bamboo products
Industrialized bamboo products
Bamboo and rattan furniture products
Bamboo and rattan furniture products
69.4
23.4
276.3
119.6
71.3
285.4
5.5
3.4
197.2
42.4
366.4
114.6
2.8
12.3
136.9
153.5
1,880.5

InternationalTrade of
Bamboo and Rattan2012
© 2014International Network for Bamboo and Rattan
Natural distribution of bamboo Natural distribution of rattan
International Network for Bamboo and Rattan
www.inbar.int
International Network for Bamboo and Rattan (INBAR)P. O. Box 100102-86Beijing 100102, P. R. China
Tel: 00 86 10 64706161Fax: 00 86 10 64702166 Email: [email protected]:// www.inbar.int
ISBN: 978-92-95098-44-2
Compiled and edited by Wu JunqiDesigned by Megan CaiProduced by Megan Cai, Andrew BentonAll photos by INBAR except: Cover furniture (Moso nternational BV), cover LED-bamboo (Dragon�y Design Center)