international trade -...
TRANSCRIPT
Unit IVUnit IVUnit IVUnit IVUnit IV
Chapter 11
INTERNATIONAL
TRADE
You have already studied about the variousaspects of International trade in the bookFundamentals of Human Geography.International Trade is mutually beneficial asno country is self-sufficient. India’sInternational trade has undergone a sea changein recent years in terms of volume, compositionas well as direction. Although India’scontribution in the world trade is as low as oneper cent of the total volume, yet it plays asignificant role in the world economy.
Let us examine the changing pattern ofIndia’s International trade. In 1950-51, India’sexternal trade was worth Rs.1,214 crore, whichrose to Rs. 22,09,270 crore in 2009-10. Canyou calculate the percentage growth in 2009-10over 1950-51? There are numerous reasons forthis sharp rise in overseas trade, such as, themomentum picked up by the manufacturingsectors, the liberal policies of the government andthe diversification of markets.
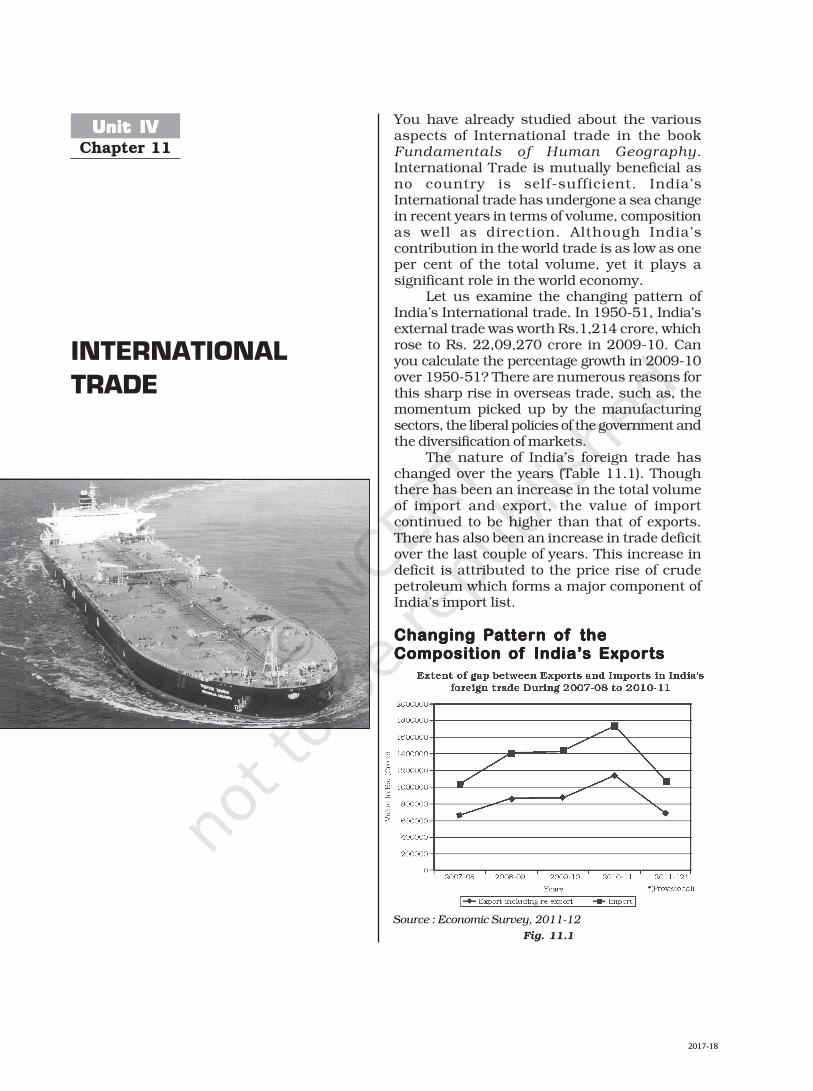
The nature of India’s foreign trade haschanged over the years (Table 11.1). Thoughthere has been an increase in the total volumeof import and export, the value of importcontinued to be higher than that of exports.There has also been an increase in trade deficitover the last couple of years. This increase indeficit is attributed to the price rise of crudepetroleum which forms a major component ofIndia’s import list.
Changing PChanging PChanging PChanging PChanging Paaaaattern ofttern ofttern ofttern ofttern of the the the the theComposition ofComposition ofComposition ofComposition ofComposition of India’ India’ India’ India’ India’s Expors Expors Expors Expors Exportststststs
Source : Economic Survey, 2011-12
Fig. 11.1
2017-18

126 India : People and Economy
Study the data in table 11.2 and answer the following
questions :
Why is the export of agricultural and allied products
declining continuously after 1997-98?
After attaining a peak in 1999-2000, why has the export
of manufacturing goods started decreasing?
Draw bar diagram to show the trends of exports of all
items given in the table. Use pen/pencil of different
colours.
The decline in traditional items is largely dueto the tough international competition. Amongstthe agricultural products, there is a great declinein the exports of traditional items such as coffee,spices, tea, pulses, etc. though an increase hasbeen registered in floricultural products, freshfruits, marine products and sugar, etc.
Manufacturing sector alone accounted for68.0 per cent of India’s total value of export in2010-11. Engineering goods have shown asignificant growth in the export list. China andother East Asian countries are our majorcompetitors. Gems and jewellery contributes alarger share of India’s foreign trade.
Year Exports Imports Total Trade Deficit
2000-01 203,571 230,873 434444 -27302
2004-05 375,340 501,065 876405 -125,725
2007-08 655,864 1,012,312 1668176 -356,448
2009-10 845,534 1,363,736 2209270 -518,202
Table 11.1 India’s Foreign TradeValue in Rs. Crores
Source : http://commerce.nic.in/publications/annual-report - 2010-11
Commodities 1997-98 2003-04 2009-2010 2010-11
Agriculture and allied products 18.93 11.8 10.0 9.9
Ore and Minerals 3.03 3.71 4.9 4.0
Manufactured goods 75.83 75.96 67.4 68.0
Crude and petroleum products 1.01 5.59 16.2 16.8
Other commodities 1.2 2.94 1.5 1.2
Table 11.2 : Composition of India’s Export, 1997-2011(Percentage share in Exports)
Source : Economic Survey 2011-12
As has already been mentioned, thecomposition of commodities in India’sinternational trade has been undergoing achange over the years. The share of agricultureand allied products has declined whereasshares of petroleum and crude products andother commodities have increased. The sharesof ore minerals and manufactured goods havelargely remained constant over the years from1997-98 to 2003-04. The increase in the shareof petroleum products is due to a rise inpetroleum prices as well as increase in India’srefining capacity.
Study table 11.3 and select major commodities
exported in 2010-11 and draw bar diagram.
Changing Patterns of the Composition ofIndia’s Import
India faced serious food shortage during 1950sand 1960s. The major item of import at thattime was foodgrain, capital goods, machineryand equipments. The balance of payment was
2017-18

International Trade 127
adverse as imports were more than export inspite of all the efforts of import substitution.After 1970s, foodgrain import was discontinueddue to the success of green revolution but theenergy crisis of 1973 pushed the prices ofpetroleum, and import budget was also pushedup. Foodgrain import was replaced by fertilisersand petroleum. Machine and equipment,special steel, edible oil and chemicals largelymake the import basket. Examine the changingpattern of imports in Table 11.4 and try tocomprehend the shifts.
Table 11.4 shows that there is a steep risein imports of petroleum products. It is used notonly as a fuel but also as an industrial rawmaterial. It indicates the tempo of risingindustrialisation and better standard of living.Sporadic price rise in the international marketis another reason for the same. Import of capitalgoods maintained a steady increase due to rising
Commodity Group 2009-10 2010-11
Food and allied products 3.7 2.9
Fuel (Coal, POL) 33.2 31.3
Fertilisers 2.3 1.9
Paper board manufacturing and news print 0.5 0.6
Capital goods 15.0 13.1
Others of which 42.6 47.7
Chemicals (5.2) (5.2)
Pearls precious and semi precious stones (5.6) (9.4)
Gold and silver (10.3) (11.5)
Table 11.4 : India Composition of Import 2009-11(In percentage)
Source : Economic Survey 2011-12
Commodities 2010-11
Agriculture and allied products 113116
Ores and Minerals 46152
Manufactured goods 777424
Mineral fuels and Lubricants 192282
Table 11.3 : Export of Principal CommoditiesRs. Crores
Source : Economic Survey 2011-12.
demand in the export-oriented industrial anddomestic sectors. Non-electrical machinery,transport equipment, manufacturers of metalsand machine tools were the main items ofcapital goods. Import of food and alliedproducts declined with a fall in imports ofedible oils. Other major items of India’s importinclude pearls and semi precious stones, goldand silver, metalliferrous ores and metal scrap,non-ferrous metals, electronic goods, etc. Thedetails of Indian imports of principalcommodities during 2010-11 have been givenin table 11.5.
Based on table 11.5, few activities may be
undertaken:
Arrange the items in ascending or
descending order and write the names of
the first five major items of India’s import
list of 2010-11.
Why does India import edible oil in spite of
being an agriculturally rich country?
Select five most important and five least
important items and represent them by bar
diagram.
Can you identify some items of imports for
which substitutes can be developed in
India?
2017-18

128 India : People and Economy
Source : Economic Survey 2005-06 and 2011-12
Direction of Trade
India has trade relations with most of thecountries and major trading blocks of theworld.
Region-wise and sub-region-wise tradeduring the period 2010-11 has been given intable 11.6.
India is a success story in terms ofdiversification of export and import markets.The share of Asia and ASEAN in total tradeincreased from 33.3 per cent in 2000-01 to 57.3per cent in the first half of 2011-12, while thatof Europe and America fell from 42.5 per centto 30.8 per cent respectively. This has helpedIndia weather the global crisis emanating fromEurope and America.(Source : Economic Survey 2011-12)
An interesting development in the directionof India’s trade is that the USA which was infirst position in 2003-04 has been relegated tothird position in 2010-11, with the UAEbecoming India’s largest trading partner,followed by China. This position continued from2008-09 to 2010-11.
Draw a multiple bar diagram to represent the major
trading partners.
Most of India’s foreign trade is carriedthrough sea and air routes. However, a smallportion is also carried through land route toneighbouring countries like Nepal, Bhutan,Bangladesh and Pakistan.
Commodities 2010-11
Fertilisers and fertilizer manufacturing 31533
Edible oils 29860
Pulp and waste paper 5208
Paper board and manufactures 9614
Non-ferrous metals 212153
Iron and steel 47275
Petroleum crude and products 482282
Pearls, precious and semi 1575596precious stones
Medicinal and Pharma products 11114
Chemical products 13278
Table 11.5 : Import of PrincipalCommodities
(in Crore rupees)
Source : Economic Survey 2011-12
Region Imports
2009-10 2010-11
Europe 263471 323857
(a) EU countries (27) 181937 202779
Africa 97871 118612
North America 139480 100602
Latin America 48942 64576
Asia and ASEAN 829224 1029881
Table 11.6 Direction of India’s Import trade
(in crore rupees)
Source : Department of Commerce based on DCCI&S
provisional data, Economic Survey 2011-12.
India aims to double its share in theinternational trade within the next five years. Ithas already started adopting suitable measuressuch as import liberalisation, reduction inimport duties, de-licensing and change fromprocess to product patents.
Country 2003-04 Country 2010-11
U.S.A. 10.3 U.A.E. 10.81
U.K. 3.7 China 10.16
Belgium 3.7 U.S.A. 7.35
Germany 3.5 Saudi Arabia 4.13
Japan 2.7 Switzerland 4.10
Switzerland 3.3 Hong Kong 3.18
Hong Kong 2.8 Germany 3.00
U.A.E. 6.2 Singapore 2.81
China 6.4 Indonesia 2.60
Singapore 3.4 Belgium 2.40
Malaysia 1.7 Korea 2.35
Total 47.7 Total 52.89
Table 11.7 India’s Major TradingPartners’ Percentage share in total
trade (Export + Import)
2017-18

International Trade 129
Sea PSea PSea PSea PSea Porororororts as Gats as Gats as Gats as Gats as Gatetetetetewwwwwaaaaayyyyys ofs ofs ofs ofs of
InternaInternaInternaInternaInternational Ttional Ttional Ttional Ttional Trrrrradeadeadeadeade
India is surrounded by sea from three sides and
is bestowed with a long coastline. Water
provides a smooth surface for very cheap
transport provided there is no turbulence. India
traders and colonisation of the country by the
British. This led to the variation in the size and
quality of ports. There are some ports which
have very vast area of influence and some have
limited area of influence. At present, India has
12 major ports and 185 minor or intermediate
ports. In case of the major ports, central
government decides the policy and plays
regulatory functions. The minor ports are there
whose policy and functions are regulated by
state governments. The major ports handle
larger share of the total traffic. The 12 major
ports handled about 71 per cent of the country’s
oceanic traffic in 2008-09.
The British used the ports as suction
points of the resources from their hinterlands.
The extension of railways towards the interior
facilitated the linking of the local markets to
regional markets, regional markets to national
markets and national markets to the
international markets. This trend continued till
1947. It was expected that the country’s
independence will reverse the process, but the
partition of the country snatched away two very
important ports i.e. Karachi port went to
Pakistan and Chittagong port to the erstwhile
east-Pakistan and now Bangladesh. To
compensate the losses, many new ports like the
Kandla in the west and the Diamond Harbour
near Kolkata on river Hugli in the east were
developed.
Despite this major setback, Indian ports
continued to grow after the Independence.
Today Indian ports are handling large volumes
of domestic as well as overseas trade. Most of
the ports are equipped with modern
infrastructure. Previously the development and
modernisation was the responsibility of the
government agencies, but considering the
increase in function and need to bring these
ports at par with the international ports, private
entrepreneurs have been invited for the
modernisation of ports in India.
The capacity of Indian ports increased from
20 million tonnes of cargo handling in 1951 to
more than 586 million tonnes in 2008-09.
Fig. 11.3 : Unloading of goods on port
has a long tradition of sea faring and developed
many ports with place name suffixed with
pattan meaning port. An interesting fact about
ports in India is that its west coast has more
seaports than its east coast.
Can you find out the reasons for the
variations in the location of ports along the
two coasts?
Though ports have been in use since
ancient times, the emergence of ports as
gateways of international trade became
important after the coming of the European
2017-18

130 India : People and Economy
Fig. 11.4 : India – Major Ports and Sea Routes
2017-18

International Trade 131
Some of the Indian ports along with their
hinterlands are as follows :
Kandla Port situated at the head of Gulf of
Kuchchh has been developed as a major port to
cater to the needs of western and north western
parts of the country and also to reduce the
pressure at Mumbai port. The port is specially
designed to receive large quantities of petroleum
and petroleum products and fertiliser. The
offshore terminal at Vadinar has been developed
to reduce the pressure at Kandla port.
Demarcation of the boundary of the
hinterland would be difficult as it is not fixed
over space. In most of the cases, hinterland of
one port may overlap with that of the other.
Mumbai is a natural harbour and the
biggest port of the country. The port is situated
closer to the general routes from the countries
of Middle East, Mediterranean countries, North
Africa, North America and Europe where the
major share of country’s overseas trade is
carried out. The port is 20 km long and 6-10
km wide with 54 berths and has the country’s
largest oil terminal. M.P., Maharashtra, Gujarat,
U.P. and parts of Rajasthan constitute the main
hinterlands of Mumbai ports.
Jawaharlal Nehru Port at Nhava Sheva
was developed as a satellite port to relieve the
pressure at the Mumbai port. It is the largest
container port in India.
Marmagao Port, situated at the entrance
of the Zuari estuary, is a natural harbour in
Goa. It gained significance after its remodelling
in 1961 to handle iron-ore exports to Japan.
Construction of Konkan railway has
considerably extended the hinterland of this
port. Karnataka, Goa, Southern Maharashtra
constitute its hinterland.
New Mangalore Port is located in the state
of Karnataka and caters to the needs of the
export of iron-ore and iron-concentrates. It also
handles fertilisers, petroleum products, edible
oils, coffee, tea, wood pulp, yarn, granite stone,
molasses, etc. Karnataka is the major
hinterland for this port.
Kochchi Port, situated at the head of
Vembanad Kayal, popularly known as the
“Queen of the Arabian Sea,” is also a natural
harbour. This port has an advantageous
location being close to the Suez-Colombo route.
It caters to the needs of Kerala, southern-
Karnataka and south western Tamil Nadu.
Kolkata Port is located on the Hugli river,
128 km inland from the Bay of Bengal. Like the
Mumbai port, this port was also developed by
the British. Kolkata had the initial advantage
of being the capital of British India. The port
has lost its significance considerably on account
of the diversion of exports to the other ports
such as Vishakhapatnam, Paradwip and its
satellite port, Haldia.
Kolkata port is also confronted with the
problem of silt accumulation in the Hugli river
which provides a link to the sea. Its hinterland
covers U.P., Bihar, Jharkhand, West Bengal,
Sikkim and the north-eastern states. Apart from
this, it also extends ports facilities to our
neighbouring land-locked countries such as
Nepal and Bhutan.
Haldia Port is located 105 km
downstream from Kolkata. It has been
constructed to reduce the congestion at Kolkata
port. It handles bulk cargo like iron ore, coal,
petroleum, petroleum products and fertilisers,
jute, jute products, cotton and cotton yarn, etc.
Paradwip Port is situated in the Mahanadi
delta, about 100 km from Cuttack. It has the
deepest harbour specially suited to handle very
large vessels. It has been developed mainly to
handle large-scale export of iron-ore. Orissa,
Chhattisgarh and Jharkhand are the parts of
its hinterland.
Visakhapatnam Port in Andhra Pradesh
is a land-locked harbour, connected to the sea
by a channel cut through solid rock and sand.
An outer harbour has been developed for
handling iron-ore, petroleum and general
cargo. Andhra Pradesh and Telangana are themain hinterland for this port.
Chennai Port is one of the oldest ports onthe eastern coast. It is an artificial harbour built
2017-18

132 India : People and Economy
Fig. 11.5 : India – Air Routes
2017-18

International Trade 133
EXERCISESEXERCISESEXERCISESEXERCISESEXERCISES
1. Choose the right answers of the following from the given options.
(i) Trade between two countries is termed as
(a) Internal trade (c) International trade
(b) External trade (d) Local trade
(ii) Which one of the following is a land locked harbour?
(a) Vishakhapatnam (c) Ennor
(b) Mumbai (d) Haldia
(iii) Most of India’s foreign trade is carried through
(a) Land and sea (c) Sea and air
(b) Land and air (d) Sea
(iv) Which one of the following is India’s largest trading partner (2010-11)
(a) U.A.E. (c) Germany
(b) China (d) U.S.A.
in 1859. It is not much suitable for large shipsbecause of the shallow waters near the coast.Tamil Nadu and Pondicherry are its hinterland.
Ennore, a newly developed port in TamilNadu, has been constructed 25 km north ofChennai to relieve the pressure at Chennai port.
Tuticorin Port was also developed torelieve the pressure of Chennai port. It dealswith a variety of cargo including coal, salt, foodgrains, edible oils, sugar, chemicals andpetroleum products.
Airports
Air transport plays an important role in theinternational trade. It has the advantage oftaking the least time for carriage and handlinghigh value or perishable goods over longdistances. It is very costly and unsuitable forcarrying heavy and bulky commodities. Thisultimately reduces the participation of thissector in the international trade as comparedto the oceanic routes.
There were 19 international airportsfunctioning in the country (February 2013).They are Ahmedabad, Amritsar, Bengaluru,Chennai, Delhi, Goa, Guwahati, Hyderabad,Kochchi, Kolkata, Mumbai, Thiruvananthapuram,Srinagar, Jaipur, Calicut, Port Blair, Nagpur,Tiruchirapalli and Coimbatore.
You have already studied about the airtransport in the previous chapter. You consultthe chapter on transport to find out the mainfeatures of air transport in India.
Name the nearest domestic and international airports
from your place. Identify the state with maximum number
of domestic airports.
Identify four cities where maximum number of air routes
converge and also give reasons for this.
2017-18

134 India : People and Economy
2. Answer the following questions in about 30 words.
(i) Mention the characteristics of India’s foreign trade.
(ii) Distinguish between port and harbour.
(iii) Explain the meaning of hinterland.
(iv) Name important items which India imports from different countries.
(v) Name the ports of India located on the east coast.
3. Answer the following questions in about 150 words.
(i) Describe the composition of export and import trade of India.
(ii) Write a note on the changing nature of the international trade of India.
2017-18