international team excellence awards - the global voice...
TRANSCRIPT

International TeamExcellence AwardsInternational TeamExcellence Awards
2005-06 Guidelines and Criteria
Baxter Healthcare – 2B1324 Value Stream Team

Table of Contents
Introduction . . . . . . . . . . . . . . . . . . . . . . . . . . . . p. 3
Entry Requirements . . . . . . . . . . . . . . . . . . . . pp. 4-5
Previous Gold Award Recipients . . . . . . . . . . . . . p. 6
Evaluation Criteria . . . . . . . . . . . . . . . . . . . . . . . p. 7
Criteria Detail . . . . . . . . . . . . . . . . . . . . . . . pp. 8-14
Entry Form. . . . . . . . . . . . . . . . . . . . . . . . . . . . p. 15
Entry Checklist . . . . . . . . . . . . . . . . . . . . . . . . . p. 16
Our Winners. . . . . . . . . . . . . . . . . . . . . . . pp. 17-18
2005 Team Finalists . . . . . . . . . . . . . . . . . pp. 19-22
2
ASQ acknowledges and thanks the following individuals and groups for theirexceptional support of this program:
Alethea Arnold, Siltronic, Oregon
Jim Bianchetta, Bianchetta Resources, Pennsylvania
Barry Bickley, Bank of America, North Carolina
Ray Bunch, Bunch Associates, Inc., Pennsylvania
Ray Emery, Scitor Corporation, Virginia
Robert Finkelmeier, Finkelmeier & Associates, Colorado
Carol Harris, Xcel Energy, Minnesota
John Hopkins, LynnMaris LLC, Virginia
Robert Imbruglio, General Dynamics—Electric Boat Division, Rhode Island
Mike Levenhagan, Oshkosh Truck Corporation, Wisconsin
Susan Miller, Dentsply Caulk, Delaware
Patricia Noonan, Noonan & Associates, Colorado
Roberta Sappington, FAA Center for ManagementDevelopment, Florida
Glenn Walters, G W Enterprises, New Mexico
Mike Whisman, Baxter Healthcare Corporation, Illinois
Present and past committee members, judges, and teams

3
What’s all the hoopla about? Is the International Team ExcellenceAward just a recognition event for team members? Or do participantsand their organizations obtain long-term benefits? Definitely the latter!The International Team Excellence Award competition began in 1985and since then 745 teams from the United States, Canada, China,Costa Rica, India, Japan, and Mexico have competed in this uniqueprocess. Here are just some of the bottom-line achievements of theteams that competed in the 2005 final round competition:
• Cash flow savings of $25 million and cost reductions of $2 million
• Savings of $20 million by developing risk management procedures
• 76% improvement in accuracy of contract deliverables using LeanSix Sigma methodology
• Reject rate reduced from 50% to 0%—network cost decreased by 100%
• 0% VAP rates—savings of more than $1.4 million
• PDCA methodology used to reduce process defects by 47%
This exciting process combines the application of continuous improvement tools, problem-solving processes, team dynamics, project management, and communication skills to generate significant performance improvements within an organization.
The International Team Excellence Award is a process that promotesbusiness effectiveness through team-based management andencourages individuals, teams, and organizations to excel in quality through participation practices.
After watching team presentations at one of the annual conferences,management guru Tom Peters remarked, “There is nothing else like this[type of] competition in the country. This is special.”
Guided by the Team Excellence criteria (p. 7), all the teams participating in the Team Excellence process are evaluated on howwell they used their improvement process, rather than the amount of money saved. This approach helps to level the playing field forthe teams, regardless of their size or industry. It doesn’t matter whattools or problem-solving process a team uses; what matters is howwell their specific team methodology was used.
Team video/DVD entries are first judged in preliminary rounds,from which qualifying teams, and team winners from a qualifyingPartner Award process, will be invited to participate as a finalistteam in the international team competition at ASQ’s WorldConference on Quality and Improvement to be held in Milwaukee,Wisconsin, May 1-3, 2006. There are Partner Award participantsfrom areas that include: California, Oregon, Washington, Utah,Hawaii, Nevada, Arizona, Florida, Kansas, Michigan, and Mexico.
What’s all the hoopla about?
Introduction
Reliance Industries Limited India – Hazira Manufacturing Division – Reliance Polyester Fiber “b”Color Control Team, 2005 Silver Team Winner

4
Entry Requirements
1. Preliminary Round Teams
EligibilityOpen to teams all over the world.
BENEFITS OF PARTICIPATION• Submit up to 5 entries per company
• Opportunity to be a judge
• Free resources
• Judging by consensus
• Detailed scoresheet
• Detailed feedback report
• Opportunity to qualify for final round live competition
• Self-assessment and improvement
• Attend ASQ World Conference at discounted team rate
• Meet and benchmark teams from around the world
• Recognition in publications, ASQ WorldConference, Web site
• Learn and benchmark quality processes and tools
• Team finalist award
• Opportunity to become Gold, Silver,Bronze winners
• Team finalist pin
• Parade into closing session
• Free video of your live presentation
AWARD ENTRY FEE/DUE DATETo be postmarked and paid by December 19, 2005
ASQ members $600 per entry
Nonmembers $700 per entry
Payment can be made by check payable toASQ (U.S. funds) or by credit card.
Shipping address:
TEAM EXCELLENCE PROCESS ADMINISTRATOR
ASQ600 N. Plankinton AvenueMilwaukee, WI 53203Phone: 800-248-1946 x7303
ITEMS TO SHIP – BY DECEMBER 19• Entry form (p. 15)
• Entry fee
• 2 copies of VHS or DVD 30-minutePowerPoint presentation
• 2 copies of binders containing all slidesused in presentation
ITEMS TO E-MAIL – BY DECEMBER 19• Entry form including 50-word description
of project
• Company name (for finalist award)
• Team name (for finalist award)
• 5x7 horizontal color picture (JPEG formatpreferred)
• Color logo (JPEG format preferred)
E-mail to [email protected]
PRELIMINARY ROUND RESULTSANNOUNCED MARCH 3, 2006
FINAL ROUND REGISTRATION FEESOnline registration form will be ready in earlyMarch 2006.
If postmarked and paid by March 27, 2006:
• Fewer than 5 people = $650 each
• 5 or more = $600 each
If postmarked and paid after March 27, 2006:
• Fewer than 5 people = $750 each
• 5 or more = $700 each
LIVE COMPETITION – FINAL ROUND PRESENTATION AIDSProvided by ASQ
• 1 LCD projector
• 2 easels for display of charts
• 1 podium with mobile microphone
• 1 table for display of items
• 1 screen
Team should bring
• 2 copies of CD (or DVD) of updatedpresentation
• 1 copy of binder with all slides used in presentation
Optional
• Banner for parade
• Camcorder to videotape presentation

5
Entry Requirements
ELIGIBILITYOpen to teams that reside in Arizona,California, Oregon, Washington, Utah,Hawaii, Nevada, Florida, Kansas, Michigan,and Mexico. E-mail [email protected] formore details.
BENEFITS OF PARTICIPATION (LIVECOMPETITION) • Opportunity to be a judge
• Free resources
• Judging by consensus
• Detailed scoresheet
• Detailed feedback report
• Opportunity to qualify for final round live competition
• Self-assessment and improvement
• Attend ASQ World Conference at discounted team rate
• Meet and benchmark teams from around the world
• Recognition in publications, ASQ WorldConference, Web site
• Learn and benchmark quality processes and tools
• Team finalist award
• Opportunity to become Gold, Silver,Bronze winners
• Team finalist pin
• Parade into closing session
• Free video of your live presentation
AWARD ENTRY FEE/DUE DATETo be postmarked and paid by February 10, 2006
ASQ members $600 per entry
Nonmembers $700 per entry
Payment can be made by check payable toASQ (U.S. funds) or by credit card.
Shipping address:
TEAM EXCELLENCE PROCESS ADMINISTRATOR
ASQ600 N. Plankinton AvenueMilwaukee, WI 53203Phone: 800-248-1946 x7303
FINAL ROUND REGISTRATION FEESSee column 2 on p. 4.
ITEMS TO SHIP – BY FEBRUARY 10• Entry form (p. 15)
• Entry fee
Optional:
• 2 copies of VHS or DVD 30-minute presentation
• 2 copies of binders containing all slidesused in presentation
ITEMS TO E-MAIL – BY FEBRUARY 10• Entry form including 50-word description
of project
• Company name (for finalist award)
• Team name (for finalist award)
• 5x7 horizontal color picture (JPEG formatpreferred)
• Color logo (JPEG format preferred)
• Copy of scoresheet and feedback from Regional Competition
E-mail to [email protected]
LIVE COMPETITION – FINAL ROUND PRESENTATION AIDSProvided by ASQ
• 1 LCD projector
• 2 easels for display of charts
• 1 podium with mobile microphone
• 1 table for display of items
• 1 screen
Team should bring
• 2 copies of CD or DVD of updatedpresentation
• 1 copy of binder with all slides used in presentation
Optional
• Banner for parade
• Camcorder to videotape presentation
ELIGIBILITYOpen to teams all over the world.
Submit storyboard/poster of yourprocess/project.
BENEFITS OF PARTICIPATION• Attend ASQ World Conference at the
discounted team rate
• Display space in the exhibit hall
• Review and feedback report from judges
STORYBOARD ENTRY FEEDue by February 10, 2006
$200 per display
If you’re interested, contact Geetha Balagopalat [email protected], for details.
REGISTRATION FEES (OPTIONAL)
If you choose to attend all 3 days of the event,see fees listed in column 2 on p. 4.
ITEMS TO E-MAIL – BY FEBRUARY 10• 50-word description of poster/project
display
• Team name
• Company name
E-mail to [email protected]
2. Partner Award Participants
3. Storyboard Opportunity

6
Previous Gold Team Award Recipients
2005 Baxter Healthcare2B1324 Value Stream TeamMarion, NC
2004 Fidelity Wide Processing’s Bulk Shipping Process Management TeamFidelity Investments Hebron, KY
2003 Fidelity Wide Processing’s Incoming CustomerCorrespondence Process ImprovementTeamFidelity Investments Hebron, KY
2002 Merrill Lynch Production TechnologiesMail Efficiency Partnering TeamPiscataway, NJ
2001 SAO Claims Quality and Productivity Improvement TeamBCBS of Florida, Inc.Jacksonville, FL
2000 Hermetic PerfectorsEmerson Electric CompanyHumboldt, TN
1999 SMT Process Improvement TeamSolectron Technology, Inc.Charlotte, NC
1998 DirtbustersHonda of America Mfg. Inc.Marysville, OH
1997 T.G.W.A.N.U.Y Daishowa AmericaPort Angeles, WA
1996 The Dam BuildersUniroyal Chemical CompanyGeismar, LA
1995 Impact 7Texaco Refining & Mktg., Inc.Bellaire, TX
1994 Men of SteelLiebert CorporationColumbus, OH
1993 Performance Plus Harris CorporationMelbourne, FL
1992 The Problem Stoppers Sylvania GTEYork, PA
1991 National winner not selected
1990 Delbert’s DevilsSheller-GlobeKeokuk, IA
1989 The CommunicatorsJohns Hopkins University APLLaurel, MD
1988 The TerminatorsArizona Public ServicePhoenix, AZ
1987 Der Waal BangersPella Rollscreen Co.Pella, IA
1986 Sonic Boom Borg Warner AutomotiveDixon, IL
United Space Alliance – Shuttle Payload Integration and Cargo Evaluation (SPICE) Team, 2005 Bronze Team Winner

7
Evaluation Criteria
Team presentation will be evaluated onhow well the following are explained(37 items = 126 points possible)
PROJECT SELECTION AND PURPOSE (9 ITEMS@ 3 POINTS = 27 POINTS POSSIBLE)
1A. Explain the methods used to choose the project. (Provide specific examples of techniques and data used.)
Describe the types of data and quality tools usedto select the project, and why they were used.
Explain the reasons why the project was selected.
Describe the involvement of potential stakeholders in project selection.
1B. Explain how the project supports/alignswith the organization’s goals/performancemeasures and/or strategies.
Identify the affected organizational goals/performance measures and/or strategies.
Identify the types of impact the project will haveon each goal/performance measure.
Identify the degree of impact the project willhave on each goal/performance measure andhow this was determined.
1C. Identify the potential stakeholders (thoseimpacted by the project) and explain how theymay be impacted by the project.
Identify the affected internal and externalstakeholders and explain how they were identified.
Identify the types of potential impact on stakeholdersand explain how these were determined.
Identify the degree of potential impact on stakeholdersand explain how these were determined.
CURRENT SITUATION ANALYSIS (6 ITEMS @4.5 POINTS = 27 POINTS POSSIBLE)
2A. Explain the approach/process the teamused to identify the potential root cause(s).
Describe the methods and tools used to identifypossible root cause(s).
Describe the team’s analysis of data to identifypossible root causes.
Describe how or if any of the stakeholders wereinvolved in identifying the root cause(s).
2B. Describe how the team analyzed information to identify the final root cause(s).(Include any appropriate validation.)
Describe the methods and tools used to identifythe final root cause(s).
Describe the team’s analysis of data to select thefinal root cause(s).
Identify the root cause(s) and explain how theteam validated the final root cause(s).
SOLUTION DEVELOPMENT (9 ITEMS @ 3 POINTS = 27 POINTS POSSIBLE)
3A. Explain the methods used to identify thepossible solutions.
Describe the methods and tools used to developpossible solution(s).
Describe the team’s analysis of data to developpossible solution(s).
Indicate the criteria the team decided to use in selecting the final solution(s).
3B. Explain how the final solution(s) was/were determined.
Describe the methods and tools used by theteam to select the final solution(s).Describe the team’s analysis of data to select thefinal solution.Describe the involvement of stakeholders in theselection of the final solution(s).
3C. Explain the final solution(s) validation and benefits expected to be realized by implementing the team’s solution(s).
Describe the final solution(s) and explain howthe team validated the final solution(s).
Indicate the types of tangible and intangiblebenefits that are expected to be realized byimplementing the team’s solution(s).
Explain how the team used data to justify theimplementation of the team’s solutions.
PROJECT IMPLEMENTATION AND RESULTS (9 ITEMS @ 3 POINTS = 27 POINTS POSSIBLE)
4A. Explain how buy-in/agreement wasachieved for implementation.
Indicate the types of internal and external (if applicable) stakeholder involvement in implementation.
Describe how various types of resistance wereidentified and addressed.
Explain how stakeholder buy-in was ensured.
4B. Explain the approach used by the team to implement its solution(s) and to ensure the results.
Describe the plan developed by the team toimplement its solution(s).
Describe the procedure, system, or otherchanges that were made to implement the solution and to sustain the results.
Describe the creation and installation of a system for measuring and sustaining results.
4C. Describe the results achieved.
Indicate the types of tangible and intangibleresults that were realized.
Explain how the project’s results link with theorganization’s goals, performance measures,and/or strategies.
Explain how results were shared with stakeholders.
5. TEAM MANAGEMENT AND PROJECTPRESENTATION (4 ITEMS @ 4.5 POINTS = 18 POINTS POSSIBLE)
5A. Explain how the team members wereselected and how they were involved throughout the project.
5B. Explain how the team was prepared towork together in addressing the project.
5C. Explain how the team managed its performance to ensure it was effective as a team.
5D. The team will also be judged on the clarityand organization of its presentation.

8
Criteria Detail
This guide presents each of the criteria items alongwith a brief discussion of each item. It is not all-inclusive and teamsshould ask for clarification onany item not fully discussed.
The team’s presentation is evaluatedby the judges based upon how wellthe team demonstrates that theyhave addressed the criteria. Judgeswill decide if the team “exceededthe criteria,” “met the criteria,”provided evidence that was
“unclear” to the judges, or if thecriteria item was “not covered” atall. Criteria items in sections 1 A,B, and C; 3 A, B, and C; and 4 A,B, and C will receive 3 points for“exceeds,” 2 points for “meets,” 1point for “unclear,” and 0 for “notcovered.” Items in sections 2 A andB and 5 A, B, C, and D will receive4.5 points for “exceeds,” 3 pointsfor “meets,” 1.5 points for“unclear,” and 0 for “not covered.”The table to the right provides additional information that furtherclarifies the four judging optionsfor each criteria item:
1. PROJECT SELECTION AND PURPOSE (9 ITEMS @ 3 POINTS = 27POINTS POSSIBLE)
1A. Explain the methods used to choose the project. (Provide specificexamples of techniques and data used.)
a. Describe the types of data and quality tools used to select the project, and why they were used.
b. Explain the reasons why the project was selected.
c. Describe the involvement of potential stakeholders in project selection.
1. Project Selection/Purpose: The project may be selected by the team orassigned by management, but the process used to select the project mustbe clear and well stated.
1Aa. Demonstrate how data and tools were used to support the selection.Even if the project is assigned to the team, explain the tools and/or datathe organization used and why they used them.
1Ab. Clearly state how and why the project was selected. If it wasassigned to the team, explain why this project is considered important.NOTE:1Aa addresses the tools and data used. The emphasis in this itemis on the decisions made as a result of the tool usage/data analysis in1Aa.
1Ac. Describe the potential stakeholders for the project and how theyparticipated in the selection process. If the stakeholders were not directlyinvolved, then explain how their interests were known and taken intoaccount. Note that this is intended to be a historical presentation and theactual/final stakeholders may be different from the potential stakeholdersat the time the project was being defined. The goal here is to be sure thatthe project was not selected in a vacuum without an understanding of theorganizational environment.
JUDGING OPTION SCORENot Covered 0–Totally missingUnclear 1 (or 1.5)–Touched upon, but not
clear. Not enough information is provided to determine if the team’sapproach met or could meet the criteria requirements.
Meets Criteria 2 (or 3)–Sufficient information is provided to determine that the team’s approach met the criteria requirements.
Exceeds Criteria 3 (or 4.5)–The team’s approach goesbeyond meeting the criteria and provides additional clarity indicatingincreased accuracy in the team’sanalysis, actions, and/or conclusions.Integration with other criteria items isapparent and enhances the team’soverall results. A “Best Practice” or“Role Model” approach.
Criteria Discussion of Criteria

Criteria Discussion of Criteria
1C. Identify the potential stakeholders (those impacted by the project)and explain how they may be impacted by the project.a. Identify the affected internal and external stakeholders and explain
how they were identified.
b. Identify the types of potential impact on stakeholders and explainhow these were determined.
c. Identify the degree of potential impact on stakeholders and explainhow these were determined.
Criteria Detail
1B. Explain how the project supports/aligns with the organization’sgoals/performance measures and/or strategies.a. Identify the affected organizational goals/performance measures
and/or strategies.
b. Identify the types of impact the project will have on each goal/performance measure.
c. Identify the degree of impact the project will have on eachgoal/performance measure and how this was determined.
1B. Organizational goals can vary in type and style, from organizationto organization; some companies have vision/mission statements thatguide the direction of the business. Some have goals that may be morespecific than the vision/mission statements, and still others may have veryspecific objectives related to their goals and/or strategies. Regardless ofhow the organization presents its high-level guidance to its associates,this item is looking for the link between the team’s project and those goalsand/or strategies. The question here is, “Why is this project of impor-tance to the organization?”
1Ba. Goals may be present at various levels in an organization and theteam is being asked to identify the goals/performance measures impactedby their project. If the team’s project is linked to a lower-level goal, it maybe helpful for the team to demonstrate the linkage between the project andthe lower-level goal as well as the linkage between the lower-level goal andthe organizational-level strategy or goal.
1Bb. Identify “WHAT” types of impact the project will have on each goalarea. Examples: increased/decreased costs, efficiencies, safety, associatesatisfaction, etc. “Type” implies a directional impact of some sort.
1Bc. Identify the degree of impact (HOW MUCH) the project will have oneach goal/performance measure. To the extent that the team can quantifythe predicted degree of impact, it should do so, and explain how it didso. If the team cannot quantify the prediction, it should at least provide arationale that explains how it decided on the degree of impact. Example:If the team characterizes the degree of impact as high, medium, or lowimpact, and it cannot quantify the degree, it should provide its rationalefor deciding “high” vs. “medium” or “low.” The ability to accurately pre-dict impact (other than high, medium, or low) will be considered in scoring this factor.
1C. “Stakeholders” defines anyone who may be affected by the project.Stakeholders might include internal/external customers/clients, suppliers,employees, etc. Stakeholders may refer to a unique group (e.g., “themaintenance department”) or one or more individuals.
1Ca. Provide a list of the stakeholders impacted by the team’s project. Theteam should briefly discuss how the stakeholders were identified.
1Cb. Stakeholders may be impacted in many different ways by the project,from quality to timeliness. Demonstrating that the team understands howthe project may have different impacts on the different stakeholdergroups is important. As with 1Bb (type of goal impact), the impact isimplied to be directional. This section could later tie to 4Ab, as correctlypredicting potential negative impacts early in the project can help theteam prepare to overcome resistance later.
1Cc. Not all stakeholders are impacted to the same degree. Explain howmuch each stakeholder may be impacted and how the team determinedthat level of potential impact. As was the case in 1Bc, quantifying thedegree of impact or providing the rationale for a qualitative degree ofimpact is preferred. The ability to accurately predict impact (other thanhigh, medium, or low) will be considered in scoring this item.
9
Criteria Discussion of Criteria
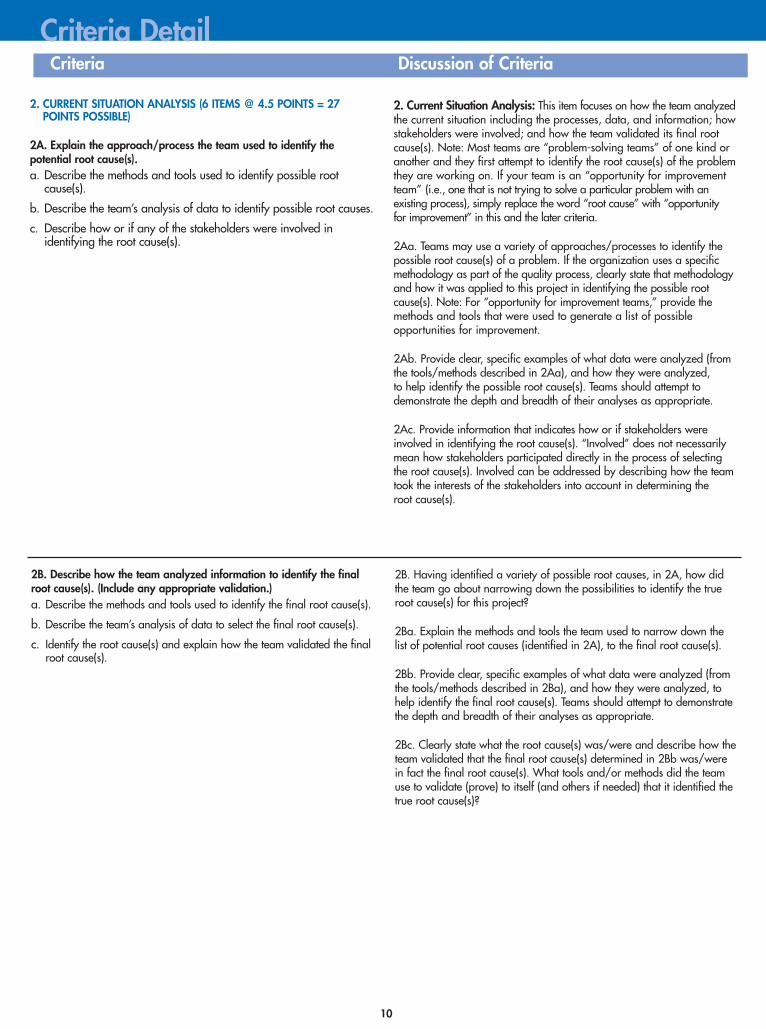
2B. Describe how the team analyzed information to identify the finalroot cause(s). (Include any appropriate validation.)a. Describe the methods and tools used to identify the final root cause(s).
b. Describe the team’s analysis of data to select the final root cause(s).
c. Identify the root cause(s) and explain how the team validated the finalroot cause(s).
Criteria Detail
2. CURRENT SITUATION ANALYSIS (6 ITEMS @ 4.5 POINTS = 27POINTS POSSIBLE)
2A. Explain the approach/process the team used to identify the potential root cause(s).a. Describe the methods and tools used to identify possible root
cause(s).
b. Describe the team’s analysis of data to identify possible root causes.
c. Describe how or if any of the stakeholders were involved in identifying the root cause(s).
2. Current Situation Analysis: This item focuses on how the team analyzedthe current situation including the processes, data, and information; howstakeholders were involved; and how the team validated its final rootcause(s). Note: Most teams are “problem-solving teams” of one kind oranother and they first attempt to identify the root cause(s) of the problemthey are working on. If your team is an “opportunity for improvementteam” (i.e., one that is not trying to solve a particular problem with an existing process), simply replace the word “root cause” with “opportunity for improvement” in this and the later criteria.
2Aa. Teams may use a variety of approaches/processes to identify thepossible root cause(s) of a problem. If the organization uses a specificmethodology as part of the quality process, clearly state that methodologyand how it was applied to this project in identifying the possible rootcause(s). Note: For “opportunity for improvement teams,” provide themethods and tools that were used to generate a list of possible opportunities for improvement.
2Ab. Provide clear, specific examples of what data were analyzed (fromthe tools/methods described in 2Aa), and how they were analyzed, to help identify the possible root cause(s). Teams should attempt todemonstrate the depth and breadth of their analyses as appropriate.
2Ac. Provide information that indicates how or if stakeholders wereinvolved in identifying the root cause(s). “Involved” does not necessarilymean how stakeholders participated directly in the process of selectingthe root cause(s). Involved can be addressed by describing how the teamtook the interests of the stakeholders into account in determining the root cause(s).
2B. Having identified a variety of possible root causes, in 2A, how didthe team go about narrowing down the possibilities to identify the trueroot cause(s) for this project?
2Ba. Explain the methods and tools the team used to narrow down thelist of potential root causes (identified in 2A), to the final root cause(s).
2Bb. Provide clear, specific examples of what data were analyzed (fromthe tools/methods described in 2Ba), and how they were analyzed, tohelp identify the final root cause(s). Teams should attempt to demonstratethe depth and breadth of their analyses as appropriate.
2Bc. Clearly state what the root cause(s) was/were and describe how theteam validated that the final root cause(s) determined in 2Bb was/werein fact the final root cause(s). What tools and/or methods did the teamuse to validate (prove) to itself (and others if needed) that it identified thetrue root cause(s)?
10

Criteria Discussion of Criteria
Criteria Detail
3. SOLUTION DEVELOPMENT (9 ITEMS @ 3 POINTS = 27 POINTS POSSIBLE)
3A. Explain the methods used to identify the possible solutions.a. Describe the methods and tools used to develop possible solution(s).
b. Describe the team’s analysis of data to develop possible solution(s).
c. Indicate the criteria the team decided to use in selecting the finalsolution(s).
3. Solution Development: Once the final root cause(s) is/are identified,the team should demonstrate how it developed its solution(s) to the problem.
3Aa. Explain the tools and methods the team used to identify the possiblesolution(s) for the root cause(s) identified and verified in 2B. There may bea number of ways to address the root cause(s). The team is being askedhere to explain what tools and methods they used to identify these possi-ble solutions. Note: For “opportunity for improvement” teams, replace theword “solutions” with “improvement actions” here and in the remainingitems in this section.
3Ab. Provide clear, specific examples of what data were analyzed (fromthe tools/methods described in 3Aa), and how they were analyzed, tohelp identify the possible root cause(s). Teams should attempt to demonstratethe depth and breadth of their analyses as appropriate.
3Ac. What criteria did the team decide to use to assess the relative effectivenessof the various possible solutions it identified in 3Aa and 3Ab above, sothat it can narrow down the list of possible solutions to enable it to identifythe best solution or solutions?
3B. Explain how the final solution(s) was/were determined.a. Describe the methods, and tools used by the team to select the final
solution(s).
b. Describe the team’s analysis of data to select the final solution.
c. Describe the involvement of stakeholders in the selection of the finalsolution(s).
3B. Explain how the team selected/determined the final solution(s) fromthe list it generated in 3A above.
3Ba. Now that the team has identified the criteria it used in selecting thefinal solution(s), this item asks the team to explain what tools and meth-ods it used along with the criteria identified in 3Ac above to select thefinal solution(s). For example, if the team’s criteria were cost, ease ofimplementation, and impact on product quality, this item is asking theteam to describe the tools and methods it used to weigh the various solu-tions against its criteria and select the final solution(s).
3Bb. Describe what data were analyzed, and how they were analyzed tohelp identify the final solution(s). The team described the methods andtools it used to determine the final solution(s) in 3Ba; 3Bb is now askingthe team to explain what data were analyzed and how they were ana-lyzed, to support the selection of its final solution(s).
3Bc. Describe how stakeholders were involved in determining the finalsolution(s). If the stakeholders were directly involved in the selection of thefinal solution, the team should describe how they were involved in theprocess; if they were not directly involved, the team should explain howthe stakeholders’ interests and concerns were considered.
11

Criteria DetailCriteria Discussion of Criteria
3C. Explain the final solution(s) validation and benefits expected to berealized by implementing the team’s solution(s).a. Describe the final solution(s) and explain how the team validated
the final solution(s).
b. Indicate the types of tangible and intangible benefits that areexpected to be realized by implementing the team’s solution(s).
c. Explain how the team used data to justify the implementation of theteam’s solutions.
3C. Explain how the team validated the final solution and what benefitsthe team expects the organization to realize once the team’s solution(s)is/are implemented.
3Ca. The team should describe the solution(s) it felt would be most appropriateand then how they validated that the solution(s) would solve the problemprior to actually proceeding with the implementation of the solution(s).“Validation,” as used in this item, is not to be confused with “justification”in 3Cc below. “Validation” is simply verifying that the solution(s), ifimplemented, will solve the problem(s)/address the root cause(s)described in 2Bc.
3Cb. Provide a list of benefits that may be realized from the solutions.Tangible benefits include those benefits that lend themselves to being rep-resented by improvements in specific measures or metrics—cycle time,number of defects, production, etc. Intangible benefits include those thatmay not easily be linked to a specific measure or measurement but mightrequire being demonstrated through improvements in a variety of relatedindicators—morale, employee satisfaction, etc. Teams should attempt todescribe what indicators they are looking at when identifying their intan-gible benefits—what did they see that led them to believe there was animprovement in a given intangible benefit?
3Cc. Explain how the team used data to justify the implementation of thesolution(s) it determined to be best in 3B. The team should present thedata and information it used to demonstrate the value to the organizationin implementing its solution(s). For example, the team might conduct andsummarize here a cost/benefit analysis to verify that the benefits to berealized are worthwhile in comparison to the costs involved to implementthe solution(s).
4. PROJECT IMPLEMENTATION AND RESULTS (9 ITEMS @ 3 POINTS =27 POINTS POSSIBLE)
4A. Explain how buy-in/agreement was achieved for implementation.a. Indicate the types of internal and external (if applicable) stakeholder
involvement in implementation.
b. Describe how various types of resistance were identified andaddressed.
c. Explain how stakeholder buy-in was ensured.
4. Project Implementation and Results: This section addresses how theteam sought and secured buy-in, what approaches it used to plan forand implement its solutions, and what results were achieved.
4A. How did the team go about securing buy-in, identifying resistance,and convincing itself (and others) that buy-in did in fact exist?
4Aa. Explain how internal and external (as applicable) stakeholders wereinvolved in implementing the solution(s). There are a number of ways inwhich teams may involve stakeholders and this item is looking for thestakeholder involvement methods used by the team.
4Ab. Describe how the team identified the various types of resistanceencountered (to its project, solution(s), and/or implementation plan), whatsteps were taken to anticipate resistance, and how resistance from any ofthe stakeholder groups was addressed.
4Ac. Explain how the team ensured that it had stakeholder buy-in. Whatproof did the team have that stakeholder buy-in existed prior to imple-mentation? If it was not practical to obtain buy-in from all stakeholders,the team should explain why.
12

Criteria Discussion of Criteria
Criteria Detail
4B. Explain the approach used by the team to implement its solution(s)and to ensure the results.a. Describe the plan developed by the team to implement its solution(s).
b .Describe the procedure, system, or other changes that were made toimplement the solution and to sustain the results.
c. Describe the creation and installation of a system for measuring andsustaining results.
4B. In this section, the team is asked to provide information regardinghow it went about implementing its solution(s) and ensuring that thedesired results would be achieved and sustained.
4Ba. Describe the methods used by the team to implement its solution(s).How did the team plan for the implementation of its solution(s), includingaction plan development, and such items as allocation of resources, timemanagement activities, etc.?
4Bb. Describe the specific procedures, systems, or other changes thatoccurred as a result of the implementation of the team’s solution(s). Whatactions/changes did the team make (or arrange to have made) to ensure that gains realized would be sustained and that new processes,procedures, or systems would not revert to the way they were before theteam’s solution(s) was/were implemented.
4Bc. Identify the system(s) used to measure and manage the team’s resultsover time. What method(s) has the team created or installed to measurethe performance of its solution(s) over time. If the measurements used forthe improved processes are already reviewed as part of a current measurement system, the team should note that this is the case anddescribe the existing measurement system in its response.
4C. Describe the results achieved.a. Indicate the types of tangible and intangible results that were realized.
b .Explain how the project’s results link with the organization’s goals, performance measures, and/or strategies.
c. Explain how results were shared with stakeholders.
4C. What results were achieved by implementing the solutions the teamselected in Section 3?
4Ca. Identify the actual results attributable to the implementation of theteam’s solution(s). Tangible results include those results represented byimprovements in specific measures or metrics—cycle time, number ofdefects, production, etc. Intangible results include those that may not easily be linked to a specific measure or measurement, but might bedemonstrated through improvements in a variety of related indicators—morale, employee satisfaction, etc. Teams should describe the indicatorsthey used to identify their intangible results and what led them to believethere was an improvement in a given intangible result.
4Cb. Demonstrate how the team’s results impacted the organization’sgoals, performance measures, and/or strategies as identified in 1B. Trailback through the criteria to the organization’s goals, measures, andstrategies identified early in the improvement process, and describe howthe team’s results supported the achievement of these organizationalgoals, measures, and/or strategies.
4Cc. Identify the ways in which the team shared its results with the various stakeholder groups. Throughout the improvement process, theteam has described how it identified, communicated, and interacted with internal and external (as applicable) stakeholders to gain their concerns and inputs. Teams should explain how they closed the feedbackloop by sharing the project’s results with the stakeholders.
13

Criteria Discussion of Criteria
Criteria Detail
5. TEAM MANAGEMENT AND PROJECT PRESENTATION (4 ITEMS @ 4.5POINTS = 18 POINTS POSSIBLE)
5A. Explain how the team members were selected and how they wereinvolved throughout the project.
5. Team Management and Project Presentation: This section addresseshow the team operated effectively as a team and how well it presented itsoverall project.
5A. Team Member Selection and Involvement: Describe how and whythe team members were selected. The team’s response should include anexplanation of how/why the various members of the team were selectedincluding: any specific skills, capabilities, knowledge, qualifications,and/or any selection criteria used in selecting the team members. Theteam should also describe how the various team members were involvedthroughout the project including any specific tasks, roles, responsibilities,etc., they may have had during the project.
5B. Explain how the team was prepared to work together in addressingthe project.
5B. Team Member Preparation/Development: Describe how the teammembers were prepared to work together effectively as a team. The team’s response should include an explanation of any training or otherpreparation the team received prior to or during the project to help itoperate more effectively as a team as well as any training it receivedrelated to the process improvement methodology/approach used by the team—including the various tools and techniques used throughout the project to collect, analyze, and/or present data and information.
14
5C. Explain how the team managed its performance to ensure it waseffective as a team.
5C. Team Management: Explain how the team members worked togethereffectively throughout the project. The team’s response should include anexplanation of how the team capitalized on the skills of its individualmembers as they carried out their roles and responsibilities, how teammembers shared data and information throughout the project, how theyensured effective communication within the team, and how the teammanaged its performance with respect to project deadlines/deliverables/milestones. Responses might include a description of how meetings wereconducted, any electronic means the team may have used, or any other methods it used to share data and information. Regardless of theapproach(es) the team used, an explanation of how it ensured effectivecommunication within the team is appropriate.
5D. The team will also be judged on the clarity and organization of its presentation.
5D. Project Presentation: The team will be scored on the organization,clarity, and overall effectiveness of its presentation. Effective use of anyaudio/visual aids and any other presentation aids and/or techniques willalso be considered in this item. It is important to note that the judges willassess how clearly and effectively the team communicated the story of itsproject
PLEASE TYPE OR PRINT
Team Name
Company
Type of Business
Type of Team
Street Address (no P.O. box) Ste./Apt. # City State/Province
Zip+4/Postal Code Country
ASQ Member Number (to determine entry fee discount)
Area Code/Telephone E-mail
Mobile Fax
Area Code/Telephone E-mail
Name, title, address, phone, e-mail of highest ranking official at your site/facility
50-word description of your project including purpose and result
INFORMATION RELEASE AUTHORIZATION
I, (print name) _______________________________________________, hereby authorize release of theentry materials submitted for the International Team Excellence Awards process. This authorization isgranted with the understanding that the grantee will not assert any copyright restrictions and/or depriveASQ of any rights related to the above-mentioned materials. ASQ has the right to display, reproduce,and/or make available the entry materials for viewing at any ASQ event or to interested parties.This authorization is granted to ASQ, 600 North Plankinton Avenue, Milwaukee, WI 53203.
Signature Date
15
Entry Form
ENTRY FORM
Entry materialsand payment due byDecember 19, 2005,see p. 16 for checklist
E-mail copy of entry formand 50-word projectdescription to [email protected] .
Please mail the completed form with payment to:TEAM EXCELLENCEPROCESS ADMINISTRATORASQ600 North Plankinton Ave.Milwaukee, WI 53203.
Credit card payments: pleasecall 800-248-1946 or 414-272-8575.
Please provide Meeting Code TC2006.
INSTRUCTIONS AND IMPORTANT INFORMATIONThe entry fee is $600 for ASQ members and $700 for nonmembers. Payment must be receivedwith completed entry form in order for the entry to be valid. A confirmation will be e-mailed to you.

Preliminary Round Competition
16
Entry Checklist—
PRELIMINARY ROUND TEAMS AND PARTNER AWARD PARTICIPANTS
DID YOU REMEMBER TO:
❏ Complete, sign, and date the entry form.
❏ Mail payment (entry fee) or call ASQ Customer Care with credit card information.
❏ E-mail one 5x7 horizontal color picture (with team members identified —JPEG format,
300 dpi).
❏ E-mail company logo (JPEG format, 300 dpi).
❏ Ship two copies of videotape/DVD (labeled with company and team name).
❏ Ship supporting documentation (copies of slides) in a binder.
❏ E-mail/fax entry form to [email protected], fax 919-847-9852.
DID YOU REVIEW THE VIDEO/DVD FOR THE FOLLOWING?
❏ Is the video/DVD of good quality, easy to see and hear?
❏ Does the presentation address each criteria item?
❏ Does the video/DVD and/or support documentation clearly show each visual?
❏ Verify that the video/DVD presentation does not exceed 30 minutes.
PRELIMINARY ROUND WINNERS AND PARTNER AWARD PARTICIPANTS – FINAL ROUND
❏ Register all team members before March 27, 2006, for discounted fee
($600 or $650 each).
❏ After March 27, 2006, the group discount is $700 each; fewer than 5 registrations
$750 each.
❏ Bring your laptop and two copies of your presentation (with speaker notes) on
CD/DVD.
2005-06 TEAM EXCELLENCEPROCESS IMPORTANT DATES
October 28, 2005Judges’ applications due tocoordinator.
November 18, 2005Judges notified of selection for judging the preliminaryround entries.
December 19, 2005Video/DVD entries and entrymaterials due from teams.
January-February 2006Judging of all team video/DVD entries(preliminary round).
February 10, 2006Entry materials due fromPartner Awards.
March 3, 2006Teams notified of selection forfinal round at ASQ’s WorldConference.
March 27, 2006Registration fees due for finalround competition and WorldConference.
May 1–3, 2006FINAL ROUND LIVE COMPETITION at ASQ World Conference on Quality and Improvement inMilwaukee, WI.
May 3, 2006Gold, Silver, and Bronze teamaward recipients selected.
June 2006Final round scores and feedback e-mailed to teams.

17
Our Winners
AND NOW—A fewwords from our winners
CSMC was honored to have beenselected to participate in the TeamExcellence Competition this year. It was an unforgettable experience!The showcase gave us the opportunity to display our datashowing how we improved patientsafety. The award criteria allowed us to strengthen our internal problem-solving techniques. The criteria encouraged our team to usemany different quality tools toexplore our facts and data, whichhelped us better understand the root causes, and led us toward ourfinal solution.
Coral Springs Medical Center
Participation in the InternationalTeam Excellence Competition validated our methodologies as themeans to solve problems that affectthe bottom line. It was truly an international event that provided arare opportunity to network withteams from around the world andlearn how others approach qualityimprovement. Our team memberswere recognized as world-classpractitioners with their projects being benchmarked by visitors to the conference.
DynMcDermott Petroleum OperationsCompany
We are honored to have participatedin the final round competition! Theaward criteria are very detailed andthis helped guide our teams throughthe problem-solving process by usingseveral different quality tools. Therecognition our teams received fromthe Team Excellence Competition was a great reward for all the hard work and perseverance eachteam demonstrated.
Keihin IPT Manufacturing, Inc.
We were looking for a way to challenge, motivate, and improveour teams through a world-classprocess. By becoming involved withthe ASQ Team Competition, we wereable to accomplish all three goals!By having other companies to benchmark, participating in the competition, and having globalrecognition, we were able to betterunderstand what other improvementswe can achieve with this process andhow much more we have to learnabout potential improvements.
Sanden International (U.S.A.) Inc.
The Team Excellence Competitionwas a great experience. We werehonored to be a finalist in the competition, and especially thrilledwhen we won the Bronze Award! All the finalist teams were absolutelyoutstanding. We enjoyed meetingthe other teams, learning about their projects, and observing theirpresentations. The experience provided us a wonderful opportunityto see quality tools and the Lean Six Sigma methodology applied in a wide variety of industries.
United Space Alliance

Our Winners
18
We initially decided to participate in the Team Excellence Competitionin order to share our team’s results,but we ended up gaining so muchmore from the process. Meeting and learning from such a diversegroup of outstanding teams was aninvaluable experience. It’s apparentthat this competition has been, andwill continue to be, enormously successful in fostering learning,knowledge exchange, and qualityimprovement to achieve enhancedbusiness results.
The Boeing Company, Philadelphia
The ASQ Team Excellence Criteriachallenged us to view our data in new ways, and gave us theopportunity to present our work toothers with the same dedication tocontinuous improvement. We wereproud to represent Xcel Energy inthis international forum, and gaineda new understanding of how diverse industries can share similarmethodologies to address a varietyof issues. Our businesses may be different, but we share the languageof improvement. It was a great andenergizing experience.
Xcel Energy
Reliance’s participation in the ASQInternational Team ExcellenceCompetition was a rewarding experience wherein our team excellence process was scrutinizedby the “connoisseur” neutral panelcomprising international teamingexperts from global industries andleading academics using the TeamExcellence Criteria. Winning theSilver Award, (whiskers away fromgold) made our people ecstaticabout their efforts, getting global
exposure and recognition. Withlearnings from ASQ and having networked with diverse globalgroups at the competition, our people look forward to new paths to provide conscientious service to all stakeholders, thereby achievingReliance’s Life Strategy of aneverending quest for growth. We wish the ASQ International Team Excellence Competition all success!
Reliance Industries Limited India—HaziraManufacturing Division

2005 Team Finalists
19
AMERICAN WATER HEATER COMPANYHEAT EXCHANGER DISCOLORATIONTEAMOur project was to find the root cause of a fieldfailure of our product. AWHC used the Global8D approach to solve this problem. We wereable to drill down to the root cause of thedefect, and then implemented measures toassure the problem would not recur. As a result,we were confident that we were providing thehighest quality product to our customers.
BAXTER HEALTHCARE 2B1324 VALUE STREAM TEAMGOLD WINNERThe team was charged with mapping the 2B1324production process and removing waste throughLEAN techniques. By implementing a pull systemthat utilizes cellular flow concepts, this teamdrastically reduced inventory at all stages ofproduction, removed non-value-added activities,and improved release performance by 77%.
BOEING COMMERCIAL AIRPLANES,WICHITA DIVISION777 FLOORS IMPROVEMENT TEAM PARTNER AWARDS—KANSAS WINNERThe subject matter of the project is the 777Cargo Floor redesign. The team utilizedprocesses to identify the root cause and determine the most effective solution. Theteam’s action was a complete redesign of thecargo floor resulting in part reductions, flowtime reductions, and quality improvements.
CABOT SUPERMETALS K2TAF7 CONTAMINATION TEAMThe team was chartered to eliminate visible contamination from our tantalum salt product.Using a cross-functional team approach andQuality Tools, we decreased our customerrejection rate from 50% to 0%, reduced network cost by nearly 100%, and establishedsix sigma process capability.
CABOT SUPERMETALS POWDER PROCESS CONTROL TEAMThe Powder Process Control team wasempowered to reduce in-process and finalproduct downgrades by 50%, increase Cpk,and improve customer satisfaction. Using six sigma methods to determine areas forimprovement, the team achieved all measurablegoals, resulting in record achievements inquality, safety, cost, and customer satisfaction.
CORAL SPRINGS MEDICAL CENTERVAPNET TEAMPARTNER AWARDS—FLORIDA WINNERCases of ventilator-associated pneumonia(VAP) exceeded the Centers for DiseaseControl’s median rates. Providing oral caredid not meet best practices identified in protocols;there was no standard process. Throughquality assessment tools and pilots we wereable to implement and standardize the overallprocess of mouth care! CSMC achieved 0%VAP rates for the last 12 months, saving $1.4 million districtwide.
DENSO MANUFACTURINGTENNESSEE, INC. TOYOTA 5.0 TEAMTo reduce Next Process Defects the team targeted “alignment defects” due to stickingor dragging knobs. Utilizing the PDCAmethodology, quality tools supported withtheir design of experiments, and the team’sperseverance, they changed the assemblyprocess eliminating these defects.Toyota5.0’s efforts reduced Next Process Defectsby 47%.

2005 Team Finalists
20
DYNMCDERMOTT PETROLEUMOPERATIONS COMPANY LESSONS LEARNED PROGRAM TEAMThe team was tasked by management todevelop a Lessons Learned program that wasfunctionally specific and accessible to all personnel, including contractor personnel. The team had to define a Lesson Learned for the purposes of the program; develop aproper format for writing a Lesson Learned;determine how to effectively disseminateLessons Learned; develop a process to followwhen safety was at risk and when a directiveis issued with the lesson.
DYNMCDERMOTT PETROLEUMOPERATIONS COMPANY QUALITY CONTROL SIX SIGMA TEAMThe team was tasked to evaluate the QualityControl Program value. They focused on theprocess of preparing, conducting, documenting,and reporting on quality control in-processinspections, in accordance with the programplan. The team benchmarked other establishedQC programs. The goal was to reduce theinspection time and revise the process to insurethat inspections performed are value-added.
GALVAK S.A. DE C.V. NO PRIMERASPARTNER AWARDS—MEXICO WINNERThe No Primeras team was challenged todevelop strategies to reduce the degradationsof quality metrics for damaged products.Utilizing the DMAIC problem-solvingapproach, improvement was seen in theareas of customer satisfaction, defect level,and productivity, resulting in total annual savings of $100,000.
GENERAL DYNAMICS—ELECTRIC BOATQUONSET POINT FACILITY
VERTICAL WORK PLATFORM TEAM The purpose of this project was to reducethe time required to prepare submarine hullsections for vertical outfitting. The methodsand procedures developed have shortenedthe time required to ready a unit for productivework, and reduced budgeted manhours andcompressed span times throughout the verticaloutfitting process.
GREENVILLE TECHNOLOGY,INCORPORATED (GTI) PROBLEM SOLVERS, INCORPORATED(PSI)PARTNER AWARDS—HONDA SUPPLIER CONFERENCE WINNERPSI’s project theme was to reduce reportingand recording of the Honda Trouble Reportprocess that the Quality Department used.During the course of the project we were ableto reduce the amount of duplication andprocess time, saving both time and money aswell as improving employee morale.
HONDA OF AMERICA MFG., INC.HEADLINERS IIThe team worked on the prevention of the V6cylinder head part movement on the pallets toeliminate out-of-standard quality data. Byinstalling additional clamping, consistent in-standard quality data were maintained.The team’s efforts positively impacted safety, deliv-ery, and morale, and we also reduced cost.

2005 Team Finalists
21
KEIHIN IPT MANUFACTURING, INC.ELIMINATORSThe team’s goal was to reduce scrap. Theteam found that the Bobbin Comp line wasproducing a 10% reject rate due to 7139 badwindings per month. Root-cause analysisdetermined that contamination and damageto the wires were the problem. The team’ssolution reduced the reject rate to 2.36%.
KEIHIN IPT MANUFACTURING, INC.HIDDEN RESOURCESThe team’s goal was to reduce cost of uniforms by 25%. Data collection showed that we were being overcharged $14,887 permonth. The team’s work resulted in selectionof new vendor, reduction of associate issuesby 93%, cost savings of $19,074 per month,and annual savings of $228,888.
MAGNEKON S.A. DE C.V.MAGNEKON, TASK FORCE TEAMPARTNER AWARDS—MEXICO WINNERA multifunctional team was formed toenhance the capability of the self-bondingmagnet wire to withstand the pin hole test.The improvement was developed using sixsigma methodology. The benefits of this project were dramatic reduction in customer
rejects, scrap reduction, longer shelf life forthe wire, bigger share of market, and savingsof $50,000.
RAYTHEON AIRCRAFT COMPANYHAWKER VISION 2003PARTNER AWARDS—KANSAS WINNERRaytheon Aircraft’s Hawker Vision 2003 project set out to significantly decrease cycletime on the 800XP aircraft assembly line. Thecross-functional team cut cycle time by 42%,resulting in a cash flow savings of nearly $25 million and cost reductions of nearly $2 million per year.
RELIANCE INDUSTRIES LIMITEDINDIA—HAZIRA MANUFACTURINGDIVISIONRELIANCE POLYESTER FIBER “B”COLOR CONTROL TEAMSILVER WINNERThe project is aimed at controlling an industryproblem of high b-color in polyester fiber.Variation in b-color leads to uneven dyeability,market complaints, and huge monetary loss. Across-functional and multi-stakeholders teamhas resolved this chronic problem using sixsigma methodology.
SANDEN INTERNATIONAL (U.S.A.), INC. I, ROTORI, Rotor attacked an assembly process thathad low process capability and an unstablereject rate, creating line downtime with out-of-control conditions. Using sophisticated SQCtools such as cause-and-effect analysis anddesign of experiments, the team was able tosuccessfully change the process specificationsand eliminate the problem.
THE BOEING COMPANY ADVANCED WIRELESS OPEN DATASYSTEM (AWODS) PARTNER AWARDS—CALIFORNIAWINNERThe AWODS is able to record digital data onan aircraft data bus for up to 20 hours. Thesedata are converted so engineers can isolatefaults. The savings on the C-17 programcomes from a 20% reduction in re-flying theaircraft, 60% reduction in the defects documentedby the flight crews, and 20% reduction in themanhours from troubleshooting.

2005 Team Finalists
22
THE BOEING COMPANY C17 ERGONOMICS IMPROVEMENTS FOR HOLE PREPARATION TEAMPARTNER AWARDS—CALIFORNIAWINNERThis team responded to their customers’needs by developing and implementinginnovative tooling and process improvementsfor assembling the C-17 Globemaster III.Their improvements reduced the number ofsteps required to drill holes from 5 to 1step/hole, and reduced the risk of repetitiveinjuries to workers by more than 70%.
THE BOEING COMPANY C17 WING LIFT PROJECT TEAMPARTNER AWARDS—CALIFORNIAWINNERThe Wing Lift Project Team pooled their visionand ideas to create a cost-effective wing liftingprocess that exceeded all safety objectives. Usingbenchmarking and the collaborative inputs ofdesigners, stress engineers, and productionmechanics, the team developed an innovativeprocess saving more than 250 hours per aircraft.
THE BOEING COMPANY SUPPLYCHAIN ACCOUNTABILITY TEAM—BOEING ROTORCRAFT, PHILADELPHIAThe Supply Chain Accountability Team wastasked with improving the overall health of
Philadelphia’s supply base by analyzing theinternal and external processes that impactquality and delivery to our customers. Directresults of the project included an 18% reductionin the supply base, a 42% improvement insupplier delivery, and a 25% improvement insupplier quality.
U.S. NAVAL SHIP REPAIRFACILITY/JAPAN REGIONALMAINTENANCE CENTER, YOKOSUKAFINE BUSINESS This team recognized the importance of safetyin the command mission, and worked onincreasing safety awareness for a safe andpleasant workplace. Developing a uniqueapproach that effectively communicated theirgoal, they successfully demonstrated commitmentand responsibility as leaders. Their effortsresulted in a dramatic decrease in themishaps and lost workdays, achieving theSECNAV Mishap Reduction Goal.
UNITED SPACE ALLIANCE SHUTTLE PAYLOAD INTEGRATION ANDCARGO EVALUATION (SPICE)BRONZE WINNERThe Shuttle Payload Integration and CargoEvaluation (SPICE) early mission feasibilityanalysis estimates the weight and mass propertiesof each upcoming Space Shuttle mission. UnitedSpace Alliance’s SPICE Improvement Team followed a structured Lean Six Sigmaapproach to achieve a 76% improvement inthe accuracy of this contractual deliverable.
VITRO QUIMICAM DREAM REACHERSPARTNER AWARDS—MEXICO WINNERThe team’s project was to improve businessprofits for stockholders and process capability,exceeding the required specification for thePVB film. DMAIC methodology was applied(part of Vitro’s business model), obtaining asigma improvement from 3.36 to 5.82, saving $92,000/year, and enhancing perceived quality by customers.
XCEL ENERGY NATURAL GAS SERVICES—RISK MANAGEMENTFollowing the default of our largest customer,the team developed procedures to manage riskassociated with our natural gas transportationservices. The project illustrates the effectivenessof continuous process improvement, as wecontinue monitoring, evaluating, and developingrisk management procedures, with revenuerecovery and risk reduction nearing $20 million to date.

23233
It’s about
RECOGNITION.
It’s about
COMPETITION.
It’s about
TEAMWORK.
May 1-3, 2006Milwaukee, WI
Conference Web sitehttp://wcqi.asq.org
Showcase Your TEAM at the 2006 ASQ World Conference on Quality and Improvement
Transforming the Face of Quality