international sugar organization an evaluation … sugar organization. an evaluation of the global...
TRANSCRIPT
International Sugar Organization
José Orive, Executive DirectorInternational Sugar Organization
An Evaluation of the Global Sugar Market Environment
34th International Sweetener SymposiumSan Diego, California – 4-9 August 2017

The Global Sugar Market
International Sugar Organization

The Global Sugar Market
International Sugar Organization
Bears remain firmly in the driving seat

10.00
12.00
14.00
16.00
18.00
20.00
22.00
24.00
Jun-12 Dec-12 Jun-13 Nov-13 May-14 Oct-14 Apr-15 Oct-15 Mar-16 Sep-16 Feb-17
ISA daily price (USD cents/lb)
World Sugar Price Outlook?
International Sugar Organization
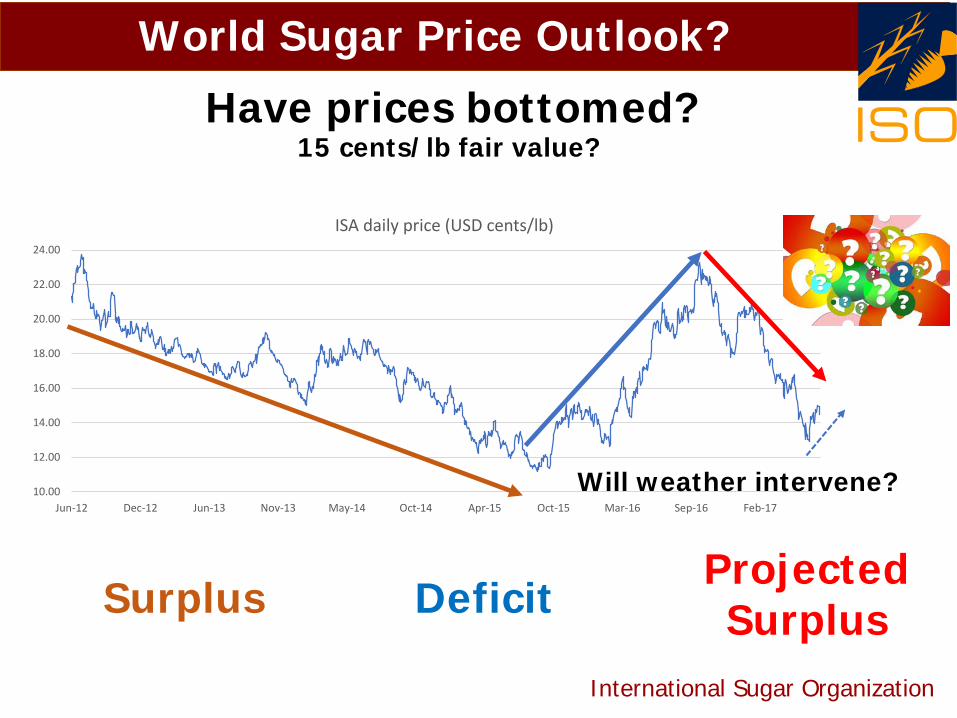
Have prices bottomed?
Surplus DeficitProjected Surplus
Prices by 28 June had slumped by almost half since October 2016 high ... Followed by a modest recovery in July
Will weather intervene?

Role of Speculative Funds?
International Sugar Organization
• Net speculative position moved the price from 12-12.5 cents/lb in February 2016 to 24.1 cents/lb by end September.
• Net long rose from around 21,000 lots to almost 350,000 lots by September 2016.
• Followed by a SELL-OFF. • At the end of 2016 speculators sold their long positions and by end of
year their net long position represented 14% of open interest, compared to a massive 33% in September.
• Sell off continued in 2017.• In May hedge funds actually became net-short.
12.5
15.5
18.5
21.5
24.5
-200
-100
0
100
200
300
US
cen
ts/lb
1,00
0 lo
ts, 1
lot =
50
long
tons
Non-Commercial Investors' Net Position and Sugar First Futures in ICE, New York
net position first futures
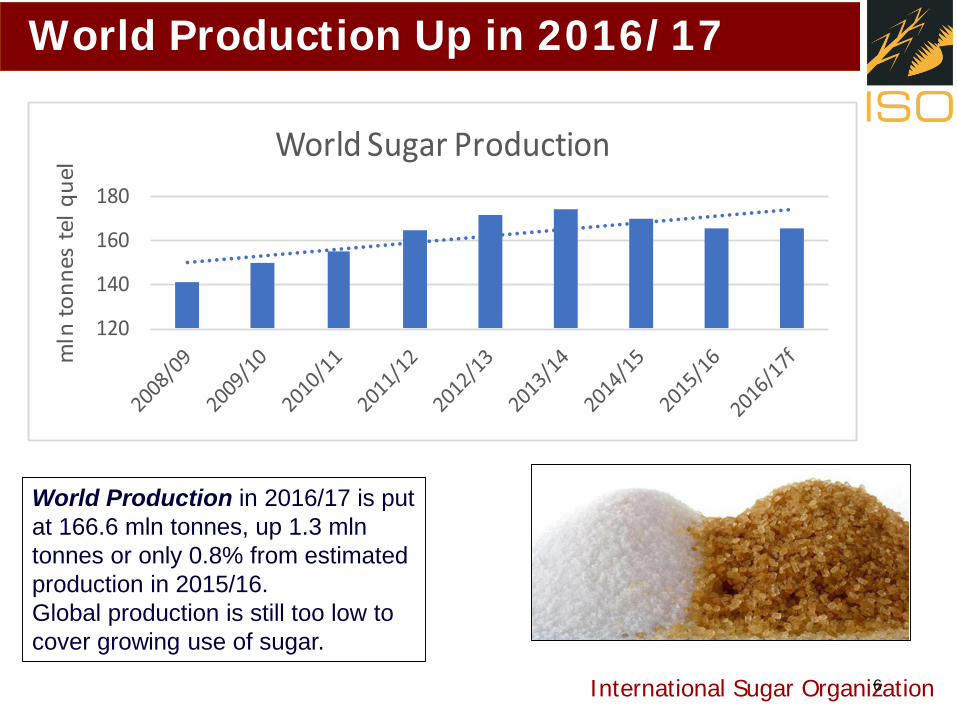
World Production Up in 2016/17
World Production in 2016/17 is put at 166.6 mln tonnes, up 1.3 mlntonnes or only 0.8% from estimated production in 2015/16. Global production is still too low to cover growing use of sugar.
International Sugar Organization
120
140
160
180
mln
tonn
es te
l que
l World Sugar Production
6

165.3
▲ 0.9▲ 0.6
▲ 1.3
166.6
▼ 4.8mm
tonn
es te
l que
l
2015/16(oct-sept)
2016/17(oct-sept)
4 countries/regions contributean increase of 4.5 mln tonnes
India aloneconributes a
decrease of 4.8 mlntonnes
Worldproduction
rise of 1.3 mlntonnes
2016/17 vs 2015/16
International Sugar Organization
EU
▲ 1.65
RussiaChina
Pakistan
India
The World Sugar Balance 2016/17

-2 -1 0 1 2 3 4
Middle East and North AfricaEquatorial and Southern Africa
Far East and OceaniaCentral America and Caribbean
North AmericaEastern Europe and CIS
Western and Central EuropeSouth America
Indian Subcontinent
2016/17 Growth Rate in %
International Sugar Organization
World Consumption Growth Slows
Poor World Consumption Growth
In 2016/17 world sugar consumption is projected to grow by 1.2% to 172.5mln tonnes.
The anticipated growth rate is lower than the world 10-year average of 1.94%.
Annual growth rate in % 2016/17 10-year average
Western and Central Europe 0.85 0.64
Eastern Europe and CIS 1.41 -0.86
North America 1.70 0.74
Central America and Caribbean 2.09 1.49
South America 0.10 0.28
Middle East and North Africa 3.64 2.22
Far East and Oceania 2.78 3.14
Indian Subcontinent -1.69 4.24
Sub Sahara Africa 2.84 3.80
WORLD 1.22 1.94
120
130
140
150
160
170
180
2011/12 2012/13 2013/14 2014/15 2015/16 2016/17f
World Sugar Consumption

The World Sugar Balance 2016/17
5 consecutive years of surplus 2 years of deficit
After 5 years of surplus, the global sugar market moves into deficit in 2015/16 and 2016/17.
International Sugar Organization
-15
-10
-5
0
5
10
15
120
130
140
150
160
170
180
Surp
lus/
Defic
it
Prod
uctio
n/Co
nsum
ptio
n
Surplus/Deficit Production Consumption
2015/16 : -5.2 mln tonnes 2016/17 : -5.9 mln tonnes
World Sugar Market Deficit
International Sugar Organization
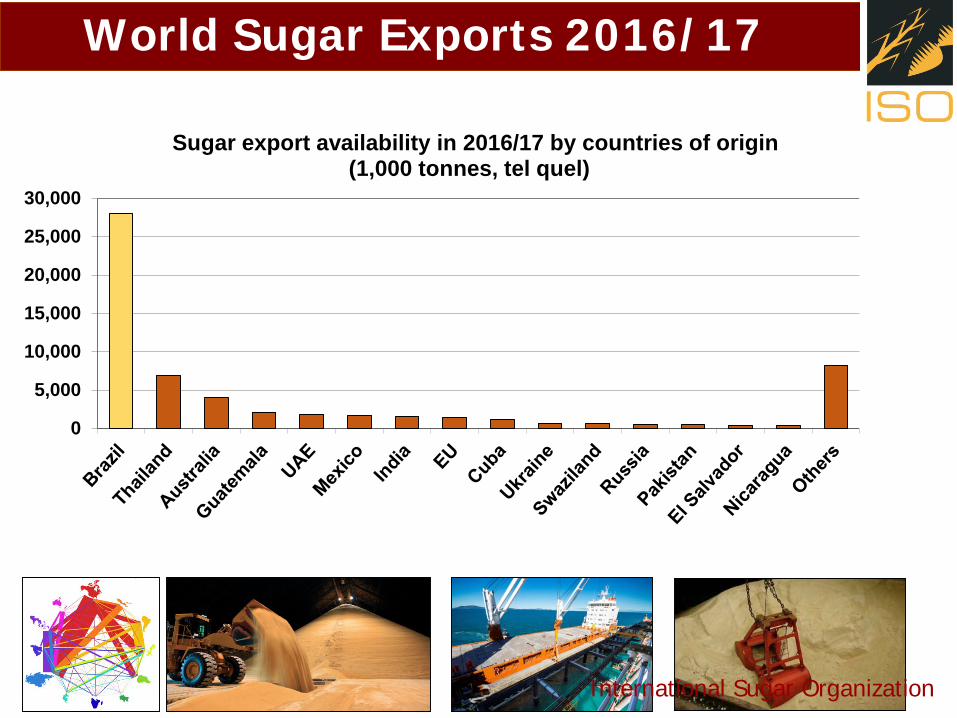
World Sugar Exports 2016/17
0
5,000
10,000
15,000
20,000
25,000
30,000
Sugar export availability in 2016/17 by countries of origin (1,000 tonnes, tel quel)

International Sugar Organization
PakistanUkraine
World Sugar Exports
Russia Cuba
Mln
tonn
es te
lque
l
▼ 1.3
▲ 0.5
▼ 0.6
Brazil
Thailand
▲ 0.4▲ 0.2 ▲ 0.15
2016/17 vs 2015/16
International Sugar Organization
United States
China
India
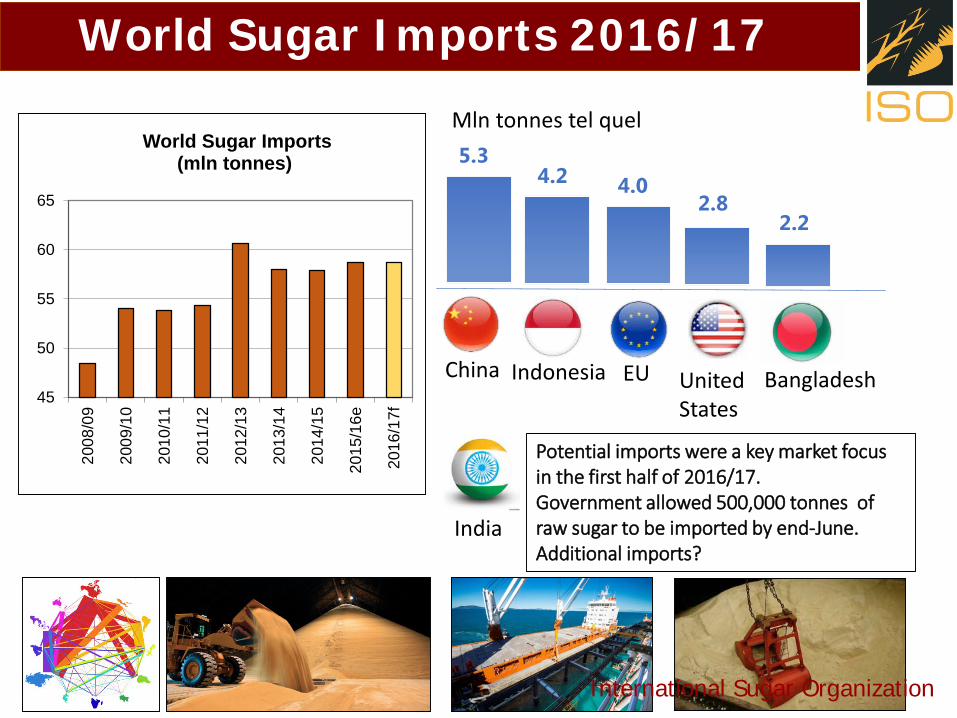
World Sugar Imports 2016/17
45
50
55
60
65
2008
/09
2009
/10
2010
/11
2011
/12
2012
/13
2013
/14
2014
/15
2015
/16e
2016
/17f
World Sugar Imports (mln tonnes)
Indonesia EU
5.3
Bangladesh
4.2 4.02.8
2.2
Mln tonnes tel quel
Potential imports were a key market focus in the first half of 2016/17.Government allowed 500,000 tonnes of raw sugar to be imported by end-June.Additional imports?

The World Sugar Balance 2017/18
5 consecutive years of surplus 2 years of deficit
International Sugar Organization
-15
-10
-5
0
5
10
15
120
130
140
150
160
170
180
Surp
lus/
Defic
it
Prod
uctio
n/Co
nsum
ptio
n
Surplus/Deficit Production Consumption
All eyes are on production prospects for 2017/18
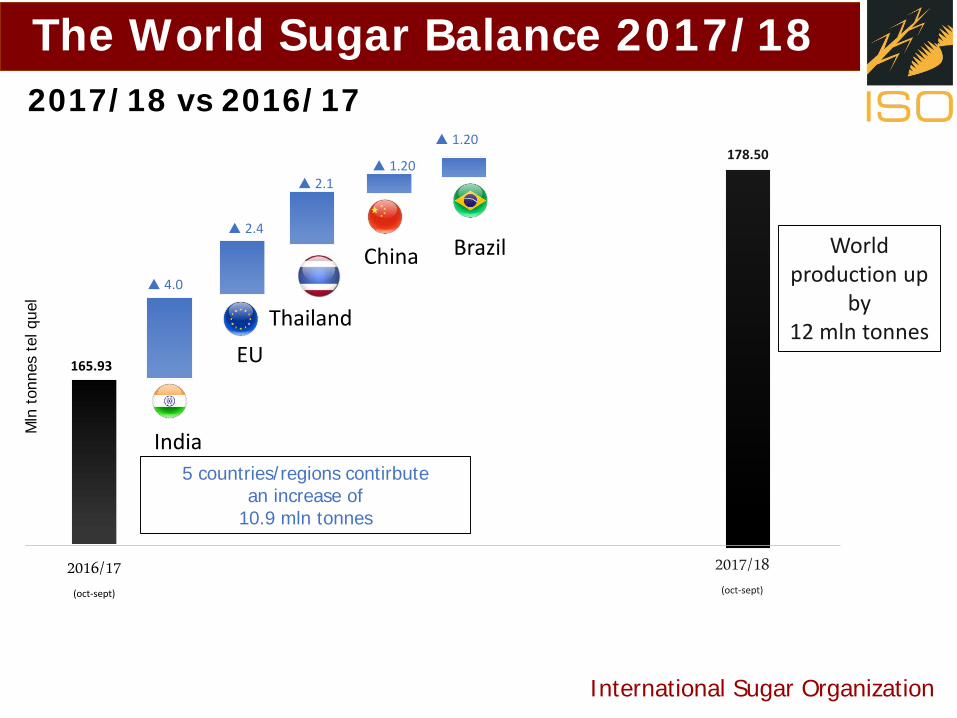
165.93
▲ 4.0
▲ 2.4
▲ 1.20
▲ 1.20178.50
Mln
ton
nes
tel q
uel
2016/17(oct-sept)
2017/18(oct-sept)
5 countries/regions contirbutean increase of
10.9 mln tonnes
Worldproduction up
by12 mln tonnes
International Sugar Organization
The World Sugar Balance 2017/182017/18 vs 2016/17
▲ 2.1
EU
India
Thailand
China Brazil

The World Sugar Balance 2017/18
5 consecutive years of surplus 2 years of deficit
The world market to move back into Surplus in 2017/18...…with global production possibly reaching a new all-time high of 178.5 mln tones tel quel….…whereas consumption growth will likely still lag.
International Sugar Organization
Another surplus cycle commences
-15
-10
-5
0
5
10
15
120
130
140
150
160
170
180
190
Surp
lus/
Defic
it
Prod
uctio
n/Co
nsum
ptio
n
Surplus/Deficit Production Consumption
World Sugar Market Surplus

Stock Levels are Low after 2 years of Deficit
Consecutive years of surplus led to a 30% increase in
ending stocks
2 Years of Deficit
International Sugar Organization
2 years of global production deficit with a combined stocks draw-down of 14.4 mlntonnes.
A massive statistical deficit reduces further the stocks-to-consumption ratio in 2016/17 by a significant 4.57 percentage points, to 47.56%. This is the lowest level since 2010/11.
Tight Global Stocks 5
10
15
20
25
30
40
45
50
55
60
ISA
Pric
e (US
cen
ts/lb
)
stoc
ks-to
-con
sum
ptio
n rat
io in
%Stocks-to-Consumption Ratio and ISA Prices
Stocks-to-use Ratio ISA Price

Renewed Market Weakness
International Sugar Organization
• Likely return to a moderate surplus in 2017/18.• Driven by boosted area under beet in the EU; huge production recoveries in
India and Thailand.• No huge weather shock • Brazil’s Centre-South off to a solid start.• India’s announced import allowance below market expectations. • China’s raw sugar imports (official and unofficial) to be curtailed.• Funds sold heavily and by May had switched from substantial net long position to
a small net short position.
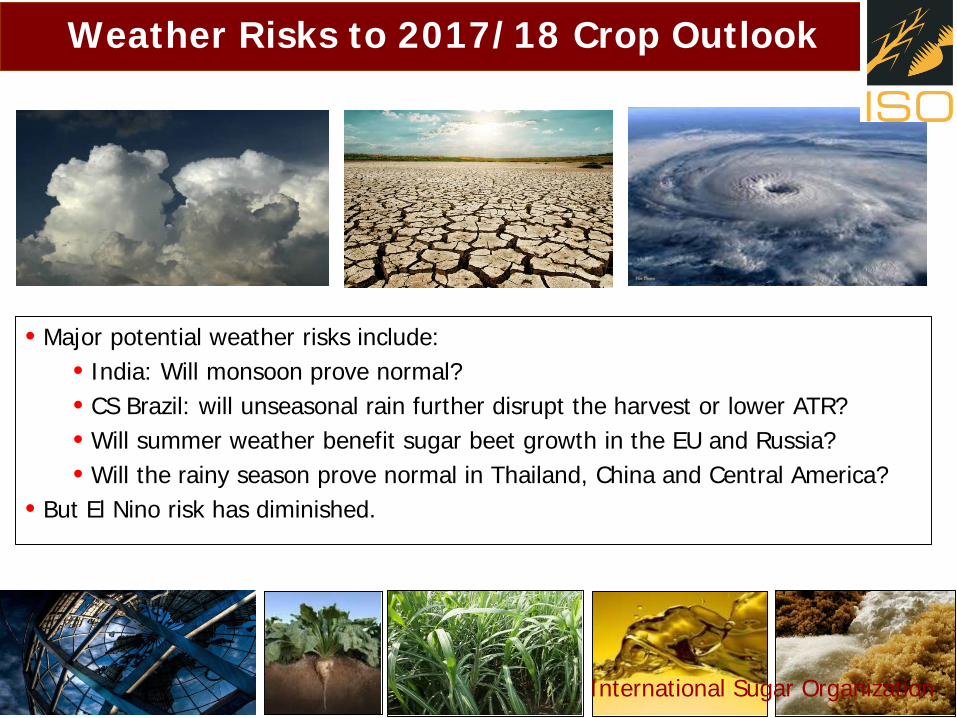
Weather Risks to 2017/18 Crop Outlook
International Sugar Organization
• Major potential weather risks include:• India: Will monsoon prove normal?• CS Brazil: will unseasonal rain further disrupt the harvest or lower ATR?• Will summer weather benefit sugar beet growth in the EU and Russia?• Will the rainy season prove normal in Thailand, China and Central America?
• But El Nino risk has diminished.
Brazil heavily impacts global surplus
International Sugar Organization
• Whilst weather events can still potentially impact the size of the global surplus in 2017/18, just as importantly, continuing low sugar prices could trigger a switch to ethanol in CS Brazil.
• Alternatively, any recovery in world sugar prices would trigger a rebound in the mix in C/S Brazil back towards sugar.
Brazil’s sugar/ethanol mix.

Brazil Outlook – Fundamental to the Fundamentals
Centre/SouthSugar Output Rises Despite Challenges to Cane Output
International Sugar Organization
Sugar/Ethanol Mix in Centre South has big impact on world sugar balance. Had prices by end-June fallen to the zone where ethanol begins to be more lucrative than sugar?Sugar Mix is subject to future market conditions: potential risk factor for lower sugar production.
Investment in New Crystallization Capacity Offsets lower cane supply2012/13 2013/14 2014/15 2015/16 2016/17 2017/18
Cane Crush Mln tonnes
533 597 571 618 607 596
ATR Kg/tonne 135.6 133.3 136.6 130.5 133.0 133.4Sugar Ratio % 49.5 45.2 43.1 40.7 46.3 48.0Sugar Production
Mln tonnes
34.1 34.4 32.0 31.2 35.6 36.3
Ethanol Production
Bln litres 21.4 25.6 26.1 28.2 25.7 24.2

China: How to Plug the 16/17 Deficit?
Sugar Balance
A deficit of around 6.8 mln tonnes in 2016/17 will be plugged by stocks releases (1.6 mln tonnes) and around 5.3 mln tonnes of imported sugar.But the antidumping duty on out-of-quota raw sugar imports from 45% to 90% could cut back imports, especially from Thailand and Brazil.Imports from non-traditional origins could be boosted – e.g. those that could be displaced from the EU market.
International Sugar Organization
-8
-7
-6
-5
-4
-3
-2
-1
0
89
1011121314151617
2012/13 2013/14 2014/15 2015/16 2016/17 2017/18
Bala
nce M
ln to
nnes
Prod
uctio
n/Co
nsum
ptio
n M
ln to
nnes
China: Supply Demand Balance
Balance Production Consumption0
2
4
6
8
10
12
14
2012/13 2013/14 2014/15 2015/16 2016/17 2017/18
mln
tonn
es te
l que
l
China Sugar Production

How Much Will India Import?
• 2016/17 crop slumps to 20.3 mln tonnes.• Consumption forecast at 25.15 mln tonnes.• Significant domestic deficit of around 5 mln
tonnes.• Government grants imports of 500,000
tonnes• More imports?• ISMA argues imports of 0.5 mln tonnes (on
top of raw sugar imports by port refineries for re-export after refining) are adequate to meet domestic demand in the interim period, before sugar from the new crop comes onto the market.
• India may still need to import in 2017/18 even if production can recover to 25 mlntonnes.
• Rebound in plantings in Maharashtra and Karnataka following good 2016 monsoon and higher sugar prices.
International Sugar Organization
10
13
16
19
22
25
28
31
2009
/10
2010
/11
2011
/12
2012
/13
2013
/14
2014
/15
2015
/16
2016
/17
2017
/18f
mln
tonn
es, t
el q
uel
Sugar Production in India

How about Thailand?
International Sugar Organization
• The Thai 2015/16 crop suffered from onset of a bad drought, cutting the cane crush to as low as 94 mln tonnes and sugar output to 9.7 mln tonnes.
• In 2016/17 the cane crush was cut further to 93 mln tonnes, but a higher sugar content boosted sugar output to 9.9 mln tonnes.
• For 2017/18, prospects point to a strong recovery in output with a return to more normal weather – possibly to as high as 11.9 mln tonnes.
• Changes to sugar policy in response to Brazil’s WTO challenge will likely not impact Thailand’s outlook but millers will face increased risks and uncertainties.
4
5
6
7
8
9
10
0
2
4
6
8
10
12
14
2012/13 2013/14 2014/15 2015/16 2016/17 2017/18p
Bala
nce m
ln to
nnes
Prod
uctio
n/Co
nsum
ptio
n m
ln to
nnes
Thailand: Supply/Demand Balance
Balance Production Consumption5
5.5
6
6.5
7
7.5
8
8.5
2012/13 2013/14 2014/15 2015/16 2016/17 2017/18p
Mln
tonn
es
Thailand: Exports

EU Sugar : A production (and export) jump in 2017/18
• Sugar production is expected to jump to around 18.3 mln tonnes (up 15.3% or 2.4 mln tonnes) in 2017/18, assuming normal weather conditions in the coming six months.
• Strong increase in planted area in readiness for liberalised EU market.• Significant implications for EU sugar trade balance.
International Sugar Organization
1,000
1,200
1,400
1,600
1,800
12,000
14,000
16,000
18,000
20,000
1,00
0 ha
1,00
0 to
nnes
, tel
que
l
EU - Sugar Production and Beet Areas
Sugar Production Beet Areas
`
-5000
-4000
-3000
-2000
-1000
0
1000
2000
2012/13 2013/14 2014/15 2015/16 2016/17
EU Sugar Trade
exports imports
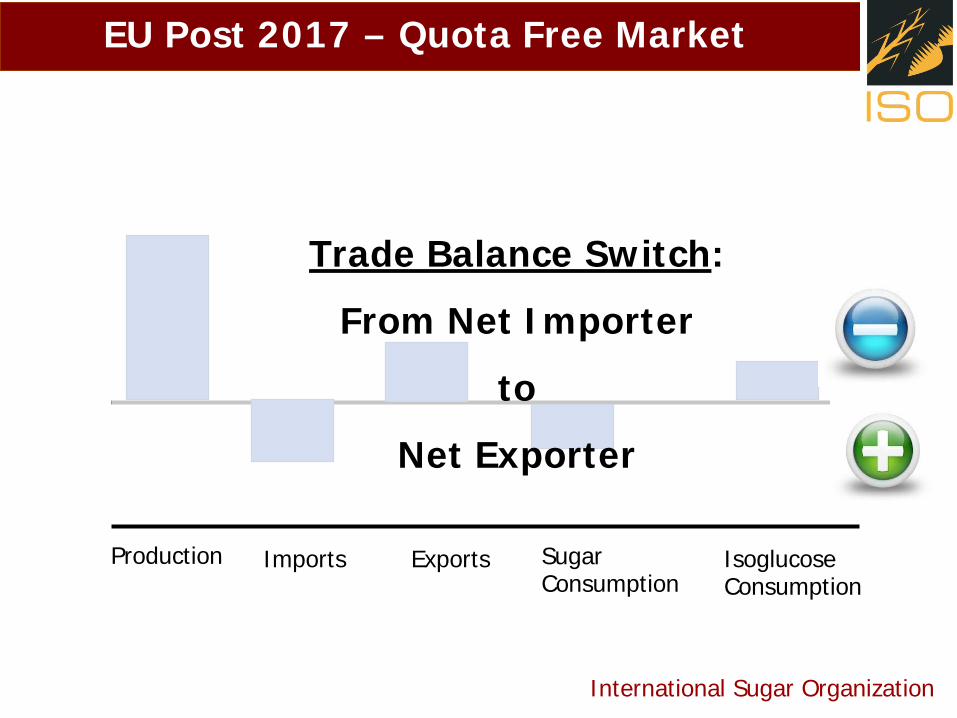
EU Post 2017 – Quota Free Market
Production Imports Exports Sugar Consumption
IsoglucoseConsumption
International Sugar Organization
Trade Balance Switch:
From Net Importer
to
Net Exporter
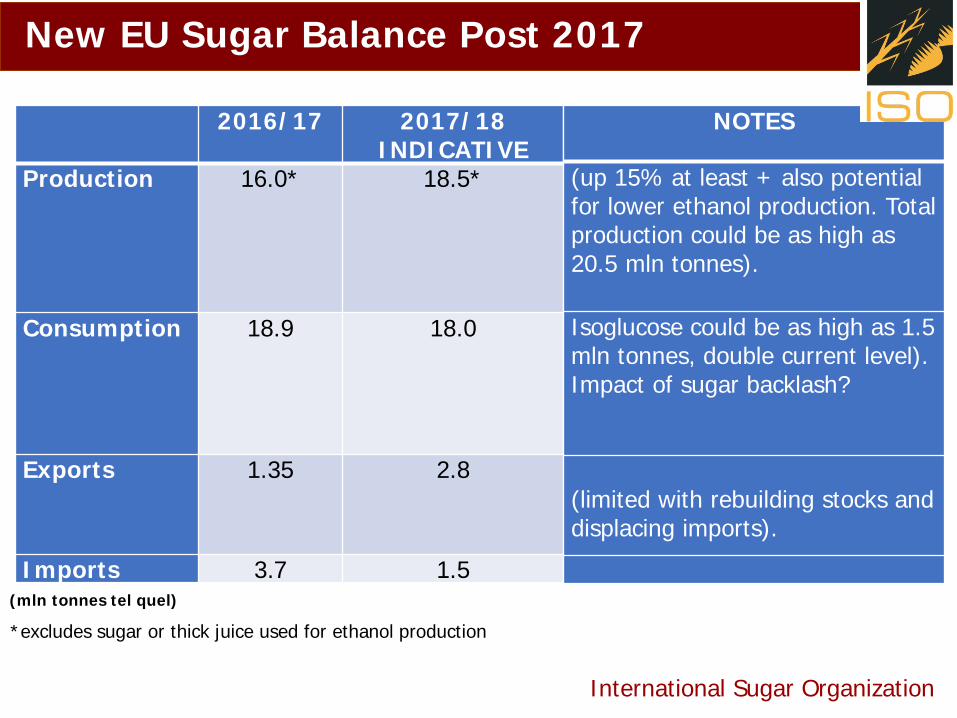
2016/17 2017/18 INDICATIVE
Production 16.0* 18.5*
Consumption 18.9 18.0
Exports 1.35 2.8
Imports 3.7 1.5
*excludes sugar or thick juice used for ethanol production
New EU Sugar Balance Post 2017
NOTES
(up 15% at least + also potential for lower ethanol production. Total production could be as high as 20.5 mln tonnes).
Isoglucose could be as high as 1.5 mln tonnes, double current level).Impact of sugar backlash?
(limited with rebuilding stocks and displacing imports).
(mln tonnes tel quel)
International Sugar Organization

EU Longer Term Issues
International Sugar Organization
• Production: EU more responsive to world market price signals.
• Flexibility between sugar and ethanol: @1 mln tonnes.• Domestic offtake is flat and isoglucose will capture
market share: boosts export availability.• Export volumes will fluctuate year to year depending
on production volatility.
10.00
12.00
14.00
16.00
18.00
20.00
22.00
24.00
Jun-12 Dec-12 Jun-13 Nov-13 May-14 Oct-14 Apr-15 Oct-15 Mar-16 Sep-16 Feb-17
ISA daily price (USD cents/lb)
World Sugar Price Outlook?
International Sugar Organization
Have prices bottomed?
Surplus DeficitProjected Surplus
15 cents/lb fair value?
Will weather intervene?

World Sugar Market Beyond 2017?
Bullish Drivers & Risks Bearish Drivers & Risks
International Sugar Organization
• Stock-to-consumption ratio at low level;
• India: production shortfall and consequent imports;
• Stronger BRL?;• Weather problems - El Nino in 2017?;• Weak USD, strong commodity and
equity markets + higher crude oil prices
• Low world market prices might deter EU exports.
• Likely end to sugar deficit next year;• Surge in EU production and exports;• Good recovery in India and Thailand;• Brazilian production remains strong.• Fewer imports from China?;• Weaker BRL?• No/weak El Nino in 2017?• Strong USD, weak commodity and
equity markets + low crude oil prices• Slower consumption growth
Will Prices test ethanol floor in Brazil?
Weather and cane quality in Brazil can still wipe 1.5-3 mln tonnes off current estimates.
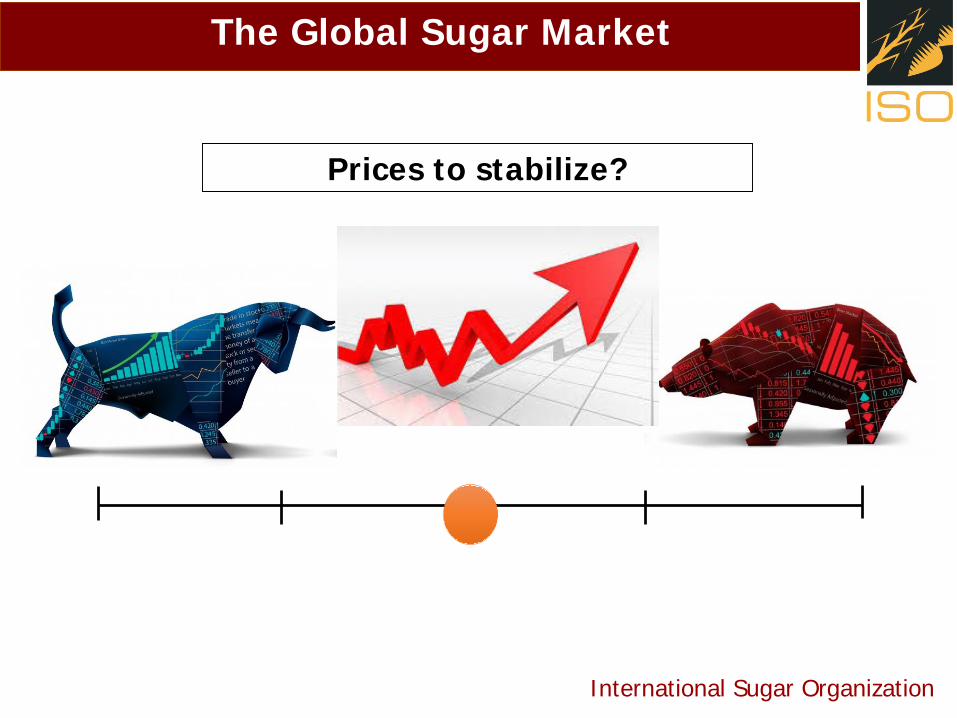
The Global Sugar Market
International Sugar Organization
Prices to stabilize?
Thank You
www.isosugar.orgTwitter: @iso_sugar
International Sugar Organization