international rail travel demand model for hs2
TRANSCRIPT

8/8/2019 International Rail Travel Demand Model for HS2
http://slidepdf.com/reader/full/international-rail-travel-demand-model-for-hs2 1/24
International Rail Travel DemandModel for HS2 (IRTDM): A Report for HS2
Final Report
February 2010

8/8/2019 International Rail Travel Demand Model for HS2
http://slidepdf.com/reader/full/international-rail-travel-demand-model-for-hs2 2/24
The SKM logo trade mark is a registered trade mark of Sincl air Knight Merz Pty Ltd.
International Rail Travel Demand Modelfor HS2 (IRTDM): A Report for HS2
Final Report
February 2010
Sinclair Knight MerzVictoria HouseSouthampton RowLondon
WC1B 4EAUnited KingdomTel: +44 20 7759 2600Fax: +44 20 7759 2601Web: www.skmconsulting.com
COPYRIGHT: The concepts and information contained in this document are the property of SinclairKnight Merz (Europe) Limited. Use or copying of this document in whole or in part without thewritten permission of Sinclair Knight Merz constitutes an infringement of copyright.
LIMITATION: This report has been prepared on behalf of and for the exclusive use of SinclairKnight Merz (Europe) Limited’s Client, and is subject to and issued in connection with the provisionsof the agreement between Sinclair Knight Merz and its Client. Sinclair Knight Merz accepts noliability or responsibility whatsoever for or in respect of any use of or reliance upon this report by any
third party.

8/8/2019 International Rail Travel Demand Model for HS2
http://slidepdf.com/reader/full/international-rail-travel-demand-model-for-hs2 3/24
SINCLAIR KNIGHT MERZ
PAGE 1
Contents
1. Foreword 2 2. Rail and Air Competition 3
2.1. Background 3 2.2. Research 3 2.3. Research Consensus 4 2.4. Best Fit Model 4 2.5. Mode Share Drivers 5 2.6. Eurostar 6
3. Modelling Approach 8 3.1. Routes Considered 8 3.2. Rail / Air Market 10
4. Forecasts 13 4.1. Assumptions about HS2 Service 13 4.2. Forecast Rail Mode Shares 13 4.3. Forecast HS2 Rail Volumes 15
5. Conclusion 17 References 18 Appendix A – Air Passenger Growth by Route 19

8/8/2019 International Rail Travel Demand Model for HS2
http://slidepdf.com/reader/full/international-rail-travel-demand-model-for-hs2 4/24
SINCLAIR KNIGHT MERZ
PAGE 2
1. Foreword
In January 2009, the government announced the creation of the company High Speed 2
(HS2) to develop proposals – and the case for – a new high speed rail line between London
and Birmingham. This new line could potentially be extended further north, and serve
Heathrow Airport either directly or indirectly.
The International Rail Travel Demand Model (IRTDM) documented in this report estimates
the diversion of international air passengers to HS2 and connecting high speed rail services
including High Speed 1 (HS1) and continental services such as TGV. In developing the
model, SKM considered trips between UK airports close to the proposed HS2 route and
selected European destinations easily accessible from London via high speed rail.
SKM has gathered a significant amount of historical information on high speed rail links
across Europe and Asia, including rail and air mode shares, drivers of mode choice and
travel demand data. This has been used to develop a bespoke model which should be
considered as a means to instigate discussion, not a definitive tool in itself.
The primary driver in IRTDM for determining rail mode share (from the air/rail market) is
rail journey time. Factors not explicitly modelled which could have an effect on mode share
include service frequency, access time, fare and service quality. Reasons for omitting these
factors are discussed within the report.
A number of assumptions have been made about the HS2 service, in general that it will be a
fast, reliable and frequent service. Two options are modelled for the London connection
between HS2 and HS1, the first involving an interchange between Euston and St Pancras
Stations, the second being a direct connection to the continent.
For forecasting purposes, the future capacity scenario assumed for Heathrow airport is s1s2:
Maximum use, plus Stansted second runway and Heathrow third runway1.
1 UK Air Passenger Demand and CO2 Forecasts, Department for Transport (2009).

8/8/2019 International Rail Travel Demand Model for HS2
http://slidepdf.com/reader/full/international-rail-travel-demand-model-for-hs2 5/24
SINCLAIR KNIGHT MERZ
PAGE 3
2. Rail and Air Competition
2.1. Background
SKM conducted a review of relevant literature and previous studies of the competition
between air and rail modes. A full list of references is included at the end of this report.
2.2. Research
This section provides a brief review of the impact high speed rail has had on air/rail mode
shares between major cities. It will be useful when reading this section to note that the
distance between Manchester and London is approximately 180 miles, and there are
approximately 500 miles between Manchester and Paris.
Paris – Brussels (180 miles, 1 hour 25 minutes)
The train operator Thalys runs high speed trains between Paris, Brussels, Amsterdam and
Cologne. The Paris – Brussels leg has become patronised to the extent that flights between
the two have been discontinued.
Cologne – Frankfurt (110 miles, ~ 70 minutes)
Similar to the Paris – Brussels service, the Cologne – Frankfurt train has been so successful
that flights have been discontinued between the two cities. In fact, Lufthansa now markets
the rail leg between Cologne and Frankfurt Airport as a “flight”.
Taiwan, Taipei – Kaohsiung (215 miles, 1 hour 20 minutes)
In 2007, a high speed rail service was introduced in Taiwan between Taipei in the north and
Kaohsiung in the south. What had traditionally been Taiwan’s busiest domestic air route saw
a 25% drop in passengers in 2007 alone. In 2008, it achieved 85% of the air/rail market.
Paris – Strasbourg (~300 miles, 2 hours 20 minutes)
In June 2007, high speed rail services began between Paris and Strasbourg on the TGV Est
line. The rail journey time was reduced from 4 hours to 2 hours 20 minutes, and sixteen daily
return journeys were available. By November 2007 air travel between Strasbourg and Paris
Orly/Charles De Gaulle was down by 54% and 25% respectively. By the end of 2008, total
Paris-Strasbourg air travel was almost 60% lower. Easyjet has discontinued its Paris –
Strasbourg flights.
8/8/2019 International Rail Travel Demand Model for HS2
http://slidepdf.com/reader/full/international-rail-travel-demand-model-for-hs2 6/24
SINCLAIR KNIGHT MERZ
PAGE 4
Madrid – Barcelona (310 miles, 2 hours 40 minutes)
This service opened in February 2008, and by the end of 2008 air travel between these
destinations had dropped by 40%.
Madrid – Seville (290 miles, 2 hours 45 minutes)
This service was introduced in 1992. The new railway line had a significant impact on the
air/rail mode split between Madrid and Seville. The share of air traffic decreased between
1991 and 1994 from 40% to 13% and the share of railway traffic increased from 16% to
51%.
Paris – Marseille (~480 miles, 3 hours)
This service was introduced in 2001 and saw Paris-Marseille air travel decrease by a third,
from approximately 3 million passengers to 2 million. This saw rail mode share increase
from 22% in 2001 to 69% in 2006.
2.3. Research Consensus
Most research carried out on rail-air competition to date agrees upon the following points:
travelling by air is rarely considered for city pairs connected by high speed rail with a
journey time of up to 90 minutes;
high speed rail typically has the an advantage over both air and car if the journey time is
2-3 hours; and
rail has a minority mode share where city pairs are connected by rail with a journey time
of over 4.5 hours or 600 miles.
This is largely confirmed by the rail mode share data collected on fourteen different routes,
some before and after service improvements to give the twenty-five data points shown in
Figure 1. This data was collected from a range of sources as listed in at the end of this report,
the most comprehensive being the Air and Rail Complementarity Report, Steer Davies
Gleave (2006).
2.4. Best Fit Model
SDG used a logit curve to model rail market share. Using the parameters implied from their
modelling and using other available data, SKM have developed a logit curve to predict the
rail mode share based solely on the rail journey time. This was compared against other

8/8/2019 International Rail Travel Demand Model for HS2
http://slidepdf.com/reader/full/international-rail-travel-demand-model-for-hs2 7/24
SINCLAIR KNIGHT MERZ
PAGE 5
model types and found to be the best predictor of rail mode share. The logit curve is shownin Figure 1.
Figure 1: Logit Model of Rail Mode Share by Rail Journey Time
2.5. Mode Share Drivers
The most important driver for determining rail mode share (from the air/rail market) is rail
journey time. As shown in Figure 1, it can explain most of the variation in mode shares on
different routes; the fit of the data points is quite close to the logit curve. It would, however,
be negligent to completely ignore all other factors. The most relevant are discussed below.
Fare
Price will undoubtedly be a factor in deciding whether to use air or rail, particularly for
leisure passengers. The influence on mode share is relatively insensitive to small changes in
fare. Assuming that business passengers2
account for a high proportion of trips on each route
2 Business passengers are assumed to have a higher value of time than leisure passengers.

8/8/2019 International Rail Travel Demand Model for HS2
http://slidepdf.com/reader/full/international-rail-travel-demand-model-for-hs2 8/24
SINCLAIR KNIGHT MERZ
PAGE 6
and the average rail fare remains less expensive than the average air fare, then fare can beomitted as an explanatory variable.
Service Frequency
The frequency of rail and air services is closely linked to the demand for each service and is
partly a result of the mode shares rather than a strong explanatory variable. In modelling the
current rail services and the proposed HS2 service, a service frequency penalty is applied in
determining the rail journey time where a connection in London is required.
Frequency penalty = 2*(average minutes between rail services)
0.7
Service Quality
Factors such as on-board catering, check-in facilities, seating classes offered and terminal
facilities are attributed to “service quality”. These are not expected to be a discriminating
factor and qualitative measures such as these are beyond the scope of this analysis.
Access Time
In general, rail terminals are easier to access than airports, as they are mostly located in city
centres. London is unique in that it offers a choice of up to five airports; this means that for
some air passengers it may be easier to access an airport. With the location of possible HS2
stations unknown at the time of producing this analysis, this variable has not been included.
Reliability
It is assumed that high speed rail services have a high reliability and therefore a competitive
advantage over standard rail services. A number of domestic UK rail services were included
in the analysis (see Figure 1); however, their mode share was not significantly different
enough to consider modelling reliability separately. Generally, reliability should be
accounted for in the rail journey time.
2.6. Eurostar
Eurostar has been operating for over fifteen years. Comparing its patronage against the air
market (Figure 2), shows consistent growth with the exception of 2002 when low cost
airlines entered the market. Eurostar responded by reducing their cheapest fares by nearly
50% and benefitting from HS1 line upgrades in September 2003 and November 2007.

8/8/2019 International Rail Travel Demand Model for HS2
http://slidepdf.com/reader/full/international-rail-travel-demand-model-for-hs2 9/24
SINCLAIR KNIGHT MERZ
PAGE 7
Figure 2: Eurostar Share of Rail/Air Market
Note: Ryanair entered the Brussels market in 2001, Easyjet entered the Paris market in 2002.
0.0%
10.0%
20.0%
30.0%
40.0%
50.0%
60.0%
70.0%
80.0%
90.0%
1994 1995 1996 1997 1998 1999 2000 2001 2002 2003 2004 2005 2006 2007 2008 2009
S h a r e o f R a i l / A i r M a r k e t
Eurostar PARIS (inc Disney)
Eurostar BRUSSELS
IVTreduced
by 20min
IVTreduced
by 21min

8/8/2019 International Rail Travel Demand Model for HS2
http://slidepdf.com/reader/full/international-rail-travel-demand-model-for-hs2 10/24
SINCLAIR KNIGHT MERZ
PAGE 8
3. Modelling Approach
3.1. Routes Considered
At the time of writing this report, there remained some degree of uncertainty surrounding the
location of HS2 stations. In order to accommodate this, a wide range of routes were
considered. On the British side of the Channel, all major airports outside London that could
feasibly overlap with the HS2 catchment area were included (see Table 1). This includes all
non-London airports carrying more than five million air passengers with the exception of
Bristol. London airports were excluded as HS1 from London to Brussels and Paris is already
well established.
Table 1: UK Airports within HS2 catchment area
Town / RegionName
IATA3
AirportCode
2008 Air Passengers(million)
Manchester MAN 21.06
Birmingham BHX 9.58
Edinburgh EDI 8.99
Glasgow GLA 8.14
East Midlands EMA 5.62
Liverpool LPL 5.33
Newcastle NCA 5.02
Source: CAA
European cities were selected based on their accessibility from London via the high speed
trains services Eurostar, ICE, Thalys and TGV, and whether they were significant attractors
of journeys from the UK. Those included are shown in Table 2.
Table 2: European Airports within HS2 catchment area
City Country IATA Airport
Code
2008 Air Passengers
(million)Paris France CDG 60.9
Frankfurt Germany FRA 53.5
Amsterdam Netherlands AMS 47.4
Brussels Belgium BRU 18.0
Cologne Germany CGN 10.5
Lyon France LYS 8.0
Source: Airports Council International
3 International Air Transport Association

8/8/2019 International Rail Travel Demand Model for HS2
http://slidepdf.com/reader/full/international-rail-travel-demand-model-for-hs2 11/24
SINCLAIR KNIGHT MERZ
PAGE 9
The UK origins and European destinations considered are shown in Figure 3 along with theexisting high speed rail network linking these cities.
Figure 3: International Air Routes Competing with HS1/HS2
Of all possible routes between the UK airports and the European cities identified above,
eleven carried between 100,000 and 300,000 air passengers in 2008 and seven carried more
than 300,000. Each of these routes is shown, airport by airport, in Appendix A (Figure 6 to
Figure 12). The trend in total air passengers on these routes over the past five years is
summarised in Figure 4; this chart shows that the number of passengers on most routes has
remained fairly stable.
Manchester
London
Amsterdam
Brussels
Paris
Lyon
Cologne
Frankfurt
Newcastle
EdinburghGlasgow
Current High Speed Rail
Proposed High Speed Rail
Liverpool
Birmingham
East Midlands
8/8/2019 International Rail Travel Demand Model for HS2
http://slidepdf.com/reader/full/international-rail-travel-demand-model-for-hs2 12/24
SINCLAIR KNIGHT MERZ
PAGE 10
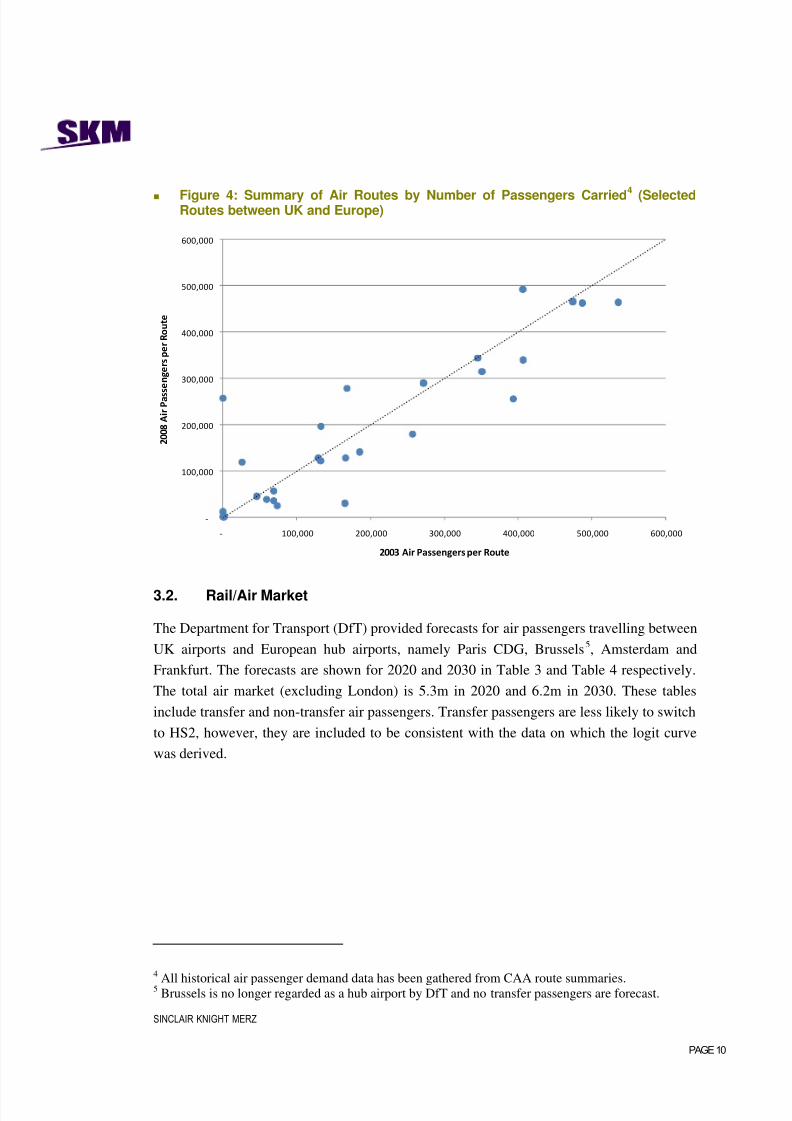
Figure 4: Summary of Air Routes by Number of Passengers Carried4
(SelectedRoutes between UK and Europe)
3.2. Rail/Air Market
The Department for Transport (DfT) provided forecasts for air passengers travelling between
UK airports and European hub airports, namely Paris CDG, Brussels5, Amsterdam and
Frankfurt. The forecasts are shown for 2020 and 2030 in Table 3 and Table 4 respectively.
The total air market (excluding London) is 5.3m in 2020 and 6.2m in 2030. These tables
include transfer and non-transfer air passengers. Transfer passengers are less likely to switch
to HS2, however, they are included to be consistent with the data on which the logit curve
was derived.
4
All historical air passenger demand data has been gathered from CAA route summaries.5 Brussels is no longer regarded as a hub airport by DfT and no transfer passengers are forecast.
‐
100,000
200,000
300,000
400,000
500,000
600,000
‐ 100,000 200,000 300,000 400,000 500,000 600,000
2 0 0 8 A i r P a s s e n g e r s p e r R o u t e
2003 Air Passengers per Route

8/8/2019 International Rail Travel Demand Model for HS2
http://slidepdf.com/reader/full/international-rail-travel-demand-model-for-hs2 13/24
SINCLAIR KNIGHT MERZ
PAGE 11
Table 3: Forecast Air Passengers, DfT 2020
UK Airport
European Airport
Paris CDG Amsterdam Brussels Frankfurt Cologne* Lyon*
Birmingham 373,719 342,935 214,505 272,104 1,764 45,106
Edinburgh 346,512 381,158 62,381 101,261 - -
Glasgow 25,395 374,794 24,937 171,143 - -
Manchester 707,176 503,183 239,590 377,219 73,819 49,676
Newcastle 182,630 362,145 65,322 - - -
East Midlands - - - - - -
Liverpool - - - - - -Heathrow 1,089,074 2,088,203 762,141 1,464,860 145,424 254,479
* Forecast base on growth rates of other airports
Table 4: Forecast Air Passengers, DfT 2030
UK Airport
European Airport
Paris CDG Amsterdam Brussels Frankfurt Cologne* Lyon*
Birmingham 438,697 432,183 284,238 326,989 2,173 55,559
Edinburgh 415,999 428,806 77,484 106,238 - -
Glasgow 9,960 434,461 29,982 160,602 - -
Manchester 879,885 589,390 308,314 455,959 90,237 60,724
Newcastle 226,079 349,462 50,412 - - -
East Midlands - - - - - -
Liverpool - - - - - -
Heathrow 1,477,634 2,851,328 1,065,618 1,932,567 197,166 345,024
* Forecast base on growth rates of other airports
SKM was not able to obtain rail volumes (base or forecast) between any of the city pairs
listed in Table 1 and Table 2. Instead the combined market for rail and air travel was
estimated by reverse engineering the logit curve derived in Section 2.3. Assuming that the
DfT air passenger forecasts represent a future scenario with no HS2 then the total air/rail
market6
is equivalent to:
Equation 1 Forecast Total Rail Market
Where = forecast year
6 Including transfer air passengers

8/8/2019 International Rail Travel Demand Model for HS2
http://slidepdf.com/reader/full/international-rail-travel-demand-model-for-hs2 14/24
SINCLAIR KNIGHT MERZ
PAGE 12
The current rail journey times between UK origins and European destinations were collatedthrough an assessment of current timetables.
Using the logit model described earlier, the estimated current mode share for rail for each of
the city pairs was calculated, and is shown in Table 5. This can be used as an approximation
for rail mode share forecast scenarios without HS2.
Table 5: Estimated 2009 Rail Mode Share
Origin/Destination Amsterdam Brussels Paris Cologne Frankfurt Lyon
London13% 78% 74% 15% 5% 6%
Birmingham 1% 18% 15% 1% 0% 0% East Midlands 1% 20% 16% 1% 0% 0% Manchester 0% 10% 9% 1% 0% 0% Liverpool 0% 10% 9% 1% 0% 0% Newcastle 0% 5% 4% 0% 0% 0% Edinburgh 0% 1% 1% 0% 0% 0% Glasgow 0% 1% 1% 0% 0% 0%
Applying Equation 1 to the figures in Table 3 to Table 5, the total air/rail market was derived
(see Table 6). Special consideration was given to East Midlands and Liverpool since DfT has
forecast no direct flights to European hub airports. The total market from these areas has
been forecast proportionally, relative to the size of their closest major neighbours in 2008:
Birmingham and Manchester respectively.
The composition of air passengers is forecast to change dramatically with a sharp drop in the
proportion of non-transfer air passengers. This means that the subject of including transfer
passengers as part of the total market is less of a concern.
Table 6: Estimated Total Air/Rail Market* with no HS2
Year Air Market % Transfer Rail Market Air / Rail Market
2008 5.2 38% 0.2 5.4
2020 6.1 17% 0.3 6.4
2030 7.2 8% 0.4 7.6
* Between city pairs listed in Table 1 and Table 2

8/8/2019 International Rail Travel Demand Model for HS2
http://slidepdf.com/reader/full/international-rail-travel-demand-model-for-hs2 15/24
SINCLAIR KNIGHT MERZ
PAGE 13
4. Forecasts
4.1. Assumptions about HS2 Service
Two separate forecast scenarios have been modelled, the first assumes that HS2 terminates at
Euston Station; the second assumes that there is a direct connection to the continent. The two
scenarios will hereafter be referred to as ‘ Interchange’ and ‘ Direct’ respectively. The
following assumptions about the proposed HS2 service are common to both scenarios:
in vehicle time (IVT) will be 70% of the current rail IVT7
on domestic journeys to
London; and
current London to European city journey time8 remains unchanged.
For the Interchange scenario rail passengers must disembark at Euston Station then transfer
to St Pancras Station. This is a distance of approximately half a mile with a range of transfer
options currently available such as walk, tube, bus or taxi. Other options may be available
when HS2 is in operation. For the purposes of modelling it is assumed that the interchange
between HS2 and HS1 will take 65 minutes, this time is the aggregation of three separate
components as shown in Table 7.
Table 7: Components of London Interchange Time
Component Time (min)
Transfer between stations (Euston to St Pancras) 15
Eurostar check-in 30
Wait time at St Pancras Station (frequency penalty) 20
Total 65
For the Direct scenario rail passengers do not need to disembark and will have a continuous
service from the UK to the continent. This is an automatic time saving of 65 minutes.
4.2. Forecast Rail Mode Shares
The rail journey time between UK origins and European destinations were estimated based
on the above assumptions, and then the logit curve was used to produce estimated rail modes
shares for both HS2 scenarios (see Table 8 and Table 9).
7 IVT, interchanges and travel time between UK and London rail stations taken from
http://nationalrail.co.uk
8 IVT, interchanges and average waiting time for London to the continent taken from
http://www.raileurope-world.com

8/8/2019 International Rail Travel Demand Model for HS2
http://slidepdf.com/reader/full/international-rail-travel-demand-model-for-hs2 16/24
SINCLAIR KNIGHT MERZ
PAGE 14
Table 8: Estimated Rail Mode Share with HS2 ( Interchange )
Origin/Destination Amsterdam Brussels Paris Cologne Frankfurt Lyon
Birmingham 2% 37% 32% 3% 1% 1%
East Midlands 2% 29% 25% 2% 1% 1%
Manchester 2% 27% 23% 2% 1% 1%
Liverpool 2% 27% 23% 2% 1% 1%
Newcastle 1% 15% 13% 1% 0% 0%
Edinburgh 0% 7% 6% 0% 0% 0%
Glasgow 0% 8% 6% 0% 0% 0%
Using the rule of thumb that high speed rail is only competitive up to a journey time of 4.5
hours, there are eight city pairs within this range (Birmingham, East Midlands, Manchester
& Liverpool to Paris and Brussels). Other city pairs will still attract some high speed rail
trips, but only a minority mode share. This appears consistent with the results shown in
Table 8.
Table 9: Estimated Rail Mode Share with HS2 (Direct )
Origin/Destination Amsterdam Brussels Paris Cologne Frankfurt Lyon
Birmingham 6% 60% 54% 7% 2% 3%
East Midlands 4% 51% 46% 5% 1% 2%
Manchester 4% 49% 43% 4% 1% 2%
Liverpool 4% 49% 43% 4% 1% 2%
Newcastle 2% 31% 27% 2% 1% 1%
Edinburgh 1% 17% 14% 1% 0% 0%
Glasgow 1% 18% 15% 1% 0% 0%
The rail mode shares from the HS2 Direct scenario have been super imposed over the top of the observed mode shares shown earlier in Figure 1. This graph (Figure 5) highlights the
degree of uncertainty surrounding the forecasts.

8/8/2019 International Rail Travel Demand Model for HS2
http://slidepdf.com/reader/full/international-rail-travel-demand-model-for-hs2 17/24
SINCLAIR KNIGHT MERZ
PAGE 15
Figure 5: Rail Mode Share by Rail Journey Time, Observed and Forecast (HS2Direct Scenario)
4.3. Forecast HS2 Rail Volumes
The rail mode shares for both scenarios have been applied to the total market for 2020 (see
Table 10) and 2030 (see Table 11). At this stage Frankfurt, Cologne and Lyon have been
omitted as European destinations due to the very small forecast rail shares. It is presumed
that existing rail passengers would switch to high speed rail.
0%
10%
20%
30%
40%
50%
60%
70%
80%
90%
100%
0 50 100 150 200 250 300 350 400 450 500
R a i l M a r k e t S h a r e
Rail Journey Time (mins)
Rail Share of Total MarketForecast
Observed

8/8/2019 International Rail Travel Demand Model for HS2
http://slidepdf.com/reader/full/international-rail-travel-demand-model-for-hs2 18/24
SINCLAIR KNIGHT MERZ
PAGE 16
Table 10: 2020 Forecast Market Size to European Destinations*
UK Origin Total Market
Rail
(no HS2)
Rail
(HS2 Interchange )
Rail
(HS2 Direct )
Birmingham 1,048,928 17,769 243,285 416,675
East Midlands 321,965 41,091 61,725 113,768
Manchester 1,547,106 97,157 255,977 484,076
Liverpool 579,083 27,147 72,514 140,173
Newcastle 621,051 10,954 36,802 79,576
Edinburgh 795,333 5,282 26,490 62,547
Glasgow 426,032 906 5,041 12,002Total 5,339,497 300,305 701,834 1,308,817
Rail Market % - 6% 13% 25%
* Amsterdam, Brussels and Paris
Table 11: 2030 Forecast Market Size to European Destinations*
UK Origin Total Market
Rail
(no HS2)
Rail
(HS2 Interchange )
Rail
(HS2 Direct )
Birmingham 1,300,858 145,740 300,778 514,576
East Midlands 396,876 50,488 75,805 139,576
Manchester 1,899,489 121,900 320,992 606,426
Liverpool 700,120 33,676 89,912 173,620
Newcastle 637,845 11,892 39,994 86,579
Edinburgh 928,650 6,361 31,898 75,287
Glasgow 475,237 834 4,652 11,121
Total 6,339,076 370,892 864,031 1,607,185
Rail Market % - 6% 14% 25%
* Amsterdam, Brussels and Paris

8/8/2019 International Rail Travel Demand Model for HS2
http://slidepdf.com/reader/full/international-rail-travel-demand-model-for-hs2 19/24
SINCLAIR KNIGHT MERZ
PAGE 17
5. Conclusion
The numbers reported in this document are indicative only, due to the assumptions made and
uncertainties noted. For this reason the numbers should be used to support a discussion rather
than be treated as conclusive.
The analysis indicates that rail would attract a high market share on routes which would be
within 4.5 hours by high speed rail. Within the UK this includes Birmingham, East
Midlands, Manchester and Liverpool. From Europe, only Paris and Brussels remain close
enough to attract significant rail patronage.
Two scenarios have been modelled, one is a direct service to the continent through St
Pancras Station and the other involves interchanging from HS2 at Euston Station to HS1 at
St Pancras Station. These could be considered a best and worst case scenario which provides
a range of forecast HS2 patronage. In 2020, the number of passengers using HS2 to connect
with HS1 is estimated to be 700,000 to 1,300,000, rising to 860,000 to 1,600,000 in 2030.
This is equivalent to 1,900 to 3,600 and 2,400 to 4,400 passengers per day respectively or
8% to 18% of the existing HS1 patronage. The effect of a connection in London is expected
to have a significant impact on patronage, as it has been assumed to add 65 minutes to the
total rail journey time.
This volume of trips switching from air to rail could result in two reactions from airlines,
either a decrease in some air services or a reduction in fares. Neither of these outcomes has
been factored into the modelling.

8/8/2019 International Rail Travel Demand Model for HS2
http://slidepdf.com/reader/full/international-rail-travel-demand-model-for-hs2 20/24
SINCLAIR KNIGHT MERZ
PAGE 18
References
ITA – Institute of Air Transport (1991) Rail/Air Complementarity in Europe: The Impact of
High Speed Train Services. Prepared for European Commission Directorate General for
Transport, Paris
Lythgoe W.F and Wardman M. (2002) Demand for rail travel to and from airports,
Transportation Journal, Leeds
COST318 (1996) Interaction between High Speed and Air Passenger Transport: Interim
Report. European Commission: Directorate General of Transport
Lopez Pita, A and Anton, F.R. (2001) The Effects of High-Speed Rail on the Reduction of
Air Traffic Congestion, Paper presented at European Transport Conference, PTRC, London
Derudder, B. And Witlox, F. (2005) An Appraisal of the Use of Airline Data in Assessing
the World City Network: A Research Note on Data. Urban Studies, USA
Department for Transport (1997) Air Traffic Forecasts for the United Kingdom 1997, UK
Wardman, M., Bristow, A., Toner, J. And Tweddle, G. (2002) Review of Research Relevant
to Rail Competition for Short Haul Air Routes. Eurocontrol, France
Steer Davies Gleave (2006) Air and Rail Competition and Complementarity. Prepared for
European Commission DG TREN, London
WebTAG Unit 3.15.4: Rail Passenger Demand Forecasting methodology (2009),
Department for Transport, UK
UK Air Passenger Demand and CO2 Forecasts (2009), Department for Transport, UK

8/8/2019 International Rail Travel Demand Model for HS2
http://slidepdf.com/reader/full/international-rail-travel-demand-model-for-hs2 21/24
SINCLAIR KNIGHT MERZ
PAGE 19
Appendix A – Air Passenger Growth by Route
Figure 6: Annual Air Passengers to/from Birmingham Airport, CAA
Figure 7: Annual Air Passengers to/from East Midlands Airport, CAA
‐
100,000
200,000
300,000
400,000
500,000
600,000
2001 2002 2003 2004 2005 2006 2007 2008
A n n u a l A i r P a x
BRUSSELS PARIS (CHARLES DE GAULLE) AMSTERDAM FRANKFURT
‐
50,000
100,000
150,000
200,000
250,000
300,000
2001 2002 2003 2004 2005 2006 2007 2008
A n n u a l A i r P a x
PARIS (CHARLES DE GAULLE) AMSTERDAM
8/8/2019 International Rail Travel Demand Model for HS2
http://slidepdf.com/reader/full/international-rail-travel-demand-model-for-hs2 22/24
SINCLAIR KNIGHT MERZ
PAGE 20
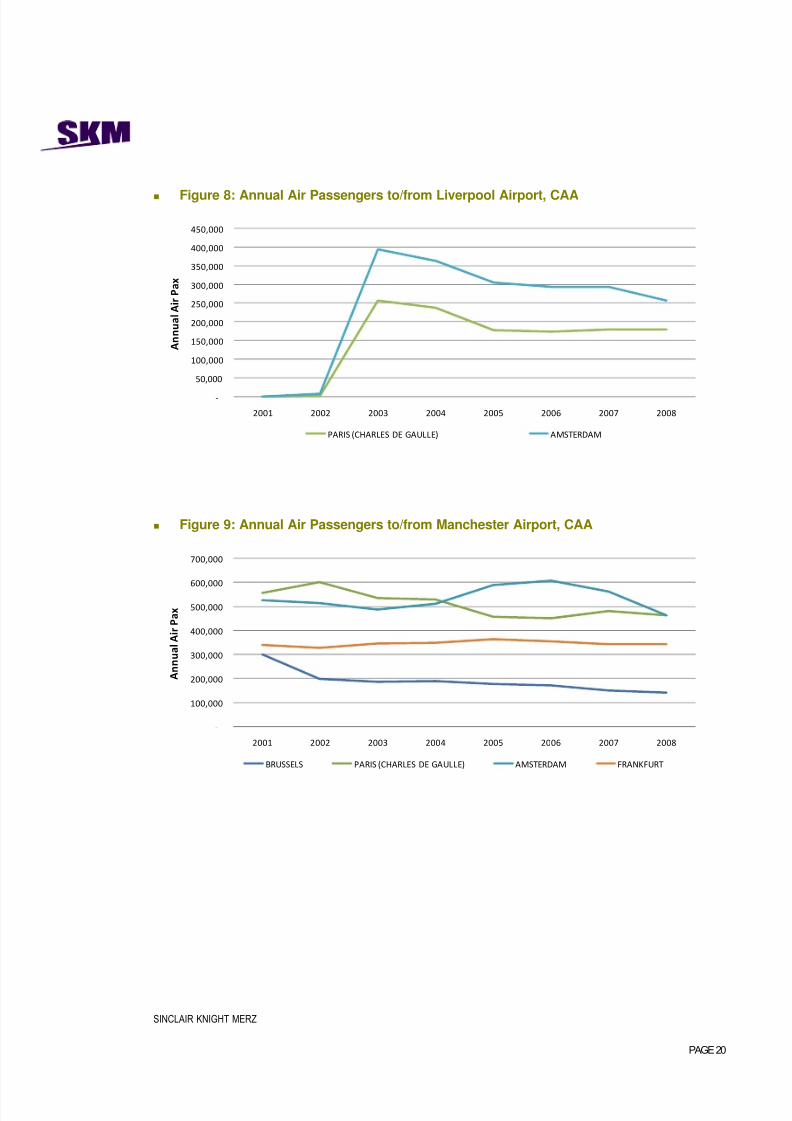
Figure 8: Annual Air Passengers to/from Liverpool Airport, CAA
Figure 9: Annual Air Passengers to/from Manchester Airport, CAA
‐
50,000
100,000
150,000
200,000
250,000
300,000
350,000
400,000
450,000
2001 2002 2003 2004 2005 2006 2007 2008
A n n u a l A i r P a x
PARIS (CHARLES DE GAULLE) AMSTERDAM
‐
100,000
200,000
300,000
400,000
500,000
600,000
700,000
2001 2002 2003 2004 2005 2006 2007 2008
A n n u a l A i r P a x
BRUSSELS PARIS (CHARLES DE GAULLE) AMSTERDAM FRANKFURT

8/8/2019 International Rail Travel Demand Model for HS2
http://slidepdf.com/reader/full/international-rail-travel-demand-model-for-hs2 23/24
SINCLAIR KNIGHT MERZ
PAGE 21
Figure 10: Annual Air Passengers to/from Newcastle Airport, CAA
Figure 11: Annual Air Passengers to/from Edinburgh Airport, CAA
‐
50,000
100,000
150,000
200,000
250,000
300,000
350,000
400,000
2001 2002 2003 2004 2005 2006 2007 2008
A n n u a l A i r P a x
PARIS (CHARLES DE GAULLE) AMSTERDAM
‐
100,000
200,000
300,000
400,000
500,000
600,000
2001 2002 2003 2004 2005 2006 2007 2008
A n n u a l A i r P a x
PARIS (CHARLES DE GAULLE) AMSTERDAM

8/8/2019 International Rail Travel Demand Model for HS2
http://slidepdf.com/reader/full/international-rail-travel-demand-model-for-hs2 24/24
SINCLAIR KNIGHT MERZ
Figure 12: Annual Air Passengers to/from Glasgow Airport, CAA
‐
50,000
100,000
150,000
200,000
250,000
300,000
350,000
400,000
450,000
2001 2002 2003 2004 2005 2006 2007 2008
A n n u a l A i r P a x
PARIS (CHARLES DE GAULLE) AMSTERDAM