international organization...
TRANSCRIPT
International Organizationhttp://journals.cambridge.org/INO
Additional services for InternationalOrganization:
Email alerts: Click hereSubscriptions: Click hereCommercial reprints: Click hereTerms of use : Click here
Is the Phone Mightier Than the Sword?Cellphones and Insurgent Violence in Iraq
Jacob N. Shapiro and Nils B. Weidmann
International Organization / Volume 69 / Issue 02 / March 2015, pp 247 - 274DOI: 10.1017/S0020818314000423, Published online: 06 May 2015
Link to this article: http://journals.cambridge.org/abstract_S0020818314000423
How to cite this article:Jacob N. Shapiro and Nils B. Weidmann (2015). Is the Phone Mightier Than theSword? Cellphones and Insurgent Violence in Iraq. International Organization, 69,pp 247-274 doi:10.1017/S0020818314000423
Request Permissions : Click here
Downloaded from http://journals.cambridge.org/INO, IP address: 73.33.37.20 on 07 May 2015

Is the Phone Mightier Than the Sword?Cellphones and Insurgent Violence in IraqJacob N. Shapiro and Nils B. Weidmann
Abstract Does improved communication provided by modern cellphone technologyaffect the rise or fall of violence during insurgencies? A priori predictions are ambiguous;introducing cellphones can enhance insurgent communications but can also make iteasier for the population to share information with counterinsurgents and creates oppor-tunities for signals intelligence collection. We provide the first systematic micro-level testof the effect of cellphone communication on conflict using data on Iraq’s cellphonenetwork (2004–2009) and event data on violence. We show that increased mobile com-munications reduced insurgent violence in Iraq, both at the district level and for specificlocal coverage areas. The results provide support for models of insurgency that focus onnoncombatants providing information as the key constraint on violent groups and high-light the fact that small changes in the transaction costs of cooperating with the govern-ment can have large macro effects on conflict.
In 2007, cellphone subscriptions reached 3.3 billion worldwide, which corresponds tohalf of the world’s population.1 The increase in wireless communication has been oneof the most important technological advances of the past two decades. There areplenty of reasons to be enthusiastic about this progress. For example, economistshave shown that improved mobile communications can enhance market performancein Indian fishing communities and reduce price dispersion in grain markets in Niger.2
At the same time, however, there are circumstances under which cellphone com-munication can have more pernicious effects. Governments are increasingly afraid
The authors thank Zain Iraq for generously sharing data on their cellphone towers. Patson Anius, WalidJallo, Alberto Lopez, Tijjay Majiyagbe, Lewis Shade, and Frederic Wohl provided critical insights into theconstruction of the Iraqi cellphone network. Our anonymous reviewers, the IO editorial team, and seminarparticipants at Colombia, Georgetown, Harvard, the Harris School, Michigan, Pennsylvania, Princeton, andStanford Universities honed this article with their incisive comments. Our students and colleagues with op-erational experience in Afghanistan and Iraq provided valuable insights regarding mechanisms and manyinformative anecdotes. Josh Martin and Thomas Scherer provided fantastic research assistance throughoutthe project. Thanks to Josh Borkowski and Zeynep Bulutgil for conducting the coding of ethnic populationsat the district level. This material is based on work supported by the Air Force Office of Scientific Research(AFOSR) under Award No. FA9550-09-1-0314, by the National Science Foundation (NSF) under AwardNo. CNS-0905086, by the Army Research Office (ARO) under Award No. W911NF-11-1-0036, and bythe Alexander von Humboldt Foundation under a Sofja Kovalevskaja Award. Any opinions, findings,and conclusions or recommendations expressed in this publication are those of the author(s) and do notnecessarily reflect the views of AFOSR, United States Department of Defense, NSF, or ARO.1. Tamo Virki, “Global Cellphone Use at 50 percent,” Reuters (Internet ed.), 29 November 2007.2. See Jensen 2011; and Aker 2010.
International Organization 69, Spring 2015, pp. 247–274© The IO Foundation, 2015 doi:10.1017/S0020818314000423
of the potential for collective mobilization that is introduced by modern communica-tion technology. During the early 2011 protests in Egypt, for example, the HosniMubarak government shut down all cellphone communications in an attempt tostop the large crowd of protesters from growing.3 Analysts of organized crime, ter-rorism, and insurgency have long argued that the spread of cheap and reliablemobile communications will open up new organizational models for terrorists andrebels.4 Indeed, recent work shows that cross-nationally the correlation betweenthe introduction of cellular coverage and conflict may be positive, at least in Africa.5
If cellphone communication is conducive to subversive action, insurgents shouldbe among the keenest adopters of this technology. Anecdotal evidence from Iraq sug-gests this is the case, with press reports calling cellphones an “explosive tool for in-surgents”6 and some arguing that mobile communications enabled a “networkedinsurgency” in Iraq.7 That cellphones can be key infrastructure for insurgent com-munication is corroborated by the observation that although insurgents in Iraq fre-quently attacked water and electricity networks, they carefully spared the cellphonenetwork,8 and even threatened telecommunication companies for not doing enoughto maintain their network.9 This pattern from Iraq contrasts with anecdotes fromAfghanistan during the same period, where the Taliban insurgents seemed afraid ofcellphone technology. In an attempt to prevent villagers from calling in tips to themilitary forces, they issued decrees ordering all cellphone towers to be turned offat night and they attacked and destroyed cellphone towers for the same purpose.10
Theoretically it is not obvious whether or how the availability of cellular com-munications influences political violence. Cellphones make collective action easier;equipped with light, mobile communication devices, insurgents can easily coordinateactions, execute attacks, and quickly react to counterinsurgency operations.11
Following this line of reasoning, increased cellphone availability should lead tohigher levels of violence. At the same time, however, cellphone availability could
3. Matt Richtel, “Egypt Cuts Off Most Internet and Cellphone Service,” New York Times, 29 January2011, A13.
4. See, for example, Arquilla, Ronfeldt, and Zanini 1999; and Andreas 2002.5. Pierskalla and Hollenbach 2013.6. “Cellphone Technology an Explosive Tool for Insurgents,” Washington Times (Internet ed.), 7
March 2005.7. Muckian 2006.8. Jon Brand, “Iraqi Insurgents Target Water and Electricity, but Spare the Cellphone.” PBS Newshour
Extra, 29 January 2007.9. Ryhs Blakely, “Terrorists ‘Threaten’ Iraq Mobile Operators,” The Times (Internet ed.), 22 July 2005.10. See Yaroslav Trofimov, “Cell Carriers Bow to Taliban Threat,”Wall Street Journal (Internet ed.), 23
March 2010; and Noah Shachtman, “Taliban Threatens Cell Towers,” Wired (Internet ed.), 25 February2008. Unfortunately, we cannot identify the causal impact of cellphones on violence in Afghanistanbecause there is no source of plausibly exogenous variation in the timing of cell tower constructionthere. Shapiro has worked with the largest cellular provider in Afghanistan on research projects sinceearly 2011 and it is clear that (1) violence and potential violence were major considerations for themthroughout their build-out; and (2) they often had to turn towers on and off at the request of localTaliban commanders.11. See, for example, Cordesman 2005; Leahy 2005; and Strother 2007.
248 International Organization

benefit counterinsurgents. In general, cellphones make it easier for the population toshare information about insurgent activity, and to safely and anonymously call in tips.If this were true, and if the population’s provision of information to counterinsurgentswere generally the binding constraint on the production of violence, then greater cell-phone availability would lead to less violence.12 On the other hand, insurgent use ofcellphones may create operational vulnerabilities given many governments’ limitedability to monitor them.We make the first systematic micro-level attempt to examine whether cellular com-
munications networks are security enhancing or not. Using detailed data on cellphonenetworks and violence in Iraq for 2004 to 2009, we estimate the effect of cellphonenetwork expansion on insurgent violence at two levels. First, because the insurgencywas organized regionally, we conduct a district-level analysis, assessing whetherincreased coverage at the district level is associated with changes in violence. Wefind that better coverage at the district level leads to a clear and robust decrease ininsurgent attacks for most of the war. Second, to provide evidence on the mechanismsbehind the main district-level effects, we study the local effect of cellphone towerswithin specific coverage areas. Using a spatial-temporal difference-in-differencedesign, we show that after a tower is turned on, there is a large drop in the numberof improvised explosive device (IED) attacks in the area around towers that introducesubstantial new coverage, but not around towers that merely increase existing capac-ity. This finding is especially striking as cellular coverage opens up a broad range oftechnologies for fusing IEDs. Importantly, these effects extend a bit beyond the im-mediate coverage area of new towers. Since insurgents in Iraq organized in units thatcovered areas larger than immediate coverage areas this pattern is consistent with ourinterpretation that the violence reduction engendered by turning on new coverage re-flects an increased ability of counterinsurgents to act against militants.These results should inform the theoretical literature on nonstate conflict in two
ways. First, they highlight the centrality of civilian decision making over informationprovision in determining equilibrium levels of violence in civil conflicts. Specifically,our results show that in a conflict where rebels faced a militarily competent govern-ment (that is, Iraq and its US allies), exogenous reductions in the costs of communi-cation (costs that should have increased the productivity of labor for rebels) led toreduced violence. This is powerful evidence for the theoretical approaches thatfocus on information sharing by civilians as the binding constraint on insurgent vio-lence, and offers further evidence for the criticality of local information that numer-ous scholars have highlighted.13 Second, and more broadly, the results show thatsmall changes in the transaction costs for communication can have dramatic effects
12. For a workhorse three-actor model in which information is the key constraint on insurgents, seeBerman, Shapiro, and Felter 2011. For a two-actor model that considers both labor and information con-straints on insurgency that has similar implications for what happens when the ability to share informationsafely increases, see Vanden Eynde 2011.13. For a three-actor model in which insurgents make a strategic choice to limit violence in response to
civilians’ subsequent decisions about information sharing, see Berman, Shapiro, and Felter 2011. For
Is the Phone Mightier Than the Sword? 249

on levels of violence. In our tower-level analysis the introduction of coverage de-creases violence by about 40 percent from the mean level in areas that receive newcoverage at some point. This is a considerable effect, especially given that construct-ing a cellular tower in Iraq was quite cheap, between $50,000 and $200,000 accord-ing to Zain Iraq—the nation’s largest cellphone provider. This result has implicationsfor theoretical models of civil conflict, but also important consequences for policy.While it is typically assumed that violence reduction is costly, we show that itneed not be; relatively simple and inexpensive measures can be very effectiveunder the right circumstances.
Cellphones and Insurgent Violence
Theories of insurgent violence and collective action provide conflicting predictionsabout the impact of introducing cellular communications into areas with ongoingviolence. In the context of the recent uprising in the Arab world, modern com-munication—and in particular cellphone technology—is frequently mentioned asa key catalyst of rebellion because it facilitates collective action. The argumentis that by making it possible for people to coordinate mass protest, these technol-ogies play a key role in toppling autocratic regimes and paving the way fordemocracy.14 This thinking is rooted in the social movements literature, whichhas shown that efficient communication critically affects a movement’s capabilityfor organizational mobilization.15 In a different context, however, fast distributionof information between the members of a movement could also foster less favor-able outcomes. During an insurgency, cellular communication technology couldlead to increasing violence by making it easier for insurgents to coordinateattacks, mass forces, and by operating in a coordinated fashion without adefined chain of command.The best evidence to date on the average impact of mobile communications on
conflict across countries comes from studying the impact of introducing mobile com-munications on 55 × 55 km grid cells in Africa.16 There the introduction of newcellular coverage is associated with a .5 to 1 percentage point increase in the proba-bility of an armed conflict event being recorded in the Uppsala Conflict Data Program(UCDP) Georeferenced Event Dataset (UCDP GED) in the following year.17 From atheoretical perspective, many governments in Africa lack the means to exploit infor-mation provided about insurgents, and so the constraints to insurgent violence could
papers highlighting the criticality of local information, see Kalyvas 2006; Lyall 2010; and Condra andShapiro 2012.14. See Diamond 2010; and Shirky 2011.15. Garrett and Edwards 2007.16. Pierskalla and Hollenbach 2013.17. Sundberg and Melander 2013.
250 International Organization

be fundamentally different there, on average, than in settings where governments dohave such capacity.From an inferential perspective, the study highlights the empirical challenges in
this area. Two issues are of concern. First, violent events are more likely to be record-ed when people in an area are in regular contact with friends and relatives in otherareas. This is why systems such as Ushahidi—a crowd-sourced reporting platformfor events of various kinds—work for tracking violence in cities with rich cellularcoverage, but it creates a correlation between measurement error and the key explan-atory variable in the study. Second, the authors rely on violence data based to a largeextent on media reports, where a violent event is geo-referenced using the place namementioned in the report. However, news reports do not usually give precise geograph-ic coordinates; rather, they mention the nearest major city. Without more detailed in-formation, violent events will be referenced to these cities. These large populationagglomerations are exactly where the cellphone network is primarily introduced. Itis thus hard to know for certain if the positive correlation stems from the fact thereseemingly is no violence where there are no cellphones, or because the introductionof coverage substantially increases reporting.18
There is ample evidence that some players in the Iraqi insurgency felt that cell-phone networks were a boon to insurgents. In addition to facilitating improved coor-dination, cellphone service opened up a range of fusing options for IEDs. Withcellular coverage, insurgents could call phones to detonate bombs, they could setup bombs that would detonate when coalition jammers terminated a call, and theycould communicate between spotters and those controlling an explosive, meaningthat the controller no longer needed to be within line-of-sight of the IED.19 Giventhe manifest potential military advantages to insurgents of having cellphones, it isperhaps not too surprising that in 2005 the chairman of the Iraqi NationalCommunications and Media Commission reported companies were being “threat-ened by terrorists for delays in setting up masts” because “terrorists like mobilecompanies.”20
Cellphone technology, however, can also improve information gathering by coun-terinsurgent forces, which would in turn lead to more effective counterinsurgency anda decrease in violence. The two key mechanisms that account for this are best under-stood in the context of the Hearts-and-Minds (HAM) model. The model is formallypresented in previous work, so we focus on a nontechnical discussion in this article.21
18. Applying the approach to comparing the potential bias from unobservables to that removed by con-trolling for observables suggested by Bellows and Miguel 2009 (outlined in the online appendix A) andused in Nunn and Wantchekon 2011 suggests that the size of this time-varying reporting bias wouldhave to be roughly 78 percent as large as the time-invariant bias explained by cell fixed-effects but notby geographic covariates. That seems a large amount to fully account for the correlation but doessuggest the average effect is probably substantially smaller than the coefficient estimates suggest.Private communications with authors, 29 March 2013.19. See online appendix Figure A01.20. Ryhs Blakely, “Terrorists ‘Threaten’ Iraq Mobile Operators,” The Times (Internet ed.), 22 July 2005.21. See Berman, Shapiro, and Felter 2011; and Berman, Felter, Shapiro, and Troland 2013.
Is the Phone Mightier Than the Sword? 251

The HAM model is a three-sided game between violent rebels seeking to imposecosts on a government, a government seeking to minimize violence by a mix of mil-itarized counterinsurgency efforts and service provision, and civilians decidingwhether to share information about insurgents. Civilian decisions are based ontheir political preferences, the benefits of government service provision, the costsimposed on them by rebel violence, and the ability of rebels to retaliate against com-munity members who share information. In equilibrium, rebels produce violence upto a “noncooperation constraint,” the point at which the externalities of violence to thecommunity are so high that the representative community member is indifferentbetween sharing information with the government or not, given their political prefer-ences and exposure to rebel retaliation.22 In extensions to the core model, Berman,Shapiro, and Felter show that the noncooperation constraint occurs at lower levelsof insurgent violence when (1) the level of collateral damage caused by governmentforces at a given level of military activity is lower; and (2) the ability of rebels to re-taliate against those who share information is reduced.23
Both of these parameters are directly affected by the introduction of cellphonetechnology. First, by using cellphone tracking and intercepted communications,counterinsurgent forces can target the most influential insurgents and therefore useforce in ways that pose less risk to innocent civilians. This “signals intelligence”mechanism corresponds to the first extension above. Second, cellphones make iteasier for the civilian population to share information with counterinsurgentsbecause they make it possible to place calls from more private places than withfixed land-line phones (of which there was not great market penetration in Iraq inany case), allow for text messaging that cannot be overheard, and reduce the needfor in-person meetings between government sources and their handlers. Cellphonesthus reduce the insurgents’ ability to identify and retaliate against people providinginformation. This “human intelligence” mechanism corresponds to the secondextension.24
There is anecdotal evidence that both mechanisms were at work in Iraq. It was cell-phone monitoring, in part, that helped US forces kill several senior al-Qa’ida leadersin Iraq including Abu Musab al-Zarqawi and many others (as well as Osama BinLaden in Pakistan).25 At the same time, coalition forces considered human intelli-gence to be key and worked throughout the war to make it safer for people toprovide it. Shortly after the invasion in 2003, the National Tips Hot Line wasrolled out by the Coalition Provisional Authority with nearly $10 million budgeted
22. Biddle, Friedman, and Shapiro 2012 provide evidence that in many places in Anbar governorateanger at the externalities created by al-Qa’ida in Iraq violence led locals to turn against that insurgent group.23. Berman, Shapiro, and Felter 2011.24. In the HAMmodel as presented in ibid., the impact of cellular communications through these mech-
anisms would not depend on community norms (n in that model) because the authors assume an additivesubutility function. Under other assumptions one could get different results.25. Cal Perry, Jamie McIntyre, Barbara Starr, Henry Schuster, and Randa Habib, “Cellphone Tracking
Helped Find al-Zarqawi,” CNN (Internet ed.), 9 June 2006.
252 International Organization

for billboard, print, radio, and television advertising.26 Throughout Baghdad in 2004,the tip line was advertised as a way to “fight the war in secret.”27 Soldiers in manyareas carried cards advertising tip lines.28 The idea behind these efforts was thatmany civilians opposed the insurgency enough to share useful information if theycould do so safely, but not enough to take up arms on their own or join the police.29
If cellphone technology affects insurgency in the way the HAM model predicts,there should be a general decline in violence associated with the introduction ofthis technology in conflict regions. This constitutes our first hypothesis, and estab-lishing the causal direction of this effect is our main goal. However, our analysisdoes not stop here. Even if we can establish a general effect, we still do not knowwhich mechanism is responsible for it. Direct tests of the signals and human intelli-gence mechanisms, however, are difficult, if not impossible. There exists no unclas-sified data on such information transfers; in fact, intelligence from human sources(HUMINT) is among the most highly classified types of information held by theUS military. Concrete data on cellphone tracking is impossible to get because ofsimilar sensitivities around signals intelligence (SIGINT).Instead, by examining effects across different kinds of attacks and at different
levels of geographic aggregation, we can make the cautious case about how ourresults are consistent (or not) with different mechanisms. In particular, we distinguishbetween the effects of cellphone coverage in larger geographic units, and those in thedirect vicinity of new cellphone towers. The former is relevant because insurgent vio-lence need not be carried out where it is planned; rather, insurgents operate in a largergeographic radius. If we assume that cellphone coverage affects the planning stage ofinsurgent attacks or allows counterinsurgents to better target senior insurgents, weshould study this effect in that area. Our first test thus focuses on administrative dis-tricts as unit of analysis.30 We conduct a second analysis at a finer resolution, the cov-erage area around cellphone towers. These coverage areas typically have a radius of afew kilometers, and mostly correspond to small villages or settlements. This analysisintends to identify towers’ influence on local tactical dynamics, either by making it
26. Kirk Semple, “US Backs Hot Line in Iraq to Solicit Tips About Trouble” New York Times (Interneted.), 4 November 2006.This form of local intelligence is of course not unique to insurgencies; police forcesconsider local communities to be key sources of information for preventing crime and terrorism, andongoing policing efforts focus on forging trust and confidence between citizens and security forces. See,for example, Innes 2006.27. Donna Miles, “Hotline Succeeding in Foiling Iraqi Insurgents,” American Forces Press Service
(Internet ed.), 29 December 2004.28. Such as the one shown in online appendix Figure A02 that was distributed by soldiers of the US
Army 3rd Infantry Division operating in al-Zubayr, near Basrah, in 2010.29. When a special operations task unit worked with Iraqna (Zain’s predecessor) in early spring 2007 to
reestablish cellphone coverage west of Fallujah for the first time in two years, the response was exactlywhat the HAMmodel would expect; the intelligence gathering and passing capabilities of the anti-insurgentmovement grew dramatically, enabling a range of anti-insurgent operations by Coalition forces. Author in-terview with US Navy Commander Ryan Shann, 23 October 2012. Princeton, NJ.30. There is good documentary evidence that one of the key insurgents groups in Iraq, al-Qa’ida in Iraq,
organized along district lines, see Bahney et al. 2011, on Al-Qa’ida in Iraq.
Is the Phone Mightier Than the Sword? 253

safer for people to share information or by enhancing the viability of remotely fusingIEDs and helping to coordinate ambushes.The two levels of analysis give us some leverage in distinguishing between the
human- and signals-intelligence mechanisms we describe. The signals-intelligencechannel predicts that increased coverage will be violence reducing at the districtlevel, but not at the coverage-area level. This is because the benefits of signals inter-cepts accrue in large part from understanding key individuals who operate widely andso can be attacked far from the location of the initial information acquisition. The in-formation-sharing channel, in contrast, predicts that increased coverage should beviolence-reducing at both levels because people living within a neighborhood aresuddenly able to more safely share information about what is going on in their spe-cific geographic space.In sum, if cellphone communication affects insurgency according to the HAM
model, we expect a general decrease in violence following the expansion of thenetwork. If we see these effects both at the district- and the tower-level, that providesevidence for the human-intelligence mechanism. In contrast, identifying the effect atthe district-level—but failure to do so at the tower level—constitutes evidence infavor of the signal-intelligence mechanism as the main one.
Data and Identification Strategy
Our analysis exploits variation in cellphone coverage introduced by the buildup ofIraq’s network. We briefly describe the history of this network, our identificationstrategy, as well as our measure of violence and other control variables in ouranalysis.
Iraq’s Cellphone Network
Under the regime of Saddam Hussein mobile communication was accessible to only asmall minority of Iraqis, but the network has seen a rapid expansion in the recentyears. Less than 10 percent of Iraq’s population of approximately 25 millionpeople lived in areas with cellphone coverage at the beginning of 2004.31 ByFebruary 2009, when our study period ends, Zain alone reported more than 10million subscribers.32 After coalition forces had invaded Iraq and toppled Saddamin 2003, the establishment of modern communication networks was a priorityduring the reconstruction efforts. In late 2003, the Iraqi government sold contractsto establish cellphone networks to three companies, one for each of three regions
31. Authors’ calculations based on coverage areas and Landscan population data.32. Zain Iraq website is available at <http://www.iq.zain.com/iq/af/home.do?lang=en>, accessed 1
December 2014.
254 International Organization

(northern, southern, and central Iraq). To improve existing coverage and enable na-tionwide competition, the government auctioned three licenses for national coveragein fall 2007, which also led to the creation of a nationwide carrier, Zain.The buildup of the cellphone network occurred in a phased approach, where pro-
viders first selected larger areas for expansion, and then chose specific sites for cell-phone towers.33 According to what we were told, network expansion was onlymarginally affected by the ongoing insurgency, both because larger expansionareas were selected at the beginning of each year based on marketing considerations,and because local placement of towers was affected by a variety of administrativeprocedures orthogonal to the ongoing conflict.We use data on the coverage of the cellphone network that Zain made available to
us. It covers the period 2004 to 2009. Since Zain purchased other providers operatingin central and southern Iraq in 2007 and 2008, our data include the majority of towersoperating in areas of Iraq experiencing violence between 2004 and 2008. The originaldata set records information on 7,687 cellphone antennas with their precise on-airdate and geographic location. Antennas were installed in groups of two or threeper cellphone tower, so that together they provided a roughly 360-degree coveragearound the tower. From the original data set we derived a tower data set of 2,489unique locations. Because of missing on-air dates, seventy-three of these towerswere dropped, which left 2,416 towers included in the analysis. Figure 1 shows theexpansion of the Iraqi cellular network.
Dependent Variable and Controls
Our measure of insurgent violence includes attacks against Coalition and Iraqi gov-ernment forces, and is based on 193,264 “significant activity” (SIGACT) reports byCoalition forces. These reports capture a wide variety of information about “executedenemy attacks targeted against coalition, ISF [Iraqi Security Forces], civilians, Iraqiinfrastructure and government organizations” occurring between 4 February 2004and 24 February 2009.34 Unclassified data drawn from the MNF-I SIGACTS-IIIDatabase were provided to the Empirical Studies of Conflict (ESOC) project in2008 and 2009. These data provide the location, date, time, and type of attack inci-dents but do not include any information pertaining to the Coalition Force units in-volved, Coalition Force casualties, or battle damage incurred. We filter the data toremove attacks we can identify as being directed at civilians or other insurgentgroups, leaving us with a sample of 168,730 attack incidents.35 Depending on
33. We give a detailed account of this procedure and its practical details in online appendix A03, basedon information from MEC Gulf, a consulting firm that advised cellphone companies (including Zain) onnetwork expansion, as well as conversations with the chief technology officers of the major Iraqi cellularfirms.34. US Department of Defense 2008, 24. See also US Government Accountability Office 2007.35. We thank Lee Ewing for suggesting the filters we applied.
Is the Phone Mightier Than the Sword? 255

FIGURE 1. Expansion of the Zain Iraq network, 2004–2009
256 International Organization
level of analysis, we aggregate these events either at the level of districts or towercoverage areas.To estimate the population we employ the fine-grained population data from
LandScan aggregated to the district level.36 We estimated each district’s ethnic com-position by combining these data with precise ethnic maps of Iraq. After collectingevery map we could find of Iraq’s ethnic mix, we geo-referenced them and combinedthem with the population data to generate estimates of the proportion of each district’spopulation that fell into each of the three main groups (Sunni, Shia, Kurd). We codeddistricts as mixed if no ethnic group had more than 66 percent of the population, oth-erwise the district was coded as belonging to its dominant ethnic group. There werelarge population movements during the war, but the sectarian changes were concen-trated in Baghdad and there they occurred mostly neighborhood-to-neighborhood, atsmaller geographic units than we are using.
Identification Strategy
Examining the impacts of coverage at both levels of geographic aggregation is import-ant for two reasons. First, because we cannot test the hypothesized mechanisms ofinformation sharing directly, we can use results at multiple levels of geographic ag-gregation to narrow down the mechanisms at work. Second, this approach is criticalfor assessing the policy relevance of the results. Results for smaller geographic unitshave ambiguous implications because coverage could reduce violence in small areasby reducing overall insurgent capacity, or by pushing insurgents to conduct attackselsewhere (spatial displacement). We therefore conduct our analysis at two levelsof analysis, the district and the tower level.
District-level Empirical Approach. At the district level we employ a standardpanel data approach that is justified to the extent that we believe that controllingfor factors such as the number of preexisting towers in a district, or time and spacefixed-effects, will account for core drivers of network expansion that are also correl-ated with violence.37 We might, for example, be concerned that expansion of thenetwork is influenced by economic activity, which appears to be positively correlatedwith insurgent violence in Iraq,38 and so want to estimate the impact of coverage onviolence in first-differences to account for unit-specific trends.39 So how viable is thisapproach?
36. Oak Ridge National Laboratory 2008.37. Online appendix Table A04 shows descriptive statistics for the district-level data, which includes
only the sixty-three districts in which Zain operated during the period of analysis.38. Berman et al. 2011.39. Formally, we can correctly identify the causal effect of network expansion if the treatment (month-to-
month changes in the network) is independent of the outcome (insurgent violence) conditional on controls.
Is the Phone Mightier Than the Sword? 257

Givenwhatwe know about how the networkwas built,40 it is extremely unlikely thatmonth-to-month variation in violence affected the network’s construction. In num-erous conversations with those who built the network, nobody reported majordesign changes being made in response to existing or anticipated insurgent violence.Site acquisition teams were reportedly able to build towers even in the context of dif-ficult security situations such as Fallujah in 2004 and Ramadi in 2006. The teamswould typically enter into long-term contracts with community members to pay forsite rental, generator fueling, and site security, as well as training local engineers toprovide these services. Where possible, they worked through local elites to identifythe personnel who could be entrusted with these jobs. This strategy meant that oncemarketing had identified an area for network expansion, teams were able to move ef-fectively even in areas with high violence.However, many factors orthogonal to violence clearly did influence tower con-
struction, often in ways that lead us to believe the month-to-month timing had alarge random component. Towers were delayed because of unpredictable decisionsby government officials, difficulties in identifying whether a potential lessor actuallyheld title to the desired site, and disputes that arose once a site had been selectedbecause the value of the lease and servicing contracts drew interested parties tomake claims to land. Given these risks, the major firms employed what they describedas a “scattershot” approach in which they would try to secure title to all of the sites intheir expansion plan as soon as site selection was complete. As a practical matter, thismeant they often built out in a different order than the marketing or service provisionpriorities alone would have dictated.The variability in the rate of new tower construction highlights two patterns.41
First, there is tremendous month-to-month variation in the rate of new tower introduc-tion, both within periods of high violence and during periods of peace. Second, thereappears to be some correlation between extremely high violence and low tower intro-duction in a few places (Al-Muqdadiyah in Baghdad in 2007 for example), and na-tionally from August 2006 to July 2007. Adequately controlling for broad seculartrends is therefore key to estimating the effect of towers on violence.To conduct a more direct test of whether tower construction at the district level was
consistently influenced by violence trends, we plot the average date of tower intro-duction within a district in a given year on the levels of violence in (1) the last sixmonths of violence in the previous year and (2) the first six months of violence ina given year. If tower construction was delayed by levels of violence at the end ofthe previous year, which made it harder to adjudicate titles, that would have led toa positive slope as the average date of introduction was pushed back. If towerswere introduced in ways that avoided violent districts, we should see a positiveslope for the second plot because tower construction teams avoid highly violentplaces and so delay construction.
40. Described in online appendix A03.41. This variability is shown in online appendix Figures A05 and A06.
258 International Organization

FIGURE 2. Relationship between violence and tower construction at district/month
Is the Phone Mightier Than the Sword? 259

Neither was the case. Figure 2 shows that there is no consistent pattern across yearsat the district level. The top panel shows the relationship between levels of violence inthe last six months of a year (plotted on the y-axis) and the average date of towerintroduction in the next year (plotted on the x-axis). The bottom panel shows the re-lationship across years between levels of violence in the first six months of a year(plotted on the y-axis) and the mean date of tower introduction (plotted on thebottom panel). Only one of the bivariate correlations shown in the figure is statisti-cally significant at the 95 percent level (the relationship between average date oftower introduction and violence in the direst six months of the current year), andthat one is in the opposite of the expected direction. All these correlations becomesubstantively small and statistically insignificant when the years are pooled orwhen sect fixed-effects are added to account for the average differences betweenpurely Sunni regions where the nationalist insurgency dominated, and mixedregions that faced both a nationalist insurgency and a sectarian civil war.42
Our core specification at the district level is therefore a first-differences approach,
ni,tþ1 � ni,t ¼ αþ β1(towersi,t � towersi,t�1)þ fi þ δt þ εi,t ð1Þ
where fi is a district fixed-effect and δt is a time fixed-effect. We lag the difference intower construction by one month to prevent simultaneity bias.43
Importantly, to provide an unbiased estimate of the impact of cellphone coverageon violence the requirement for this approach is not that we control for all otherfactors that could affect violence. Rather, it is that the fixed-effects control forthose factors that are also correlated with both changes in the number of towersand changes in levels of violence. Based on what we know about the process of ex-panding the network, none of the factors affecting the month-to-month timing of theintroduction of towers (for example, the availability of clean titles to desired loca-tions) are likely to vary in ways not accounted for by time and space fixed-effects.44 Figure 2 provides strong evidence that they did not and we will showthat our results are robust to the inclusion of a broad range of time and spacefixed-effects. More importantly, the core results pass both geographic and temporalplacebo tests, providing confidence that the results are not driven by district-specific
42. A similar plot for the violence in the last six months of the current year is shown in online appendixFigure A07. Results of regressions pooling across years and adding controls to account for differencesbetween them are shown in online appendix Table A08.43. We believe the first-differences specification is the right one in this application—as opposed to es-
timating the model in levels with a unit fixed-effect—because we are more concerned with controlling forunit-specific trends in potential confounders than in unit-specific means. The war followed very differenttrajectories in each district: see, for example, Figure A05 in the online appendix; Fig. 1 in Berman, Shapiro,Felter 2011; or Fig. 2 and suppl. Fig. 4 in Biddle, Friedman, and Shapiro 2012. As a general matter, vio-lence in these districts did not vary around some mean for most of the war. Most districts saw a strongupward trend until sometime in 2006 or 2007 and then a strong downward trend.44. As we will discuss, online appendix A12 checks for the possibility that past sectarian violence is an
omitted variable impacting both the difficulty of obtaining title and trends in violence, finding no evidencethat it is.
260 International Organization

trends or by region-specific omitted variables. We also control for Coalition forcelevels because one might imagine their presence facilitated both tower introductionand changes in violence.
Tower-level Empirical Approach. For our tower-level analysis, we require ap-proximations of the towers’ coverage areas. We approximate the coverage of individ-ual towers by a circular area. Depending on whether a tower is located in an urban orrural area, we assign a short radius or a long radius. In conversations with electricalengineers we determined radii of four and twelve kilometers to be good first-orderapproximations of the coverage areas given the equipment used on the towers andtheir spacing, respectively, but we also conduct robustness checks with alternativeones.45 Estimating more precise coverage areas entails substantial complicationsand so for purposes of this paper we restrict ourselves to approximating coverage.The key to our tower-level approach is that some towers simply enhance service
that was already available, while other towers extend service into new areas. If vio-lence declines because towers are introduced, and not because of some omitted var-iable driving introduction and violence, we should see that violence goes downaround towers that provide new coverage, but not around those that simplyenhance existing service. If, however, violence declines because of some omitted var-iable, say because the providers are good at anticipating where violence will drop, weshould see post-introduction declines in both areas.An effective way to implement this approach is to use a standard difference-in-dif-
ferences design where our estimate of the treatment effect is just E[(apost - apre) -(bpost - bpre)] where a is a vector of violence in towers that provide new coverageand b is the analogous vector for towers that simply deepen existing coverage.This logic gives us the following tower-level estimating equation:
ni,t ¼ β1postt þ β2(postt × newi)þ fi þ qt þ εi,t ð2Þwhere fi is a slice fixed-effect, qt is a quarter fixed-effect to control for secular trendsin the conflict, the postt variable is a dummy variable that takes a value of 1 aftertower introduction, and postt × newi is a dummy variable that takes a value of 1 innew coverage areas after towers are turned on. Since the threshold for what shouldconstitute a new coverage area is not obvious—Zain always sought some overlapso there are almost no entirely new areas—our core analysis shows what happensas we vary the threshold for being a “new” tower from 10 percent new coverage to90 percent. The key coefficient to focus on is β2, which tells us how much thetrend around towers that provide substantial new coverage differs from the trendaround similar towers that extend existing coverage.
45. Precise coverage estimates do not exist for Iraq and all major modeling software requires substantialinput we have not been able to get from Zain. The twelve kilometer and four kilometer data are based on anextensive effort to precisely model Zain’s coverage with colleagues in electrical engineering, ProfessorMung Chiang and Dr. Haris Kremo. Details available on request.
Is the Phone Mightier Than the Sword? 261
Of the 1,859 coverage areas created by towers established between 14 June 2004and 26 October 2008, 1,787 areas experienced at least one violence incident in ourdata.46 These are the slices for which we have eight full fifteen-day periods of vio-lence data (120 days) before and after the towers were established. Towers reinforc-ing existing coverage typically serve larger populations and experience more totalviolence, though substantially less per capita. This is, of course, because few newtowers are needed in sparsely populated rural areas, while increasing adoption of cell-phones created demand for greater capacity in urban areas, requiring Zain tointroduce more towers and “split cells” to maintain service and maximize itsprofits. Under the identifying assumption for the difference-in-differences estimate,that differencing accounts for unit-specific characteristics, these time-invariant differ-ences in slices should not bias the estimation, though we will discuss how it mightand why we think it unlikely.
Results
To analyze the impact of expanding the cellphone network on violence, we firstanalyze district-level effects using standard panel data techniques, and provide aseries of robustness checks. Second, we briefly describe additional results byattack type and sectarian area, the details for which can be found in the online appen-dix. Third, we analyze the effect of introducing coverage over towers’ coverage areas.
District-level
At the district level, we find that adding additional cellphone coverage decreases vio-lence. Table 1 presents the core specification in first differences that nets out district-specific factors such as the anticipated long-term economic value of the district,which might have an impact on trends in both insurgent violence and the introductionof cellphones. The results in differences are smaller but remain statistically significantonce we control for national changes using time fixed-effects for the quarter-year(column 2) or month (column 3). Adding a district fixed-effect in addition to differ-encing (column 4) shows the results are robust to controlling for time-invariant dis-trict effects in addition to district-specific trends. Allowing the fixed-effects to varyacross the intersections of time and ethnic regions in columns (5 and 6) accountsfor the fact that trends in the war were quite heterogeneous across differentregions. The peak violence in Anbar province where Sunni tribes were fighting a na-tionalist insurgency, for example, came six months before violence peaked in
46. See online appendix Table A09 for descriptive statistics. Panels (A) and (B) provide key character-istics for the full sample; panels (C) and (D) do the same for the towers that have at least a 50 percentoverlap with existing towers; and panels (E) and (F) provide information for towers that cover morethan 50 percent new territory.
262 International Organization

TABLE 1. Impact of increased cellphone coverage on total attacks—district/month
(1) (2) (3) (4) (5) (6) (7)Dependent variable First difference of SIGACTS /100,000
Lagged first difference of tower count −0.0780 −0.0882* −0.115** −0.149** −0.0887* −0.0952* −0.188*(0.047) (0.049) (0.056) (0.070) (0.054) (0.055) (0.11)
Observations 3,654 3,654 3,654 3,654 3,654 3,654 3,654R-squared 0.01 0.01 0.07 0.07 0.03 0.06 0.07Time fixed-effects Half Quarter Month Month Sect X half Sect X quarter Province X quarterSpace fixed-effects No No No District No No No
Notes: Unit of analysis for violence is district/month, February 2004 to January 2009. Violent events based on data on MNF-I SIGACT-III database. Cell tower data provided by Zain Iraq.Population data from Oak Ridge National Laboratory (2008) gridded population data and World Food Programme surveys (2004, 2006, and 2008). Analysis restricted to sixty-three districtsin which Zain operated during period under study. Sect variable classifies districts as Sunni, Shia, Kurdish, or mixed. Robust standard errors, clustered at the district level in parentheses.Significance shown as *p < .10; **p < .05; ***p < .01.

Baghdad where Sunni and Shia militias were engaged in a sectarian conflict. Theresults remain substantively similar and statistically strong even when we include adistrict fixed-effect and net out the average violence in the each of the thirteen prov-inces each quarter (column 7), an extremely robust way to control for the geograph-ically specific trends in the conflict and in incentives to build towers.47
Overall, the introduction of new towers correlates with less violence no matter howwe handle secular trends in violence. In the most stringent model, column (7), a onestandard deviation increase in the number of towers in a district (1.8) predicts 1.1 lessattacks (−.188 × 3.27 × 1.8) in the following month, a 10 percent decrease from themean level of violence.48 In the online appendix49 we provide tests that suggestthe results are not driven by: (1) omitted variables driving trends in both violenceand tower construction; (2) the direct impact of violence on future tower construction;or (3) enhanced coverage making insurgents more effective, allowing them toconduct more lethal attacks (for example, shifting from a large number of small am-bushes to a small number of large complex attacks). Taken together, these checksprovide additional confidence that the combination of differencing and fixed-effects in Table 1 properly identify the causal impact of tower construction at the dis-trict-month level.Finally, as we show in the online appendix,50 the results become substantially
stronger when we restrict attention to district/months where the proportion of thepopulation covered was not yet high. This suggests that towers covering new geo-graphic territory, as opposed to those that simply enhance the capacity of thenetwork, are driving the result. We will see this pattern again in the tower-levelanalysis.
Variation in District-level Effects
The effect of expanded cellphone coverage on insurgent attacks varies in informativeways across different insurgent tactics and across sectarian areas. Different kinds ofinsurgent attacks have different sensitivities to the productivity of labor and to infor-mation sharing by the population. In particular, direct fire attacks (for example, am-bushes) typically involve multiple individuals coordinating their actions but they aresensitive to information sharing by the population, which can observe insurgentssetting up. Indirect fire attacks (for example, mortars) require less coordination andare less sensitive to information sharing as insurgents have great flexibility in choos-ing their firing position. IED attacks require much less coordination around the pointof attack than direct fire attacks and reveal less information to non-combatants, but
47. Online appendix Table A10 shows the results of the most stringent specifications (columns 4 and 7)are robust to the inclusion of the spatial lag of violence as an additional control.48. These effects fade after about two months, as online appendix Figure A11 shows.49. See online appendix Tables A12–A14.50. See online appendix Table A15.
264 International Organization
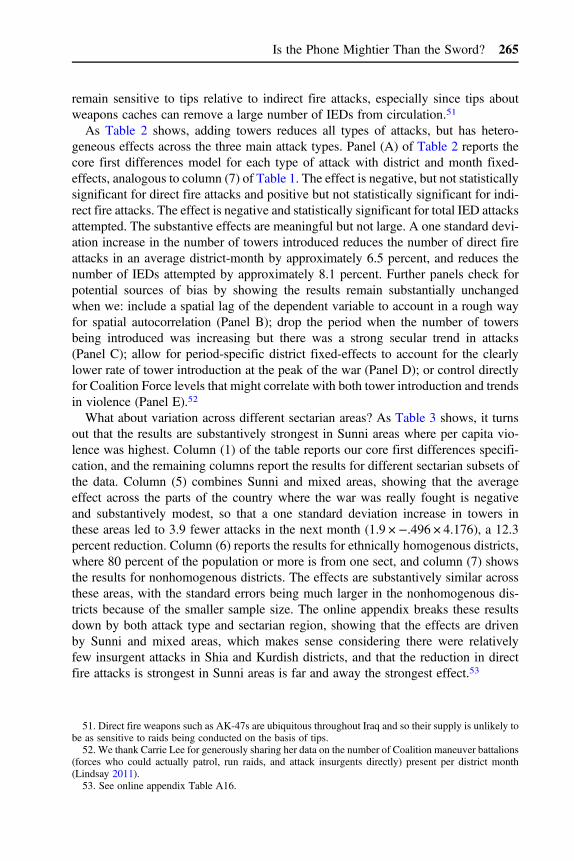
remain sensitive to tips relative to indirect fire attacks, especially since tips aboutweapons caches can remove a large number of IEDs from circulation.51
As Table 2 shows, adding towers reduces all types of attacks, but has hetero-geneous effects across the three main attack types. Panel (A) of Table 2 reports thecore first differences model for each type of attack with district and month fixed-effects, analogous to column (7) of Table 1. The effect is negative, but not statisticallysignificant for direct fire attacks and positive but not statistically significant for indi-rect fire attacks. The effect is negative and statistically significant for total IED attacksattempted. The substantive effects are meaningful but not large. A one standard devi-ation increase in the number of towers introduced reduces the number of direct fireattacks in an average district-month by approximately 6.5 percent, and reduces thenumber of IEDs attempted by approximately 8.1 percent. Further panels check forpotential sources of bias by showing the results remain substantially unchangedwhen we: include a spatial lag of the dependent variable to account in a rough wayfor spatial autocorrelation (Panel B); drop the period when the number of towersbeing introduced was increasing but there was a strong secular trend in attacks(Panel C); allow for period-specific district fixed-effects to account for the clearlylower rate of tower introduction at the peak of the war (Panel D); or control directlyfor Coalition Force levels that might correlate with both tower introduction and trendsin violence (Panel E).52
What about variation across different sectarian areas? As Table 3 shows, it turnsout that the results are substantively strongest in Sunni areas where per capita vio-lence was highest. Column (1) of the table reports our core first differences specifi-cation, and the remaining columns report the results for different sectarian subsets ofthe data. Column (5) combines Sunni and mixed areas, showing that the averageeffect across the parts of the country where the war was really fought is negativeand substantively modest, so that a one standard deviation increase in towers inthese areas led to 3.9 fewer attacks in the next month (1.9 ×−.496 × 4.176), a 12.3percent reduction. Column (6) reports the results for ethnically homogenous districts,where 80 percent of the population or more is from one sect, and column (7) showsthe results for nonhomogenous districts. The effects are substantively similar acrossthese areas, with the standard errors being much larger in the nonhomogenous dis-tricts because of the smaller sample size. The online appendix breaks these resultsdown by both attack type and sectarian region, showing that the effects are drivenby Sunni and mixed areas, which makes sense considering there were relativelyfew insurgent attacks in Shia and Kurdish districts, and that the reduction in directfire attacks is strongest in Sunni areas is far and away the strongest effect.53
51. Direct fire weapons such as AK-47s are ubiquitous throughout Iraq and so their supply is unlikely tobe as sensitive to raids being conducted on the basis of tips.52. We thank Carrie Lee for generously sharing her data on the number of Coalition maneuver battalions
(forces who could actually patrol, run raids, and attack insurgents directly) present per district month(Lindsay 2011).53. See online appendix Table A16.
Is the Phone Mightier Than the Sword? 265

These patterns imply first that the human-intelligence mechanism is key.Expanding coverage creates new collection channels for signals intelligence in allregions, but we expect the impact of providing people a safer way to share tips tobe larger in Sunni areas because (1) Coalition forces’ ability to run human sourceswould be weakest and (2) in-group policing by insurgents would be most effective.If the reader agrees with that expectation, then the fact that these areas see the largestproportional declines from introducing coverage should be suggestive. Second, thefact that the effects are of similar magnitude for direct fire and IED attacks (nearlyidentical if we drop 2008 from the analysis) makes it seem unlikely that expanding
TABLE 2. Impact of increased cellphone coverage by attack type
Dependent variable: Firstdifference of attacks/100,000
(1) All attacks (2) Direct fire (3) Indirectfire
(4) Total IEDattempts
(5) IEDs cleared/total attempts
Panel A: Full sampleLagged first difference of
tower count−0.149** −0.0449 0.00525 −0.065* −0.003
(0.070) (0.033) (0.0083) (0.037) (0.004)Observations 3,654 3,654 3,654 3,654 1,701R-squared 0.07 0.03 0.09 0.05 0.02
Panel B: Full sample with spatial lagLagged first difference of
tower count−0.140** −0.0443 0.0049 −0.056* −0.0027
(0.069) (0.033) (0.008) (0.032) (0.004)Spatial lag of dependent
variable0.0323*** 0.0106** 0.0022 0.0433*** −0.0326
(0.008) (0.0042) (0.004) (0.013) (0.030)Observations 3,654 3,654 3,654 3,654 1,701R-squared 0.12 0.04 0.09 0.12 0.02
Panel C: Without 2008Lagged first difference of
tower count−0.184** −0.0631* 0.0045 −0.075** −0.0006
(0.075) (0.037) (0.009) (0.036) (0.004)Observations 2,898 2,898 2,898 2,898 945R-squared 0.07 0.03 0.09 0.06 0.03
Panel D: With period-specific district fixed-effects (period breaks at August 2006 and June 2007)Lagged first difference of
tower count−0.149** −0.050 0.007 −0.062* −0.0032
(0.068) (0.034) (0.008) (0.034) (0.005)Observations 3,654 3,654 3,654 3,654 1,701R-squared 0.11 0.05 0.12 0.08 0.02
Panel E: Controlling for coalition force levelsLagged first difference of
tower count−0.150** −0.047 0.0051 −0.064* −0.0018
(0.070) (0.034) (0.0084) (0.033) (0.004)Observations 3,528 3,528 3,528 3,528 1,575R-squared 0.071 0.034 0.090 0.055 0.032
Notes: Unit of analysis for violence is district/month, February 2004 to January 2009. Violent events based on data onMNF-I SIGACT-III database. Cell tower data provided by Zain Iraq. Population data from Oak Ridge NationalLaboratory (2008) gridded population data and World Food Programme surveys (2004, 2006, and 2008). Coalition forcelevels from Lindsay 2011. Analysis restricted to sixty-three districts in which Zain operated during period under study.Robust standard errors, clustered at the district level in parentheses. All results include district and month fixed-effects.Significance shown as *p < .10; **p < .05; ***p < .01.
266 International Organization

TABLE 3. Impact of increased cellphone coverage by sectarian area
Dependent variable: First difference of attacks/100,000
(1) All areas (2) Mixed (3) Kurd/Shia (4) Sunni (5) Mixed/Sunni (6) Ethnicallyhomogenous
(7) Nonhomogeneous
Lagged first difference of tower count −0.149** −0.251 −0.0096 −2.259* −0.496* −0.195** −0.184(0.070) (0.19) (0.058) (1.07) (0.29) (0.083) (0.15)
Observations 3,654 580 2,436 638 1,218 2,784 870Number of districts 63 10 42 11 21 48 15R-squared 0.07 0.30 0.10 0.23 0.18 0.06 0.21
Notes: Unit of analysis for violence is district/month, February 2004 to January 2009. Violent events based on data on MNF-I SIGACT-III database. Cell tower data provided by Zain Iraq.Population data from Oak Ridge National Laboratory (2008) gridded population data and World Food Programme surveys (2004, 2006, and 2008). Sectarian data from ESOC developed byattributing LandScan data according to maps by Michael Izady made available through the Gulf 2000 website. Analysis restricted to sixty-three districts in which Zain operated during periodunder study. Robust standard errors, clustered at the district level in parentheses. All results include month and district fixed-effects. Significance shown as *p < .10; **p < .05; ***p < .01.
coverage substantially eased coordination. If it had, the effect on direct fire attacks,which require more coordination, should have been muted.
Tower-level Results
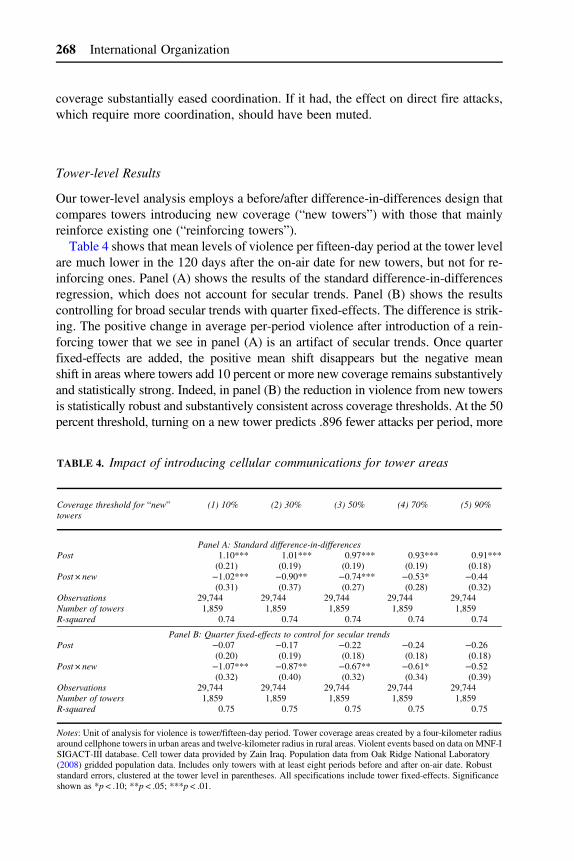
Our tower-level analysis employs a before/after difference-in-differences design thatcompares towers introducing new coverage (“new towers”) with those that mainlyreinforce existing one (“reinforcing towers”).Table 4 shows that mean levels of violence per fifteen-day period at the tower level
are much lower in the 120 days after the on-air date for new towers, but not for re-inforcing ones. Panel (A) shows the results of the standard difference-in-differencesregression, which does not account for secular trends. Panel (B) shows the resultscontrolling for broad secular trends with quarter fixed-effects. The difference is strik-ing. The positive change in average per-period violence after introduction of a rein-forcing tower that we see in panel (A) is an artifact of secular trends. Once quarterfixed-effects are added, the positive mean shift disappears but the negative meanshift in areas where towers add 10 percent or more new coverage remains substantivelyand statistically strong. Indeed, in panel (B) the reduction in violence from new towersis statistically robust and substantively consistent across coverage thresholds. At the 50percent threshold, turning on a new tower predicts .896 fewer attacks per period, more
TABLE 4. Impact of introducing cellular communications for tower areas
Coverage threshold for “new”towers
(1) 10% (2) 30% (3) 50% (4) 70% (5) 90%
Panel A: Standard difference-in-differencesPost 1.10*** 1.01*** 0.97*** 0.93*** 0.91***
(0.21) (0.19) (0.19) (0.19) (0.18)Post × new −1.02*** −0.90** −0.74*** −0.53* −0.44
(0.31) (0.37) (0.27) (0.28) (0.32)Observations 29,744 29,744 29,744 29,744 29,744Number of towers 1,859 1,859 1,859 1,859 1,859R-squared 0.74 0.74 0.74 0.74 0.74
Panel B: Quarter fixed-effects to control for secular trendsPost −0.07 −0.17 −0.22 −0.24 −0.26
(0.20) (0.19) (0.18) (0.18) (0.18)Post × new −1.07*** −0.87** −0.67** −0.61* −0.52
(0.32) (0.40) (0.32) (0.34) (0.39)Observations 29,744 29,744 29,744 29,744 29,744Number of towers 1,859 1,859 1,859 1,859 1,859R-squared 0.75 0.75 0.75 0.75 0.75
Notes: Unit of analysis for violence is tower/fifteen-day period. Tower coverage areas created by a four-kilometer radiusaround cellphone towers in urban areas and twelve-kilometer radius in rural areas. Violent events based on data on MNF-ISIGACT-III database. Cell tower data provided by Zain Iraq. Population data from Oak Ridge National Laboratory(2008) gridded population data. Includes only towers with at least eight periods before and after on-air date. Robuststandard errors, clustered at the tower level in parentheses. All specifications include tower fixed-effects. Significanceshown as *p < .10; **p < .05; ***p < .01.
268 International Organization

than half the mean level of violence in tower areas that provide 50 percent new cover-age. The online appendix repeats the analysis of Table 4 dropping coverage areas thatintroduce intermediate levels of new coverage, that is, towers that cover between 10percent new area and the threshold for being a “new” area in Panel A.54 The differ-ence-in-difference estimate is substantively larger and more statistically significant athigher coverage thresholds with this specification, as it should be when the treatmentcontrast is between towers that introduce substantial new coverage and those that intro-duce no new coverage.Once we net out the broad secular trends, it appears that introducing coverage is
violence reducing at the local level, but that building reinforcing towers is not.Table 5 shows that, just as with the district-level results, the effect is statisticallystrongest for IED attacks. The impact of coverage is positive for indirect fireattacks but statistically insignificant for more lenient interpretations of what consti-tutes new coverage. This is consistent with an information mechanism insofar as itindicates tactical substitution wherein insurgents seeking to attack newly coveredareas do so with methods that do not require that they physically go to those areas.The tower-level effects do vary a bit by period, though the introduction of new cov-
erage always reduces violence relative to overall trends in tower catchment areas thatdo not expand coverage.55 Panel A excludes towers turned on during the period in2006–2007 when tower construction slowed. Panel B drops towers built after2007. The results mirror those in the full sample because there is a clear negativeimpact of towers that provide at least 20 percent new coverage on IED attacks relativeto the change in tower catchments that provide less than that. Our ability to control forbroad secular trends in areas getting new towers is reduced when we exclude certainperiods (the mean shift after reinforcing tower introduction is statistically significantin many of these models), however the core result that violence drops more in newtower catchments (the interaction term) remains robust.The geographic nature of the spillovers from the introduction of new towers is also
informative. If introducing new coverage simply pushed insurgents to relocate, thenwe might see a near term increase in attacks in a ring around new coverage areas.Alternatively, if new coverage made it easier for counterinsurgents to acquire infor-mation that facilitated raids that disrupt insurgent activity over a larger area, then wemight expect violence to drop in the area adjacent to new towers, but not that adjacentto existing towers. The online appendix shows that insurgent violence drops faster inthe four-kilometer ring around new coverage areas than in similarly sized ringsaround preexisting coverage areas.56 Since insurgents in Iraq organized in unitsthat covered areas larger than immediate coverage areas this pattern is consistent
54. See online appendix Table A17.55. Online appendix Table A18 reports these results by attack type.56. See online appendix Table A17. Panel A reports the results from estimating equation (2) with vio-
lence in the ring around the coverage area as the LHS variable. Panel B reports the same specificationadding controls for the contemporaneous number of attacks within the main coverage area.
Is the Phone Mightier Than the Sword? 269

with our interpretation that the violence reduction engendered by turning on new cov-erage reflects an increased ability of counterinsurgents to act against militants.
For one to believe the tower-level results are driven by omitted variable bias, thecorrelation between future violence and the week-to-week timing of where towers areplaced would have to be massively stronger for new towers than for reinforcingtowers installed at the same time. That seems unlikely, particularly since the correla-tion between the proportion of new coverage a tower provides and total violence overthe 120 days after construction is negligible once district-specific violence has beentaken into account.57
Overall then, the tower-level results provide additional evidence that the human-intelligence mechanism is driving the panel data results. Introducing cellphone cov-erage has a clear localized impact in reducing the number of IEDs in new coverage
TABLE 5. Impact of increased cellphone coverage by attack type at different thresholds
Dependent variable (1) All attacks (2) Direct fire (3) Indirect fire (4) Total IED attempts
Panel A: Coverage threshold for “new” towers = 20%Post −0.15 −0.17 −0.021 −0.074
(0.19) (0.11) (0.042) (0.088)Post × new −0.89** −0.24 0.064 −0.42***
(0.37) (0.19) (0.050) (0.13)Observations 29,744 29,744 29,744 29,744R-squared 0.75 0.64 0.31 0.80
Panel B: Coverage threshold for “new” towers = 50%Post −0.22 −0.19* −0.025 −0.090
(0.18) (0.10) (0.041) (0.085)Post × new −0.67** −0.16 0.12** −0.45***
(0.32) (0.16) (0.056) (0.13)Observations 29,744 29,744 29,744 29,744R-squared 0.75 0.64 0.31 0.80
Panel C: Coverage threshold for “new” towers = 80%Post −0.25 −0.20** −0.024 −0.11
(0.18) (0.097) (0.040) (0.083)Post × new −0.58* −0.14 0.16*** −0.42***
(0.35) (0.17) (0.058) (0.15)Observations 29,744 29,744 29,744 29,744R-squared 0.75 0.64 0.31 0.80
Notes: Unit of analysis for violence is tower/fifteen-day period. Tower coverage areas created by a four-kilometer radiusaround cellphone towers in urban areas and twelve-kilometer radius in rural areas. Violent events based on data on MNF-ISIGACT-III database. Cell tower data provided by Zain Iraq. Population data from Oak Ridge National Laboratory(2008) gridded population data. Includes only towers with at least eight periods before and after on-air date. Robuststandard errors, clustered at the tower level in parentheses for 1,859 towers. All specifications include tower and quarterfixed-effects. Significance shown as *p < .10; **p < .05; ***p < .01.
57. In other words, controlling for violence at a level of geographic aggregation that is much larger thanthe tower-specific fixed-effects used in all the regressions in this section removes the correlation we wouldexpect if there were a strong relationship between violence and the amount of new coverage towers provide.Results available on request.
270 International Organization

areas but not in previously covered ones. This is particularly striking considering thatputting coverage over an area increases the range of IED fusing options that should, ifanything, decrease the proportion counterinsurgents can successfully neutralize.
Conclusion
This article presents the first systematic examination of cellular communications’effect on political violence using novel micro-level data from Iraq. We find that cell-phone network expansion reduced insurgent violence at both the district level andwithin specific tower coverage areas. Our conclusions have to remain somewhat cau-tious regarding the distinction between the human and the signals intelligence, sincedirect tests are impossible. However, we see that the reduction of violence applies atboth the district and the local level. Also, the effect seems to be particularly strong inSunni areas. Had the signals-intelligence mechanism been solely responsible for thedecrease in violence, we should have seen an effect at the district but not the locallevel, and there should not have been any differences between sectarian areas sinceit was possible to implement signals intelligence gathering across all of them.These results suggest (with some uncertainty of course) that cellphone coveragereduces insurgent violence largely because it enhances voluntary information flowfrom noncombatants to counterinsurgents by reducing the risks of informing. Weexpect similar results to hold wherever government security services (and theirallies) have a robust ability to act on the increase in human and signals intelligencethat expanded cellular coverage provides.These results speak to a number of literatures. First, they contribute to a growing
body of literature demonstrating the beneficial effects of expanding communicationsopportunities.58 Our findings suggest cellular communications may confer a range ofgovernance and stability advantages that have not previously been tested in this lit-erature. Second, they highlight the importance of civilian decisions that fall farbelow the threshold of actually participating in the conflict and are not subject to col-lective action problems. That such decisions can be critical suggests political sciencetheories may have greatly overestimated what it takes to dramatically change the dy-namics of conflicts.Third, the results also speak to debates about what kinds of ethnic concentrations
increase the risk of civil war,59 and to discussions of why insurgencies are more suc-cessful when operating from rural areas.60 The question at issue in these debates iswhether urban terrain makes it easier or harder for state security forces to controlviolent groups. The key argument on the “easier” side is that in urban areas manypeople necessarily have information on the insurgents, by virtue of simple population
58. See Jensen 2011; and Aker 2010.59. Weidmann 2009.60. See Kocher 2004; Bates 2008; and Staniland 2010.
Is the Phone Mightier Than the Sword? 271

density, which makes them acutely vulnerable to informants. By showing that ex-ogenous environmental changes that reduce the cost of informing leads to a clearand unambiguous reduction in insurgent violence, we provide solid empiricalgrounding for a mechanism discussed, but never tested, in this literature.Fourth, and perhaps most importantly, these results are highly relevant to ongoing
policy in all countries facing active insurgencies and the need to grow their wirelessinfrastructure. For countries such as Colombia, India, Pakistan, and Thailand, thepolicy debates typically hinge on how tightly regulated access to phones and SIMcards should be. For the international community the debates are about the extentto which the expansion of cellular communications should be subsidized. InAfghanistan, for example, there was an extended discussion about whether or notforeign governments and aid agencies should work with telecommunications firmsthat made compromises with local militants to protect their towers and staff, withsome arguing there should be little engagement so long as towers were beingturned off at night when the Taliban demanded. Our analysis suggests that in additionto their economic impact, cellular coverage can carry counterinsurgency benefits, atleast in a context with highly capable government forces. In such places, local gov-ernments and the international community may well want to subsidize the expansionof cellphone networks regardless of how the firms managing them interact with thelocals.
Supplementary Material
Replication data and an online appendix are available at http://dx.doi.org/10.1017/S0020818313000489.
References
Aker, Jenny C. 2010. Information from Markets Near and Far: Mobile Phones and Agricultural Markets inNiger. American Economic Journal: Applied Economics 2 (3):46–59.
Andreas, Peter. 2002. Transnational Crime and Economic Globalization. In Transnational OrganizedCrime and International Security. Business as Usual? edited by Mats R. Berdal and Monica Serrano,37–52. Boulder, CO: Lynne Rienner.
Arquilla, John, David Ronfeldt, and Michele Zanini. 1999. Networks, Netwar, and Information-AgeTerrorism. In Strategic Appraisal: The Changing Role of Information in Warfare, edited by ZalmayKhalilzad and John P. White, 75–112. Santa Monica, CA: RAND Corporation.
Bahney, Benjamin, Howard J. Shatz, Carroll Ganier, Renny McPherson, and Barbara Sude. 2011. AnEconomic Analysis of the Financial Records of al-Qa’ida in Iraq. Santa Monica, CA: RANDCorporation.
Bates, Robert H. 2008. When Things Fell Apart: State Failure in Late-Century Africa. New York:Cambridge University Press.
Bellows, John, and Edward Miguel. 2009. War and Local Collective Action in Sierra Leone. Journal ofPublic Economics 93 (11–12):1144–57
272 International Organization

Berman, Eli, Michael Callen, Joseph H. Felter, and Jacob N. Shapiro. 2011. Do Working Men Rebel?Insurgency and Unemployment in Iraq and the Philippines. Journal of Conflict Resolution 55 (4):496–528.
Berman, Eli, Joseph H. Felter, Jacob N. Shapiro, and Erin Troland. 2013. Modest, Secure, and Informed:Successful Development in Conflict Zones. NBER Working Paper 18674. Cambridge, MA: NationalBureau of Economic Research.
Berman, Eli, Jacob N. Shapiro, and Joseph H. Felter. 2011. Can Hearts and Minds Be Bought? TheEconomics of Counterinsurgency in Iraq. Journal of Political Economy 119 (4):766–819.
Biddle, Stephen, Jeffrey A. Friedman, and Jacob N. Shapiro. 2012. Testing the Surge: Why Did ViolenceDecline in Iraq in 2007? International Security 37 (1):7–40.
Condra, Luke N., and Jacob N. Shapiro. 2012. Who Takes the Blame? The Strategic Effects of CollateralDamage. American Journal of Political Science 56 (1):167–87.
Cordesman, Anthony. 2005. Iraq’s Evolving Insurgency. Washington, DC: Center for Strategic andInternational Studies.
Diamond, Larry. 2010. Liberation Technology. Journal of Democracy 21 (3):69–83.Garrett, R. Kelly, and Paul N. Edwards. 2007. Revolutionary Secrets: Technology’s Role in the SouthAfrican Anti-Apartheid Movement. Social Science Computer Review 25 (1):13–26.
Innes, Martin. 2006. Policing Uncertainty: Countering Terror Through Community Intelligence andDemocratic Policing. Annals of the American Academy of Political and Social Science 605 (1):222–41.
Jensen, Robert. 2011. The Digital Provide: Information (Technology), Market Performance, andWelfare inthe South Indian Fisheries Sector. Quarterly Journal of Economics 122 (3):879–924.
Kalyvas, Stathis N. 2006. The Logic of Violence in Civil War. New York: Cambridge University Press.Kocher, Matthew. 2004. Human Ecology and Civil War. University of Chicago. Unpublished manuscript,University of Chicago, Chicago.
Leahy, Kevin. 2005. The Impact of Technology on the Command, Control, and Organizational Structure ofInsurgent Groups. Master’s thesis, US Army Command and General Staff College, Fort Leavenworth,KS.
Lindsay, Carrie Lee. 2011. Iraq Order of Battle—District Level. Dataset. Stanford, CA: StanfordUniversity.
Lyall, Jason. 2010. Are Coethnics More Effective Counterinsurgents? Evidence from the Second ChechenWar. American Political Science Review 104 (1):1–20.
Muckian, Martin. 2006. Structural Vulnerabilities of Networked Insurgencies: Adapting to the NewAdversary. Parameters 36 (Winter):14–25.
Nunn, Nathan, and Leonard Wantchekon. 2011. The Slave Trade and the Origins of Mistrust in Africa.American Economic Review 101 (7):3221–52.
Oak Ridge National Laboratory. 2008. LandScan Global Population Database. Oak Ridge, TN. Availableat <http://www.ornl.gov/landscan/>. Accessed 14 June 2011.
Pierskalla, Jan H., and Florian M. Hollenbach. 2013. Technology and Collective Action: The Effect of CellPhone Coverage on Political Violence in Africa. American Political Science Review 107 (22):207–24.
Shirky, Clay. 2011. The Political Power of Social Media. Foreign Affairs 90 (1):28–41.Staniland, Paul. 2010. Cities on Fire: Social Mobilization, State Policy, and Urban Insurgency.Comparative Political Studies 43 (12):1623–49.
Strother, Tiffany. 2007. Cell Phone Use by Insurgents in Iraq. Shawnee, OK: Urban Warfare AnalysisCenter.
Sundberg, Ralph, and Erik Melander. 2013. Introducing the UCDP Georeferenced Event Dataset. Journalof Peace Research 50 (4):523–32.
US Department of Defense (DOD). 2008.Measuring Stability and Security in Iraq: March 2008 Report toCongress in Accordance with the Department of Defense Appropriations Act 2008. Washington, DC:Government Printing Office.
US Government Accountability Office (GAO). 2007. The Department of Defense’s Use of Solatia andCondolence Payments in Iraq and Afghanistan. Washington, DC: Government Printing Office.
Is the Phone Mightier Than the Sword? 273

Vanden Eynde, Oliver. 2011. Targets of Violence: Evidence from India’s Naxalite Conflict. Unpublishedmanuscript, Paris School of Economics, Paris.
Weidmann, Nils B. 2009. Geography as Motivation and Opportunity: Group Concentration and EthnicConflict. Journal of Conflict Resolution 53 (4):526–43.
World Food Programme (WFP). 2004. Baseline Food Security Analysis in Iraq. UN World FoodProgramme, Iraq Country Office.
———. 2006. Food Security and Vulnerability Analysis in Iraq. UN World Food Programme, IraqCountry Office.
———. 2008. Comprehensive Food Security and Vulnerability Analysis (CFSVA). UN World FoodProgramme, Iraq Country Office.
274 International Organization