international monetary fund kuwait - cbk.gov.k · pdf fileinternational monetary fund kuwait...
TRANSCRIPT

INTERNATIONAL MONETARY FUND
KUWAIT
Staff Report for the 2011 Article IV Consultation
Prepared by Staff Representatives for the 2011 Article IV Consultation with Kuwait
Approved by Alfred Kammer and David Marston
June 28, 2011
Discussions: Held in Kuwait during April 27–May 9, 2011 with Mr. Mustafa Al-Shamali, Minister of Finance; Mr. Mohammad Y. Al-Hashel, Deputy Governor of the Central Bank of Kuwait (CBK); other senior government officials; and private sector representatives.
Team: Ms. Khamis (Head); Ms. Beidas-Strom, Messrs. Charap, and Rodriguez (all MCD), and Ms. Oulidi (MCM).
Mission Focus: Near-term economic policies and a strategy for sustained economic growth; medium-term fiscal reform; and measures to maintain financial stability.
Previous Consultation: Concluded on July 16, 2010. The staff report and the PIN of the Executive Board’s discussion is available at: http://www.imf.org/external/pubs/cat/longres.aspx?sk=24092.0
Exchange arrangements: The exchange regime is classified as conventional peg to a basket. Kuwait has accepted the obligations of Article VIII, Sections 2, 3, and 4, and maintains an exchange system free of restrictions on payments and transfers for current international transactions, other than those notified to the Fund pursuant to Decision 144-(52/51).
Data: Data provision has shortcomings, but is broadly adequate for surveillance. Further progress regarding quality and timeliness is needed, particularly in the national accounts.
2
Contents Page
I. Context....................................................................................................................................3
II. Economic Outlook and Risks ................................................................................................5
III. Policy Discussions ...............................................................................................................7 A. Near-term Macroeconomic Policy Mix ....................................................................8 B. Strategy for Sustained Economic Growth ...............................................................11 C. Medium-term Fiscal Reform ...................................................................................13 D. Bolstering Financial Sector Monitoring and Regulation ........................................17 E. Other Issues .............................................................................................................20
IV. Staff Appraisal ...................................................................................................................21 Tables 1 Selected Economic Indicators, 2006–12 ...............................................................................24 2. Summary of Government Finance, 2005/06–2012/13 .........................................................25 3. Summary Balance of Payments, 2005–12 ...........................................................................27 4.Monetary Survey, 2005–12 ...................................................................................................28 5. Illustrative Macroeconomic Baseline Scenario, 2005–16 ...................................................29 6. Financial Soundness Indicators of the Banking Sector ........................................................30 Figures 1. Credit and Non-oil GDP, 2000–10 ........................................................................................3 2. Inflation Developments, 2001–10 ..........................................................................................4 3. GCC Stock Market Developments.........................................................................................7 4. Key Interest Rates in Kuwait and the U.S, Dec. 2007–Apr. 2011 .........................................9 5. REER and NEER, Apr. 2007–Jan. 2011................................................................................9 6. Allocation of Banks’ Credit Portofolio, 2010 ......................................................................17 7. Financial Sector Conditions, 2007–10 .................................................................................18 Boxes 1. Multipliers of Government Expenditure ................................................................................6 2. Labor Market Issues .............................................................................................................12 3. The Composition of Government Expenditure—A Case for Subsidy Reform?..................14 4. Fiscal Sustainability Analysis ..............................................................................................15 Appendixes I. Education, Health, and Infrastructure in Kuwait ..................................................................31 II. Stress Testing Methodology and Results ............................................................................33 III. FSAP Update 2010: Recommendations Implementation Status .......................................39 Annexes I. Fund Relations ......................................................................................................................42 II. Relations with the World Bank Group ................................................................................44 III. Statistical Issues .................................................................................................................49

3
-5
0
5
10
15
20
25
30
35
40
-5
0
5
10
15
20
25
30
35
40
2000 2001 2002 2003 2004 2005 2006 2007 2008 2009 2010
Figure 1. Credit and Non-oil GDP, 2000–10(Annual percent change)
Nominal credit
Real non-oil GDP
Sources: Central Bank of Kuwait and Fund staff estimates.
I. CONTEXT
1. Kuwait faced the global financial crisis from a position of strength. The government posted large saving rates during the pre-crisis boom years, which allowed it to accumulate large external buffers in the form of foreign assets and placed it in a relatively strong fiscal and external position to address the impact of the crisis. In this context, the government launched a four year development plan (DP) in early 2010—which emphasizes much needed investment in health, education, and infrastructure—with the objective of transforming Kuwait into a regional trade and financial center, while expanding the role of the private sector in the economy.1 Kuwaiti nationals account for 1.1 million, just over 30 percent of the country’s 3.6 million population and are predominantly employed in the public sector while the private sector is largely dependent on expatriate labor.
An expansionary fiscal position and moderate recovery in nonoil GDP growth
2. Activity in the non-oil sector has recovered. Real GDP growth in 2010 is estimated at 3.3 percent, comprising oil growth of 3.2 percent and non-oil growth of 3.4 percent. Activity has been driven mostly by government expenditure; credit growth was small (Figure 1), with lending growth of 3.3 percent to the productive sectors (industry, services, and trade) partially offset by a reduction in credit to the real estate and financial sectors. Similar to other countries in the region, the regional unrest has weighed down on equities prices, which declined by over 8 percent in 2011 through May 25. At the same time, Kuwait has increased its oil production (by 6 percent since December 2010) to assist in the effort to stabilize the global market.
1 Overall, the government’s cost of the plan is estimated at $55 billion (about 42 percent of 2010 GDP), which is expected to be matched by the private sector through public-private participation and the establishment of joint stock companies.

4
3. The fiscal stance has been expansionary. Government expenditure in FY2010/11—excluding energy-related subsidies and recapitalization of social security—is estimated to have increased by 21½ percent. Half of this growth was attributable to the recent Amiri grant, which offset the under-implementation of the budget.2 Higher international oil prices bolstered revenue with oil export receipts increasing by 19 percent. In 2010, fiscal and external surpluses are estimated at about 21 and 28 percent of GDP, respectively, compared to 28 and 24 percent in 2009. 4. Headline inflation increased in 2010, primarily due to higher international food prices. Average food inflation reached about 8.2 percent in 2010 (9.8 percent at end-April 2011), compared to 3.4 percent in 2009, but its impact on Kuwaiti citizens has been mitigated by the Amiri grant (Figure 2). Non-food inflation remains subdued at around 3.6 percent as of April 2011, reflecting moderate increases in rents.3 5. The relationship between the government and parliament remains tense. After a short-lived improvement in relations in 2010, tensions reignited in the latter part of the year and pressures on the government led to its resignation in late March 2011—the sixth cabinet resignation in the past five years. A new government was formed by the reappointed prime minister but disputes on economic and political issues have persisted and led to the resignation of the Deputy Prime Minister for Economic Affairs in mid-June. Several members of parliament also have voiced their intention to go ahead with earlier plans to question key ministers.
Banking sector strong but continued weaknesses in investment companies 6. Banks’ profitability and capitalization have improved but the Investment Companies (ICs) sector continued to post losses. Profits of local banks increased by 70 percent in 2010 and capitalization strengthened further. ICs continued to struggle and
2 The grant included a transfer of KD 1,000 (about $3,600) in cash to each Kuwaiti citizen (equivalent to almost 3 percent of 2010 GDP) and the provision of free essential food items from February 2011 through March 2012. 3 Recent international oil price increases did not have an impact on the CPI because Kuwait has generous oil-related subsidies (fuel, electricity, and water) and retail oil-related prices are not adjusted with international price movements.
0
2
4
6
8
10
12
14
0
2
4
6
8
10
12
14
Dec-2001
Dec-2002
Dec-2003
Dec-2004
Dec-2005
Dec-2006
Dec-2007
Dec-2008
Dec-2009
Dec-2010
Figure 2. Inflation Developments, 2001–10(12-month average rate)
Inflation (whole basket)
Food inflation
Nonfood inflation
Sources: Central Bank of Kuwait; and Fund staff estimates.

5
posted losses on average in 2010—although at a lower level than average losses in 2009—and the debt restructuring of some ICs remains unresolved.4
7. The performance of the nonfinancial corporate sector has improved in 2010, notwithstanding the continued drag by the real estate sector. The corporate sector’s net profits increased by 170 percent in 2010, but the real estate sector continued to post losses at levels similar to those in 2009.5 With the exception of the real estate sector, the debt service capacity of the corporate sector improved significantly, and corporates’ financial positions were strengthened by higher cash cushions. On average, corporates’ leverage and resilience to interest rate and income shocks have improved, although these improvements were not observed in the weaker corporates.6
II. ECONOMIC OUTLOOK AND RISKS
Stronger recovery in 2011 accompanied by larger fiscal and current account surpluses
8. The economy is expected to grow steadily in 2011 and over the medium term as the government implements the DP and global recovery supports demand for oil (Box 1). Real GDP is projected to increase by about 5 percent, reflecting an increase in oil GDP of about 3¼ percent and non-oil GDP of 6 percent, spurred by government spending.7 Inflation is projected to pick up in 2011 to about 6¼ percent, driven by imported inflation.
9. The fiscal and current account balances are expected to improve further in 2011. Despite projected growth of 12 percent in FY2011/12 expenditure, the fiscal balance is expected to improve by almost 5½ percentage points to 26 percent of GDP on account of higher oil revenue. The external current account balance is projected to increase to 33½ percent of GDP. Broad money is projected to increase by about 16 percent on account of the Amiri grant, with credit to the private sector rising by over 6 percent on account of private sector involvement in DP project implementation.
4 As of May 9, 2011, of the 97 investment companies, six companies have completed the restructuring of their debt and three companies have entered into debt restructuring negotiations. 5 While the trend in the residential and investment real estate market appears positive, the commercial real estate sector has excess supply. The Kuwait Investment Authority (KIA) announced in early 2011 the establishment of a KD1bn portfolio ($3.6bn or 2 percent of 2011 GDP) for investment in the local commercial real estate market, which might improve conditions in that market. 6 See Chapter 3 in the associated Selected Issues Paper. 7 Nonoil GDP growth is projected to trend slightly downwards in the medium-term following a similar pattern of government expenditure growth, which is expected to peak in 2011–12.

6
Internal and external factors pose risks to the outlook
10. The outlook is subject to domestic downside risks. The overarching risk would be associated with a significant shortfall in meeting DP spending targets. Red tape, bureaucratic hurdles, and political gridlock could delay project implementation, discourage private sector participation, and limit progress on necessary legislative reforms. Separately, with regard to ICs, a further deterioration in their balance sheets or delays in their restructuring could result in an increase in banking sector provisions. This scenario could weigh down on banks’ profitability.
Box 1. Kuwait: Multipliers of Government Expenditure 1/
How will the government’s Development Plan (DP) impact nonoil economic activity? This is an important question for Kuwait’s policymakers, given the broad spectrum of expenditures that the government is planning to undertake.
Econometric estimates conducted by staff suggests that increasing government expenditure by one Kuwaiti Dinar (in real terms) will produce an increase in (real) nonoil GDP in the range of 0.9 to 1.3 Kuwaiti Dinars (i.e., the expenditure multiplier is 0.9–1.3). Also, multipliers seem to vary by type of government expenditure: for instance, the multiplier of government capital expenditure is estimated at almost 2¾. Furthermore, the analyses suggest that most of the impact of government expenditure tends to take place in the implementation year, but there is some evidence that capital expenditure may impact nonoil GDP also after one year of its implementation.
Overall, the multipliers reported above are qualitatively consistent with those found in the literature of fiscal multipliers, but larger in quantitative terms. Four factors may explain these quantitative differences. First, Kuwait’s government expenditure has been mostly financed by oil revenues. Accordingly, the increase in expenditure has not been accompanied by an increase in taxes, which would reduce the net impact on aggregate demand. Second, Kuwait’s labor supply is highly elastic in light of its dependence on expatriate labor. This alleviates wage pressures, which could ultimately slow growth. Third, staff analyses focused on expenditure types that are expected to have a direct impact on aggregate demand (e.g., the analyses excluded transfers by the central government to the social security fund). This is likely to produce higher multipliers than when using broader measures of government expenditure. Fourth, staff analyses focused on a subsector of the economy—the nonoil sector—while other studies have focused on total GDP, which could result in a lower multiplier.
Interestingly, expenditure multipliers appear to be high despite the large share of imports in the economy. Staff analyses suggest that the high correlation between government expenditure and imports operates through higher nonoil GDP activity (i.e. government expenditure→nonoil GDP→imports) rather than direct leakage through imports. ___________
1/ This box is based on the results presented in Chapter 1 of the accompanying Selected Issues Paper.

7
11. Deterioration in the regional political and economic environment, particularly Bahrain and Egypt, also poses risks for Kuwait. Spillover channels would be mainly financial and include: (i) losses on Kuwaiti investment in the GCC and the MENA region, which could put further pressure on ICs; (ii) direct exposure of Kuwaiti banks to the region; and (iii) stricter access to and a higher cost of external funding for Kuwaiti entities in the short-term (Figure 3). The materialization of regional risks would likely be accompanied by an increase in oil prices, which would mitigate the impact of this scenario on Kuwait.
Sources: Bloomberg and Markit
Figure 3. GCC Financial Markets Developmentsthrough May 23, 2011
10
35
60
85
110
135
160
185
210
235
10
35
60
85
110
135
160
185
210
235
Dec-05 Dec-06 Dec-07 Dec-08 Dec-09 Dec-10
Bahrain
Kuwait
Oman
Qatar
Saudi Arabia
Dubai
Abu Dhabi
(GCC Stock Market Developments, Dec. 31 2005-May 25, 2011(Index, December 31, 2005=100)
0
100
200
300
400
500
600
700
800
900
1,000
0
100
200
300
400
500
600
700
800
900
1,000
Jun-07 Dec-07 Jun-08 Dec-08 Jun-09 Jan-10 Jul-10 Jan-11
Credit Default Swaps on 5-year Senior
Abu Dhabi
Bahrain
Qatar
Dubai
Saudi Arabia
Oman
12. The economic outlook could face downside risks from developments in oil prices and international financial markets. Kuwait has the financial strength to smooth out the impact of short-term oil price fluctuations on expenditure, and its fiscal and current account breakeven oil prices (at $51 and $35 per barrel, respectively) remain significantly lower than current prices. Nevertheless, if global recovery is derailed and results in sustained low oil prices, prospects for government expenditure in Kuwait might be affected.
13. The authorities noted that they were closely monitoring the impact of regional developments on the financial sector. The impact on investments and credit portfolios has been manageable. They did not expect any significant impact on the cost of and access to external funding, citing adequate capacity by investors to differentiate risks.
III. POLICY DISCUSSIONS
14. The discussions focused on near- and medium-term economic and financial policies. The main issues centered on a strategy for sustained economic growth; medium-term fiscal reform; near-term economic policies; and measures to maintain financial stability.

8
A. Near-term Macroeconomic Policy Mix
15. The projected continued fiscal stimulus is expected to support recovery in the non-oil sector but should be moderated if signs of overheating emerge. The non-oil fiscal deficit is estimated to have increased by close to 6½ percentage points in FY2010/11 with a projected decrease of 1 percentage point in FY2011/12.8 The planned increase in capital expenditure and associated purchases of goods and services should have a strong contemporaneous impact on nonoil growth due to high fiscal multipliers (Box 1).9 Capital spending would also support medium- and long-term diversification efforts by addressing infrastructure needs and strengthening expenditure on health and education. Continued fiscal stimulus is appropriate at this juncture in light of modest nonoil GDP recovery in 2010, weak private sector investment, and moderate non-food inflationary pressures.10 Nevertheless, expenditure should be moderated if signs of overheating emerge, particularly in housing services, notably rents.11 Staff welcomes progress made toward the establishment of a macro-fiscal unit at the Ministry of Finance and plans to move to performance-based budgeting. 16. Monetary policy is expected to remain accommodative, reflecting the basket peg and low global interest rates. During the past year the CBK adjusted its policy rates in line with domestic credit conditions and low global interest rates and significant public sector deposits were maintained in the banking system, which have boosted liquidity (Figure 4).12 Exchange rate movements could have some role in offsetting the pass-through of commodity price increases, although this is limited by the presumed large weight of the U.S. dollar in the currency basket (Figure 5).
8 The non-oil fiscal balance used here excludes investment income, pension recapitalization, and oil-related subsidies. The non-oil deficit is estimated at over 54½ percent and 53 percent in FY2010/11 and FY2011/12, respectively, compared to approximately 49 percent in the years preceding the crisis (FY2005/06 to FY2007/08). 9 Staff estimates that the impact on growth of the recent household package, which is largely in the form of direct cash transfers, is likely to be limited as a large part is likely to be saved. 10 Domestic inflation is projected to trend upward as recovery takes hold, but is likely to remain low in light of excess supply in the commercial real estate sector, the expected increase in the supply of housing units, and the high elasticity of the labor market. Oil-related subsidies contribute to containing nonfood and nonfuel inflation to the extent that they contain the price of transportation and electricity and thereby the price of goods and services. 11 At this point, nonoil GDP is still estimated to be below potential. The accompanying regional background paper includes an estimation of the output gap for Kuwait and also a discussion of the caveats of output gap estimation for GCC countries. 12 In a 2009 study on GCC monetary policy, Bova and Senhadji find that Kuwait followed the U.S. monetary policy less closely than the other GCG countries. They note that the currency basket allowed for more flexibility in the exchange rate and in monetary policy. The extent of divergence from U.S. monetary policy within the GCC in general was found to be higher after the recent global crisis, and interest rate adjustments took longer time.

9
Figure 5. Kuwait: REER and NEER, Apr. 2007–Jan. 2011(April 2007=100)
Sources: Country authorities; and Fund staff estimates.
90
95
100
105
110
115
120
125
130
90
95
100
105
110
115
120
125
130
Apr-07 Jan-08 Oct-08 Jul-09 Apr-10 Jan-11
REER
GCC average (excl. Kuwait)
Kuwait
90
95
100
105
110
115
120
125
130
90
95
100
105
110
115
120
125
130
Apr-07 Jan-08 Oct-08 Jul-09 Apr-10 Jan-11
NEER
GCC average (excl. Kuwait)
Kuwait
17. Macroprudential policies are of particular importance in Kuwait. While fiscal policy should be the first line of defense to manage the financial cycle that is typically associated with the oil cycle, macroprudential policies are essential to dampen cyclical fluctuations in credit and to maintain financial stability (see Chapter 4 in the associated Selected Issues Paper).
18. Assessment of the real exchange rate suggests that the dinar is broadly in line with fundamentals. The equilibrium real exchange rate approach suggests that the dinar is undervalued in the range of 0–10 percent, on the basis of both annual and high frequency estimation methods. The macrobalance approach suggests a medium-term current account surplus norm in the range of 32 to 42 percent of GDP, implying either an undervaluation of 4 percent or an overvaluation of 17 percent. The external sustainability approach (using a constant per capita annuity rule), which is very sensitive to assumed parameters, suggests
0.0
0.5
1.0
1.5
2.0
2.5
3.0
3.5
4.0
4.5
0.0
0.5
1.0
1.5
2.0
2.5
3.0
3.5
4.0
4.5
Dec-07 Apr-08 Aug-08 Dec-08 Apr-09 Aug-09 Dec-09 Apr-10 Aug-10 Dec-10 Apr-11
1-month Interbank Rate
KWD 1-month Intervention (absorption) Rate
USD Fed Funds Rate
Figure 4. Key Interest Rates in Kuwait and the U.S., Dec. 2007–Apr. 2011(In percent per annum)
Source: Haver and Central Bank of Kuwait.

10
that the real exchange rate is overvalued by 12 percent. While the different approaches produce mixed results—the misalignment ranges from an overvaluation of 17 percent to an undervaluation of 10 percent—the average across the three approaches indicate an overvaluation of just 4½ percent. On balance, the estimates indicate that the real exchange rate is broadly in line with fundamentals. Subdued domestic inflation and the lack of pressure on the currency forward markets support this assessment.13
ES 3
Underlying current account (A) 5 34.1 34.1 34.1 … …
Equilibrium current account (B) 42.2 32.1 39.7 … …
Difference (A-B) -8.1 2.0 -5.6 … …
Percentage of ER overvaluation (-)/undervaluation (+) -17.4 4.4 -12.0 9.9 0.3
1 Current account figures are in percent of GDP. Overvaluation/undervaluation calculations are in percent.2 Macro balance approach. Uses the CGER coefficients as reestimated for oil-exporters by Bems and
de Carvalho Filho (2009–first column) and Beidas-Strom and Cashin (forthcoming--second column).3 External sustainability approach. The equilibrium current account delivers a constant real annuity
(third column) after oil exports are exhausted. 4 Equilibrium real exchange rate approach. Based two approaches: an annual method (fourth column)
of the cointegration relationship between the real exchange rate and key fundamentals (terms of trade,
investment income, and government expenditure); and a high frequency method (fifth column)
of the cointegration between the real exchange rate and real oil prices. 5 2015 WEO projection.
Kuwait: Exchange Rate Assessment 1
MB 2 ERER4
19. The authorities noted that they did not expect inflation to pick up in the near term. In particular, there continues to be excess capacity in real estate and significant leakage of government expenditure occurs through the balance of payments. On policy instruments, they argued that the basket peg provided sufficient monetary policy flexibility and that they had in place a number of macroprudential tools that could be time-varying depending on conditions, but they were ready to consider others.14 They highlighted the sustained deviation of domestic interest rates from the U.S., both with respect to timing and the extent of interest rate reductions. While the authorities agreed with the findings of the exchange rate assessment, they noted that these assessments were highly sensitive to the assumed future oil price path and other parameters.
13 See Chapter 3 in the associated Selected Issues Paper.
14 The authorities noted that they had in place a loan-to-deposits ratio, liquidity ratio, higher risk weights for certain portfolios, and precautionary provisions. They added that they used credit growth limits during the boom period that preceded the global crisis.

11
B. Strategy for Sustained Economic Growth
20. The DP rightly puts weight on needed investment but its implementation should be managed carefully. The DP emphasizes much needed investment in health, education, and infrastructure, particularly the preparation of Kuwaiti nationals for private sector employment. In all three areas, Kuwait fares relatively low vis-à-vis international comparisons, taking into account its GDP per capita level (Appendix I). The DP is also expected to have an important impact on short- and medium-term growth, particularly in light of weak private sector activity. Staff noted that implementation weaknesses and distortions should be addressed to achieve the DP’s objectives.
DP implementation. The DP envisages significant participation of the private sector through the establishment of public shareholding companies. Effective DP implementation requires: (i) the enhancement of the business environment and development of streamlined procedures and processes and the needed legislative base for efficient and timely project screening and implementation;15 (ii) project design for developmental projects that provides appropriate internal rates of return while limiting fiscal risks within a proper framework for risk sharing between the public and private sectors; (iii) ensuring adequate outcomes by evaluating the viability of projects and conducting regular reviews of the productivity of spending, including achieving the project’s qualitative targets on health and education; (iv) that absorptive capacity and supply constraints are taken into account to avoid the resurgence of inflation; and (v) no buildup of excessive private sector leverage. Initiatives to diversify financing channels, including through the development of a corporate debt market, should be pursued.
Labor sector policies. A key objective of the DP is to increase the participation of
Kuwaitis in private sector activities but labor policies are generally inconsistent with this objective (Box 2). The government provides generous public sector compensation packages raising the reservation wage of nationals for private sector jobs, which undermines efforts by the government to promote private sector employment. The government also relies on administrative measures (minimum sectoral quotas for the participation of Kuwaiti nationals) which are largely ineffective but nevertheless create further distortions. Consistent labor sector policies, including containing the growth in the wage bill, would help get the incentives right for Kuwaiti nationals and limit recurring, excessive increases in current expenditure.
15 Kuwait consistently scores lower than the GCC average in measures of the business environment. Although it ranked relatively highly overall in the 2009 World Economic Forum’s Global Competitiveness index, Kuwait’s ranking (35th) was below the GCC average of 28. Kuwait received significantly lower scores in “Doing Business Indicators” with very weak performance in the areas of starting a business, trading across borders, and enforcing contracts.

12
Staff welcomes the initiative by the authorities to target better education outcomes and training.
Box 2. Kuwait—Labor Market Issues The private sector in Kuwait is largely dependent on expatriate labor. Available data indicate that the annual average growth rate of the Kuwait labor force was 4 percent in 2002–09, with 86 thousand Kuwaitis entering the labor market during the period. While close to 700 thousand jobs were created by the private sector in the past decade, Kuwaitis remain primarily employed in the public sector (83 percent) and constitute less than 10 percent of the private sector labor force. Expatriates are employed mostly in the private sector (64 percent) or as domestic workers (29 percent). Nevertheless, asignificant share of expatriate jobs is low-skilled, with 54 percent of expatriates assessed as having no qualification. As regards the Kuwaiti workforce, only 12 percent hold employment in technical or scientific professions. A key objective of the Development Plan is to increase the participation of Kuwaitis in private sector activities, but labor policies are generally inconsistent with this objective. This objective is supported by Law 19 of 2000, which sets out generous government-provided benefits to Kuwaitis employed in the private sector—including a social allowance, a living expense allowance, and a child allowance—to enhance the attractiveness of private sector jobs. Nevertheless, the effectiveness of the Law is undermined by high and rising public sector wages and benefits. Moreover, the policy of “Kuwaitization” (minimum sectoral quotas for the participation of Kuwaiti nationals) is circumvented by employers, largely due to a skills mismatch and high reservation wages.
0
1
2
3
4
0
20
40
60
80
100
120
2002 2003 2004 2005 2006 2007 2008
Population Development(2002 - 2008)
Nationals (% of total) Non nationals (% of total)
Total Population (mln - RHS)
Source: Supreme Council for Planning and Development.
0
200
400
600
800
1,00
1,20
1,40
0
200
400
600
800
1,000
1,200
1,400
Private Public Private Public Private Public
Labor Force by Sector and Origin(Thousands of workers)
Kuwaiti
Expatriate
2002 20092005
Source:Country authorities.
13
21. The authorities were in broad agreement with staff’s assessment of the DP and its challenges, while noting that delays were inevitable in the first year of the DP implementation. They attributed delays to the lack of readiness of the legislative base and noted their intention to accelerate work on this front. They expected implementation performance to improve in the current fiscal year. The authorities acknowledged the need to address the growth of the wage bill, but noted that they did not expect any near-term reforms on this front. As regards the development of the debt market, they noted that a law that would allow sukuk issuance by government was currently under consideration by the Council of Ministers.
C. Medium-term Fiscal Reform
22. Medium-to-long-term fiscal reforms are essential to reduce distortions. Fiscal distortions in the form of large subsidies and the low contribution of nonoil revenue to the budget will likely be exacerbated as growth picks up. The cost of domestic subsidies, particularly those related to utilities (electricity and water) and fuel, will continue to increase as the economy expands (Box 3).16 Subsidies, low taxation, and rapid growth in current expenditure (including the public sector wage bill) imply high and inefficient transfers of oil resources to the nonoil economy.
23. Fiscal consolidation is required to achieve intergenerational equity in the consumption of oil wealth. While an assessment of long-term sustainability of fiscal policy that takes into account intergenerational equity is highly sensitive to the parameters involved in the calculation, staff estimates suggest that the government’s medium-term non-oil deficit is somewhat above its long-term sustainable value, and this gap is projected to widen over time (Box 4). Furthermore, current expenditures have expanded rapidly in recent years—largely on account of increases in wages, subsidies, and transfers—increasing breakeven prices for the fiscal and external balances and raising fiscal vulnerability to the volatility of oil prices.
16 Oil-related subsidies account for about 95 percent of subsidies, and they derive primarily from the sale of subsidized fuels for transportation and for production and distribution of electricity and water. Food subsidies cover a few basic products.

14
0
20
40
60
80
100
120
0
20
40
60
80
100
120
19
84
/85
19
86
/87
19
88
/89
19
90
/91
19
92
/93
19
94
/95
19
96
/97
19
98
/99
20
00
/01
20
02
/03
20
04
/05
20
06
/07
20
08
/09
20
10
/11
Total primary expenditure excl. recapitalization of pension fundOil-related subsidies/benefits
Government Primary Expenditure and Oil-related Subsidies/Benefits(Percent of nonoil GDP)
Box 3. Kuwait: The Composition of Government Expenditure—A Case for Subsidy Reform?
The size of government expenditure with respect to nonoil GDP has fluctuated substantially in Kuwait over the past three decades. Overall, a downward trend that started in 1992 has been reversed since FY2005/06. In FY2010/11 government expenditure was about 77 percent of nonoil GDP, just 1¼ percentage points below its 25-year average.
The rising trend in the share of government expenditure allocated to oil-related subsidies/benefits—which amounts for the bulk of total subsidies—is striking. Oil-related subsidies/benefits were estimated to be around 17¼ percent of nonoil GDP in FY2010/11, about 11½ percentage points above its 25-year average and almost eight percentage points above the FY1984/85 peak. Oil-related subsidies/benefits comprised one-fifth of government expenditure in FY2010/11. These subsidies tend to increase with economic growth and the associated higher consumption, population growth, and the increase in global oil prices—retail prices are fixed and are not revised frequently. The bulk of these subsidies goes to subsidizing the consumption of electricity and water.
While oil-related subsidies/benefits can be viewed as a mechanism for the sharing of oil wealth, they are largely untargeted and, as a result, increase inefficient consumption of utilities and/or disproportionally benefit high-income groups. Accordingly, a better targeting of subsidies/benefits and a reallocation of the expenditure envelope toward capital expenditure could go a long way in improving the efficiency and productivity of government expenditure.
___________
1/ For this box we focus on primary government expenditures (i.e., excluding interest payments) and remove payments for pension fund recapitalization. We also exclude the period related to the Iraqi invasion (i.e., FY1990/91 and 1991/92).

15
Box 4. Kuwait: Fiscal Sustainability Analysis
The analysis of long-term fiscal sustainability—broadly defined as the government’s capacity to provide a stable path of expenditure—provides a useful benchmark for oil exporting countries, which have to make fiscal policy decisions that take into account the future depletion of oil resources. While the results are quite sensitive to the assumptions of difficult-to-predict parameters such as future oil prices and population growth, it nonetheless provides useful guidance, and can be complemented with alternative scenarios to assess the robustness of the results. 1/
Fiscal sustainability analysis conducted by staff suggests that Kuwait’s nonoil deficit should be reduced in the medium-term to ensure long-term sustainability. In the baseline scenario (left panel), the non-oil fiscal deficit is estimated to be in equilibrium in FY2011/12, but around 3 percentage points of GDP over its equilibrium by 2016/17. Assuming a lower rate of population growth, the non-oil fiscal deficit remains below its equilibrium in the medium-term, but the margin between the two declines over time.
When assuming lower oil prices (right panel), the nonoil deficit becomes larger than its equilibrium by FY2011/12 indicating the need for earlier fiscal consolidation. Fiscal consolidation would be essential under this scenario, even in the case of lower population growth, as the projected nonoil deficit becomes higher than its low population growth equilibrium in the medium-term.
Fiscal Sustainability Scenarios, 1994/95–2015/16
0
10
20
30
40
50
60
0
10
20
30
40
50
60
1994/95 1997/98 2000/01 2003/04 2006/07 2009/10 2012/13 2015/16
Government Non-oil Deficit to GDP(In percent, baseline oil price scenario)
Actual/Projected
Equilibrium (baseline pop. growth )
Equilibrium(alternative pop. growth)
Note: The baseline calculations assume long-term values of the real rate of return of assets, inf lation, and population growth of Kuwaiti nationals of 4 percent, 2 percent, and 2 percent, respectively. Oil reserves are assumed to be depleted in 72 years and the oil price to reach $98.5 per barrel in 2016 and remain constant in real terms thereaf ter. The alternative calculation assumes long-term population growth of 1.4 percent (as forecasted for the whole population [i.e., nationals and expatriates] by the 2008 United Nations World Population Prospects for the period 2010-50).
Source: Kuwait Ministry of Finance and Fund Staf f estimates.
0
10
20
30
40
50
60
1994/95 1997/98 2000/01 2003/04 2006/07 2009/10 2012/13 2015/16
Government Non-oil Deficit to GDP(In percent, lower oil price scenario)
Actual/Projected
Equilibrium(baseline pop. growth)
Note: The lower oil price scenario assumes oil prices are 20 percent lower than in the scenario presented in the upper panel (which leaves the 2011 average at around $85).
Equilibrium(alternative pop. growth)
_________
1/ In this exercise, long-term sustainability assumes intergenerational equity by calculating a constant real per capita government expenditure path (and related nonoil deficit) that delivers a constant real per capita annuity to finance government expenditures after oil revenues are exhausted. The non-oil deficit calculations discussed above refer to the non-oil deficit excluding investment income.

16
24. Policy options for medium-to-long-term fiscal reforms include:
Reforms to the tax system. Staff welcomes the planned introduction of VAT in 2013 in conjunction with the planned GCC-wide VAT implementation. While the government is also considering the introduction of a comprehensive income tax system (personal and corporate), staff suggested that priority should be placed on the implementation of the latter in light of capacity constraints.
A gradual reduction of untargeted subsidies. The phased withdrawal of subsidies should be a high priority, complemented by efficient and well-targeted safety nets. The results of the recent census could form the basis for the establishment of such a system.
A fiscal rule would be useful for medium-term fiscal management. Because of the volatility of revenue and intergenerational equity considerations, the fiscal rule should yield a relatively high public savings rate. A robust fiscal anchor could consist of an expenditure ceiling that would require that windfall revenues are largely saved while allowing for wider fiscal deficits when oil revenues are below forecast.17 The fiscal framework could incorporate explicit “escape clauses” in the event of severe shocks.
25. The authorities were in broad agreement with the need to diversify revenue sources and reduce the growth in current expenditure. They noted that efforts to diversify budget revenues have already started; non-oil revenue was targeted to grow to KD 4 billion by the end of the DP period (FY2013/14) from KD 1.1 billion (6¼ percent of non-oil GDP) in FY2009/10, through adjustments to fees, customs, and taxation. VAT preparations were well underway and will be implemented jointly with the rest of the GCC countries, but there was growing uncertainty regarding the implementation date. A comprehensive income tax was scheduled to be implemented by end-FY2013/14. While there was no intention at this time to undertake subsidy reform, work is underway on improving bill collection and the repricing formula for utilities. On budget planning and performance, they noted that they planned to move to a performance based budgeting in eight years. The authorities acknowledged that there were downside risks to achieving their targets, largely due to potential delays on the legislative front.
17 An example of an expenditure rule is a cap on nominal or real expenditure growth consistent with a credible medium-term budget framework.
17
Trade15%
(15%)
Construction7%
(7%)
NBFIs11%
(12%)
Total Personal Facilities
34%(33%)
Real Estate26%
(26%)
Other7%
(7%)*
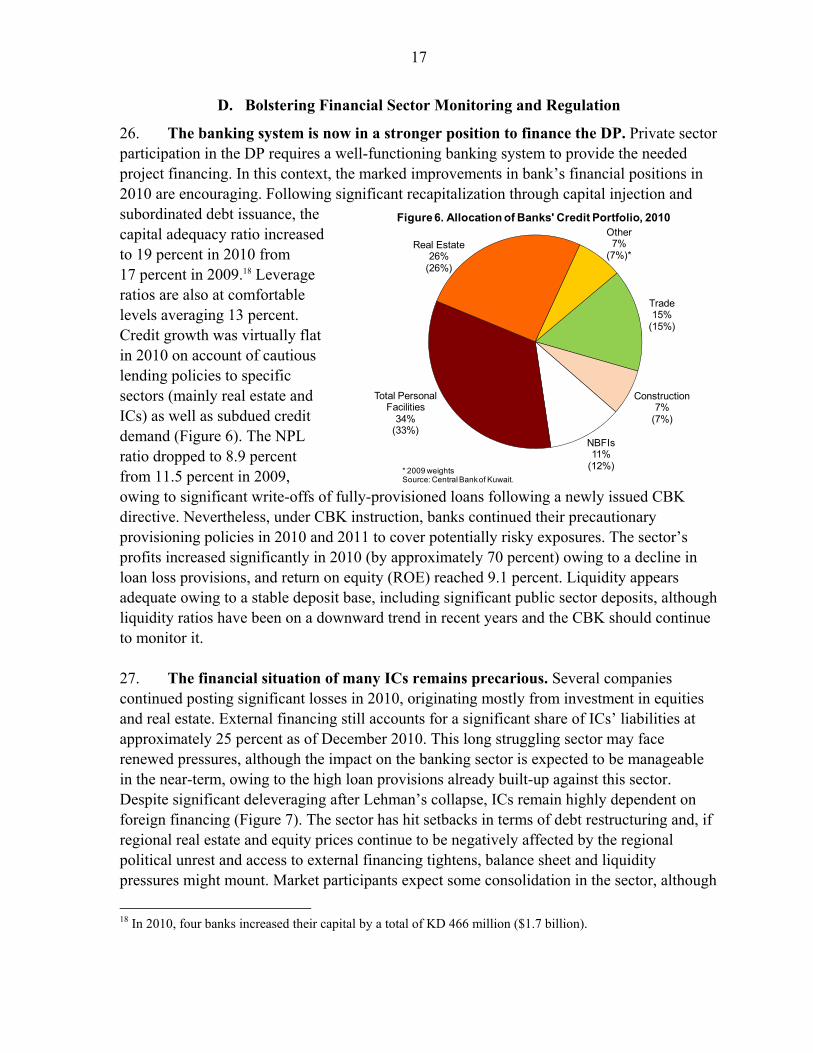
Figure 6. Allocation of Banks' Credit Portfolio, 2010
* 2009 weightsSource: Central Bank of Kuwait.
D. Bolstering Financial Sector Monitoring and Regulation
26. The banking system is now in a stronger position to finance the DP. Private sector participation in the DP requires a well-functioning banking system to provide the needed project financing. In this context, the marked improvements in bank’s financial positions in 2010 are encouraging. Following significant recapitalization through capital injection and subordinated debt issuance, the capital adequacy ratio increased to 19 percent in 2010 from 17 percent in 2009.18 Leverage ratios are also at comfortable levels averaging 13 percent. Credit growth was virtually flat in 2010 on account of cautious lending policies to specific sectors (mainly real estate and ICs) as well as subdued credit demand (Figure 6). The NPL ratio dropped to 8.9 percent from 11.5 percent in 2009, owing to significant write-offs of fully-provisioned loans following a newly issued CBK directive. Nevertheless, under CBK instruction, banks continued their precautionary provisioning policies in 2010 and 2011 to cover potentially risky exposures. The sector’s profits increased significantly in 2010 (by approximately 70 percent) owing to a decline in loan loss provisions, and return on equity (ROE) reached 9.1 percent. Liquidity appears adequate owing to a stable deposit base, including significant public sector deposits, although liquidity ratios have been on a downward trend in recent years and the CBK should continue to monitor it. 27. The financial situation of many ICs remains precarious. Several companies continued posting significant losses in 2010, originating mostly from investment in equities and real estate. External financing still accounts for a significant share of ICs’ liabilities at approximately 25 percent as of December 2010. This long struggling sector may face renewed pressures, although the impact on the banking sector is expected to be manageable in the near-term, owing to the high loan provisions already built-up against this sector. Despite significant deleveraging after Lehman’s collapse, ICs remain highly dependent on foreign financing (Figure 7). The sector has hit setbacks in terms of debt restructuring and, if regional real estate and equity prices continue to be negatively affected by the regional political unrest and access to external financing tightens, balance sheet and liquidity pressures might mount. Market participants expect some consolidation in the sector, although
18 In 2010, four banks increased their capital by a total of KD 466 million ($1.7 billion).

18
this could be limited by the prevalence of family business groups, which constrains the potential for mergers, and the absence of an efficient and speedy resolution framework and lack of financial expertise in the court system.
Figure 7. Kuwait: Financial Sector Conditions, 2007–10
Sources: Central Bank of Kuwait, Zawya, and Fund staff estimates.
1/ Data for nonfinancial corporates excludes Zain's revenues from the sale of its African subsidiaries.
0
4
8
12
16
20
0
4
8
12
16
20
2007 2008 2009 2010
CAR
NPLs
ROA
12
13
14
15
16
17
18
19
20
5
10
15
20
25
30
35
40
45
Dec-07 Sep-08 Jun-09 Mar-10 Dec-10
Financing f rom Local BanksForeign LiabilitiesOwn FundsTotal Liabilities (KWD billions, RHS)
10
12
14
16
18
20
35
38
41
44
47
50
Dec-07 Sep-08 Jun-09 Mar-10 Dec-10
(In percent of total assets)
Foreign Assets
Total Assets (KWD billions, RHS)
-1.0
-0.5
0.0
0.5
1.0
1.5
2.0
2.5
-1.0
-0.5
0.0
0.5
1.0
1.5
2.0
2.5
2007 2008 2009 2010 1/
(In KD billions)
Banks
Investment Companies
Nonf inancial Corporates
(In percent of total liabilities)(In percent)
While NPLs have been rising and profitability has been low, banks have
high capitalization ratios.
ICs are more vulnerable since they have a relatively high dependance on
foreign financing...
...are exposed to regional and global asset markets...
...and still have very low profitability.
19
28. Stress test results indicate that, while the banking sector could broadly withstand significant shocks, ICs remain vulnerable. Stress tests conducted by staff show improved results compared to 2009, owing to higher capitalization and liquidity buffers as well as large precautionary provisions (Appendix II).19 Under the most adverse scenario—which assumes a significant drop in oil and asset prices and protracted low growth over a year—no bank loses its entire capital despite a marked deterioration in the loan portfolio. The maximum recapitalization need estimated under this scenario to restore the CAR to the statutory 12 percent requirement, would not exceed 2 percent of GDP. Single factor stress test results still underscore the vulnerability of the banking sector to exposure to the real estate and equity markets but the recapitalization needs under the severe scenarios in these tests appear manageable. Liquidity stress test results also indicate that banks can broadly withstand a liquidity shock, although one bank becomes illiquid under the severe scenario. To this effect, the authorities should continue to ensure that banks hold adequate liquid assets to cushion against stressful events. ICs included in the stress test sample continue to show very limited capacity to withstand shocks.20 Under the severe scenario the capital of eight (out of eleven) ICs could be wiped out due to insufficient capital buffers and exposure to risky assets. 29. The authorities made significant progress in the implementation of the 2010 FSAP recommendations (Appendix III). New ICs regulations were issued by the CBK in June 2010, setting prudential limits on liquidity, leverage, and foreign exposure. The Capital Market Authority (CMA) has issued its full set of bylaws and is expected to assume its supervisory role in September 2011. A MoU between the CBK and CMA is currently being drafted to delineate their respective supervisory responsibilities over ICs and specify the coordination process. A core team has been set up in the CBK with the aim of strengthening macroprudential supervision and significant progress has been made in the identification and design of analytical tools, including a quarterly off-site surveillance report, stress tests, and an early warning system (EWS) drawing on micro and macro financial and economic data. Major improvements have also been noted in banking sector data collection and analysis and migration into a risk-based supervisory system. 30. Improvement in financial sector regulation and supervision are welcome, but further steps are warranted. The authorities should ensure the finalization of the MoU between the CBK and CMA in a manner that closes gaps and limits overlap to ensure efficient oversight architecture. Any legal impediments to the sharing of information between the two authorities (e.g., banking secrecy provisions) should be removed. Moreover, the CMA should ensure adequate staffing, both quantitatively and qualitatively, at a level
19 The 2010 FSAP methodology and assumptions were used in the stress test updates for comparability purposes. 20 The sample included 11 listed ICs with a 29 percent share of total ICs’ assets.

20
commensurate with the development stage of the financial sector and sophistication of the financial instruments. With regard to macroprudential supervision, the authorities could explore the establishment of an inter-agency financial stability committee for systemic risk monitoring and crisis management. In regard to ICs, the CBK should continue to monitor progress toward the 2012 deadline for compliance with the quantitative regulations of the CBK and ensure that companies are undertaking needed restructuring. In this connection, to facilitate efficient restructuring processes and exits, it is important to move expeditiously to establish a special resolution regime (SRR) for financial institutions.21 Special courts could also be considered to adjudicate the process in case of challenges.
31. The authorities started the establishment of their Anti-Money laundering and Combating the Financing of Terrorism (AML/CFT) framework in 2002. Nevertheless, the framework needs further strengthening in a number of areas, particularly the criminalization of the financing of terrorism, the structure and functions of the Financial Intelligence Unit, and the AML/CFT supervisory system. The authorities should draw upon the recommendations of the assessment report adopted in June 2011. As part of this process, a new AML/CFT Law, which complies with the Financial Action Task Force 40+9 recommendations, will need to be quickly adopted.
32. The authorities considered IC risk to be modest with minimal impact on banks. They noted that banks were now adequately provisioned against loans to ICs and could withstand further deterioration in this loan portfolio although such an event would be likely to affect banks’ profitability. They expected a need for additional provisioning in 2011 and the first half of 2012. They also acknowledged that the transfer of supervision of ICs from the CBK to the CMA presented a significant challenge, particularly since the CMA was at its early stages of inception and still lacked adequate staffing. They noted their preference to limit dual supervision, although that might not be possible in some cases. On the resolution framework, they noted that special clauses related to the resolution of financial institutions could be introduced as part of the planned amendment of the Commercial Law, rather than as a standalone law.
E. Other Issues
33. Progress has been made in improving Kuwait’s statistical system, but further work is needed. The CBK prepares and publishes comprehensive and timely monetary and financial statistics and has recently made significant progress in improving the compilation, coverage, and periodicity of the BOP data with the help of Fund TA, although IIP and external debt data are still provided with some lag. Following the change in the
21 The resolution framework will need to cater to the different nature of activities and the risk associated with them. For example, the resolution framework for ICs may focus on aspects of segregation of client’s assets, custody, and collateral.
21
organizational structure and leadership of the Central Statistical Office (CSO), the long lags in the compilation of CPI data have been eliminated. Preparation of national accounts at constant prices continues to be delayed, with the latest data covering 2007. The authorities are encouraged to provide the necessary financial and institutional support to the CSO to ensure that plans to improve the quality and frequency of dissemination of statistics in these areas are achieved.
IV. STAFF APPRAISAL
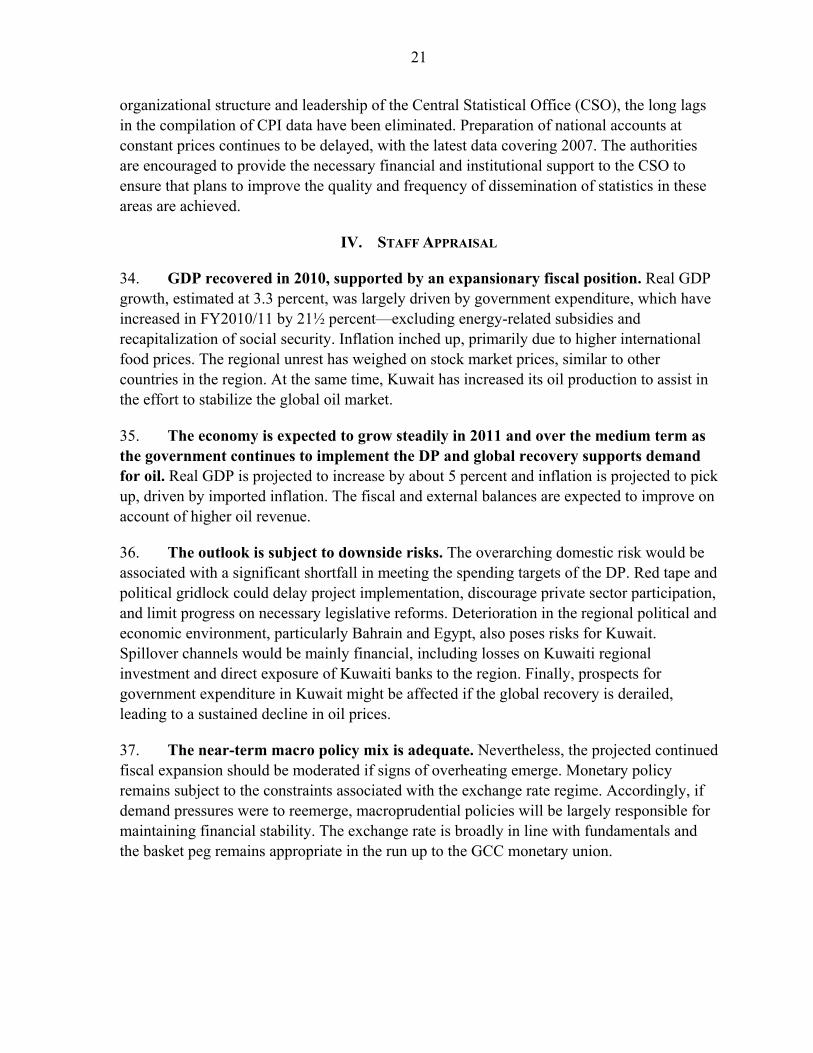
34. GDP recovered in 2010, supported by an expansionary fiscal position. Real GDP growth, estimated at 3.3 percent, was largely driven by government expenditure, which have increased in FY2010/11 by 21½ percent—excluding energy-related subsidies and recapitalization of social security. Inflation inched up, primarily due to higher international food prices. The regional unrest has weighed on stock market prices, similar to other countries in the region. At the same time, Kuwait has increased its oil production to assist in the effort to stabilize the global oil market.
35. The economy is expected to grow steadily in 2011 and over the medium term as the government continues to implement the DP and global recovery supports demand for oil. Real GDP is projected to increase by about 5 percent and inflation is projected to pick up, driven by imported inflation. The fiscal and external balances are expected to improve on account of higher oil revenue.
36. The outlook is subject to downside risks. The overarching domestic risk would be associated with a significant shortfall in meeting the spending targets of the DP. Red tape and political gridlock could delay project implementation, discourage private sector participation, and limit progress on necessary legislative reforms. Deterioration in the regional political and economic environment, particularly Bahrain and Egypt, also poses risks for Kuwait. Spillover channels would be mainly financial, including losses on Kuwaiti regional investment and direct exposure of Kuwaiti banks to the region. Finally, prospects for government expenditure in Kuwait might be affected if the global recovery is derailed, leading to a sustained decline in oil prices.
37. The near-term macro policy mix is adequate. Nevertheless, the projected continued fiscal expansion should be moderated if signs of overheating emerge. Monetary policy remains subject to the constraints associated with the exchange rate regime. Accordingly, if demand pressures were to reemerge, macroprudential policies will be largely responsible for maintaining financial stability. The exchange rate is broadly in line with fundamentals and the basket peg remains appropriate in the run up to the GCC monetary union.

22
38. DP implementation should be managed carefully. The DP rightly puts significant weight on much needed investment, with emphasis on preparing Kuwaiti nationals for private sector employment. For effective implementation of the DP, the authorities should enhance the business environment and develop supportive legislation; ensure the viability of projects and productivity of spending; take into account absorptive capacity and supply constraints to avoid the resurgence of inflation; and avoid buildup of excessive private sector leverage. The development of a corporate debt market should be pursued. Containing the growth in the public sector wage bill would be needed to get the incentives right for Kuwaiti nationals.
39. Medium-to-long-term fiscal reforms are essential to reduce distortions and ensure intergenerational equity in the distribution of oil wealth. Untargeted subsidies, low taxation, and rapid growth in current expenditure imply high and inefficient transfers of oil resources to the nonoil economy. Furthermore, the steady growth in current expenditures has raised the breakeven prices for the fiscal and external balances, increasing their vulnerability to the volatility of oil prices. As a result, the medium-term non-oil deficit is somewhat above its long-term sustainable value, and this gap is projected to widen over time. Medium-to-long-term reforms should include tax and subsidy reforms; a better targeting of subsidies/benefits and a reallocation of the expenditure envelope toward capital expenditure could go a long way in improving the efficiency and productivity of government expenditure. A fiscal rule would be useful for medium-term fiscal management.
40. The financial positions of banks improved markedly in 2010 but the financial situation of many investment companies (ICs) remains precarious. Stress tests conducted by staff indicate that the banking system could reasonably withstand significant credit and liquidity shocks, although bank liquidity should continue to be monitored closely. On the other hand, stress tests point to the ICs’ limited capacity to withstand adverse shocks. Several ICs continued to post losses in 2010 and, despite significant recent deleveraging, they remain highly dependent on foreign financing while hitting setbacks in terms of debt restructuring. If regional real estate and equity prices continue to be negatively affected by the regional political unrest and access to external financing tightens, balance sheet and liquidity pressures might mount. Banks are now adequately provisioned against loans to ICs and can withstand additional deterioration in this loan portfolio, but such an event is likely to weigh down on banks’ profitability. In this regard, the CBK should continue to monitor ICs’ progress toward the 2012 deadline for compliance with the quantitative regulations of the CBK and ensure that companies are undertaking needed restructuring. To facilitate efficient restructuring processes and exits, it is important to move expeditiously to establish a special resolution regime (SRR) for financial institutions. Special courts could also be considered to adjudicate the process in case of challenges.

23
41. The authorities made significant progress in the implementation of the 2010 FSAP update recommendations, but further steps are warranted. The MoU that is currently being drafted between the Central Bank of Kuwait and the newly established CMA should close gaps and limit overlap to ensure efficient oversight architecture, and any legal impediments to the sharing of information between the two authorities (e.g., banking secrecy provisions) should be removed. The CMA should ensure adequate staffing commensurate with the development stage of the financial sector. With regard to macroprudential supervision, the authorities could explore the establishment of an inter-agency financial stability committee for systemic risk monitoring and crisis management. Finally, a new AML/CFT Law, which complies with the Financial Action Task Force 40+9 recommendations, will need to be quickly adopted.
42. Progress has been made in improving Kuwait’s statistical system, but further work is needed. The authorities are encouraged to provide the necessary financial and institutional support to the CSO to ensure that plans to improve the quality and frequency of dissemination of statistics in these areas are achieved.
43. It is recommended that the next Article IV Consultation take place on a standard 12-month cycle.
24
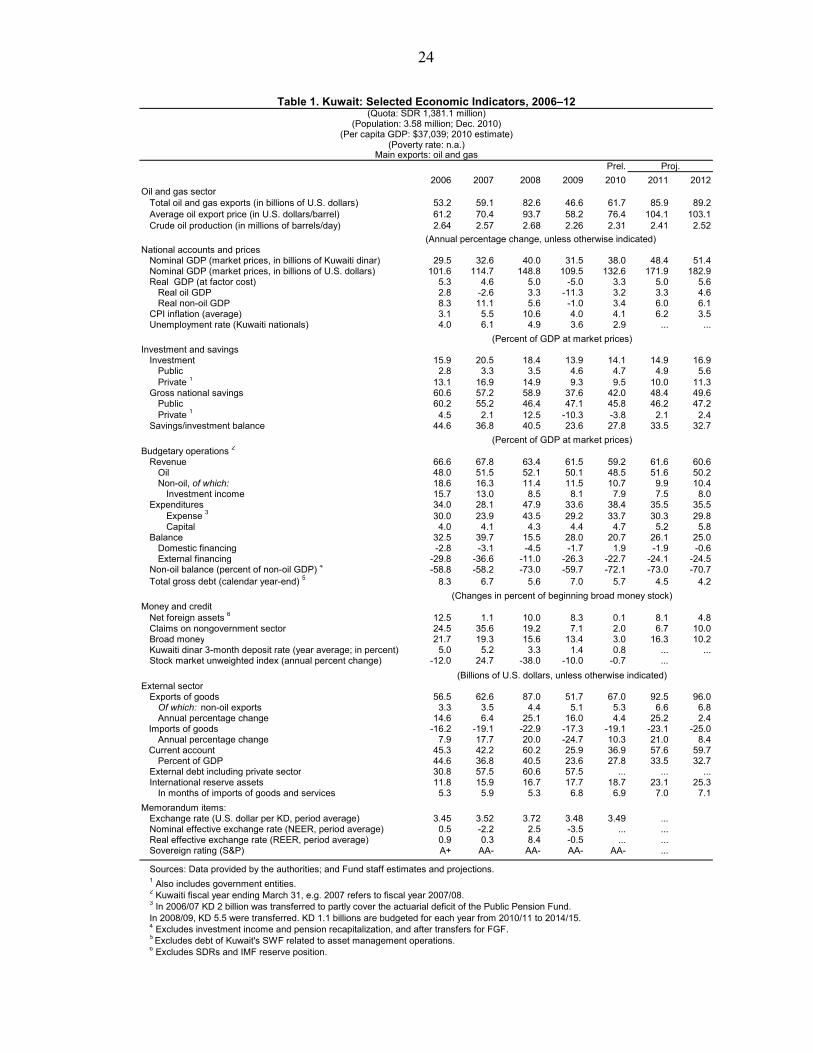
Prel. Proj.
2006 2007 2008 2009 2010 2011 2012Oil and gas sector
Total oil and gas exports (in billions of U.S. dollars) 53.2 59.1 82.6 46.6 61.7 85.9 89.2Average oil export price (in U.S. dollars/barrel) 61.2 70.4 93.7 58.2 76.4 104.1 103.1Crude oil production (in millions of barrels/day) 2.64 2.57 2.68 2.26 2.31 2.41 2.52
(Annual percentage change, unless otherwise indicated)National accounts and prices
Nominal GDP (market prices, in billions of Kuwaiti dinar) 29.5 32.6 40.0 31.5 38.0 48.4 51.4Nominal GDP (market prices, in billions of U.S. dollars) 101.6 114.7 148.8 109.5 132.6 171.9 182.9Real GDP (at factor cost) 5.3 4.6 5.0 -5.0 3.3 5.0 5.6
Real oil GDP 2.8 -2.6 3.3 -11.3 3.2 3.3 4.6Real non-oil GDP 8.3 11.1 5.6 -1.0 3.4 6.0 6.1
CPI inflation (average) 3.1 5.5 10.6 4.0 4.1 6.2 3.5Unemployment rate (Kuwaiti nationals) 4.0 6.1 4.9 3.6 2.9 ... ...
Investment and savingsInvestment 15.9 20.5 18.4 13.9 14.1 14.9 16.9
Public 2.8 3.3 3.5 4.6 4.7 4.9 5.6Private 1 13.1 16.9 14.9 9.3 9.5 10.0 11.3
Gross national savings 60.6 57.2 58.9 37.6 42.0 48.4 49.6Public 60.2 55.2 46.4 47.1 45.8 46.2 47.2Private 1 4.5 2.1 12.5 -10.3 -3.8 2.1 2.4
Savings/investment balance 44.6 36.8 40.5 23.6 27.8 33.5 32.7
Budgetary operations 2
Revenue 66.6 67.8 63.4 61.5 59.2 61.6 60.6Oil 48.0 51.5 52.1 50.1 48.5 51.6 50.2Non-oil, of which: 18.6 16.3 11.4 11.5 10.7 9.9 10.4
Investment income 15.7 13.0 8.5 8.1 7.9 7.5 8.0Expenditures 34.0 28.1 47.9 33.6 38.4 35.5 35.5
Expense 3 30.0 23.9 43.5 29.2 33.7 30.3 29.8Capital 4.0 4.1 4.3 4.4 4.7 5.2 5.8
Balance 32.5 39.7 15.5 28.0 20.7 26.1 25.0Domestic financing -2.8 -3.1 -4.5 -1.7 1.9 -1.9 -0.6External financing -29.8 -36.6 -11.0 -26.3 -22.7 -24.1 -24.5
Non-oil balance (percent of non-oil GDP) 4 -58.8 -58.2 -73.0 -59.7 -72.1 -73.0 -70.7Total gross debt (calendar year-end) 5 8.3 6.7 5.6 7.0 5.7 4.5 4.2
Money and creditNet foreign assets 6 12.5 1.1 10.0 8.3 0.1 8.1 4.8Claims on nongovernment sector 24.5 35.6 19.2 7.1 2.0 6.7 10.0Broad money 21.7 19.3 15.6 13.4 3.0 16.3 10.2Kuwaiti dinar 3-month deposit rate (year average; in percent) 5.0 5.2 3.3 1.4 0.8 ... ...Stock market unweighted index (annual percent change) -12.0 24.7 -38.0 -10.0 -0.7 ...
External sectorExports of goods 56.5 62.6 87.0 51.7 67.0 92.5 96.0
Of which: non-oil exports 3.3 3.5 4.4 5.1 5.3 6.6 6.8Annual percentage change 14.6 6.4 25.1 16.0 4.4 25.2 2.4
Imports of goods -16.2 -19.1 -22.9 -17.3 -19.1 -23.1 -25.0Annual percentage change 7.9 17.7 20.0 -24.7 10.3 21.0 8.4
Current account 45.3 42.2 60.2 25.9 36.9 57.6 59.7Percent of GDP 44.6 36.8 40.5 23.6 27.8 33.5 32.7
External debt including private sector 30.8 57.5 60.6 57.5 ... ... ...International reserve assets 11.8 15.9 16.7 17.7 18.7 23.1 25.3
In months of imports of goods and services 5.3 5.9 5.3 6.8 6.9 7.0 7.1
Memorandum items:Exchange rate (U.S. dollar per KD, period average) 3.45 3.52 3.72 3.48 3.49 ...Nominal effective exchange rate (NEER, period average) 0.5 -2.2 2.5 -3.5 ... ...Real effective exchange rate (REER, period average) 0.9 0.3 8.4 -0.5 ... ...Sovereign rating (S&P) A+ AA- AA- AA- AA- ...
Sources: Data provided by the authorities; and Fund staff estimates and projections.1 Also includes government entities.2 Kuwaiti fiscal year ending March 31, e.g. 2007 refers to fiscal year 2007/08.3 In 2006/07 KD 2 billion was transferred to partly cover the actuarial deficit of the Public Pension Fund. In 2008/09, KD 5.5 were transferred. KD 1.1 billions are budgeted for each year from 2010/11 to 2014/15.4 Excludes investment income and pension recapitalization, and after transfers for FGF.5 Excludes debt of Kuwait's SWF related to asset management operations.6 Excludes SDRs and IMF reserve position.
(Billions of U.S. dollars, unless otherwise indicated)
(Changes in percent of beginning broad money stock)
(Percent of GDP at market prices)
(Percent of GDP at market prices)
Table 1. Kuwait: Selected Economic Indicators, 2006–12(Quota: SDR 1,381.1 million)
(Population: 3.58 million; Dec. 2010)(Per capita GDP: $37,039; 2010 estimate)
(Poverty rate: n.a.)Main exports: oil and gas

25
Est. Budget, Est. Proj.
2005/06 2006/07 2007/08 2008/09 2009/10 2010/11 2011/12 2011/12 2012/13
Revenue (includes grants) (A) 18.9 20.1 23.3 24.0 20.4 24.0 13.1 30.2 31.5Taxes 0.2 0.3 0.4 0.3 0.3 0.3 0.0 0.4 0.4Social contributions Grants Other revenue 18.7 19.8 23.0 23.7 20.0 23.7 13.1 29.8 31.1
Oil and gas 13.0 14.5 17.7 19.7 16.6 19.7 12.3 25.4 26.1
Investment income and transfer of profits of
public entities15.4 4.7 4.5 3.2 2.7 3.2 0.0 3.7 4.2
Other 20.4 0.6 0.8 0.7 0.7 0.8 0.8 0.8 0.8
Total expenditure (B=C+D) 6.8 10.3 9.7 18.1 11.1 15.6 18.3 17.4 18.5Expense (C) 5.9 9.1 8.2 16.5 9.7 13.7 14.8 14.9 15.5
Compensation of employees 2.1 2.5 2.8 3.4 3.5 3.7 4.5 4.2 4.5
Purchases/use of goods & services 31.4 1.6 1.8 1.9 1.9 2.1 2.6 2.3 2.6
Interest 4 0.1 0.1 0.1 0.1 0.1 0.0 0.0 0.1
Subsidies and social benefits 5, 61.7 3.9 2.4 9.7 3.1 5.7 7.0 6.9 6.7
Subsidies 0.8 1.1 1.5 2.6 1.8 2.4 3.0 2.9Oil-related subsidies 0.8 1.1 1.4 2.6 1.8 2.4 3.0 2.9Other subsidies 0.0 0.0 0.0 0.0 0.0 0.0 0.0 0.0
Social benefits 0.9 2.8 1.0 7.1 1.3 3.3 3.9 3.8 Payments to social security fund 0.7 2.5 0.7 6.4 0.8 1.9 2.0 2.1
Transfers to social security fund 0.7 0.5 0.7 0.8 0.8 0.8 0.9 1.0Fund recapitalization 0.0 2.0 0.0 5.6 0.0 1.1 1.1 1.1 1.1
Other social benefits 0.3 0.3 0.3 0.7 0.5 1.4 1.9 1.7Oil-related 0.0 0.0 0.0 0.3 0.1 0.9 1.1 1.2Others 0.2 0.2 0.3 0.4 0.4 0.5 0.7 0.6
GrantsExpense not elsewhere classified 0.5 1.0 1.1 1.5 1.0 2.2 0.7 1.5 1.6
Net acquisition of nonfinancial assets (D) 0.9 1.2 1.4 1.6 1.4 1.9 3.5 2.5 3.0Purchases of nonfinancial assets 0.9 1.2 1.4 1.6 1.5 1.9 3.5 2.6 3.0Sales of nonfinancial assets 0.0 0.0 0.0 0.0 0.0 0.0 0.0 0.0 0.0
Gross operating balance [=A-C] 13.0 11.0 15.1 7.5 10.7 10.3 -1.7 15.3 16.0Net lending / borrowing [=A-B] 12.1 9.8 13.7 5.9 9.3 8.4 -5.2 12.8 13.0
Non-oil balance -0.8 -4.7 -4.0 -13.8 -7.3 -11.3 -17.5 -12.6 -13.1excluding investment income -6.2 -9.4 -8.5 -17.1 -10.0 -14.5 -17.5 -16.3 -17.2
excluding recapitalization of pension -6.2 -7.4 -8.5 -11.4 -10.0 -13.4 -16.4 -15.2 -16.2excluding oil-related subsidies and benefits -5.4 -6.3 -7.1 -8.6 -8.1 -10.1 -11.1 -12.1
Financing -12.1 -9.8 -13.7 -5.9 -9.3 -8.4 5.2 -12.8 -13.0
Revenue (includes grants) 75.5 66.5 67.8 63.4 61.5 59.1 26.6 61.5 60.5
Total expenditure 27.1 34.0 28.0 47.9 33.5 38.4 37.3 35.5 35.5
Gross operating balance 52.0 36.5 43.8 19.9 32.3 25.4 -3.5 31.2 30.7Net lending / borrowing 48.5 32.5 39.7 15.5 28.0 20.7 -10.6 26.1 25.0
Non-oil balance -3.2 -15.5 -11.7 -36.5 -22.1 -27.8 -35.7 -25.6 -25.1excluding investment income -24.6 -31.1 -24.8 -45.0 -30.2 -35.7 -35.7 -33.1 -33.1
excluding recapitalization of pension -24.6 -24.5 -24.8 -30.2 -30.2 -33.0 -33.5 -30.9 -31.0excluding oil-related subsidies and benefits -21.4 -20.7 -20.5 -22.7 -24.4 -25.0 -22.6 -23.2
Table 2. Kuwait: Summary of Government Finance, 2005/06–2012/13 (continued)
(Percent of GDP)
(Billions of Kuwaiti Dinars)

26
Est. Budget, Es Proj.
2005/06 2006/07 2007/08 2008/09 2009/10 2010/11 2011/12 2011/12 2012/13
Revenue (includes grants) 174.8 157.4 157.0 152.0 120.0 128.1 62.5 144.3 136.8Taxes 2.2 2.2 2.4 2.2 2.0 1.8 0.0 1.8 1.8Other revenue 172.5 155.2 154.7 149.8 118.0 126.3 62.5 142.6 135.0
Oil and gas 119.6 113.6 119.3 124.8 97.8 105.1 58.8 121.2 113.4Investment income 49.5 37.1 30.2 20.5 15.9 17.1 0.0 17.6 18.1Other 3.4 4.5 5.2 4.6 4.3 4.0 3.7 3.7 3.5
Total expenditure 62.6 80.4 65.0 114.7 65.4 83.2 87.4 83.2 80.2Expense 54.5 71.0 55.5 104.3 57.0 73.2 70.7 71.1 67.3
Compensation of employees 19.6 19.3 18.7 21.2 20.7 19.8 21.6 19.9 19.7Purchases/use of goods & services 13.3 12.3 12.0 12.1 11.5 11.2 12.2 11.2 11.1Interest 0.9 1.0 0.9 0.6 0.3 0.3 0.0 0.2 0.2Subsidies and social benefits 15.7 30.9 16.4 61.2 18.5 30.4 33.2 32.7 29.3
Subsidies 7.3 8.9 9.8 16.5 10.9 12.8 0.0 14.2 12.7Social benefits 8.4 22.0 6.6 44.7 7.6 17.6 0.0 18.5 16.6 Payments to social security fund 6.0 19.9 4.5 40.5 4.6 10.2 0.0 9.5 9.0
Other social benefits 2.3 2.1 2.1 4.2 3.0 7.4 0.0 9.0 7.5GrantsExpense not elsewhere classified 5.1 7.5 7.4 9.3 6.0 11.5 3.6 7.1 7.0
Net acquisition of nonfinancial assets 8.1 9.4 9.5 10.4 8.4 10.0 16.8 12.1 12.9
Gross operating balance 120.2 86.4 101.6 47.7 63.1 55.0 -8.2 73.2 69.5Net lending / borrowing 112.1 77.0 92.1 37.3 54.6 44.9 -24.9 61.1 56.6
Non-oil balance -7.5 -36.6 -27.2 -87.5 -43.1 -60.2 -83.7 -60.0 -56.8excluding investment income -57.0 -73.7 -57.4 -108.0 -59.0 -77.3 -83.7 -77.7 -74.9
excluding recapitalization of pension -57.0 -58.1 -57.4 -72.3 -59.0 -71.5 -78.5 -72.5 -70.2excluding oil-related subsidies and benefits -49.6 -49.1 -47.5 -54.3 -47.6 -54.2 -52.9 -52.5
Memorandum items:
Expenses excl. recapitalization of pension fund (percent of nonoil GDP) 54.5 55.4 55.5 68.6 57.0 67.3 65.9 62.6Oil-related subsidies and benefits (percent of nonoil GDP) 7.4 9.0 9.9 17.9 11.4 17.3 19.5 17.7Kuwait Crude oil price, USD per barrel 53.3 63.5 76.2 84.8 62.7 83.3 60.0 103.9 102.2
Sources: Ministry of Finance; Central Bank of Kuwait; and Fund staff estimates and projections.1 Excluded from the national budget presentation. Estimated by Fund staff.2 Includes UN (Irak) compensations3 Includes other miscellaneous expenditures in FY 07/08 and 08/09.4 Covers interest payments on the treasury bills and bonds, and on the DCP bonds. Only the latter is included in the national budget presentation.5 In 2006/07 KD 2 billion was transferred to partly cover the actuarial deficit of the social security fund. In 2008/09, KD 5.5 were transferred. KD 1.1 billions are budgeted for each year from 2010/11 to 2014/15.7 The 2006/07 budget reflects KD195 million on account of a KD 200 one off grant transfer to each Kuwaiti citizen. The 2010/11 budget reflects KD 1,120 million on account of a KD 1,000 one off grant transfer to each Kuwaiti citizen.
(Percent of nonoil GDP)
Table 2. Kuwait: Summary of Government Finance, 2005/06–2012/13 (concluded)

27
Table 3. Kuwait: Summary Balance of Payments, 2005–12
Prel. Proj.2005 2006 2007 2008 2009 2010 2011 2012
Current account 30.1 45.3 42.2 60.2 25.9 36.9 57.6 59.7Goods (trade balance) 30.2 40.2 43.4 64.0 34.4 47.9 69.4 71.0
Exports 45.3 56.5 62.6 87.0 51.7 67.0 92.5 96.0Oil exports 42.4 53.2 59.1 82.6 46.6 61.7 85.9 89.2Non-oil exports including re-exports1 2.9 3.3 3.5 4.4 5.1 5.3 6.6 6.8
Of which: re-exports 0.6 0.9 1.2 1.7 1.6 1.8 2.7 2.7Imports -15.1 -16.2 -19.1 -22.9 -17.3 -19.1 -23.1 -25.0
Services -3.9 -2.2 -3.2 -3.8 -2.5 -5.9 -7.2 -7.7Transportation -0.4 0.2 -0.1 -0.6 -1.4 -1.7 -2.0 -2.2Insurance 0.0 -0.1 -0.1 -0.1 -0.2 -0.2 -0.3 -0.3Travel -4.4 -5.4 -6.4 -7.3 -6.1 -6.5 -7.9 -8.6Other services 0.9 3.0 3.4 4.3 5.1 2.6 3.0 3.4
Investment income 7.2 11.0 12.4 10.7 7.0 7.9 9.2 11.3Receipts 8.0 12.5 16.3 14.0 8.6 9.6 10.4 12.6
General government2 4.9 7.1 8.5 8.8 6.3 7.4 7.8 9.4Other sectors3 3.2 5.4 7.8 5.1 2.3 2.2 2.5 3.2
Payments -0.8 -1.5 -3.9 -3.2 -1.6 -1.8 -1.2 -1.3General government 0.0 0.0 0.0 0.0 0.0 0.0 0.0 0.0Other -0.8 -1.5 -3.9 -3.2 -1.6 -1.8 -1.2 -1.3
Current transfers4 -3.4 -3.7 -10.5 -10.7 -13.0 -13.0 -13.8 -14.9
Capital and financial account -32.1 -48.8 -33.4 -49.6 -25.3 -32.6 -53.3 -57.5Capital account5 0.7 0.7 1.5 1.7 1.1 2.2 2.3 2.3Financial account -32.8 -49.6 -34.9 -51.3 -26.4 -34.7 -55.5 -59.8
Direct investment -4.9 -8.1 -9.7 -9.1 -7.5 -2.0 -8.0 -8.2Abroad6 -5.1 -8.2 -9.8 -9.1 -8.6 -2.1 -8.0 -8.3In Kuwait 0.2 0.1 0.1 0.0 1.1 0.1 0.1 0.1
Portfolio investment -13.1 -29.1 -34.9 -28.1 -8.2 -7.7 -29.9 -32.6Other investment (net) -14.7 -12.4 9.7 -14.1 -10.7 -25.0 -17.7 -18.9
Net errors and omissions7 2.7 7.1 -5.5 -10.0 1.2 -3.3 0.0 0.0
Overall balance 0.7 3.6 3.3 0.7 1.7 1.0 4.4 2.2
Memorandum itemsCurrent account/GDP (in percent) 37.2 44.6 36.8 40.5 23.6 27.8 33.5 32.7Current account (excl. oil)/GDP (in percent) -15.3 -7.7 -14.7 -15.0 -18.9 -18.7 -16.4 -16.1Investment income/GDP (in percent) 8.9 10.8 10.8 7.2 6.4 5.9 5.4 6.2WEO oil price (dollars per barrel) 53.4 64.3 71.1 97.0 61.8 79.0 106.3 105.3Import growth (in percent) 21.4 7.9 17.7 20.0 -24.7 10.3 21.0 8.4International reserve assets (billions of U.S. dollars)8 8.1 11.8 15.9 16.7 17.7 18.7 23.1 25.3
In months of imports of goods and services 4.1 5.3 5.9 5.3 6.8 6.9 7.0 7.1
Sources: Central Bank of Kuwait; and Fund staff estimates.1 Also includes unrecorded oil exports.2 Kuwait Investment Authority, Kuwait Petroleum Corporation, Kuwait Fund for Arab Economic Development, Public Institute for Social Security, Kuwait Airways Corporation, and Bank of Savings and Credit.3 CBK, local banks, investment companies, exchange companies, insurance companies, and the nonfinancial private sector.4 From 2007, based on a new, more comprehensive methodology to estimate outward workers’ remittances.5 Includes UN war compensation.6 For 2010, includes a projection of the net inflow from the sale for $10.6 billion of a foreign asset owned by a Kuwaiti company.7 Includes other unclassified private sector flows.8 Includes SDRs and IMF reserve position.
(Billions of U.S. dollars, unless otherwise indicated)

28
Prel. Proj.End of period 2005 2006 2007 2008 2009 2010 2011 2012
Foreign assets (net) 1 3,904 5,545 5,718 7,610 9,441 9,464 11,535 12,981Central bank 2,370 3,416 4,327 4,510 5,009 5,183 6,414 7,045Local banks 1,534 2,129 1,392 3,100 4,432 4,281 5,121 5,935
Domestic assets (net) 9,182 10,375 13,269 14,341 15,455 16,170 18,288 19,880Claims on government (net) 948 113 -968 -2,675 -3,227 -2,441 -3,393 -3,701
Central bank (net) -520 -617 -920 -1,124 -1,165 -533 -723 -802Claims 15 0 0 0 0 0 0 0Deposits 534 617 920 1,124 1,165 533 723 802
Local banks (net) 1,467 731 -47 -1,550 -2,063 -1,908 -2,670 -2,899Claims 2,463 2,165 1,912 1,985 1,922 1,910 1,910 1,910
Government debt bonds 378 176 0 0 0 0 0 0Public debt instruments 2,085 1,989 1,912 1,985 1,922 1,910 1,910 1,910Other claims 0 0 0 0 0 0 0 0
Deposits 996 1,434 1,959 3,535 3,984 3,818 4,580 4,809
Claims on nongovernment sector 12,937 16,148 21,822 25,460 27,019 27,527 29,239 32,217Credit facilities 11,827 14,934 20,139 23,660 25,108 25,201 26,769 29,495Local investments 1,109 1,215 1,683 1,800 1,911 2,326 2,471 2,722
Other items (net) -4,702 -5,886 -7,585 -8,444 -8,336 -8,916 -7,558 -8,636
Broad money 2 13,086 15,921 18,987 21,950 24,896 25,634 29,823 32,861Money 3,727 3,550 4,147 4,370 4,714 5,625 6,325 6,969Quasi money 9,359 12,370 14,841 17,580 20,182 20,009 23,499 25,892
Of which: Foreign currency deposits 1,548 2,245 1,710 1,899 2,753 2,119 2,382 2,625
Foreign assets (net) 10.4 42.0 3.1 33.1 24.1 0.2 21.9 12.5 Central Bank 9.5 44.1 26.6 4.2 11.1 3.5 23.8 9.8 Local banks 12.0 38.8 -34.6 122.8 43.0 -3.4 19.6 15.9
Domestic assets (net) 13.1 13.0 27.9 8.1 7.8 4.6 13.1 8.7 Claims on Government (net) -24.0 -88.0 -953.4 176.4 -20.7 24.4 -39.0 -9.1 Claims on nongovernment sector 18.8 24.8 35.1 16.7 6.1 1.9 6.2 10.2 Other items (net) -17.2 -25.2 -28.9 11.3 1.3 -7.0 15.2 -14.3
Broad money 12.3 21.7 19.3 15.6 13.4 3.0 16.3 10.2 Money 17.4 -4.8 16.8 5.4 7.9 19.3 12.4 10.2 Quasi money 10.4 32.2 20.0 18.5 14.8 -0.9 17.4 10.2
Of which: Foreign currency deposits 32.4 45.0 -23.8 11.1 45.0 -23.0 12.4 10.2
Foreign assets (net) 3.2 12.5 1.1 10.0 8.3 0.1 8.1 4.8 Central bank 1.8 8.0 5.7 1.0 2.3 0.7 4.8 2.1 Local banks 1.4 4.5 -4.6 9.0 6.1 -0.6 3.3 2.7
Domestic assets (net) 9.1 9.1 18.2 5.6 5.1 2.9 8.3 5.3 Claims on government (net) -2.6 -6.4 -6.8 -9.0 -2.5 3.2 -3.7 -1.0 Claims on nongovernment sector 17.6 24.5 35.6 19.2 7.1 2.0 6.7 10.0 Other items (net) -5.9 -9.0 -10.7 -4.5 0.5 -2.3 5.3 -3.6
Broad money 12.3 21.7 19.3 15.6 13.4 3.0 16.3 10.2 Money 4.7 -1.4 3.7 1.2 1.6 3.7 2.7 2.2 Quasi money 7.5 23.0 15.5 14.4 11.9 -0.7 13.6 8.0
Of which: Foreign currency deposits 3.3 5.3 -3.4 1.0 3.9 -2.5 1.0 0.8
Memorandum items:Non-oil GDP/M2 79.4 76.4 77.0 70.8 66.5 70.8 68.5 68.5Foreign currency deposits/M2 11.8 14.1 9.0 8.7 11.1 8.3 8.0 8.0Private credit/non-oil GDP 114.8 121.3 135.5 148.8 151.9 141.2 133.4 133.4
Sources: Central Bank of Kuwait; and Fund staff estimates.
1 Excludes SDRs and IMF reserve position.
2 Excludes deposits with financial institutions which are marginal.
Table 4. Kuwait: Monetary Survey, 2005–12
(Millions of KD)
(Annual percentage change)
(Change in percent of beginning of period broad money stock)

29
Prel. Projections2005 2006 2007 2008 2009 2010 2011 2012 2013 2014 2015 2016
(Percentage change, unless otherwise specified)Production and prices Nominal GDP (KD billions) 23.6 29.5 32.6 40.0 31.5 38.0 48.4 51.4 53.8 56.6 60.2 64.2
Nominal GDP 34.7 24.9 10.6 22.7 -21.2 20.6 27.3 6.4 4.6 5.2 6.2 6.7 Nominal non-oil GDP 16.8 17.0 20.3 6.3 6.6 9.6 12.4 10.2 9.3 8.8 9.0 9.4
Real GDP 10.4 5.3 4.6 5.0 -5.0 3.3 5.0 5.6 5.1 4.8 4.7 4.7 Real oil GDP 12.1 2.8 -2.6 3.3 -11.3 3.2 3.3 4.6 4.6 4.6 4.5 4.5 Real non-oil GDP 10.6 8.3 11.1 5.6 -1.0 3.4 6.0 6.1 5.3 4.9 4.9 4.9
Kuwait crude export price (U.S. dollars per barrel) 50.6 61.2 70.4 93.7 58.2 76.4 104.1 103.1 99.6 97.3 96.6 96.4 Crude oil output (millions of barrels per day) 2.57 2.64 2.57 2.68 2.26 2.31 2.41 2.52 2.64 2.76 2.88 3.01
Consumer price index 4.1 3.1 5.5 10.6 4.0 4.1 6.2 3.5 3.0 3.0 3.0 3.0
Public finance 1
Revenue, of which : 75.6 66.6 67.8 63.4 61.5 59.2 61.6 60.6 61.2 61.8 62.5 63.5 Oil and gas 51.7 48.0 51.5 52.1 50.1 48.5 51.6 50.2 48.5 47.1 46.0 44.9
Investment income 2 21.4 15.7 13.0 8.5 8.1 7.9 7.5 8.0 10.3 12.3 14.2 16.3 Expenditure 27.2 34.0 28.1 47.9 33.6 38.4 35.5 35.5 36.1 36.3 34.2 34.0
Expense 3 23.6 30.0 23.9 43.5 29.2 33.7 30.3 29.8 29.7 29.4 27.3 26.9 Capital 3.6 4.0 4.1 4.3 4.4 4.7 5.2 5.8 6.4 6.8 7.0 7.1 Fiscal balance (deficit -) 48.5 32.5 39.7 15.5 28.0 20.7 26.1 25.0 25.1 25.6 28.3 29.5
Fiscal balance after transfer to FGF and excl. transfer to
pension 4 21.6 18.4 21.2 16.4 14.5 10.4 15.4 13.9 11.7 10.2 9.2 8.4Nonoil balance/non-oil GDP excluding recapitalization of
pension 5 -57.6 -58.8 -58.2 -73.0 -59.7 -72.1 -73.0 -70.7 -69.4 -67.8 -66.0 -64.2
Non-oil primary deficit/Non-oil GDP (in percent) 6 -57.0 -58.1 -57.4 -72.3 -59.0 -71.5 -72.5 -70.2 -68.9 -67.3
Exchange ratesExchange rates (U.S. dollar per KD, period average) 3.42 3.45 3.52 3.72 3.48 3.49 ... ... ... ... ... ...Nominal effective exchange rate 0.5 0.5 -2.2 2.5 -3.5 ... ... ... ... ... ... ...Real effective exchange rate 2.1 0.9 0.3 8.4 2.2 ... ... ... ... ... ... ...
Balance of payments 6
Exports of goods and services excl. re-exports 59.5 60.8 59.7 61.9 52.4 56.3 59.2 58.0 56.3 54.8 53.6 52.7 Of which : oil and refined products 52.5 52.4 51.5 55.5 42.6 46.5 50.0 48.8 47.2 45.9 44.9 43.9 Imports of goods and services excl. re-exports -26.9 -23.3 -24.6 -21.4 -23.3 -24.7 -23.0 -23.4 -23.7 -23.8 -23.9 -24.0 Investment income (net) 8.9 10.8 10.8 7.2 6.4 5.9 5.4 6.2 9.0 11.4 13.4 15.6 Current account 37.2 44.6 36.8 40.5 23.6 27.8 33.5 32.7 33.0 33.5 34.1 34.9 Current account (excluding oil exports) -15.3 -7.7 -14.7 -15.0 -18.9 -18.7 -16.4 -16.1 -14.2 -12.4 -10.7 -9.0
Saving-investment balanceFinal consumption 47.9 42.5 44.4 41.1 57.7 54.2 48.9 48.5 48.7 48.8 49.4 50.0
Government 15.7 13.9 14.0 13.3 20.5 15.0 13.1 13.5 13.9 14.1 14.1 14.0Private 32.2 28.6 30.4 27.9 37.2 39.1 35.8 35.0 34.8 34.7 35.3 36.0
Gross domestic investment 14.6 15.9 20.5 18.4 13.9 14.1 14.9 16.9 18.8 20.2 20.9 21.3 Government 3.0 2.8 3.6 3.5 4.6 4.7 4.9 5.6 6.2 6.7 6.9 7.1 Private 11.7 13.1 16.9 14.9 9.3 9.5 10.0 11.3 12.6 13.5 14.0 14.3 Savings 56.8 64.7 57.2 58.9 36.8 42.0 48.4 49.6 51.8 53.7 55.0 56.2
Government saving 55.7 60.2 55.2 46.4 47.1 45.8 46.2 47.2 47.2 47.7 48.4 49.3Private savings 1.1 4.5 2.1 12.5 -10.3 -3.8 2.1 2.4 4.6 6.0 6.7 6.9
Sources: Kuwait authorities; IMF World Economic Outlook; and Fund staff estimates and projections.
1 Fiscal year ending March 31. 2 Includes profits of public enterprises.3 In 2006/07 KD 2 billion was transferred to partly cover the actuarial deficit of the Public Pension Fund. In 2008/09, KD 5.5 were transferred. KD 1.1 billions are budgeted for each year from 2010/11 to 2014/15.4 Excluding transfer to FGF and investment income5 Equals overall balance minus oil revenues, investment income, and 10 percent of other current revenues and capital revenues plus pension transfer.6 Staff estimates and projections, based mainly on balance of payment flow data and assuming return on foreign assets close to the LIBOR.
Table 5. Kuwait: Illustrative Macroeconomic Baseline Scenario, 2005–16
(Percent of GDP, unless otherwise specified)
(Percent of GDP, unless otherwise specified)
(Percent of GDP, unless otherwise specified)

30
2006 2007 2008 2009 2010Capital adequacy Regulatory capital to risk-weighted assets 20.2 19.3 15.6 16.7 18.9 Regulatory Tier I capital to risk-weighted assets 17.7 17.2 14.3 14.9 17.3 Capital to assets 12.6 12.3 10.9 11.4 12.6Loan composition and quality Oil/gas 0.7 0.8 0.9 1.2 1.2 Trade 11.8 10.4 10.2 10.6 10.0 Industry 5.0 5.9 6.8 6.5 7.0 Construction 13.4 12.6 11.9 11.4 12.7 Real estate 17.5 19.2 18.1 20.6 20.0 Equity purchase loans (corporate) 5.4 4.5 5.8 5.9 5.7 Agriculture/fishing 0.2 0.1 0.7 0.3 0.4 Financial Institutions 14.6 15.9 12.8 12.7 14.1 Of which : investment companies 5.3 7.9 7.5 8.0 8.7 Of which : banks 0.0 0.0 0.0 0.0 4.6 Public services 1.6 2.2 1.9 1.6 1.6 Households 20.3 19.1 16.0 16.1 16.3 Of which: credit card advances 1.0 0.8 0.6 0.5 0.5 Of which : installment loans 13.7 12.1 10.9 12.7 12.1 Of which: consumer loans 3.7 4.1 2.5 1.0 2.2 Of which : equity purchase loans (individuals) 1.8 2.1 2.0 1.9 1.4 Other 9.6 9.2 14.8 13.3 11.1 Gross non-performing loans to total loans 4.6 3.8 6.8 11.5 8.9 NPLs net of specific provisions to total loans net of specific provisions 2.5 2.1 4.9 7.4 6.1 Specific provisions to gross NPLs 47.4 47.2 29.0 38.3 33.9 NPLs net of specific provisions to Tier I capital 12.6 10.8 31.5 46.2 33.8 Loans to shareholders, parent companies, & directors to total loans 4.9 4.2 4.9 6.4 2.0 Large exposures to Tier I capital 147.6 141.6 212.4 165.1 124.3 Specific provisions to gross loans 2.2 1.8 2.0 4.4 3.0Profitability Return on Average Assets (ROAA) 2 2.7 3.3 0.8 0.7 1.2 Return on Average Equity (ROAE) 2 20.1 24.3 6.5 6.1 9.1 Net interest income to gross income 33.9 29.0 36.6 44.5 49.9 Non-interest income to gross income 29.0 29.0 21.6 25.3 24.6 Trading and foreign exchange income to gross income 13.7 15.1 6.7 6.0 4.1 Non-interest expenses to gross income 27.6 23.9 26.4 36.9 37.7 Non-interest expenses to average assets 2 1.4 1.5 1.6 1.9 1.6 Personnel expenses to non-interest expenses 50.7 49.6 48.0 42.9 48.7Liquidity Core liquid assets to total assets 3 29.3 26.9 20.8 20.4 17.7 Core liquid assets to short-term liabilities 38.6 34.1 28.0 28.6 27.8 Liquid assets to total assets 34.5 32.9 28.4 27.9 22.8 Liquid assets to short term liabilities 45.3 41.7 38.4 39.2 35.7 FX- loans to total loans 19.7 23.3 24.9 25.8 25.5 FX- deposits to total deposits 28.8 34.9 35.1 32.7 30.7 FX- liabilities to total liabilities 23.2 27.8 24.2 22.6 11.2 Deposits to assets 59.3 56.4 59.2 58.8 56.7 Loans to deposits 96.1 103.1 109.0 113.0 116.5 FX- loans to FX-deposits 65.5 68.9 77.3 89.1 96.8Sensitivity to market risk Net open FX position (overall) as percent of Tier I capital 0.0 0.0 11.2 10.7 8.7 Off-balance sheet operations as percent of assets 32.1 34.7 32.5 25.3 26.2 Gross asset position in derivatives as a percentage of tier I capital 77.9 90.9 71.1 46.9 33.6 Gross liability position in derivatives as a percentage of tier I capital 77.9 91.0 71.1 46.8 39.4 Equity exposure to capital 40.6 42.4 47.1 45.4 39.1
1 Data is on consolidated basis.2 averaging was not applied in 2006 indicators.3 Core liquid assets include: cash and cash equivalents, deposits with CBK, government securities, CBK bills,deposits with banks, certificate of deposits with other banks which mature within three months. The data wasextracted from CBK prudential report.
Source: Central Bank of Kuwait
Table 6. Kuwait: Financial Soundness Indicators of the Banking Sector, 2006–10(Percent unless specifed otherwise) 1

31
APPENDIX I. EDUCATION, HEALTH, AND INFRASTRUCTURE IN KUWAIT 1. Kuwait faces challenges to improve the quality of the health and education sectors, as well as to upgrade infrastructure. In all three sectors, Kuwait fares relatively low vis-à-vis international comparisons, taking into account its GDP per capita level.
2. The long-term growth potential of the economy is linked to the effectiveness of the health and education sectors. Education is also important to reduce inequality. A World Bank study of education in the Middle East and North Africa concluded that once basic education needs have been met, effective participation in secondary and tertiary education required a complex mix of factors—not just higher spending.1 Accordingly, education reform should focus on achieving better outcomes and a focus on preparing graduates to meet the needs of the private sector.
3. The primary health care system is relatively good but the system has not kept up with the demand for specialized care, leading to an expensive program to send citizens abroad for healthcare services.2 The health care infrastructure, such as hospital beds per capita, is significantly below countries with a comparable income level and the share of spending in GDP is low.2 Accordingly, there is significant scope to increase the provision of healthcare services domestically, which will require capital spending and adequate resources to hire well-trained service providers.
4. At its current GDP per capita level, the quality of infrastructure in Kuwait is also relatively poor (see, for example, the indicator on quality of electrical supply). Additional investment is needed to bring electricity (and roads) up to regional standards. Investment should target bottlenecks that are a constraint to economic development and to ease capacity constraints.
1 The Road Not Traveled: Education Reform in the Middle East and North Africa, World Bank, 2008. 2 Unpublished Report, Kuwait: Review of Public Spending Allocations, World Bank, 2009.
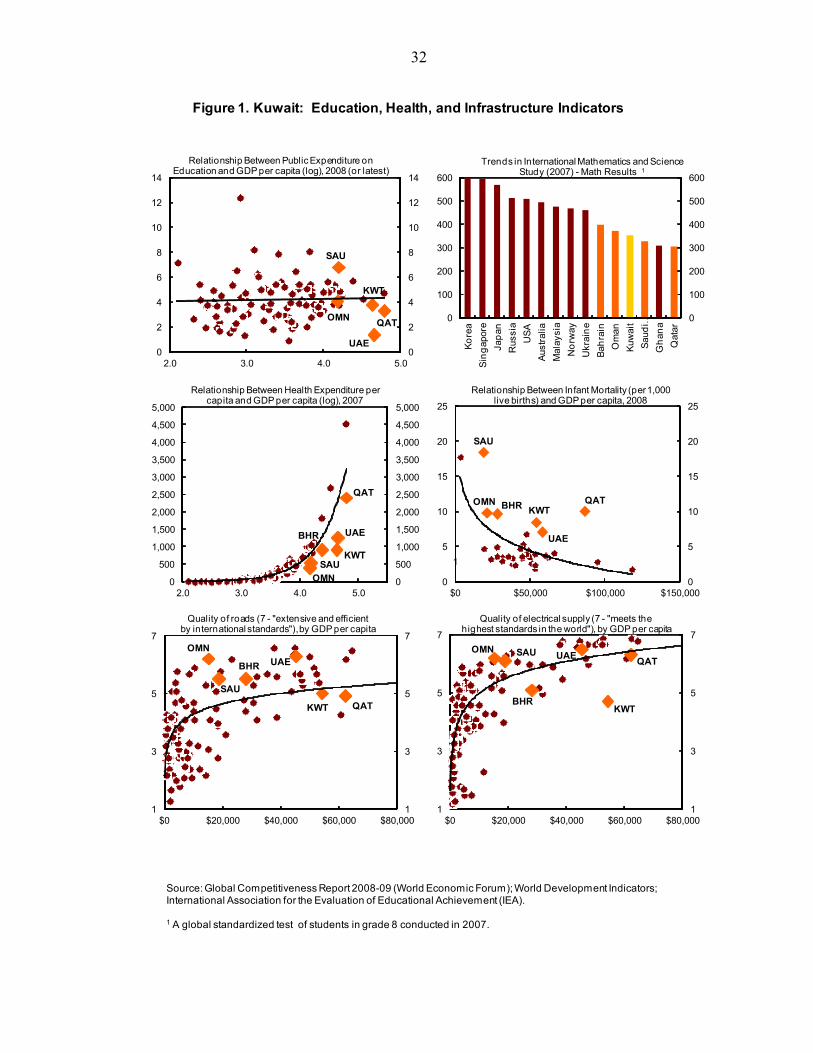
32
Figure 1. Kuwait: Education, Health, and Infrastructure Indicators
Source: Global Competitiveness Report 2008-09 (World Economic Forum); World Development Indicators; International Association for the Evaluation of Educational Achievement (IEA).
1 A global standardized test of students in grade 8 conducted in 2007.
UAE
SAU
OMNQAT
KWT
0
2
4
6
8
10
12
14
0
2
4
6
8
10
12
14
2.0 3.0 4.0 5.0
0
100
200
300
400
500
600
0
100
200
300
400
500
600
Ko
rea
Sin
gap
ore
Jap
an
Rus
sia
US
A
Aus
tral
ia
Mal
aysi
a
No
rway
Ukr
ain
e
Bah
rain
Om
an
Kuw
ait
Sau
di …
Gh
ana
Qat
ar
Trends in International Mathematics and Science Study (2007) - Math Results 1
BHR
KWT
OMN
QAT
SAU
UAE
0
500
1,000
1,500
2,000
2,500
3,000
3,500
4,000
4,500
5,000
0
500
1,000
1,500
2,000
2,500
3,000
3,500
4,000
4,500
5,000
2.0 3.0 4.0 5.0
Relationship Between Health Expenditure per capita and GDP per capita (log), 2007
BHR KWTOMN QAT
SAU
UAE
1
0
5
10
15
20
25
0
5
10
15
20
25
$0 $50,000 $100,000 $150,000
Relationship Between Infant Mortality (per 1,000 live births) and GDP per capita, 2008
BHR
KWT
OMN
QAT
SAU
UAE
1
3
5
7
1
3
5
7
$0 $20,000 $40,000 $60,000 $80,000
Quality of roads (7 - "extensive and efficient by international standards"), by GDP per capita
BHRKWT
OMNQAT
SAU UAE
1
3
5
7
1
3
5
7
$0 $20,000 $40,000 $60,000 $80,000
Quality of electrical supply (7 - "meets the highest standards in the world"), by GDP per capita
Relationship Between Public Expenditure on Education and GDP per capita (log), 2008 (or latest)

33
APPENDIX II. STRESS TESTING METHODOLOGY AND RESULTS
1. The CBK has introduced its own stress testing exercise. To date, the CBK has started its own banking sector stress testing exercise in mid-2010 and has already concluded one set of stress tests based on March 2010 data. The stress tests included three macroeconomic scenarios to evaluate the resilience of banks’ solvency to a combination of adverse shocks including a decline in oil prices, government expenditure, and GDP growth; a decrease in real estate and stock market prices; a depreciation of the exchange rate; and deterioration in banks’ liquidity conditions. The stress tests were carried out with the help of an external consulting firm, and results indicate the resilience of most banks to the shocks.
2. Staff conducted Banking sector stress tests based on December 2010 consolidated data. The tests covered market, credit, and liquidity risks with single-factor shocks and macroeconomic scenarios. The stress tests covered the 10 domestic banks, which account for 97 percent of the banking sector’s assets and were based on consolidated December 2010 financial statements and supervisory data. Three macroeconomics scenarios were considered in the solvency tests, ranging from mild to very severe scenarios. In credit risk stress tests, the losses consisted of increased provisions; in exchange rate stress tests, they consisted of revaluation gains or losses from net open positions; in interest rate stress tests, they consisted of net interest income gains or losses using a time to next repricing gap model that evaluates the impact of a parallel shift in the yield curve; and in equity risk stress tests they consisted of equity investments revaluation gains or losses. In the liquidity stress tests, the impact of deposit runs was evaluated on the banks’ ability to service cash outflows through a fire-sale of their liquid assets with no access to CBK financing for five days.
3. Staff applied the same increases in the NPL ratio as the 2010 FSAP update under the three tested scenarios for comparability purposes. The increases were then mapped into banks’ results through a migration of loans from the performing loan categories to the non-performing ones (substandard, doubtful, and loan loss) distributed proportionally according to banks’ initial shares of NPLs in these categories. Using the regulatory provisioning rates for each loan category and CBK regulation calculation methodology, the additional NPLs were translated into additional provisions under each scenario. The methodology accounted for collateral deemed realizable by reducing the loan base on which the provisioning rate was applied after assuming a haircut on the collateral. Haircut magnitudes ranged from 10 percent in the mild scenario to 50 percent in the most severe scenario. Pre-provisioning operating profits and existing precautionary provisions subsequently formed first buffers against the credit risk losses. The tests covered a one year span, similar to those conducted under the FSAP.
4. Single factor credit risk stress tests covered large exposures and sectoral concentration risks. Large exposure stress tests assumed default of the three largest exposures of each bank, while sectoral concentration risks stress tests assumed a deterioration of loans in real estate and construction, investment companies, and loans for

34
securities purchases. The tests assumed a fifty percent haircut of underlying collateral, which is a fairly conservative assumption given the complex foreclosure procedures and the current illiquidity condition of the real estate market. Single factor credit risk stress tests also accounted for existing precautionary provisions.
5. Single factor market risk stress tests included exchange rate, interest rate, and equity price risks. The generally limited impact of exchange rate risk is due to the regulatory restrictions limiting FX-net open positions to 15 percent of Tier I capital. The indirect impact of foreign exchange also appears contained given reported restrictions on FX lending to hedged borrowers. The impact of interest rates fluctuations on banks’ net interest margins did not appear significant owing to the predominance of floating rates loans which reprice in tandem with short-term deposits (both rates are indexed to the discount rate). However, lending rates associated with installment loans are subject to a ceiling which gives rise to some interest rate risk. Fixed income securities—predominantly government securities— account for 10 percent of banks’ assets. However, these are not mark-to-market owing to the absence of a secondary market for these securities, which makes the revaluation impact on the fixed income securities manageable. Conversely, banks’ significant holdings of equity investments and collateral expose them to stock market price fluctuations. The banking sector’s direct equity investments constitute 6 percent of total assets, and nearly 40 percent of collateral is held in equity shares. This test has the most significant impact among single factor market risks.
6. A liquidity stress test was carried out to test banks’ liquidity to a deposit run over a five day period without external funding. The liquidity test assumed daily withdrawals of 10 percent of demand deposits and 5 percent of time deposits for five days. A haircut of 10 percent was applied to the liquid assets. A bank was considered illiquid when the sale of its liquid assets did not cover deposit outflows in any specific day.
7. Stress tests of ICs included 11 listed companies accounting for 29 percent of total assets. The tests assumed loss rates by asset type1 and geographic location. The impact was estimated on ICs shareholders’ equity to assets ratio.
1 The asset allocation breakdown included investments in equities, bonds, real estate, hedge funds and private equities, loan advances, and other assets.

35
Assets Mild Moderate Severe
Cash instruments 0.0 0.0 0.0
Stocks
Domestic 15.0 33.0 66.0
Other GCC 15.0 33.0 66.0
US (and Canada) 10.0 19.0 38.0
UK 15.0 14.0 28.0
EMU 10.0 20.0 30.0
Other Mature Europe 10.0 20.0 30.0
Mature Asia 10.0 18.0 36.0
Emerging Markets 10.0 20.0 40.0
Bonds and loans and advances
Of which: domestic 10.0 20.0 30.0
Other GCC 10.0 20.0 30.0
Other 10.0 15.0 20.0
Real Estate
Domestic 15.0 25.0 40.0
Other GCC 15.0 25.0 40.0
US 10.0 15.0 20.0
UK 10.0 20.0 30.0
EMU 10.0 15.0 20.0
Emerging Markets 10.0 15.0 20.0
Other 10.0 15.0 20.0
Private Equity
US (and Canada) 10.0 15.0 30.0
Europe 10.0 15.0 30.0
Other Mature Markets 10.0 15.0 30.0
Emerging Markets 10.0 15.0 30.0
Hedge Funds 10.0 30.0 60.0
Other assets 10.0 15.0 20.0
Decline in total assets due to losses in assets 15.0 20.0 25.0
Decline in commission, dividend and rental income 10.0 15.0 20.0
Decline in Value
Table 1. Kuwait: Investment Companies Stress Tests—Assumptions for Asset Loss Under Different Scenarios
Scenarios
Decline in Value
Decline in Value
Loss in bonds and loans
Decline in Value

36
2008 2009 2010
Number of ICs included 97 97 97
Number of ICs with Losses 36 55 44
Total Losses (million KDs) -1,325 -1,158 -416
Total Net income (million KDs) -1,132 -985 -189
Table 2. Kuwait: Net Income of Investment Companies, 2008–10
IC1 IC2 IC3 IC4 IC5 IC6 IC7 IC8 IC9 IC10 IC11 Total# of ICs with
negative capital
Baseline (2010) 24.1 42.9 40.0 20.2 63.2 79.5 12.5 25.0 54.3 5.6 54.4 38.3 0Mild 7.7 39.3 31.4 16.5 37.3 85.8 (2.5) 9.1 66.1 7.6 43.5 28.7 1Moderate (1.3) 25.6 21.4 4.3 27.2 79.2 (12.4) (1.6) 63.3 (4.8) 26.8 18.9 4Severe (15.0) (2.2) (0.1) (16.5) 6.4 57.0 (27.0) (18.9) 54.8 (28.6) (7.9) 0.0 8
Baseline (2010) 144 94 112 39 245 213 19 149 161 9 77 1262Mild 39 73 75 27 123 195 -3 46 167 11 52 804Moderate -6 45 48 7 84 169 -15 -8 150 -6 30 498Severe -71 -4 0 -25 20 122 -33 -90 130 -38 -9 1
Souce: CBK data and staff estimates
Table 3: Summary of ICs Stress Tests Results
Capital to Assets Ratio (Leverage Ratio; in percent)
Capital in Million KD
(Based on December 2010 data)

37
Table 4. Kuwait: Banking Sector Stress Tests Scenarios and Results
2010 2011 2010 2011 2010 2011
I. Key assumptions
Banks' balance sheets
Non performing loans NPL ratio (%) 1 8.9 11.3 8.9 16.2 8.9 17.7
Change in NPL ratio (percentage points) -2.6 2.4 -2.6 7.3 -2.6 8.8
Provisions 2
Percent of NPLs 46.9 47.3 46.9 55.1 46.9 58.3
Percent of loans 3.7 4.3 3.7 7.6 3.7 8.8
Percentage increase 50.0 34.4 50.0 135.9 50.0 175.2
Change in operating non interest income (%) 3 2.0 2.0 2.0 -4.0 2.0 -10.0
Banks's nominal credit growth (%)
Banking system 6.0 6.0 6.0 0.0 6.0 -4.0
Memo items:
Collateral haircut 10.0 10.0 30.0 30.0 50.0 50.0
II. Impact analysis
Capital adequacy
Banking system
No. of banks with <0 0 0 0 0 0 0
No. of banks with 0%-8% 0 0 0 1 0 2
No. of banks with 8%-12% 0 0 0 0 0 3
No. of banks with >12% 10 10 10 9 10 5
Top 5 banks
No. of banks with <0 0 0 0 0 0 0
No. of banks with 0%-8% 0 0 0 1 0 1
No. of banks with 8%-12% 0 0 0 0 0 2
No. of banks with >12% 5 5 5 4 5 2
LiquidityNumber of Illiquid banks after liquidity shock 4 0 0 0 0 0 0
Number of illiquid Top 5 banks 0 0 0 0 0 1
Recapitalization requirements
Capital required to achieved 12% (in millions KD) 0.0 0.0 0.0 132.5 0.0 694.2
Percent of GDP 0.0 0.0 0.0 0.4 0.0 1.8
Percent of regulatory capital 0.0 0.0 0.0 2.3 0.0 11.91 Based on consolidated data.2 Specific and precautionary3 Excluding dividends and valuations gains.4 Liquidity stress test assumes daily withdrawals of 10 percent of demand deposits and 5 percent of time
deposits. A bank is considered illiquid when the sale of its assets does not cover the withdrawal of demand
and time deposits during the day.
Scenario 2Baseline Scenario 1
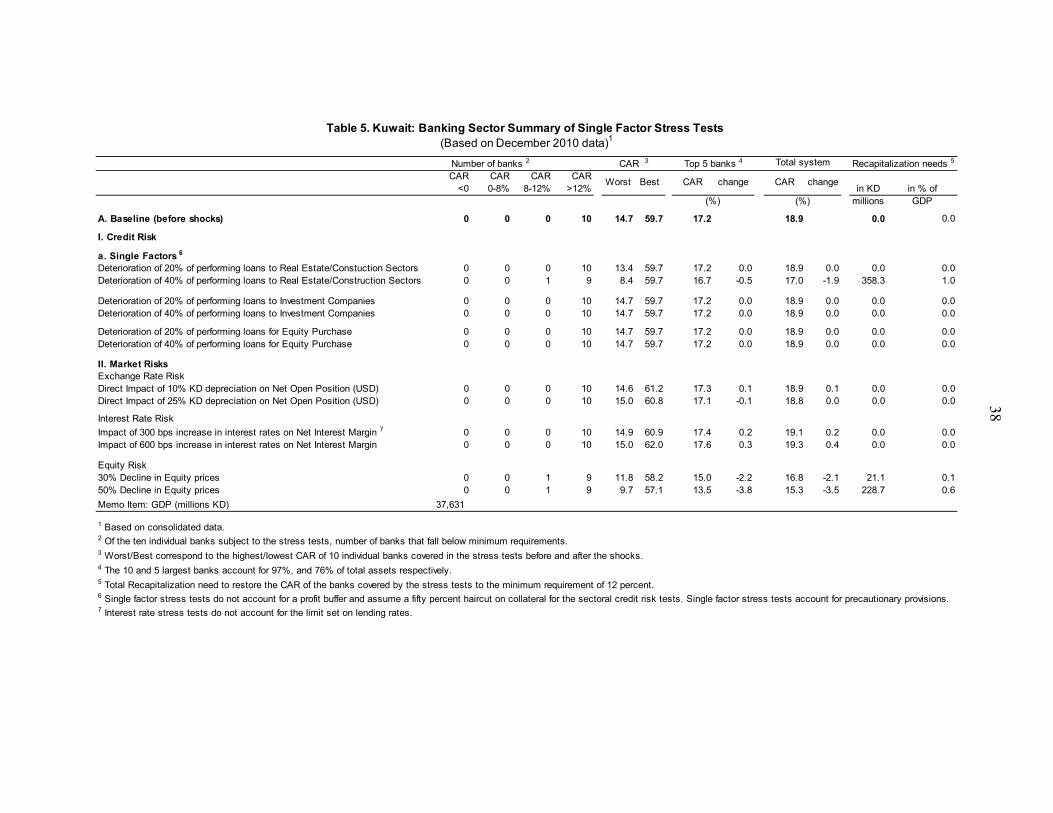
38
CAR <0
CAR 0-8%
CAR 8-12%
CAR >12%
Worst Best CAR change CAR changein KD in % of
millions GDP
A. Baseline (before shocks) 0 0 0 10 14.7 59.7 17.2 18.9 0.0 0.0
I. Credit Risk
a. Single Factors 6
Deterioration of 20% of performing loans to Real Estate/Constuction Sectors 0 0 0 10 13.4 59.7 17.2 0.0 18.9 0.0 0.0 0.0Deterioration of 40% of performing loans to Real Estate/Construction Sectors 0 0 1 9 8.4 59.7 16.7 -0.5 17.0 -1.9 358.3 1.0
Deterioration of 20% of performing loans to Investment Companies 0 0 0 10 14.7 59.7 17.2 0.0 18.9 0.0 0.0 0.0Deterioration of 40% of performing loans to Investment Companies 0 0 0 10 14.7 59.7 17.2 0.0 18.9 0.0 0.0 0.0
Deterioration of 20% of performing loans for Equity Purchase 0 0 0 10 14.7 59.7 17.2 0.0 18.9 0.0 0.0 0.0Deterioration of 40% of performing loans for Equity Purchase 0 0 0 10 14.7 59.7 17.2 0.0 18.9 0.0 0.0 0.0
II. Market RisksExchange Rate RiskDirect Impact of 10% KD depreciation on Net Open Position (USD) 0 0 0 10 14.6 61.2 17.3 0.1 18.9 0.1 0.0 0.0Direct Impact of 25% KD depreciation on Net Open Position (USD) 0 0 0 10 15.0 60.8 17.1 -0.1 18.8 0.0 0.0 0.0
Interest Rate Risk
Impact of 300 bps increase in interest rates on Net Interest Margin 7 0 0 0 10 14.9 60.9 17.4 0.2 19.1 0.2 0.0 0.0Impact of 600 bps increase in interest rates on Net Interest Margin 0 0 0 10 15.0 62.0 17.6 0.3 19.3 0.4 0.0 0.0
Equity Risk30% Decline in Equity prices 0 0 1 9 11.8 58.2 15.0 -2.2 16.8 -2.1 21.1 0.150% Decline in Equity prices 0 0 1 9 9.7 57.1 13.5 -3.8 15.3 -3.5 228.7 0.6
Memo Item: GDP (millions KD) 37,631
1 Based on consolidated data.2 Of the ten individual banks subject to the stress tests, number of banks that fall below minimum requirements.3 Worst/Best correspond to the highest/lowest CAR of 10 individual banks covered in the stress tests before and after the shocks.4 The 10 and 5 largest banks account for 97%, and 76% of total assets respectively.5 Total Recapitalization need to restore the CAR of the banks covered by the stress tests to the minimum requirement of 12 percent.6 Single factor stress tests do not account for a profit buffer and assume a fifty percent haircut on collateral for the sectoral credit risk tests. Single factor stress tests account for precautionary provisions.7 Interest rate stress tests do not account for the limit set on lending rates.
(%) (%)
CAR 3
Table 5. Kuwait: Banking Sector Summary of Single Factor Stress Tests
Number of banks 2 Top 5 banks 4 Total system Recapitalization needs 5
(Based on December 2010 data)1

39
APPENDIX III. FSAP UPDATE 2010: RECOMMENDATIONS IMPLEMENTATION STATUS
(As of May 2011)
Recommendation Implementation status and details
General
The CBK, CMA, and the Ministry of Commerce and Industry (MOCI) should clarify at the outset their respective supervisory responsibilities and initiate a coordination process to achieve efficient oversight architecture.
In progress. The chairman of the capital market authority (CMA) has been appointed and the institution is expected to fully resume its supervisory role in September 2010. CMA bylaws have been passed, specifying its supervisory roles over ICs and the finalization of the draft MoU delineating the supervisory responsibilities of and coordination process between CMA and CBK is underway. ICs extending credit are expected to remain under the supervision of the CBK while those engaged in securities dealings will be supervised by the CMA. Arrangements with respect to areas of overlaps are currently being worked out.
Establish at the CBK a financial stability unit (FSU) responsible for macro-prudential supervision
In progress. Significant progress has been made in this area. A new core team comprising on - and off-site supervisors has been formed with the help of an external consultant. Significant progress has been made on the analytical front and identification of tools that would be used to assess systemic risk. These include a quarterly off-site surveillance report, banking sector stress testing (developed during July-October 2010 with the assistance of a consulting firm), and an early warning system (EWS) that incorporates macro and micro economic and financial indicators that would be used to signal sector-wide weaknesses. The FSU is envisaged to draw from interdepartmental competencies including supervision and macro economic analysis but the institutional structure is still undecided.
Banking Supervision
Perform periodic stress tests including for real estate and other major sectoral credit risk concentrations, and review existing assessments of the way banks consider these risk concentrations in their internal capital adequacy assessment processes (ICAAPs).
Implemented. The CBK has made significant strides in its data collection and stress testing capacities with the help of an external consulting firm. Sectoral stress tests have been carried out by the CBK and the results were shared and discussed with banks. The CBK has completed an ICAAP manual based on the June 19, 2009 circular and have completed four ICAAP inspections in 2010. Three additional ICAAP inspections are scheduled for 2011.

40
Recommendation Implementation status and details
Lower the maximum exposure limits on related parties and enhancing the legal framework to prohibit conflicts of interest concerning related party transactions
Not implemented. The CBK noted that they have started to look into this issue. Moreover, they argued that they would like to avoid policy contradictions that could arise from lowering related lending limits and other policies that are directed at enhancing credit growth (e.g., relaxing the prudential loan/deposit ratio), particularly in light of the implementation of the Development Plan.
Complete the migration from compliance-based supervision to risk-based supervision
In progress. An external consultant was appointed to assist the CBK modernize its supervisory framework into a risk based one, and perform ICAAP assessments. Four ICAAP assessments have been completed in 2010 and three more are scheduled for 2011. The CBK intends to use the off-site surveillance report to identify the work program for the new inspection cycle that will start in October 2011, including the identification of targeted inspections.
Continue strengthening the supervision capacity through further hiring and training
Ongoing. A total of 31 on-site and off-site supervisors were recently hired. Staff in the banking supervision department have benefited over the last year from several trainings and seminars inside and outside Kuwait.
Shorten the on-site supervision cycle Not implemented. Nevertheless, with the migration to risk-based supervision, more frequent and targeted ICCAP bank examinations have strengthened on-site supervision. Additional targeted inspections are expected to take place in the upcoming inspection cycle.
Organize comprehensive ICAAP on-site examination Implemented. So far, four ICAAP inspections have been completed, and three are planned for 2011.
Investment Companies
Strengthen regulations on (a) licensing (in particular “fit and proper” criteria); (b) permissible activities; (c) corporate governance, including requirements on internal organization, internal control, risk management, external auditors, and accountancy rules; and (d) prudential limits on leverage and liquidity/maturity mismatch.
In progress. The CBK issued new regulations on ICs in June 2010. The new regulations set prudential limits on liquidity, leverage, and FX exposures. The CBK set June 2012 as the deadline for full compliance of ICs with the new regulations. The CBK has postponed any issuance of new regulations on corporate governance until the delineation of supervisory responsibilities over ICs is completed. The recently issued CMA bylaws seek to strengthen corporate governance in ICs by imposing approval of CMA for management, board members, and other key positions, including the compliance, internal controls, risk management, and AML/CFT officers. Minimum qualifications have been established for board members and key officers are required to pass a certain test specified by the CMA. New listing requirements for listed companies were also issued (compliance required by March 2012).

41
Recommendation Implementation status and details
Consideration could also be given to varying the minimum capital requirement depending on the activities and risks assumed by the entity
Not implemented.
Financial Safety Net Framework
Replace the blanket guarantee with a deposit insurance system which promotes market discipline, including by introducing a cap at a level that adequately protects depositors, but provides incentives to conduct due diligence. The authorities need to define a transition strategy, with a timetable, once conditions allow.
Not implemented. The authorities believe that it is still premature to remove the blanket guarantee. Furthermore, in view of the large deposit concentration in Kuwait (99% of depositors own only 20 percent of deposits), a standard deposit scheme would not be effective in guarding against bank runs.
Improve ELA, including by broadening collateral acceptance policies and establishing a valuation framework with haircuts for non-standard collateral
Not implemented. Nevertheless, the CBK law allows the CBK to use any collateral it deems acceptable for emergency lending. Currently, the ELA comprises a wider range than government securities including traded shares and bonds of solvent commercial companies as well as commercial paper, but does not include other non-standard collateral.
Resolution Framework
Overhaul the bankruptcy framework to adequately handle bankruptcies of banks and other financial institutions
Not implemented.

42
ANNEX I. KUWAIT—FUND RELATIONS (As of May 31, 2011)
I. Membership Status: Joined September 13, 1962 Article VIII on April 5, 1963 II. General Resources Account: SDR Million % Quota
Quota 1,381.10 100.00 Fund holdings of currency 1,201.08 73.93 Reserve position in Fund 360.06 26.07 III. SDR Department: SDR Million % Allocation Net cumulative allocation 1,315.57 100.00
Holdings 1,444.23 109.78
IV. Outstanding Purchases and Loans: None V. Financial Arrangements: None VI. Lending to the Fund and Grants: SDR million 11.8 (New Arrangements to Borrow) Kuwait has made a contribution to the PRGF-HIPC Trust in support of Fund’s concessional assistance to low-income countries. These include an interest-free deposit of SDR 4.2 million with a maturity at end-2018, and a grant contribution of SDR 0.1 million to the PRGF-HIPC Trust. VII. Exchange Rate Arrangement: Since May 2007, the Kuwaiti dinar has been pegged to an undisclosed currency basket, reverting to the exchange system before January 2003. Between January 1, 2003 and May 2007, the Kuwaiti dinar had been pegged to the U.S. dollar with a margin of 3.5 percent on either side around the parity exchange rate of 299.63 fils/U.S. dollar. Kuwait has accepted the obligations of Article VIII, Sections 2, 3, and 4, and maintains an exchange system free of restrictions on payments and transfers for current international transactions, other than those notified to the Fund pursuant to Decision 144-(52/51). On April 2, 2002 Kuwait notified the Fund, under Decision 144-(52/51), of exchange restrictions it introduced in order to implement UN Security Council resolutions 1373 (2001), 1333 (2000) and 1267 (1999).

43
VIII. Article IV Consultations: The last Article IV consultation was completed by the Executive Board on July 16,
2010. The staff report is available at: http://www.imf.org/external/pubs/cat/longres.aspx?sk=24092.0
IX. FSAP Participation An FSAP Update was conducted in March 2010. It included an updated assessment of a selected number of Basel Core Principles. An FSSA report was discussed by the Executive Board along with the staff report for the 2010 Article IV consultation and it is available at: http://www.imf.org/external/pubs/cat/longres.aspx?sk=24096.0 X. Technical Assistance: STA Seminar on GDDS February 2000 STA National Accounts and Price Statistics June 2001–June 2002 FAD Restructuring Budget Processes January/February 2002 FAD A Program for Tax Reform December 2002 MFD/LEG Bank Insolvency October 2004 FAD Macro Fiscal Unit February 2009 STA External Sector Statistics February 2009 STA External Sector Statistics December 2009 XI. Resident Representative: None XII. Kuwait has consented to the quota increase under the Eleventh General Review of Quotas; it has accepted the Fourth Amendment of the Articles of Agreement.

44
ANNEX II. KUWAIT—RELATIONS WITH THE WORLD BANK GROUP (As of June 7, 2011)
The World Bank and the Government of Kuwait developed a new four-year Country
Partnership Strategy (CPS) 2010–13, which leverages the setup of a World Bank Country Office in Kuwait (inaugurated in January 2009).
The Kuwait CPS and program emphasize implementation of reforms. Hence all
programs are grounded in the Government five-year plan, and are developed closely with the line ministry/agency as well as with the Ministry of Finance, which plays the coordinator role and the Bank’s central counterpart.
The CPS focuses on Fee-Based Services laying the ground for Bank provision of
advisory and analytical support to Kuwait. Program priorities are driven and guided by CPS and revolve around the following three pillars:
(i) Improving public sector performance, with activities in the areas of reforming
procurement; improved governance including setting up an anti-corruption agency; fiscal management, including support for Value Added Tax implementation; energy reforms in renewable energy and increased efficiency; and support for several environmental initiatives.
(ii) Economic diversification through increased private sector development, with
support for implementation of privatization law and public-private partnerships, and demand for supporting development of small and medium enterprises.
(iii) Human development, with a major program to support the quality of education,
including having an international expert based in Kuwait. Ongoing Activities for the FY 2011–12
I – Improving public sector performance
Governance TA – Phase III. This is a third phase of a continuing Governance program that began in FY08 (Phase I completed in FY09.) The scope of the project included review and/or assistance in drafting legislation pertaining to conflict of interest, and asset and income disclosure by public officials; advice and guidance on the creation of a well-functioning anticorruption agency including legal and institutional framework; development of the agency’s strategic plan, operational manual and guidelines; and public awareness campaign. The project is currently close to completion.

45
Clean Development Mechanism (CDM). At the request of the Environment Protection Agency (EPA) the Bank is providing assistance in the development of a national CDM Strategy, a CDM portfolio and an outline of options for Kuwait to participate in an international post-Kyoto regime. This activity aims also at assisting the EPA raise awareness and engage governmental and private sector stakeholders in a dialogue on carbon finance in general and the CDM more specifically, as well as providing training to potential project proponents and supporting identification of CDM project activities and other emerging carbon trading schemes.
Environmental Compliance Fund (ECF). This activity is in response to the request
from the Kuwait Supreme Council for the Environment, and subsequently from the Ministry of Finance, for World Bank support in promoting improved environmental performance from point-source/industrial polluters in Kuwait through the establishment of an ECF.
Power Sector Support. This activity aims at supporting the Ministry of Electricity and
Water (MEW) develop an implementation strategy, a coordination mechanism, and implementation steps for the development of energy efficiency and large-scale solar power combining the strengths of public and private sectors. This activity is drawing to a conclusion and discussions are underway for a follow-up activity during which the Bank will support MEW implement the detailed action plans and defined specific projects recommended in phase one.
Project Cycle. At the request of the Ministry of Finance, the World Bank is conducting
a review of the government project cycle. The objective of this program is to explore ways of shortening the project cycle and improving current project management practices in Kuwait. The proposed evaluation will review and analyze a selection of projects in government entities at three stages: concept, implementation and evaluation. This review will identify bottlenecks and areas that need amendments in procedures or regulation/legislation. It will also assist the Government to strengthen the capacity of the Government agencies to implement projects through adequate training.
Value Added Tax (VAT). The World Bank is supporting efforts by the Kuwaiti
Government to design and implements a VAT - as part of Kuwait’s GCC union obligations. Introducing VAT in Kuwait has four objectives: diversifying the sources of public revenues; supporting economic development programs by making available a steady stream of additional tax revenues; compensating the deficiency in customs duties resulting from the application of free trade agreements; and, improving taxation on luxury items. A parallel objective of this project is capacity building, which is where the involvement of the World Bank is critical. This will be achieved through intensive training in VAT basics, VAT specifics, VAT operations and modern techniques of tax administration, as well as through on-the-job training by the experts hired by the project.

46
This focus on strengthening a critical public sector function – tax administration – in the context of fiscal reform makes the Bank a natural partner for the government. An international resident advisor will be placed in Kuwait for two years to work on this activity.
Solid Waste Management II. This activity is a follow-up to a first phase solid Waste
Management program, which aimed at improving Kuwaiti authorities understanding of the current challenges of the solid waste sector and incited them to promote reforms to enhance cost effectiveness of private sector participation, particularly in collection, sorting and recycling of waste. At the request of the Municipality of Kuwait City, the Bank is engaged through this second phase of the program to help implement the main recommendations of the first phase, namely: (i) preparation & implementation of a national priority project for the closure and rehabilitation of existing dumpsites, (ii) elaboration and adoption of a solid waste master plan consistent with Kuwait Land-Use Master plan, to identify national policy & investment priorities for the solid waste sector, (iii) completion & harmonization of existing legal instruments, starting with a Solid Waste Law, and (iv) establishment of a municipal solid waste agency under the municipality’s authority.
Kuwait Environmental Action Plan. This activity represents the Kuwaiti national
component of the regional initiative for the Gulf Environment Action Program (GEPAP) launched in 2009 by the World Bank, at the meeting of the Gulf Cooperation Council (GCC) Environment Coordination Committee in Muscat, Oman. The objective of this activity is to support Kuwait’s efforts focus on environmental sustainability that could generate financing and economic benefits in addition to protecting Kuwait’s natural resources in line with the State’s regional and national priorities; and to help establish clear, transparent and predictable environmental regulations that would improve the investment climate in Kuwait. The activity comprises three main components, which are: (i) Implementing a cost assessment of environmental degradation as a decision making tool for delineating policy and investment priorities based on economic and social costs of the various forms of environmental degradation; (ii) Carrying out a pollution load assessment as a decision support system for monitoring and enforcement of environmental regulations; and (iii) Strengthening the environmental impact assessment system as a preventive tool for reducing environmental and social impacts and risks.
Follow-up to the Country Procurement Assessment Report (CPAR). Building on the
Bank’s CPAR report for Kuwait, the Bank is supporting the Ministry of Finance procurement team draft a new comprehensive procurement law and to promote reforms aimed at modernizing procurement practices in the country.

47
II – Economic diversification through increased private sector development
Public Authority for Transport. In this activity the World Bank is supporting the Ministry of Commerce to establish a Public Authority for Transport (PAT) as decreed by the Council of Ministers. In this task the Bank is commenting on draft laws establishing the authority and providing options analysis for design, organization and governance of the authority, including help with drawing the new authorities’ organizational structure and Operations Manual. Discussions are underway with the MoC on possible additions to the scope of work for the remainder of this program.
Public-Private Partnerships (PPP): Partnership Technical Bureau (PTB) Capacity
Building. The objective of this activity was to assist the PTB in the implementation of the BOT (build-operate-transfer) Law 7, 2008. More specifically, the task team (i) prepared operating BOT guidelines in line with the new Kuwait law and international best practice; and (ii) assisted the PTB in becoming a fully operational body by recommending a suitable organizational structure as well as provided ad hoc support in preparing and finalizing documents, including: procurement documents for recruiting transaction advisors, and requests for proposals. The first phase was completed in March 2010, and currently the project team has begun implementation of the second phase that will focus on the formal launch of the Kuwait PPP program (and the dissemination of the PPP guidebook), including preparation of a PPP policy note, the organization of a regional launch event; institutional and capacity development for PTB; and assistance in establishing a project development fund.
Kuwait Airways Privatization Support. At the request of the Kuwait Investment
Authority the World Bank provided support in the evaluation of technical proposals for the selection of a technical advisor to the Kuwait Airways Privatization Committee (KAPC). As part of this task the Bank will also review and comment on draft management and shareholder agreements.
Kuwait Foreign Investment Bureau (KFIB) Support. The World Bank is supporting
KFIB in developing feasibility studies and master plan(s) for three new economic zones for foreign investors (Wafra, Abdali, and Shegaya).
Privatization Support. The Ministry of Finance asked for World Bank support in
implementing a recently passed Privatization Law. The Bank’s support will focus initially on helping draft by-laws for the privatization law and policy (vision) statement to provide additional rationale and explanation for the draft by-laws. The proposed support also includes capacity building for the set-up of a Privatization Technical Bureau (PTB); Portfolio development; Transaction support, Public education, and support enhance corporate governance and Post-privatization reforms.

48
KPC Support. KPC management contacted the Bank, seeking support with KPC privatization program. The World Bank is providing support to KPC in the following three areas: (i) helping KPC establish a Private Sector Involvement Follow-Up unit; (ii) Support to the preparation of an Options Guide for the private sector participation in some of the KPC activities; and (iii) providing technical support for private sector involvement in KPC activities through the establishment of a Petroleum Industrial Zone.
III – Human development Education Sector TA. Building on the success of the School Education Quality
Improvement (SEQI) Program - designed to support the Ministry of Education (MoE) to implement selected critical elements of its own 4-year Government Program, the World Bank is partnering with MoE in expanding the cooperation program to improve the output of the education process, including through work on curriculum, diversifying secondary education (Grades 10-12) and developing an education system for special needs and gifted students. The World Bank work in the education sector is further expanding to potentially include support the work of the National Center for Assessment and Evaluation (NCAE) as well as support for the development of a strong higher education sector strategy, which will include a sector review and benchmarking to regional and more global standards.

49
ANNEX III. KUWAIT—STATISTICAL ISSUES
(As of May 31, 2011)
I. Assessment of Data Adequacy for Surveillance
General: Data provision has some shortcomings, but is broadly adequate for surveillance. There is scope for improved compilation of the national accounts and balance of payments statistics through better coordination among statistical agencies. Timeliness, particularly for the national accounts, is an area of concern.
National Accounts and Production: Recent improvements of national accounts include: change of the base year for the constant price data to 2000 and the estimates of value added for subsidized goods and services of the public utilities sector through the use of input costs (the household expenditure survey was used previously). Continued progress, especially in the estimation of value added for the oil sector, requires the dedication of adequate resources and improved coordination between the Ministries of Planning, Oil, and Finance. The IMF’s statistics department (STA) has provided technical assistance to the Ministry of Planning to improve national accounts and price data. It would be useful if the Central Bank of Kuwait (CBK) would publish oil sector information in the Quarterly Statistical Bulletin pertaining to output, refining, domestic consumption, export price for crude and refined products and the domestic price of petroleum products. These data are available from the Ministry of Oil. Timeliness of the data needs to be improved. Recent delays in the production of price indexes have caused long delays in the production of real GDP data.
Price statistics
CPI weights are based on the 1999–2000 household expenditure survey and were introduced into the index for a reference year of 2002. An improved monthly CPI based on a revised basket has been published in monthly CPI bulletins with about a one-month lag. The wholesale price index (WPI) needs to be developed into a producer price index (PPI) which is consistent with the national accounts and includes all domestically produced goods, ex-factory, for the export and the domestic market.
Government finance statistics: Annual GFS data are reported for publication in the Government Finance Statistics Yearbook (GFSY). The major components of extrabudgetary revenues (investment income and transfers of profits of public institutions), extrabudgetary expenditures (interest on foreign debt and treasury paper), and financing operations conducted by two reserve funds are not reported. Data on investment income, and on interest on foreign debt and treasury paper, however, are usually provided to Article IV consultation missions.
The authorities have made some progress in fiscal data presentation, but the lack of a suitable classification of data on the execution of the budget remains a constraint on monitoring
50
effectively fiscal developments during the year. The authorities’ presentation is not yet fully compliant with the GFSM 2001 guidance, but progress is being made in terms of creating a new chart of accounts and moving reporting to an accrual basis. Data on the operations of the Public Institute for Social Security are not made available. Sharing of information between various government agencies could be improved. STA has indicated to the authorities that operations of the two reserve funds should be classified as part of government, as they perform activities for public policy purposes (management of debt and assets, and financing of the budget). An additional extension of coverage would be to report GFS in the form of the Statement of Sources and Uses of Cash for the consolidated central government. The authorities have also been briefed on the IMF’s ongoing work to enhance the transparency of fiscal accounts and presentations detailed in the “Code of Good Practices on Fiscal Transparency” and were encouraged to adopt some of the practices recommended in the Code. Monetary and financial statistics
The CBK reports monetary data to STA on a regular and timely basis based on the Standardized Report Forms (SRFs). CBK needs to work further to distinguish a number of investment companies that accept deposits from other investment companies that do not accept deposits. Investment companies that accept deposits should appropriately be classified as part of the depository corporations sector. In the current SRFs, all investment companies (including those that accept deposits) are classified as other financial corporations. However, the amount of deposits accepted by investment companies is considered as not significant.
Balance of Payments Statistics: The CBK compiles and disseminates detailed annual data in accordance with the methodology of the BPM5, while trade data estimates are disseminated monthly. However, data on capital flows of the nonfinancial private sector are limited. To improve coverage for inward foreign direct investment, the CBK is making efforts to obtain more data by surveying direct investment enterprises. The Central Statistical Office (CSO), working with the CBK, plans to implement the IMF’s Coordinated Direct Investment Survey in 2010–11. This initiative should improve foreign direct investment statistics. Enhancements have been made in the estimation of travel services and communication services, but further improvements are needed in compilation practices and in the estimation of data on several service items and private transfers. A major step forward in 2007 was the dissemination of IIP data for 2001 onwards in STA publications. However, the information on IIP data made available to staff is incomplete as it excludes the external assets held by the general government due to domestic legal constraints on dissemination (however, loans granted by the Kuwaiti Fund for Arab Economic Development and general government trade credits are included).

51
The CBK also participates in the Coordinated Portfolio Investment Survey (CPIS) with data reported for 2003 onwards. These data are for the financial sector acting as end-investors or as intermediaries on behalf of residents and do not include holdings of foreign securities held by government agencies, which comprise the bulk of Kuwait’s cross-border holdings. In 2009, STA provided TA on improving external accounts data. The CBK has made good progress since then, particularly in the substantial revisions to report forms, including the separate reporting of financial transactions in the BOP and other changes in volume in the international investment position. It has also made progress in the estimation of remittances data. Yet, major delays and data gaps remain. In particular, major government entities do not report quarterly data to the CBK in time to compile timely quarterly statistics. Trade data are compiled by the CSO annually and provided to the CBK with a time lag of well over one year. Furthermore, the response rate for the private nonfinancial sector is low.
II. Data Standards and Quality
Kuwait is one of the first GDDS participants. However, most of its metadata, with the exception of the real sector and socio-demographic metadata, have not been updated since October 2002. The CBK maintains its own webpage where it provides the following data to the public: money and banking statistics; balance of payments statistics; trade balance statistics; exchange rate; GDP by sector and expenditure at current and constant prices; public finance statistics; CPI and WPI; and security market indicators. Similarly, the Ministry of Planning has a webpage where the CSO publishes data on national accounts, prices, and other related statistics. The Ministry of Finance webpage includes detailed data for actual and estimated budget operations. In addition, the Kuwait Stock Exchange webpage provides data on stock market indices, volume and value of securities traded, as well as privatization schedules and other related information.
No data ROSC is available.
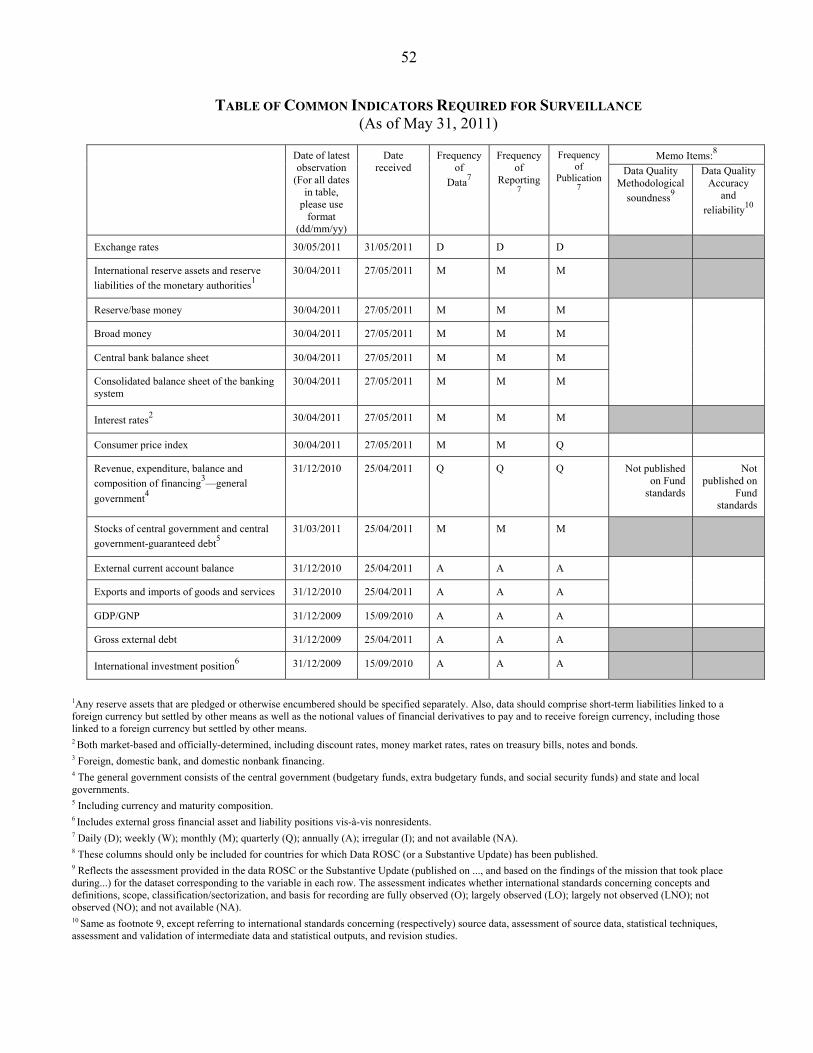
52
TABLE OF COMMON INDICATORS REQUIRED FOR SURVEILLANCE (As of May 31, 2011)
1Any reserve assets that are pledged or otherwise encumbered should be specified separately. Also, data should comprise short-term liabilities linked to a foreign currency but settled by other means as well as the notional values of financial derivatives to pay and to receive foreign currency, including those linked to a foreign currency but settled by other means. 2 Both market-based and officially-determined, including discount rates, money market rates, rates on treasury bills, notes and bonds. 3 Foreign, domestic bank, and domestic nonbank financing. 4 The general government consists of the central government (budgetary funds, extra budgetary funds, and social security funds) and state and local governments. 5 Including currency and maturity composition. 6 Includes external gross financial asset and liability positions vis-à-vis nonresidents. 7 Daily (D); weekly (W); monthly (M); quarterly (Q); annually (A); irregular (I); and not available (NA). 8 These columns should only be included for countries for which Data ROSC (or a Substantive Update) has been published. 9 Reflects the assessment provided in the data ROSC or the Substantive Update (published on ..., and based on the findings of the mission that took place during...) for the dataset corresponding to the variable in each row. The assessment indicates whether international standards concerning concepts and definitions, scope, classification/sectorization, and basis for recording are fully observed (O); largely observed (LO); largely not observed (LNO); not observed (NO); and not available (NA). 10 Same as footnote 9, except referring to international standards concerning (respectively) source data, assessment of source data, statistical techniques, assessment and validation of intermediate data and statistical outputs, and revision studies.
Date of latest observation
(For all dates in table,
please use format
(dd/mm/yy)
Date received
Frequency of
Data7
Frequency of
Reporting7
Frequency of
Publication7
Memo Items:8
Data Quality Methodological
soundness9
Data Quality Accuracy
and
reliability10
Exchange rates 30/05/2011 31/05/2011 D D D
International reserve assets and reserve
liabilities of the monetary authorities1
30/04/2011 27/05/2011 M M M
Reserve/base money 30/04/2011 27/05/2011 M M M
Broad money 30/04/2011 27/05/2011 M M M
Central bank balance sheet 30/04/2011 27/05/2011 M M M
Consolidated balance sheet of the banking system
30/04/2011 27/05/2011 M M M
Interest rates2 30/04/2011 27/05/2011 M M M
Consumer price index 30/04/2011 27/05/2011 M M Q
Revenue, expenditure, balance and
composition of financing3—general
government4
31/12/2010 25/04/2011 Q Q Q Not published on Fund
standards
Not published on
Fund standards
Stocks of central government and central
government-guaranteed debt5
31/03/2011 25/04/2011 M M M
External current account balance 31/12/2010 25/04/2011 A A A
Exports and imports of goods and services 31/12/2010 25/04/2011 A A A
GDP/GNP 31/12/2009 15/09/2010 A A A
Gross external debt 31/12/2009 25/04/2011 A A A
International investment position6 31/12/2009 15/09/2010 A A A

Public Information Notice (PIN) No. 11/93 FOR IMMEDIATE RELEASE July 19, 2011 IMF Executive Board Concludes 2011 Article IV Consultation with Kuwait
On July 15, 2011, the Executive Board of the International Monetary Fund (IMF) concluded the Article IV consultation with Kuwait.1 Background
The 2011 consultation discussions were held against the backdrop of the second year of implementation of Kuwait’s Development Plan, recovery in non-oil economic activity, tension between government and parliament, regional unrest, and higher global oil prices.
Real Gross Domestic Product (GDP) growth in 2010 is estimated at 3.3 percent, comprising oil growth of 3.2 percent and non-oil growth of 3.4 percent. Activity has been driven mostly by an expansionary fiscal stance. Government Expenditure in FY2010/11—excluding energy-related subsidies and recapitalization of social security—is estimated to have increased by 21½ percent. Half of this growth was attributed to the recent Amiri grant, which included a cash transfer of about $3,600 to each Kuwaiti citizen (equivalent to almost 3 percent of 2010 GDP) and free essential food items from February 2011 through March 2012. The increase in bank lending to the private sector was small, with higher lending of 3.3 percent to the productive sectors (industry, services, and trade) partially offset by a reduction in credit to the real estate and financial sectors.
1 Under Article IV of the IMF's Articles of Agreement, the IMF holds bilateral discussions with members, usually every year. A staff team visits the country, collects economic and financial information, and discusses with officials the country's economic developments and policies. On return to headquarters, the staff prepares a report, which forms the basis for discussion by the Executive Board. At the conclusion of the discussion, the Managing Director, as Chairman of the Board, summarizes the views of Executive Directors, and this summary is transmitted to the country's authorities. An explanation of any qualifiers used in summings up can be found here: http://www.imf.org/external/np/sec/misc/qualifiers.htm.
International Monetary Fund 700 19th Street, NW Washington, D. C. 20431 USA

2
Headline inflation increased in 2010, primarily due to higher international food prices. Average food inflation reached about 8.2 percent in 2010 (and 9.8 percent at end-April 2011), compared to 3.4 percent in 2009, but its impact on Kuwaiti citizens has been mitigated by the Amiri grant. Non-food inflation remains subdued at around 3.6 percent as of April 2011, reflecting moderate increases in rents. Similar to other countries in the region, the regional unrest has weighed down on stock market prices, which declined by over 8 percent in 2011 through May 25. At the same time, Kuwait has increased its oil production to assist in the effort to stabilize the global oil market.
Banks’ profitability and capitalization have improved but the Investment Companies (ICs) sector continued to post losses. Profits of local banks increased by 70 percent in 2010 and the sector’s capital adequacy ratio increased to 19 percent in 2010 from 17 percent in 2009. ICs continued to struggle and posted losses on average in 2010—although at a lower level than average losses in 2009—and the debt restructuring of some ICs remains unresolved. The performance of the nonfinancial corporate sector has improved in 2010, notwithstanding the continued drag by the real estate sector. Executive Board Assessment
Executive Directors noted that Kuwait’s economy has recovered from the impact of the global financial crisis on the back of a strong fiscal stimulus and an ambitious development plan. The outlook is however subject to external and internal risks and policy will need to be implemented flexibly in the period ahead. To secure sustainable broad-based growth and address the challenges ahead, Directors also stressed the need for further fiscal, financial, and institutional reforms.
Directors endorsed the currently accommodative mix of macroeconomic policies, but recommended that support be withdrawn if signs of overheating emerge. They agreed that the basket peg regime remains broadly appropriate and took note of the staff’s assessment that the exchange rate is broadly in line with medium-term fundamentals.
Directors considered that the authorities’ 2010—2014 Development Plan rightly targets much needed investment, including in human capital, with a view to better preparing Kuwaiti nationals for private sector employment. They underscored the importance of implementing this plan carefully, with special regard to project viability, the business environment, and absorptive capacity, while avoiding the buildup of vulnerabilities in private sector’s balance sheets.
More broadly, Directors emphasized the importance of further reforms to improve the fiscal framework, reduce distortions, and ensure intergenerational equity in the sharing of oil wealth. Priority should be given to tax reforms, including the introduction of a value-added tax and a comprehensive income tax system, better targeted subsidies and social benefits, and a reallocation of public expenditure toward investment. A fiscal rule could also strengthen fiscal management.

3
Directors recognized important advances in financial sector stability. They welcomed improvements in banks profits and balance sheets and progress in implementing the recommendations of the 2010 Financial Sector Assessment Program. Directors cautioned, however, that many investment companies remained in fragile financial positions and urged the authorities to monitor their situation closely. In this regard, developing of a special resolution regime for financial institutions would facilitate efficient restructuring and exits. The effectiveness of financial oversight would also be boosted by further empowering the newly established Capital Market Authority and the adoption of a new AML/CFT law.
Directors welcomed improvements in Kuwait’s statistical system but considered that more work is needed. They encouraged the authorities to provide additional support to the Central Statistical Office and give priority to the compilation of timely national accounts.
Public Information Notices (PINs) form part of the IMF's efforts to promote transparency of the IMF's views and analysis of economic developments and policies. With the consent of the country (or countries) concerned, PINs are issued after Executive Board discussions of Article IV consultations with member countries, of its surveillance of developments at the regional level, of post-program monitoring, and of ex post assessments of member countries with longer-term program engagements. PINs are also issued after Executive Board discussions of general policy matters, unless otherwise decided by the Executive Board in a particular case.

4
Kuwait: Selected Economic Indicators, 2006–12
(Quota: SDR 1,381.1 million) (Population: 3.58 million; Dec. 2010) (Per capita GDP: $37,039; 2010 estimate)
Main exports: oil and gas Prel. Proj. 2006 2007 2008 2009 2010 2011 2012
Oil and gas sector Total oil and gas exports (in billions of U.S. dollars) 53.2 59.1 82.6 46.6 61.7 85.9 89.2 Average oil export price (in U.S. dollars/barrel) 61.2 70.4 93.7 58.2 76.4 104.1 103.1 Crude oil production (in millions of barrels/day) 2.64 2.57 2.68 2.26 2.31 2.41 2.52
(Annual percentage change, unless otherwise indicated) National accounts and prices
Nominal GDP (market prices, in billions of Kuwaiti dinar) 29.5 32.6 40.0 31.5 38.0 48.4 51.4 Nominal GDP (market prices, in billions of U.S. dollars) 101.6 114.7 148.8 109.5 132.6 171.9 182.9 Real GDP (at factor cost) 5.3 4.6 5.0 -5.0 3.3 5.0 5.6
Real oil GDP 2.8 -2.6 3.3 -11.3 3.2 3.3 4.6 Real non-oil GDP 8.3 11.1 5.6 -1.0 3.4 6.0 6.1
CPI inflation (average) 3.1 5.5 10.6 4.0 4.1 6.2 3.5 Unemployment rate (Kuwaiti nationals) 4.0 6.1 4.9 3.6 2.9 ... ...
(Percent of GDP at market prices) Investment and savings
Investment 15.9 20.5 18.4 13.9 14.1 14.9 16.9 Public 2.8 3.3 3.5 4.6 4.7 4.9 5.6 Private 1 13.1 16.9 14.9 9.3 9.5 10.0 11.3
Gross national savings 60.6 57.2 58.9 37.6 42.0 48.4 49.6 Public 60.2 55.2 46.4 47.1 45.8 46.2 47.2 Private
1 4.5 2.1 12.5 -10.3 -3.8 2.1 2.4 Savings/investment balance 44.6 36.8 40.5 23.6 27.8 33.5 32.7
(Percent of GDP at market prices) Budgetary operations
2 Revenue 66.6 67.8 63.4 61.5 59.2 61.6 60.6
Oil 48.0 51.5 52.1 50.1 48.5 51.6 50.2 Non-oil, of which: 18.6 16.3 11.4 11.5 10.7 9.9 10.4
Investment income 15.7 13.0 8.5 8.1 7.9 7.5 8.0 Expenditures 34.0 28.1 47.9 33.6 38.4 35.5 35.5
Expense 3 30.0 23.9 43.5 29.2 33.7 30.3 29.8
Capital 4.0 4.1 4.3 4.4 4.7 5.2 5.8 Balance 32.5 39.7 15.5 28.0 20.7 26.1 25.0 Non-oil balance (percent of non-oil GDP)
4 -58.8 -58.2 -73.0 -59.7 -72.1 -73.0 -70.7 Total gross debt (calendar year-end)
5 8.3 6.7 5.6 7.0 5.7 4.5 4.2 (Changes in percent of beginning broad money stock)
Money and credit Net foreign assets
6 12.5 1.1 10.0 8.3 0.1 8.1 4.8
Claims on nongovernment sector 24.5 35.6 19.2 7.1 2.0 6.7 10.0 Broad money 21.7 19.3 15.6 13.4 3.0 16.3 10.2 Kuwaiti dinar 3-month deposit rate (year average; in percent) 5.0 5.2 3.3 1.4 0.8 ... ... Stock market unweighted index (annual percent change) -12.0 24.7 -38.0 -10.0 -0.7 ...
(Billions of U.S. dollars, unless otherwise indicated) External sector
Exports of goods 56.5 62.6 87.0 51.7 67.0 92.5 96.0 Of which: non-oil exports 3.3 3.5 4.4 5.1 5.3 6.6 6.8 Annual percentage change 14.6 6.4 25.1 16.0 4.4 25.2 2.4
Imports of goods -16.2 -19.1 -22.9 -17.3 -19.1 -23.1 -25.0 Annual percentage change 7.9 17.7 20.0 -24.7 10.3 21.0 8.4
Current account 45.3 42.2 60.2 25.9 36.9 57.6 59.7 Percent of GDP 44.6 36.8 40.5 23.6 27.8 33.5 32.7
External debt including private sector 30.8 57.5 60.6 57.5 ... ... ... International reserve assets 11.8 15.9 16.7 17.7 18.7 23.1 25.3
In months of imports of goods and services 5.3 5.9 5.3 6.8 6.9 7.0 7.1
Memorandum items: Exchange rate (U.S. dollar per KD, period average) 3.45 3.52 3.72 3.48 3.49 ... Sovereign rating (S&P) A+ AA- AA- AA- AA- ...
Sources: Data provided by the authorities; and Fund staff estimates and projections. 1 Also includes government entities.
2 Kuwaiti fiscal year ending March 31, e.g. 2007 refers to fiscal year 2007/08.
3 In 2006/07 KD 2 billion was transferred to partly cover the actuarial deficit of the Public Pension Fund.
In 2008/09, KD 5.5 were transferred. KD 1.1 billions are budgeted for each year from 2010/11 to 2014/15. 4 Excludes investment income and pension recapitalization, and after transfers for FGF.
5 Excludes debt of Kuwait's SWF related to asset management operations.6 Excludes SDRs and IMF reserve position.

Statement by Mr. Shaalan on Kuwait Executive Board Meeting
July 15, 2011 1. On behalf of the Kuwaiti authorities, I would like to thank staff for the constructive dialogue and candid advice during the article IV discussions. The authorities broadly concur with staff’s analysis and recommendations. The discussions rightly focused on the planned fiscal and financial reforms, as well as on the agenda to achieve sustainable growth and economic diversification. Recent developments 2. After contracting by 5 percent in 2009, economic activity recovered to about 3 percent in 2010, underpinned by a supportive fiscal stance and reflecting a rebound in both the oil and non-oil sectors. Headline inflation increased on account of higher international food prices. Non-food prices, however, remained subdued. 3. The fiscal and external accounts continued to post large surpluses, reflecting high international oil prices. The fiscal surplus is estimated at 21 percent of GDP in 2010, notwithstanding an increase in government expenditure by 21½ percent of GDP. 4. Financial soundness indicators point to a considerable improvement in banking system strength and resilience. Capital adequacy ratio remained significantly above the minimum required by the Central Bank of Kuwait (CBK). Bank profitability increased and non-performing loans dropped due to write-offs of fully provisioned loans. Credit to residents, however, recorded modest growth in 2010, as a result of stricter regulations following the financial crisis and the cautious lending policies adopted since last year. An ambitious development plan 5. In February 2010, Kuwait’s parliament approved a US$ 108 billion development plan extending over 4 years. This plan is the first of six successive plans that are aimed at rendering Kuwait a regional financial and trade hub by 2035. The plan will help restructure the economy by promoting diversification away from the oil sector and paving the way for greater private sector participation in economic activity. Half of the investments envisaged in the plan will come from the private sector and three quarters of investments will benefit the non-oil sector. The plan also envisages the enactment or revision of laws that are intended to enhance the role of the private sector. Economic outlook and risks 6. Growth momentum is likely to be sustained in 2011 and beyond, on the account of the newly approved development plan. While there may be concerns regarding the government’s capacity to execute the development plan in a timely manner, the restoration of confidence in the prospects of the economy is likely to have a positive impact on the non-oil sector. The increase in oil prices in 2011 will provide an added incentive for the government

2
to move ahead with the large projects and more generally, expedite the pace of project execution. However, price pressures are expected to pick up in 2011, although this mainly reflects an increase in international food prices. Towards sustainable economic growth 7. Kuwait’s economy and public finances remain very reliant on the oil sector, which accounts for more than 90 percent of budget revenues and exports. The new development plan aims at building a more diverse and dynamic economy, by providing incentives for the private sector to assume a leading role in the economy. This will also reduce pressures on the government to continue providing job opportunities for Kuwaiti nationals. 8. The business environment in Kuwait will largely benefit from the investments identified in the development plan. The plan incorporates an upgrade of the country’s infrastructure, including roads, airports, and hospitals. It also calls for sizable investments in education in order to prepare Kuwaiti nationals for employment in the private sector. 9. The development plan took off slowly in its first year due to delays in introducing the needed legislative base. This new legislation aims at improving efficiency, governance, and competitiveness. Fiscal policy reforms 10. The strong recovery in oil prices will enable Kuwait to sustain continued spending over the medium term while still achieving a significant surplus. Staff’s analysis points to a high government expenditure multiplier. The authorities are in agreement with this finding. They concur with staff on the importance of better targeting spending, and particularly subsidies. Currently, work is ongoing to improve collection and proposing a new pricing mechanism for public utilities. A significant portion of government spending is also directed towards the recapitalization of the social security fund. 11. On the revenue side, and in order to enhance non-oil revenue, the authorities will introduce tax reforms in the medium term. They intend to introduce a VAT as well as an income tax. Progress has also been achieved in establishing a macro-fiscal unit at the Ministry of Finance. Monetary policy and financial sector issues 12. Monetary policy has been accommodative since the onset of the global financial crisis. Below potential growth in the non-oil GDP, import-driven inflationary pressures, and low global interest rates; all justify an accommodative stance. Nonetheless, the CBK remains vigilant to the developments of liquidity in the banking system, and stands ready to tighten its monetary stance when market conditions signal overheating. 13. The pegged exchange rate regime continues to serve the Kuwaiti economy well. Although the U.S. dollar plays a dominant role in the basket, the exchange rate regime gives

3
the CBK a degree of flexibility in relation to the U.S. economy, in view of the differences in the business cycles of the two countries. The CBK has a set of policy instruments, such as loan-to-deposit ratio and credit growth limits, to resort to if needed. 14. The banking system remains well supervised and highly capitalized. Banks’ profitability is expected to rise with the healthy growth in the economy and the financing opportunities that will be created by the development plan. Stress tests carried out by CBK and by staff indicate a strong resiliency of banks to severe shocks. The adequate provisioning against loans to investment companies (IC) will mitigate the impact of IC risks on banks profitability. The CBK has issued new regulations in June 2010 imposing a number of prudential limits on IC liquidity, leverage, and foreign exposure. In addition, IC must meet the quantitative regulations of the CBK by 2012 to ensure that IC are undertaking a proper restructuring. The CBK continues to monitor progress in this area. Other issues 15. Kuwait is committed to continue its support to developing countries, especially through the HIPC Initiative. More recently, Kuwait pledged to support the Managing Natural Resources Wealth topical fund and the Tax Policy and Administration topical fund.