international journal of vol. 2, no.2-3, 121-130 chemical ...ijcepr.in/vol-2/issue-2-3/9.pdfbahumani...
TRANSCRIPT
International Journal of Chemical, Environmental and Chemical, Environmental and Chemical, Environmental and Chemical, Environmental and
Pharmaceutical ResearchPharmaceutical ResearchPharmaceutical ResearchPharmaceutical Research
Vol. 2, No.2-3, 121-130
May-December, 2011
Shivasharanappa, and Padaki Srinivas
Assessment of Ground Water Quality of Bidar City and its Industrial Area
for Drinking and Irrigation Purpose: A Geo-chemical Analysis
Shivasharanappa1,* and Padaki Srinivas2
1,* Department of Civil Engineering, P. D. A. College of Engineering (Autonomous Institution)
Gulbarga-585102, Karnataka, India. 2 Department of Chemistry Dept, P. D. A. College of Engineering (Autonomous Institution)
Gulbarga - 585102, Karnataka, India.
*E-mail: [email protected]
Article History: Received: 29 September 2011
Accepted: 7 October 2011
ABSTRACT
The quality of groundwater of any area is of great importance for human beings and irrigation. In order to evaluate the problems
of pollution hazards of groundwater and to ascertain its suitability for drinking and agricultural purpose in Bidar City & its
industrial area, Karnataka State, the data relating to groundwater chemical quality are analyzed from 35 wards covering the whole
city and its industrial area. The available data was analyzed and compared with standards laid down by BIS 10500:1991. The
analysis showed that in general, the quality of the groundwater is suitable for drinking purposes and also suitable for irrigation
purposes. Geo–chemical analysis through Piper diagram and US Salinity Graphs showed that water samples are primary saline
secondary alkaline groundwater
Keywords: Groundwater, Water quality standards, Water quality characteristics, Piper Diagram, U S Salinity gaph. ©2011 ijCEPr. All rights reserved
INTRODUCTION Rapid urbanization, especially in developing countries like India, has affected the availability and quality of
groundwater due to its overexploitation and improper waste disposal, especially in urban areas. According to WHO
organization, about 80% of all the diseases in human beings are caused by water. Once the groundwater is
contaminated, its quality cannot be restored back easily and to device ways and means to protect it [1, 3].
The quality of groundwater of any area is of great importance for human beings and irrigation. All the
ground waters irrespective of their source of origin contain mineral salts and their chemical properties. The kind and
concentration of these constituents depend upon various geological and physical factors. Since most of these factors
are varying from place to place, the groundwater of any region are characterized by marked difference in their
chemical properties. Since the quality of groundwater is directly or indirectly depends on its related use, there is
always a need to classify the ground waters of an area on a regional basis. In recent times the environment activists
of this area, especially ground water of Bidar city have often demonstrated against the excessive pollution. The
Karnataka Pollution Control Board has taken some measures to contain pollution of the city water and nearby river
water [11]. The objective of the present work is to discuss the suitability of groundwater for human consumption and
for irrigation purpose based on computed groundwater characteristics, quality assessment through geo–chemical
analysis by Piper Diagram and by US Salinity Graphs.
MATERIALS AND METHODS The study area Bidar City, the head quarters of the Bidar district of Karnataka State, India, is located in the
northern most part of the state of Karnataka on Deccan plateau (Figure No. 1). The city including its industrial area
is divided into 35 wards. Bidar is situated at a distance of 669 Kms. from the state capital Bangalore and at a
distance of 141 Kms from Hyderabad. Bidar City and the ancient monuments that exist today belong to the period of
Bahumani Kings in the fifteenth century. The important monumental works in Bidar are, the Kings Fort with the old
palace and other ancient monuments inside it, Madarasa Mohammad Gawan (Oldest International University),
Tombs of Barid Shahi Kings, Dargah of Hazarath Khaja –Abdul Fiaz, Tomb of Ali Barid and Tomb of Hazarath
Ziauddin Sahib.
Bidar can be located at 17°35’ north latitude and 77°32’ east longitude and its elevation is about 664 m
above the mean sea level. The climate of Bidar and its environs is reported to be pleasant and is relatively cooler
when compared to the temperatures in the neighboring districts of Karnataka. The average annual rainfall as
recorded in the previous years is 916.508 mm and 919.630 mm, the monsoon period is over four months i.e.
between June to September. The highest recorded during the above period is 925.05 mm during July month. The
Vol.2, No.2-3, 121-130(2011)
Shivasharanappa, and Padaki Srinivas 122
average maximum temperature of 43° C is recorded during the period 1963-1979 is in the month of May. The
maximum temperature however varies from 39° C to 43° C during the month of February to June and falls to 18° C
during November month. The mean annual maximum humidity observed in the morning was 62.72 per cent and the
minimum was observed in the evening was 43.7 per cent. Humidity will be least during the month of May. During
summer the predominant wind direction is westerly and during the monsoon seasons wind blows in Southwesterly
directions. During the winter seasons, the predominant wind direction is Southeasterly.
Fig.-1a: Location of Bidar City
Fig.-1b: Bidar City Map
Vol.2, No.2-3, 121-130(2011)
Shivasharanappa, and Padaki Srinivas 123
Bidar city is on the plateau being almost on its northern edge, which gives a picturesque view of the low-
lying lands on the North and East. The plateau is of irregular shape, land stretching about 35.4 Km in length and
19.3 Km in width. The plateau consists of red laterite rocky crust, of a depth varying from 30.5 m to 152.4 m
supported on impervious trap base. This has resulted in springs at the cleavages between trap and laterite rocks.
Such water springs can be observed in Bidar at Gurunanak Zheera, Narasimha Zheera, Papanasha Shiva Temple and
a few other places. The lands in Bidar and its environs drains into Manjira River (which flows in the region) is a
tributary of Godavari River. The major soil types are, Red laterite soil, Black cotton soil and a combination of the
above two types. The commonly used building materials (laterite stones) can be easily cut from laterite soil. Once
they are cut and exposed to the atmosphere, it gets harder. Some parts of the district have black cotton soil, which is
good for agricultural purposes. All reagents were analytical grade and solutions were made of distilled water.
Various water quality parameters such as alkalinity, hardness, BOD, COD etc., were determined using standard
analytical methods. The instruments used were calibrated before use for observing readings. The repeated
measurements were made to ensure precision and accuracy of results [11].
Samples were collected from all the 35 wards as per standard procedural method for the physicochemical
analysis of 17 parameters [4], it is revealed that all the parameters studied under the area are within the prescribed
limits [5, 6]
0
20
40
60
80
100
120
140
1 3 5 7 9 11 13 15 17 19 21 23 25 27 29 31 33 35
Sampling Points
To
tal H
ard
ness, C
alc
ium
Hard
ness, M
ag
nessiu
m
Hard
ness, m
g/l
TH mg/l
Ca mg/l
Mg mg/l
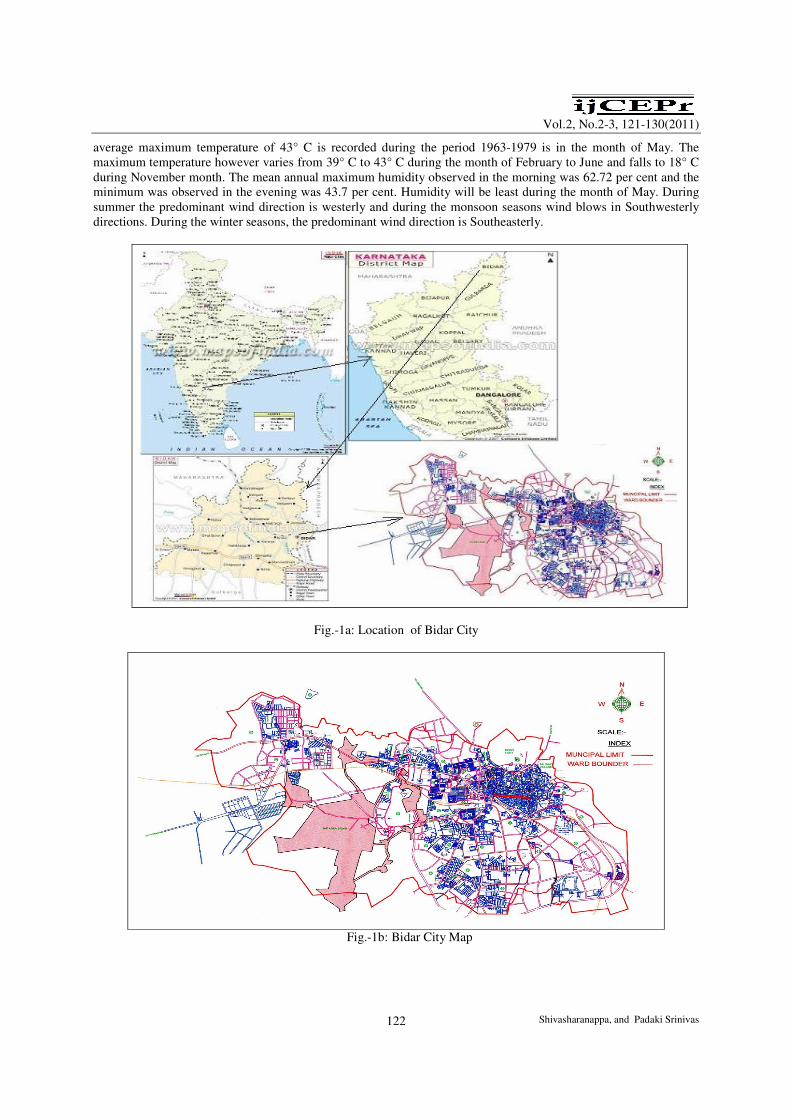
Fig.- 2: TH - Total Hardness, Ca - Calcium Hardness and Mg - Magnesium Hardness variations during the study
period
0
100
200
300
400
500
600
700
1 3 5 7 9 11 13 15 17 19 21 23 25 27 29 31 33 35
Sampling Points
Ch
lori
de, T
ota
l S
olid
s, T
ota
l
Dis
so
lved
So
lid
s, m
g/l
Cl mg/l
TS mg/l
TDS mg/l
Fig.-3: Cl - Chloride, TS - Total Solids, and TDS - Total Dissolved Solids variations during the study period
RESULTS AND DISCUSSIONS In this chapter for the purpose of revealing the water quality of 35 bore wells of 35 wards covering the study area
have been established by determining the physical and chemical characteristics as per standard methods [4]. These
parameters have been listed systematically and represented in table-2. The physical characteristics of the ground
Vol.2, No.2-3, 121-130(2011)
Shivasharanappa, and Padaki Srinivas 124
water under the study area are known by the parameters viz., pH, total dissolved solids and total solids [10]. The
chemical characteristics of the ground water under the study area are known by the parameters viz., total hardness,
calcium hardness, magnesium hardness, iron, fluoride, nitrate, chloride, sulfate, sodium, potassium, alkalinity,
manganese, zinc, and dissolved oxygen [10]. Total Hardness, Calcium Hardness & Magnesium Hardness variations
during the study period is presented in Figure No. 2. Chloride, TS & TDS variations during the study period are
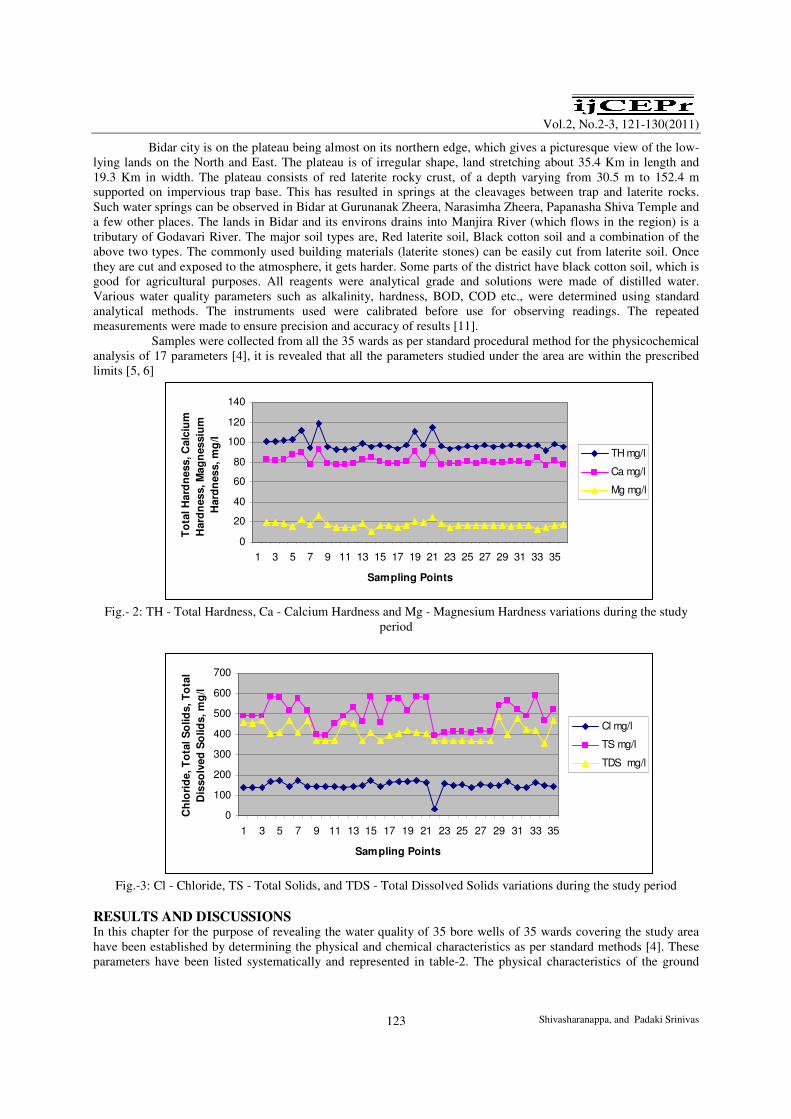
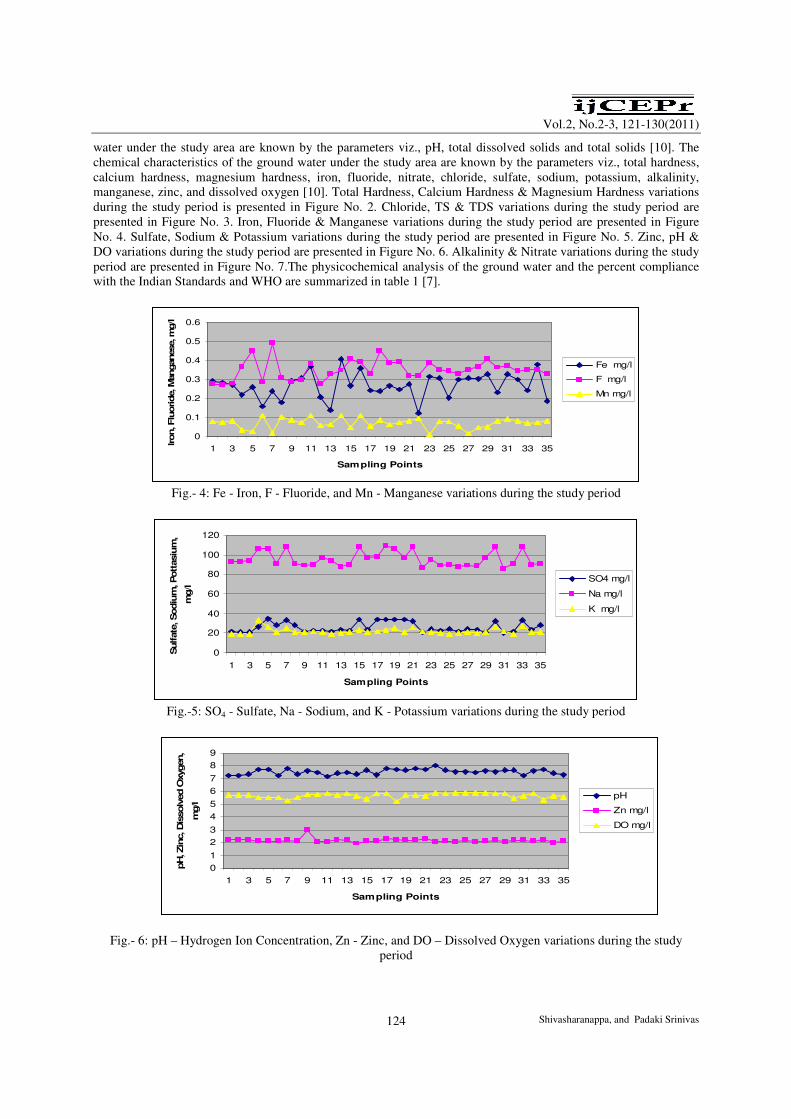
presented in Figure No. 3. Iron, Fluoride & Manganese variations during the study period are presented in Figure
No. 4. Sulfate, Sodium & Potassium variations during the study period are presented in Figure No. 5. Zinc, pH &
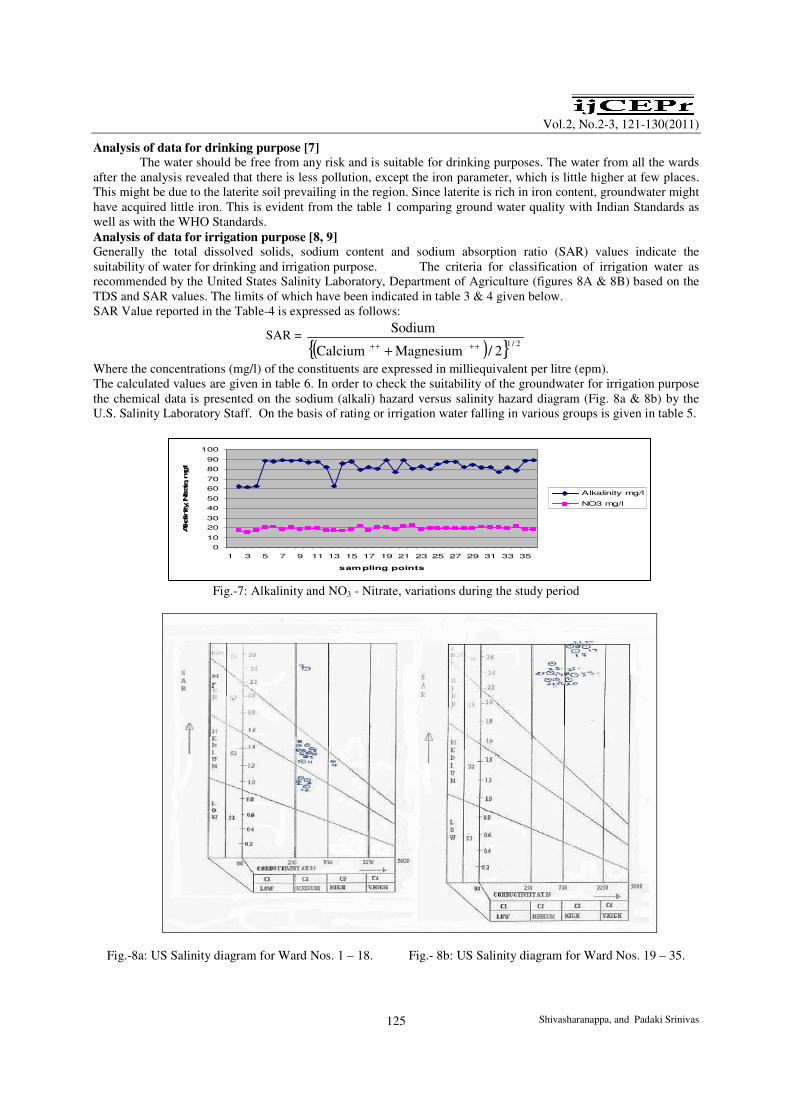
DO variations during the study period are presented in Figure No. 6. Alkalinity & Nitrate variations during the study
period are presented in Figure No. 7.The physicochemical analysis of the ground water and the percent compliance
with the Indian Standards and WHO are summarized in table 1 [7].
0
0.1
0.2
0.3
0.4
0.5
0.6
1 3 5 7 9 11 13 15 17 19 21 23 25 27 29 31 33 35
Sampling Points
Iron, Flu
oride, M
anganese, m
g/l
Fe mg/l
F mg/l
Mn mg/l
Fig.- 4: Fe - Iron, F - Fluoride, and Mn - Manganese variations during the study period
0
20
40
60
80
100
120
1 3 5 7 9 11 13 15 17 19 21 23 25 27 29 31 33 35
Sampling Points
Sulfate
, Sodiu
m, Pott
asiu
m,
mg/l
SO4 mg/l
Na mg/l
K mg/l
Fig.-5: SO4 - Sulfate, Na - Sodium, and K - Potassium variations during the study period
0
1
2
3
4
5
6
7
8
9
1 3 5 7 9 11 13 15 17 19 21 23 25 27 29 31 33 35
Sampling Points
pH
, Zin
c, D
issolv
ed O
xygen,
mg/l
pH
Zn mg/l
DO mg/l
Fig.- 6: pH – Hydrogen Ion Concentration, Zn - Zinc, and DO – Dissolved Oxygen variations during the study
period
Vol.2, No.2-3, 121-130(2011)
Shivasharanappa, and Padaki Srinivas 125
Analysis of data for drinking purpose [7]
The water should be free from any risk and is suitable for drinking purposes. The water from all the wards
after the analysis revealed that there is less pollution, except the iron parameter, which is little higher at few places.
This might be due to the laterite soil prevailing in the region. Since laterite is rich in iron content, groundwater might
have acquired little iron. This is evident from the table 1 comparing ground water quality with Indian Standards as
well as with the WHO Standards.
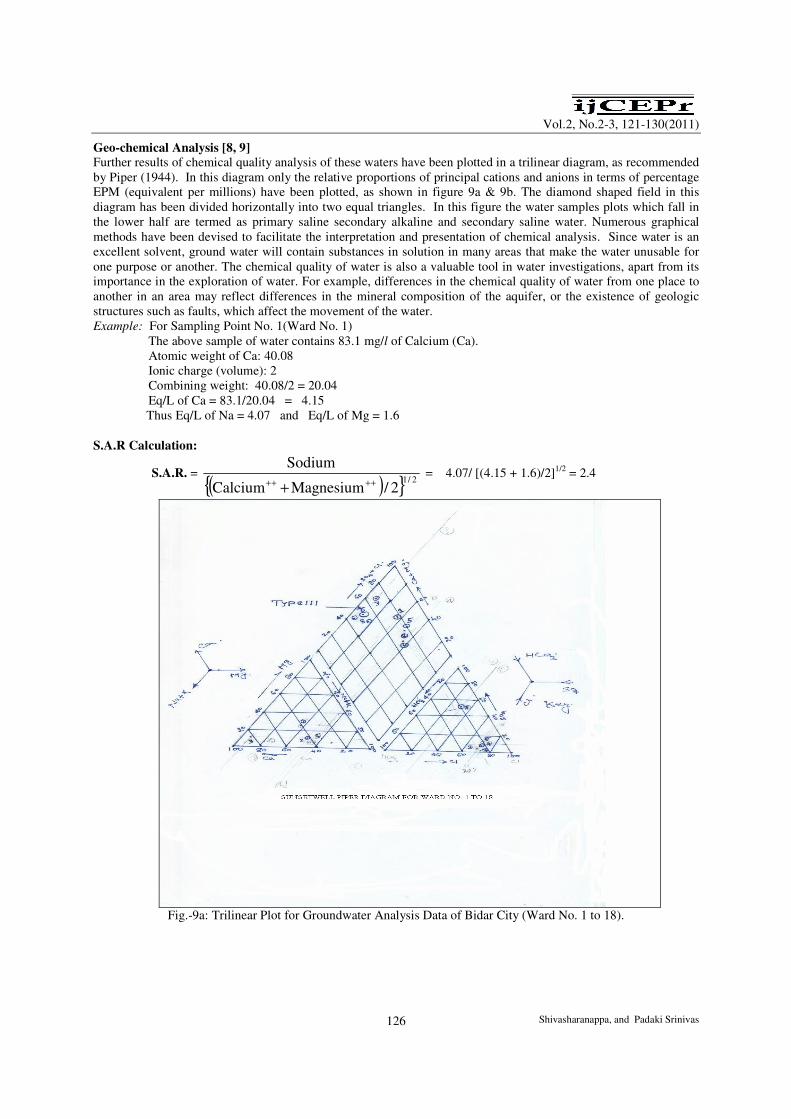
Analysis of data for irrigation purpose [8, 9]
Generally the total dissolved solids, sodium content and sodium absorption ratio (SAR) values indicate the
suitability of water for drinking and irrigation purpose. The criteria for classification of irrigation water as
recommended by the United States Salinity Laboratory, Department of Agriculture (figures 8A & 8B) based on the
TDS and SAR values. The limits of which have been indicated in table 3 & 4 given below.
SAR Value reported in the Table-4 is expressed as follows:
SAR =
( ){ } 2/12/MagnesiumCalcium
Sodium
+++++
Where the concentrations (mg/l) of the constituents are expressed in milliequivalent per litre (epm).
The calculated values are given in table 6. In order to check the suitability of the groundwater for irrigation purpose
the chemical data is presented on the sodium (alkali) hazard versus salinity hazard diagram (Fig. 8a & 8b) by the
U.S. Salinity Laboratory Staff. On the basis of rating or irrigation water falling in various groups is given in table 5.
0
10
20
30
40
50
60
70
80
90
100
1 3 5 7 9 11 13 15 17 19 21 23 25 27 29 31 33 35
sampling points
Alkalinity, Nitrate, mg/l
Alkalinity mg/l
NO3 mg/l
Fig.-7: Alkalinity and NO3 - Nitrate, variations during the study period
Fig.-8a: US Salinity diagram for Ward Nos. 1 – 18. Fig.- 8b: US Salinity diagram for Ward Nos. 19 – 35.
Vol.2, No.2-3, 121-130(2011)
Shivasharanappa, and Padaki Srinivas 126
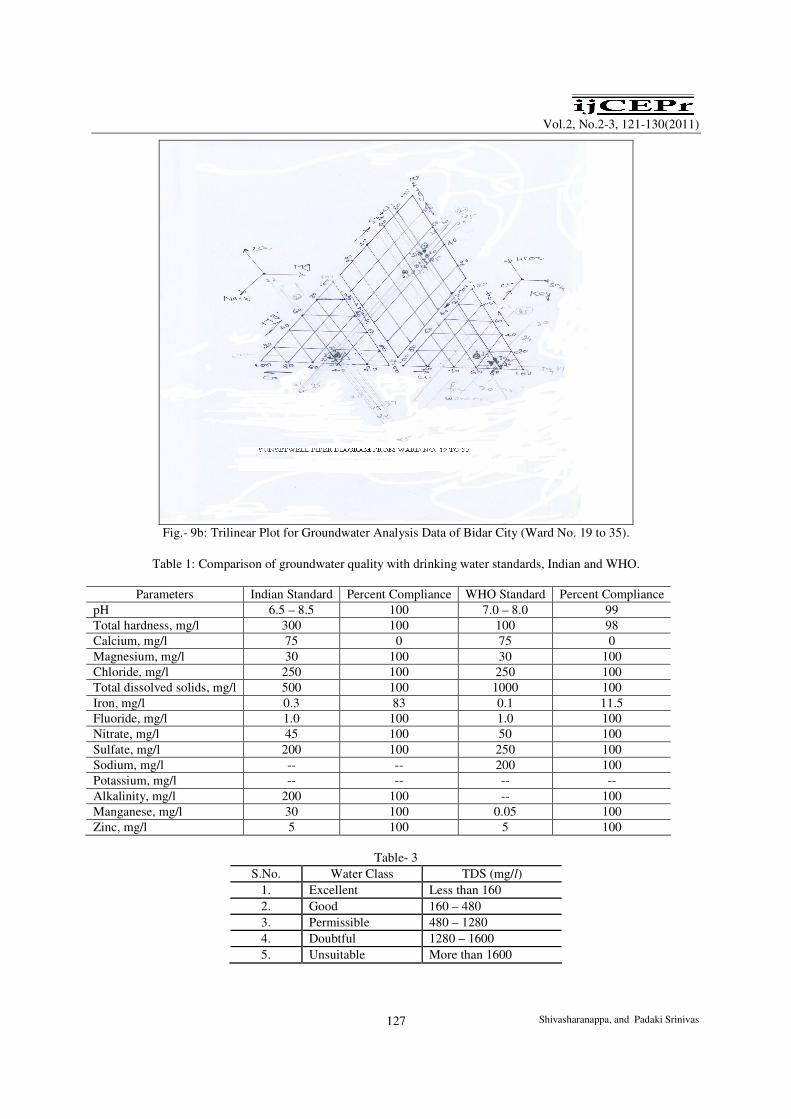
Geo-chemical Analysis [8, 9]
Further results of chemical quality analysis of these waters have been plotted in a trilinear diagram, as recommended
by Piper (1944). In this diagram only the relative proportions of principal cations and anions in terms of percentage
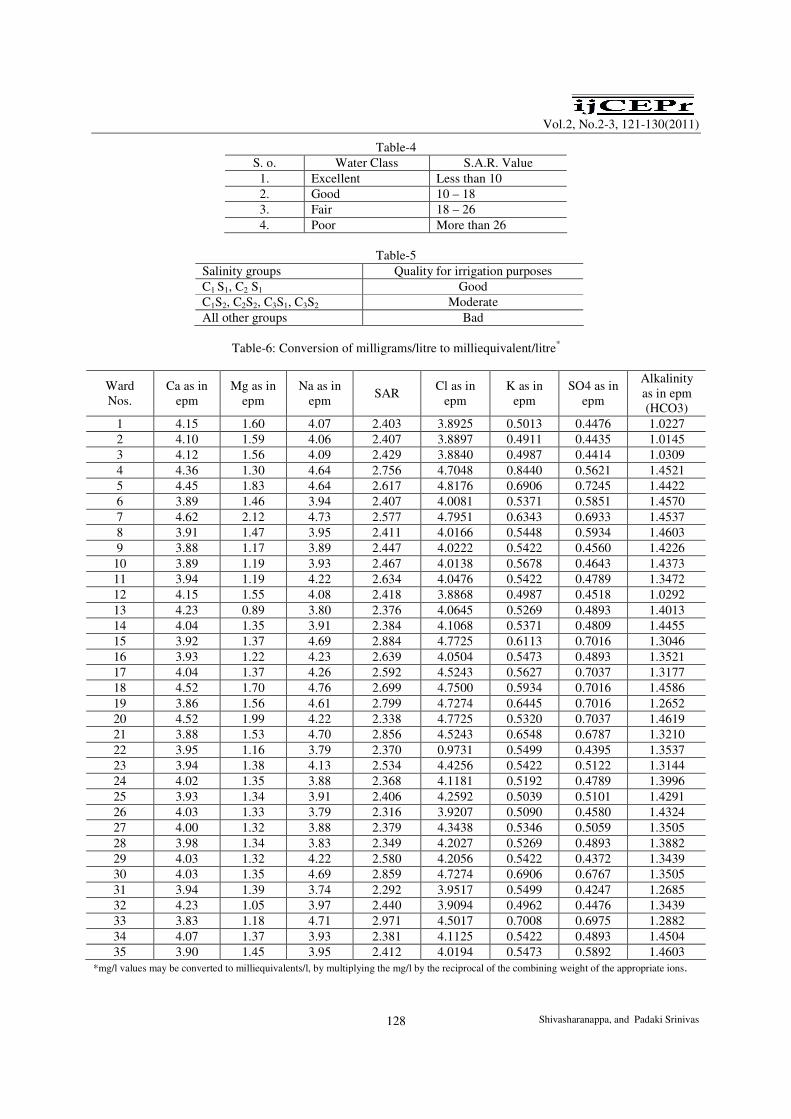
EPM (equivalent per millions) have been plotted, as shown in figure 9a & 9b. The diamond shaped field in this
diagram has been divided horizontally into two equal triangles. In this figure the water samples plots which fall in
the lower half are termed as primary saline secondary alkaline and secondary saline water. Numerous graphical
methods have been devised to facilitate the interpretation and presentation of chemical analysis. Since water is an
excellent solvent, ground water will contain substances in solution in many areas that make the water unusable for
one purpose or another. The chemical quality of water is also a valuable tool in water investigations, apart from its
importance in the exploration of water. For example, differences in the chemical quality of water from one place to
another in an area may reflect differences in the mineral composition of the aquifer, or the existence of geologic
structures such as faults, which affect the movement of the water.
Example: For Sampling Point No. 1(Ward No. 1)
The above sample of water contains 83.1 mg/l of Calcium (Ca).
Atomic weight of Ca: 40.08
Ionic charge (volume): 2
Combining weight: 40.08/2 = 20.04
Eq/L of Ca = 83.1/20.04 = 4.15
Thus Eq/L of Na = 4.07 and Eq/L of Mg = 1.6
S.A.R Calculation:
S.A.R. =
( ){ } 2/12/MagnesiumCalcium
Sodium
+++++
= 4.07/ [(4.15 + 1.6)/2]1/2
= 2.4
Fig.-9a: Trilinear Plot for Groundwater Analysis Data of Bidar City (Ward No. 1 to 18).
Vol.2, No.2-3, 121-130(2011)
Shivasharanappa, and Padaki Srinivas 127
Fig.- 9b: Trilinear Plot for Groundwater Analysis Data of Bidar City (Ward No. 19 to 35).
Table 1: Comparison of groundwater quality with drinking water standards, Indian and WHO.
Parameters Indian Standard Percent Compliance WHO Standard Percent Compliance
pH 6.5 – 8.5 100 7.0 – 8.0 99
Total hardness, mg/l 300 100 100 98
Calcium, mg/l 75 0 75 0
Magnesium, mg/l 30 100 30 100
Chloride, mg/l 250 100 250 100
Total dissolved solids, mg/l 500 100 1000 100
Iron, mg/l 0.3 83 0.1 11.5
Fluoride, mg/l 1.0 100 1.0 100
Nitrate, mg/l 45 100 50 100
Sulfate, mg/l 200 100 250 100
Sodium, mg/l -- -- 200 100
Potassium, mg/l -- -- -- --
Alkalinity, mg/l 200 100 -- 100
Manganese, mg/l 30 100 0.05 100
Zinc, mg/l 5 100 5 100
Table- 3
S.No. Water Class TDS (mg/l)
1. Excellent Less than 160
2. Good 160 – 480
3. Permissible 480 – 1280
4. Doubtful 1280 – 1600
5. Unsuitable More than 1600
Vol.2, No.2-3, 121-130(2011)
Shivasharanappa, and Padaki Srinivas 128
Table-4
S. o. Water Class S.A.R. Value
1. Excellent Less than 10
2. Good 10 – 18
3. Fair 18 – 26
4. Poor More than 26
Table-5
Salinity groups Quality for irrigation purposes
C1 S1, C2 S1 Good
C1S2, C2S2, C3S1, C3S2 Moderate
All other groups Bad
Table-6: Conversion of milligrams/litre to milliequivalent/litre*
Ward
Nos.
Ca as in
epm
Mg as in
epm
Na as in
epm SAR
Cl as in
epm
K as in
epm
SO4 as in
epm
Alkalinity
as in epm
(HCO3)
1 4.15 1.60 4.07 2.403 3.8925 0.5013 0.4476 1.0227
2 4.10 1.59 4.06 2.407 3.8897 0.4911 0.4435 1.0145
3 4.12 1.56 4.09 2.429 3.8840 0.4987 0.4414 1.0309
4 4.36 1.30 4.64 2.756 4.7048 0.8440 0.5621 1.4521
5 4.45 1.83 4.64 2.617 4.8176 0.6906 0.7245 1.4422
6 3.89 1.46 3.94 2.407 4.0081 0.5371 0.5851 1.4570
7 4.62 2.12 4.73 2.577 4.7951 0.6343 0.6933 1.4537
8 3.91 1.47 3.95 2.411 4.0166 0.5448 0.5934 1.4603
9 3.88 1.17 3.89 2.447 4.0222 0.5422 0.4560 1.4226
10 3.89 1.19 3.93 2.467 4.0138 0.5678 0.4643 1.4373
11 3.94 1.19 4.22 2.634 4.0476 0.5422 0.4789 1.3472
12 4.15 1.55 4.08 2.418 3.8868 0.4987 0.4518 1.0292
13 4.23 0.89 3.80 2.376 4.0645 0.5269 0.4893 1.4013
14 4.04 1.35 3.91 2.384 4.1068 0.5371 0.4809 1.4455
15 3.92 1.37 4.69 2.884 4.7725 0.6113 0.7016 1.3046
16 3.93 1.22 4.23 2.639 4.0504 0.5473 0.4893 1.3521
17 4.04 1.37 4.26 2.592 4.5243 0.5627 0.7037 1.3177
18 4.52 1.70 4.76 2.699 4.7500 0.5934 0.7016 1.4586
19 3.86 1.56 4.61 2.799 4.7274 0.6445 0.7016 1.2652
20 4.52 1.99 4.22 2.338 4.7725 0.5320 0.7037 1.4619
21 3.88 1.53 4.70 2.856 4.5243 0.6548 0.6787 1.3210
22 3.95 1.16 3.79 2.370 0.9731 0.5499 0.4395 1.3537
23 3.94 1.38 4.13 2.534 4.4256 0.5422 0.5122 1.3144
24 4.02 1.35 3.88 2.368 4.1181 0.5192 0.4789 1.3996
25 3.93 1.34 3.91 2.406 4.2592 0.5039 0.5101 1.4291
26 4.03 1.33 3.79 2.316 3.9207 0.5090 0.4580 1.4324
27 4.00 1.32 3.88 2.379 4.3438 0.5346 0.5059 1.3505
28 3.98 1.34 3.83 2.349 4.2027 0.5269 0.4893 1.3882
29 4.03 1.32 4.22 2.580 4.2056 0.5422 0.4372 1.3439
30 4.03 1.35 4.69 2.859 4.7274 0.6906 0.6767 1.3505
31 3.94 1.39 3.74 2.292 3.9517 0.5499 0.4247 1.2685
32 4.23 1.05 3.97 2.440 3.9094 0.4962 0.4476 1.3439
33 3.83 1.18 4.71 2.971 4.5017 0.7008 0.6975 1.2882
34 4.07 1.37 3.93 2.381 4.1125 0.5422 0.4893 1.4504
35 3.90 1.45 3.95 2.412 4.0194 0.5473 0.5892 1.4603
*mg/l values may be converted to milliequivalents/l, by multiplying the mg/l by the reciprocal of the combining weight of the appropriate ions.
Vol.2, No.2-3, 121-130(2011)
Shivasharanappa, and Padaki Srinivas 129
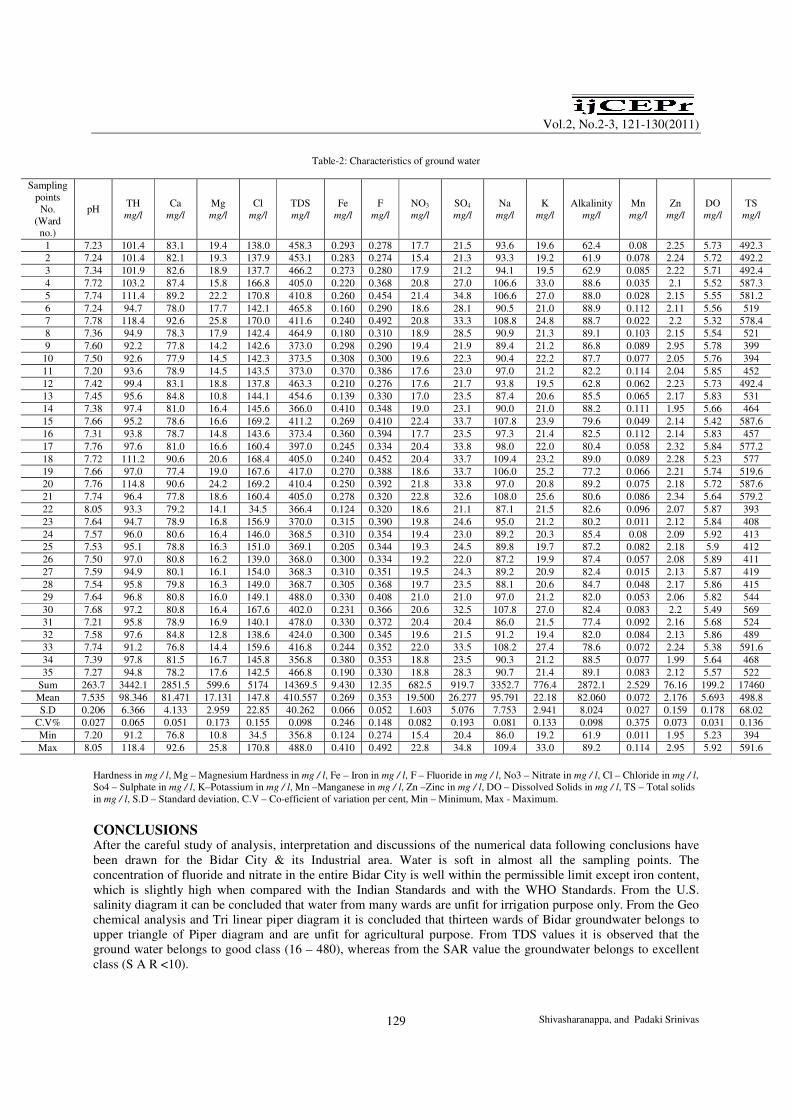
Table-2: Characteristics of ground water
Sampling
points
No.
(Ward
no.)
pH TH
mg/l
Ca
mg/l
Mg
mg/l
Cl
mg/l
TDS
mg/l
Fe
mg/l
F
mg/l
NO3
mg/l
SO4
mg/l
Na
mg/l
K
mg/l
Alkalinity
mg/l
Mn
mg/l
Zn
mg/l
DO
mg/l
TS
mg/l
1 7.23 101.4 83.1 19.4 138.0 458.3 0.293 0.278 17.7 21.5 93.6 19.6 62.4 0.08 2.25 5.73 492.3
2 7.24 101.4 82.1 19.3 137.9 453.1 0.283 0.274 15.4 21.3 93.3 19.2 61.9 0.078 2.24 5.72 492.2
3 7.34 101.9 82.6 18.9 137.7 466.2 0.273 0.280 17.9 21.2 94.1 19.5 62.9 0.085 2.22 5.71 492.4
4 7.72 103.2 87.4 15.8 166.8 405.0 0.220 0.368 20.8 27.0 106.6 33.0 88.6 0.035 2.1 5.52 587.3
5 7.74 111.4 89.2 22.2 170.8 410.8 0.260 0.454 21.4 34.8 106.6 27.0 88.0 0.028 2.15 5.55 581.2
6 7.24 94.7 78.0 17.7 142.1 465.8 0.160 0.290 18.6 28.1 90.5 21.0 88.9 0.112 2.11 5.56 519
7 7.78 118.4 92.6 25.8 170.0 411.6 0.240 0.492 20.8 33.3 108.8 24.8 88.7 0.022 2.2 5.32 578.4
8 7.36 94.9 78.3 17.9 142.4 464.9 0.180 0.310 18.9 28.5 90.9 21.3 89.1 0.103 2.15 5.54 521
9 7.60 92.2 77.8 14.2 142.6 373.0 0.298 0.290 19.4 21.9 89.4 21.2 86.8 0.089 2.95 5.78 399
10 7.50 92.6 77.9 14.5 142.3 373.5 0.308 0.300 19.6 22.3 90.4 22.2 87.7 0.077 2.05 5.76 394
11 7.20 93.6 78.9 14.5 143.5 373.0 0.370 0.386 17.6 23.0 97.0 21.2 82.2 0.114 2.04 5.85 452
12 7.42 99.4 83.1 18.8 137.8 463.3 0.210 0.276 17.6 21.7 93.8 19.5 62.8 0.062 2.23 5.73 492.4
13 7.45 95.6 84.8 10.8 144.1 454.6 0.139 0.330 17.0 23.5 87.4 20.6 85.5 0.065 2.17 5.83 531
14 7.38 97.4 81.0 16.4 145.6 366.0 0.410 0.348 19.0 23.1 90.0 21.0 88.2 0.111 1.95 5.66 464
15 7.66 95.2 78.6 16.6 169.2 411.2 0.269 0.410 22.4 33.7 107.8 23.9 79.6 0.049 2.14 5.42 587.6
16 7.31 93.8 78.7 14.8 143.6 373.4 0.360 0.394 17.7 23.5 97.3 21.4 82.5 0.112 2.14 5.83 457
17 7.76 97.6 81.0 16.6 160.4 397.0 0.245 0.334 20.4 33.8 98.0 22.0 80.4 0.058 2.32 5.84 577.2
18 7.72 111.2 90.6 20.6 168.4 405.0 0.240 0.452 20.4 33.7 109.4 23.2 89.0 0.089 2.28 5.23 577
19 7.66 97.0 77.4 19.0 167.6 417.0 0.270 0.388 18.6 33.7 106.0 25.2 77.2 0.066 2.21 5.74 519.6
20 7.76 114.8 90.6 24.2 169.2 410.4 0.250 0.392 21.8 33.8 97.0 20.8 89.2 0.075 2.18 5.72 587.6
21 7.74 96.4 77.8 18.6 160.4 405.0 0.278 0.320 22.8 32.6 108.0 25.6 80.6 0.086 2.34 5.64 579.2
22 8.05 93.3 79.2 14.1 34.5 366.4 0.124 0.320 18.6 21.1 87.1 21.5 82.6 0.096 2.07 5.87 393
23 7.64 94.7 78.9 16.8 156.9 370.0 0.315 0.390 19.8 24.6 95.0 21.2 80.2 0.011 2.12 5.84 408
24 7.57 96.0 80.6 16.4 146.0 368.5 0.310 0.354 19.4 23.0 89.2 20.3 85.4 0.08 2.09 5.92 413
25 7.53 95.1 78.8 16.3 151.0 369.1 0.205 0.344 19.3 24.5 89.8 19.7 87.2 0.082 2.18 5.9 412
26 7.50 97.0 80.8 16.2 139.0 368.0 0.300 0.334 19.2 22.0 87.2 19.9 87.4 0.057 2.08 5.89 411
27 7.59 94.9 80.1 16.1 154.0 368.3 0.310 0.351 19.5 24.3 89.2 20.9 82.4 0.015 2.13 5.87 419
28 7.54 95.8 79.8 16.3 149.0 368.7 0.305 0.368 19.7 23.5 88.1 20.6 84.7 0.048 2.17 5.86 415
29 7.64 96.8 80.8 16.0 149.1 488.0 0.330 0.408 21.0 21.0 97.0 21.2 82.0 0.053 2.06 5.82 544
30 7.68 97.2 80.8 16.4 167.6 402.0 0.231 0.366 20.6 32.5 107.8 27.0 82.4 0.083 2.2 5.49 569
31 7.21 95.8 78.9 16.9 140.1 478.0 0.330 0.372 20.4 20.4 86.0 21.5 77.4 0.092 2.16 5.68 524
32 7.58 97.6 84.8 12.8 138.6 424.0 0.300 0.345 19.6 21.5 91.2 19.4 82.0 0.084 2.13 5.86 489
33 7.74 91.2 76.8 14.4 159.6 416.8 0.244 0.352 22.0 33.5 108.2 27.4 78.6 0.072 2.24 5.38 591.6
34 7.39 97.8 81.5 16.7 145.8 356.8 0.380 0.353 18.8 23.5 90.3 21.2 88.5 0.077 1.99 5.64 468
35 7.27 94.8 78.2 17.6 142.5 466.8 0.190 0.330 18.8 28.3 90.7 21.4 89.1 0.083 2.12 5.57 522
Sum 263.7 3442.1 2851.5 599.6 5174 14369.5 9.430 12.35 682.5 919.7 3352.7 776.4 2872.1 2.529 76.16 199.2 17460
Mean 7.535 98.346 81.471 17.131 147.8 410.557 0.269 0.353 19.500 26.277 95.791 22.18 82.060 0.072 2.176 5.693 498.8
S.D 0.206 6.366 4.133 2.959 22.85 40.262 0.066 0.052 1.603 5.076 7.753 2.941 8.024 0.027 0.159 0.178 68.02
C.V% 0.027 0.065 0.051 0.173 0.155 0.098 0.246 0.148 0.082 0.193 0.081 0.133 0.098 0.375 0.073 0.031 0.136
Min 7.20 91.2 76.8 10.8 34.5 356.8 0.124 0.274 15.4 20.4 86.0 19.2 61.9 0.011 1.95 5.23 394
Max 8.05 118.4 92.6 25.8 170.8 488.0 0.410 0.492 22.8 34.8 109.4 33.0 89.2 0.114 2.95 5.92 591.6
Hardness in mg / l, Mg – Magnesium Hardness in mg / l, Fe – Iron in mg / l, F – Fluoride in mg / l, No3 – Nitrate in mg / l, Cl – Chloride in mg / l,
So4 – Sulphate in mg / l, K–Potassium in mg / l, Mn –Manganese in mg / l, Zn –Zinc in mg / l, DO – Dissolved Solids in mg / l, TS – Total solids
in mg / l, S.D – Standard deviation, C.V – Co-efficient of variation per cent, Min – Minimum, Max - Maximum.
CONCLUSIONS After the careful study of analysis, interpretation and discussions of the numerical data following conclusions have
been drawn for the Bidar City & its Industrial area. Water is soft in almost all the sampling points. The
concentration of fluoride and nitrate in the entire Bidar City is well within the permissible limit except iron content,
which is slightly high when compared with the Indian Standards and with the WHO Standards. From the U.S.
salinity diagram it can be concluded that water from many wards are unfit for irrigation purpose only. From the Geo
chemical analysis and Tri linear piper diagram it is concluded that thirteen wards of Bidar groundwater belongs to
upper triangle of Piper diagram and are unfit for agricultural purpose. From TDS values it is observed that the
ground water belongs to good class (16 – 480), whereas from the SAR value the groundwater belongs to excellent
class (S A R <10).
Vol.2, No.2-3, 121-130(2011)
Shivasharanappa, and Padaki Srinivas 130
ACKNOWLEDGEMENTS Thanks to Hyderabad Karnataka Education Society Gulbarga, Karnataka State, India.
REFERENCES 1. Maniyar M.A., Evaluation of Groundwater Quality of the Bore wells of Gulbarga city maintained by UWS
and D Board. M.E. Dissertation Submitted to Gulbarga University Gulbarga (1990)16.
2. Mise S.R., Wastewater Characterization of Gulbarga City (Zones ‘A’ & ‘B’). M.E., Environmental
issertation Work Submitted to Gulbarga University Gulbarga (1988) 28 .
3. Shivasharanappa, Wastewater Characterization of Gulbarga City (Zone ‘C’). M.E., Environmenta
issertation Work Submitted to Gulbarga University Gulbarga (1988) 30.
4. ]PHA (American Public Health Association) Standard methods for examination of water and
wastewaterSpecifications, Washington DC, 6, 19th
edition (2003)
5. Bureau of Indian Standards (IS 10500:1991), Edition 2.1(1993)
6. WHO (World Health Organization) Guidelines for drinking water quality, 2nd
Edition, 1(1993)188.
7. Ramakrishniah C.R. et. al., E-Journal of Chemistry, 6(2) (2009)523.
8. Jain R. et. al., Journal of Indian Public Health Engineering, India, 1, 2001
9. Talebi A. et. al., Journal Indian Association of Environmental Management, 21 (1994) 8.
10. Bhattacharjee K. K. and Bhattacharya K. G., Journal of Environmental Science & Engineering, 52(2)
(2010)121.
11. Patil N. et. al., International Journal of Applied Biology and Pharmaceutical Technology,2 (2010)518
[IJCEPR-191/2011]
New Journal
WaterR&D ISSN: 2249-2003
[April, August and December]
All articles will be peer-reviewed.
www.waterrnd.com
Water: Research & Development [April, August and December]
All articles will be peer-reviewed.
Scope and Coverage: Water: Research & Development [Water R&D] is an international Research Journal,
dedicated to ‘Water’. It is a truly interdisciplinary journal on water science and
technology. It’ll showcase the latest research related to Water in the field of chemistry,
physics, biology, agricultural, food, pharmaceutical science, and environmental,
oceanographic, and atmospheric science. It includes publication of reviews, regular
research papers, case studies, communications and short notes.
Its Coverage area is:
Water Pollution; Ecology of water resources, including groundwater; Monitoring,
remediation and conservation of water resources; Rain Water Harvesting; Absorption and
Remediation; Aquatic and Marine life ; Corrosion ; Industrial Effluent treatments; Physics,
Chemistry and Biology of water; Water, as a Green solvent/ Reaction Medium;
Management of water resources and water provision; Wastewater and water treatment;
Water related Rules, Policies, Laws; Dyes and Pigments; Water and Health; Sustainable
use of water; Policies and Regulations about water; Degradation of aquatic ecosystem;
Water Footprints and Virtual water calculations.
All submissions are addressed to the Editor-in-Chief at Editorial office address or by e-
mail to: [email protected].
*Note: If you think you may be a
potential reviewer for water related
manuscripts, please send your CV and
Photo to the Editor.
WaterR&D 23 ‘Anukampa’, Janakpuri, Opp. Heerapura Power Stn., Ajmer Road, Jaipur-302024 (India)
E-mail : [email protected] ; Phone : 0141-2810628(Off.), 07597925412(Mob.)