international journal of scientific research - ijsrst.comijsrst.com/paper/v2i4.pdf · international...
TRANSCRIPT


i
International Journal of Scientific Research
in Science and Technology
Print ISSN: 2395-6011 Online ISSN : 2395-602X
Volume 2, Issue 4, July-August-2016
International Peer Reviewed, Open Access Journal
Bimonthly Publication
Published By
Technoscience Academy
(The International Open Access Publisher)
Email: [email protected]
Website: www.technoscienceacademy.com

ii
Advisory/Editorial Board
Dr. Manish Shorey, Bangalore, Karnataka
Dr. M. K. Rameshaiah, Bangalore, Karnataka
Dr. V. S. Majumdar, Pune, Maharashtra
Prof. Shardul Agravat, Surendranagar, Gujarat, India
Dr. Sundeep Sinha, Delhi, Gujarat, India
Dr. Ashish Sharma, Delhi, Gujarat, India
Prof. Vaishali Kalaria, RKU, Rajkot, Gujarat, India
Prof. H. B. Jethva, L. D. College of Engineering, Ahmedabad, Gujarat, India
Prof. Bakul Panchal, L. D. College of Engineering, Ahmedabad, Gujarat, India
Prof. Bhavesh Prajapati, Government MCA College Maninagar, Ahmedabad, Gujarat, India
Prof. Amod Pandurang Shrotri, Shivaji University, Kolhapur, Maharashtra, India
Prof. Sunil Kulkarni, Datta Meghe College of Engg. Airoli,Mumbai, Maharashtra, India
Prof. Atishey Mittal, S.R.M. University, NCR Campus, Modinagar, Ghaziabad, Uttar Pradesh, India
Dr. Syed Umar, Dept. of Computer Science and Engineering, KL University, Guntur, Andhra Pradesh, India
Dr. S. Ahmed John, Jamal Mohamed College, Tiruchirappalli, India
Prof. S. Jagadeesan, Nandha Engineering College Erode, Tamil Nadu, India
Dr. Faisal Talib, IIT Roorkee(PhD), Aligarh, Uttar Pradesh, India
Prof. Joshi Rahul Prakashchandra, Parul Institute of Engineering & Technology, Vadodara, Gujarat, India
Dr. Aftab Alam Tyagi, Department of Mathematics, SRM University NCR Campus, Uttar Pradesh, India
Dr. Sudhir Kumar, Department of Mathematics, S.D. (P.G.) College, Uttar Pradesh, India
Dr. Rimple Pundir, Nagar, Uttar Pradesh, India
Prof (Dr.) Umesh Kumar, Dept of Science & Technology, Govt. Women’s Polytechnic, Ranchi,Jharkhand,India
Abhishek Shukla, R. D. Engineering College Technical Campus, Ghaziabad, Uttar Pradesh, India
Dr. Balram Panigrahi, Soil & Water Conservation Engineering, College of Agricultural Engg. & Techn. Orissa University Of Agriculture & Technology, Bhubanmeswar, Odisha, India
Dr. Anant Lalchand Chaudhari, Department of Electronics, Arts, Science & Commerce College, Chopda, Jalgaon, Maharashtra India
Dr. N. Pughazendi, Computer Science and Engineering, Panimalar Engineering College Chennai, Tamilnadu, India
Dr. V. Ananthaswamy, Department of Mathematics, The Madura College, Madurai, Tamil Nadu, India

iii
Rakesh K. Bumataria, Mechanical Engineering, Marwadi Education Foundation's Group of Institutions Rajkot, Gujarat, India
Dr. Arvind Bijalwan, Indian Institute of Forest Management (IIFM) (Ministry of Environment & Forests, Govt. of India) Bhopal, Madhya Pradesh, India
Sharvil D. Shah, Mechanical Engineering Dept. Parul Institute Of Engg. & Tech, Vadodara, Gujarat, India
Dr. Aditya Kishore Dash, Department of Environmental Engineering, Institute of Technical Education and Research (ITER), S’O’A University, Bhubaneswar, Odisha, India
Dr. Subha Ganguly, Department of Veterinary Microbiology Arawali Veterinary College, Bajor, Rajasthan, India
Dr. Shivakumar Singh, MVS Govt UG & PG College, Palamuru University, Mahabubnagr, Telangana, India
Md Irfan Ahmed, Power System, Sityog Institute Of Technology Aurangabad, Bihar , India
A. Dinesh Kumar, Mathematics, Dhanalakshmi Srinivasan Engineering College, Perambalur, Tamilnadu, India
Shyam Lal Sharma, Mechanical Engineering, Department, AFSET, Al Falah University, Dhauj, Faridabad, India
Prof (Dr.) Hardeep Singh, Electronics & Communication Engineering Department, Indo Global College of Engineering, Abhipur, District Mohali, Punjab, India
S. R. Boselin Prabhu, Anna University Chennai, Tamilnadu, India
N.R.Shingala, Department of Mechanical Engineering, VVP Engineering College, Rajkot, Gujarat, India
R. G. Vaghela, Mechanical Engineering, Atmiya Institute of Technology & Science, Rajkot, Gujarat, India
S. Mayakannan, Vidyaa Vikas College of Engineering & Technology, Tiruchengode, Tamil Nadu, India
R. Girimurugan, Nandha College of Technology, Erode, Tamil Nadu, India
Achal Garg, Structural Section, Keppel Offshore and Marine Engineering, Mumbai, India
Velladurai Chinnappillai, Department of Animal Repoduction, Gynaecology and Obstetrics, Veterinary College And Research Institute, Tamil Nadu Veterinary and Animal Sciences University, Namakkal, Tamil Nadu, India
Sachin Narendra Pardeshi, Department of Computer Engineering, R.C.Patel Institute of Technology, Shirpur, Maharashtra, India
Hari Krishna, Department of Chemistry, Jagans College of Engineering & Technology, Choutapalem, Vikrama Simhapuri University, Nellore, Andhra Pradesh, India
Rajnish Kumar, Amity Institute of Biotechnology, Amity University, Uttar Pradesh, Lucknow Campus, Uttar Pradesh, India
Dr. Meenakshi Sharma, Medical Biotechnology, Dr B.R. Ambedkar Centre for Biomedical Research, University of Delhi, Delhi, India
Dr. P. Vijayarengan, Department of Botany, Annamalai University, Annamalainagar, Tamil Nadu, India
Dr. Vishnu Narayan Mishra, Applied Mathematics and Humanities Department, Sardar Vallabhbhai National Institute of Technology, Ichchhanath Mahadev Dumas Road, Surat, Gujarat, India
Dr. Bangole Narendra Kumar, Department of Computer Science and Systems Engineering, Sree Vidyanikethan Engineering College, Tirupati, Andhra Pradesh, India

iv
International Advisory/Editorial Board
Prof. Sundeep Singh, Mississauga, Ontario, Canada
Dr. Scheiber Lazarova, Germany
Dr. Reckeweg Ulmet, Germany
Dr. Carly Pouladi,Vancouver, Canada
Dr. Gheorghe Nagy, Romania
Dr. Anja Siersbæk,Odense, Danmark
Dr. Daniala Paoloni Zurich, Switzerland
Dr. Joseph Easton, Boston, USA
Dr. Eliana Lu, USA
Dr. M. Chithirai Pon Selvan, Mechanical Engineering, Amity University, Dubai
Dr. Md. Abdullah Al Humayun, School of Electrical Systems Engineering, University Malaysia, Perlis,
Malaysia
Dr. V. Balaji, Bahir Dar University, Bahir Dar, Ethiopia
Lusekelo Kibona, Department of Computer Science, Ruaha Catholic University (RUCU) , Iringa,
Tanzania
Dr. Mohamed Abdel Fattah Ashabrawy, Reactors Department, Atomic Energy Authority, Egypt
Mohammed Noaman Murad, Department of Computer Science, Cihan University Erbil, Kurdistan
Region, Iraq
Dr. Abul Salam, UAE University, Department of Geography and Urban Planning, UAE
Md. Amir Hossain, IBAIS University/Uttara University, Dhaka, Bangladesh
Dr. Amer Taqa, Department of Dental Basic Science College of Dentistry, Mosul University, Iraq
Prof. Dr. H. M. Srivastava, Department of Mathematics and Statistics, University of Victoria, Victoria,
British Columbia, Canada
AJENIKOKO Ganiyu Adedayo, Electronic and Electrical Engineering, Ladoke Akintola University of
Technology, Ogbomosho, Nigeria
Dr. A. Heidari, Ph.D., D.Sc., Faculty of Chemistry, California South University (CSU), Irvine, California,
USA
Dr. Entessar Al Jbawi, General Commission for Scientific Agricultural Research,Crops Research

v
Administration, Sugar Beet Department, Baramqa, Damascus, Syria
Md. Kamrul Hasan, English Language Institute, United International University Universiti Utara
Malaysia, Malaysia
Dr. Eng. Ramzi R .Barwari, Department of Mechanical Engineering, College of Engineering, Salahaddin
University - Hawler (SUH), Erbil - Kurdistan, Iraq
Kerorsa, Lubo Teferi [Environmental Law and Governance], Seoul National University; Family
Dormitory. Seoul, South Korea
Dr. C. Viswanatha, Department of Chemistry, Arba Minch University, Arba Minch, Ethiopia
Tsunatu Danlami Yavini, Chemistry Department, Faculty Of Science, Taraba State University, Jalingo ,
Taraba State, Nigeria
Bello Alhaji Buhari , Usmanu Danfodiyo University, Department of Mathematics, Computer Science
Unit, Sokoto, Nigeria
Ramzi Raphael Ibraheem AL Barwari, ANKAWA - ERBIL, Department of Mechanical Engineering,
College of Engineering, Salahaddin University - Hawler (SUH), Erbil - Kurdistan
Innocent E. Bello, National Space Research And Development Agency, Abuja, Nigeria
Ang Kean Hua,Department of Environmental Sciences, Faculty of Environment Studies, Universiti Putra
Malaysia, Selangor Darul Ehsan, Malaysia
Dr. Abdulghani Mohamed Ali Alsamarai, Professor of Infectious Diseases and Dermatology and
Medical Education, Iraq
Agbor Reagan Bessong, Department of Genetics & Biotechnology, P.M.B 1115, University of Calabar,
Calabar, Nigeria
Dr. Abbas Bubakar El-ta'alu , Department of Human Physiology, Faculty of Basic Medical Sciences,
College of Health Sciences, Bayero University, Kano, P.M.B 3011, Kano-Nigeria
Dr. Salah H.R. Ali, Engineering & Surface Metrology Department, National Institute for Standards (NIS),
Giza, Egypt
Jiban Shrestha, Plant Breeding & Genetics, Nepal Agricultural Research Council, National Maize
Research Program, Rampur, Chitwan, Nepal
Dr. M. L. A. M Najimudeen, Department of Obstetrics and Gynaecology, Melaka Manipal Medical
College, Malaysia
Rolando P. Javellonar, Romblon State University, Odiongan, Romblon, Philippines
Chaudhary Dhiraj Kumar, Department of Life Science, Kyonggi University, Suwon, Gyeonggi, South
Korea

vi
CONTENTS
Sr. No Article/Paper Page No
1
Micropropagation Photoautotrophic Kalanchoe pinnata in water and
humus with use of natural light, and determination of total flavonoids: A
Review
Neves C. R. S. S., Procopio M. C., Penna T. C. V.
01-13
2 Therapeutic management of Staph. Spp skin infection in Labrador
B. K. Patra, P. P. Harichandan, J. K. Ray 14-16
3 Tree Gummosis a Thread for Mango Production in Northern Senegal
N. Mbaye, G. F. A. Manga, P. M. Diedhiou, P. I. Samb 17-22
4
Isolation and Identification of Bacteria from Different Soil Samples of
Telangana and Andhra Pradesh States
Arsheen Tabassum, Dr. M. Shailaja Raj
23-28
5
Biological Control of Bark Eating Caterpillar Indarbela Quadrinotata in
Indian Gooseberry
Savita Raidas, Sandeep Kumar, Dr. Sandeep Pandey
29-33
6
Correlation of Knowledge and Metabolic Syndrome in Container Crane
Operator
Lestari Sri Pusparini, Denny Ardyanto W., Hari Basuki Notobroto
34-36
7
Lane Detection for Departure using Hough Transform for Driving
System
Ankaram S. N., Prof. Rahane S. B.
37-42
8
Specific Activity and Production Yield of Neutron Induced Cross Section
Reactions for Hafnium Isotopes at 14.5MeV
Iman Tarik AL-Alawy*, Firas Hashem Ahmed
43-48
9
Steam-Microwave on reduction of microbial level of red pepper and
compared with Gamma Irradiation
Pouya sahraie, Toktam Mostaghim, Alireza Rahman
49-57
10 Preserving Privacy Using Attribute Based Access Control in DataStream
Suyog Vilas Patil, Prof. K. B. Manwade 58-63
11
Physical and Chemical Changes In the Soluble Fraction of Eggs from
Hens FED with Pleuroncodes Planipes (RED CRAB), Stored for Different
Lengths of Time at Different Temperatures
Ma. De la Concenpcion Calvo, Ma. Elena Carranco, Silvia Carrillo, Leonor
Sangines, Benjamin Fuente, Ernesto Avila
64-71

vii
12
Measurements of Radon Concentrations and Dose Assessments in
Chemistry Department-Science College- Al-Mustansiriyah University,
Baghdad, Iraq
Iman Tarik Al-Alawy, Haider Rayed Fadhil
72-82
13
Demodulation of a Single Interferogram based on Bidimensional
Empirical Mode Decomposition and Hilbert Transform
Said Amar, Mustapha Bahich, Hanane Dalimi, Mohammed Bailich, Bentahar
Youness, ElMostafa Barj, Mohamed Afifi
83-89
14
Protective Effect of Umbelliferone against Doxorubicin Induced
Cardiotoxicity in Swiss Albino Rats
Sathesh Kanna Velli, Sharmila Salam, Premkumar Thandavamoorthy,
Palanisamy Krishnan, Jagan Sundaram, Devaki Thiruvengadam
90-97
15
The Characteristics of Physico-Chemical and Sensory Properties of Bran
and Pumpkin Flours Substitution of Simulation Chips
Wayan Trisnawati, Ketut Suter,Nengah Kencana Putra
98-106
16 Bioinformatics Tools for Protein Analysis
Mahin Ghorbani, Fatemeh Ghorbani, Hamed Karimi 107-111
17
Bioinformatics Analysis of Evolution of Secondary Structures of Protein
Trypsin Beta
Mahin Ghorbani
112-115
18
INVERSION OF TIME IN THE CLASSICAL KINEMATICS OF
MATERIAL POINT
Zvezdelin Ivanov Peykov, Todor Peychev Spiridonov, Angel Todorov
Apostolov
116-125
19
Appraising Use of Mobile Messaging Application as an Additional Tool
for Undergraduate Teaching
Ruchi Kothari, Pradeep Bokariya, Varun Kothari
126-129
20
Measurement of Uranium Concentration in the Soil Samples by Using
Solid State Nuclear Track Detectors (SSNTDs)
Bashair M. Saied, Raad M. Al-Khafaji, Auday T. AL-Bayati
130-135
21 Design and Fabrication of Wind Mill for Power Generation
G. Balasubramanian, P. Balashanmugam 136-151
22
Extirpation of traumatically ruptured and maggoted eyeball in a Sambar
Deer (Cervus unicolor)
Jayakrushna Das, Biswadeep Jena, Snehasis Pradhan
152-154
23
Treatment of Haemophilia A by Replacement Therapy using Factor VIII
Inhibitors
Maria Shahid, Sikander Ali
155-161

viii
24
Electron Transfer Reaction of Pyridine with 12-tungstocobaltate (III) in
Acidic Buffer Medium
B. Dash, A. K. Patnaik, G. C. Dash, P. Mohanty
162-166
25
Modelling and Structural Analysis of a Pressure Hull under Dynamic
Load
P. Yamini Charishma, T. R. Sydanna, M. Naga Kiran, A. Salmon
167-172
26
Responsiveness of Unemployment To Inflation : Empirical Evidence
From Nigeria
I. G. Okafor, Ezeaku Hillary Chijindu, Ugwuegbe S. Ugochukwu
173-179
27 Querying Unintelligible Data on Geospatial Trajectory Database
Dr. K. Sathesh Kumar, Dr. S. Ramkumar 180-187
28
Surveillance of Helminthes and Molecular Phylogeny of Fasciola
Gigantica Infecting Goats in Sadat District, Egypt
ElKhtam A. O., Khalafalla R. E
188-192
29
Bio-activity of plant product as insecticides to control mustard
aphid, Lipaphis erysimi Kaltenbach (Aphididae: Homoptera) infesting
Cabbage (Brassica oleracea var capitata)
Monica Singh Chauhan, J.P.Shukla, Ashish Pandey
193-202
30 Classification of Epileptic & Non Epileptic EEG Signal Using Matlab
Sanat Kumar, Dinesh Kumar Atal 203-207
31 Modular Neural Networks Chronicles in Biological Aspects
Mohseena Thaseen 208-213
32
Using Concept Mapping to Remediate Chemistry Teacher Trainees'
Understanding of Chemical Phenomena - Before and After
Hanson R., Kwarteng T. A.
214-221
33
Forest Fires Model and SIR Model Used in Spread of Ebola Virus in
Prediction and Prevention
Ning ZHANG, Jing TANG
222-231
34
Effect of Al Dopants on the Optical and Dispersion Parameters of Iron
Oxide thin Films
Hadi Ahmed Hussin
232-235
35
A Review on Anticancer Drug from Marine
Omkar A Patil, Prajkta S Patil,Trupti D Dudhgaonkar, Shriniwas K Mohite,
Chandracanth S Magdum
236-242
36
Microwave Assisted Synthesis, Characterization and Antibacterial
Activity of 2- Chloromethyl Benz Imidazole Derivatives
Ruchita A Patil, Sharmila T Patil, Trupti D Dudhgaonkar, Archana R Dhole,
Shriniwas K Mohite, Chandrakant S Magdum
243-249

ix
37
Opinion Classification from Online Reviews based on Support Vector
Machine
Sangram Ashok Patil, Prof. K. B. Manwade
250-254
38
Correlation Analysis of Irrigation Water Quality parameter from the
major rivers in the Amansie West District, Ashanti Region, Ghana
Gabriel W. Quansah, Joseph Fening, Kwabena Nketia, Eric Asamoah, Ekow
Gaisie
255-258
39
The Technical Teacher, Teaching and Technology: Grappling with the
Internationalization of Education in Nigeria
Okworo Gibson Samuel, Caleb E. E., Touitou Tina C.
259-265
40
A Paper on Multisite Framework for Web page Recommendation Using
Incremental Mining
Mr. Rahul B. Patil, Prof. K. B. Manwade
266-270
41 Discovering Frequent Item Set Mining Using Transaction Splitting
Khude Tejashree Vishnu, Dr. D. S. Bhosale 271-273
42
Evaluation of Resource Needs and Service Delivery of Performance
Contracting in Public Primary Teachers Training Colleges in Kenya
Simon K Kipkenei, Judah Ndiku, Julius Maiyo, Rodgers Cherui
274-285
43
Diversity of Phytoplankton in Ayyanakere Lake, Chikmagalur District,
Karnataka
N. B. Mruthyunjaya, M.Venkateshwarlu, B. R. Kiran, D. S. Somashekar
286-292

IJSRST162382 | Received : 15 June 2016 | Accepted : 05 July 2016 | July-August 2016 [(2)4: 01-13]
© 2016 IJSRST | Volume 2 | Issue 4 | Print ISSN: 2395-6011 | Online ISSN: 2395-602X Themed Section: Science and Technology
1
Micropropagation Photoautotrophic Kalanchoe pinnata in Water and Humus with use of Natural Light, and
Determination of Total Flavonoids: A Review Neves C. R. S. S.*, Procópio M. C, Penna T. C. V.
Department of Biochemical Pharmaceutical Technology, College of Pharmaceutical Sciences, University of São
Paulo, São Paulo, SP, Brazil
ABSTRACT
Micropropagation is a vegetative propagation method widely studied in many different plant species,
beinga mode in tissue culture, the one that has found widespread and proven practical applications. Among
the advantages of its use is the possibility of obtaining various plants from an initial explant, regardless of
the season, besides the reduction of time and area required for the species propagation. The development
of photoautotrophic micropropagation systems with natural light usage, emerge as potential possibilities to
increase the micropropagation efficiency and help reduce costs, making it commercially viable for active
principles and phytotherapeutics production. Thus, the flavonoid content contained in Kalanchoe pinnata
plant extract, can base the pharmacological activity of it when used by population, for the cure and
prevention of various types of chronic noncommunicable diseases (NCDs).
Keywords: Kalanchoe Pinnata, Micropropagation, Photoautotrophic, Flavonoids, Cost Reduction
I. INTRODUCTION
Photoautotrophic Micropropagation
Micropropagation is a vegetative propagation me-thod
widely studied in many different plant species, being
the mode in tissue culture, the more widespread and
has found proved practical applications [50]. Among
the advantages of its use is the possibility of obtaining
various plants from an initial explant, regardless of
the season, besides the reduction of time and area
required for the species propagation. Moreover, due to
best sanitary conditions by cultivation of meristems
previously treated by thermotherapy to eliminate
diseases, there is the reproduction of the mother-plant
genotype usually with fidelity during multiplication,
which allows the propagation of species difficult to
propagate by other methods.
The development of photoautotrophic micropro-
pagation systems (production of micropropagules
without addition of sucrose in the culture medium and
under ambient conditions favoring photo-synthesis)
[47], with natural light usage, emerge as potential
possibilities to increase micropropagation efficiency
and help reduce costs, making it commercially viable.
Studies have shown that light can determine the
growth direction of plants (phototropism). It is able to
determine chloroplasts [21, 22] and plant organs
(photomorphogenesis) [21] differentiation, espe-cially
the leaf, the most susceptible organ to environ-mental
changes [23, 24], and in other substances production,
such as flavonoids [21]. This fact raises the possibility
of studying various light sources effects at different
wavelengths, focusing on plants in order to verify and
modulate the amount of synthe-sized substances.

International Journal of Scientific Research in Science and Technology (www.ijsrst.com) 2
The light also strongly influences hormones
biosynthesis. Vegetal hormones are molecules
responsible for the seedlings development, present in
low concentrations [26]. These substances act in all
morphogenetic processes, including those induced by
light. Studies have shown that gibberellin levels in
events like disestiolation, germination and
tuberization are directly linked to light, regulated by
phytochrome or cryptochromes. The indole acetic
acid (IAA) and cytokinins levels in disestiolation are
also regulated by phytochrome. The light is able to
regulate abscisic acid (ABA), ethylene and
brassinosteroids levels in a phytochromes and
cryptochromes dependent process [32]. The
interaction between light, photoreceptors and plant
hormones has a strong influence on plant life, even
regulating tissues and organs development, that is,
morphogenesis.
Studies have shown that the relationship between
light and flavonoid biosynthesis is also closely linked.
Flavonoids provide coloring for plants ranging from
lilacto blue. The ability of these molecules to absorb
wavelength in UV range gives to these substances a
protection function against damage caused by this
type of radiation [36, 37] and microorganisms or
fungi [36].
Other authors have shown that different spectral
ranges differently influence the development of plant
organs, leading to changes in several anatomical
characteristics such as leaf thickness, leaf area, stem
diameter, stomata and trichomes density [53, 54, 55].
Besides morphological and anatomical features, light
may influence secondary metabolites production such
as flavonoids. The flavonoid biosynthesis occurs by
secondary and mixed pathways (shikimate and acetate
pathways), being regulated by blue and UV light in a
process mediated by cryptochromes. In this process
occurs the expression of the enzyme phenylalanine
ammonia lyase, essential for the first step of
fenilpropanoídica and chalcone synthase pathways,
the first flavonoid biosynthesis pathway [38]. Due to
these molecules protective action against
microorganisms in plants, it makes them a target to
pharmacological studies using plants.
The perception of color and the amount of substances
that plants produce, as a rule, are related to spectral
quality of light they receive. The solar radiation that
reaches the Earth covers a spectral range extending
from 290 nm (ultraviolet) to 4000 nm (infrared) [21].
Many of these wavelengths are absorbed by ozone in
the atmosphere, by the atmospheric oxygen and CO2.
On average, 45% of the radiation coming from the
sun are in the range from 380 nm to 710 nm [21]. It is
in this spectral range that is the visible light,
composed of seven spectral ranges, the seven rainbow
colors.
In this range, there are also the wavelengths used by
plants for photosynthesis (photosynthetically active
radiation, FRG) [21]. However, light is not only
utilized by the plant as a source of energy, it also
controls the plant growth and development through
signals. Plants are able to monitor the intensity,
quality, direction and duration of light. As already
mentioned, the solar radiation is decisive in many
physiological processes such as stem elongation,
germination, stomatal conductance, chlorophyll
synthesis.
Due to its characteristics of sessile beings and their
autotrophic nature, dependent on light energy, plants
have developed environmental recognition
mechanisms realizing the variations in the quantity
and quality of light they receive, according to the
vegetation cover in a particular location which can be
closed or opened, light is gradually assimilated by
layers of superimposed sheets.
Thus, the canopy energy is greater than the lower
layers, meaning that the light reaching the soil is
richer in wavelengths than that reaching the canopy,
that is, it tends to contain more light in the red range.
In addition, a few feet below the topsoil, only reaches
lengths corresponding to the extreme red [21]. This
effect is called radiation attenuation [21]. Different
species require different amounts of light to its perfect
development. Hence it is so important that plants
recognize the different quantities and qualities of light
where they are located.
In this manner, plants can regulate their development
in order to seek light. This recognition process is
through special molecules called photoreceptors, able
to recognize different wavelengths. The processes
regulated by light are categorically divided into two
main classes: phytochrome mediated, red light
receptors and cryptochromes mediated, blue light /
UV-A receptors [26]. The phytochrome are the most
characterized photoreceptors and form a family of
International Journal of Scientific Research in Science and Technology (www.ijsrst.com) 3
five proteins (phytochrome A, B, C, D and E) of
approximately 125 kDa [27].
Each phytochrome has two forms, in particular
spectrally reversible: one that absorbs red light (Pr -
biologically inactive) and one that absorbs extreme
red wavelength (Per - biologically active). Pr, when
absorbs light in the 620-680 nm range is converted to
the Per, this by absorbing radiation in the 700-800 nm
range becomes Pr. The balance between the two
forms, given by red and extreme red proportion in the
environment light, will cause physiological responses
in the plant [28, 21, 27].
The greater the amount of far red, the plant is more
shaded. The amount of red and far red that the plant
receives also indicates the seasons (long or short
days).
This information determines the plants aspects such
as germination, flowering, maintenance or not
plumular hook, chlorophyll synthesis and circadian
rhythm. Although in most cases, responses regulated
by phytochrome are linked to red light, some studies
show dependent responses of blue and UV-A light
[29,30].
The cryptochromes are a family of blue / UV-A light
photoreceptors extremely important during
disestiolation of plants grown in the dark [31]. They
are involved in the inhibition of stem growth
processes, cotyledon expansion and chlorophyll
synthesis. There have been shown that cryptochromes
act in coordination with phytochromes in several
processes and its action is temperature dependent
[31]. However, phytochrome and cryptochromes,
along with other photoreceptors, are not the only
substances that act in photomorphogenic events.
Other substances act on plant tissue, translating in
them environmental light conditions. These
substances are plant hormones.
It is possible to observe that among the environ-
mental factors that most influence the plant
development is the lighting. Studies have indicated
that in addition to the amount of light received, the
spectral quality of it is also important as it can induce
morphoanatomic answers, for example, it can cause
different red and extreme red ratios altering the
structure of the mesophyll [24] or the stomata density
[33]. The leaf is the organ that most responds to
environmental radiation, being therefore chosen by
many authors as object of study of spectral quality
and quality effect in plants [34, 33, 24, 22, 35].
Different plant species are adapted to different
lighting conditions, with an amount of light to be
optimum to perform photosynthesis. Plants usually
have morphoanatomic features related to these
different light environments. Such characteristics
provide the best use of the incident light and
protection of photosynthetic apparatus [21]. During
its life, plants can be exposed to different lighting
conditions, so it is possible to notice that most plants
have developed adaptation mechanisms, mainly
anatomical, of the individual to the new climatic
conditions [22]. This flexibility occurs even at a
cellular level, as in the case of different organizations
and developmental changes in mesophyll chloroplasts
[21, 22].
Some advantages of photoautotrophic micropro-
pagation at the expense of natural light compared to
the conventional method of micropropagation include
plant growth increase. Due to the removal of sucrose
from the culture medium, there are improvements in
the physiological characteristics of the plant, once the
cultivation environmental conditions are more natural,
reducing plant stress during acclimatization,
increasing the percentage of survival of seedlings [48,
49, 50], elimination of lighting costs and reduced
costs for repairs and maintenance, and also possibility
of use of simplified facilities reducing construction
costs [51].
In conventional micropropagation, the heterotrophic
or fotomixotrófica nature of plant growth is directly
or indirectly responsible for most of the factors
related to the cost of production of micropropagated
plants [50]. Explants are cultured in flasks without
gas exchange and with high relative humidity (about
98%), high ethylene concentration, low CO2
concentration (which decreases from 3.000 to 1 mol
9.000μmol the dark period to less of 100μmol mol-1
during the photoperiod), and low photon flux density
of photosynthetically active. That means that low
lightning (40 - 50μmol m-2 s-1) and with sucrose as a
major source of metabolic energy [52], once the
explants show low photosynthetic rate [50]. The
nutrient medium used is composed of essential and
optional components. The standard medium used
universally for micropropagation of medicinal

International Journal of Scientific Research in Science and Technology (www.ijsrst.com) 4
plants is MS medium (Murashige and Skoog) [56],
which has as essential nutrients: inorganic salts,
carbohydrates, vitamins and growth regulators.
Many explants or in-vitro plants have the ability to
grow photoautotrophicly, i.e. without sucrose in the
culture medium and under environmental
conditions, which promote photosynthesis [50]. The
photosynthetic process, contrary to what occurs in
the respiratory chain, need an external source of
energy, without which it does not occur, showing
that there is a strong relationship between light and
plants, photosynthetic organisms. Since, during
photosynthesis, light is not only a regulation factor,
it acts as an important component in the
biochemical reaction [21], being able to interfere in
several physiological factors, such as chlorophyll
production, stem stretching regulation, in enzymes
production and other substances such as
anthocyanins, a type of flavonoid [21]. In this sense,
it is understood that the light is a determining factor
for plants to be able to, from inorganic molecules,
synthesize carbohydrates.
Kalanchoe pinnata Description
The Brazilian flora is extremely rich, because in it
there are thousands of species of medicinal plants,
and among these plants there is Kalanchoe pinnata,
which despite being widely used by the population,
still has few studies proving its medicinal
properties. It is a perennial plant, therefore easily
found in several climates and regions of the world,
and easy handling due to their morphological
characteristics (Table 2).
The different species of the genus
Kalanchoe (Crassulaceae family) are known in
popular medicine in many countries as it can be
observed in Table 1. As used in treatment of
inflammatory processes and in several diseases.
This fact favors the search for new bioactive
molecules. Among the main active principles of
Kalanchoe pinnata, there are the polyphenols [59],
which are flavonoids, antioxidants, mucilage and
others (Table 3). Among the present flavonoids,
there is quercetina43, which has shown significant
action in the leishmaniasis treatment [41].
Quercetin and kaempferol are flavonoids
widely spread throughout the plant kingdom and
have significant anti-inflammatory action, that can
be attributed to inhibition of the enzymes
phospholipase A2 (PLA2), 8 lipo-oxygenates to,
cyclooxygenase and inhibition of nitric oxide
production, through modulation of enzyme iNOS
[35, 37, 59].
Table 1- Taxonomy of Kalanchoe pinnata
(Lamarck) Persoon:
Kingdom Plantae (Plantas)
sub Kingdom Tracheobionta (vascular
plant)
Super division Magnolioliophyta
(Flowering plant)
Class Rosidae
Order Saxifragales
Family Crassulaceae Stonecrop
family [39]
Genre Kalanchoe
Species Kalanchoe pinnata
(Lam.) Per [14]
Synonyms
Verea pinnata, Crassuvia
floripendia, C. calyculata,
Cotyledon calycina,
Bryophyllum calycinum,
Crassula pinnata, Sedum
madagascariense, B.
germinans, C. rhizophilla.
[13]
Source Uncertain. It is believed
to be the Mauritius
Islands, Africa, India and
Indian Ocean islands
Distribution It is distributed through-
hout India and grown in
wild gardens in the hills
of northern and western
India, Deccan and Bengal
[18]. In Brazil, they can
be found from Sao Paulo
to Bahia, mainly in the
coastal zone.
Regional
Names
Brazil
Saião, Folha-da-fortuna,
Coirama, Roda-da-
fortuna, Folha-da-costa,
Folha-grossa, Erva-da-
costa
India Zakhm-hayat
Arabia kushnulhayat
Walking
stick
Koppata
Sanskrit Asthi-bhaksha
telugu Simajamudu
Tamil Ranakalli
kannada Ganduklinga
malayalam Elamurunga
Persian and
Urdu
Chubehayat [17, 19]

International Journal of Scientific Research in Science and Technology (www.ijsrst.com) 5
Table 2 : Morphological characteristics of Kalanchoe pinnata:
Dimension Sublenhosa plants, perennial fleshy, 1.5 meters high; succulent stems, hermaphrodite, tubular, penduladas, pale
green or yellow reddish.
Seeds Oblong small soft - ellipsoid, striatum bad, soft. The leaves often produce, at the ends of the lateral nerves, buttons
furnished with roots, stems and leaves, which drop off at the same time become new plants [13].
Sheets Juicy, Dimensions: length 7-20cm 4-9cm wide on average, 10 to 25 leaves, or occasionally when lower generally
have 8-12 and 6-8 in size, the upper usually 3-5 or sometimes 7 - leaflets, long and pointed, the united petioles by a
ridge around the stem. Leaflets ovate or elliptical, serrated [17].
Fruits
With 10-14 mm long, produce numerous seeds per fruit in closed chalice and corolla. [13]
Trunk succulent stems, hollow, rarely branched. [13]
One of the main features of Kalanchoe pinnata is its
ease in micropropagation in aquatic environments
and on land, having high adaptability to different
climates and easy handling conditions (Table 3).
Due to these factors, it was decided to replace the
synthetic medium MS [56] for water and earth
through composted with natural bio-fertilizer and
humus, and bio-organic materials used in
biofertilizers, provided from waste solids reuse fruit.
According to Fukuoka [59], the natural fertilization
is defined by natural conditions, soil regeneration
with the soil itself, returning to the soil what it
hasgiven, such as fruits, vegetables and grains. The
soil is enriched progressively mind, and the content
of natural mind-nutrients present is balanced with
the help of natural fertilizer from the own culture
developed in this soil. In Table 3 below the optimal
growth conditions for the Kalanchoe pinnata.
Table 3. Characteristics of a better climate adaptation and management:
Life Cycle Perennial Climate Enjoy warm weather
luminosity Enjoy light full sun and half-shade
pruning Not necessary, but cut dry parts can be carried out, and to contain the spread, remove new
growth if you want
Cultivation It must be used substrate that has good drainage, which does not accumulate water which will
cause the death of the plant. Mixing Tip: two pieces of coarse sand construction, a part of
common garden and land part of the plant. It supports soil with low humidity, and also
develops in water
Fertilization At the site preparation, apply about two NPK tablespoons of 04-14-08 formula per square
meter
Propagation Vegetative from seedlings, and shoot buds formed along the sheet margins, producing young
plants [40]
Medicinal plant Her daughter medicinal properties have been used in the treatment of various diseases.
Chemical constituents Mucilage, tannins, organic acids, minerals, quercetin glycosides [41, 43]. bufadienolídeos
[44, 45].
Toxic plant Special care should be taken with small children, pets and master-mind with grazing animals
Use Quite showy ornamental effect, is very well in rock gardens forming together with other
succulents
The objective of the research was to investigate the
development of the crop in water and soil with humus
(natural biofertilizers) of Kalanchoe pinnata leaves,
(Lam Pers), kept under natural light (photoperiod).
Extracts of developed sheets were evaluated by
spectrophotometry, as the concentration of flavonoids,
which is, the minimum necessary to justify the

International Journal of Scientific Research in Science and Technology (www.ijsrst.com)
6
medical activities of the extracts of Kalanchoe pinnata leaves described in Table 4.
Table 4: Medicinal Uses Worldwide:
II. METHODS AND MATERIAL
A. Humus preparation
The papaya, banana, orange, mandarin and mango
residue were gathered and milled with the aid of an
organic waste processor in order to form a biomass of
fruits. They were then added to water ratio gradient in
order to obtain the best uniformity for the process of
fermentation the kefir grains, for cleaving complex
sugars and free reducing sugars, providing among these
microelements to facilitating uptake by plants. During
the fermentation, the fruit biomass was placed in glass
containers covered with fabric. Subsequent to
fermentation, biomass was added to the earth for the
humus formation, through composting method.
Fermented biomass was evaluated to their chemical
composition of trace elements as well as dosage of total
ash, moisture, protein, carbohydrates, glucose, fructose,
fiber and lipids.
B. Determination of the chemical composition of
biomass fruit
The chemical composition of biomass (consisting of
papaya, orange, mango, banana and tangerine waste)
Brazil
Furunculous [20], Intestinal problems, arthritis, ulcers, athlete's foot, abscesses, bubos,
bronchitis, burns, calluses, conjunctivitis, corns, dermatosis, coughs, earaches, eczema, fever,
urinary insufficiency, rheumatism, itch, glaucoma, infections, headache, kidney stones, scurvy,
tumor, wart, sedative, whooping cough, wounds, inset stings, lymphatic disorders, mouth sores,
respiratory infections, mouth sores, erysipelas [10]. Immunosuppressant, leishmaniasis [41,
43], diabetes [41, 42, 43] hemostatic, antiseptic, healing topical, inflammation (stomach pain)
[15, 16]
USA Chicken pox, stomachache, fevers [10]
Mexico Inflammations, wounds, eye infections, headaches, menstrual disorders [10]
Ecuador Bruises, broken bones [10]
Guatemala Diarrhea, pain, skin problems, aches [10]
Nicaragua aches, burns, colds, pain, fever, headache, respiratory infections, coughs, childbirth [10]
Bangladesh Coughs, fever, constipations, mucus, epilepsy [11]
Peru
Bacterial infections, boils, broken bones, ulcers, urethritis, sore, skin problems, nausea,
migraine, intestinal problems, eye infections, epilepsy, gas, headache, heartburn, inflammation,
cancer (lymphoma), bronchitis, conjunctivitis, coughs, earaches [10]
South America Asthma, tumors, headaches, colds, earaches, chest colds, sores, strains [10]
Nigeria Coughs, earaches, pimples, inflammation, eczema10, cut umbilical cord in new born baby [7]
West Indies Ulcers, menstrual disorders, urinary disorder, hypertension [10]
Other places Arthritis, asthma, burns, bruises, constipation, malnutrition, headaches, migraines, nephritis,
respiratory infections, earaches, diabetes, paralysis, rheumatism, swelling [10], and to induce
vomiting of blood, expel worms, cut umbilical cord in new born baby [7]
Vietnam Anti-inflammatory and antibacterial [8]
India
Orissa Diarrhea [5, 2]
Karnataka Leaf juice externally, applied to scabies and leucoderma and leaf decoction applied over, cuts to
stop bleending [10, 12]
Maharashtra The leaves in used against cough dysentery [4]
in Himalaya Leaves are applied on wound, bruises, insect bite, swelling [9]
Arunachal
Pradesh
Leaf extract is taken in empty stomach is used in the treatment urinary bladder stones and fewer
in children’s [3]
International Journal of Scientific Research in Science and Technology (www.ijsrst.com)
7
was determined according to the methodology of the
AOAC [57]: moisture (925.45); protein (960.52); lipids
(920.39) and ash (923.03). The conversion factor used
for determining the protein content was 6.25. The energy
value was calculated using the general factors of
Atwater and considering the energy from dietary fiber
(DF) [58]. The analyzes were performed in triplicate and
the results expressed in g per 100 g of sample in the
integral base. The DF content was determined according
to AOAC method 991.43 [57]. The analysis was done in
quadruplicate and the results expressed as g / 100g
sample basis. Dosages of glucose and fructose were
made in triplicate by Waters chromatograph column for
detection of sugars (Shodex SC 1011); refractive index
detector; Mobile phase: EDTA-Ca 0,187g / l.
Chromatography conditions: column temperature: 72 °
C; detector temperature: 45C, mobile phase flow: 0.6 ml
/ min. Detector sensitivity 32, Volume injection: 10μL,
running time: 30 minutes.
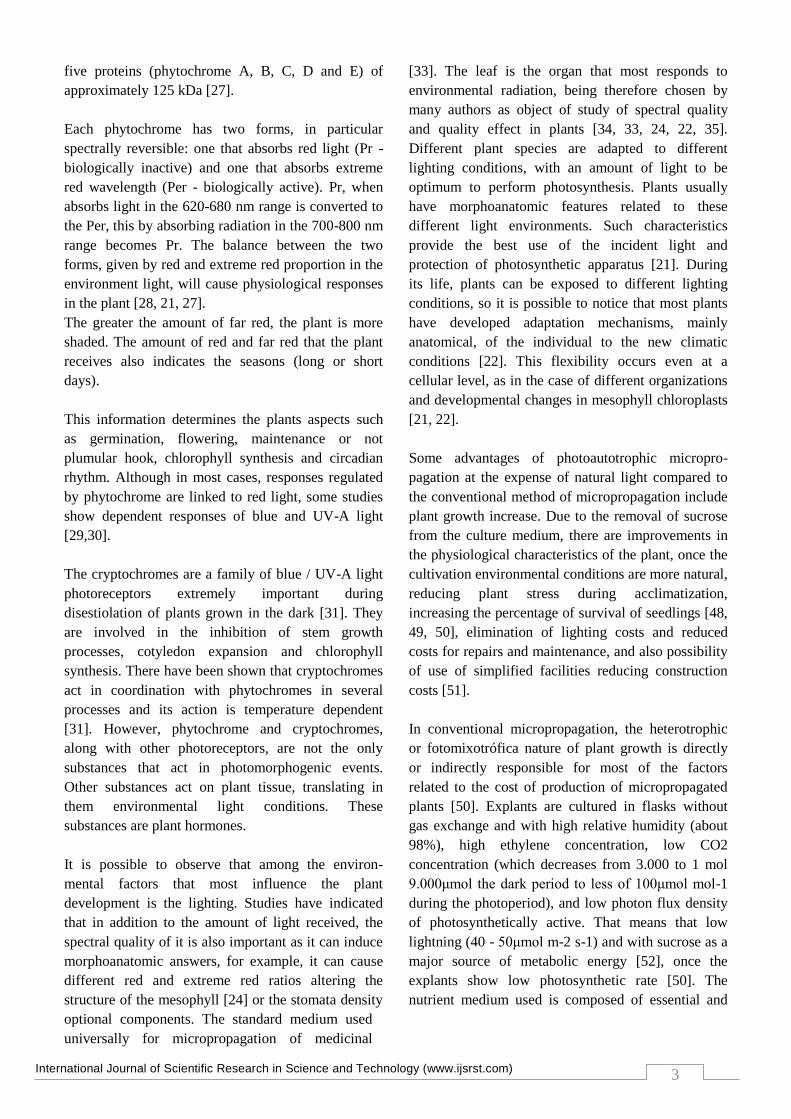
C. Photoautotrophic Micropropagation
The leaves of Kalanchoe pinnata, initially developed in
soil, were transferred to individual containers in which
were placed submerged in water. The jars were kept at
room temperature, covered by a synthetic porous fabric
(TNT), provided direct daylight (photoperiod). Initially,
the dimensions and leaflets of each sheet were
measured. After a period of seven to ten days of
permanence in the same water, the size of sprouts from
the leaflets and their roots were measured as shown in
Fig. 1, and the water was changed. Each bud, with its
leaves and roots were transferred to the humus (prepared
from biomass fruit fermented with kefir and composted
with soil). Then, the micropropagation development
monitoring was made, measuring the dimensions of the
roots and formation, and the growth of buds in relation
to the cultivation time.
Figure 1. Illustrative Photo Kalanchoe pinnata. Source:
Author's photo
D. Preparation of the Kalanchoe pinnata leaves
extract
There were extractions of leaves developed to evaluate
the concentrations of flavonoids. The alcoholic extract
of 100 g of cereal leaf was macerated in ethanol, and
transferred quantitatively into 100 mL volumetric flask,
and the final volume with grain alcohol.
E. Determination of total flavonoid, catechin
equivalents
It was transferred 0.5 ml of K. pinnata extract solution
into a 25 mL volumetric flask and was added 0.100 mL
of 10% aluminium chloride with 4.3 ml of grain alcohol.
We adopted the same experimental procedure dilutions,
described below, for the preparation of the absorbance
of the response curve as a function of the concentration
(mg / ml) ranging from 60 to 260 (mg / mL) of total
flavonoids equivalent of catechin using the equation of
the line from the calibration curve of the standard
secondary reference catechin being evaluated linearity.
Linearity
To check the linearity, it was elaborated analytical curve
with the stock solution of standard secondary reference
catechin (purity = 98%) in the concentration of 500,0μg
/ ml in cereal alcohol. From the stock solution dilutions
were prepared at concentrations of 0.084; 0.05; 0.028;
0.017; 0.0076 g / L, which was reacted with 0.100 mL of
10% aluminum chloride solution (v / v), completing the
volume with ethanolic grain alcohol. After 40 minutes of
rest, we proceeded to read in a spectrophotometer at 510
nm using as white cereal alcohol solvent plus aluminum
chloride solution. Elaborated the analytical curve,
checking the linearity of the method, using visual
observation and appropriate statistical analysis,
obtaining - the equation of the line and the linear
correlation coefficient. Equation 1 is the equation of the
calibration curve of the standard secondary reference

International Journal of Scientific Research in Science and Technology (www.ijsrst.com)
8
catechin, where y is absorbance and x is the
concentration of standard secondary reference catechin:
y = 10.121 x – 0, 0475 (1)
r2 = 0, 9936
From the obtaining of a line to the calibration curve and
the correlation coefficient (r2) .9936 was verified the
linearity of the method.
III. RESULT AND DISCUSSION
A. Quantification of equivalent total flavonoids
catechin in Kalanchoe pinnata extract.
In Table 5 it can be seen the results of
quantification of total flavonoids, catechin
equivalents in Kalanchoe pinnata extract, with an
average of 42.39 mg / mL.
Table 5 – spectrophotometric dosage of the equivalent
total flavonoids catechin present in Kalanchoe pinnata
extract to 510nm. EKP: Kalanchoe pinnata extract .: CF:
concentration of total flavonoid, catechin equivalents.
Concentration
of EKp (µg/mL) Absorbance CF µg/mL)
60,0 0,2230 17,34
100,0 0,3320 28,00
140,0 0,4219 36,00
180,0 0,5543 50,00
220,0 0,6030 54,00
260,0 0,7456 69,00
Average: 42,39
B. Kalanchoe pinnata Micropropagation
Water-soaked sheets produced roots from all the leaflets,
and buds (buds) with leaves in most leaflets, from 7 to
10 days. In a similar period, the sheet cultivated on earth
developed, on average, two shoots 10 days and 40 days
from the main stem height reached an average of 8 cm
from each bud, 8 new sheets for each sprout dimensions
Similar to that of the mother sheet. In water, the leaves
are multiple and diminutive dimensions, three times
smaller, and remains in this size and had to be
transferred to new culture in water or on land.
C. Statistics of K. pinnata.micropropagation
Figure 2. K. pinnata with 11.5cm long and 6.5cm
wide; ANOVA: p < 0.05 ***
Figure 3. K. pinnata with 15.7 cm long and 10
cm wide; ANOVA: p <0.05 ***
Figure 5. K. pinnata with 14cm long and 9
cm wide; ANOVA: p <0.05 ***

International Journal of Scientific Research in Science and Technology (www.ijsrst.com)
9
Figure 4. K. pinnata in length and 13cm 9.7 cm wide;
ANOVA: p <0.05 ***
Figure 6. K. pinnata with 11 cm long and 5.5
cm wide; ANOVA: p <0.05 ***
Figure 7. K. pinnata with 18cm in length and 12.5 in
width;
ANOVA: p <0.05 ***
Figure 8. K. pinnata with 10,5cm long
and 5,4wide; ANOVA: P < 0, 05 ***

International Journal of Scientific Research in Science and Technology (www.ijsrst.com)
10
A. Determination of the chemical composition of
biomass fruit
Table 6 - Proximate analysis of biomass of fruits
Biomass fruit
(g/100 g)
(I) (II) (III) (IV) Average
Carbohydrates 4 4,9 4,8 -- 4,56
Lipids 0,02 0,03 0,02 -- 0,023
Proteins 0,4 0,5 0,8 -- 0,56
Ash 2 1,98 2 -- 1,99
Humidity (%) 89 89 89 -- 89
Fibers 5 4,8 4,9 4,9 4,9
Glucose (g/L) 7,756 7,54 7,15 -- 7,483
Fructose (g/L) 9,107 8,80 8,31 -- 8.756
IV. CONCLUSION
The micropropagation of Kalanchoe pinnata proved
to be auspicious, since it presented a high capacity for
reproduction by fotoautotrophic micropropagation in
water with the use of natural light, and soil humus
with derived bio-organic fertilizer. Observe a
satisfactory value the concentration of micronutrients
present in the biomass of fruits needed for plant
nutrition, this fact makes possible the replacement of
synthetic media, which implies lower costs allowing
obtaining of one rich source of active ingredients for
herbal, water extracts (poultices) or cereal alcohol
(tinctures).
The photoautotrophic plant micropropagation, in
addition to increasing the growth of in vitro explants,
also minimizes the risk of microbial contamination,
reduces production costs, improves the physiological
characteristics of the plant and facilitates their
acclimatization to ex vitro conditions due to have
been grown in conditions natural.
V. ACKNOWLEDGEMENTS Agency CAPES, Prof. Dr. Marco Antônio Sthephano
(FBT-FCF-USP), Prof.ª. Dra. Marina Ishii (FBT-
FCF-USP), Drª Aline de Oliveira Santos (FBA-FCF-
USP), Drª Caroline Matos de Mello (IPT- USP)
Figure 9. K. pinnata (all sheets with varying
sizes) ANOVA: P <0.05 ***

International Journal of Scientific Research in Science and Technology (www.ijsrst.com)
11
VI. REFERENCES
[1] Cherly A Lans, Ethanomedicines used in
Trinidad and Tobago for urinary problems and
diabetesmellitus, Journal of Ethanobiology and
Ethanomedicine, 2006; 2:45
[2] Samim Sofika Begum and Rajib Jogoi, Herbal
recipe prepared during Bohag or Rogali Bihu in
Assam, Indian Journal of Tradicional Knowledge,
2007; 6(3): 417-422
[3] Prabal Sen, Mihin Dollo, Manabendra Dutta
Chaudhury, Dhrupad Choudhury, Documentation
and Tradicional Herbal Knowledge of Khamptis
of Arunachal Pardesh, 2008; 7(3): 438442
[4] Kirtikar K.R & Basu B. D., Indian Medicinal
Plants with illustrations. Volume- 5, second
edition, Oriental enterprises. 2003: 1394 - 1396
[5] Santos kumar Dash and Sanchidanda Padhy,
review of ethanomedicines for diarrhea disease
from Orissa: prevalence versus culture, Journal
Hum. Ecol. 2006; 20 (1): 59-64
[6] Donatus Ebere Okwu, and Nnamdi Fred
Uchenna, Exotic Multifacetaded Medicinal Plants
of drug and pharmacetical indutries, African
Journal of Biotecnology, 2009; 8(25):72271 –
7282
[7] Mai Thanh Thi Nguyen, Suresh Awale, Yssuhiro
Tezuka, Quan Le Tran, Hiroshi Watanabe and
Shigetoshikadota, Xanthin Oxidase Inhibitory
Activity of Vietnamese Medicinal Plants, Biol.
Pharm Bull. 2004; 27 (9): 1414-1521
[8] S Huissain and DK Hore, Collectionpn and
conservation of major medicinal plants of
Darjeeling and Sikkim, Indian Journal of
Traditional Knowledge, 2007; 6 (2): 352-357
[9] www.raintree.com - Disponível em 01/06/2016
[10] Md. Shahadat hossan, Abu Hanif, Mujib Khan,
Sazzadul Bari, Rownak jahan, Mohammad
rahematullah, Ethanobotanical Survey of the
Tripura trible of Bangladesh, American -
Eurasian Journal of Sustainable Agriculture,
2009; 3(2): 253-261
[11] MJ Bhandary, KR Chandrashekar, KM
Kaveriappa, Medical Ethanoibotany of Siddis of
Uttara Kannada district, Karnataka, India, Journal
od Ethanopharmacology, 1995; 47: 149-158
[12] QUAZI MAJAZ A. et al / IJRAP 2011, 2 (5)
1478- 1482 - The Miracle Planta (kalanchoe
Pinnata): A Phitochemical and Pharmacological
Reviw - Ali Allana College of Pharmacy,
Akkalkuwa, Dist- Nandurbar, MS, India
[13] Plants.usda.gov – Disponível em 01/06/2016
[14] Zuanazzi J S; J Mountain A. Flavonoids In:
Simões C M, et al. Pharmacognosy plant to the
drug, 6 edition, Porto Alegre: Ed UFSC, 2010,
chapter 23, p. 577-656.
[15] Alcaraz M J; Carvalho JC T. Flavonoids In as
anti-inflammatory agents: Carvalho J C T, Herbal
anti-inflammatories: chemical, pharmacological
aspects and therapeutic applications - 1 edition,
Ribeirão Preto, Brazil. Tecmedd 2004
[16] Kirtikar K. R. & B. D., Indian Medicinal Plants
wihillustrations. Volume-5, second edition,
Oriental enterprises. 2003: 1394 - 1396
[17] Nandkarni A>K., Indian Materia Medica,
Volume -1, third edition, Popular Prakashan,
Bombay, 2005: 1402 & 221
[18] The Wealt of India A Dictionary of Indian Raw
Materials and Industrial products, ( Volume - 5)
(H-K) Firts Supplement Series, National Institute
of Science Communications and Information
Resources, Council of Scientific and Industrial
Research, New Delhi; 1997: 31
[19] Http://www.apanat.org.br/noticias/videos/plantas-
medicinais-aprovadas-pelo-governo-e-
distribuidas-pelo-sus/
[20] LARCHER, 2004, W. Ecofisiologia Vegetal. São
Carlos: RiMa Artes e Textos, 2000. 531p.
[21] WESTON, E.; THOROGOOD, K.; VINTI, G.;
LÓPEZ-JUEZ, E. Light quality controls leaf-cells
and chloroplast development in Arabdopsis
thaliana wild type and blue-light-perception
mutants. Planta, v. 211, 807-815, 2000
[22] VIEIRA, R. C. Anatomia da folha de Bauhinia
radiata Vell. Em diferentes ambientes. Arq. Biol.
Tecnol., v. 38, 63-107, 1995.
[23] LEE, D. W.; OBERBAUER, S. F.; JOHNSON,
P.; KRISHNAPILAY, B.; MANSOR, M.;
MOHAMAD, H.; YAP, S. K. Effects of
irradiance and spectral quality on leaf structure
and function in seedlings of two Southeast Asian
Hopea (Dipterocarpaceae) species. American
Journal of Botany, v. 87, 447-455, 2000
[24] SCHUERGER, A. C.; BROWN, C. S.;
STRYJEWSKI, E. C. Anatomical features of
pepper plants (Capsicum annum L.) grown under

International Journal of Scientific Research in Science and Technology (www.ijsrst.com)
12
red light-emitting diodes suplemented with blue
or far-red light. Annals of Botany, v. 79, 273-282,
1997
[25] TAIZ, L.; ZEIGER, E. Fisiologia Vegetal. 3. ed.
Porto Alegre: Artmed, 2009
[26] HUQ, E. Degradation of negative regulators: a
common theme in hormone and light signaling
networks? Trends in Plant Science, v. 11, 4-7,
2006
[27] WHITELAM, G. C.; DEVLIN, P. F. Light
signaling in Arabdopsis. Plant Physiol. Biochem.,
v. 36, 128-133, 1998
[28] CHUN, L.; KAWASAMI, A. CHRISTOFER D.
A. Phytochrome A mediates blue light and UV-
A-dependent chloroplast gene transcription in
green leaves. Plant Physiology, v. 125, 1957-
1966, 2001
[29] SPALDING, E. P.; FOLTA, K. M. Illuminating
topics in plant photobiology. Plant, Cell and
Environment, v. 28, 39-53, 2005
[30] CHEN, M.; CHORY, J.; FANKHAUSER, C.
Light signal transduction in higher plants. Annu.
Rev. Genet., v 38, 87-117, 2004
[31] SYMONS, G. M.; REID, J. B. Interactions
between light and plant hormones during de-
etiolation. Journal of Plant Growth Regulation, v.
22, 3-14, 2003
[32] RAJAPAKSE, N. C.; KELLY, J. W. Spectral
filters influence transpirational water loss in
chrysanthemum. HortScience, v. 28, 999-1001,
1993
[33] JURIK, T. W.; CHABOT, J. F.; CHABOT, B. F.
Effects of light on leaf size, CO2 exchange, and
anatomy in wild strawberry (Fragaria virginiana).
Plant Physiology, v. 70, 1044-1048, 1982
[34] JUSTO, C. F.; SOARES, A. M.; GAVILANES,
M. L.; CASTRO, E. M. Plasticidade anatômica
das folhas de Xylopia brasiliensis Sprengel
(Annonaceae). Acta Botanica Brasilica, v.19,
111-123, 2005
[35] SHIRLEY, B. W. Flavonoid biosynthesis: "new"
functions for an "old" pathway. Trends in Plant
Science, v. 1, 377-382, 1996
[36] JAAKOLA, L.; MÄÄTTÄ-RIIHINEN, K.;
KÄRENLAMPI, S.; HOHTOLA, A. Activation
of flavonoid biosynthesis by solar radiation in
bilberry (Vaccinium myrtillus L.) leaves. Planta,
v. 218, 721-728, 2004
[37] WEISSHAAR, B.; JENKINS, G. I.
Phenylprpanoid biosynthesis and its regulation.
Current Opinion in Plant Biology, v. 1, 251-257,
1998
[38] SILVEIRA, A. L.; RODRIGUES, M. C.;
PAULO, M. Q. Estudos tóxicológicos e
microbiológicos de Kalanchoe pinnata. In: I
CONGRESSO BRASILEIRO DE EXTENSÃO
UNIVERSITÁRIA. Anais eletrônicos.
Disponível em . Acesso em 11/12/2006
[39] JOLY, A. B. Botânica: introdução à taxonomia
vegetal. Editora Nacional. 1983
[40] DA-SILVA, S. A. G.; COSTA, S. S.; ROSSI-
BERGMANN, B. The anti-leishmanial effect of
Kalanchoe is madiated by nitric oxide
intermediates. Parasitology, v. 118, 575-582,
1999
[41] LANS, C. A. Ethnomedicines used in Trinidad
and Tobago for urinary problems and diabetes
mellitus. Journal of Ethnobiology and
Ethnomedicine, v. 2, 2006
[42] MUZITANO M. F.; TINOCO, L. W.; GUETTE,
C.; KAISER, C. R., ROSSI-BERGMANN, B.;
COSTA, S. S. The anti-leishmanial activity
assessment of unusual flavonoids from
Kalanchoe pinnata. Phytochemistry, v.67, 2071-
2077, 2006
[43] SUPRATMAN, U.; FUJITA, T.; AKIYAMA, K.;
HAYASHI, H. New insecticidal bufadinolide,
bryophyllin C, from Kalanchoe pinnata. Biosci.
Biotechnol. Biochem., v. 64, 1310-1312, 2000.
[44] SUPRATMAN, U.; FUJITA, T.; AKIYAMA, K.;
HAYASHI, H.; MURAKAMI, A.; SAKAI, H.;
KOSHIMIZU, K.; OHIGASHI, H. Anti-tumor
promoting avtivity of bufadienolides from
Kalanchoe pinnata and K. Daigremontiana x
tubiflora. Biosci. Biotechnol. Biochem., v. 65,
947-949, 2001.
[45] ALAN CRISTIANO ERIG; Márcia Wulff
Schuch. Micropropagação fotoautotrófica e uso
da luz natural. Ciência Rural, Santa Maria, v.35,
n.4, p.961-965, jul-ago, 2005.
[46] KUBOTA, C.; TADOKORO, N. Control of
microbial contamination for large-scale
photoautotrophic micropropagation. In vitro
Cellular and Developmental Biology Plant, New
York, v.35, p.296-298, 1999
[47] HEMPEL, M. From micropropagation to
microponics (part II). Practical Hydroponics &

International Journal of Scientific Research in Science and Technology (www.ijsrst.com)
13
Greenhouses, May/June, p.17-20, 1994.
Capturado em 15 out. 2003. Online. Disponível
na Internet:
http://members.ozemail.com.au/~mhempel/public
ations/mponic2.htm
[48] AFREEN, F. et al. Photoautotrophic culture of
Coffea arabusta somatic embryos: photosynthetic
ability and growth of different stage embryos.
Annals of Botany, London, v.90, p.11-19, 2002
[49] KOZAI, T; KUBOTA, C. Developing a
photoautotrophic micropropagation system for
woody plants. Journal of Plant Research, Tokyo,
v.114, p.525-537, 2001
[50] KODYM, A.; ZAPATA-ARIAS, F.J. Natural
light as an alternative light source for the in vitro
culture of banana (Musa acuminata cv. ‘Grande
Naine’). Plant Cell, Tissue and Organ Culture,
The Hague, v.55, p.141-145, 1999
[51] ARIGITA, L. et al. Influence of CO2 and sucrose
on photosynthesis and transpiration of Actinidia
deliciosa explants cultured in vitro. Physiologia
Plantarum, Copenhagen, v.115, p.166-173, 2002
[52] WÄNGLER, M. S. Micropropagação clonal e
desenvolvimento in vitro de Cyrtopodium
polyphyllum (Vell.) pabst. ex F. Barros,
Orchidaceae. Dissertação (Mestrado em
Biotecnologia Vegetal) - Programa de Pós-
graduação em Biotecnologia Vegetal. Rio de
Janeiro: Universidade Federal do Rio de Janeiro,
2002.
[53] LUCENA-DE-LUCA, R. Padronização genética
e cultivo controlado de Echinodorus grandiflorus
(Cham. & Schlecht.) Micheli para a produção de
fitoterápicos. Dissertação (Mestrado em
Biotecnologia Vegetal) - Programa de Pós-
graduação em Biotecnologia Vegetal. Rio de
Janeiro: Universidade Federal do Rio de Janeiro,
2003.
[54] MACEDO, A. F. Estudo dos efeitos dos meios de
cultura e diversas condições de iluminação nas
características morfológicas, fitoquímicas e
farmacológicas de Alternanthera brasiliana (L.)
Kuntze cultivada in vitro. Tese (Doutorado em
Biotecnologia Vegetal) - Programa de Pós-
graduação em Biotecnologia Vegetal. Rio de
Janeiro: Universidade Federal do Rio de Janeiro,
2003.
[55] MURASHIGUE, T.; SKOOG, F. A revised
medium for rapid growth and bioassys of tobacco
tissue cultures. Physiol. Plant., v. 15, 473-479,
1962.
[56] HORWITZ, W.; LATIMER, G. W. (Eds.).
Official Methods of Analysis of AOAC
International. 18th ed. Gaithersburg, Maryland:
AOAC International, 2006.
[57] FAO. 2003. State of the World’s Forests 2003.
Home. ftp.fao.org/docrep/fao/005/y7581e/.
Disponível em 10/06/2016
[58] COUTINHO, M.A.S.; Muzitano, Michele F.;
Costa, Sônia S. – Flavonoides: potenciais
Agentes Terapêuticos para o Processo
Inflamatório. Revista Virtual Quim, 2009, 1 (3),
241-256. Data de publicação na Web: 26 de
junho de 2009. ISSN1984-6835. Disponível em:
http://rvq.sbq.org.br/index.php/rvq/article/viewAr
ticle/51, acesso 28.04.16.
[59] (FUKUOKA,2014)http://www.brasil247.com/pt/
247/revista_oasis/110110/Fukuoka-O-
agricultorque-deixava-a-terra-em-paz.htm
disponível em 15/012/2015.

IJSRST16224 | Received : 01 July 2016 | Accepted : 05 July 2016 | July-August 2016 [(2)4: 14-16 ]
© 2016 IJSRST | Volume 2 | Issue 4 | Print ISSN: 2395-6011 | Online ISSN: 2395-602X Themed Section: Science and Technology
14
Therapeutic Management of Staph Spp Skin Infection in Labrador B. K. Patra, P. P. Harichandan, J. K. Ray
Orissa University of Agriculture and Technology, Bhubaneswar, India
Department of Animal Reproduction, Gynecology and Obstetrics, College of Veterinary Science and Animal
Husbandry, Orissa University of Agriculture and Technology, Bhubaneswar, India
ABSTRACT
A three years old black male Labrador was presented with clinical sign of alopecia, pruritus, eczema on dorsal
region of paw of right forelimb and chin region. Antibiotic sensitivity test of skin scraping revealed the infection of
coccal bacteria undifferentiated from staphylococcus spp., with highly sensitivity to gentamycin. Intramuscular
injection of genticyn along with immunomodulation therapy resulted in remission of clinical signs and improvement
of healthy condition.
Keywords: Staphylococcus, Gentamycin, Pyoderma.
I. INTRODUCTION
Skin diseases are the most common health problems in
dogs. The condition of dog's skin and coat are important
indicator of its general health. Skin disorders of dogs
vary from acute, self-limiting problems to chronic or
long-lasting problems requiring lifelong treatment. They
also need to be differentiated on the basis of being of
primary or secondary in nature, making diagnosis
complicated [1]
. The skin is a milieu for controlled
bacterial growth. Skin supports the growth of
commensally bacteria, which protect the host from
pathogenic bacteria. Environmental and local factors,
host immunity, and organism adherence and virulence
are intricately related to systemic infection.
Staphylococcus aureus and Streptococcus pyogenese
notoriously pathogenic in the skin (Chiller, et al., 2001).
Among this Staphylococcal infection is a common skin
disorder of the dog. Infections may be superficial
(folliculitis), deep (furunculosis), or
both. Staphylococcus intermedius is the most commonly
isolated bacterium (Scott, et al., 2001) which was
isolated from 88.6% and 49.4% of skin and ear samples,
respectively, during the years 1992 through 1997, and
frequency of isolation remained unchanged (Petersen, et
al., 2002). Despite their frequency of occurrence, many
pyodermas are misdiagnosed or improperly managed
(Lhrke, P. J., 1987).
Chronic skin infections leads to pyoderma which
includes symptoms like scaling, crustiness, hair loss, and
the development of papules, pustules, and pus/discharge
on the skin. It can be tentatively diagnosed by visual
examination but definitive diagnosis may require
examination of hair and discharge, and skin cultures of
the lesions (Michael Dym, Holistic & Conventional
Veterinarian (Bio).
History and Clinical Examination:
A 3 years old male Labrador was presented to the
Teaching Veterinary Clinical Complex, OUAT,
Bhubaneswar, with the history of alopecia, pruritus,
Eczema on dorsal surface of paw of right forelimb and
also on chin region. On physical examination
serosanguineous fluid was found to be oozing out of it.
Skin scraping examination didn’t reveal any presence of
parasitic infection like mites but antibiotics sensitivity
test suggested coccal infection undistinguishable from
Staphylococcus species which is highly sensitive to
Gentamycin and Amikacin.
Treatment
Prior to clinical test the dog was treated with Inj.
Ivermec- 1ml s/c ly (Ivermectin @ 1 ml upto 20kg body
weight), Lixen (Cephalexin-600mg @ 1 tab per 20 kg
B.wt) 1tab daily for 3 days, Cetrizine- 1 tab orally daily

International Journal of Scientific Research in Science and Technology (www.ijsrst.com)
15
for 3 days, Curabless Ointment- 25gm to be applied
liberally and Multistar Pet- 1phl, 10ml orally twice.
Following antibiotic sensitivity test, on fourth day it was
treated with Inj. Genticyn- 2ml i/m ly (Gentamycin)
daily for three days, Curable ointment and Multistar Pet
to continue. On day 7, a substantial clinical
improvement was noted, based on complete lack of pus
and blood oozing out of it.
Discussion
Ivermec was given as ecto-endo parasiticide for the
treatment of any parasitic infection, lixen contain
cephalexin antibiotic given for the treatment of bacterial
infection causing Soft tissue infection, Pyoderma (Skin
infections due to coagulase positive Staphylococci),
cetrizine was given as antiallergic medication, Multistar
Pet is multivitamin which was given to enhance the
immune system and for regeneration of healthy
epithelium, curabless contain terbinafine
hydrochloride(antifungal), ofloxacin (antibacterial),
ornidazole (antiprotozoan) and clobetasol
propionate(corticosteroid used to treat various skin
disorders including eczema and psoriasis) which was
given for the treatment of various types of skin problems.
Figure 1. Moist Eczema of the chin region
Figure 2. Pyoderma with pus and blood on the dorsal
surface of paw region of right forelimb (acral granuloma)
Figure 3. Antibiotic sensitivity test showing bacterial
sensitivity to Gentamycin.

International Journal of Scientific Research in Science and Technology (www.ijsrst.com)
16
II. CONCLUSION
Use of sensitive antibiotics along with
supplementation of systemic immunomodulation
therapy will be more effective in localized canine
pyoderma cases compare to conventional routine
treatment.
III. REFERENCES
[1] Dog Health Guide, Disease and Conditions Canine
Skin, 2011.
[2] Ihrke, P.J., 1987. An overview of bacterial skin
disease in the dog. British Veterinary Journal. Vol.
143, Issue 2, March–April, pp. 112–118.
[3] Chiller, K., Selkin, B.A. and Murakawa, G.J., 2001.
Skin Microflora and Bacterial Infections of the
Skin. Journal of Investigative Dermatology
Symposium Proceedings (2001) 6, 170–174.
[4] Guardabassi, L., Schwarz, S. and Lloyd, D.H.,
2004. Pet animals as reservoirs of antimicrobial-
resistant bacteria. Journal of Antimicrobial
Chemotherapy. Vol. 54, pp: 321–332
[5] Petersen, A.D., Walker, R.D., Bowman, M.M.,
SchottII, H.S. and RosserJr, E.J. (2002). Frequency
of Isolation and Antimicrobial Susceptibility
Patterns of Staphylococcus intermedius and
Pseudomonas aeruginosa Isolates From Canine
Skin and Ear Samples Over a 6-Year Period (1992–
1997). Journal of the American Animal Hospital
Association: Vol. 38, No. 5, pp. 407-413.
[6] Scott D.W., Miller W.H. Jr, Griffin, C.E. Muller &
Kirk’s (2001). Small Animal Dermatology VI.
Philadelphia: WB Saunders, 2001:274–309.
[7] Medleau, L., Long, R.E., Brown, J. and Miller,
W.H. (1986). American Journal of Veterinary
Research. Vol. 47(2): 229-231.
[8] I. S. Mason, 2008. Canine pyoderma. Journal of
Small Animal Practice. Volume 32, Issue 8, pages
381–386, August 1991.

IJSRST116245 | Received: 04 July 2016 | Accepted : 10 July 2016 | July-August-2016 [(2)4: 17-22]
© 2016 IJSRST | Volume 2 | Issue 4 | Print ISSN: 2395-6011 | Online ISSN: 2395-602X Themed Section: Science and Technology
17
Tree Gummosis a Thread for Mango Production in Northern Senegal
N. Mbaye2, G. F. A. Manga
2, P. M. Diedhiou
1* and P. I. Samb
2
1*Université Gaston Berger Route de Ngallele BP 234 Saint-Louis - Sénégal
2Département de Biologie Végétale, Université Cheikh Anta DIOP de Dakar, BP 5005 Dakar Fann, Sénégal
ABSTRACT
In Senegal mango is one of the most important fruit crops. Mango trees are planted in a large part of the territory
and produced in different cropping systems. Setting up mango orchards represents a great contribution to the
national production effort. However, infestations of the vegetative organs of the trees by diseases, in addition to
fruits infestations, are a major constraint to the development of mango plantations. The identification of the causal
agents for any disease is a prerequisite for corrective actions. In the Lampsar orchard, an outbreak of gummosis was
observed in almost all plots of mango trees, with greater intensity in the lower parts of the field. However a variety
of symptoms was recorded. Some plants showed cracking of the stem bark and gum exudation (gummosis), while
others, exhibited only the cracking of the stem bark. The symptoms were most frequently located below the grafting
point and/or on the junction point of the graft and the rootstock. The incidence of the disease varied from a plot to
the other, ranging from 0.59% to 8.5%. The diagnosis, made for 30 fungal isolates obtained from samples collected
in the field, allowed identifying Lasiodiplodia sp as a causal agent, thanks to the presence of its characteristic
pycnidia and pycniospores. Recommendations were made for the control of this fungus in the orchard.
Keywords: Lasiodiplodia sp, Mangifera Indica, Sénégal, Tree Gummosis.
I. INTRODUCTION
The mango (Mangifera indica L.) is one of the major
fruit crops of tropical and subtropical regions. According
to FAO (2011), the production of tropical fruits was
estimated at over 82.2 million tons in 2009. The mango
presents one of the main crops with 39% of world
production of tropical fruits. In Senegal, mango
production is experiencing a big growth with an increase
of acreages allocated to this crop and a modernization of
mango orchards as well. Mango represents 60% of fruit
production in the country with an annual production of
150,000 tons harvested on a land surface of about
41,000 ha (ASEPEX, 2012). Although the soil and
climatic conditions of the country offer a great potential
for the expansion of mango production (USAID, 2006),
this value chain is facing a lot of constraints related to
phytosanitary quality of both tree and fruit stages.
Postharvest rotting of fruits due mainly to anthracnose
and fruit fly cause important losses. In addition, the
appearance of a disease causing gum exudation from the
trunk of the trees in the north of the country accentuates
the pest pressure on the plant and thus affects the entire
value chain. This disease has been reported in mango
orchards from different parts of the world sometimes in
relation to mango decline (Malick et al., 2005). The
most specific symptom of the disease, one that earned
him his name, is the flow of brown gum, along the trunk
and branches (Vanderweyen, 1974). Several fungi are
associated with tree gummosis, among them, are listed :
Phytophthora palmivora (N'diaye et al, 2011),
Lasiodiplodia theobromae, Ceratocystis fimbriata, F.
solani, Phoma sp, Ceratocystis omanensis (Khanzada et
al., 2004b; Al Adawi et al., 2006; Iqbal et al., 2007;
Saeed et al., 2011; Haougui, 2013). The objective of this
study was to identify the causing agent of the disease
and assess its incidence in order to better target an
adequate control method.

International Journal of Scientific Research in Science and Technology (www.ijsrst.com)
18
II. METHODS AND MATERIAL
1. Study Site
The mango orchard where the disease broke out, is
located in the zone of Lampsar, 30 km east of the main
city of Saint-Louis (16°06’N latitude, 16°20’W
longitude and 29 m altitude). The climate is of Salelian
type and characterized by low rainfall (less than 300 mm
in the year). The soil is sandy but the proximity of the
river Senegal has impacted deeply on the landscape and
provides fresh water for irrigation.
The studied orchard covers 50 hectares of land, of which
about 40 ha are cultivated, the remaining 10 hectares are
represented by driveways and various facilities. It is
divided into 20 plots of 2 ha each. Almost all mango
trees were planted in 2013 on rows with 7 m interval. In
each row trees are planted in lines with 5 m spacing. Plot
10 and 19 were set up 2 years later, in 2015. The
plantation design resulted in a population of 572 trees
per plot populated with only mango trees of the variety
Kent. Planting was performed by first sowing mango
kernels let to grow in the nursery. The seedlings, used as
rootstock were thereafter grafted with scions from
mature mango trees of the variety kent only. The orchard
is equipped with drip irrigation system. This is set in a
way to feed each mango tree with twenty drippers
emitting 5L per hour each around each around the tree.
Each plot is irrigated every 2 days for 50 minutes.
Fertilization is performed through the irrigation system
allowing the supply of nutrients in soluble form in the
irrigation water. The nutrients are delivered to the trees
with the drippers on the basis of fertilization program. A
mechanical weed control with an offset is performed on
the driveways and between the rows as necessary. It is
done manually under the canopy of the trees. Several
phytosanitary treatments were carried out in the orchard,
likewise, an insecticide was sprayed in May 2015 and
lime paintings were applied to the trunk of the mango
trees to control fungi.
2. Collection of data
A questionnaire was submitted to the head of the
orchard. Thereafter, an assessment of the diseases was
carried out in the orchard and covered systematically all
plants of the plots. Parameters like the presence of
cracking or gumming were recorded. Disease severity
was scored on a scale of 0 to 3, and the location of the
symptoms with respect to the grafting point was also
recorded. The topography of the different plots in the
orchard was taken into account in terms location on
upland or lowland areas in the orchard.
3. Sampling
Thirty samples were collected from diseased plants by
pealing the bark on parts of the trunk showing disease
symptoms. Twenty other samples were taken from the
trunk of symptomless plants. The fragments were then
taken to the laboratory for isolation of pathogens.
4. Isolation of Fungi
The isolation of pathogenic fungi responsible for the
disease was performed at the front of progression of
developing disease symptoms according to the
methodology described by Diédhiou et al. (2007). The
samples were first soaked in a 2% solution of sodium
hypochrorite for 1 minute. A sterilized scalpel incision is
made in order to cut a small fragment of bark at the front
progression of disease. The fragment is placed in a petri
dish containing PDA (Potato Dextrose Agar)
supplemented with 100 ppm of chloramphenicol. The
petri dishes are incubated at room temperature in the dark.
After 48 h, the mycelium growing out of the fragment is
transplanted into fresh petri dishes. When the pure
cultures are obtained, petri dishes are incubated for 3 to 6
weeks to allow sporulation. Features of fruiting bodies
like spores and pycnidia were used for the identification
of fungi.
5. Statistical analysis
The data were submitted to an analysis of variance
(ANOVA) using the SigmaStat ® software with a
confidence interval of 95%. Mean values was separated
through Tukey's tests pairwise comparisons.
III. RESULT AND DISCUSSION
1. Incidence of disease
Gum exudation from the trunk of mango trees was
observed in all plots except for plots 10 and 19. The

International Journal of Scientific Research in Science and Technology (www.ijsrst.com)
19
incidence of the disease ranged from 0 in plot 10 to 8.5%
in plot 4 (Figure 1). Some of the diseased plants
exhibited cracking of the bark of the trunk accompanied
by an exudation of gum (Figure 2a). The other type of
symptoms was characterized by only the cracking of the
bark on the trunk of trees (Figure 2b). The highest rate
of cracking was observed at the plot 4 (8.5%). The
younger trees in plots 10 and 19 were apparently healthy.
Figure 1: Incidence of gummosis in the plots of the
orchard (n = 14, p≤ 5%) (in the plot, there are 14 rows
representing each a replication)
a
b
Figure 2: Trunk of mango trees showing cracking and
exudation of gum (a) and cracking of the bark (b)
Either gum exudation and/or cracking of the bark of the
trunk of the trees were mainly located either below the
grafting point (figure 3a), or at the grafting point (figure
3b).
For most of the cases, cracking of the bark and/or gum
exudation were often located on the grafting point and
below the graft point (figure 4). The proportion of plants
with symptoms above the grafting point was low. The
incidence per plot was variable but reached a maximum
of 5.33% in plot 4 for symptoms on the grafting point.
The highest incidence for symptoms appearing below
the grafting point was also recorded in the same plot 4.
a b
Figure 3: Plants with symptoms of gummosis at the
grafting point (b) and below the graft point (a)
Figure 4: frequency of gummosis symptoms with
respect to the grafting point
The incidence of gum exudation and cracking of the
bark was significatively higher in plots located in the
lowland portions of the field 3.7 % and 4.3%
respectively against 1.5% and 2.4% for plants in the
upland areas (figure 5).
Figure 5: incidence of gummosis and cracking of the
bark in the lowland and upland areas of the orchard.

International Journal of Scientific Research in Science and Technology (www.ijsrst.com)
20
2. Pathogenic agents
All fungal isolates from the samples collected in the
field were initially white to smoky gray with a soft aerial
mycelium on PDA. This mycelium color turned
thereafter black on both sides of the Petri dishes. On the
upper side, shiny black fruiting bodies that match the
pycnidia were gradually visible. The conidia from the
pycnidia were initially hyaline, unicellular and
subovoïde to ellipsoid, with granular content. At
maturity, the conidia become dark brown and cinnamon,
with a thick wall and presented a central septum (figure
6). These features are specific for fungi of the genus
Lasiodiplodia.
Figure 6 : conidia (pycniospores) of Lasiodiplodia sp
under compound microscope
DISCUSSION
Lasiodiplodia sp was found as the causal agent causing
gum exudation as well as cracking of the bark of the
mango trees in the orchard. All macroscopic and
microscopic features of colonies, pycnidia, and conidia
were characteristic for the genus Lasiodiplodia.
However among all species of Lasiodiplodia, L.
theobromae is the one always associated with diseases
of mango. It is descried as a cosmopolitan fungus that
causes various diseases on about 500 plant species
(Pedraza et al., 2013). L. theobromae is found mainly in
tropical and subtropical regions in mango production
area. It was reported as a pathogen of mango worldwide
and is associated with several diseases such as mango
decline, canker and dieback (Ismail et al., 2012).
According Khanzada et al., (2005) L. theobromae is a
soil-borne fungus that causes both diseases on standing
trees and on mango fruits during storage. L. theobromae
was identified as causal agent for mango gummosis back
in 1992 (Narasimhudu & Reddy, 1992). Khanzada et al.,
(2004a) reported that mango decline and gummosis in
Sindh (Pakistan), were also caused by L. theobromae.
The same fungus was found associated with all
symptoms of dieback of the mango tree (Iqbal et al.,
2007; Khanzada et al., (2004b). The disease is
characterized by burning twigs, gum bleeding and
splitting of the bark. Diedhiou et al., (2007) and Haggag
et al., (2010) also identified L. theobromae as the causal
agent of stem end rot of mango fruits after harvesting.
Lasiodiplodia sp was also isolated from several samples
from apparently healthy mango trees in the orchard. A
similar case was reported by Muniz et al., (2011) who
found L. theobromae in tissues of asymptomatic cashew
plants. This could explain the absence of symptoms in
plants used as controls. According to Muniz et al.,
(2011), L. theobromae is able to live in plant tissues
without causing apparent symptoms. Following external
signals due to biotic or abiotic stress, symptoms begin to
appear and the disease is established. In the case of the
orchard studied, water and fertilizers were provided to
individual trees abundantly. In addition, smaller younger
trees were still symptomless.
The incidence of gummosis varied across the different
plots in the orchard. This variability could also be
related to the topography. In fact, a higher infestation
rates were observed for plots in the low areas of the
orchard. This could be explained by the presence of a
moist microclimate favorable for the development of
pathogens. Harsh climatic conditions and high humidity
are favorable for the development of mango gummosis
(N'diaye et al., 2011). Such conditions were found zone
where the orchard is located.
Gum exudation from trees may be observed alone or in
combination with other symptoms in mango orchards
(Iqbal et al., 2007; Shahbaz et al., 2009; Malik et al.,
2005). In the present study, mango gummosis was
combined with cracking of the bark on the trunk for
some of the infected plants. This combination was
observed for other plant species like neem tree (Khalil,
2012) and citrus (Graham and Timmer, 2003). In other
cases, gum exudation is associated with dieback (Iqbal
et al., 2007; Shahbaz et al., 2009; Malik et al., 2005).
The combination of gum exudation with other disorders
on the mango tree could be an indication that they share

International Journal of Scientific Research in Science and Technology (www.ijsrst.com)
21
a common causal agent (Iqbal et al., 2007). In the
present study, the symptoms were mainly observed on
the rootstock. It is known that L. theobromae is a soil-
borne fungus (Khanzada et al., 2005), which is
preserved in the soil, on plants debris, etc. The rootstock
is therefore more exposed to the pathogen and should be
more susceptible to develop the disease in a conducive
environment. The genotype of the rootstock could then
play an important role in plant susceptibility to the
disease. If resistant rootstocks could be found, this may
help reduce the importance of the potential damage of
the disease. The questionnaire conducted with the
orchard manager revealed however, that any mango
varieties were used as rootstock making any further
investigation in this direction, not relevant. Surveys
conducted in the region showed no other mango orchard
with gummosis. It is important to mention that the
variety kent is not common in the region. In addition, all
other orchards are of traditional type, with trees planted
and left without further care until harvest period.
IV. CONCLUSION
Gummosis disease was observed in almost all plots of
this single orchard, with widely varying incidences
between plots and higher levels infestation in the lower
parts. Results of the present study would suggest that
Lasiodiplodia sp is the causal agent of gummosis
diseases of mango in Senegal. Isolation of the pathogen
from asymptomatic plants, confirms its endophyte
character. Further studies would be necessary to identify
not only the species of Lasiodiplodia associated of the
gummosis of mango in Senegal, but also the sensitivity
of different mango.
V. REFERENCES
[1] Al Adawi, A.O., Deadman, M.L., Al Rawahi,
A.K., Al Maqbali, Y.M., Al Jahwari, A.A., Al
Saadi, B.A., Al Amri, I.S., Wingfield, M.J. 2006.
Aetiology and causal agents of mango sudden
decline disease in the Sultanate of Oman.
European Journal of Plant Pathology 116:247-254.
[2] ASEPEX, 2012. Bilan de la campagne 2012
d’exportation mangue au Sénégal.
[3] Diedhiou, P.M., Mbaye, N., Dramé, A., Samb, P.I.
2007. Alteration of post harvest diseases of mango
(Mangifera indica L.) through production
practices and climatic factors. African Journal of
Biotechnology 6(9):1087-1094.
[4] FAOSTAT. 2011
[5] Graham, J.H., Timmer L.W. 2003. Phytophthora
Diseases of Citrus. 11p
[6] Haggag, W.M. 2010. Mango diseases in Egypt.
Agriculture And Biology Journal Of North
Americ 1(3):285-289
[7] Haougui, A. 2013. Fiche technique du RECA
Niger : Dépérissement du manguier au Niger.
[8] Iqbal, Z., Valeem, E.E., Shahbaz, M., Ahmad, K.,
Khan, Z.I., Malik, M.T., Danish, M. 2007.
Determination of different decline disorders in
mango orchards of the Punjab, Pakistan. Pakistan
Journal of Botany 39:1313-1318.
[9] Ismail, A.M., Cirvilleri, G., Polizzi, G., Crous, P
.W., Groenewald, J.Z., Lombard, L. 2012.
Lasiodiplodia species associated with dieback
disease of mango (Mangifera indica) in Egypt.
Australasian Plant Pathology 41:649-660.
[10] Khalil, O. 2012. Lasiodiplodia theobromae
Associated with Gummosis in Neem Tree
(Azadirachta indica A. Juss.) in The Sudan.
University of Africa Journal of Sciences 2:105-
117
[11] Khanzada, M.A., Lodhi, A., Shahzad, S. 2004a.
Mango dieback and gummosis in Sindh, Pakistan
caused by Lasiodiplodia theobromae. Plant Health
Prog. doi:10.1094/PHP-2004-0302-01-DG
[12] Khanzada, M.A., Lodhi, A.M., Shahzad, S. 2004b.
Pathogenicity of Lasiodiplodia theobromae and
Fusarium solani on mango. Pakistan Journal of
Botany 36(1):181-189
[13] Khanzada, A.M., Lodhi, A.M., Shahzad, S. 2005.
Chemical control of Lasiodiplodia theobromae,
the causal agent of mango decline In Sindh.
Pakistan Journal of Botany 37(4): 1023-1030
[14] Malik, M.T., Dasti, A.A., Khan, S.M. 2005.
Mango decline disorders prevailing in Pakistan.
Proceedings of International Conference on
Mango and Date palm: Culture and Export,
University of Agriculture, Faisalabad, Pakistan.
20-23 June, pp. 53-60.
[15] Muniz, C.R., Freire, F.C.O., Viana, F.M.P.,
Cardoso, J.E., Cooke, P., Wood, D., Guedes,
M.I.F. 2011. Colonization of cashew plants by
Lasiodiplodia theobromae : Microscopical
feactures. Micron 42 : 419-428

International Journal of Scientific Research in Science and Technology (www.ijsrst.com)
22
[16] Narasimhudu, Y., Reddy, P.S.N. 1992. A note on
gummosis of mango. Indian Phytopathol. 45(2):
261-262.
[17] N'diaye, M., Arnoldus, M., Kéita, S. 2011. Manuel
sur le dessèchement des manguiers dans la région
de Koulikoro. SNV; AOPP; KIT. 46 p
[18] Pedraza, J.M.T., Aguilera, J.A.M., Díaz, C.N.,
Ortiz, D.T., Monter, A.V., Mir, S.G.L. 2013.
Control of Lasiodiplodia theobromae, the causal
agent of dieback of Sapote mamey [Pouteria
sapota (Jacq.) H. E. Moore and Stearn] grafts in
Mexico. Revista Fitotecnia Mexicana 36 (3): 233-
238.
[19] Saeed, S., Khan, M.I., Masood, A. 2011.
Symptom development after artificial inoculation
of Botryodiplodia theobromae, a possible causal
organism to quick decline in mango trees. Pak. J.
Agri. Sci., 48(4):289-294.
[20] Shahbaz, M., Iqbal, Z., Saleem, A., Anjum, M.A.
2009. Association of Lasiodiplodia theobromae
with different decline disorders in mango
(Mangifera indica L.). Pakistan Journal of Botany
41:359-368.
[21] USAID. 2006. La chaîne de valeurs mangue au
Sénégal ; analyse et cadre stratégique d’initiatives
pour la croissance de la filière.
[22] Vanderweyen, A. 1974. La gommose à
Phytophthora des agrumes au Maroc. AI Awamia
5l : 83-127.

IJSRST16246 | Received: 08 July 2016 | Accepted: 18 July 2016 | July-August-2016 [(2)4: 23-28]
© 2016 IJSRST | Volume 2 | Issue 4 | Print ISSN: 2395-6011 | Online ISSN: 2395-602X Themed Section: Science and Technology
23
Isolation and Identification of Bacteria from Different Soil Samples of
Telangana and Andhra Pradesh States Arsheen Tabassum, Dr. M. Shailaja Raj
Department of Microbiology, St. Francis College for Women, Begumpet, Hyderabad, Telangana, India
ABSTRACT
The word agriculture is more related to natural activity and to nature like plant life cycle, ecosystem, green earth,
vegetables, fruits, soil, water & natural environment. Plants have a number of relationships with fungi, bacteria, and
algae. These are known to deliver a number of benefits including plant nutrition, disease resistance, tolerance to
adverse soil and climatic conditions. These techniques have proved to be successful biofertilizers that form a healthy
relationship with the roots. Biofertilizers provide eco-friendly organic agro-input and are more cost-effective than
chemical fertilizers.
In the present studies various soil samples were collected from actively cultivated lands after a thorough survey of
the areas. The places from where these soil samples were collected include Gandipet, Shamirpet areas in Hyderabad,
Chevella on the outskirts of Hyderabad and Adilabad district of Telangana State and Kurnool, Kadapa, Gudipadu
areas of Andhra Pradesh State. Most of the soils thus obtained were seem to be supporting agriculture actively.
These soil samples thus collected were packeted and brought to the laboratory for further microbiological testing.
Characterization and microscopic observation of the culture was done and the bacteria identified were Streptomyces
sp., Staphylococcus sp., Azotobacter sp., Leptothrix sp., Derxia sp., Bacillus sp., and Sphaerotilus sp. Of the above
isolated organisms Azotobacter sp. Streptomyces sp. and Bacillus sp. are familiar to be used as biofertilizers in
various crop fields. Derxia sp. is a Gram negative, nitrogen fixing bacteria but not much known as a biofertilizer,
which seems to be very interesting to scientist to work on it. Hence it is important to study its role in agriculture.
Keywords: Soil samples, Biofertilizers, Bacteria, Crop fields, Farmers.
I. INTRODUCTION
One of the major concerns in today’s world is the
pollution and contamination of soil. [1]
The use of
chemical fertilizers and pesticides has caused
tremendous harm to the environment. While manure,
cinder and iron making slag have been used to improve
crops for centuries, the use of biofertilizers is arguably
one of the great innovations. [2] [3]
Minerals, organic
components and microorganisms are three major solid
components of the soil. They profoundly affect the
physical, chemical, and biological properties and
processes of terrestrial systems. Biofertilizer are the
products containing cell of different types of beneficial
microorganisms. Biofertilizers are classified as Nitrogen
fixers which includes Bacteria like Rhizobium,
Azotobacter, Mycobacterium and Blue Green Algae like
Anabaena , Nostoc etc. Further depending upon the
fixing capacity they are divided as Phosphate
solubilizing fertilizer, Plant growth promoting
Rhizobacterim (PGPR), Sulphur solubilizing microbes
etc.
Biofertilizers can be expected to reduce the use of
chemical fertilizers and pesticides. The microorganisms
in biofertilizers restore the soil's natural nutrient cycle
and build soil organic matter. Through the use of
biofertilizers, healthy plants can be grown, while
enhancing the sustainability and the health of the soil.
Since they play several roles, a preferred scientific term
for such beneficial bacteria is "plant-growth promoting

International Journal of Scientific Research in Science and Technology (www.ijsrst.com)
24
rhizobacteria "(PGPR).[4]
These are some of bacteria that
can grow in the root environment and be effective on
plant growth. Mechanisms that can promote plant
growth include production of phytohormones, biological
nitrogen fixation and increased solubility of insoluble
elements in soil. Therefore, they are extremely
advantageous in enriching soil fertility and fulfilling
plant nutrient requirements by supplying the organic
nutrients through microorganism and their byproducts.
Hence, biofertilizers do not contain any chemicals which
are harmful to the living soil.
Several soil bacteria help the crops to fix the
atmospheric nitrogen and the organic phosphate. Hence
these potential bacteria would play key role in
productivity and sustainability of soil and also protect
the environment as eco-friendly and cost effective inputs
for the farmers.[5]
It also means that nature grows only
when there is balance of activities between natural
things only like animals, plants, microbes and
environment! These potential bacteria as biological
fertilizers can be important components of integrated
nutrient management.
II. METHODS AND MATERIAL
A. Collection of soil samples
Various soil samples were collected from actively
cultivated lands after a thorough survey of the areas. The
places from where these soil samples were collected
include Gandipet, Shamirpet areas in Hyderabad,
Chevella on the outskirts of Hyderabad and Adilabad
district of Telangana State and Kadapa, Kurnool,
Gudipadu areas of Andhra Pradesh State. Most of the
soil thus obtained was seem to be supporting agriculture
actively. The land was dug as deep as 10 – 15 cm for the
collection of soil samples. These soil samples thus
collected were packeted and brought to the laboratory
for further microbiological testing. The soil samples
were wetted from time to time to help in the sustenance
of the microorganisms as moisture is also a very
important factor that plays an important role in the
survival of microorganisms.
B. Characterization of the soil samples
The soil samples were then studied for the soil type,
colour and the crops that they support for cultivation.
The soils were then typed as red soil and black soil.
Crops like Green leafy vegetables, Onion, Turmeric,
Ground nuts, Rice, Pea plants and Tomato were being
cultivated on these soils. The soils were then labelled
and segregated according to the crops and place from
where they were obtained.
C. Preparation of culture media
Nutrient agar media was used for primary isolation and
Jensen agar media ,William and Kusters media for their
sub culturing.
D. Isolation and characterization of bacteria
Serial dilution agar plating was done for the isolation of
soil microbes. Suspension was diluted up to 10-10
. The
aliquots were cultured for bacteria. For primary isolation
of bacteria Nutrient broth, Nutrient agar media and
specific medias like Jensons media and William and
Kusters media for the growth of Azotobacter sp. and
Actinomycetes sp. were used. The inoculum was spread
with the help of a spreader evenly on the media. The
inoculated plates were then incubated at 37C for 24 h.
Growth of the microorganisms is observed in the form
of turbidity and colony growth respectively.
Characterization and microscopic observation of the
culture was done.
III. RESULT AND DISCUSSION
One way to increase crop yield is using the beneficial
microorganisms. Biofertilizers help the crops to fix the
atmospheric nitrogen and the organic phosphate. They
maintain a healthy symbiotic relationship with the crops
thus helping to increase the yield of the crops. This
symbiotic relationship proves beneficial both to the
organism contributing for their sustenance and also in
turn increases the soil fertility thereby helping to obtain
an increased, disease free, resistant crop type [6]
.
Biofertilizers such as Rhizobium, Azotobacter,
Azospirilium and blue green algae(BGA) have been in
use for a long time. And also there must be some
organism having direct or indirect association with

International Journal of Scientific Research in Science and Technology (www.ijsrst.com)
25
plants which need to be investigated thoroughly. For this
one has to study the organism present in the different
soil samples of various plants.
In the current studies various soil samples were collected
from actively cultivated lands after a thorough survey of
the areas. The first step of this project is to isolate and
identify bacteria from different soil samples like
Gandipet, Shamirpet areas in Hyderabad, Chevella on
the outskirts of Hyderabad and Adilabad district of
Telangana State and Kurnool, kadapa, Gudipadu areas
of Andhra Pradesh State. Most of the soils thus obtained
were seem to be supporting agriculture actively. These
soil samples thus collected were packeted and brought to
the laboratory for further microbiological testing.
Characterization and microscopic observation like Gram
stainig, Spore staining, Capsular staining and
biochemical test were performed. It is evident from the
Table 1. the organism isolated and identified from
Telangana State of Gandipet black soil rice field is
Streptomyces sp., to confirm this organism it was
inoculated in to Williams and kusters media which had
shown the orange pigmented smooth, entire mucoid and
translucent colonies, characteristic feature of
Streptomyces. According to literature Streptomyces sp.
isolated (Tinatin Doolotkeldieva et al., 2015)[7]
from the
rhizosphere has improved the composition of
rhizosphere microflora, attracting saprophytic
microorganisms: ammonificators and oligotrophs. The
presence of the biocontrol microorganism Streptomyce
sp. in the rhizosphere plays an important role in
enhancing the growth and development of useful groups,
such as nitrogen-fixing bacteria [7]
. Organism identified
from Tomato plants of Shamirpet black soil is
Staphylococcus sp. Chevella black soil, showed the
growth of Azotobacter sp. in pea plant and the organism
isolated from leafy green vegetables of Adilabad red soil
are Leptothrix sp. and Azotobacter sp.
Leptothrix sp. is a sheathed filamentous bacterium that
can generally be found in different types of aquatic
environments with sufficient organic matter. It is known
to be capable of oxidizing both iron (II) and manganese
(II), unlike other sheathed bacteria. Crops inoculated
with Azotobacter and Azospirilla reviewed by Wani
(1990) indicated that Pearl millet and Sorghum, which
are grown as dry land crops showed 11-12% increased
yields due to inoculations. [8]
Table 2. shows that an
organism isolated from Andhra Pradesh State of
Kurnool black soil Rice is Azotobacter sp. and from
Ground nut is Derxia sp. The organism Azotobacter sp.
are Gram-negative bacteria[9]
found in neutral and
alkaline soils, in water and in association with some
plants. It plays a vital role in every ecosystem, it is
found worldwide, in climates ranging from extremely
northern Siberia to Egypt and India. [10].
It is used as
biofertilizers for the development of various vegetable
plants such as mustard, maize, wheat, cotton etc. The
most dominant Azotobacter sp. which was isolated from
Chevella, Adilabad and Kurnool districts is confirmed
by inoculating in to specific Jensen agar media. Derxia
is a genus of Gram-negative, nitrogen-fixing bacteria
from the family of Alcaligenaceae.[11] [12] [13]
Rennie
(1980) examined sugarcane rhizosphere soil samples
from Brazil and found them to contain equal populations
of Derxiagummosa, Enterobacter cloacae, Bacillus
polymyxa and Azotobacter vinelandi.[14]
And organism
isolated from Ground nuts of Kadapa red soil are
Bacillus sp. and Staphylococcus sp. Literature shows
that Bacillus and Staphylococcus sp. bacteria have
potential to fix atmospheric nitrogen, able to produce
IAA with the range of 15.13± 0.2 to 33.1± 0.2 μg/ml
when supplemented with 100 μg/ml of tryptophan and
showed some P-solubilizing activity which have been
claimed by manufacturers. [15]
Sample collected from
Gudipadu black soil of Onion and Turmeric crop field
identified as Bacillus sp. and from Ground nuts are
Sphaerotilus sp. and Bacillus sp.
Sphaerotilus sp.[16]
is a filamentous bacterium that is
covered in a tubular sheath and can be found in flowing
water and in sewage and waste water treatment plants. A
group of rhizosphere bacteria (rhizobacteria) that exerts
a beneficial effect on plant growth is referred to as plant
growth promoting rhizobacteria or PGPR (Schroth and
Hacock, 1981). PGPR[17]
belong to several genera e.g.
Agrobacterium, Alcaligenes,Arthrobacter, Actinoplanes,
Azotobacter, Bacillus, Pseudomonas sp., Rhizobium,
Bradyrhizobium, Erwinia, Enterobacter, Cellulomonas,
Flavobacterium, Streptomyces and Xanthomonas sp.
(Weller, 1988). Several soil bacteria and fungi notably
species of Pseudomonas, Bacillus, Penicillium and
Aspergillus etc., secrete organic acids and lower the pH
in their vicinity to bring about solubilization of bound
phosphates in soil (Sundara Rao and Sinha, 1963)[18]
.
Habibi et al. (2011) strongly suggested that using

International Journal of Scientific Research in Science and Technology (www.ijsrst.com)
26
biofertilizers (combined strains) plus half a dose of
organic and chemical fertilizers have resulted in the
greatest grain yield and oil yield in medicinal
pumpkin[19]
. Studies showed that the inclusion of wheat
plant with PGPR increased the growth characteristics of
wheat [20].
The second step of the project is to check potential use
of these bacteria as biofertilizers on various crop fields.
Furthermore, the phosphate solubilization capacity and
nitrogen fixing ability of Azotobacter and other
organisms isolated from various soils are to be tested
and employed as biofertilizers during field trials on
various crop plants which will be taken up as next phase
of project work. Biofertilizer containing those
microorganisms would play a great role in crop
improvement. Crop yield can be increased by 20-30% if
they are used properly. Hence these potential bacteria
would play key role in productivity and sustainability of
soil and also protect the environment as eco-friendly and
cost effective inputs for the farmers.[21]
Table 1: Organism isolated from Telangana State.
Area /
Type of
soil
Type
of
crop
Media
used
Colony morphology Microscopic Observatios Organism
identified
G
a
n
d
i
p
e
t
B
l
a
c
k
S
o
i
l
Rice Nutrien
t
agar
Orange pigmented
smooth, entire mucoid
and translucent colonies.
Gram-positive, filamentous
bacteria with well-developed
vegetative hyphae with
branches. Spore surfaces were
hairy, smooth, and spiny .
Streptomyces sp.
Rice Williu
m and
kusters
media
Orange pigmented
smooth, entire mucoid
and translucent colonies.
Gram-positive, filamentous
bacteria with well-developed
vegetative hyphae with
branches. Spore surfaces were
hairy, smooth, and spiny .
Streptomyces sp. is
confirmed
Shamipet
Black
Soil
Tomat
o
Plant
Nutrien
t agar
Golden yellow colonies Gram positive cocci in clusters Staphylococcus sp.
C
h
e
v
e
l
l
a
B
l
a
c
k
S
o
i
l
Pea
plant
Nutrien
t agar
Non pigmented, smooth,
mucoid and translucent
colonies.
Gram negative thick
sporulating bacilli arranged
singli.
Azotobacter sp.
Pea
plant
Jensen
agar
media
Non pigmented, smooth,
mucoid and translucent
colonies.
Gram negative, thick
sporulating bacilli arranged
singli.
Azotobacter sp. is
Confirmed
A
d
i
l
a
b
a
d
R
e
d
S
o
i
l
Green
leafy
vegeta
bles
Nutrien
t
agar
Non pigmented
medium sized, round,
entire margin colonies.
Gram negative filamentous
network.
Leptothrix sp.
Green
leafy
vegeta
bles
Nutrien
t
agar
Non pigmented, smooth,
mucoid and translucent
colonies.
Gram negative, thick
sporulating bacilli arranged
singli.
Azotobacter sp.

International Journal of Scientific Research in Science and Technology (www.ijsrst.com)
27
Table 2: Organism isolated from Andhra Pradesh State
IV. CONCLUSION
The purpose of this study was to investigate the bacteria
associated with different soil samples of various crop
fields of Telangana and Andhra Pradesh States. The
bacteria isolated and identified were Streptomyces sp.,
Staphylococcus sp., Bacillus sp., Azotobacter sp.,
Leptothrix sp., Derxia sp., Bacillus sp., and Sphaerotilus
sp. Of the above isolated organism there is no evidence
of using Leptothrix sp.and Sphaerotilus sp. as
biofertilizers. Azotobacter sp.is used as biofertilizers for
the development of various vegetable plants. Derxia sp.
is a Gram negative, nitrogen fixing bacteria but not
much known as a biofertilizer, which seems to be very
interesting to scientist to work on it. Hence it is
important to study its role in agriculture. Furthermore,
the phosphate solubilization capacity and nitrogen fixing
ability of Azotobacter, Derxia and other organisms
isolated from various soils are to be tested and employed
as biofertilizers during field trials on various crop plants
which will be taken up as next phase of project work.
V. REFERENCES
[1] Vessey, J. K., "Plant growth promoting
Rhizobacteriaas bio-fertilizers". Plant Soil ,2003,
255, 571-586
[2] http://www.calfertilizer.org
[3] http://www.planthealthcare.com
Area /
Type
of soil
Type
of crop
Media
used
Colony morphology Microscopic Observatios Organism
identified
K
u
r
n
o
o
l
B
l
a
c
k
S
o
i
l
Ground
nut
Nutrien
t
agar
Small,mucoid, pin
pointed, opaque ,
smooth.
Gram negative slightly curved
rods with rounded ends. Cells
appear as dividing pairs.
Derxia sp.
Rice
Nutrien
t
agar
Non pigmented smooth,
mucoid and translucent
colonies.
Gram negative thick sporulating
bacilli arranged singli.
Azotobacter Sp.
K
a
d
a
p
a
R
e
d
S
o
i
l
Ground
nut
Nutrien
t
agar
Non pigmented pale,
smooth mucoid and
opaque.
Gram positive thick sporulating
bacilli.
Bacillus sp.
Ground
nut
Nutrien
t
agar
Round, flat,serrated
margins, yellow
pigmented colonies.
Gram positive Cocci arranged in
cluster.
Staphylococcus sp.
G
u
d
i
p
a
d
u
B
l
a
c
k
S
o
i
l
Onion,
Turmer
ic and
Ground
nut
Nutrien
t
agar
Non pigmented pale,
smooth, mucoid and
opaque colonies.
Gram positive thick sporulating
bacilli.
Bacillus sp.
Ground
nut
Nutrien
t
agar
Large irregular ,
mucoid, rough and
opaque colonies.
Gram negative sheated bacilli Sphaerotilus sp.

International Journal of Scientific Research in Science and Technology (www.ijsrst.com)
28
[4] De Freitas, J. R. and Germida, J. J., "Plant growth
promoting rhizobacteria for winter Wheat" .Can. J.
Microbiol., 1990; 36, 265.
[5] Khosro Mohammadi and Yousef
Sohrabi,"Bacterial biofertilizers for sustainable
crop Production". ARPN Journal of Agricultural
and Biological Science: may 2012; vol.7,no. 5.
[6] Mohd Mazid and Taqi Ahmed Khan. "Future of
Bio-fertilizers in Indian Agriculture" International
Journal of Agricultural and Food Research , ISSN
1929-0969 , 2014; Vol. 3 , No.3, pp. 10-23.
[7] Tinatin Doolotkeldieva et al, "Effects of
Streptomyces Biofertilizer to Soil Fertility and
Rhizosphere’s Functional Biodiversity of
Agricultural Plants’’. Advances in Microbiology,
2015, 5, 555-571
[8] Biotechnology of Biofertilizers - Page 54 - Google
Books Result
https://books.google.co.in/books?isbn=140200219
X
[9] Zohreh Mazinani1, Mehdi Aminafshar, Ahmad
Asgharzadeh, Mohammad Chamani "Effect of
Azotobacter population on physico–chemical
characteristics of some soil samples in Iran".
Annals of Biological Research, 2012; 3 (7):3120-
3125.
[10] Sartaj a. wani et al, "Potential Use of Azotobacter
Chroococcum in Crop Production: An Overview,
ISSN: 2347-4688, Online ISSN: 2321–9971.
[11] Xie, Cheng-Hui; Yokota, Akira "Phylogenetic
analyses of the nitrogen-fixing genus Derxia". The
Journal of General and Applied Microbiology,
2004; 50 (3):129– 35.
[12] Roy, A. B.; Sen, Subir A New Species of Derxia".
Nature , 1962; "194 (4828): 604–5.
[13] The ProkaryotesA Handbook on the Biology of
Bacteria Vol 5 Proteobacteria: Alpha and Beta
Subclasses ISBN 3540238611 Springer 2006.
[14] Biotechnology of Biofertilizers - Page 340 -
Google Books Result
https://books.google.co.in/books?isbn=140200219
X
[15] G.H. Tan and S. A. Nazaruddin, "Isolation,
characterization and identification of effective
microorganisms from Malaysia biofertilizer
products". Director research journal ofAgriculture
and Food science (DRJAFS) 2015; vol.3,157- 161.
[16] Pellegrin, Veronique, Stefan Juretschko, Michael
Wagner and Gilles Cottenceau. "Morphological
and biochemical properties of a Sphaerotilus sp.
isolated from paper mill slimes." Appl Environ
Microbiol, 1999; vol. 65, no. 1. American Society
for Microbiology. (156-162).
[17] BS Saharan and V Nehra. "Plant Growth
Promoting Rhizobacteria": A Critical Review Life
Sciences and Medicine Research, Volume 2011:
LSMR-21.
[18] Azolla Biofertilizer for Sustainable Rice
Production https://books.google.co.in/books
[19] Influence of bio, organic and chemical fertilizers
on medicinal pumpkin.
www.academicjournals.org
[20] Yoav Bashan, Gina Holguin, and Ran
Lifshitz."Isolation and Characterization of Plant
Growth-Promoting Rhizobacteria".1993;
libra.msra.cn › Publications.
[21] Annika Durve- Gupta, Bharati Devaguptapu,
Vijaya Lobo , Isolation and evaluation of isolated
bacteria as potential biofertilizer, International
Journal of Applied Research 2016; 2(2): 429-435.

IJSRST162376 | Received: 10 June 2016 | Accepted: 13 July 2016 | July-August-2016 [(2)4: 29-33]
© 2016 IJSRST | Volume 2 | Issue 4 | Print ISSN: 2395-6011 | Online ISSN: 2395-602X Themed Section: Science and Technology
29
Biological Control of Bark Eating Caterpillar Indarbela Quadrinotata in Indian Gooseberry
Savita Raidas
1, Sandeep Kumar
2, Dr. Sandeep Pandey
2*
1G.M.H. College of Home Science and Science for Women, Jabalpur, Madhya Pradesh, India
2School of Environmental Biology, A.P.S. University, Rewa, Madhya Pradesh India
ABSTRACT
Field trials were carried out to study the efficacy of different entomopathogens, commercial bio-pesticides and plant
extract against bark eating caterpillar (Inderbela quadrinotata wlk.) on Indian gooseberry (Emblica officinalis). All
the treatments show remarkable variations against the moth. Among the treatments the bio-pesticides were found
superior over entomopathogens in frass reduction of the caterpillar. The result reveals that neem extracts shows
maximum frass reduction of the larvae followed by Bacillus thuringiensis and Beauveria bassiana over control.
Further, the efficacy test of entomopathgens reveals that Fusarium moniliformae was found comparably the best
among the other tested fungal isolates in frass reduction. The use of biopesticides preferably the entomopathogens in
pest management, is widely acceptable as it is safer and economical maintaining the ecological balance of the nature.
Keywords: Bark Eating Caterpillar, Biological Control, Plant Extract, Entomopathogens, Indian Gooseberry.
I. INTRODUCTION
The bark eating caterpillar (Inderbela quadrinotata wlk.)
a moth of order Lepidoptera, with wood boring habits,
the most prevalent in Asia Pacific region (34%) (FAO,
2009), affects nearly fifty plant species in tropical and
sub-tropical India. The caterpillar damages varieties of
fruit trees in central India (CROPSAP, 2013) including
Indian gooseberry (Emblica officinalis), and thus a pest
of national significance (AESA, 2014). Although bark
caterpillar is apolyphagous generally considered of
minor importance in forestry, however is a major pest of
Indian gooseberry (Mathew, 1997; Bharpoda et al 2009).
The infected plant generally shows symptoms in form of
large dark-brown masses of chewed wood and faecal
matter near the forks. The larva bores into the bark
making tunnel of nearly 20 cm. depth take refuge during
the day and eats the bark of the tree during night. Bark
damaged by the larva results in inhibiting translocation
of cell sap, and reduces growth of host species
(Sashidharan et al 2010) along with adverse impact on
fruiting of the plant.
The infestation of pest generally starts in the month of
April with the emergence of moths (Pathak, 2003). The
damage due to this pest prevails more or less but
maximum during rainy season over rest of the season in
a year (Sasidharan and Varma, 2008; Bharpoda et al
2009). The temperature plays an important role in
population variations of the pest, thus the insect–tree
host–natural enemy relationship can help in developing
timely control management of the larvae (Sasidharan
and Varma, 2008).The incidence of pest is also
influenced due to elevation, varying 0 to 98% which is
negligible in high elevation, followed by mid and
maximum in low areas (Gupta et al 2014).The age of
plant species and availability of appropriate alternative
host plants are significant factors for survival of a
residual pest population (Mathew, 1997).
The pest control using pesticides are found effective but
create toxicity in the environment. The Agro-ecosystem
analysis (AESA) focusing bio-intensive techniques
based IPM shows least damage to the ecosystem, and
has emerged as a better alternative of pest management
programme in various countries (FAO, 2016). Among

International Journal of Scientific Research in Science and Technology (www.ijsrst.com)
30
the integrated management approaches, biological
control is favourable in terms of cost-benefit ratio,
combating insecticide-resistant pests and minimizing the
practice of chemical pesticides (Bale et al., 2008).
Biological control has also gained maximum acceptance
for management of major pests as they restore the
natural balance through meaningful human intervention
(Ballal and Verghese, 2015). A large number of
Fusarium species are entomopathogenic known for their
abundance in nature and can be easily cultured and mass
produced, and causes high insect mortalities along with
high host specificity without damaging to plants (Teetor-
Barsch and Roberts, 1983). The microbial biocontrol
agent shows different mechanisms of action (Fravel,
2005) and are natural enemies devastating the vast
population of the pest with no hazardous effect on
human health and the environment (Khan et al 2012).
Therefore, the present work is based on evaluation of
various biocides, plant extract and entomopathogens as a
part of biological control system and their potentiality in
effective management of bark eating pest of Indian
gooseberry.
II. METHODS AND MATERIAL
The experiment was conducted in a nursery, in Jabalpur
district of Madhya Pradesh, in central India (230
79056'E) during year 2014. The experimental plot
contains 105 trees of E. officinalis distributed in 21
rows of 5 trees each. The bark eating larvae infected
with entomopathogenic fungi was collected from the
nursery and brought for further laboratory study.
Larval Cultures and Isolation of Entomopathogens
The infected larvae were put on moist and sterilized
paper on petridishes for the germination of
entomopathogen for 72 hrs. The entomopathogenic
fungal isolates used in this study were obtained as
natural infections in host insects. Three species of
entomopathogenic fungi viz. Fusarium oxysporum, F.
moniliformae and Aspergillus niger were identified
with the help of standard mycological literature (Booth,
1971; Ellis, 1971; Grove, 1937; Sutton, 1980).
Pathogenicity Test
The isolates were grown on Potato Dextrose Agar
(PDA) at various concentrations for 10-15 days. The
harvesting of conidia were carried out by scraping the
surface of the agar using sterile spatula, and rinsing it
with distilled water containing 0.1% Triton X-100.The
conidial suspension was filtered to remove debris. The
conidia were determined using hemocytometer
(neubauer improved cell counting chamber) and the
suspensions were adjusted to 1 × 10⁸ conidia mL
−1 to
prepare required volume for each isolate. The conidial
suspensions of the isolates were applied by pipetting
onto the larva. The F. oxysporum isolate was applied at
concentrations of 1.6 ×10⁻³
, 1.6 ×10⁻⁵
,1.6 ×10-6
, 1.6 ×10-
7,1.6 ×10
-8 cell mL
−1, F. moniliformae isolates at 1.5
×10-3
, 1.5 ×10⁻⁵,
1.5 ×10⁻⁶
, 1.5×10⁻⁷
,1.5 ×10-8
cell mL−1
and A. niger isolates at 1.8 ×10⁻³
, 1.8 ×10⁻⁵
, 1.8 ×10⁻⁶
,
1.8 ×10⁻⁷
,1.8 ×10-8
cell mL−1 along with one control
plate in each experiment. Finally the petri-plates were
tightly sealed and incubated at 25 ± 10C, 70% RH and
larvae were examined for pathogenicity at regular
interval of one week for four weeks. It was observed
that Fusarium. oxysporum at 1.6 ×10⁻⁶
, Fusarium
moniliformae at 1.5 ×10⁻⁶
and Aspergillus niger at 1.8
×10-6
cell mL−1 concentrations was found to be
effective against larvae and kept for further
experimental studies.
Field Trials
Two field trials were laid out in triplicates in
randomized block for testing the efficacy of biocontrol
agents along with control, against bark eating pest of
Indian gooseberry. In first trial three commercial
biopesticides including Deuteromycotina fungi
Fusarium oxysporum (fungal suspension) @ 1.7x10-
cell mL−1 and Beauveria bassiana (Trade name-
Boverin) (1% w/w) @25 g L-1
, and a spore forming
bacteria Bacillus thuringiensis (var. kurstaki) (Btk)
(Trade name-Dipel BL)@ 25 g L-1
, along with aqueous
extract of Neem@10% were tested against the larvae.
The bio-pesticides were prepared on the basis of their
active spore formulation and were sprayed by Hand
Sprayer (cap. 5lit).The second trial was conducted to
evaluate the entomopathogenic activity of three in vitro
isolated fungi with their effective dose of pathogenicity
on the larvae. Fusarium [email protected] ×10-6
,

International Journal of Scientific Research in Science and Technology (www.ijsrst.com)
31
cell mL−1, F. [email protected] ×10
-6 cell mL
−1and
Aspergillus niger@ 1.8 ×10⁻⁶
cell mL−1, and solvent
extract of Cleistanthus collinus prepared in petroleum
ether@10%, were applied on the infected tree. The
observations on the reduction of frass made by I.
quadrinotata were recorded 3 7 10 and 15 DAT in both
the trials. The effects of various treatments on bark
eating caterpillar were determined using ANOVA and
treatment means were separated using the LSD test.
III. RESULT AND DISCUSSION
1. Results
Effect of commercial biopesticides and plant extract
on frass reduction
The efficacy of fungal suspension, commercial bio-
pesticides and plant extract was studied and all the
treatment shows significant frass reduction of I.
quadrinotata in compared to control plot (p<0.05)
(Table 1). There was a lower production of frass where
neem extract was applied and in contrast, the frass
formation progressed a little more in other treatments.
The pooled mean data revealed that neem extract @10%
was found significantly effective, followed by Bacillus
thuringiensis @25g L−1 in reduction of frass 15 DAT.
The Larvae treated with fungal suspension of Fusarium
oxysporum and Beauveria bassiana also shows frass
reduction to a satisfactory percentage over control at 15
DAT.
Table 1. Effect of bio-pesticides and plant extract in frass
reduction (%)
Treatment Dose Frass reduction
(%)*
F. oxysporum
1.7x10⁻⁷
cell mL−1
60.83
B. bassiana 25g L−1 68.52
B. thuringiensis 25g L−1 70.27
Neem Extract 10% 79.5
Control 0.00
SEm ±
CD at 5%
3.0201
6.5802
*mean of three replications
Effect of entomopathogens and plant extract on frass
reduction
The pathogens isolated from the infected larvae were bio
assayed for entomo-pathogenic activity against I.
quadrinotata and were found effective in frass reduction.
The assessment of the efficacy of three isolates and
solvent petroleum ether plant extract shows significant
variations from the control treatment (Table 2).
Table 2. Entomopathogenic activity of isolated pathogen
in frass reduction (%) 15 DAT
Treatment Dose Frass reduction
(%)*
F. oxysporum
1.6 ×10⁻⁶
cell mL−1
55.55
F. moniliformae
1.5 x 10⁻⁶
cell mL−1
60.73
A. niger 1.8 ×10⁻⁶
cell mL−1
51.48
C. collinus 10% 55.1
Control 0.00
SEm ±
CD at 5%
7.6727
17.693
*mean of three replications
Figure1: Comparison of various treatments in frass
reduction (%) of larvae, 15 DAT. Values expressed as
mean SEm± over control
Among all the treatments Fusarium moniliformae @ 1.5
× 10-6
cell mL−1 shows maximum frass reduction. The
suspension of the fungal isolates and petroleum ether
extract of Cleistanthus collinus shows remarkable
differences due to effects of mycoses in the frass of the
larvae. The fungal suspension F. oxysporum @ 1.6 ×10⁻⁶

International Journal of Scientific Research in Science and Technology (www.ijsrst.com)
32
cell mL−1 and Cleistanthus collinus extract were found
at par with each other in minimizing frass formation by
the larvae 15 DAT. The comparative study of all the
treatments reveals that neem extract was found to be
significantly superior among all the treatments in frass
reduction of I. quadrinotata larvae (Figure 1).
2. Discussion
The use of bio-control agents and plant extracts in pest
management in fruit trees was found significant. The
present study reveals that neem extract was found
significantly superior among all the treatments in frass
reduction of the larvae. Sundararaj (2014) advocated the
use of maximum quantity of neem based products as an
integral component for pest management due to its
feasibility. Kurosawa et al (2012) reported that emulsion
form of nano organic pesticide prepared from
Azadiractin A, B and Limonoids in combination with
Earthen Pot Irrigation System (EPIS) resulted 50-90%
reduction in apical twig, gall maker, leaf roller, bark and
shoot borer and termites in Indian gooseberry in arid
areas. Satti et al (2013) observed that botanical treatment
of Neem and Argel at ten days interval has potentiality
in controlling green leaf caterpillar (Noorda blitealis
Walker), in drumstick tree (Moringa oleifera Lam.). The
application of biocontrol agents in combination with
biofertilizers for Fusarium wilt of Delbergia sissoo
(Singh et al., 2002) and with organic manure against
Fusarium wilt of Gmelina arborea (Singh et al 2003)
was reported to be effective, which support the present
work. Tounsi et al (2005) reported that the wild strain
of B. thuringiensis, kurstaki individually as compared to
toxin mixtures, have more effective biopesticidal action
against the Mediterranean flour moth, Ephestia
kuehniella. Mohan et al (2014) determined toxicity of
Bacillus thuringiensis (Bt) kurstaki against important
lepidopterous insect pests of agricultural importance.
Similarly, the effectiveness of the entomopathogenic
fungi Beauveria bassiana has been reported against the
larvae of Polyphylla fullo (Erler and Ozgur Ates, 2015),
cotton bollworm (Helicoverpa zea) (Lopez and Sword,
2015) Colorado potato beetle Leptinotarsa decemlineata
(Wraight and Ramos, 2015) and tobacco caterpillar
(Spodoptera litura) (Kaur et al 2011).
The efficacy of entomopathogenic fungi against bark
eating caterpillar was found to be encouraging. In the
present study the efficacy of Fusarium sps. and
Aspergillus sps. was less significant in frass reduction as
compared to plant extract and biocides which may be
due to their weak pathogenesis on diseased lepidopteran
forest pests as reported by Draganova et al (2013). The
entomopathogenic activity of the pathogens on various
other pests gave promising results. Abd El- Ghany et al
(2012) observed that crude extract of F. oxysporum was
found effective in controlling Greater wax moth
Galleria mellonella (49.48%). Similarly, the
entomopathogenic activity of F. oxysporum observed on
southern green stink bug (Nezara viridula) of rice shows
51.96% mortality (Dutta et al 2013). Under laboratory
conditions Aspergillus niger causes mortality of Red
spider mite, Oligonychus coffeae Nietner of tea up to
91.11% (Mazid et al 2015).
IV. CONCLUSION
The present research concludes that biological management
of bark eating caterpillar in Indian gooseberry trees, the
bio-pesticides appeared to be a promising candidate
however the fungal isolate were also effective and thus
needs a wide investigation. The Integrated pest
management using plant extract, bio-pesticides, entomo
pathogenic fungi is environmental friendly, feasible and
widely accepted. Future investigation in search of new
biological control methods with the integration of modern
scientific techniques can lead to develop ecofriendly pest
control model.
V. REFERENCES
[1] Abd El-Ghany, T.M., El-Sheikh, H.H., Abd El-Rahman,
G.A. and Abd El-Nasser, A.M. (2012) Biodiversity of
entomopathogenic fungi in new cultivated soil with their
using to control of Galleria mellonella. Int J Curr Res
Rev. 4(24), 17-31.
[2] AESA IPM PACKAGE, AESA based IPM – Amla.
(2014) DAC. Ministry of Agriculture, Government of
India. [http://farmer.gov.in/imagedefault/ipm/IPM
package for Amla]
[3] Bale, J., Van Lenteren, J. and Bigler, F. (2008)
Biological control and sustainable food production.
Philosophical Transactions of the Royal Society B.
Biological Sciences. 363(1492), 761-776.
[4] Ballal,, C.R., Verghese, A. (2015) Biological Control – The
best organic alternative to insecticides. 4th
Congress on
Insect Science “Entomology for [1] Sustainable

International Journal of Scientific Research in Science and Technology (www.ijsrst.com)
33
Agriculture” Department of Entomology, Punjab
Agricultural University, Ludhiana. 16th-17th April.
[5] Bharpoda, T.M., Koshiya, D.J. and Korat, D.M. (2009)
Seasonal occurrence of insect-pests on aonla (Emblica
officinalis Geartn) and their natural enemies. Karnataka
J. Agric. Sci. 22(2), 314-318.
[6] Booth C. (1971) The genus Fusarium. Commenwealth
mycological institute, Kew, Surrey, England.
[7] CROPSAP. (2013) Pests of Fruits (Banana, Mango and
Pomegranate) „E‟ Pest Surveillance and Pest
Management Advisory (ed. D.B. Ahuja), NCIPM, New
Delhi-SDHCA, Pune.
[8] Gupta, D., Naram, S. and Bhatia, R.S. (2014) Incidence,
intensity and management of bark eating caterpillar,
Indarbela sp. infesting fruit trees in Himachal Pradesh,
India. Pest Management Hort. Eco. 20(1), 1-7.
[9] Draganova, S., Takov, D., Pilarska, D., Doychev, D.,
Mirchev, P. and Georgiev, G. (2013) Fungal Pathogens
on Some Lepidopteran Forest Pests in Bulgaria, Acta
zool. bulg. 65 (2), 179-186.
[10] Dutta, P., Pegu, J. and Pujari, K.C. (2013) Current status
and future prospects of entomopathogenic fungi in North
East India. KAVAKA. 41, 75-86.
[11] Ellis, M.B. (1971) The genus Fusarium. Commonwealth
agriculture bureau, Farnham Royal bucks, England.
[12] Erler, F. and Ozgur Ates, A. (2015) Potential of two
entomopathogenic fungi, Beauveria bassiana
and Metarhizium anisopliae (Coleoptera: Scarabaeidae),
as biological control agents against the June beetle. J
insect sc. 15(1).
[13] Food and Agriculture Organization (2016) www.fao.org
[14] Fravel, D.R. (2005) Commercialization and
Implementation of Biocontrol. Annual Review of
Phytopathology. 2005; 43: 337-359.
[15] George, M. (1997) Management of the bark caterpillar
Indarbela Quadrinotata in forest plantations of
Paraserianthes Falcataria, Research Report 122, Kerala
Forest Research Institute Peechi, Thrissur. p. 1-24.
[16] Food and Agriculture Organization (2009) Global
Review of forests pests and diseases, FAO.
[17] Groove, W.B. (1967) British stem and leaf fungi
(Coelomycetes). Cambridge University Press.
[18] Kaur, S., Kaur, H.P., Kaur, K.. Kaur, A. (2011) Effect of
different concentrations of Beauveria bassiana on
development and reproductive potential of Spodoptera
litura (Fabricius), J Biopest. 4(2), 161-168.
[19] Khan, S., Guo, L., Maimaiti, Y., Mijit, M., Qiu, D.
(2012) Entomopathogenic Fungi as Microbial Biocontrol
Agent. Mol. Plant Breed.. 3(7), 63-79.
[20] Kurosawa, K., Sinha, S., Kumar, S. and Kojima, T.
(2012) Application of Nanotechnology in Earthen Pot
System for Arid Area Afforestation, J Ecotech Res.
16(3-4), 103- 108.
[21] Lopez, D.C. and Sword, G.A. (2015) The endophytic
fungal entomopathogens Beauveria bassiana and
Purpureocillium lilacinum enhance the growth of
cultivated cotton (Gossypium hirsutum) and negatively
affect survival of the cotton bollworm (Helicoverpa zea).
Biological Control. 89, 53-60.
[22] Mazid, S., Rajkhowa, R.C. and Kalita, J.C. (2015)
Pathogenicity of Aspergillus Niger and Aspergillus
flavus on red spider mite (Oligonychus coffeae Nietner),
a serious pest of tea. Journal of Entomology and Zoology
Studies. 3(3),11-13.
[23] Mohan, M., Rangeshwaran, R., Sivakumar, G. and
Verghese, A. (2014) Relative Toxicity of Subspecies
of Bacillus thuringiensis against Lepidopterous Insect
Pests of Agricultural Importance. Journal of Biological
Control. 28(4), 197-203.
[24] Pathak, R.K. (2003) Status Report on Genetic Resources
of Indian Gooseberry-Aonla (Emblica officinalis
Gaertn.) in South and Southeast Asia, IPGRI, NASC,
New Delhi.
[25] Sasidharan, K.R., Varma, R.V and Sivaram, M. (2010)
Impact of Indarbela quadrinotata on the Growth of
Casuarina equisetifol1a. Indian Forester. S.l, 182-186.
[26] Sasidharan, K.R. and Varma, R.V. (2008) Seasonal
population variations of the bark eating caterpillar
(Indarbela quadrinotata) in Casuarina plantations of
Tamil Nadu. Tropical Ecology. 49(1), 79-83.
[27] Satti, A.A., Nasr O. El-Hag., Fadelmula, A. and Ali, F.E.
(2013) New record and preliminary bio-ecological
studies of the leaf caterpillar, Noorda blitealis Walker
(Lepidoptera: Pyralidae) in Sudan. I.J.S.N. 4(1), 57-62.
[28] Sundararaj, R. (2014) Relevance of Botanicals for the
Management of Forest Insect Pests of India; in Basic
and Applied Aspects of Biopesticides, Springer India,
New Delhi. pp. 155-179. ISBN 978-81-322-1877-7.
[29] Sutton, B.C. (1980) The Coelomycetes, Fungi Imperfect
with Pycnidia, Acervuli and stromata. CAB International
mycological Institute, Kew, England.
[30] Teetor-Barsch, G.H. and Roberts, D.W. (1983)
Entomogenous Fusarium species, Mycopathologia.
84(1), 3-16.
[31] Tounsi, S., Dammak, M., Rebai, A., Jaoua, S. (2005)
Response of larval Ephestia kuehniella (Lepidoptera:
Pyralidae) to individual Bacillus thuringiensis kurstaki
toxins and toxin mixtures. Biological Control. 35 (1), 27-
31.
[32] Wraight, S.P. and Ramos, M.E. (2015) Delayed efficacy
of Beauveria bassiana foliar spray applications against
Colorado potato beetle: Impacts of number and timing of
applications on larval and next-generation adult
populations. Biological Control, 83, 53-60.

IJSRST16249 | Received: 11 July 2016 | Accepted: 15 July 2016 | July-August 2016 [(2)4: 34-36]
© 2016 IJSRST | Volume 2 | Issue 4 | Print ISSN: 2395-6011 | Online ISSN: 2395-602X Themed Section: Science and Technology
34
Correlation of Knowledge and Metabolic Syndrome in Container Crane Operator
Lestari Sri Pusparini*1
, Denny Ardyanto W. 2, Hari Basuki Notobroto
3
11
st Class of Port Health and Quarantine Office, Surabaya, Indonesia
2Department of Occupational Health and Safety, Airlangga University, Indonesia 3Department of Bio Statistic and Demography, Airlangga University, Indonesia
ABSTRACT
This study aimed to know the correlation between knowledge and incident of metabolic syndrome in container crane
operators. The design of the study was observational method and conducted by cross sectional approach in an
international container terminal facilities company in Surabaya. The independent variable was knowledge of
metabolic syndrome using questionnaires method. The dependent variable was metabolic syndrome using
International Diabetes Federation criteria. The number of population was 68 container crane operators and 40
operators as the samples were taken randomly. The results showed that knowledge did not have significant
correlation with metabolic syndrome incident. Considering the study’s result, the company needs to find other cause
of the metabolic syndrome in their container crane operator population and find effective health promotion in
metabolic syndrome prevention.
Keywords: Knowledge, Metabolic Syndrome, Crane Operator.
I. INTRODUCTION
Cardiovascular disease, diabetes mellitus and stroke are
degenerative diseases that allegedly afflict more and
more workers in the world. These diseases can cost the
company's health and reduce the quality of life of the
workers. The diseases may also be an underlying factor
cause of workers unsafe action. Unsafe actions may lead
to work accidents.
Metabolic syndrome is a collection of symptoms that
consist of glucose intolerance, insulin resistance, central
obesity, dyslipidemia, and hypertension which can be a
risk factor for cardiovascular disease and diabetes
mellitus [1, 2]. Researchers believe that low physical
activity and unhealthy lifestyles are related to metabolic
syndrome in workers. To increase crane operator
awareness in low physical activity and unhealthy
lifestyles effects, the company held seminar about
metabolic syndrome in 2015.
Health seminar in health promotion has important role in
the company’s occupational health and safety programs.
The purpose of seminar is to give knowledge about
metabolic syndrome. The knowledge is expected to
change worker health‘s behavior. A container crane
operator must have good condition of health including
sufficient physical strength, endurance, agility,
coordination, and reaction speed to meet the demands of
working as a container crane operator.
II. METHODS AND MATERIAL
This study aimed to know the correlation between
knowledge and incident of metabolic syndrome in
container crane operators. This study was designed as an
observational study and conducted by cross sectional
method. Forty container crane operators as respondents
were obtained by using simple random sampling
technique. The dependent variable in this study was
metabolic syndrome using International Diabetes
Federation criteria, while the independent variable was
worker’s knowledge about metabolic syndrome. This

International Journal of Scientific Research in Science and Technology (www.ijsrst.com)
35
study data get through questionnaires and direct
measurements of blood pressure, waist circumference,
fasting triglyceride (TG), high density lipoprotein (HDL)
and blood glucose. The ethics committee for Research
Project in Airlangga University, Surabaya, Indonesia
approved the study. The study was held in an
international company that provides container terminal
facilities in Surabaya, Indonesia.
Validity and Reliability
The questionnaires instrument was validated by 13
operators excluded from the respondents. Cronbach's
Alpha reliability method was adopted to determine the
internal consistency of the instrument. A reliability
coefficient of 0.91 was obtained.
III. RESULT AND DISCUSSION
Knowledge of metabolic syndrome data obtained by
calculating the total score of the correct answers. Each
correct answer is worth 1 score. Table 1 show that the
average score of container crane operator knowledge
was 8.03. The lowest score is 0 and the highest score of
13 out of 18 questions. Based on the calculation of 95%
Confidence Interval, the average metabolic syndrome
knowledge in the population of PT. X container crane
operator was 7 to 9 score.
Table 1. Distribution of Respondents Knowledge Score
Variable Mean Median Modus SD 95%
CI
Knowledge
Score
8,03 8 8 2.64 7.18-
8.87
For correlation analysis, knowledge variable was
transformed into categorical variable. As seen in Table 2,
the respondents knowledge score most frequents were
less than 9 point (23 men).
Table 2. Distribution of Categorical Data in Knowledge Score
Variable
Data Frequency Percentage
(%)
Knowledge
Score
≤8
>8
Total
23
17
40
57.5
42.5
100
Based on the examination results of the respondents
fasting TG, HDL, blood sugar, blood pressure and
abdominal circumference added with history of blood
pressure medications, history of treatment of cholesterol
as well as diabetes mellitus, the study found the number
of respondents who have metabolic syndrome according
IDF criteria as much as 40% or 16 of the total 40
respondents as seen in Fig 1.
Dyslipidaemia was the most frequent result came from
32 people or 82.5%, then the second rank was the
abdominal circumference (above 90 cm for Asian ethnic)
which was found in 30 people or 75% of total
respondents, followed hypertension and blood sugar
levels above normal (hyperglycaemia).
Figure 1. Percentage of Metabolic Syndrome Incidents
Correlation between knowledge score and metabolic
syndrome incident was analysed using Chi-square test
and α 0.05. Chi-square analysis was due to the non-
parametric data category. This analysis aims to examine
differences in the proportion of two or more groups of
samples [3, 4]. Knowledge of the metabolic syndrome
that ≤ 8 score had fewer metabolic syndrome
incidences than > 8 score as seen in Table.
16
40% 24
60%
Metabolic
Syndrome (Mets)
no Mets

International Journal of Scientific Research in Science and Technology (www.ijsrst.com)
36
Table 3. Correlation between Knowledge Score and
Metabolic Syndrome
Variable Mets N (%) p-
value
Correlation
Yes No
Knowledge Score
>8
≤ 8
10
(58.8%)
6
(26.1%)
7
(41.2%)
17
(73.9%)
17
(100%
23
(100%)
0.08 Not
Significant
Occupational health care in PT. X had health education
in metabolic syndrome theme which was attended by
representatives of employees in 2015. This study found
that many respondents could only answer questions less
than 9 questions. Percentage of metabolic syndrome in
operator who can answer ≤8 questions and > 8 question
was 26.1% and 58.8% and showed no significant
correlation.
Metabolic syndrome can be prevented with a workers
healthy behaviour. Benjamin Bloom theory, quoted by
Notoatmodjo [5] stated that health behaviour could be
shaped by knowledge along with an attitude, and
practice. Knowledge has 6 levels intensity, which are
knowing, understanding/comprehension, application,
analysis, synthesis, and evaluation. Data analysis
showed that the operator with a high score had greater
risk of metabolic syndrome. This result might be caused
the operator was on the knowing level and did not
understand also able to evaluate the hazards of the
metabolic syndrome.
Lawrence Green theory mentioned that health problems
caused by behavioural factors and non-behavioural
factors. Though with increasing one's knowledge did not
necessarily lead to behaviour change. Changes in
healthy behaviour required an enabling factor and
reinforcing factors [5]. According to Rowe, et al cited
by [6], enabling factors are health facilities availability,
availability of infrastructure to support the success of the
program. In this study, enabling factors could be
achieved by providing the sports infrastructure for
operators, health care and referrals system. Reinforcing
factors could be given through the figure of someone
who had influence in the company and provided
continuous monitoring of workers health.
Notoatmodjo also added that a person's health
behaviours related his socio-economic level, culture,
religion, education and experience [5]. Knowledge could
not associate with the occurrence of the metabolic
syndrome directly be caused of a lot of other factors
involved. Operators with knowledge score above 8
points might be at risk of metabolic syndrome due to
unsuccessful influence figure health workers in health
presentation class, the absence of supporting healthy
habits infrastructure, his culture, his socio-economic,
education and experience. Similarly, the operator that
had score knowledge under 8 points more likely to have
metabolic syndrome risk factors from the opposite of the
previous explanation.
IV. CONCLUSION
There is no significant correlation between knowledge
and metabolic syndrome incident. The company owner
must find the cause of metabolic syndrome incident
among workers and the worker themselves should aware
of the importance having healthy behaviour and
prevention of metabolic syndrome.
V. REFERENCES
[1] Sir George Alberti, et al, 2006. The IDF
Consensus Worldwide Definition of the Metabolic
Syndrome. Brussel, Belgium: International
Diabetes Federation
[2] Julian, H., Arshed, A. Q., (2005). Metabolic
Syndrome: Overview and Current Guidelines.
Cardiology, Volume 11. pp: 1-12
[3] Sujarweni, V. W., (2015). Statistik Untuk
Kesehatan. Yogyakarta. Penerbit Gava Media.
[4] Hastono, S. P., (2011). Basic Data Analysis for
Health Research Training : Analisa Data
Kesehatan. Fakultas Kesehatan Masyarakat
Universitas Indonesia.
[5] Notoatmodjo, S. (2010). Promosi Kesehatan :
Teori dan Aplikasi. Jakarta : PT. Rineka Cipta
[6] Kurniawidjaja, L.M. (2012). Teori dan Aplikasi
Kesehatan Kerja. Penerbit Universitas Indonesia.
Jakarta

IJSRST162413 | Received : 11 July 2016 | Accepted : 15 July 2016 | July-August 2016 [(2)4: 37-42]
© 2016 IJSRST | Volume 2 | Issue 4 | Print ISSN: 2395-6011 | Online ISSN: 2395-602X Themed Section: Science and Technology
37
Lane Detection for Departure using Hough Transform for
Driving System
Ankaram S. N., Prof. Rahane S. B.
Electronics Engineering Department, Amrutvahini College of Engineering, Sangamner, Maharashtra, India
ABSTRACT
The Hough transform is technique of feature extraction used for analysis of images, computer vision, and digital
image processing. The purpose of the technique is to find imperfect instances of objects within a certain class of
shapes by a voting procedure. This voting procedure is carried out in a parameter space, from which object
candidates are obtained as local maxima in a so-called accumulator space that is explicitly constructed by the
algorithm for computing the Hough transform.
A Hough Transform Based Lane Detection for Driving System has been developed to aid a driver in the lane
departure decision-making, to reduce a loss of concentration and to prevent an accident while driving. In this paper,
we propose a method for detecting the lanes by using a webcam camera to record the road as a video file (.avi) and
using Hough Transform method to detect the lanes in an image. The results show the lane detection in various line
road conditions. According to the results, the drivers can use this information to increase their safety of driving,
especially when making the decision of lane changing.
Keywords: Computer Vision, Voting Procedure, Hough Transform, Driver Assistance Systems, Standard Hough
Transform
I. INTRODUCTION
Vision based street lane detection and tracking is an
important process for Driver Assistance Systems, which
can reduce the risk of car accidents. Various lane
detection and tracking methods have been proposed but
situations like strongly differing illuminations, and
unmarked or partly marked lanes are still challenging.
Now a days, the growing volume of the traffic all around
the world requires higher levels of the traffic safety on
the road. There are so many unsafe driving cars that the
driver required to be highly careful while driving.
Important for driver is being careful when he/she is
changing lane, especially in new driver who absolutely
cannot keep too much information at once and has no
confidence for driving. Driver may lose concentration
and control over car. In fact, human behaviors are
indeed hard to recognize, predict and handle by current
available equipments. Therefore, a monitoring and
warning system focusing on behaviors of the vehicle is
needed while the car is moving on the road. A Hough
Transform Based Lane Detection for Driving System
was developed to find the way that can reduce the loss
of views to the frontstreet.
The Hough Transform, one of the easy techniques for
image processing, used for detecting road lanes within
the image. This system is designed to work in
conjunction with the general principles of the webcam
image processing. The system helps the driver by
keeping track of movements of a vehicle through the
lanes. The System proposed in this paper is
comprehensive system which uses road information
collected using camera. Firstly, the acquired video file is
extracted to image frames. Secondly, the image frames
are specifically divided into road part from the
information of webcam camera. Thirdly, RGB color
image is converted by image enhancement to grayscale
image. Threshold is applied to evaluate the grayscale
image into a binary image. Fourthly, the Hough

International Journal of Scientific Research in Science and Technology (www.ijsrst.com)
38
transform method is applied to detect the lanes in the
road image and finally, lane departure is predicted from
obtain Hough Line Pattern. The concept in this paper
proposes complete system to monitor the position of a
vehicle with respect to road lanes for improved driving
safety.
II. METHODS AND MATERIAL
Frame Differencing
Frame Differencing is an easiest simple method for
finding objects which got subtracted from one frame to
another, in which all the different objects of interest
called foreground responsible for this process to be
applied to detect moving objects. In this method, the
algorithms cannot be used because the frame
differencing were not able to detect the object when it is
stationary, even it intrude along the defensive line at that
time.
Image Processing
Digital Image Processing converts image data into
digital data. The system receives image data, calculates
output digital image data and then store image data into
the computer's memory that can be performed by
reservation memory of the machine in the form of an
array. The value in each array represents the quantity of
pixel. The position of the image is determined by the
position of the array.
Principle for splitting video into image
Video file is a computer file that contains digitized video.
The video which has high motion will be having the
high numbers of frames per second (frame rate). Video
files can be split into frame, used for process the image
and stored in a three dimensional array.
Cropping an image
Crop tool is used to extract road part within an image by
using the ‘imcrop’ function that can specify the size and
position as parameters by specifying the crop rectangle
as a four-element position vector.
(A) Original Image
(B) Road Part Image
Figure 1. The result of cropping road part image.
Image Enhancement
This process changes the color image (RGB) toa
grayscale image. Its analysis detects objects in theimage
frames into the process. If using the color imagein the
work, the process will be slow because theprocess must
access all of the chromaticity. Therefore,it would be
easier to access the grayscale image.
Morphological Operations
Morphological operations affect the form, structure or
shape of an object in an image. These operations
areperformed on binary images and used in pre or post
processing. For this paper, Morphological operations
assist segmentation. They are used to cleanup the image
including clear border objects, remove small objects and
also reduce noises in the image.
Hough Transform
The Hough transform is a popular technique which can
be used to isolate features of a particular shape within an
image. In this work, it is used for detecting line road as
lane detection. There are 2 methods for computing the
Standard Hough transform(SHT) of the binary image
BW, which is an algorithm of parameter matrix whose
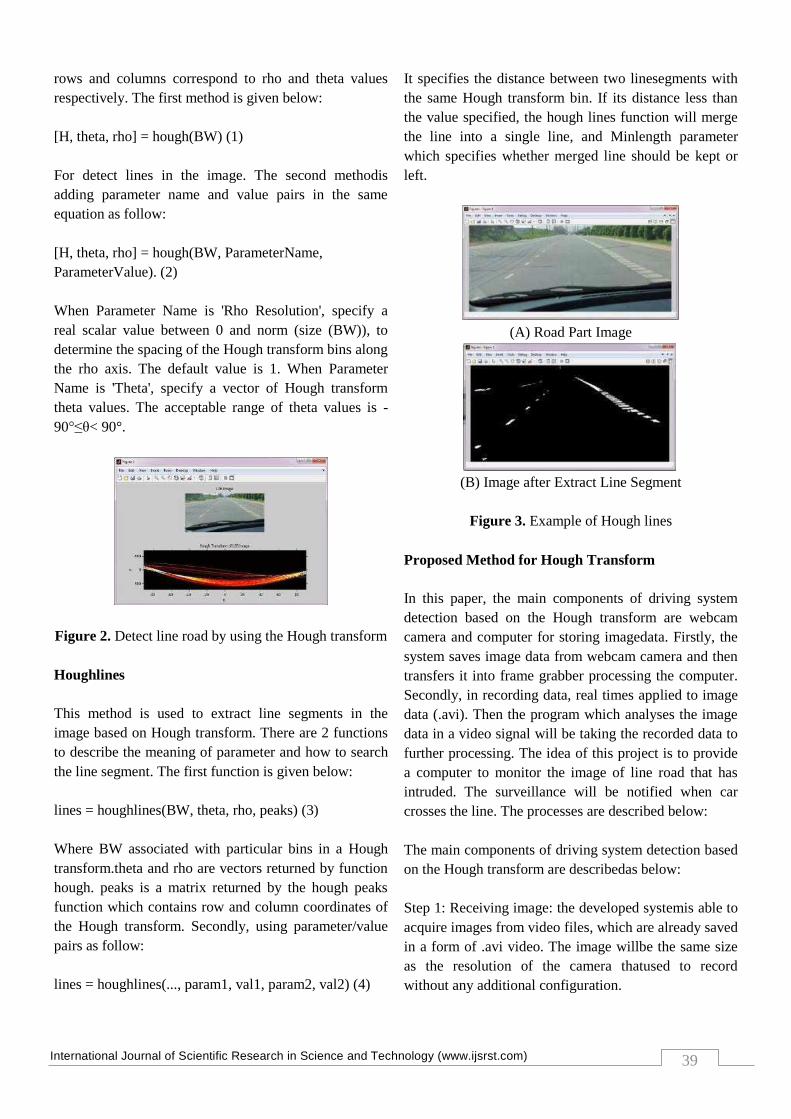
International Journal of Scientific Research in Science and Technology (www.ijsrst.com)
39
rows and columns correspond to rho and theta values
respectively. The first method is given below:
[H, theta, rho] = hough(BW) (1)
For detect lines in the image. The second methodis
adding parameter name and value pairs in the same
equation as follow:
[H, theta, rho] = hough(BW, ParameterName,
ParameterValue). (2)
When Parameter Name is 'Rho Resolution', specify a
real scalar value between 0 and norm (size (BW)), to
determine the spacing of the Hough transform bins along
the rho axis. The default value is 1. When Parameter
Name is 'Theta', specify a vector of Hough transform
theta values. The acceptable range of theta values is -
90°≤θ< 90°.
Figure 2. Detect line road by using the Hough transform
Houghlines
This method is used to extract line segments in the
image based on Hough transform. There are 2 functions
to describe the meaning of parameter and how to search
the line segment. The first function is given below:
lines = houghlines(BW, theta, rho, peaks) (3)
Where BW associated with particular bins in a Hough
transform.theta and rho are vectors returned by function
hough. peaks is a matrix returned by the hough peaks
function which contains row and column coordinates of
the Hough transform. Secondly, using parameter/value
pairs as follow:
lines = houghlines(..., param1, val1, param2, val2) (4)
It specifies the distance between two linesegments with
the same Hough transform bin. If its distance less than
the value specified, the hough lines function will merge
the line into a single line, and Minlength parameter
which specifies whether merged line should be kept or
left.
(A) Road Part Image
(B) Image after Extract Line Segment
Figure 3. Example of Hough lines
Proposed Method for Hough Transform
In this paper, the main components of driving system
detection based on the Hough transform are webcam
camera and computer for storing imagedata. Firstly, the
system saves image data from webcam camera and then
transfers it into frame grabber processing the computer.
Secondly, in recording data, real times applied to image
data (.avi). Then the program which analyses the image
data in a video signal will be taking the recorded data to
further processing. The idea of this project is to provide
a computer to monitor the image of line road that has
intruded. The surveillance will be notified when car
crosses the line. The processes are described below:
The main components of driving system detection based
on the Hough transform are describedas below:
Step 1: Receiving image: the developed systemis able to
acquire images from video files, which are already saved
in a form of .avi video. The image willbe the same size
as the resolution of the camera thatused to record
without any additional configuration.

International Journal of Scientific Research in Science and Technology (www.ijsrst.com)
40
Step 2: Splitting image: The system analyzes the video
file to apply to the video frames splitting process by
applying the data of video files and then the system
specifies the variable to divide sub frames in the variable
of array image to the frame.
Figure 4. Frame work of driving system detection based
on the Hough transform.
Step 3: Cropping image: Specifying the area of interest
by using crop tool to extract the region of road part
within the image. It can specify the size and position as
parameters by specifying the crop rectangleas a four-
element position vector.
Step 4: Image enhancement (from RGB colorto
grayscale image): In this process, the system conducts
the frame, which stored in the storage module, to
convert RGB color image into grayscale image. After
this process, we have the grayscale image. As shown in
Fig 5.
(a) Road part image
(b) Grayscale image
Figure 5. The results of image enhancement from
converting RGB color image (road part) to grayscale
image.
Step 5: Converting grayscale image to binary image:
Threshold is an appropriate method that uses to convert
the grayscale image to binary.
Step 6: Segmenting and removing objects: Using the
opening operation, Morphological Operations which can
assist segmentation and remove objects which are not
structuring element. As shown in Fig 6.
(a) (b) (c)
Figure 6. The image received by Morphological
Operations, (a)is cleaned image, (b) is image with clear
border bjects and(c) is all remaining connected regions.
It was showed bycolor.
Step 7: Defining the analytic area within theimage: The
system conducts the binary image to define detection or
surveillance area within the image by using the Hough
transform which can identify straight line. We set green
color to detect line and red color to detect the longest
line segment as shown in Fig 7.

International Journal of Scientific Research in Science and Technology (www.ijsrst.com)
41
(a) red color (b) green color
Figure 7. The results of final detected lines
Step 8: Computing Hough transform: From step7, the
system operates the defined segment to analyze the
Hough transform. The original image is determined by
Hough function. After computing, we get the Hough
transform in red color to show the line parameters of its
algorithm in the image.
III. RESULT AND DISCUSSION
A Hough Transform Based Lane Detection for Driving
System has been operated by setting the webcam camera
to monitor the movement of vehicle through the lanes,
segmenting the video file to the image, converting RGB
color image to grayscale, setting threshold to make a
binary image, using Morphological Operations and
defining the analytic areas by using Hough transform. In
this section we will explore the experimental results of
the performance of the lane detection algorithm in
various environments and describe its algorithm based
on its process. We test the lane detection while driving
along the lanes which have 2 types of lanes; dashed line
and solid line. It also has 2 colors; white and yellow lane
color. We proposed test conditions as follows:
Figure 8. Lane detection results by Hough transform
This test condition shows the detected lane boundaries
which are highlighted by green color. The longest
detected lane boundaries are highlighted in redcolor.
From the experimental results, this algorithmcan detect
any kind of lanes with various test conditions.
This test condition shows the red line parameters in
Hough transforms. We show the original image in 2
Situations; intruded lane and not intruded lane.

International Journal of Scientific Research in Science and Technology (www.ijsrst.com)
42
IV. CONCLUSION
In this paper, we proposed a method for helping the
drivers in the lane departure decision-making based on
the Hough transform by detecting lanes. The adopted
lane detection method was consisted of image
processing, morphological operations, dynamic
threshold, Hough lines and Hough transform. Its
advantages of Hough transform are easy to use, lowcost
and also effective in detect lines form the image.
Experimental results reveal the efficiency of the
performance of the lane detection algorithm in various
environments. In further research, we will focus on how
to detect the lane correctly in various situations, and how
to arouse driver’s attention by setting the sensor in a car.
V. REFERENCES
[1] K. Gabor, B. József, P. László, G. László, S. Ákos
and S. Péter, "Lane-Departure Detection and
Control System for Commercial Vehicles,"IEEE
International Conference on Intelligent Vehicles,
pp. 46-50, 1998.
[2] P. Thitapa and K. Mahasak, "A Lane Detection for
the Driving System Based on the Histogram
Shapes,"International Conference on Systems and
Electronic Engineering (ICSEE’2012), Phuket,
vol. , pp.43-47, December 18-19, 2012.
[3] C. Tang-Hsien, L. Chun-hung, H. Chih-sheng and
W. Yao-jan, "A Vision-Based Vehicle Behavior
Monitoring and Warning System", IEEE, pp. 443-
448, 2003.
[4] W. Bing-Fei, C. Chao-Jung, H. Yi-Pin and C.
Ming-Wei, "A DSP-Based Lane Departure
Warning System,"Proc. of the 8th WSEAS Int.
Conf. on Mathematical Methods and
Computational Techniques in Electrical
Engineering, Bucharest, October 16-17, pp. 240-
245, 2006.
[5] Z. Yong, X. Rong, Xiao-Feng Hu, and Qing-Tai
Ye, "A Lane Departure Warning System Based on
Virtual Lane Boundary,", Journal of Information
Science and Engineering vol. 24, pp. 293-305,
2008.
[6] Information on http://www.mathworks.com

IJSRST162385 | Received: 19 June 2016 | Accepted: 15 July 2016 | July-August-2016 [(2)4: 43-48]
© 2016 IJSRST | Volume 2 | Issue 4 | Print ISSN: 2395-6011 | Online ISSN: 2395-602X Themed Section: Science and Technology
43
Specific Activity and Production Yield of Neutron Induced Cross Section Reactions for Hafnium Isotopes at 14.5MeV
Iman Tarik AL-Alawy*, Firas Hashem Ahmed
Physics Department, AL-Mustansiriyah University, College of Science, Baghdad, Iraq
ABSTRACT
Specific activity and total production yield at the end of irradiation (EOI) (i.e. Saturation) have been calculated.
Projected production yields from irradiation of Hafnium target element induced (as a function of irradiation time) by
14.5MeV neutron at 1x10⁹ neutron/cm
2.s neutron flux. Different irradiation time have been selected for the periods
(1, 60, 3600, 86400, 172800 s) showing the saturation state for each reaction. The analyzing of a complete energy
range has been done starting from threshold energy for each reaction. The cross sections are reproduced in fine steps
of incident neutron energy with 0.01MeV intervals with their corresponding errors. The recommended cross
sections for available experimental data taken from EXFOR library have been calculated for all the considered
neutron induced reactions for Hf (Z=72; A=176-180) isotopes. The calculated results are analyzed and compared
with the experimental data.
Keywords: EXFOR, Incident Neutron, 14MeV, Recommended Cross Section, Specific Activity.
I. INTRODUCTION
The excitation functions in (n,2n), (n,α), and (n,p)
reactions measured for Hf (Z=72, A=176-180) with the
aid of EXFOR library have been evaluated in the present
work for the exact estimation of the cross sections
among different authors. This paper describes Specific
Activity, Production Yield and Neutron Induced Cross
Section Reactions for Hafnium Isotopes at 14.5MeV
neutron energy. The systematic of such reactions,
neutron induced reactions was discussed in Smith D.L.
et al. (1989) [1], Van D. N. et al. (2008) [2], Noguere G.
et al. (2009) [3] and Junhua L. et al. (2011) [4]. The
present work concerns the induced neutron cross section
reactions. Recommended formulas for the evaluation of
cross sections for these reactions were derived using
EXFOR experimental data for different authors
describing the emission or neutron capture in nuclear
reactions. The parameters of formulas were fitted with
minimum chi squared from the analysis of available
experimental data.
Radioisotopes are produced in a nuclear reactor by
neutron induced reaction from different neutron sources
(nuclear reactor, neutron generator) by exposing
appropriate target material to the neutrons in the reactor,
causing a nuclear reaction to occur which leads to the
production of desired radioisotope. The factors which
decide the type of nuclear reaction that takes place and
the rate of production are [5]:
1. The energy of the neutrons and the neutron flux.
2. The characteristics and quantity of the target
material.
a. Substances which are explosive, pyrophoric, and
volatile, etc. are not permitted to beirradiated in
neutron sources.
b. Targets should be stable under irradiation conditions.
c. Isotopically pure target gives high specific activity
radioisotopes.
d. The physical form of the target should be such that
the neutron flux depression is minimum.
e. The target should be in a suitable chemical form for
post irradiation processing.
f. Usually target in metallic form are preferred.
g. If the target is hygroscopic; it is preferable to
preheat the target prior to encapsulation.

International Journal of Scientific Research in Science and Technology (www.ijsrst.com)
44
M
amNN av
tot
3. The activation cross-section for the desired reaction.
The radioisotopes have numerous applications in
medicine, agriculture, industry and pure research.
II. METHODS AND MATERIAL
1. Recommended Cross Section
The available measured data from EXFOR library for
the cross section of the above mentioned reactions
measured for Hf (Z=72, A=176-180) have been plotted,
interpolated and recalculated in different fine steps and
for different energy ranges of incident neutron by using
Matlab-8.1 in order to calculate the recommended cross
section for each mentioned reaction. This can be
described in the following steps:
1. The interpolations for the nearest data for each
energy interval as a function of cross sections and
their corresponding errors have been done using
Matlab-8.1.
2. The sets of experimental cross sections data are
collected for different authors and with different
energy ranges. The cross sections with their
corresponding errors for each value are re-arranged
according to the energy interval 0.01MeV for
available different energy range for each author.
3. The normalization for the statistical distribution of
cross sections errors to the corresponding cross
section values for each author has been done.
4. The interpolated values are calculated to obtain the
recommended cross section which is based on the
weighted average calculation according to the
following expressions [6]:
(1)
Where the standard deviation error is:
(2)
Where σi : is the cross section value. Δ σi : is the
corresponding error for each cross section value.
Fig.s 1 to 3 illustrate the recommended cross sections for
the above mentioned reactions as calculated in the
present work compared with EXFOR library. It is clear
in the caption of each figure, the refry of authors name
are arranged according to the year of measured data are
listed with the present calculated recommended cross
section. The results are in good agreement with the
measured data.
2. Specific Activity And Production Yield of
Radioisotopes
The activity of a certain sample is the number of
radioactive disintegrations per sec for the sample as a
whole. The specific activity, on the other hand, is
defined as the number of disintegrations per sec per unit
weight or volume of sample. The unit of activity is the
Becquerel (Bq), which is defined as a decay rate of one
disintegration per second (dps). The fundamental
equation to calculate the activity produced in a target is
described by a first order differential equation [5,7]:
NNdt
dNacttot (3)
Where:
dt
dN: is the production rate per second.
N : is the number of activated atoms.
totN : is the total number of target atoms.
: is the neutron flux (number of neutrons per cm2per
second).
act : is the activation cross section (1barns=10-24
cm2)
refers to the production of the particular radioactive
species.
: Decay constant.
The activity of radionuclide formed at any time during
or at the end of irradiation is obtained by integration of
equation (3) [5,7].
)1( t
acttot eNNA (4)
Where:
(5)
N
i i
DS
12
1
1..

International Journal of Scientific Research in Science and Technology (www.ijsrst.com)
45
Therefore, the specific activity is:
M
eaNA
t
actav
actSP
)1(..
(6)
m : Mass of the target material in grams.
avN : Avogadro’s number (6.023×10²³
atom/mole).
a : Isotopic abundance of the target isotope.
M : Atomic mass of target material in atomic mass unit.
t : Time of irradiation in sec.
The nuclear reaction cross sections are of considerable
importance in optimizing the production process of a
radioisotope. In principle, the well-known activation
equation is applicable to all activation processes,
induced by neutron [8].
III. RESULT AND DISCUSSION
Nuclear reactions leading to radioisotope production
yield studied in this paper are:
1- (n, ) reaction
In the following cases: For (n, ) reactions, some of
them lead to a product with a certain half-life and
intensity which decays by beta emission to the isotope of
interest, as shown in Table I, the following details of
decay modes for (n,α) reactions are [9]:
(n,α) Reactions:
Decay Modes [9]:
105
175
702
4
21
1
0106
178
72 YbHenHf
107
177
702
4
21
1
0108
180
72 YbHenHf
2- (n,p) reaction
In some cases (n,p) reaction leads to a product with a
certain half-life and intensity which decays by gamma
emission to the isotope of interest as shown in Table I
for the following reactions:
(n,p) Reactions :
Decay Modes [9]:
107
178
710
1
11
1
0106
178
72 LuHnHf m
108
179
710
1
11
1
0107
179
72 LuHnHf
109
180
710
1
11
1
0108
180
72 LuHnHf
It is clear from Table I that (n,α) and (n,p) reactions for
each product are described by combining with gamma
emissions . The study of the systematic cross sections
for (n,2n) reaction which are listed in Table I gives
products with gamma emission decay mode.
Table I: Experimental (IAEA)[10] and calculated recommended cross sections at 14.5MeV with the activation product yields
of Hafnium target element at (1*109 n/cm
2.s) fast neutron flux, and the properties of their products.

International Journal of Scientific Research in Science and Technology (www.ijsrst.com)
46
Table I list the calculated specific activity and total
production yield at the end of irradiation (EOI) (i.e.
Saturation). The projected production yields from
irradiation of Hafnium target element induced (as a
function of irradiation time) by 14.5MeV neutron at
1x10⁹
neutron/cm2.s neutron flux values are shown in
Fig. (4). Different irradiation time have been selected for
the periods (1, 60, 3600, 86400, 172800 s) showing the
saturation state for each reaction.
Fig. (4) show that the growth of activity in a target under
irradiation increases exponentially and reaches a
saturation value limited by the neutron flux for a given
weight of the target element. The results show good
agreement in most of the reactions, but there is a
discrepancy for some reactions between the
experimental and calculated values, because there are
differences in the type of the detector used, experimental
technique, and the cross sections even if the cross
section value of a certain author is in a good agreement
with the experimental value.
13.4 13.6 13.8 14 14.2 14.4 14.6 14.8 150.2
0.25
0.3
0.35
0.4
0.45
0.5
0.55
0.6
0.65
ENERGY OF INCIDENT NEUTRON (MeV)
CR
OS
S S
EC
TIO
N (
mb
)
data1
data2
72Hf178(n,p)71Lu178 EXFOR
recommended value
13 13.5 14 14.5 1512
14
16
18
20
22
24
26
ENERGY OF INCIDENT NEUTRON (MeV)
CR
OS
S S
EC
TIO
N (
mb
)
data1
data2
recommended value
72Hf180(n,2n)72Hf179 EXFOR
Figure 2. Recommended cross section compared with EXFOR Library versus the energy of incident neutron. Left
side: for 72Hf178(n,p)72Hf179 reaction; Data 1: [17] Murahira S. et al.(1995). Data 2: present work (pw).Right
side: for 72Hf180(n,2n)72Hf179 reaction; Data in right side Data 1: [16] Konno C. et al.(1993). Data 2: present
work (pw).
8 10 12 14 16 18400
600
800
1000
1200
1400
1600
1800
2000
2200
ENERGY OF INCIDENT NEUTRON (MeV)
CR
OS
S S
EC
TIO
N (
mb
)
data1
data2
data3
data4
data5
72Hf176(n,2n)72Hf175 EXFOR
recommended value
13 13.5 14 14.5 151.5
2
2.5
3
3.5
4
ENERGY OF INCIDENT NEUTRON (MeV)
CR
OS
S S
EC
TIO
N (
mb
)
data1
data2
data3
72Hf178(n,alpha)70Yb175 EXFOR
recommended value
Figure 1. Recommended cross section compared with EXFOR Library versus the energy of incident neutron. Left
side: for the 72Hf176(n,2n)72Hf175 reaction; Data 1: [11] LuHanlin et al.(1999). Data 2: [12] Kiraly B. et
al.(2001). Data 3: [13] ZhuChuan-Xin et al.(2010). Data 4: [14] Serris M. et al.(2012).Data 5: present work (pw).
Right side: for 72Hf178(n,alpha)70Yb175 reaction; Data in right side: Data 1: [15] Konno C. et al.(1990). Data 2:
[16] Konno C. et al.(1993). Data 3: present work (pw).

International Journal of Scientific Research in Science and Technology (www.ijsrst.com)
47
0 0.5 1 1.5 2 2.5 3 3.5 4
x 107
0
0.05
0.1
0.15
0.2
0.25
0.3
0.35
0.4
Irradiation Time,sec
1B
q p
er 1
mic
rogram
of
target
14.5 MeV neutron specific activity(EXP.)
14.5 MeV neutron specific activity(pw)
Yield of Hf176(n,2n)Hf175
1 microgram Hf176 at 1*109 (n/cm
2 sec)
0 0.5 1 1.5 2 2.5 3
x 106
0
0.5
1
1.5
2
2.5
3x 10
-3
Irradiation Time,sec
1B
q p
er 1
mic
ro
gra
m o
f ta
rg
et
14.5 MeV neutron specific activity(EXP.)
14.5 MeV neutron specific activity(pw)
Yield of Hf178(n,alpha)Yb175
1 microgram Hf178 at 1*109 (n/cm
2 sec)
0 2 4 6 8 10
x 104
0
0.1
0.2
0.3
0.4
0.5
0.6
0.7
0.8
0.9
1x 10
-3
Irradiation Time,sec
1B
q p
er 1
mic
ro
gra
m o
f ta
rg
et
14.5 MeV neutron specific activity(EXP.)
14.5 MeV neutron specific activity(pw)
Yield of Hf178(n,p)Lu178m
1 microgram Hf178 at 1*109 (n/cm
2 sec)
0 500 1000 1500 2000 2500 3000 3500 40000
0.2
0.4
0.6
0.8
1
1.2
1.4
1.6
1.8
2
Irradiation Time,sec
1B
q p
er 1
mic
ro
gra
m o
f ta
rg
et
14.5 MeV neutron specific activity(EXP.)
14.5 MeV neutron specific activity(pw)
Yield of Hf180(n,2n)Hf179m1
1 microgram Hf180 at 1*109 (n/cm
2 sec)
0 0.5 1 1.5 2
x 106
0
0.5
1
1.5
2
2.5
3x 10
-3
Irradiation Time,sec
1B
q p
er 1
mic
ro
gra
m o
f ta
rg
et
14.5 MeV neutron specific activity(EXP.)
14.5 MeV neutron specific activity(pw)
Yield of Hf180(n,alpha)Yb177
1 microgram Hf180 at 1*109 (n/cm
2 sec)
Figure 4: Calculated and experimental [10]
activation for the production yields of 72Hf
Target elements by neutron irradiation of
targets as a function of irradiation time at 1x10⁹
(n/cm2.s) fast neutron flux with 1microgram of
target element.
14.4 14.5 14.6 14.7 14.8 14.9 150.9
0.91
0.92
0.93
0.94
0.95
0.96
0.97
0.98
ENERGY OF INCIDENT NEUTRON (MeV)
CR
OS
S S
EC
TIO
N (
mb
)
data1
data2
data3
recommended value
72Hf180(n,alpha)70Yb177 EXFOR

International Journal of Scientific Research in Science and Technology (www.ijsrst.com)
48
IV. CONCLUSION
We have evaluated the neutron induced nuclear cross
section data of spherical hafnium isotopes for
considerable energy ranges. The calculated
recommended cross sections are in good agreement with
experimental data. The reliability in this work is to
estimate the specific activity and production yield for the
energy E=14.5MeV for 72Hf (A=176-180) isotopes
target elements of neutron induced reactions. The results
confirm that the comparison of calculated and
experimental cross sections is especially important
because reaction calculations have to be used to estimate
important cross sections for applied purposes, which are
difficult to measure.
V. REFERENCES
[1] Smith D.L., Meadows J.W., Greenwood L.R., and Ikeda
Y., "A search for long-lived radionuclides produced by
fast-neutron irradiations of copper, silver, europium,
terbium, and hafnium", Historical Energy Database
(United States), U.S. Department of Energy
OSTI(1989).
[2] Van D. N., Duc K. P., Tien T. K., Truong S. L., Young
S.L., Guinyun K., Youngdo O., Hee S. L., Moo H. C., In
S. K., and Won N., "Measurement of thermal neutron
cross-sections and resonance integrals for
179Hf(n,γ)180mHf and 180Hf (n,γ)181Hf reactions at
the Pohang neutron facility", Journal Nuclear
Instruments and Methods in Physics Research Section B:
Beam Interactions with Materials and Atoms, Vol.266,
PP.21-29 (2008).
[3] Noguere G., Blaise P., Litaize O., Bernard D., and
Ruggieri J.M., "Group-average covariance matrices for
the hafnium isotopes of interest for light water reactor
applications", Journal Annals of Nuclear Energy, Vol.
36, PP.1059–1069 (2009).
[4] Junhua L., Fei T., and Xiangzhong K., "Cross-sections
for formation of 178m2Hf and 179m2Hf through
reactions on natural hafnium at neutron energy 14.8 ±
0.2 MeV", Journal Radioanal Nucl Chem, Vol.288,
PP.143–148 (2011).
[5] Sukadev Sahoo and Sonali Sahoo, "Production and
Application of Radioisotopes ", Physics Education, PP.
5-11 (2006).
[6] T.V. Varalakshmi, T.n. Suseela, T.G. Gnana Sundaram,
T.S. Ezhilarasi and Indrani T.B., "Statistics", Tamilnadu
Textbook Corporation, College Road, Chennai-600 006.
(2005) 98-100.
[7] Abbasi I.A., "Nuclear Reaction Cross Section
Measurement and Model Calculations for Some
Medically Important Radioisotopes", Ph.D. thesis,
Pakistan (2005).
[8] Qaim S.M., "Nuclear Data Relevant to the Production
and Application of Diagnostic Radionuclides",
Radiochim. Acta 89, PP. 223-232 (2001).
[9] Packer L.W. and Sublet J-Ch.," The European
Activation File: EAF-2010 decay data library",
European Activation system Documentation Series
CCFE-R (10) 02, EURATOM/CCFE Fusion
Association, Culham Science Centre, Abingdon,
Oxfordshire, OX14 3DB, UK(2010).
[10] Engelbrecht C.A. and Fiedeldey H., "Nonlocal potential
and the energy dependence of the optical model for
neutrons", Annals of Physics, Vol.2, Issue 2, PP.262-295
(1967).
[11] LuHanlin, ZhaoWenrong, YuWeixiang, HanXiaogang,
HuangXiaolong, and HanYinlu, "The cross sections of
176-Hf(n,2n)175-Hf and 185-Re(n,2n)184-Re-m,g
reactions", Atomic Energy Science and Technology,
Vol.33, Issue.5, P.410(1999).
[12] Kiraly B., Csikai J., and Doczi R., "Validation of
neutron data libraries by differential and integral cross
sections",JAERI Conference proceedings, Vol.006,
No.2001, P.283(2001).
[13] ZhuChuan-Xin, ZhengPu, GuoHai-Ping, MouYun-Feng,
HeTie, and YangJian, "Measurement of
176Hf(n,2n)175Hf cross section", Atomic Energy
Science and Technology, Vol.44, Issue.s, P.7(2010).
[14] Serris M., Diakaki M., Galanopoulos S., Kokkoris M.,
Lamprou M., Papadopoulos C.T., Vlastou R., Demetriou
P., Kalfas C.A., and Lagoyannis A., "Experimental and
theoretical study of the (n,2n) reaction on 174,176Hf
isotopes", Physical Review, Part C, Nuclear Physics,
Vol.86, P.034602(2012).
[15] Konno C., Ikeda Y., and Nakamura T., "Activation
Cross Section Measurements at Neutron Energy from
13.3MeV to 15.0MeV for 84-Sr, 113-In, 115-In, 178-
HF, 179-HF and 180-HF", Japanese report to NEANDC
No.155, P.15(1990).
[16] Konno C., Ikeda Y., Oishi K., Kawade K., Yamamoto
H., and Maekawa H., "Activation Cross section
measurements at neutron energy from 13.3 to 14.9
MeV", JAERI Reports No.1329(1993).
[17] Murahira S., Satoh Y., Honda N., Takahashi A., Iida T.,
Shibata M., Yamamoto H., and Kawade K.,
"Measurement of Formation Cross Sections Producing
Short-Lived Nuclei by 14 MeV Neutrons - Pr, Ba, Ce,
Sm, W, Sn, Hf", Japanese report to the I.N.D.C.
No.175/U, p.171(1995).

IJSRST162411 | Received : 09 July 2016 | Accepted : 18 July 2016 | July-August 2016 [(2)4: 49-57 ]
© 2016 IJSRST | Volume 2 | Issue 4 | Print ISSN: 2395-6011 | Online ISSN: 2395-602X Themed Section: Science and Technology
49
Steam-Microwave on Reduction of Microbial Level of Red
Pepper and Compared with Gamma Irradiation Pouya Sahraie, Toktam Mostaghim
*, Alireza Rahman
Department of Food Science and Technology, Shahr-e-Qods Branch, Islamic Azad University, Tehran, Iran
ABSTRACT
Red pepper is utilized as a single flavor or in combination with other spices. This spice contains capsaicin,
Carotenoid pigment and high Ascorbic acid level which have proper health and Anti-cancer effects on it. Normally
this product is replete with microbial load and pathogens prior to applying any decontamination methods that could
threaten human life. So creating a new approach for microbial decontamination of whole dry red pepper is
obligatory, which is applying steam and microwave together. Here, saturated steam and microwave heat is used for
10 minutes with 720 watts and for 90 seconds respectively, while microbial load, enzymatic activities, moisture
content and color alternation were monitored. Finally it was observed that processed red pepper contains the
minimal microbial load and lacks any enzymatic activities, even in comparison with applying gamma irradiation
with 5KGy in which enzyme activity was noticeably seen.
Keywords : Red pepper, Irradiation, Microbial load, Microwave, Capsaicin
I. INTRODUCTION
Red Pepper is planted all over the world and is used both
in fresh and dry forms. This product basically is used for
creation of desired red color along with a sharp taste, it
has been known that (Kim et al. 2014; Rico et al. 2010).
Red Pepper contains a significant amount of A and C
vitamins. Its active ingredient that describes the sharp
taste is known as capsaicin which has high impact on
reduction of body fat mass and cholesterol levels, it was
reported that (Song et al. 2014). Red Pepper production
has risen 21% since 1994 and plays an important role in
all kinds of food, dressings and seasonings, it was
reported that (Neetoo & Chen 2012). Red Pepper
contains large amounts of carotenoids and ascorbic acid
which has high anticancer effects, it was reported that
(CRC handbook of medicinal spices.). Before applying
any decontamination method, this useful material
contains lots of microbial loads along with huge
amounts of mold, yeast, and big varieties of bacterial
loads, it has been known that (Kim et al. 2014; Rico et al.
2010), and is considered as a contaminator and even
infectious substance in food materials, it was reported
that (Neetoo & Chen 2012). It specifically leads to
microbial spoilage such as Salmonella and E. Coli’s
activities in uncooked materials, thus this contamination
needs to be reduced to its lowest amount available , it
was reported that (Rico et al. 2010).
In Mexico’s market, 10 out of 27 samples of red pepper
are infected by Salmonella. Furthermore, US witnessed
one of the greatest epidemic spreads of Salmonella
caused by raw red pepper usage. Most such pathogenic
substances have their least activity in dry situations. On
the contrast they would have their maximum activity in
humid and watery circumstances which leads to
endangering consumers’ health, it has been known that
(Neetoo & Chen 2012; Song et al. 2014). Nowadays,
legal and financial acts are concentrated on either
developing and enhancing microbes de-off techniques
based on preservation quality, consumers’ health, and
safety. Common preservative techniques are as follow:
A. Utilizing Ethylene Oxide fumigation, which is being
used for a long time but banned in many countries since
their cancer-causing effects, it has been known that
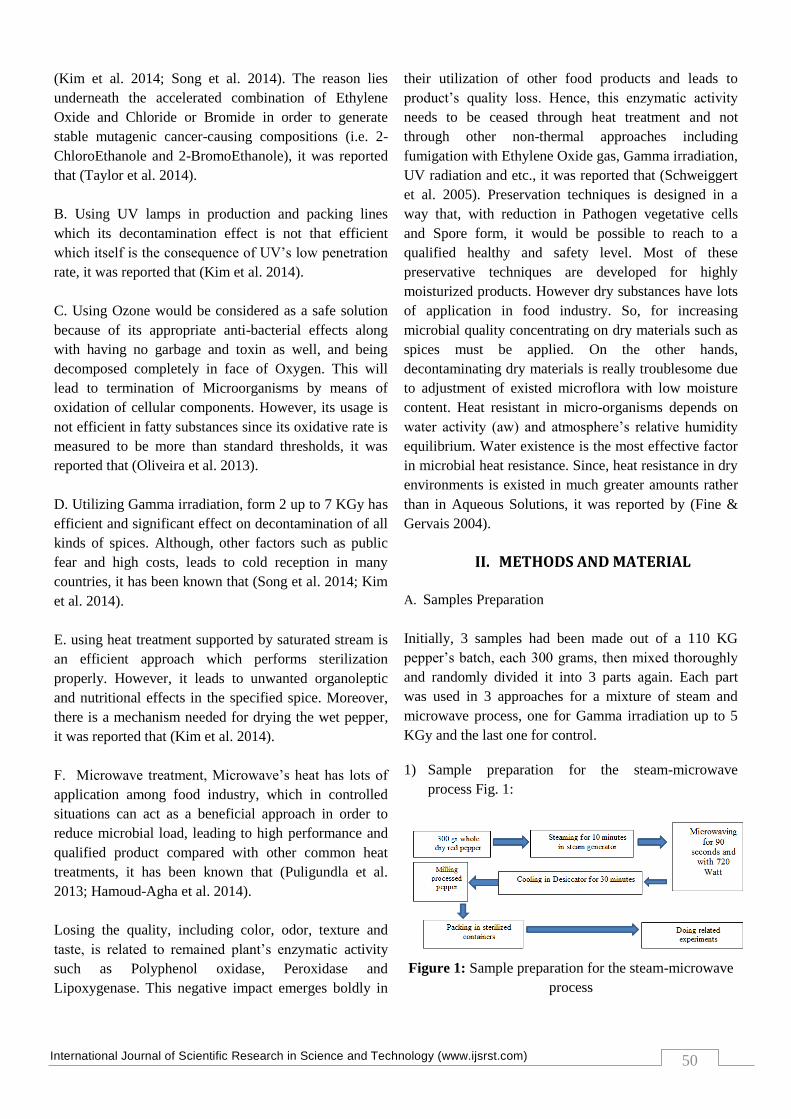
International Journal of Scientific Research in Science and Technology (www.ijsrst.com)
50
(Kim et al. 2014; Song et al. 2014). The reason lies
underneath the accelerated combination of Ethylene
Oxide and Chloride or Bromide in order to generate
stable mutagenic cancer-causing compositions (i.e. 2-
ChloroEthanole and 2-BromoEthanole), it was reported
that (Taylor et al. 2014).
B. Using UV lamps in production and packing lines
which its decontamination effect is not that efficient
which itself is the consequence of UV’s low penetration
rate, it was reported that (Kim et al. 2014).
C. Using Ozone would be considered as a safe solution
because of its appropriate anti-bacterial effects along
with having no garbage and toxin as well, and being
decomposed completely in face of Oxygen. This will
lead to termination of Microorganisms by means of
oxidation of cellular components. However, its usage is
not efficient in fatty substances since its oxidative rate is
measured to be more than standard thresholds, it was
reported that (Oliveira et al. 2013).
D. Utilizing Gamma irradiation, form 2 up to 7 KGy has
efficient and significant effect on decontamination of all
kinds of spices. Although, other factors such as public
fear and high costs, leads to cold reception in many
countries, it has been known that (Song et al. 2014; Kim
et al. 2014).
E. using heat treatment supported by saturated stream is
an efficient approach which performs sterilization
properly. However, it leads to unwanted organoleptic
and nutritional effects in the specified spice. Moreover,
there is a mechanism needed for drying the wet pepper,
it was reported that (Kim et al. 2014).
F. Microwave treatment, Microwave’s heat has lots of
application among food industry, which in controlled
situations can act as a beneficial approach in order to
reduce microbial load, leading to high performance and
qualified product compared with other common heat
treatments, it has been known that (Puligundla et al.
2013; Hamoud-Agha et al. 2014).
Losing the quality, including color, odor, texture and
taste, is related to remained plant’s enzymatic activity
such as Polyphenol oxidase, Peroxidase and
Lipoxygenase. This negative impact emerges boldly in
their utilization of other food products and leads to
product’s quality loss. Hence, this enzymatic activity
needs to be ceased through heat treatment and not
through other non-thermal approaches including
fumigation with Ethylene Oxide gas, Gamma irradiation,
UV radiation and etc., it was reported that (Schweiggert
et al. 2005). Preservation techniques is designed in a
way that, with reduction in Pathogen vegetative cells
and Spore form, it would be possible to reach to a
qualified healthy and safety level. Most of these
preservative techniques are developed for highly
moisturized products. However dry substances have lots
of application in food industry. So, for increasing
microbial quality concentrating on dry materials such as
spices must be applied. On the other hands,
decontaminating dry materials is really troublesome due
to adjustment of existed microflora with low moisture
content. Heat resistant in micro-organisms depends on
water activity (aw) and atmosphere’s relative humidity
equilibrium. Water existence is the most effective factor
in microbial heat resistance. Since, heat resistance in dry
environments is existed in much greater amounts rather
than in Aqueous Solutions, it was reported by (Fine &
Gervais 2004).
II. METHODS AND MATERIAL
A. Samples Preparation
Initially, 3 samples had been made out of a 110 KG
pepper’s batch, each 300 grams, then mixed thoroughly
and randomly divided it into 3 parts again. Each part
was used in 3 approaches for a mixture of steam and
microwave process, one for Gamma irradiation up to 5
KGy and the last one for control.
1) Sample preparation for the steam-microwave
process Fig. 1:
Figure 1: Sample preparation for the steam-microwave
process

International Journal of Scientific Research in Science and Technology (www.ijsrst.com)
51
It can be concluded that, this process has two stages:
Steaming with a Feller (from Germany) steam
generator machine, in order to condition, reduce
microbial load and cease enzymatic activities.
Microwaving with a MC-3022 snr machine
produced by LG, in order to dry the conditioned red
pepper, continue both microbial load reduction and
cease enzymatic activities.
2) Sample preparation for Pepper Irradiating process
Following milling the second batch and putting them in
sterilized containers, they are sent for Gamma irradiation
up to 5 KGy for about 34 min and 12 second. Source
host configurations of Irradiation device are as follows:
Dos Rate: 2.56 Gy/Sec
Transit Rate: 7.86 Gy
After irradiating the second batch, they are sent to
laboratory for microbial and chemical experiments.
3) Sample preparation for control
Control sample is the one with no applied processes and
is just milled and packed with means of comparing with
two other samples.
B. Microbial experiments
1) Total Plate Count Agar based on Iran’s National
Standard (5272):
He counting process for specified colonies is performed
by a standard procedure which includes adding prepared
0.1 dilution of Pepper suspension to the culture medium
of PCA (Merck, Germany) which has a rotational
movement, then flocculating the specified culture and
finally transporting it into Incubator in an upside down
position for 72 hours in 30°C.
Counts the number of colonies with following formula:
⁄
d: coefficient of initial dilution suspension.
Y: Average number of existed colonies in two plates.
2) Counting Mold and Yeast below 0.6 water activity
based on Iran’s National Standard (10899-3):
This experiment is performed in a Yeast extract-
Dextrose-Chloramphenicol (YGC) culture medium. The
counting process for specified colonies is performed by
a standard procedure which includes adding prepared
0.1 dilution of Pepper suspension to the culture medium
of YGC (Merck, Germany) which has a rotational
movement, then flocculating the specified culture and
finally transporting it into Incubator in an upside down
position for 5 days in 25°C.
Counts the number of colonies with following formula:
⁄
d: coefficient of initial dilution suspension.
Y: Average number of existed colonies in two plates.
3) Counting Coliform based on Iran’s National
Standard (9263):
Its culture medium is Crystal violet, neutral red and bile
lactose agar (VRBL). The counting process for specified
colonies is performed by a standard procedure which
includes adding prepared 0.1 dilution of Pepper
suspension to the culture medium of VRBL (Merck,
Germany) which has a rotational movement, then
flocculating the specified culture, supported by adding 4
ml from VRBL to each plate, and finally transporting it
into Incubator in an upside down position for 24 hours
in 30°C.
4) Counting E.coli based on Iran’s National Standard
(2946):
This process is performed by adding 1 ml of initial
suspension to 9 ml of Lauryl sulphate broth. The
Inoculated tubes are held in incubator in 37°C in periods
of 24 and 48 hours. In case of gas production in Durham
tubes, EC and all supplementary tests are held,
otherwise the report is sent as negative.
C. Physicochemical experiments
1) pH measurement based on Iran’s National Standard
(2852):
10 grams of red Pepper is mixed with 50 ml of distilled
water, followed upon measuring its pH by a pH meter

International Journal of Scientific Research in Science and Technology (www.ijsrst.com)
52
electrode (Jenway, Germany) and after fixing its number,
it will be reported.
2) Moisture measurement based on Iran’s National
Standard (2705) for calculating Total Solid (TS):
After weighing 5 grams of the sample (M2) and the
container with its lid (md), it will be put in oven
(Memert, Germany) for 120 minutes, followed by
cooling in desiccating machine for 30 minutes. Then, it
will be weighed (ml) upon which the dried sample mass
(M1) is extracted by below formula:
M1=ml-md
In order to calculate moisture percentage following
formula can be used:
[ ]
3) Qualitative determination of enzymatic activity
(Catalase and peroxidase) based on Iran’s National
Standard (48):
On the cross section of a gram of different treatments, a
drop of 3.0 or 5.0 per cent hydrogen peroxide solution
(Merck, Germany) is added. With emergence of pink
colour tinged with orange, or creation of lots of bubbles,
the existence of Catalase and peroxidase enzymes is
assured in the specific sample.
4) Peroxide test based on Iran’s National Standard
(4179):
First oil in pepper is extracted with cold extraction, and
then 5 grams of the oil is mixed with 50 ml of solution
(acetic acid (Sigma Aldrich, US) + iso-octane (Merck,
Germany) which is prepared in a 3 to 1 proportion. Then,
0.5 ml of saturated potassium iodide (KI) (Merck,
Germany) is added to the container. Then the container
is left in a dark cabinet for 1 minute. Following stage,
100 ml of distilled water is added to the container with a
few drops of starch (Kimia Gostar, Iran) (1 to 5
percentage starch solution).
A prepared sample which is now in dark colour, will be
under the affection of titration with 0.01 N sodium
thiosulfate (Sigma Aldrich, US) up until it becomes
colourless. Besides, Titration of the control is performed.
Thiosulfate amount consumed by the control is
subtracted from the amount consumed by the sample.
Amount of proxide:
( )
Hereby the parameters are as followed:
S: Thiosulfate volume consumed by the sample
B: Thiosulfate volume consumed by the control
N: Thiosulfate Normality
W: Sample Weight
D. Machinery Tests
1) Colorimetric measurement with Hunter lab system
a*, b* and L* colour space is a model which was
approved in 1976 by International Commission on
Illumination light for describing the relationship
between the visible colours by eye in which L* defines
brightness (between 0 to 100), a* represents red and
greenish colour (+a for red and –a for green) and b*
explains yellow and blue colours (+b for yellow and –b
for blue), that both a* and b* are from -120 to +120.
E. Statistical Analysis
By using Microsoft Excel in representing and packing
the raw data and utilizing one-sample T-test from SPSS
software the data was summarized, interpreted and
observed properly.
III. RESULT AND DISCUSSION
A. Total Solid results with P<0.01 assumption
According to Fig. 2, Steam-microwave process (B), had
the lowest TS compared to the control (C) and irradiated
sample (A), which B’s TS is less than about 0.64 of
control sample averagely, Rico et al.(Rico et al. 2010)
have shown that.
Employing heat steam-microwave process leads to
increase in Moisture content and the reason lies
underneath the facts of water absorption during steaming
process and Failure in returning the moisture to its initial
amount during Microwave process. In spite of the fact
that these changes are considered as really minute (about
0.6%) and would have no effects on pepper’s
preservative and organoleptic properties.
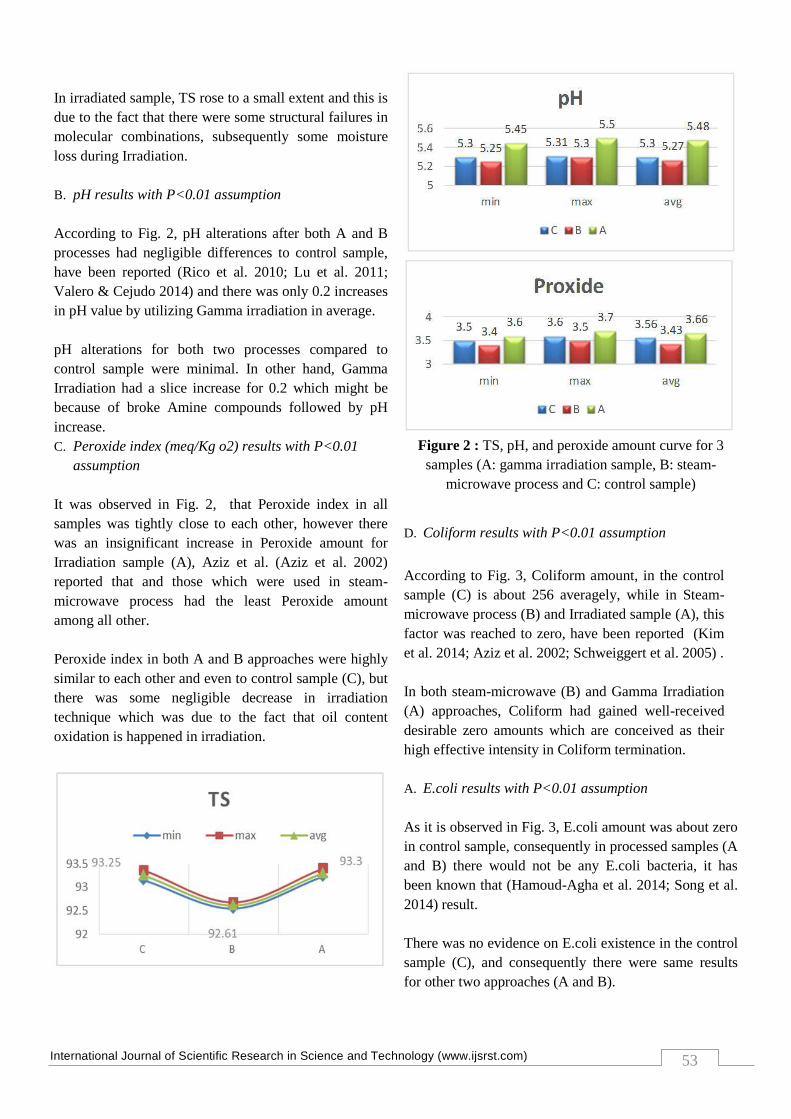
International Journal of Scientific Research in Science and Technology (www.ijsrst.com)
53
In irradiated sample, TS rose to a small extent and this is
due to the fact that there were some structural failures in
molecular combinations, subsequently some moisture
loss during Irradiation.
B. pH results with P<0.01 assumption
According to Fig. 2, pH alterations after both A and B
processes had negligible differences to control sample,
have been reported (Rico et al. 2010; Lu et al. 2011;
Valero & Cejudo 2014) and there was only 0.2 increases
in pH value by utilizing Gamma irradiation in average.
pH alterations for both two processes compared to
control sample were minimal. In other hand, Gamma
Irradiation had a slice increase for 0.2 which might be
because of broke Amine compounds followed by pH
increase.
C. Peroxide index (meq/Kg o2) results with P<0.01
assumption
It was observed in Fig. 2, that Peroxide index in all
samples was tightly close to each other, however there
was an insignificant increase in Peroxide amount for
Irradiation sample (A), Aziz et al. (Aziz et al. 2002)
reported that and those which were used in steam-
microwave process had the least Peroxide amount
among all other.
Peroxide index in both A and B approaches were highly
similar to each other and even to control sample (C), but
there was some negligible decrease in irradiation
technique which was due to the fact that oil content
oxidation is happened in irradiation.
Figure 2 : TS, pH, and peroxide amount curve for 3
samples (A: gamma irradiation sample, B: steam-
microwave process and C: control sample)
D. Coliform results with P<0.01 assumption
According to Fig. 3, Coliform amount, in the control
sample (C) is about 256 averagely, while in Steam-
microwave process (B) and Irradiated sample (A), this
factor was reached to zero, have been reported (Kim
et al. 2014; Aziz et al. 2002; Schweiggert et al. 2005) .
In both steam-microwave (B) and Gamma Irradiation
(A) approaches, Coliform had gained well-received
desirable zero amounts which are conceived as their
high effective intensity in Coliform termination.
A. E.coli results with P<0.01 assumption
As it is observed in Fig. 3, E.coli amount was about zero
in control sample, consequently in processed samples (A
and B) there would not be any E.coli bacteria, it has
been known that (Hamoud-Agha et al. 2014; Song et al.
2014) result.
There was no evidence on E.coli existence in the control
sample (C), and consequently there were same results
for other two approaches (A and B).

International Journal of Scientific Research in Science and Technology (www.ijsrst.com)
54
Figure 3 : Coliform and E.coli amount curve for 3
samples (A: gamma irradiation sample, B: steam-
microwave process and C: control sample).
B. Total Plate Count Agar (TPCA) results with P<0.01
assumption
According to Fig. 4, There was high amounts of TPC in
our initial sample (C), nearly about 1287, but with
employing the steam-microwave process (B) for 3 times,
this number is reduced to about 56 colony, have been
reported (Rico et al. 2010; Aziz et al. 2002;
Schweiggert et al. 2005) .
Besides, by applying irradiation this number is reduced
to about 73 colonies, it has been known that (Aziz et al.
2002; Rico et al. 2010).
The most significant reduction of TPC was seen in
steam-microwave process which on average decreased
the number from 1286 in control sample (C) to 56,
which is followed by next technique in second position,
Gamma Irradiation that lessened the number to 73 units
of TPC.
C. Mold results with P<0.01 assumption
According to Fig. 4, Initial Mold count on our control
sample (C) was about 3733, but with employing the
steam-microwave process (B) or applying Gamma
irradiation with 5 KGy, there was no other signs of mold
observed in culture media, it has been known that
(Schweiggert et al. 2005; Rico et al. 2010) .
Mold values in control sample was high in amounts
initially, for about 3737, but with applying steam-
microwave (B) and Gamma Irradiation (A) upon
processing its amount declines drastically to the state of
no mold in both samples which explains highly
responsive behaviour of mold destruction in both
processes.
240
0 0
280
0 0
256.66
0 0 0
50
100
150
200
250
300
C B A
COLIFORM min max avg
min0
0.2
0.4
0.6
0.8
1
CB
A
E.coli
min max avg dev
1210 1350 1286.67
10066.66667
50 60 56.6 66.6666666
7 70 80 73.33 0
2000
4000
6000
8000
10000
12000
min max avg dev
TPC
C B A

International Journal of Scientific Research in Science and Technology (www.ijsrst.com)
55
Figure 4 : TPC, Mold, and yeast amount curve for 3
samples (A: gamma irradiation sample, B: steam-
microwave process and C: control sample).
D. Yeast results with P<0.01 assumption
According to Fig. 4, There was high amounts of Yeast in
our initial red pepper sample (C), nearly about 846,
however by employing the steam-microwave process
(B), this number is reduced to about 136, it has been
known that (Schweiggert et al. 2005; Rico et al. 2010).
Besides, by applying irradiation with 5 KGy in 3 times,
this number is increased to about 1140, in contrast with
the data, Rico et al. (Rico et al. 2010) have shown that,
due to lower treatment dose irradiation.
The lowest yeast amount is referred to steam-microwave
process (B) in which the amount was reduced from 846
of control sample (C) to 136 units. However, employing
Gamma Irradiation approach (A), led to its soar to 1140
which was due to the fact that Irradiation causes
germination of yeast cells. This malfunction creates
disastrous problems which itself is the key factor in
spoilage and fluff in future products.
E. Hunter Lab Colorimetric results
1) L* (Brightness factor) with P<0.01 assumption
According to Fig. 5, In steam-microwave approach L*
amount was about 44 which was reduced from the
control sample value by 3 units, have been reported
(Schweiggert et al. 2005; Rico et al. 2010; Chang et al.
2010) result, although there was a 3 unit increase on this
factor by employing Gamma Irradiation (A) approach
compared to control sample (C), Song et al. (Song et al.
2014) have shown that.
2) a* (Red factor for red pepper) with P<0.01
assumption
According to Fig. 5, On average, a* index was about
22.11 in the steam-microwave approach (B), which had
a reduction compared to control sample (C) with its
amount near about 23.7, have been reported
(Schweiggert et al. 2005; Rico et al. 2010; Chang et al.
2010) result, although in Gamma Irradiation approach
(A) this index was increased in small amounts to 24.61,
Song et al. (Song et al. 2014) have shown that.
3) b* (Yellow factor for red pepper) with P<0.01
assumption
According to Fig. 5, b* index had a decrease in the
steam-microwave approach (B), and its amount
declined from 51.6 for Control sample (C) to 49.4, have
been reported (Schweiggert et al. 2005; Rico et al. 2010;
Chang et al. 2010) result. Although in Gamma
Irradiation approach (A) this index was increased for
about 5 units which lead to more yellow color in its
output, Song et al. (Song et al. 2014) have shown that.
All in all, steam-microwave approach had tiny effect on
reduction of brightness (L*), red color (a*) and yellow
3400
0 0
4100
0 0
3733.3
0 0 0
500
1000
1500
2000
2500
3000
3500
4000
4500
C B A
Mold
min max avg
846.667
136.667
1140
0
200
400
600
800
1000
1200
1400
C B A
Yeast
min max avg

International Journal of Scientific Research in Science and Technology (www.ijsrst.com)
56
color (b*) factors, which is due to the fact that there are
some destructions in colour pigments during steaming
and microwaving processes. In other hand, irradiation
led to minuscule upward trend in all color factors that
are the result of destruction of some pigments during
Gamma irradiation along with de-polymerization of
substances and structural unpacking.
Figure 5: L*,a
*,and b
* amount for 3 samples (A:
gamma irradiation sample, B: steam-microwave process
and C: control sample)
F. Existence Quality Test of Enzymatic Activity
According to the table 1, both control and Gamma
irradiated samples had enzymatic activities which led to
negative effects on its future products; however the
output from steam-microwave process lacked any
enzymatic activities. Schweiggert et al. (Schweiggert et
al. 2005) has shown that.
Table 1: Existence Quality Test of Enzymatic Activity.
Condition Control Steam-
Microwave
Gamma
Irradiated
Enzymatic
Activity
No
Enzymatic
Activity
IV. CONCLUSION
Steam-microwave process (B), had the lowest TS
compared to the control (C) and irradiated sample (A),
pH alterations after both A and B processes had
negligible differences to control sample, Peroxide index
in all samples was tightly close to each other; however
there was an insignificant increase in Peroxide amount
for Irradiation sample (A), Coliform amount, in the
control sample (C) is about 256 averagely, while in
Steam-microwave process (B) and Irradiated sample (A),
this factor was reached to zero, E.coli amount was about
zero in control sample, consequently in processed
samples (A and B) there would not be any E.coli, The
most significant reduction of TPC was seen in steam-
microwave process, The most significant reduction of
mold was seen in steam-microwave process, The lowest
yeast amount is referred to steam-microwave process (B)
However, employing Gamma Irradiation approach (A),
led to its soar, All in all, steam-microwave approach had
tiny effect on reduction of (L (a*) and (b*) factors,. In
other hand, irradiation led to minuscule upward trend in
all colour factors and both control and Gamma irradiated
samples had enzymatic activities which led to negative
effects on its future products; however the output from
steam-microwave process lacked any enzymatic
activities.
47.22
44.29
50.04
40
45
50
55
C B A
L*
min max avg
23.7
22.11
24.61
18
20
22
24
26
C B A
a*
min max avg
51.6 49.4
53.33
44
46
48
50
52
54
56
C B A
b*
min max avg

International Journal of Scientific Research in Science and Technology (www.ijsrst.com)
57
V. REFERENCES
[1] Aziz N.H., Mahrous S.R.,Youssef, B.M. (2002):
Effect of gamma-ray and microwave treatment on
the shelf-life of beef products stored at 5 ° C.Food
Control, 13: 437–444.
[2] Chang S., Han A.R., and Powers J.R., Kang D.
(2010): Evaluation of steam pasteurization in
controlling Salmonella serotype Enteritidis on raw
almond surfaces. Lett. Appl. Microbiol, 50: 393–
398.
[3] Fine F., Gervais P. (2004): Thermal destruction of
dried vegetative yeast cells and dried bacterial
spores in a convective hot air flow: strong
influence of initial water activity. Environ.
Microbiol, 7: 40-46.
[4] Hamoud-Agha M.M., Curet S., Simonin H.,
Boillereaux L. (2014): Holding time effect on
microwave inactivation of Escherichia coli K12:
Experimental and numerical investigations. J.
Food Eng, 143: 102–113.
[5] Kim J.E., Lee D.-U., Min, S.C. (2014): Microbial
decontamination of red pepper powder by cold
plasma. Food Microbiol, 38: 128–136.
[6] Lu Y., Turley A., Dong X., Wu C. (2011):
Reduction of Salmonella enterica on grape
tomatoes using microwave heating. Int. J. Food
Microbiol, 145: 349–352.
[7] Neetoo H., Chen H.( 2012): High pressure
inactivation of Salmonella on Jalapeño and
Serrano peppers destined for direct consumption
or as ingredients in Mexican salsa and
guacamole. Int. J. Food Microbio,. 156: 197–203.
(2012).
[8] Duke J.A., Bogenschutz-Godwin M.J., duCellier
J., Duke PK. (2003): CRC handbook of medicinal
spices. CRC Press LLC, 2000 N.W. Corporate
Blvd., Boca Raton, Florida, USA. pp. 94-96.
[9] Oliveira, E. et al., (2013): Inactivation of E. Coli
and B. subtilis spores in ozonized cassava starch.
Food Sci. Technol Campinas, 33: 289–294.
[10] Puligundla P., et al., (2013): Potentials of
Microwave Heating Technology for Select Food
Processing Applications - a Brief Overview and
Update. J. Food Process Technol. 4:278.
[11] Rico C.W., et al., (2010): The comparative effect
of steaming and irradiation on the
physicochemical and microbiological properties
of dried red pepper (Capsicum annum L.). Food
Chem, 119: 1012–1016.
[12] Schweiggert U., Mix K., Schieber A., Carle R.
(2005): An innovative process for the production
of spices through immediate thermal treatment of
the plant material. Innov. Food Sci. Emerg, 6:
143–153.
[13] Song, W.-J., et al. (2014): Inactivation of
Escherichia coli O157:H7 and Salmonella
Typhimurium in black pepper and red pepper by
gamma irradiation. Int. J. Food Microbiol, 172:
125–129.
[14] Taylor P., Bononi M., Quaglia G., Tateo F.
(2014): Identification of ethylene oxide in herbs,
spices and other dried vegetables imported into
Italy. Food Addit. Contam, Part A 31: 271–275.
[15] Valero A., Cejudo M. M. (2014): Inactivation
kinetics for Salmonella Enteritidis in potato
omelet using microwave heating treatments. Food
Control, 43: 175–182.
IJSRST162416 | Received : 11 July 2016 | Accepted : 19 July 2016 | July-August 2016 [(2)4: 58-63 ]
© 2016 IJSRST | Volume 2 | Issue 4 | Print ISSN: 2395-6011 | Online ISSN: 2395-602X Themed Section: Science and Technology
58
Preserving Privacy Using Attribute Based Access Control in
Data Stream Suyog Vilas Patil
1, Prof. K. B. Manwade
2
1ME (CSE ) Student,Ashokrao Mane Group of Institutons,Vathar, Kolhapur, Maharashtra, India
2Asst. Prof., Ashokrao Mane Group of Institutons, Vathar, Kolhapur, Maharashtra, India
ABSTRACT
Data security is a very broad area that addresses many issues, like legal and ethical issues regarding the
right to access certain information. The sensitive data is accessible to authorized users only. The database
security is based on the Access Control Mechanism (ACM) and the Privacy Protection Mechanism (PPM).
The Access Control Mechanisms (ACM) is used to ensure that only information is available authorized to
users. The authorized user can only access the authorized data. The privacy protection mechanism (PPM)
is a general method used to transform the original data into some anonymous form to prevent from
accessing owners sensitive information. There are numerous methods to provide the privacy for the
sensitive data. In existing literature, the Access Control mechanism allows Role Based Access using Time
Based Sliding Window Query. It protects the user information from the unauthorized access. PPM meets
privacy requirement through k-anonymity it provides better privacy for the sensitive information which is
to be shared. The privacy is achieved by the high accuracy of the user information. To protect data, the
anonymization method is one of the best privacy protection mechanisms. The anonymization process will
transform the sensitive information to some anonymzed form using K-anonymity, ℓ -diversity. The PPM
needs to satisfy an additional constraint namely the Imprecision bound for each selection predicate. The
imprecision bound reduced the delaying for publishing data stream. The challenge is to optimize the delay
in publishing data stream, if the delay in publishing query is reduced then the imprecision bound is
satisfied. Proposed system is an accuracy based access control using Attribute Based Access Control with
Tuple Based Sliding Window Query. and PPM with the ℓ -diversity. The ℓ -diversity method is an
extension of the k-anonymity method, it is more efficient than the k-anonymity method. It avoids the
attacks like background knowledge attack and others in k-anonymity method.
Keywords: Access Control Mechanisms, Privacy Protection Mechanism, Information Security, Top
Down Selection Mondrian, Attribute Based Access Control, Total Minimum Imprecision
I. INTRODUCTION
In the field of Information Security, the data
security refers to protecting data from unauthorized
users. It is based on confidentially, integrity and
availability. To accessing a DataStream, it is not
possible to control the order in which data arrive,
nor feasible to storing data. The data owners may
not be willing to exactly processing the true value
of their data due to various reasons, mostly privacy
consideration and accuracy of data accessing.
However, the unauthorized user can also take

International Journal of Scientific Research in Science and Technology (www.ijsrst.com)
59
advantages of this to accessing the data. Therefore
it is need to user has a better access control
mechanism to provide both security and privacy.
II. METHODS AND MATERIAL
1. Literature Review
1. To provide better Access control mechanism to ensure
both security and privacy of the sensitive information,
Access control mechanism for Data Stream Management
System (DSMS) provide access of authorized part of the
stream to each user. Zahid Pervaiz, Arif Ghafoor,
Fellow, Walid G. Aref et.al uses a Role Based Control
Policy (RBAC) [1] defines the authorized view of the
data stream for each role.
2. Role based access control gives permission to the
users to access data based on their role. For Relational
data Nagabhushan,Arif Ghafoor,Zahid Pervaiz et al
defines [2] selection predicates query technique is
savailable to role while the privacy requirement is
satisfy.
3. The stream data offers query processing over
continues and sequencing data for data publishing and
the windowing techniques generally emphasize on the
streaming data. T.Ghanem, A.Elmagarmid, P.Larsen
and w.Aref et al. proposed the predicate window query
processing for streaming data [3].The access control
uses Role based techniques to satisfy minimum
Imprecision bound using the time based sliding window
query [1].
4. To maintain the privacy of data it is need to minimize
the imprecision of aggregate for all queries. The
imprecision bound is a resulted value which determines
the amount of imprecision that can be tolerated for each
query. Privacy preserving mechanism needs to sum of
false negative and false positive is less than imprecision
bound. Zahid Pervaiz, Arif Ghafoor, Fellow, Walid G.
Aref et.al proposed the Top Down Selection Mondrian
(TDSM) used to minimize imprecision bound for
rational data [2].
5. The Data anonymization is one of the important
privacy protection techniques. It transforms the sensitive
information to some anonymzed form. J. Cao, B.
Carminath, E. Ferrai and K. Tan et al. presents the
continues anonymzing data stream [4]. To anonymize
data use generalization will replace the sensitive
information with border range. C. Clifton and T. Tesa
et al proposed the differential privacy model using
generalization [5]. L. Sweency represents an
anonymization method to preserve a privacy of data. i.e.
k-Anonymity [6]. To prevent uncontrollable information
loss and affects the accuracy of crowd sourcing database
Saiwo,Xi aloi, Sheng Wang et al proposed K-
Anonymity for crowd sourcing database [7].
2. Proposed Work
In proposed system, the access control mechanism
allows only authorized queries predicates on sensitive
data using Attribute Based Access Control (ABAC)
policy. It defines an access control paradigm whereby
access rights are granted to users through the use of
policies which combine attributes together. The policies
can use any type of attributes (user attributes, resource
attributes, environment attribute etc.).The imprecision
bound is a threshold value which determines the amount
of imprecision that can be tolerated for each query. The
access control policy administrator sets the imprecision
bound using overlap semantics and enclosed semantics
for each predicate Tuple Based Sliding Window Query.
This query meets the minimum imprecision bound,
means it prevents and solves the query violation problem.
The proposed system formulate query generation
module of the system using tuple based sliding window
query that offers overlap and enclosed semantics. The
proposed system refers data anonymization using the ℓ -
diversity. ℓ -diversity method reduces the granularity of
representation of the data, ℓ -diversity can still defend
against background knowledge that is unknown to the
data publisher. The ℓ -diversity method is an extension
of the k-anonymity method.
The following techniques is used are as follows,
1. To use Attribute Based Access Control Policy for
precession bounded access over DataStream
2. Implementation of heuristics algorithm for satisfying
the imprecision bounds.
3. To use Tuple Based Sliding Window Query for
accessing data to maintain accuracy.
4. To use ℓ -diversity method for anonymization of
DataStream instead of k-anonymity

International Journal of Scientific Research in Science and Technology (www.ijsrst.com)
60
3. Proposed Architecture
The proposed system provides following dynamic policy
management modules:
Figure 1: Architecture of Attribute based Access Control System
Data Collection
In this module, the proposed system refers sensitive
information in the form of streaming data. DataStream
offers a continues data arrive in a system for storing and
processing.
Access Control Mechanism I
The Access control mechanism-I is divide into two parts
are as follows:
1) User/attribute: In this framework user accessing the
DataStream using attribute Based Access Control
(ABAC) technique. It provides a high level of flexibility
that promotes security and information sharing. ABAC
is composed of a set of Users, a set of attributes, and a
set of Permissions.
2) Admin Permissions: System administrator set the
permission to imprecision bound for each query, user-to-
attribute assignments, and attribute-to permission
assignments.
Access Control Mechanism II
The Access Control Mechanism –II is divided into two
parts are as follows:
1) Imprecision Bound: It ensures that the authorized
data has the desired level of accuracy. The imprecision
bound can be used to meet the privacy requirement. The
privacy protection mechanism is required to meet the
privacy requirement according to the imprecision bound
for each permission.

International Journal of Scientific Research in Science and Technology (www.ijsrst.com)
61
2) Reference monitor: A predicate Tuple Based Sliding
Window Query is evaluated for a DataStream by
including all the stream tuples that satisfy the query
predicate. For predicate evaluation over an anonymzed
DataStream will be used reference monitor, including all
the tuples in equivalence classes that overlap the query
predicate range.
Privacy Protection Mechanism:
The privacy protection module anonymzed the data
using ℓ-diversity to meet privacy requirements and
imprecision constraints on predicates set by the access
control mechanism.
Recursive ℓ diversity:
Recursive (c, ℓ)-Diversity. In a given q⋆-block, let ri
denotethe number of times the ith most frequent
sensitive value appears in that q⋆-block. Given a
constant c, the q⋆-block satisfies recursive (c, ℓ)-
diversity if r1 < c(rℓ + rℓ+1 + ・ ・ ・ + rm). A table T
⋆ satisfies recursive (c, ℓ)-diversity if every q⋆-
blocksatisfies recursive ℓ-diversity. We say that 1-
diversity is always satisfied.Now, both entropy and
recursive ℓ-diversity may be too restrictive. To see
whylet us first look at entropy ℓ-diversity. Since −x
log(x) is a concave function, it canbe shown that if we
split a q⋆-block into two sub-blocks qa and q⋆b then
entropy(q⋆) ≥ min(entropy(q⋆a), entropy(q⋆b )). This
implies that in order for entropy ℓ-diversity tobe
possible, the entropy of the entire table must be at least
log(ℓ). This might notbe the case, especially if one value
of the sensitive attribute is very common – for example,
if 90% of the patients have “heart problems” as the value
for the “Medical Condition” attribute.This is also a
problem with recursive ℓ-diversity. It is easy to see that
if 90% of the patients have “heart problems” as the value
for the “Medical Condition” attribute then there will be
at least one q∗-block where “heart problems” will have
frequency of at least 90%. Therefore if we choose c < 9
in Definition 4.2, no generalization of the base table will
satisfy recursive (c, ℓ)-diversity
4. Implementation Steps
The implementation steps are as follows:
Step 1. The proposed system uses a continues and
sequencing data . In step I the system uses
DataStream.
Step 2. In Step II the privacy protection mechanism
deals with sensitive data.it transfer the sensitive
data into some anonymize form using ℓ -
diversity.
Step 3. In access control mechanism -I user access the
accurate data using attribute based access
control.
Step 4. In access control mechanism –II generate the
tuple based sliding window query for precision
access of data and admin set the permission to
maintain imprecision bound.
Step 5. The reference Monitor maintains all the tuples
in equivalence class for accuracy of data
accessing.
Step 6. In this step ,attributed based access control using
tuple based sliding window query maintain
precision bound access of the DataStream.
5. Scope
Role Based Access Control policy cannot be ensures
permission on sequence of operation need to be
controlled. In proposed system, Attribute-based access

International Journal of Scientific Research in Science and Technology (www.ijsrst.com)
62
control (ABAC), provides a high level of flexibility that
promotes security and information sharing.
The Total Minimum Imprecision (TIM) algorithm use to
meet the desired level accuracy for relational data
accessing. In proposed system, the heuristics algorithm
will be used for streaming data to satisfy precision
bounded access.
The purpose of access control is to ensure that each user
access only the authorized information. This semantic
suggested in reference monitor, the Role Base Access
Control (RBAC) uses the time based sliding window
query. To prevent an overlapping data and maximum
response time of query evolution, the proposed system
refers Tuple Based Sliding Window Query with use of
overlap and enclosed semantics.
The k-anonymity is the anonymization techniques
convert the sensitive information to some anonymzed
form using generalization and suppression. The
proposed system uses ℓ -diversity method. ℓ - diversity
is a form of group based anonymization that is used to
preserve privacy in data sets by reducing the granularity
of a data representation.
6. Methodology
There are following techniques and algorithm in
proposed methodology:
Data Collection: The proposed system stores the
sensitive data in the form of DataStream. Accessing
a DataStream is concerned with extracting
knowledge represented in non-stopping, continues
and ordered sequence of information.
Access Control Mechanism I: The framework of
Access Control Mechanism -I uses Attribute-based
access control (ABAC), provides a high level of
flexibility that promotes security and information
sharing. ABAC also overcomes some of the
problems associated with Role Based Access
Control (RBAC).RBAC cannot be ensure
permission on sequence of operation need to be
controlled. Using ABAC policy mining algorithm
we prevent privileges unwieldy.
Access Control Mechanism II: The purpose of
Access Control Mechanism-II is used to Tuple
Based Sliding Window Query technique. Privacy is
achieved using cost of accuracy and imprecision is
introduces in the authorized information under an
access control policy. In proposed system a heuristic
algorithm set the minimum imprecision bound.
Query impression bound is the total impression
acceptable for query predicate and present by the
access control administrator.
4. Privacy Protection Mechanism:
Privacy protection mechanism includes data
anonymization. The data anonymization is the process
that transforming sensitive data to some anonymzed
form. The proposed system used ℓ-diversity, it is
techniques better than k-anonymity. It has strong
background knowledge and maintains lack of diversity.
The approach for preserving privacy is based on data
anonymization.
Experimental Setup & Implementation:
1. To implement above system some pre work to
do.
2. To Fetch the dataset from a file and import to
the database.
3. A privacy preserving module preserves the data
using l- diversity.
4. The reference monitor uses the top down
heuristics algorithm for accuracy of data.
5. The ABAC policy uses the data accessing
through attribute.
III. RESULT AND DISCUSSION
We fetch and perform really insertion of record into
database around then into frame work the normal
execution time means what number of time used to
insertion of record (computed in millisecond) of the both
l-distinct and l – recursive technique. Framework of l-
recursive in graph 1.
In a general view, the insertion of record having two
different background procedure of database. In this
checking methodology checker don't have a clue about
the substance of client's tuple. In second stage,
framework really redesigns the database relies on upon
the consequence of the user. Sometimes the insertion or

International Journal of Scientific Research in Science and Technology (www.ijsrst.com)
63
updating fizzled in l recursive database then it holds up
until l quality gets to be sure and different tuples fail the
insertion.
IV. CONCLUSION
In this, we focus on a privacy preserving of l-diversity
database. We have presented two secure techniques l –
distinct and l recursive for database anonymization
techniques for protecting individual's privacy. The
Authorized user accessing the database using ABAC
policy for better accuracy.
V. REFERENCES
[1] Zahid Pervaiz, Arif Ghafoor, Walid G. Aref,
"Precision-Bounded Access Control Using
Sliding-Window Query Views for Privacy-
Preserving Data Streams", IEEE Trans. Knowl.
Data Eng, July 2015.
[2] Z.Pervaiz,W.G.Aref, A.Ghafoor,andN. Prabhu,
"Accuracy constrained privacy-preserving access
control mechanism for relational data", IEEE
Trans. Knowl. Data Eng., April 2014.
[3] T. Ghanem, A. Elmagarmid, P. Larson, and W.
Aref, "Supporting views in data stream
management systems," ACM Trans. Database
Syst., 2010.
[4] J. Cao, B. Carminati, E. Ferrari, and K. Tan,
"Castle: Continuously anonymizing data streams,"
IEEE Trans. Dependable Secure Comput.
May/Jun. 2011.
[5] C. Clifton and T. Tassa, "On syntactic anonymity
and differential privacy," in Proc. IEEE Int. Conf.
Data Eng. Workshop Privacy-Preserving Data
Publication Anal., 2013.
[6] B. Zhou, Y. Han, J. Pei, B. Jiang, Y. Tao, and Y.
Jia, "Continuous privacy preserving publishing of
data streams," in Proc. 12th Int. Conf. Extending
Database Technol.: Adv. Database Technol.,
2009.
2 4 6 8 10
1000 225 210 203 198 188
2000 1990 1654 1446 1440 1064
3000 1522 1499 1144 1129 833
4000 2560 1803 1956 1930 1623
5000 3175 2611 2512 2400 1998
225 210 203 198 188
1990
1654 1446 1440
1064
1522 1499
1144 1129
833
2560
1803 1956 1930
1623
3175
2611 2512
2400
1998
0
500
1000
1500
2000
2500
3000
3500
Tim
e(m
s)
l Value
Execution Time as Parameter for I increase
100020003000

International Journal of Scientific Research in Science and Technology (www.ijsrst.com)
2
[7] Sai Wu,Xiaoli Wang,Sheng Wang ,Zhenjie
Zhang,"k-Anonymity for crowd sourcing
Database" IEEE Trans. Knowl. Data Eng, sept
2014.

IJSRST162410 | Received : 12 July 2016 | Accepted : 19 July 2016 | July-August 2016 [(2)4: 64-71 ]
© 2016 IJSRST | Volume 2 | Issue 4 | Print ISSN: 2395-6011 | Online ISSN: 2395-602X Themed Section: Science and Technology
64
Physical and Chemical Changes in the Soluble Fraction of Eggs from Hens Fed
With Pleuroncodes Planipes (Red Crab), Stored for Different Lengths of Time
At Different Temperatures Ma. De la Concenpción Calvo
1, Ma. Elena Carranco
1*, Silvia Carrillo
1, Leonor Sanginés
1, Benjamín
Fuente2, Ernesto Ávila
2
1Animal Nutrition Department Dr. Fernando Pérez-Gil Romo, National Institute of Medical Sciences and Nutrition
Salvador Zubirán, Mexico City, Mexico 2Experimentation Center, Research and Extension in Poultry Production, National Autonomous University of Mexico,
Mexico City, Mexico *Corresponding author: Ma. Elena Carranco. [email protected]
ABSTRACT
As an abundant resource on the coast of Baja California, Mexico, the crustacean known as red crab (Pleuroncodes
planipes) may represent an alternative for use in the formulation laying hens’ diet because of the crab’s protein
content. It has been reported that diets containing 4% red crab meal (RCM) generate eggs with satisfactory sensorial
characteristics. However, changes in the physical and chemical characteristics of the water-soluble components that
alter the biological value of eggs might occur during storage. Therefore the aim was to determine the effect of
storage conditions on the water-soluble fraction of eggs from hens fed with Pleuroncodes planipes meal (RCM). To
determine the effect of storage conditions on the water-soluble fraction of eggs from hens fed with a standard diet
and with a diet with 4% (RCM), 90 hens were divided into two treatments: Control and RCM (4%). During four
weeks of testing, production variables were evaluated. Eggs from each treatment were collected to assess the
following factors: Haugh Units (HU), pH and levels of crude protein, essential amino acids and water-soluble
vitamins after 0, 15 and 30 days at 4° and 20°C. The results were analyzed using a 2x2x2 factorial design, and the
difference between means was compared using Tukey’s test. The results showed that there was no significant
difference in production performance between the treatment groups. During the storage period, there was a decrease
in the CP content (49.8%/15 days – 49.2%/30 days) and HU (60.16/15 days – 52.62/30 days) and an increase in the
pH (8.73/15 days – 9.32/30 days). The effects of temperature and egg storage time on the CP content (49.2%/20°C –
50.2%/4°C) and HU (56.82/20°C – 71.05/4°C) were different (P < 0.05). The effects of diet and egg storage time
resulted in differences (P < 0.05) in the CP content (49.2 Control – 50.2 RCM) and HU (62.91 Control – 64.96
RCM). Adding 4% RCM to the diets of laying hens did not affect the studied productive parameters, but changes
were observed in the water-soluble part of the egg in a double interaction (times and temperatures). The eggs
presented changes inherent to the egg metabolism, modifying the variables studied.
Keywords: Red Crab Meal, Egg Quality, Storage
I. INTRODUCTION
Researchers at the Northwest Center for Biological
Research (known by its Spanish acronym, CIBNOR)
have been studying the biology, ecology and utilization
of red crab (Pleuroncodes planipes) for several years,
and the results show that this species can be considered
the most abundant benthic decapod in Mexico. Data
from Balart [1] and Aurioles and Pérez [2] reported an
abundance of approximately 300,000-500,000 t/year and
a maximum density of up to 40 red crabs/m2 or higher
for the coast of the Baja California peninsula. To date,
this species has not been commercially exploited in
Mexico. These authors suggest that 40,000 t of bentho-

International Journal of Scientific Research in Science and Technology (www.ijsrst.com)
65
pelagic red crabs could be captured during the initial
phase of the fishery without decreasing the amount
available; creating a sustainable fishery that allows the
harvest of biomass for industrial exploitation. Therefore,
it is important to develop technologies for red crab
exploitation and to evaluate the resulting products in
various applications. Today, this type of red crab is
widely studied for its use in the poultry industry as an
ingredient in poultry diets, where it constitutes an
alternative source of protein, fatty acids and pigments [3,
4, 5, 6, 7].
Mexico ranks first in the word in egg consumption (22
kg per capita per year or 305 eggs per person per year)
[8]. Furthermore, the Mexican Norm NMX-FF-079-
SCFI-2004 [9] regarding poultry products, fresh chicken
eggs and method specifications considers an egg to be
fresh at the 15 days old; however, eggs are often stored
for longer periods and the different temperatures. During
this period, the air space within the egg increases due to
loss of water, and a change in pH occurs. This change
and the effect of the compounds in new raw materials
added to the bird’s diet can affect the chemical and
physical quality of eggs [10, 11].
According to the results published by Carrillo et al. [6]
and Carranco et al. [7], the inclusion of between 3 and
6% of RCM in the diets of laying hens is probably
adequate for obtaining high-quality eggs because higher
levels cause changes in the sensorial characteristics of
eggs. Starting from the above inclusion criterion, this
study was designed to determine whether the physical
and chemical properties of the water-soluble portion of
eggs from hens fed a standard diet and a diet with 4% of
red crab meal undergo modifications when stored at 4°
and 20° for 0, 15 and 30 days.
II. METHODS AND MATERIAL
Red crab meal (RCM) was provided by CIBNOR (The
Northwest Center for Biological Research), Guaymas
Unit, Sonora, Mexico. Subsequently, the meal was
transported to the City of Mexico to the Department of
Animal Nutrition Dr. Fernando Pérez-Gil Romo at the
National Institute of Medical Sciences and Nutrition
Salvador Zubirán, where it was stored in black plastic
bags and frozen (-20°C) until use.
A. Preparation of diets and test with birds
The procedure for the use of birds was according to The
Technical Specifications for the Production, Care and
use of Laboratory Animals [12].
This test was conducted at the CEIEPAV (Center for
Teaching, Research and Extension in Poultry
Production), in the School of Veterinary Medicine of the
National Autonomous University of Mexico.
The sorghum-soybean meal-based diet and the 4% RCM
diet were formulated to meet the nutrient requirements
of the National Research Council [13] for laying hens
through Nutrion WindowsTM
(Version 5.0 Pro), a
computerized system for feed formulation (Guadalajara,
Jal., Mexico).
Ninety Isa-Brown laying hens (32 wk age, with mean
body weight of 1560 ± 20 g) were selected from 300 hen
flock based on similar weights and production rate.
After a 2-wk of adaptation, the selected hens were
divided into 2 groups of 45 birds each, which consisted
of five replications of nine birds each. The experimental
period lasted 4 wk (34 – 38 wk of age). The treatments
consisted of a control diet (Control) and a diet
containing 4% RCM. Throughout the experimental
periods, feed and water available to allow for ad libitum
consumption. During this period, the productive
parameters (egg production, egg weight, feed conversion
and feed intake) were measured. At the end of 4 weeks,
250 eggs were collected from each treatment group and
stored as follows: day 0 (50 eggs), 15 days at 20°C (50
eggs), 15 days at 4°C (50 eggs), 30 days at 20°C (50
eggs), and 30 days at 4°C (50 eggs).
B. Haugh Units (HU)
For the fresh eggs and the eggs stored at 20°C and 4°C
for 15 and 30 days, the HU were determined using
automated equipment (Technical Service and Supplies,
Inc., England, UK). The system consists of a
microprocessor (QCM+) connected to a digital scale and
a micrometer for measuring albumen height. The QCM+
collects data from online tools and displays a reading,
which is transferred to a computer equipped with egg
quality-assurance software. The HU were calculated
from the albumen height and the egg weight using the
same processor.

International Journal of Scientific Research in Science and Technology (www.ijsrst.com)
66
C. Chemical Analysis
The following analyses were performed on the RCM
according to standardized techniques published by the
Association of Official Analytical Chemists [14]: crude
protein (method 968.06), total ash (method 942.05),
ether extract (method 920.39), minerals (Ca, Na and
Mg) (methods Cap. 4-40), water-soluble vitamins (B1,
B2 and niacin) by high performance liquid
chromatography (HPLC) (methods 970.65 and 942.23),
gross energy of RCM, was determined a total
combustion using an adiabatic bomb calorimeter (Parr
1755, Parr Instrument Company, Moline, Il, USA), and
the amino acid profile by HPLC (hydrolyze the sample
into its component amino acids, and derivative the
amino acids using AccQ-Fluor Reagent) (WatersAcc-
Qtag Manual, Manual No. WAT052874, April 1993).
The pH of the egg samples fulfilling the desired age and
storage conditions was performed using a Hanna
Instrument pH-210 potentiometer, and the egg were
subsequently mixed (yolk and albumen) and lyophilized.
Using the lyophilized egg, analyses of crude protein,
essential amino acids and water-soluble vitamins were
performed according to the techniques described above.
D. Statistical Analysis.
The data of the productive parameters tests were
analyzed using a completely randomized design
(ANOVA), and the differences between means were
tested using Tukey’s test with a confidence level of
95%. The analyses were conducted using SPSS version
11.0 for Windows (SPSS Inc., Chicago IL, USA).
The statistical model was: Yij = μ + τi + Єij, where Yij
= the response variable, μ = the experimental mean, τi =
the effect of the i-th treatment, Єij = the experimental
error.
The data of the physical and chemical analyses of the
water-soluble fraction of the egg were analyzed
according to a 2x2x2 factorial design with the following
factors: treatment, time and temperature. Tukey’s test
was used to perform a pairwise comparison of the means
with a confidence level of 95%, using SPSS version 11.0
for Windows (SPSS Inc., Chicago IL, USA).
The statistical model was: Yijk = μ + αi + βj +ᵞk (αβ)ij +
(αᵞ)ik + (βᵞ)jk +(αβᵞ)ijk + Єijk(l), where Yijk = the
response variable, μ = the experimental mean, αi = the
effect of the i-th diet treatment, βj = the effect of the j-th
time treatment, ᵞk = the effect of the k-th temperature
treatment, (αβ)ij = the effect of the interaction of
treatment and time, (βᵞ)jk = the effect of the interaction
of time and temperature, (αβᵞ)ijk = the interaction of
treatment, time and temperature, Єijk(l) = the
experimental error.
III. RESULT AND DISCUSSION
A. Chemical composition of the red crab meal
(RCM)
The results of the approximate chemical analyses are
presented in Table 1; the most abundant fractions were
crude protein (33.74%), total ash (20.24%) and Mg (9.70
mg/100 g). Due to the high protein content found in this
unconventional raw material, it was important to
evaluate the content of essential amino acids. The
experimental diets were formulated based on the
chemical and amino acid compositions of the meal
(Table 2). TABLE I
Composition of red crab meal
(Pleuroncodes planipes) used in this study
(g/100 g)1 RCM
Moisture 9.13 ± 0.07
Ash 20.24 ± 0.03 Ether extract 7.29 ± 0.01
Crude protein 33.74 ± 0.14
Total carbohydrates 29.58 Gross energy (kcal/100 g) 255.7 ± 0.08
Calcium 7.97 ± 0.05
Sodium 1.18 ± 0.08 Magnesium 9.70 ± 0.96
Amino acid composition g aa/100g protein
Isoleucine 3.98 ± 0.01 Leucine 6.55 ± 0.01
Lysine 10.02 ± 0.02
Methionine 1.55 ± 0.01 Cystine 1.98 ± 0.02
Phenylalanine 4.31 ± 0.02
Tyrosine 4.08 ± 0.03 Threonine 3.55 ± 0.01
Valine 5.35 ± 0.03
Arginine 3.68 ± 0.02 Histidine 6.80 ± 0.02
Alanine 6.35 ± 0.03
Aspartic acid 9.18 ± 0.03
Glutamine 14.55 ± 0.01
Glycine 7.56 ± 0.01
Proline 5.15 ± 0.03 Serine 3.42 ± 0.02
Tryptophan 1.27 ± 0.02 1 The values are the mean
± standard deviation of six samples.

International Journal of Scientific Research in Science and Technology (www.ijsrst.com)
67
TABLE II
Composition of the experimental layer diets
Ingredients (as fed
g/kg)
Control 40 g/kg Red crab
meal
Sorghum 673.957 701.255
Red crab meal 0.000 40.000 Calcium carbonate 107.159 92.204
Soybean meal 182.800 150.932
Calcium phosphate 1821 11.931 9.356
Vegetal oil 10.000 0.000
Salt (NaCl) 3.626 0.290 Premixa 2.500 2.250
L-Lysine HCl 2.426 0.000
DL-Methionine 2.249 1.163 Mycotoxin sequestrant 1.000 1.000
L-Threonine 0.703 0.000
Avelut powderb 0.500 0.500 Choline chloride 60% 0.500 0.500
Bacitracin-zinc 0.300 0.300
Aviredc 0.200 0.000 Antioxidant 0.150 0.000*
Calculated analysis (g/kg diet)
ME (kcal/kg) 2715.1 2715.1
Crude protein 150.0 151.0 Methionine 4.56 3.94
Methionine + cystine 6.90 6.90
Total calcium 41.78 39.81 Available phosphorus 3.40 3.40
Sodium 1.50 1.50
Lysine 8.60 9.84 Threonine 6.20 6.42
Tryptophan 1.91 1.74
a The premix provided the following per kg of diet:
retinyl acetate, 12000 IU; cholecalciferol, 2500 IU;
DL-α-tocopheryl acetate, 30 mg; menadione, 2 mg; thiamine, 2.25 mg; riboflavin, 7.5 mg; pyridoxine, 3.5 mg;
cyanocobalamin, 0.02 mg; D-pantothenic acid, 12.5 mg;
biotin, 0.125 mg; folic acid, 1.5 mg; Zn, 50 mg; Cu, 12 mg; I, 0.3 mg; Fe, 110 mg; Se, 0.1 mg; Mn, 110 mg. b Saponified xanthophylls of Aztec marigold (yellow, 15 ppm). c Red xanthophylls (canthaxanthin, 10 ppm).
* Due to the carotenoids contained.
B. Production variables
No statistically significant differences (P > 0.05) in the
productive parameters measured were found (Table 3).
TABLE III
The effect of dietary supplementation with RCM on the production
performance of laying hens between 34 and 38 weeks of age1.
Number
of
eggs/hen
Egg
weight
(g)
Feed
conversion
ratio
(g feed/g
egg)
Feed
consumption
(g/hen/day)
Control 88.35 ±
6.26
64.20 ±
1.30
2.07 ± 0.11 118.0 ± 2.54
RCM 87.22 ±
7.78
62.5 ±
1.23
2.07 ± 0.15 112.74 ± 4.2
1 The data are means of five replicates of nine hens each with the SD. No significant differences were found.
C. Crude protein content (CP), pH and Haugh
Units (HU) in eggs
Table 4 shows the results of the response of RCM
addition, days and temperature storage on the crude
protein content (CP), pH and HU of the egg. Showing a
significant difference (P < 0.05) in CP, pH and HU
between days and temperatures storage.
With respect to temperature were found significant
difference (P < 0.05) in CP and HU, but not in pH (P <
0.05). For the days of storage, there were differences (P
< 0.05), with CP and HU decreasing and the pH
increasing as storage time went on (P < 0.05).
The effect of temperature and egg storage time on CP,
pH and HU, showing a significant difference (P < 0.05)
for CP between temperatures and not between storage
days. The pH and HU showed differences for either of
the measured variables (P < 0.05).
The effects of diet and egg storage time on CP, pH and
HU showing significant differences for both diet and
storage days (P < 0.05).
TABLE IV
The effect of RCM addition storage days and storage temperature on egg
Crude Protein content, pH and Haugh Units.
Diet
Crude
Protein
content (g/100 g)
pH Haugh
Units
Control 49.2b 8.48a 62.91b
RCM 50.2a 8.53a 64.96a SEM 0.27 0.06 1.56
Temperature
Baseline* 48.8 7.35 76.14
20°C 49.2b 8.44a 56.82b
4°C 50.2ª 8.50ª 71.05ª SEM 0.19 0.04 1.1
Storage days 15 49.8ab 8.73b 60.16b
30 49.2b 9.32ª 52.62c
SEMd 0.27 0.06 1.56
Significance
Diet 0.0002 0.4216 0.0158 Temperature 0.0037 0.0761 0.0001
Storage days 0.0033 0.0001 0.0001
Diet * Temperature 0.1101 0.1907 0.9504 Diet * Storage days 0.0001 0.5193 0.0055
Temperature*Storage
days
0.0100 0.1343 0.0001
Diet *Temperature*
Storage days
0.0515 0.1886 0.9767
a,b,c Means in each column followed by different subscript letters differ
significantly. d Pooled standard error of mean *Baseline (fresh eggs without storing)

International Journal of Scientific Research in Science and Technology (www.ijsrst.com)
68
D. Amino acids and Water-soluble vitamin
There were no significant differences (P > 0.05) on the
content of the studied amino acids or the water-soluble
vitamins (B1, B2 and niacin).
In this study, the value obtained for crude protein
(33.74%) in RCM was lower than the values reported by
Charley [15] for crab meal (47.2%) and by Castro et al.
[5] for red crab (39.9%). The RCM showed a high level
of total ash (20.24%). However, this value is lower than
that reported by other authors (28.9-33%) [16, 17, 18].
This discrepancy can be explained by the environment in
which these crustaceans live, rich in minerals, in
particular Mg, which is an element that is present in high
concentrations in all crustaceans, ranging from 10 to 50
mg/100 g [19]. The value of ether extract (7.29%) was
greater than that reported by [15] of 4.9%. This
variability is likely due to the season of capture and the
fact that this meal was composed of males and females.
Castro et al. [5] reported that females have a higher lipid
content, requiring stored energy for reproduction.
The gross energy obtained in this study was 255.7
kcal/100g, a similar value to that of meat meal (271.5
kcal/100g) that has also been used as an ingredient in
diets for laying hens [16]. Crustaceans obtain their
energy mainly from protein catabolism, so the
metabolism of these organisms is different from land
animals [16].
With respect to the essential amino acids for birds, most
were found in higher quantities compared to those
reported by Toma and Meyers [20]. Additionally,
Quintero [21] published higher values for the amino
acids reported in this study, with the exception of
histidine, valine and lysine. According to the
formulation of diets for birds [13], it was only necessary
to add the amino acids methionine, threonine and lysine
to the control diet, unlike the diet containing RCM,
which is rich in lysine (10.02 g aa/100 g protein) and to
which only methionine was added.
The objective of this study was to determine the effect of
storage conditions on the water-soluble fraction of eggs
from hens fed a standard diet and a diet containing 4%
RCM. The pH has a value of 7.6 on a freshly laid egg
and rises to 8.5 after 24 hours at 20°C, reaching values
of 9 to 9.4 after several days. In this study, the pH
increased as storage time went on (7.35 – 9.32), which is
consistent with the pattern reported by Li -Chan et al.
[22], who found that in a fresh egg (at the time of
laying) the pH ranged from 7.6 to 8.5. The eggs stored
for 15 days at different temperatures showed pH values
between 7.35 and 9.32. These values are similar to those
reported by these authors: the pH after three days of
storage at 3°C was 9.18 and after 21 days was 9.4. The
pH of the egg (mainly of the albumin) is an important
factor in the control of the rheological properties of gels
formed during the heat treatment (80°C). The pH
depends on the balance between the dissolved carbon
dioxide, bicarbonate ions and carbonate ions governed
by the partial pressure of carbon dioxide from the
external environment. The bicarbonate ion concentration
increases as the carbonate concentration decreases [23].
In addition, the pH is related to the action of proteins
and the reactivity of the sulfhydryl groups. As the pH
increases in the egg during storage, the elasticity of the
gel, the penetration force and the viscosity index
decrease [24]. This change increases the fragility of the
yolk by the dispersion of albumin, which could affect
the functional properties of the egg through the
formation of foam.
Both the physical and chemical egg qualities are
important, especially when new ingredients are
incorporated in the formulation of the birds’ diet.
Through various laboratory analyses, the changes
experienced by the samples, both fresh and during
storage, can be assessed, specifically regarding their
physical (egg weight and HU) and chemical (protein,
pH, amino acids and vitamins) characteristics, which
influence their quality and the preference of the
consumer. As reported by Grobas and Mateos [25], the
water-soluble components of egg show little variation
when the ingredients of the bird’s diet are changed;
however, these authors did not consider the changes due
to the storage conditions and time.
In hens, daily consumption of the amino acids needed to
procedure egg protein is more important than the total
amount of protein. The amino acids that are important
for the birds were quantified in RCM. Methionine,
lysine and threonine are considered the limiting amino
acids in poultry diets; in RCM, the lysine content was
greater than that of methionine, such that it was only

International Journal of Scientific Research in Science and Technology (www.ijsrst.com)
69
necessary to add methionine to the diet. Therefore, the
reduction of one of these amino acids negatively affects
the production of albumin in the eggs, decreasing the
size of the egg over time. Egg protein is considered high
quality, and the essential amino acid ratio depends on
the genetic line of the bird. Egg protein has been used as
a reference for other types of food for human
consumption. Therefore, it is important that the bird's
diet contains appropriate levels of essential amino acids
for maintaining biological and commercial egg quality
[26].
The Mexican Norm NMX-FF-079-SCFI-2004
(regarding poultry products, fresh chicken eggs and test
methods specification) [9] states the physical
characteristics and specifications to be met by "classified
fresh chicken eggs" that are produced and/or sold within
the country. In this standard, five categories for fresh
chicken eggs based on the egg weight and size are
recognized and should be applied to all classifications of
consumption (Extra Large = greater than 64 g, Large =
60-64 g, Medium = 55-60 g; Small = 50-55 g, and
Pewee = less than 50 g). According to these categories,
both the control eggs (63.8 g/initially to 60.1 g/20°C and
63 g/4°C) and the RCM eggs (64.2 g/initially to 61.4
g/20°C and 63.2 g/4°C) had weights that were within the
“Large egg weight” category after 30 days in storage.
Likewise, fresh chicken eggs for cooking are classified
in grades according to the following specifications: the
scale of Haugh Units (HU) ranges from 0 to 110. The
interpretation of these units is an aid to determine the
laying time: lower values indicate older eggs. Thus, this
classification is as follows: Mexico Extra = more than
60 HU; Mexico 1 = from 61 to 70 UH; Mexico 2 = from
31 to 60 UH and, out of classification = less than 30 HU.
In general, both the control eggs and the RCM (62.91
and 64.96 HU, respectively) were classified as Mexico 1
(>5.5 mm height and albumin and >70 HU for eggs
freshly laid), decreasing after 15 and 30 days at 4°C to
rank as Large eggs (>4.2 mm and 61-70 HU) and after
30 days at 20°C as Medium eggs (>3.0 mm and 31-60
HU). In this study, a decrease in HU was observed as an
effect of diet, storage time and temperature; this
decrease was most notable for eggs stored for 30 days at
20°C. This change is explained by natural phenomena
that occur in a perishable product that is not consumed at
the laying time. This change can be understood as a
decrease in albumen quality that is reflected in the HU
and manifested by the liquefaction of the dense
albumen, which results in the loss of the internal
structure and the spatial organization of the layers of the
albumen and the yolk. The mechanisms responsible for
this change are complex and not well defined, but all
involve alterations of proteins. The phenomena can be
described as follows [27]: a) partial destruction of the
lysozyme-ovomucin complex due to the deactivation of
lysozymes; b) destruction of the electrostatic bonds
between the amino groups of the lysine residues of the
lysozyme and the carboxyl groups of the sialic acid in
the ovomucin when the pH increases; c) dissociation of
ovomucin subunits, mainly of β, which is favored by the
passage of divalent ions from the albumin to the yolk of
the eggs during storage; d) modification of the structure
of the ovomucin, especially the β subunit, which
changes the type of the lysozyme-ovomucin complex,
due to the increase in pH and; e) partial degradation of
the O-glycosidic bonds, which results in the
solubilization of ovomucin-β and releases hexoses,
hexosamines and sialic acid by an alkaline β-elimination
process.
The above mentioned phenomena are related to the
release of carbon dioxide from the interior of the egg,
which tends to balance its concentration with the partial
pressure of surrounding air, resulting in an increase in
pH. The changes accelerate significantly when the egg is
stored at room temperature. This acceleration occurred
in eggs stored at 20°C for 15 and 30 days; when they
were opened, it was observed that the yolk had moved
from its original position (in the center), shrunk and
flattened, and that the cell membrane (vitelline) broke
easily. All of these changes are associated with
alterations in the proteins present in the albumin [27].
Note that although there were no differences in the
composition of water-soluble vitamins, their values
become important in nutritional labeling [28].
IV. CONCLUSION
We conclude that the productive parameters are not
affected by an addition of 4% RCM to the diets of laying
hens. However, changes were observed in the CP
content, pH and HU due to the chemical and physical
changes that occur in the eggs stored at 20°C for 30
days.

International Journal of Scientific Research in Science and Technology (www.ijsrst.com)
70
V. REFERENCES
[1] Balart EF. 1996. Recurso Langostilla. Red crab as a
resource. Study of the fisheries and aquaculture
potential in Baja California Sur. Casas Valdéz M.,
and Ponce Díaz, G (Eds.) SEMARNAP, Gob. De
BCS, IPN, FAO, UABCS, CIB, CICIMAR,
CETMAR. La Paz, Baja California Sur, México.
Pp. 167-180. (in Spanish).
[2] Aurioles GD and Pérez FR. 1997. Seasonal and
bathymetric changes in feeding habitats of the
benthic red crab Pleuroncodes planipes (Decapoda,
Anomura, Galatheidae) off the pacific coast of Baja
California Sur, México. Crustaceana 70:272:287.
[3] Karnicki ZS. 1981. Posibilities for utilization of
Langostilla (P. planipes) and ways of approach the
problem in Mexico. Fishery Industry Officer,
Rome.
[4] García CF. 1992. The digestive protease of
langostilla (Pleuroncodes planipes, Decapoda):
their partial characterization, and the effect of feed
on their composition. Comp. Biochem. Physiol.
103B: 575-578.
[5] Castro GM, Carrillo D, Pérez-Gil R and Calvo C.
1995. Red crab chemical composition and
technological processes. In: Aureoles-Gamboa, D.,
Balart, E.F. (Eds.). La Langostilla: Biología,
Ecología y Aprovechamiento. Centro de
Investigaciones Biológicas del Noroeste, S.C.
México, Pp. 163-177. (in Spanish).
[6] Carrillo DS, Carranco J, Castillo D, Castro G,
Ávila G and Pérez-Gil R. 2005. Cholesterol and n-3
and n-6 Fatty Acid Content in Eggs from Laying
Hens Fed with Red Crab Meal (Pleuroncodes
planipes). Poult. Sci. 84: 167-172.
[7] Carranco JM, Calvo CC, Carrillo DS, Ramírez P,
Morales B, Sanginés G, Fuente M, Ávila G and
Pérez-Gil R. 2011. Crustacean meal in laying hen
rations. Effect on productive variables and sensory
evaluation of eggs stored in different conditions.
Cuban J. Agric. Sci. 45: 171-175.
[8] INA. 2015. Instituto Nacional Avícola. (online).
Retrieved April 27, 2015. Available at:
[9] NMX. 2004. NMX-FF-079-SCFI-2004. Mexican
Norm for Poultry Products. Fresh Egg chicken.
Specifications and Testing Methods. Secretaría de
Economía, México. (in Spanish).
[10] Ahn DU, Sell J, Chamruspollet M and Jeffrey M.
1999. Effect of dietary conjugated linolenic acid on
the quality characteristics of chicken eggs during
refrigerated storage. Poult. Sci. 78: 922-928.
[11] Guerra M. 2000. Factors affecting egg quality.
Agricultura, 4: 38-40. (in Spanish).
[12] NOM 1999., NORMA Oficial Mexicana NOM-
062-ZOO-1999. Technical specifications for the
production, care and use of laboratory animals.
Secretariat of Agriculture, Livestock, Rural
Development, Fisheries and Food, Mexico. (in
Spanish).
[13] NRC. 1994. Nutrient Requirements of Poultry. 9th
revision ed. National Academy Press. Washington
D.C.
[14] AOAC. 2000. Official Methods of Analytical
Chemist, 15th ed. Association of Official
Analytical Chemists. Arlington, VA, USA.
[15] Charley H. 2004. Tecnología de Alimentos. Food
Technology. Chemical and physical processes in
food preparation. Limusa, México, pp 435-473. (in
Spanish).
[16] FAO. 1987. The Nutrition and Feeding of farmed
fish and shrimp. A training manual. 1. The essential
nutrients. Food Agriculture Organization. Brasilia,
Brazil, Pp 132.
[17] Cruz-Suárez LE, Ricque-Marie D, Martínez-Vega
JA and Wesche-Eveling P. 1993. Evaluation of two
shrimp by-product meals as protein sources in diets
for Penaeus vannamei. Aquaculture 115: 53-62.
[18] Andrade DR, Torres GR, Montes MEJ, Chávez
BMM and Naar OV. 2007. Development of a
seasoning made from flour of farmed shrimp heads
(Penaeus sp.). Rev. Fac. de Química Farmacéutica,
Colombia 14: 109-113. (in Spanish).
[19] Caeiro MJR. 2004. Basic operations in production
of canned fish and seafood. 1ª. Ed. Editorial Vigo.
200 pp. (in Spanish).
[20] Toma RB and Meyers S. 1975. Isolation and
chemical evaluation of protein from shrimp
cannery effluent. J. Agric. Food Chem. 23: 632-
635.
[21] Quintero HE. 2009. Ingredients for aquaculture
feeds - Part I. American Soybean Association, Pp.
63. (in Spanish).
[22] Li-Chan EC, Powrie D and Nakai S. 1995. The
chemistry of eggs and egg products. In: Stadelman,

International Journal of Scientific Research in Science and Technology (www.ijsrst.com)
71
Cotterill OJ (Eds). Egg Science and Technology.
4th ed. Food Products Press, New York, Pp 591.
[23] Glenn WF. 2008. Egg products industry and future
perspectives. In: Yoshinori, M. (ed) Egg bioscience
and biotechnology. pp. 307-325 (New Jersey, USA,
Wiley Inter-Science).
[24] Croguennec T, Nau F and Brulé G. 2002. Influence
of pH and Salts on Egg White Gelation. J. Food
Sci. 67: 608-614.
[25] Grobas S and Mateos G. 1996. Influence of feeding
on the nutritional composition of the egg. XII
Curso de Especialización FEDNA. Madrid, España,
Pp 27. (in Spanish).
[26] Grobas S, Mateos GG and Martínez J. 1999.
Influence of dietary linolenic acid in production
and weight of eggs and egg components in Young
Brown hens. J. Appl. Poultry Res., 8: 177-184.
[27] Yoshinory M and D’Silva I. 2008. Bioactive
components in egg White. In: Yoshinori, M. (ed)
Egg bioscience and biotechnology. pp. 141-184.
(New Jersey, Wiley Inter-Science).
[28] Naber EC and Squires M. 1993. Vitamin profiles of
eggs as indicators of nutritional status in the laying
hen: diet to egg transfer and commercial flock
survey. Poult. Sci. 72: 1046-1053.

IJSRST162384 | Received : 18 June 2016 | Accepted : 20 July 2016 | July-August 2016 [(2)4: 72-82 ]
© 2016 IJSRST | Volume 2 | Issue 4 | Print ISSN: 2395-6011 | Online ISSN: 2395-602X Themed Section: Science and Technology
72
Measurements of Radon Concentrations and Dose Assessments in Chemistry Department-Science College- Al-
Mustansiriyah University, Baghdad, Iraq
Iman Tarik Al-Alawy *1, Haider Rayed Fadhil 2 *
1Physics Department, College of Science, Al-Mustansiriyah University/Baghdad, Iraq
2Ministry of Science and Technology, City, Baghdad, Iraq
ABSTRACT
Measurements of radon gas concentrations with their progeny and the annual effective dose indoor the building of
Al-Mustansiriyah University College of Science-Chemistry Department have been carried out by using time-
integrated passive radon dosimeters solid state nuclear track detector CR-39 technique. The detectors with 1cm
x1cm have been distributed over 58 places and suspended for sitting (1m) and standing (1.75m) positions in each
location under study. The dosimetric measurements are made over a period of 100 days from 30 January 2014 to 10
May 2014. The calibration process has been done using radium-226 source with known activity radiation. It has
found that the indoor radon gas concentrations varying from 35.220±5.935Bg/m3 to 71.673±8.466Bg/m
3 with an
average value 49.129±6.969Bg/m3
at 1m, and varying from 31.794±5.639Bg/m3 to 68.246±8.261Bg/m
3 with an
average value 45.487±6.696Bg/m3 at 1.75m which are within the worldwide limits 148Bg/m
3 (EPA, 2003) and 200-
300Bg/m3 (ICRP, 2009). The annual effective dose of the inhalation exposure to radon gas has been estimated and
this vary from 0.370mSv/y to 0.753mSv/y with an average value 0.516mSv/y at 1m, and varying from 0.334mSv/y
to 0.717mSv/y with an average value 0.478mSv/y at 1.75m which are within the worldwide permissible limits 3-
10mSv/y (ICRP, 1993). The potential alpha energy concentration found to vary from 3.808mWL to 7.748mWL with
an average value 5.311mWL at 1m and vary from 3.437mWL to 7.378mWL with an average value 4.918mWL at
1.75m which are less than the recommended value 53.33mWL (UNSCEAR, 1993). The lung cancer cases per
million person per year vary from 6.664 to 13.562per million person per year with an average value 9.296per
million person per year at 1m and vary from 6.016 to 12.913per million person per year with an average value
8.607per million person per year which are less than the recommended range 170-230 per million person per year
(ICRP, 1993). The number of decays per-minute using swabs measurements technique have been used for selected
units within two swabs from building materials walls for each unite, with area of 100cm2 using Ludlum 3030, the
average of three swabs measurements have been calculated. Hence, the effectiveness of emitted alpha particles from
the walls has been calculated to be varied from 0.00556 to 0.02222Bq/cm2 with an average value 0.01154Bq/cm
2 at
1m and 0.00000Bq/cm2 to 0.01667Bq/cm
2 with an average value 0.00983Bq/cm
2 at 1.75m respectively which is
within the permissible limit 0.04Bq/cm2 (Danial, 2010).
Keywords: Indoor Radon gas; Natural radioactivity; CR-39 detector; Annual effective dose; Ludlum 3030
I. INTRODUCTION
Radon was the fifth radioactive natural element being
found as a noble gas, which was discovered by the
German Physicist Friedrich Ernst Dron in (1900), who
called it Niton. It has been called radon since (1923).
Its atomic number is 86 and mass number is 222 in the
periodic table [1, 2]. Radon is a gas that comes from the
radioactive decay of either uranium-235 and 238 or
thorium-232. All of the gaseous radon members of the
three primordial series headed by U-235, U-238, and Th-
232 which are common naturally occurring are
radioactive alpha particle emitters [3]. The decay of
radon, with uranium-238, goes through four inter-

International Journal of Scientific Research in Science and Technology (www.ijsrst.com)
73
mediate states to form radium-226 which has a half-life
1600 years. Radium-226 then decay to form radon-222
gas. Radon's half-life is 3.82 days, which provides
sufficient time for it diffuse through soil and into homes,
where it further disintegrates to produce the more
radiologically active radon progeny (radon daughters)
[2]. The name radon is Rn-222 isotope in order to
distinguish it from other two natural isotopes; called
thoron Rn-220 (alpha emitter of 55.6s half Life) and
action Rn-219 (alpha emitter of 3.96 s half-Life) because
they originate in the thorium and actinium series,
respectively. Because of these properties the
measurements of the alpha dose delivered from action
Rn-219 and thoron Rn-220 would be the primary
concern but so far these situations have been rare [2].
Because Rn-222 gas moves freely in the indoor
environment, it becomes a human health hazard. If its
concentration in indoor air becomes high, radon and its
decay products can be inhaled and cause lung cancer.
Many previous studies of indoor radon concentration
have been performed with widely used of solid state
nuclear track detectors (SSNTDs) [4, 5, 6, 7, 8, 9, and
10]. However, in this work the indoor radon gas
concentrations using CR-39 detectors have been
measured in the department of chemistry in college of
science of Al-Mustansiriyah University, at which a
radioactive sources are usually used in their laboratories.
II. METHODS AND MATERIAL
A. Area of the Study
Baghdad city is located in the Middle of Iraq and it is the
capital of the Republic of Iraq. Its location of latitude
33.316666 and longitude 44.416668 it is located about
34meters above sea level, with a total area nearly of
204.2 km2 and a population nearly of
7665292inhabitants, see Fig. 1 Baghdad city has a
desert climate characterized by extreme heat during the
day, an abrupt drop in temperature at night, and slight,
erratic rainfall. The temperature is moderate at 12 in
winter and 33 in summer. Its lands are flat and
levelled in areas linked to waters from the Tiger River.
AL- Mustansiriyah University is located in the Southern
of Baghdad City, see Fig. 2. The science college and
their buildings are shown in Fig. 3. The three figures are
taken from Google earth.
B. Measurement Technique
Radon concentrations are measured using 68 plastic
cups (i.e. dosimeters) prepared with solid state nuclear
track detectors CR-39 of 500µm thick, density 1.36
gm/cm3, UK issued, and 1x1 cm
2 area are distributed
inside the rooms and laboratories of department of
chemistry. 34 detectors of 68 are suspended at 1m and
the others are suspended at 1.75m. Each dosimeter is to
be made of a plastic cup of height 4.5cm, the diameter of
the bottom is 3cm and that of the top is 4.5cm, with a
circular hole of diameter 1cm in the centre, Fig. 4a
shows the typical CR-39 track detectors. The hole is
covered by a piece of sponge sealed into the interior
surface of the lid. The detector CR-39 is fixed in the
bottom of the dosimeter as shown in Fig. 4b. The
detectors are left for a period of three months from 30
January 2014 to 30 April 2014. The exposed detectors
are collected from different locations and etched
chemically in 6.5M NaOH solution at 60oc for 6 hours.
The chemical etching process to the CR-39 detectors has
been done in order to show the alpha-particles tracks
from 222
Rn. Optical microscope with magnification of
400X by an objective (4x, 10x, 40x and 100x) and two
eye pieces (10x) with digital video camera of 5MB
resolution and connected with a personal computer to
show and counting the alpha damage tracks formed on
the detectors.

International Journal of Scientific Research in Science and Technology (www.ijsrst.com)
74
C. Ludlum3030
The Ludlum3030 alpha-beta counter is powered by main
supply of AC voltage. The instrument features a built-in
detector, ZnS (Ag) adhered to plastic scintillation
material, tube 5.1cm (2inch) diameter, magnetically
shielding photomultiplier, window 0.4mg/cm2
aluminized molar, active and open area 20.3cm2,
efficiency alpha 32% 230
Th, 39% 238
U, 37 % 239
Pu, high-
voltage power supply, adjustable count time periods, and
a click-per-event audio with adjustable volume. A pulse
height analyser is employed to provide information to
the two independent counters. Filter paper for
qualitative analysis made in Germany by diameter 4.5cm,
used to take samples from the walls of the chemistry
department building of the college of science.
D. Chemical Etching
For the preparation of etching solution, the weight of
(NaOH) has been calculated as follows [11]:
(1)
Where: is the weight of NaOH needed to prepare for
a given normality. is the equivalent weight of
NaOH (i.e. the summation of the atomic weight of Na, O
and H). i.e. 22.98977 + 15.9994 + 1.00794 =
39.99711= 40. N is the normality =6.25. is the
volume of distilled water (1 liter). 40×6.25×1=
250 gm of NaOH in 1 liter of distilled water.
E. Microscopic Viewing
After etching and drying process the detectors have a
viewing by optical microscope so as to get on the alpha
particles tracks by selecting right zoom (the ability of
magnification is equal to 1000 related to objective lens
and camera with magnification 100 and 10 respectively)
and to count the tracks per unit area. Especially glass
slide have been used to calibrate the dimensions of
pictures. The camera has been connected with a
microscope to photograph promised tracks. The camera
is connected with the computer to show pictures effects
on a computer screen. The calibration of software have
been done to calculates the area of field view on a glass
slide in front of the lens object-oriented and to calculate
the length and width of the picture, then calculate the
area and divides the average number of tracks ( ) for
the (sample X) calculated on the area of field view per
unit mm2 ( ) to get the track density. Ten attempts
(pictures) have been taken for each sample, otherwise to
calculate the average number of tracks obtained for each
sample. The track density has been calculated by
using the following equation [12, 13]:
(2)
F. Calibration of CR-39 Detector
The calibration of CR-39 detector has been carried out
by using the standard source of radium 226
Ra with
radioactivity ( =0.1μCi=37000Bq) at manufacturing
data 1-03-1982, which emits radon gas 222
Rn. After
correction the activity to =36481.13Bq at 30-09-2013
and dose rate at 1cm is 63.611μSv/hr using Rad Pro
software. The CR-39 detector and the standard source of
radium 226
Ra were placed at the special container used in
the present work with a cylindrical shape and volume
0.11m3 diameter 40cm and height 85cm as shown in Fig.
4c.

International Journal of Scientific Research in Science and Technology (www.ijsrst.com)
75
The activity of radon gas ( ) inside the container
at any time can be calculated by using the following
equation [14]:
(3)
Where: t1/2(222
Rn) =3.8253 day. 36481.1Bq
is the activity of radium-226 as a standard source.
is the decay constant of radon-222=0.1812 day-1
.
is the exposure time in day. The exposure time of
detectors was with different times (0.25, 0.5, 0.7, and 1
day), then the radon exposure determined by [15]:
[
]
(4)
Where is the radon gas exposure (i.e. concentration)
in standard source. is the radioactivity of 222
Rn
calculated by Eq. (3). is the container volume in m3; t
is the exposure time in day. Fig. 5 shows the relation
between the track density ( ) and the radon exposure
( ).
(5)
Where is the track density of standard source
(tracks/mm2). is the radon exposure of standard
source (Bq/m3).days = (Bq/m
3) by multiplying with
(0.25, 0.5, 0.75, and 1 day).
G. Calculation of Radon Exposure
After microscopic viewing process has been done to
calculate the track density. Radon gas 222
Rn
concentration indoor has been measured by comparison
between track densities on the detector around the
unknown sample and that of the standard calibration
source, from the following relation [15]:
(6)
i.e. . Where is the radon gas
exposure in unknown sample (Bq/m3.day). is the
track density of unknown sample(tracks/mm2).
Therefore, from the , can be
estimated as:
(7)
H. Determination of Radon Concentration
Radon concentration in surrounding air is measured in
terms of Bq/m3, since the most regulate reference levels
are specified in this unit. Determinations of radon
concentration indoor buildings of the Department of
Physics-College of Science are carried out by the
following equation [16, 17]:
( )
(
) (8)
Where is the track density (number of track /mm2) of
distributed detectors. is the exposure time (days) of
distributed detectors. Comparable method is also
obtained for track detectors techniques to determine the
calibration constant (factor). This is obtained by dividing

International Journal of Scientific Research in Science and Technology (www.ijsrst.com)
76
the track density by the total exposure of radon source.
Then Eq. (8) of radon exposure becomes [18, 19]:
(
)
(9)
Since
( )
(10)
Where the slope is the calibration factor in terms of
(track.mm-2
/ Bq.day.m3).
I. Dose Assessment Indoor Radon
A. The annual effective dose
The annual effective dose, due to radon inhalation,
which corresponds to the values of indoor air radon
concentrations, was calculated according to the
following expression [20]:
(11)
Where is the average indoor air radon concentration,
in Bq/m3. is the indoor equilibrium factor between
radon and its progeny (=0.4) (Wahl, 2007) [20]. is the
exposure time to this concentration, in hours, and 9nSv
(Bq.h.m3)
-1 is the dose conversion factor.
B. Potential Alpha Energy Concentration
The Potential Alpha Energy Concentration (PAEC) in
terms of (WL) units was obtained using the relation [8,
21]:
(12)
C. Lung Cancer Cases per Year per Million Person
The lung cancer cases per year per million people
(CPPP), was obtained using the relation [4, 21, 22]:
(13)
Where 18x10-6
mSv-1
.y is conversion factor.
D. Alpha particles emitted of surfaces
Specific activities of various radionuclides,
disintegrations per minute per 100 square centimetres
(dpm/100 cm2) used to measure alpha emitted of
surfaces of an object, such as concrete or metal [23].
(14)
Where (dpm) is equal to (Bq/60). Table 1 tabulated the
location name and the cods at 1m and 1.75m in the
department of chemistry laboratories building. While
Fig. 6 shows the block diagram for the chemistry
department laboratories building.

International Journal of Scientific Research in Science and Technology (www.ijsrst.com)
77
III. RESULT AND DISCUSSION
Radon exposure for such long time is necessary in order
to obtain relatively a good number of tracks and to be
counting statistically. The calibration factor used for
conversion of track density (track/mm2.day) to radon
concentrations in (Bq/m3) is 0.12423track.mm
-2 per
Bq.day.m-3
. The background has been calculated by
calculating and subtracting from the track density of
each track detector which was exposure to a period of
measurement. The radiological risk associated with
indoor radon exposure and relevant regulation has been
evaluated. Regulations vary greatly between countries.
The United States of America (USA) use a reference
level of 148Bq/m3
for dwellings and 400Bq/m3 for
workplaces (USEPA, 2004) [24]. The European Union
(EU) accepts the recommended action level, the
radiation level above which preventive action must be
taken, included in the International Commission on
Radiological Protection (ICRP, 1965) [25] of between
500 and 1500Bq/m3 given by Kavasi et al., 2006 [26],
and ICRP, 2009 [27] has identified the limit of radon
concentration for the population to be (200-300 Bq/m3)
(ICRP, 2009) [27]. In the United Kingdom (UK) the
Health and Safety Executive (HSE) given by Kendall et
al., 2005 [28] has adopted a radon action level of
400Bq/m3 for workplaces. Also the limit is populated to
be (148Bq/m3) in Environmental Protection Agency
(EPA) (EPA, 2003) [29]. In Hangary the action level for
workplaces is 1000Bq/m3
(Kendall et al., 2005) [28].
While Israel uses a reference level between 40 and
200Bq/m3 (Akerblom, 1999) [30]. There are no specific
regulations in Iraq for indoor radon levels in either
dwellings or workplaces. Department of Chemistry
Building consists of several unites including laboratories
preliminary studies and laboratories graduate addition to
the private rooms of the masters. Among 68 suspended
detectors, 6 have been lost. The results of the
measurements at 1m and 1.75m for the department of
chemistry are as follows:
A. Measurements at 1 meter for Department of
Chemistry
Figs. 7, 8, 9, and 10 show the measured radon
concentrations, the annual effective dose, potential alpha
energy concentrations, and the lung cancer per year
million person for different locations in the building of
department of chemistry at 1m. The minimum radon
concentration is recorded at location (Ch16a1),
inorganic chemistry laboratory lab A4, with a value
35.220±5.934Bq/m3, and the maximum value of radon
concentration recorded at location (Ch3a1), teaching
staff room no.1, with a value of 71.672±8.465Bq/m3,
with an average value 49.129±7.009Bq/m3. The results
are less than the limits (200-300Bq/m3) (ICRP, 2009)
[27], and (148Bq/m3) (EPA, 2003) [29]. The
measurements of radon concentrations from 30Bq/m3 to
40Bq/m3 are at locations: Ch16a1=35.219,
Ch17a1=37.823, Ch21a1=39.741, Ch22a1=35.904,
Ch23a1=37,412, Ch24a1=36.589 and
Ch26a1=35.356Bq/m3. The measurements of radon
concentrations from 40Bq/m3 to 50Bq/ m
3 are at
locations: Ch1a1=41.523, Ch8a1=41.797,
Ch10a1=46.868, Ch11a1=46.045, Ch13a1=44.264,
Ch14a1=47.553, Ch17a1=47.964 and Ch20=40.975. The
measurements of radon concentrations from 50Bq/m3 to
60Bq/m3 are at locations: Ch4a1=59.612, Ch5a1=57.694,
Ch6a1=57.009, Ch9a1=53.583, Ch18a1=57.968,
Ch19a1=54.697. The measurements of radon
concentrations from 60Bq/m3 to 70Bq/ m
3 are at
locations: Ch2a1=63.038, Ch7a1=61.257,
Ch12a1=65.368 and Ch25a1=60.435. The measurements
of radon concentrations from 70Bq/m3 to 80Bq/m
3 are at
location: Ch3a1=71.672. The values of the indoor
annual effective dose vary from 0.370mSv/y in (Ch16a1)
to 0.753mSv/y in (Ch3a1) with an average value
0.516mSv/y which is less than the lower limit of the
admissible range 3-10mSv/y (ICRP, 1993)[31]. The
values of the potential alpha energy concentration were
found to vary from 3.808mWL in (Ch16a1) to
7.748mWL in (Ch3a1) with an average value
5.311mWL which is less than the admissible value 53.33
mWL given by UNSCEAR, 1993 [3]. The values of
lung cancer cases per million person per year vary from
6.664 in (Ch16a1) to 13.565 in (Ch3a1) with an average
value 9.296 per million person which is less than the
lower limit of the admissible range 170- 230 per million
person per year (ICRP, 1993) [31].
B. The measurements at 1.75 meter for Department
of Chemistry
Figs. 11, 12, 13 and 14 show the measured radon
concentrations, the annual effective dose, potential alpha
energy concentrations, and the lung cancer per million
* *

International Journal of Scientific Research in Science and Technology (www.ijsrst.com)
78
person per year for different locations in the department
of chemistry building at 1.75m. The minimum radon
concentration is recorded at location (Ch17a2),
inorganic chemistry laboratory for higher studies A4,
with a value (31.793±5.638Bq/m3), and the maximum
radon concentration recorded at location (Ch3a2),
teaching staff room no.1, with a value of
68.246±2.46Bq/m3, with an average value
45.487±6.768Bq/m3. All results are within the
worldwide limits 200-300Bq/m3(ICRP,2009)[27], and
148Bq/m3(EPA,2003)[29]. The measurement radon
concentrations from 30Bq/m3 to 40Bq/ m
3 are at
locations: Ch10a2=33.163, Ch11a2=33.026,
Ch13a2=36.864, Ch14a2=35.904, Ch16a2=32,204,
Ch17a2=31.793, Ch20a2=35.356, Ch21a2=37.960,
Ch22a2=35.356, Ch23a2=36.864 and
Ch26a2=36.041Bq/m3. While the measurement radon
concentrations from 40Bq/m3 to 50Bq/ m
3 are at
locations: Ch1a2=45.634, Ch5a2=43.442,
Ch9aa2=49.197, Ch15a2=44.127, Ch19a2=47.964, and
Ch24a2=41.386Bq/m3; and the measurement radon
concentrations from 50Bq/m3 to 60Bq/ m
3 are at
locations: Ch2a2=55.090, Ch4a2=53.171,
Ch7a2=53.034, and Ch25a2=55.364Bq/m3. Then the
measurement radon concentrations from 60Bq/m3 to
70Bq/ m3 are at locations: Ch3a2=68.246,
Ch6a2=67.698, Ch12a1=67.013Bq/m3. Fig. 15 shows
the radon concentrations at 1m and 1.75m for different
locations in the laboratories building of the chemistry
department. The minimum value recorded at location
(Ch17a2) with a value of 31.793±5.638Bq/m3
and the
maximum value recorded at location (Ch3a1) with a
value 71.673±8.466Bq/m3. All results are within
acceptable limits 200-300Bq/m3(ICRP, 2009) [27], and
148Bq/m3(EPA, 2003) [29]. The indoor annual effective
dose varies from 0.334mSv/y in (Ch17a2) to
0.717mSv/y in (Ch3a2) with an average value
0.478mSv/y which is less than the lower limit of the
admissible range 3-10mSv/y (ICRP, 1993) [31]. The
potential alpha energy concentration were found to vary
from 3.437mWL in (Ch17a2) to 7.378mWL in (Ch3a2)
with an average value 4.918mWL which is less than the
admissible value 53.33mWL given by UNSCEAR, 1993
[3]. The lung cancer cases per million person per year
vary from 6.016 in (Ch17a2) to 12.913 in (Ch3a2) with
an average value 8.607 per million person per year
which is less than the lower limit of the admissible range
(170-230) per million person per year (ICRP,1993) [31].
C. Measurements of the Alpha particles emitted from
wall surfaces
For this process, we need to use a filter paper which has
specifically designed to take swabs from the surface of
the walls inside rooms, since the walls consisting of
building materials. The swabs have been taken from 52
swabs from the wall surfaces with squared area (10x10)
cm2 by scanning all this area with a filter paper. The
measurements have been done by insert the filter in the
Ludlum3030 device for a period of one minute. This
procedure will be repeated three times for each filter
respectively, to take the average value then using Eq.
(14) to calculate the emitted alpha particles. Fig. 16
shows the results of measurements of alpha particles
emitted from the wall surfaces in the chemistry
department building by using Ludlum3030. The
minimum value is 0.000Bq/cm2 recorded at locations
(Ch5a2, and Ch17a2), laboratory of spectra2 G-Lab A1,
and inorganic chemistry laboratory for higher students
A4 respectively. The maximum value 0.02222Bq/cm2
recorded at location Ch12a1 (the laboratory of organic
chemistry) and Ch25a1 (the laboratory of biochemistry
preparation room) respectively. The average value is
0.01154Bq/cm2 for sitting position and
0.00983Bq/m2for standing position. Therefore, all
results are lower than the recommended limit 0.04
Bq/cm2 given by Daniel, 2011 [32].
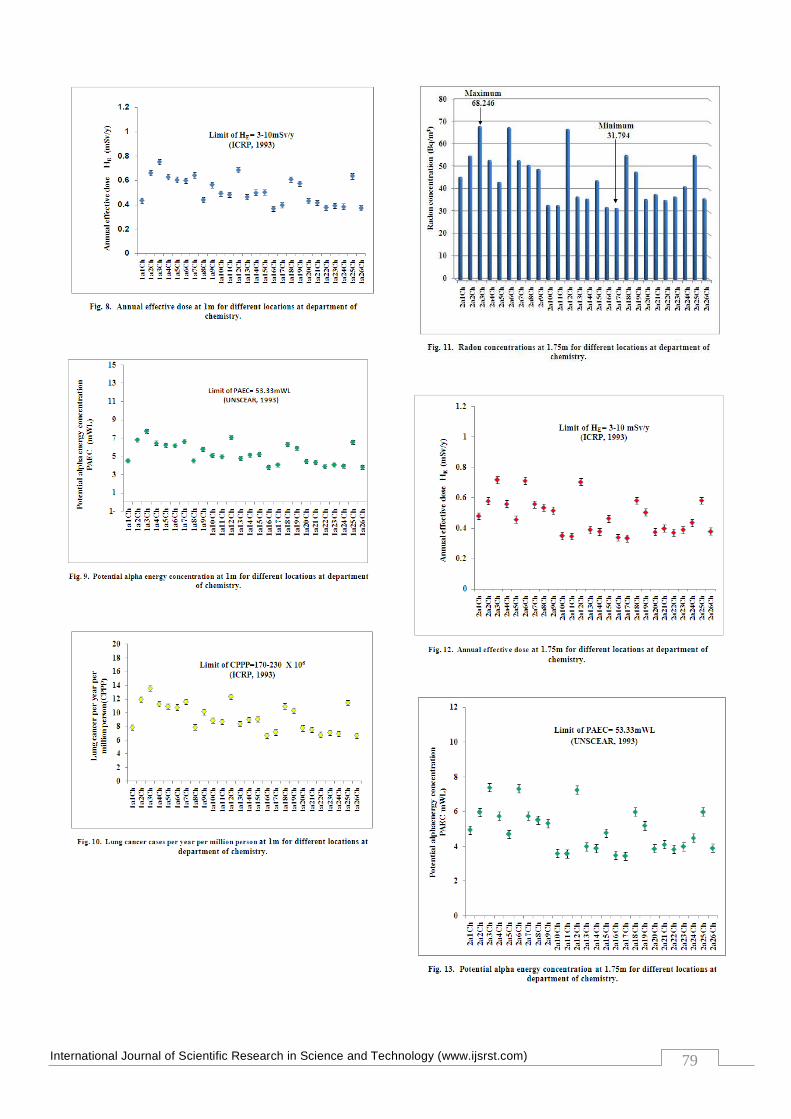
International Journal of Scientific Research in Science and Technology (www.ijsrst.com)
79

International Journal of Scientific Research in Science and Technology (www.ijsrst.com)
80
IV. CONCLUSION
The maximum recorded value of higher radon
concentrations in the laboratory building of Chemistry
Department is 71.673±8.466Bq/m3 in (Ch12a2) the
laboratory of organic chemistry, and the minimum value
is 31.794±5.639Bq/m3
in (Ch17a2) the at inorganic
chemistry laboratory for higher students A4 for standing
position respectively. Both results are lower than the
recommended worldwide (200-300Bq/m3) (ICRP, 2009),
and (148Bq/m3) (EPA, 2003). The maximum indoor
annual effective dose, potential alpha energy
concentration, and lung cancer cases per million person
per year are 0.704mSv/y, 7.245mWL, and 12.680 in
(Ch12a2) the laboratory of organic chemistry for sitting
position respectively. While the minimum values are
0.334mSv/y, 3.437mWL, and 6.016 in (Ch17a2) the
inorganic chemistry laboratory for higher students A4
for standing position respectively. Which are less than
the lower limit of the admissible limit range 3-10mSv/y
(ICRP, 1993), 53.33mWL given by (UNSCEAR, 1993),
and the admissible limit range 170- 230 per million per
person per year (ICRP, 1993). The maximum measured
alpha particles emitted values from the wall surfaces are
0.02222Bq/cm2 at (Ch12a1, and Ch25a1) laboratory of
organic chemistry and laboratory of biochemistry
preparation room respectively for sitting position. The
results are lower than the recommended worldwide limit
(0.04Bq/cm2). All results are within the worldwide
acceptable limits and there are no health risks.
V. REFERENCES
[1] UNSCEAR, (2000), United Nations Scientific
Committee on the Effects of Atomic Radiation,
Sources and Effects of Ionizing Radiation, Report
to the General Assembly with scientific Annex
E: Occupational Radiation Exposures. Sources
to Effects Assessment for Radon in Homes and
Workplaces. New York, United Nations, 2000.
[2] H. Cember and T. E., (2009), Johnson,
Introduction to Health Physics, (4th edition) New
York: Mc Graw-Hill Companies.
[3] UNSCEAR, (1993), United Nations Scientific
Committee on the Effect of Atomic Radiation.
Sources and Effects of Ionizing Radiation, Report
to the General Assembly with Scientific Annexes
A and B: Exposures from natural sources of
radiation; Exposures from man-made sources of
radiation, New York,1993.
[4] H. H. Mansour, (2005), Measurement of Indoor
Radon Level in Arbil Capital by Using Solid State
Nuclear Track Detectors, Radiation
Measurements, 40, pp.544-547.
[5] K. N. Yu, D. Nikezic, F. M. F. Ng and J.K.C.
Leung, (2005), Leung, Long – Term

International Journal of Scientific Research in Science and Technology (www.ijsrst.com)
81
Measurements of Radon Progeny Concentrations
with Solid StateNuclear Track Detectors,
Radiation Measurements, 40, pp.560-568.
[6] K.M. Abumurad and R. A. Al-Omari, (2008),
Indoor Radon Levels in Irbid and Health Risks
from Internal Dose, Radiation Measurements, 43,
pp.S389-S391.
[7] R., Shweikani, (2012), Variatio of Radon
Exposure in Damasus Dwelling, Applies
Radiation and Isotopes, 70, pp.785-789.
[8] S. Kansal, R. Mehra and N. P. Singh, (2012),
Life Time Fatality Risk Assessment Due to
Variation of Indoor Radon Concentration in
Dwellings in Western Haryana, India, Applied
Radiation and Isotopes, 70(7), pp.1110-1112.
[9] S.S. Al-Ghamdi, (2014), Seasonal and Location
Dependence of Indoor and Soil Radon
Concentrations in Two Villages Najran Region,
Saudi Arabia, Radiation Measurements, 69,
pp.12-17.
[10] A. Sakoda, O. Meisenberg and J. Tschiersch,
(2015), Behavior of Radon Progeny Produced
in a Scintillation Cell in the Flow – Through
Condition, Radiation Measurements, 77, pp.41-
45.
[11] A. D. Saeed and I. Radomir, (1997), Radon
Measurements by Etched Track Detectors:
Applications in Radiation Protection, Earth
Sciences and the Environment, Published by
World Scientific Publishing Co.Inc , May 1997.
Edited by: A. D. Saeed, (University of
Birmingham, England) and I. Radomir,
(University of Ljubljana and University of
Maribor, Slovenia, 1997).
[12] O. Amalds, N. H. Custball and G. A. Nielsen,
(1989), Cs-137 in Montarq Soils, Health Physics,
57(6), pp.955-958.
[13] E. H. EL-Araby, (2013), Environmental Air
Dosimetry in Some Locations of Jazan Using
Passive Track Detectors, Life Sciences and
Technologies, 1(1), pp.75-78.
[14] F. Michael, (2007), Radioactivity: Introduction
and History, 1st edition, Elsevier.
[15] J. Chen, NM. Rahman and IA. Atiya, (2010),
Radon Exhalation from Building Materials for
Decorative Use, Environmental Radioactivity,
101(4), pp.317-322.
[16] A. B. Tanner, (1980), Radon Migration in the
Ground: a Supplementary Review. In Gessell,
TF, and Lowder, WM, (eds.), Natural Radiation
Environment III. Report No. CONF - 780422,
Springfield, VA: National Technical Information
Service, 1980, pp.5-56.
[17] M. Al-Kofahi, B. Khader, A. Lehlooh, M. Kullab,
K. Abumurad and B. Al-Bataina, (1992),
Measurement of Radon 222 in Jordanian
Dwellings, Nuclear Tracks Radiation
Measurements, 20, pp.377-382.
[18] J. Wiegand, (2001), A Guideline for the
Evaluation of the Soil Radon Potential Based on
Geogenic and Anthropogenic Parameters,
Environmental Geology, 40, pp.949-963.
[19] M. Rasas, (2003), Measurement of Radon and Its
Daughter's Concentrations in Indoor and Outdoor
Throughout Gaza Strip", M.Sc. Thesis. Islamic
University of Gaza.
[20] W. Wahl, (2007), Radionuclide Handbook for
Laborator Workers: in Spectrometry, Radiation
Protection and Medicine, ISuS, Germany.
[21] A. H. Ismail and M. S. Jaafar, (2010), Indoor
Radon Concentration and Its Health Risks in
Selected Locations in Iraqi Kurdistan Using CR-
39 NTDs. The 4th International Conference on
Bioinformatics and Biomedical Engineering
(ICBBE 2010). 18-20 June 2010. Cheengdu-
Chaina.
[22] A. A. Abdullah, (2013), Internal and External
Radiation Exposure Evaluation amongst Selected
Workers and Locations in Iraq". Ph.D. Thesis,
University Sains Malaysia,Malaysia.
[23] OSA, Office for Research Safety, (2010),
Radiation Safety Handbook. Radiation Worker
Registratio and Personnel Dosimetry. Dose and
Exposure, Dose Equivalent. Northwestern
University.
[24] USEPA, US EPA, Environments Division
(6609J), (2004), A Citizen’s Guide to Radon: The
Guide to Protecting Yourself and Your Family
from Radon (Washington, DC 20460 US EPA
402-K-02-006, 2004.
[25] ICRP, (1965), International Commission on
Radiological Protection. Recommendations of the
International Commission on Radiological
Protection, Annals of the ICRP/ICRP Publication,
9, pp.1-27.

International Journal of Scientific Research in Science and Technology (www.ijsrst.com)
82
[26] N. Kavasi, T. Kovacs, C. Nemeth, T. Szabo, Z.
Gorjanacz, A. Varhegyi, J. Hakl and J. Somlai,
(2006), Difficulties in Radon Measurements at
Workplaces, Radiation Measurements, 41,
pp.229-234.
[27] ICRP, (2009), International Commission on
Radiological Protection, International
Commission on Radiological Protection Statement
on Radon. ICRP, Ref.00/902/09,2009.
[28] G.M. Kendall, B.M.R. Green, J.C.H. Miles and
D.W. Dixon, (2005), The Development of the UK
Radon Programme, Radiological Protection,
25(4), p.475.
[29] EPA, Environmental Protection Agency, (2003),
Assessment of Risks from Radon in Homes, (EPA
402-R-03-003). Office of Radiation and Indoor
Air United States Environmental Protection
Agency, Washington, DC, 20460, 2003.
[30] G. Akerblom, (1999), Radon legislation and
National Guidelines Swedish Radiation Protection
Institute, SSI Report 99:18, ISSN 0282-4434,
1999.
[31] ICRP, (1993), International Commission on
Radiological Protection. Against Radon-222 at
Home and at Work, ICRP Publication 65, Annual
of the ICRP Pergamon. 23(2), 1993.
[32] A. G. Daniel, (2011), Basic Radiation Protection
Technology, 6th edition, Publisher: Pacific
Radiation Corporation, ISBN: 978-0-916339-14-2,
2011.
IJSRST16247 | Received : 11 July 2016 | Accepted : 23 July 2016 | July-August 2016 [(2)4: 83-89]
© 2016 IJSRST | Volume 2 | Issue 4 | Print ISSN: 2395-6011 | Online ISSN: 2395-602X Themed Section: Science and Technology
83
Demodulation of a Single Interferogram based on Bidimensional Empirical Mode Decomposition and Hilbert Transform
Said Amar*1, Mustapha Bahich1, Hanane Dalimi1, Mohammed Bailich2, Bentahar Youness1, ElMostafa Barj1, Mohamed Afifi1
1Laboratoire d’Ingénierie et Matériaux, Equipe Ingénierie et Energie, Faculté des sciences Ben M'sik, Casablanca, Maroc
2Equipe d’électronique et télécommunications, École Nationale des Sciences Appliquées, Université Mohammed Premier,
Oujda, Maroc
ABSTRACT
The phase calculation is a powerful measurement technique that allows the reconstruction of 3D profiles from
interferogram intensity. In this article a new phase extraction algorithm is presented. This algorithm uses the BEMD
technique (Bidimensional Empirical Mode Decomposition) for the evaluation of the phase distribution from a single
uncarrier interferogram. The proposed method requires the numerical addition of a high spatial frequency carrier
and application of the wavelet transform of the Fourier transform. An evaluation was made through a numerical
simulation on simulated and real fringes to validate and confirm the performance of the proposed algorithm. The
main advantage of this technique is its ability to provide a metrological solution for the fast dynamic analysis.
Keywords: Interferometry, Fourier Transform, Bidimensional Empirical Mode Decomposition, dynamic
analysis, Carrier Superposition, Phase Retrieval, wavelet transform.
I. INTRODUCTION
Optical interferometry techniques are widely used as
tools for measuring micro-displacement and microstrain
in several areas both scientific and industrial. [1]
These non-destructive methods are based on the
measurement of small variation of the optical path using
interference phenomena. Optical interferometry
techniques are many and varied: classical
interferometry, speckle interferometry, holography,
fringe projection technique, shearography, etc. [2]
The physical quantity to be measured is modulated by a
phase which is characterized by a deformed fringe
system in an intensity image. The phase extraction
algorithms are designed to calculate the phase
distribution coding this image [3].
This research is based on the phase extraction from a
single uncarrier interferogram using BEMD technique
(Bidimensional Empirical Mode Decomposition). We
present here a phase calculation algorithm based on this
method for calculating modal intrinsic functions
bidimensional (BIMFs) followed by a digital phase shift
by Hilbert Transform for each BIMF. Then, a spatial
digital carrier has been superimposed followed by an
application of the continuous wavelet transform or
Fourier transform giving access to the phase distribution
across a local analysis of intensity images.
II. THE EMPIRICAL MODE DECOMPOSITION
The EMD decomposition base is intrinsic to the signal.
The extraction of the oscillating components called
empirical modes (IMF Intrinsic Mode Functions) is non-
linear, but their recombination is linear. As EMD has no
analytical formulation, it is defined by an algorithm and
a process called sifting [4-6] for decomposing the signal
to the Empirical Modes.
To calculate the IMFs of a signal x (t) we follow the
following algorithm:
1. Extract local maxima and minima of the signal x (t)

International Journal of Scientific Research in Science and Technology (www.ijsrst.com)
84
2. Interpolating the maxima sets and the minima sets
(cubic splines, for example), to get the upper
envelopes (lower envelopes) : temin , temax
3. calculate the mean of envelopes:
2
)()()( maxmin tete
tm
4. subtract the mean envelope of the input signal
)()()( tmtxth
5. If h(t) is an IMF, the residue is )()()( thtxtr
and the new signal will be )()( thtx ,
6-If h (t) is not a IMF, the new signal will be
)()( trtx ,
For that )(th is a IMF, we must have a extrema between
several zero. 1 zeroextrema and the mean of
the upper and lower envelopes is zero
The signal x (t) can be written as:
n
i trtIMFtx1
)()()( (1)
The scope of the EMD technique to two-dimensional
signals (BEMD) follows the same steps for the
extraction of the BIMFs and the residue.
III. HILBERT TRANSFORM
In mathematical and signal theory, the Hilbert transform,
denoted H, of a real variable function f (t) is obtained by
convolution of f (t) with t
th
1)( [7].
d
t
xdthx
ttxtxH
)(1
)()(1
)()(
(2)
Moreover, the Hilbert transform may be interpreted as
the output of a invariant linear system as input x(t),
which is a impulse response system t
1. This is a
mathematical tool widely used in signal theory to
describe the complex envelope of the real magnitude
modulated by a signal.
Its Fourier transform is expressed as follows:
)()()( fXfHtxHTF (3)
With
)sgn()()( fjthTFfH (4)
Where sgn (f) is the "sign" function such as:
0,1
0,0
0,1
)sgn(
fsi
fsi
fsi
f (5)
Hilbert transform has the effect of turning of 90° the
negative frequency component of x (t) and -90° the
positive frequency component. The Hilbert transform
does not change the amplitude F (k), it only changes the
phase.
Hence the Hilbert transform is equivalent to a filter
altering the phases of the frequency components by 90°
positively or negatively according to the sign of
frequency.
However, the direct application of this transform to
interferogram to carry out the phase shift sometimes
introduces a sign ambiguity problem can be corrected by
a guided method of fringe orientation interferogram [8].
Applying the Hilbert transform to equation (1):
n
i
i
n
i
i
trHtIMFH
trtIMFHtxH
1
1
)(()(
)()()(
(6)
Therefore, the Hilbert of a signal x (t) is the sum the
Hilbert of all IMF components and the residual r (t).
Otherwise, with EMD decomposition (BEMD), we can
shift a signal (image) with 2
.
IV. THE FOURIER TRANSFORM
The intensity at a point of the interferogram at
coordinates (x, y) is expressed as follows:
),(cos),(1,),( 0 yxmyyxVyxIyxI (7)
With, I0, V and are respectively the average intensity,
the visibility factor and the desired phase. m is the

International Journal of Scientific Research in Science and Technology (www.ijsrst.com)
85
modulation rate of the high frequency spatial carrier
respecting the following condition:
maxy
m
(8)
The above expression can be written differently in the
following form:
imyimy eyxceyxcyxIyxI ),(),(),(),( *
0 (9)
Where
),(0
2
,),(),( yxie
yxVyxIyxc (10)
The one-dimensional Fourier transform is performed on
Equation (7) along the line x. The spectrum of the thus
obtained interferogram is expressed as:
),(ˆ),(ˆ),(ˆ),(ˆ *
0 mkxCmkxCkxIkxI (11)
Where I , 0I , C and
*C are respectively the Fourier
Transform of I , I0 , c and c*
After filtered two components 0I and
*C , and shifted
the component C to the origin. The inverse Fourier
transform is applied to C for obtain c (x, y).
The real and imaginary parts of c (x, y) are given by
)),(cos(),(),(Re yxyxbyxc (12)
)),(sin(),(),(Im yxyxbyxc (13)
The desired phase distribution will be evaluated using
the arctangent of the quotient Equation (13) on Equation
(12):
),(Re
),(Im),(
yxc
yxcarctgyx (14)
V. THE CONTINUOUS WAVELET TRANSFORM
(CWT)
Unlike the overall processing the Fourier analysis, the
wavelet transform allows a local study of the optical
information modulating the interference signal I(x, y).
By applying the wavelet transform to signal I(x,y), we
will have:
dyyyxIbaxW ba )(),(),,( *
, (15)
Where ba , are the wavelets: very special elementary
functions constructed from the wavelet mother )(y by
translation and dilation [4-6] such as:
a
by
ayba
1)(, (16)
Where 0a : The dilation parameter (scale) and b: the
translation parameter.
Therefore
myyxVyxIa
baxW cos(),(1),(1
),,( 0(17)
Exploiting the localization of the wavelet and assuming
a slow variation of I0 and V, the Parseval identity leads
to
),(
*
),(
*
0
ˆ
ˆ
2
),(),(),,(
bxi
bxi
ey
ma
ey
ma
abxVbxIbaxW
(18)
Choosing a mother wavelet that its Fourier transform is
null in the negative frequencies (in our case complex
Morlet), the second term of (18) can be neglected. So the
wavelet transform becomes

International Journal of Scientific Research in Science and Technology (www.ijsrst.com)
86
),(
*
0
ˆ
2
),(),(),,(
bxiey
ma
abxVbxIbaxW
(19)
The modulus and the phase arrays can be calculated by
the following equations:
),(),( baWbaabs (20)
)),(Re(
)),(Im(arctan),(
baW
baWba (21)
To compute the phase of the row, the maximum value of
each column of the modulus array is determined and
then its corresponding phase value is found from the
phase array [9]. By repeating this process to all rows of
the fringe pattern, a wrapped phase map is resulted and
needs after to be unwrapped [10].
VI. INTERFEROGRAM ANALYSIS
Our method of analysis of an interferogram can be
outlined by the following chart (Figure 1)
Figure 1: The flow chart of interferogram analysis
method
After applying the BEMD on our interferogram, we get
the BIMFs, on which we apply the Hilbert Transform to
digitally shift with 2
. These shifted BIMFs will be later
corrected to remove their sign ambiguity and the new
images are called CHBIMFs.
By adding all BIMFs and CHBIMFs, we find the two
BIMF and CHBIMF images respectively.
Using a suitable modulation rate m, we combine
digitally SIMF(x,y) and CHBIMF(x,y) with the matrix
cos(my) and sin(my) to derive the carrier interferogram
IP as following :
),()sin(
),()cos(),(
yxSCHIMFmy
yxSIMFmyyxIP
(22)
By using the Fourier Transform or wavelet Transform,
we can obtain simply the phase distribution.
VII. SIMULATIONS AND RESULTS
In this work, we apply our algorithm on an
interferogram with size 256 × 256 pixels whose
distribution is given by:
),(cos1),( yxyxI (23)
and illustrated in figure 2
Figure 2: The simulated interferogram
with ϕ(x,y) the phase variation that have expression:
2212812815.0),( yxyx (24)
shown in Figure 3
Figure 3: The theoretical phase distribution
With x and y are the pixel coordinates in the image
The Figure 4 shows the BEMD decomposition of the
interferogram obtained by numerical simulation.

International Journal of Scientific Research in Science and Technology (www.ijsrst.com)
87
Figure 4: BEMD decomposition of interferogram
(BIMFs)
After that, the Hilbert Transform is applied to each
BIMF followed by a sign correction. Figure 5 shows the
sum of all corrected BIMFs. It’s a π/2 phase shifted
interferogram.
50 100 150 200 250
50
100
150
200
250
Figure 5: 2
phase shifted interferogram.
After combining the two phase shifted fringe patterns
numerically with sin (my) and cos (my), we have
obtained the modulated fringe pattern shown in Figure 6
with modulation rate value 0.8 radian/pixel.
50 100 150 200 250
50
100
150
200
250
Figure 6: The carrier interferogram
The wavelet method was applied to the new carrier
fringe pattern to retrieve the phase map of Figure 7.
Figure 8 illustrates the retrieved continuous phase map
after the unwrapping process.
50 100 150 200 250
50
100
150
200
250
Figure 7: The wrapped phase map
Figure 8: The retrieved phase map
The algorithm generated by our method was used to
calculate the desired phase image with an RMS error
(Root Mean Square) equal to 2.26 rad, and this by using
only one uncarrier interferogram.

International Journal of Scientific Research in Science and Technology (www.ijsrst.com)
88
VIII. APPLICATION ON REAL FRINGES
To illustrate the use of our method for real applications,
we tested its performance on a rough ground finish,
aluminium surface from a hard disk drive assembly of
the company 4D Technology.
Figure 9 shows the real fringes of Hard Drive at
aluminum.
Figure 9: Real fringes of the hard drive enclosure
By applying the same steps as before, we find the
wrapped phase distribution by using the Fourier
Transform (FT) (Figure 10):
50 100 150 200 250
50
100
150
200
250
Figure 10: The wrapped phase by F.T
Figure 11 shows the distribution of the continuous phase
obtained after unwrapping process.
Figure 11: The unwrapped phase distribution by F.T
And if using the continuous wavelet transform (CWT),
we find the wrapped phase distribution shown in figure
12.
50 100 150 200 250
50
100
150
200
250
Figure 12: The wrapped phase by CWT.
The figure 13 shows the distribution of continuous phase
after unwrapping method.
Figure 13: The unwrapped phase distribution by CWT
with both methods we obtained the same phase
distribution
IX. CONCLUSION
In this paper, we have presented a new algorithm of
phase retrieval from a single uncarrier interferogram
with closed fringes. This was achieved by numerical
superposition of the spatial carrier by Empirical Mode
Decomposition and Hilbert Transform, followed by
fringes demodulation using Continuous Wavelet
Transform or Fourier Transform.
The numerical simulation validated the reliability of the
method on simulated and real fringes by estimating the
phase distribution with good accuracy even with the
closed fringes.
X. REFERENCES
[1] D.C. Williams, "Optical methods in engineering
metrology". Chapman and Hall, First edition.
(1993).
[2] José Xavier, Identification de la variabilité des
rigidités du bois à l’intérieur de l’arbre par la

International Journal of Scientific Research in Science and Technology (www.ijsrst.com)
89
méthode des champs virtuels, PhD thesis, École
Nationale Supérieure d’Arts et Métiers, 2007.
[3] M. Afifi, these d’état, Université Hassan II
Mohammedia, (2002).
[4] N. E. Huang, Z. Shen and S. R. Long, ''The
empirical mode decomposition and the Hilbert
spectrum for nonlinear and non stationary time
series analysis'' in: Proceedings of the Royal
Society of London Series, 1998, 454, pp. 903-
995.
[5] G. Rilling, P. Flandrin, “On empirical mode
decomposition and its algorithms”, in: IEEE–
EURASIP Workshop Nonlinear Signal Image
Process, Grado, Italy, 2003.
[6] Cexus Jean-Christophe, " Analyse des signaux
non stationnaires par Transformation de
Huang,Opérateur de Teager-Kaiser, et
Transformation de Huang-Teager (THT) " these
de Doctorat, 2005.
[7] EB Saff, AD Snider, “Complex analysis for
mathematics, science and engineering”, Prentice-
Hall Inc, New York, (1976).
[8] M Bahich, M Afifi, EM Barj, “Optical phase
extraction algorithm based on the continuous
wavelet and the Hilbert transforms”, Journal Of
Computing, vol.2, 5, (2010)
[9] Q. Kemao, et al., Wavelets in optical metrology,
in: K. Singh, V.K. Rastogi (Eds.), Perspectives in
Engineering Optics, 2003, pp. 117–133.
[10] D.C. Ghiglia, M.D. Pritt, Two-dimensional Phase
Unwrapping: Theory Algorithms and Software,
Wiley, New York, 1998.
IJSRST162423 | Received: 21 July 2016 | Accepted: 26July 2016 | July-August 2016 [(2)4: 90-97]
© 2016 IJSRST | Volume 2 | Issue 4 | Print ISSN: 2395-6011 | Online ISSN: 2395-602X Themed Section: Science and Technology
90
Protective Effect of Umbelliferone against Doxorubicin Induced
Cardiotoxicity in Wistar Albino Rats
Sathesh Kanna Velli, Sharmila Salam, Premkumar Thandavamoorthy, Palanisamy Krishnan,
Jagan Sundaram, Devaki Thiruvengadam*
Department of Biochemistry, University of Madras, Guindy Campus, Chennai, Tamilnadu, India
ABSTRACT
Doxorubicin (DOX) is widely used as chemotherapeutic agent. Usefulness of this agent is limited due to its
cardiotoxic effects. The aim of this study was to investigate the curative effect of Umbelliferone (UMB) against
Doxorubicin (DOX) induced cardiotoxicity in albino rats. Biomarkers like LDH, AST, ALT, ALP, CK, along with
heart weight index, antioxidant enzymes, lipid profiles and histological examination were assessed to determine the
cardiotoxicity effect. DOX alone (25mg/kg bw intraperitoneally three times per week for two weeks) administered
group exhibited significant increase in LDH, AST, ALT, ALP, CK, FC, FFA and TG levels and decrease in
Enzymatic and Non enzymatic antioxidants activities when compared to control group. Oral administration of
Umbelliferone (UMB) (30mg/kg bw) treatment daily for two weeks along with DOX significantly attenuated the
increased serum biomarkers, reduced hyperlipidemia and restored the tissue antioxidant activities when compared to
DOX alone treated group. Histology examination also clearly showed that UMB significantly inhibited the cardiac
damage induced by DOX. Based on the results, this study clearly indicates that UMB used as a potent compound
against cardiotoxicity induced by DOX.
Keywords: Doxorubicin, Umbelliferone, Cardiotoxicity
I. INTRODUCTION
Globally Doxorubicin (DOX) used as an anticancer drug
because of its antineoplastic antibiotic effect, this has
used to treat the several cancers including leukemia and
solid tumours (1). Long term usage of this drug causes
severe side effects, which includes predominantly cardio
toxicity later that may lead to irreversible
cardiomyopathy and heart failure (2). Administration of
anticancer agents adversely affect the antioxidant
haemostasis in the cellular levels thereby generation of
abnormal free radicals which lead to oxidative stress that
causes tissue damage (3).
Myocardial infarction or heart attack is the major disease
that causes predominantly death from all over the world.
When blood supply is insufficient to myocardium, death
of cardiomyocytes occurs, a condition known as
ischemia. Prolonged ischemia leads to necrosis, which is
called as myocardial infarction. Currently many
medicines are used to treat myocardial infarction that
has so many side effects. Dietary occurring natural
compounds play a key role in treating various diseases,
including cardiac diseases. Herbal formulations are safer
than modern drugs which lead to herbal preparations.
World Health Organization also recommended the uses
of herbal medicines as an alternative medicine in the
developing countries (4).
Coumarin is a benzopyrene structured compound
derived from the plant sources. Coumarin is extensively
distributed in the entire parts of the plant, especially high
amount in flowers, stem, and roots (5). Coumarins are
vast group of natural compounds, among umbelliferone
were predominantly found in the edible fruits of Golden
apple Aegle marmelos (Rutaceae) (6). It is a yellowish-
white crystalline solid, slightly soluble in hot water and
high soluble in ethanol (7).

International Journal of Scientific Research in Science and Technology (www.ijsrst.com)
91
UMB contains wide spectrum of pharmaceutical effects
including anti-lipidemic (8), anti-diabetic and anti-
hyperglycemic (9), anti-inflammatory (10), radio
protective (11), and antioxidant activity (12). In addition,
recent studies revealed that UMB have significant
hepatoprotective effect (13). But still, there is scarce
information about the cardio protective effect of UMB.
Hence this study was designed in such a way to
elucidate the role of UMB on experimentally induced
cardio toxicity.
A B
Figure 1.Structure of (A)Umbelliferone (C9H6O3) and
(B) Doxorubicin (C27H29N011)
.
II. METHODS AND MATERIAL
Source of chemicals and drugs
Doxorubicin was purchased from Hi Media laboratories,
India. Umbelliferone (7-Hydroxy coumarin) was
purchased from Sigma-Aldrich, Bangalore. All other
chemicals used which were of analytical grade obtained
from SRL/TCI/HIMEDIA laboratories, India.
Experimental animals
Male Albino Wistar rats weighing about 150–160 g were
procured from TANUVAS, Chennai, India and all the
experiments were designed and conducted according to
the Institutional Animal Ethics Committee approved
guidelines. The animals were maintained in clean, sterile
cages, well ventilated room with controlled temperature
(25±2°C) and were acclimatized to 12-h light and dark
cycles. Animals were fed with commercially available
standard rat pelleted feed (M/S Hindustan Foods Ltd,
Bangalore, India) throughout the experimental period.
The animals were free access to food and water.
Experimental design
The rats were divided into four groups, each group
consisting of six animals.
Group I Control rats were given 10% DMSO which
served as a vehicle control through the experimental
period along with standard diet and drinking water.
Group II Rats were injected DOX (25mg/kg bw,
intraperitoneally using saline) three times per week for
two weeks (14)
Group III Rats were administered with Umbelliferone
orally (30mg/kg bw dissolved in 10% DMSO) daily
for two weeks along wi th the same time DOX were
injected intraperitoneally three times per week for two
weeks period.
Group IV Rats were administered with UMB orally
(30mg/kg bw dissolved in 10% DMSO) daily for two
weeks.
At the end of the experimental period, the animals were
fasted overnight and anesthetized with Ketamine (90
mg/kg bw) and Xylazine (10 mg/kg bw) and sacrificed
followed by cervical decapitation. Blood were collected
and allowed to coagulate at room temperature for 30 min.
Serum were separated by centrifugation at 3000 rpm for
15 min at 4˚C. The heart were immediately excised and
washed in ice-cold saline. The heart tissues were sliced
and homogenized into 0.1 M Tris–HCL buffer (pH 7.4).
The tissue homogenates were centrifuged at 1000 rpm
for 10 min at 4˚C and the supernatants were collected
and assessed for various parameters.
Figure 2.Schematic representation of experimental
design Biochemical parameters
Estimation of marker enzymes
Activities of Lactate dehydrogenase (LDH) (15),
Asparate transaminases (AST) (16), Alanine
tansaminases (ALT) (16), alkaline phosphatase (ALP)
(17) and Creatine kinase (18) were assayed in the serum
of experimental animals.

International Journal of Scientific Research in Science and Technology (www.ijsrst.com)
92
Estimation of enzymic and non-enzymic antioxidants
The data were analysed with SPSS/10 Software.
Hypothesis testing methods included one way analysis
of variance (ANOVA) followed by least significant
difference (LSD) test. P values of <0.05 were considered
to indicate the statistically significance. All the results
were expressed as mean ± standard error (SE) for six
animals in each group.
III. RESULT AND DISCUSSION
1. RESULT
Effect of UMB on body weight, Heart weight and
relative heart weight
Fig 3 shows the initial and final body weight of the
control and experimental group of animals. In DOX
administered group II animals there is drastic reduction
in the final body weight, whereas UMB+DOX
administered group III animals were showed significant
increase in the final body weight when compared with
DOX alone group II animals. In addition there is no
significant difference found in the final body weight of
UMB alone treated animals when compared to control
animals.
Fig 4 shows the heart weight and relative heart weight of
control and experimental animals. DOX administered
animals showed increase in the heart weight and relative
heart weight. UMB+DOX treated animals exhibited the
significant decrease in the heart weight and relative heart
weight when compared with the DOX induced animals.
There are no significant changes between heart weight
of the control animals and UMB alone treated animals.
(aCompared with control and bCompared with DOX)
Figure 3.Effect of UMB on body weight during
experimental group of animals
(aCompared with control and bCompared with DOX)
Figure 4.Effect of UMB on Heart weight and relative
heart weight during experimental group of animals
UMB decreased the levels of serum marker enzymes in
DOX induced cardiotoxicity animals
Table 1 shows the effect of UMB on the levels of
markers enzymes LDH, AST, ALT, ALP and CK in the
serum of control and experimental group of rats. The
marker levels were significantly increased in DOX
induced animals when compared with control animals.
Whereas UMB+DOX treated animals significantly
decreased the levels of marker enzymes when compared
with DOX induced animals. No significant changes
observed between control and UMB alone treated
animals.
a
b
135140145150155160165
Bo
dy
we
igh
t in
gm
s
Initial body weight Final body weight
a
b a
b
00.20.40.60.8
11.2
Hea
rt w
eig
ht
in g
ms
Heart weight Relative heart weight

International Journal of Scientific Research in Science and Technology (www.ijsrst.com)
93
UMB treatment increased the levels of HDL
cholesterol
Table 2 shows the serum lipoprotein fractions such as
LDL, HDL and VLDL of control and experimental
groups of animals. DOX administered animals showed
significant reduction in the HDL levels and the same
increased in the LDL/VLDL when compared with
control animals. Whereas UMB+DOX treated animals
significantly restored the HDL levels and decreased in
the LDL/VLDL levels when compared to DOX induced
animals.
UMB alleviate the antioxidant activities during DOX
induced cardiotoxicity
Table 3 and 4 indicates the enzymatic and non-
enzymatic antioxidant activities in the heart of the
control and experimental groups. DOX induced animals
showed significant decrease in the activities of
enzymatic antioxidants such as SOD, CAT, GPx, GR
and GST when compared with control animals. Whereas
UMB+DOX supplemented animals showed significant
increase in the activities of these enzymes when
compared with DOX induced animals.
Non enzymatic antioxidants such as GSH, G6PD, VIT C,
VIT E and VIT A also found significantly decreased
activities during DOX induced animals when compared
with control animals. In UMB+DOX treated animals,
there is significant increase in the activities of GSH,
G6PD, VIT C, VIT E and VIT A when compared with
DOX induced animals. No significant change was
observed in UMB alone treated animals when compared
with control animal.
Table 1: Effect of UMB and on the activities of marker enzymes in serum of control and experimental group of rats
Groups LDH AST ALT ALP CK
Control 87.33 ± 6.32 108.6 ± 9.16 74.83± 5.26 19.42 ± 1.03 10.46 ± 0.97
DOX 178.32 ± 14.67 a aa 158.5 ±13.05 a 286.35 ± 21.84 a 73.53 ± 5.11 a 27.64 ± 1.98 a
UMB+DOX 111.23 ± 8.45 b 124.1 ±11.04 b 128.43 ± 7.62 b 48.13 ± 3.06 b 13.23± 0.73 b
UMB 89.11 ± 7.05 104.9 ± 8.99 72.32 ± 5.04 18.46 ± 1.69 10.14 ± 0.57
Results are expressed as mean ± S.D. for six rats in each group. Statistical significance at p<0.05 compared with
aCompared with control and bCompared with DOX. Units CK: µmol of phosphorus/h/mg protein; LDH, AST and
ALT: µmol of pyruvate/h/mg protein; ALP: KA U/l.
Table 2: Effect of UMB on the activities serum lipoprotein fraction of control and experimental group of rats
Groups LDL HDL VLDL
Control 16.12 ± 1.05 40.77± 3.29 26.14 ± 2.11
DOX 32.16 ± 2.02 a 26.16 ± 1.80 a 42.66 ± 4.09 a
UMB+DOX 20.65 ± 1.01 b 38.14 ± 2.68 b 35.56 ± 2.68 b
UMB 15.67 ± 1.22 40.29 ± 3.11 25.62 ± 1.95
Results are expressed as mean SD for six rats each group. Statistically significance at p<0.05; Results are
compared with aCompared with group 1 and bCompared with group 2.Units— mg/dl

International Journal of Scientific Research in Science and Technology (www.ijsrst.com)
94
Table 3.Effect of Umbelliferone on the activities of antioxidant enzymes in the heart of control and experimental
groups of rats
Groups SOD CAT GPx GR GST
Control 3.86 ± 0.17 69.06 ± 5.39 19.23 ± 1.41 2.99 ± 0.10 1.86 ± 0.12
DOX 1.68 ± 0.07a 37.45 ± 2.92a 11.96 ± 0.87a 0.74 ± 0.05a 0.59 ± 0.04a
UMB+DOX 2.32 ± 0.09b 54.84 ± 4.23b 16.28 ± 1.43b 1.46 ± 0.11b 1.43 ± 0.09b
UMB 3.67 ± 0.16 68.38 ± 4.96 18.56 ± 1.47 2.69 ± 0.10 2.11 ± 0.14
Results are expressed as mean ± S.D. for six rats in each group. Statistical significance at p<0.05 compared with
aCompared with control and bCompared with DOX. Units: SOD in units/mg protein, CAT in µmol of H2O2
decomposed/min/mg protein, GPx in µmol of GSH utilized/min/mg protein, GR in µmol of NADPH
oxidized/min/mg protein and GST in µmol of CDNB-GSH conjugate formed/min/mg protein. G6PD in µmol of
NADPH oxidized/min/mg protein.
Table 4.Effect of Umbelliferone on the activities of non-enzymatic enzymes in the heart of control and experimental
group of rats
Groups GSH G6PD VITAMIN C VITAMIN E VITAMIN A
Control 5.92 ± 0.45 2.36 ± 0.13 1.84 ± 0.13 2.83 ± 0.25 3.16 ± 0.10
DOX 1.89 ± 0.07a 0.58 ± 0.04 a 0.66 ± 0.05a 1.43 ± 0.08a 0.88 ± 0.02a
UMB+DOX 3.75 ± 0.29b 1.83 ± 0.06 b 1.38 ± 0.07 b 2.32 ± 0.16 b 2.28 ± 0.18 b
UMB 5.66 ± 0.39 2.27 ± 0.12 1.71 ± 0.10 3.01 ± 0.20 3.54 ± 0.09
Results are expressed as mean ± S.D. for six rats in each group. Statistical significance at p<0.05 compared with a
Compared with control and bCompared with DOX. Units: VitC in mg/g of wet tissue, VitE in mg/g of wet tissue,
VitA in mg/g of wet tissue and GSH in µg/mg protein.
Table 5.Effect of UMB on cardiac lipids of control and experimental groups of rats
Groups Free
cholesterol
Esterified
cholesterol
Phospholipids Free fatty
acids
Triglycerides
CONTROL 3.47 ± 0.29 2.34 ± 0.12 14.88 ± 1.21 3.19 ± 0.21 3.23 ± 0.18
DOX 6.34 ± 0.52a 0.54 ± 0.04a 09.37 ± 0.45a 7.11 ± 0.59a 6.89 ± 0.44a
DOX+UMB 4.08 ± 0.29b 1.78 ± 0.11b 12.87 ± 0.68b 4.31 ± 0.27b 4.96 ± 0.52b
UMB 3.39 ± 0.24 2.16 ± 0.16 14.66 ± 0.89 3.06 ± 0.29 3.17 ± 0.24
Results are expressed as mean ± S.D. for six rats in each group. Statistical significance at p<0.05 compared with
aCompared with control and bCompared with DOX Units: mg/dL

International Journal of Scientific Research in Science and Technology (www.ijsrst.com)
96
Effect of UMB on cardiac lipid status
Table 5 shows the levels of free cholesterol, esterified
cholesterol, phospholipids, free fatty acids and
Triglycerides. DOX induced animals showed significant
increase in the content of free cholesterol, free fatty
acids, triglycerides and decreased levels of
phospholipids, esterified cholesterol were observed.
Whereas UMB+DOX administered animals found
significant reduction in the levels of free cholesterol,
free fatty acids, triglycerides and at the same time,
increased in the levels of esterified cholesterol,
phospholipids were observed when compared to DOX
induced animals.
Histology examination
Haematoxylin and Eosin stained (H&E) sections of heart
were assessed under a light microscope (40x). Control
animals (Fig 5A) and UMB alone administered animals
(Fig 5D) showed normal architecture of myocardial
fibres and myocytes. (Fig 5B) Doxorubicin administered
animals showed myocyte swelling, severe damage in
myocardial fibres and hyalinization in the heart.
Umbelliferone + Doxorubicin treated animals (Fig 5C)
almost showed normal myocytes and less damage in
myocardial fibres.
Figure 5.Photomicrographs (40x) obtained from the heart
sections A. Control group, B. DOX alone group, C. UMB +
DOX group, D. UMB alone group.( ) Shows normal
myocytes and cardiomyofibres ( ) Shows swollen myocytes
and damaged myocardial fibres ( ) Shows normal myocytes
and less myocardial fibres damage
2. DISCUSSION
Doxorubicin is an anthracycline, which is used for the
treatment of various malignant and non-malignant
tumors. The use of doxorubicin as chemotherapeutic
drug has been limited due to its diverse toxicities,
including cardiac, renal, haematological and testicular
toxicity (34). It has been reported doxorubicin induced
cardio toxicity mediated by lipid peroxidation and
inhibition of fatty acids and oxidation in cardiac tissues
(35). Several studies reported, anticancer therapies
adversely affect the physiological homoeostasis of
different organ functions during cancer treatment.
Doxorubicin induced myocardial damage have been well
established in animal models.
The present study delineates the protective role of UMB
in DOX induced cardio toxicity. Experimentally DOX
challenged animal models severely causes oxidative
stress mediated free radical generation that causes cardio
toxicity. The metabolic action of DOX is initially
converted into semiquinone form in the cardiac tissue,
which is a toxic, short lived metabolite that interacts
with molecular oxygen and initiates a cascade of
reaction leading to ROS generation (36).
In this present study, administration of DOX drastically
reduced in the final body weight and significantly
increased the heart weight. Similarly DOX
administration adversely affects the tissue by increase in
the serum markers LDH, AST, ALT, ALP, and CK-MB.
Umbelliferone challenged along with DOX animals
significantly increase the body weight and attenuated the
tissue damage thereby preventing the membrane
enzymes leakage into the serum, this shows the
protective effect of UMB in myocytes against
cardiotoxicity (37).
Clinical investigations also suggest that increased
oxidative stress associated with DOX causes
cardiomyopathy that leads to heart failure (11). DOX
and its mebolites reduced the oxidant level that leads to
accumulate abnormal free radical generation in the heart
tissue (38). In this study, the oxidative stress associated
tissue injury caused by DOX results significant
decreased in the activities of SOD, CAT, GPx, GR, GST
and UMB along with DOX treatment restored the

International Journal of Scientific Research in Science and Technology (www.ijsrst.com)
97
enzymic antioxidant levels which clearly shows the
beneficial effect against DOX induced cardiotoxicity (39)
Non-enzymic antioxidants also play an excellent role in
protecting the cells from oxidative damage. GSH an
ubiquitous tripeptide which act as a free radical
scavenger (39). Decreased level of GSH impairs the
ability of cells thereby enhance in the levels of LPO.
Lipid soluble antioxidant like Vitamin E which is
present in the cellular membranes plays an important
role in the suppression of free radicals (40). Vitamin C is
a free radical scavenger, act as an antioxidant in
recycling of Vitamin E. Cellular levels of vitamin C and
vitamin E were maintained in the active form by GSH.
In this study, DOX group shows reduced activities of
Vitamin C, A, E and has pronounced GSH depletion
were observed. UMB along with DOX treated animals
showed significant increase in the levels of non enzymic
antioxidants activities which may be due to ability of
UMB quenched the free hydroxyl and superoxide
radicals.
Hypercholestrolemia, hypertriglyceridemia is a well-
known risk factor in cardiovascular disease. Heart attack
risk can be reduced by lowering the cholesterol levels
and the alteration in the lipoprotein transport and
metabolism affects the physiological context of changes
in plasma lipids (42). In this study DOX group
significantly revealed increase in the levels of
cholesterol and triglycerides. Interestingly UMB
supplementation along with DOX completely attenuated
the increased cholesterol and triglycerides levels.
Biochemical data were further confirmed the
histopathological studies from the cardiac tissues. UMB
along with DOX treated animals showed the minimal
damage by maintaining the cardiomyocytes and
myofibres neatly to the normal architecture than the
DOX animals (43). From the above, all the data revealed
that the UMB has the potential to cure the cardiotoxic
effect produced by the DOX.
IV. CONCLUSION
The present findings clearly shows the protective effect
of UMB on DOX induced cardiotoxicity through
maintaining systemic antioxidant activities, cellular
membrane integrity and reducing hyperlipidimea
conditions. Further studies are in the underway to
investigate the intricate mechanism.
V. ACKNOWLEDGEMENT
First author Sathesh Kanna Velli, Project fellow
gratefully acknowledges the UGC for the financial
assistance provided in the form of UGC-UPE
fellowship.
VI. REFERENCES
[1] Hrdina, R., Gersl, V., Klimtova, I., Simunek, T.,
Machackova, J, Adamcova, M (2000). Anthracycline
induced cardiotoxicity Acta Medica; 43(3):75–82.
[2] Lefrak, EA.,Pitha, J., Rosenheim, S., Gottlieb, J.A (1973).
A Clinicopathologic analysis of adriamycin cardiotoxicity
Cancer; 32:302–314.
[3] Minotti, G., Ronchi, R., Salvatorelli, E., Menna, P.,
Gaetano, C.G (2001). Dox irreversibly inactivates iron
regulatory proteins 1 and 2 in cardiomyocytes: Evidence
for distinct metabolic pathways and implications for iron
mediated cardio toxicity of antitumor therapy Cancer Res;
(61): 8422-8428.
[4] Jain, PK., Joshi, H (2012). Coumarin: chemical and
pharmacological profile J Appl Pharm Sci; 2:236 –40.
[5] Battino, M., (2001). Natural distribution and occurrence
of coenzyme Q homologues in mammals In: Ebadi, M.,
Marwah, J., Chopra, R (Eds.), Mitochondrial Ubiquinone
(Coenzyme Q10): Biochemical, Functional, Medial, and
Therapeutic Aspects in Human Health and Diseases
Prominent Press, Scottsdale, pp152 - 182.
[6] Venugopala, K.N., Rashmi, V., Odhav, B (2013). Review
on natural coumarin lead compounds for their
pharmacological activity Bio Med Research International
doi.org/ 10.1155/ 2013/963248
[7] Dean, F.M (1963). Naturally occurring oxygen ring
compounds Butter worths, London.
[8] Ramesh, B., Pugalendi, K.V (2005). Antihyperlipidemic
and antidiabetic effects of umbelliferone in streptozotocin
diabetic rats Yale J Biol Med; 78:189 – 96
[9] Ramesh, B., Pugalendi, K.V (2006). Antihyperglycemic
effect of umbelliferone in streptozotocin - diabetic rats J
Med Food; 9:562–6.
[10] Lino, C.S., Taveira, M.L., Viana, G.S.B., Matos, F.J.A
(1997). Analgesic and antiinflammatory activities of
Justicia pectoralis Jacq and its main constituents:
coumarin and umbelliferone Phyther Res; 11:211–5.
[11] Jayakumar, S., Hari, N., Bhilwade, R.C.C (2013).
Suppression of radiation-induced DNA damage and
apoptosis in hematopoietic cells of mice by umbelliferone
BARC Newsletter; p327–31.
[12] Hoult, J.R., Paya, M (1996). Pharmacological and
biochemical actions of simple coumarins: natural

International Journal of Scientific Research in Science and Technology (www.ijsrst.com)
98
products with therapeutic potential Gen Pharmacol;
27:713–22
[13] Tamilarasi, S., Devaki, T(2016). Umbelliferone
exetunates the abnormalities in lipid metabolism during
galactosamine and lipopolysaccharide - induced
fulminant hepatic failure in rats Int J Pharm Sci; 8: 79-84
[14] Dhankhar, S., Ruhil, S., Balhara, M., Dhankhar, S.,
Chhillar, AK (2011). Aegle marmelos (Linn.) correa: a
potential source of phytomedicine; 5:1497–507
[15] King, J(1965). The dehydrogenases or oxidoreductases-
lactate dehydrogense In: Van D editor Practical clinical
enzymology; London: Nostrand; p83–93
[16] Mohun, A.F., Cook, L.J (1957). Simple method for
measuring serum level of glutamateoxaloacetate and
glutamate-pyruvate transaminases in laboratories J Clin
Chem; 10:394–9
[17] King, J(1965). Van editor Practical clinical enzymology
London: Nostrand; p363
[18] Okinaka, S., Sugita, H., Mamoi, T (1964). Cysteine-
stimulated serum creatine kinase in health and disease J
Lab Clin Med; 64:299–305
[19] Misra, H.P., Fridovich, J (1972). The role of superoxide
anion in the auto-oxidation of epinephrine and a simple
assay for superoxide dismutase J Biol Chem; 247:3170–5
[20] Bergmeyer, H.V., Gowehn, K., Grassel, M (1974).
Methods of enzymatic analysis New York: Academic;
p438
[21] Rotruck, J.T., Pope, A.L., Ganther, H.E (1973).
Selenium: biochemical role as a component of glutathione
peroxidase, purification and assay Science; 179:588–90
[22] Habig, W.H., Pabs, J (1974). Glutathione-S-transferase J
Biol Chem; 249:7130–9
[23] Beutler, E., Matsumoto, F (1975). Ethinic variation in red
cell glutathione peroxidase activity Blood; 46:103-10
[24] Maye, S.T., Turbull, T.P., Sauberchich, H.C (1979).
Selected methods for determination of ascorbic acid in
cells, tissues and fluids Methods Enzymol; 6:3-11
[25] Desai, I.D (1984). Vitamin E analysis methods for animal
tissues Methods Enzymol; 105:138 47
[26] Bayfield, R.F., Cole, E.R (1980). Colorimetric estimation
of vitamin A with trichloro acetic acid Methods Enzymol;
67:189-203
[27] Staal, G.E.J., Visser, J., Veger, C (1969). Purification and
properties of glutathione reductase of human erythrocytes
Biochim Biophys Acta; 185:39–48
[28] Wilson, D.F., Spiger, M.J (1973). A dual precipitation
method for quantitative plasma lipoprotein measurement
without ultracentrifugation J Lab Clin Med; 82:473-82
[29] Sperry, W.M., Webb, A (1950). A revision of
schoenhemer-sperry method for cholesterol determination
J Biol Chem; 187:97-106
[30] Barlett, G.R (1959). Phosphorous assay in column
chromatography J Biol Chem; 234:466-8
[31] Rouser, G., Sidney F., Akira, Y (1970). Two dimensional
thin layer chromatographic separation of polar lipids and
determination of phospholipids by phosphorus analysis of
spots Lipids; 494-96
[32] Horn, W.T., and Menahan, I.A (1981). A sensitive
method for the determination of the fatty acids in plasma
J Lipid Res; 22:377-81
[33] Rice, E.W (1970). Triglycerides ("neutral fats") in serum
In: Standard methods of clinical chemistry MacDonald
RP. Ed. Academic press: New York; 6:215-22
[34] YF1 Xin., Wan LL., Peng JL., Guo C (2010). Alleviation
of the acute doxorubicin induced cardiotoxicity by
Lycium barbarum polysaccharides through the
suppression of oxidative stress. Food and Chemical
Toxicology.; 9:259-264.
[35] Yilmaz S, Atessahin A, Sahna E, Karahan I, Ozer S.
(2006). Protective effect of lycopene on adriamycin-
induced cardiotoxicity and nephrotoxicity. Toxicology;
218:164-17.
[36] Oliveira, P.J., Bjork, J.A., Santos, M.S., Leino, R.L.,
Froberg, M.K., Moreno, A.J., et al., (2004). Carvedilol-
mediated antioxidant protection against doxorubicin-
induced cardiac mitochondrial toxicity. Toxicol Appl
Pharmacol ; 200:159-168.
[37] Dorr, R.T. (1996). Cytoprotective agents for
anthracyclines. Semin. Oncol. 23: 23-34.
[38] King, J (1965). The dehydrogenases or oxidoreductases-
lactate dehydrogense. In: Van D. editor. Practical clinical
enzymology. London: Nostrand; p. 83-93
[39] Singh, Ravinder, J (2002). Glutathione: a marker and
antioxidant for aging. J Lab Clin Med; 140:380-1.
[40] Halliwell, B., Gutteridge, J.M.C (1984). Lipid
peroxidation, oxygen radicals, cell damage and
antioxidant therapy. Lancet; 1:1396–7
[41] Elberry, A.A., Abdel-Naim, A.B., Abdel-Sattar, E.A.,
Nagy, A.A., Mosli, H.A., Mohamadin, A.M., et al.,
(2010). Cranberry (Vaccinium macrocarpon) protects
against doxorubicin-induced cardiotoxicity in rats. Food
and Chemical Toxicology; 48:1178-1184.
[42] Mushlin, P.S., Cusack, B.J., Boucek, R.J., Andrejuk, T.,
Li, X and Olson, R.D (1993). Time-related increases in
cardiac concentrations of doxorubicinol could interact
with doxorubicin to depress myocardial contractile
function. Br. J. Pharmacol., 110: 975–982.
[43] Mantawy, E.M (2014). Chrysin alleviates acute
doxorubicin cardiotoxicity in rats via suppression of
oxidative stress, inflammation and apoptosis'. Eur J
Pharmacol; 728:107-18.

IJSRST162420 | Received : 19 July 2016 | Accepted : 04 July 2016 | July-August 2016 [(2)4: 98-106 ]
© 2016 IJSRST | Volume 2 | Issue 4 | Print ISSN: 2395-6011 | Online ISSN: 2395-602X Themed Section: Science and Technology
98
The Characteristics of Physico-Chemical and Sensory Properties of Bran and
Pumpkin Flours Substitution of Simulation Chips Wayan Trisnawati
1, Ketut Suter
2, Nengah Kencana Putra
2
1Departement of Agriculture Technology Assessment, Bali, Indonesia
2Department of Food Science and Technology Faculty of Agriculture Technology, Udayana University Bali, Bali, Indonesia
ABSTRACT
Snacks are food consumed between the times of the main meal. Indonesian people have a habit of eating a snack,
and it is a business opportunity for the snack industry. Most snack on the market contain a lot of monosodium
glutamate (MSG), to reduce the use of MSG, it can use local foodstuffs such as bran and fruit pumpkin that has a
complete nutritional content, source of dietary fiber, and antioxidants. By processing the bran and pumpkin fruit into
flour, it can be used as raw material in the processing of the simulation chips. The purpose of this study was to
determine the effect of substitution proportion of TB and TLK to the physico-chemical properties and sensory
quality of simulation chips. The design used was completely randomized design (CRD) with four replications for
each treatment. Treatment substitution of TB consists of 7 levels: 0%, 5%, 10%, 15%, 20%, 25%, and 30% of the
total flour, whereas substitution of TLK consists of 7 levels, namely 10%, 20 %, 30%, 40%, 50%, 60% of the total
flour. The best results obtained on substitution treatment of F4 with TB were as much as 15% and 30% of TLK
which has a water content of 3.71%, ash content of 5.09%, the protein content of 10.67%, fat content of 16.94%,
carbohydrate content of 63.58%, β-carotene with 2.81 µg/g, vitamin E of 0.59 mg / 100 g, TDF of 10.64% db, the
antioxidant capacity of 668.52 ppm GAEAC, and IC 50 amounted to 145.19 mg / mL. Sensory acceptance is based
on the overall quality attributes of a score of 4.13 (quite like to like).
Keywords: Flour, Bran, Pumpkin, and Chips Simulation
I. INTRODUCTION
Indonesian people have a habit of eating a snack. Snacks
are light meals consumed between main meals. Snack
consumption is generally more or less 2-3 hours between
main meal times, which are at 10 am and 4 pm. The
habit of eating snacks is one of the business
opportunities for the snack industry, as evidenced by the
increasingly diverse types of snacks that have flooded
the market, based on wheat flour, soy flour, chocolate,
fruit, and nuts.
Snacks on the market is still dominated by dense foods
contain a lot of calories and monosodium glutamate
(MSG) (Pajajaran University, 2012). Eating snacks with
high MSG content in large quantities and on an ongoing
basis can cause health problems. To address this, now
healthy snack began much talked about, because people
began to realize the importance of the quality of food
consumed to maintain health. The criteria of healthy
snacks are to contain vitamins, protein, and fiber food
(Kompas, 2009). Consumption of healthy snacks can
provide extra energy to move, and help meet the energy
needs until the main meal.
Chips are generally made in an intact form in
accordance with the raw materials, such as banana,
cassava, and potato chips. Besides the chips processed
products, there are also other types of product chips,
known as the simulated chips. Simulated Chips are a
snack that is processed by shaping the dough, made of
thin sheets, sliced, dried and fried (Matz, 1984).
Processing chips in dough forms possible using raw
materials that have high nutritional value, containing
dietary fiber, and antioxidants to produce a healthy
snack. To get healthy snack products, it is preferably
using raw materials derived from nature without using
additional materials made from chemicals. One type of
local food that can be used are rice bran and fruit
pumpkin. Bran and pumpkin contains a complete

International Journal of Scientific Research in Science and Technology (www.ijsrst.com)
99
nutrient (carbohydrate, protein, fat, minerals and
vitamins) as a source of dietary fiber and antioxidants.
To facilitate the consumer in processing chips, rice bran,
and pumpkin fruit can be processed into flour.
Bran is rice mill waste, which is generally used as cattle
feed, while rice bran can be used as a food ingredient,
they are natural healthy foods and as sources of
antioxidants (Ramezanzadeh et al., 1999 and Iqbal et al.,
2005). Components of essential substances in bran is a
food fiber, as a source of calcium mineral of 500-700
mg/100g and magnesium at 600-700 mg/100g, contains
vitamin B complex, vitamin E, essential fatty acids and
amino acids (Astawan, 2009; Damayanthi et al., 2010;
and Pasha et al., 2002).
Pumpkin including types of vegetables that can be
grown in the lowlands to high, between 0-1500 m above
the sea level (Hendrasty, 2003), generally the fruit of
pumpkin can be grown in the tropics and sub-tropics
(Kulkarni et al., 2013). Pumpkin is a source of
carotenoids, pectin, mineral salts, vitamins and other
bioactive substances, such as phenolic compounds
(Cerniauskiene et al., 2014). The yellow color of
pumpkin showed β-carotene compound that can be used
as a food ingredient alternatives to increase the amount
of β-carotene which the body needs daily (Usmiati et al.,
2005).
Products of simulated chips that have been researched
are simulated chips of low fat bran flour substitution by
Damayanthi and Listyorini (2006), the addition of 10%
low fat bran flour is the best formula of simulated chips,
but from the tests of sensory to the flavor of low fat bran
flour simulated chips has left slightly bitter taste. To
improve the taste of simulated chips, it can be done with
pumpkin flour substitution that has flavor and sweeter
aroma than the bran flour.
Utilization of bran flour (TB) and pumpkin flour (TLK)
with other supporting materials produce healthy snacks
that contain dietary fiber and antioxidants. Research on
the substitution of bran flour with pumpkin flour in food
products has not been widely conducted. The purpose of
this study was to determine the influence of the
proportion of the addition of bran flour (TB) and
pumpkin flour (TL) to the physical properties (yield,
hardness, and color), chemical (proximate, amylose,
vitamin E, β-carotene, dietary fiber, and total
antioxidant), and sensory quality of the simulated chips.
II. METHODS AND MATERIAL
A. Materials
Bran used was obtained from farmers in Tabanan
regency, while the pumpkin fruit is obtained from
farmers in the Sub-district of Petang, Badung Regency,
Bali. Additional materials used consisted of flour, green
beans, onions, garlic, salt, refined sugar, baking powder,
and margarine.
Chemicals used consisting of sulfuric acid (H2SO4),
boric acid (H3BO3), HCL 0.02 N, hexane, Na-phosphate
0.1M, 0.1 ml of the enzyme amylase, the enzyme pepsin,
pancreatic enzyme, 4M HCL, NaOH, 1,1-diphenyl-2-
2picrylhydrazyl (DPPH), petroleum ether, ascorbic acid,
ethanol, alcohol, methanol, potassium hydroxide, α-
tocopherol, methyl alcohol, and nitrite. All chemicals
used for the analysis was obtained from Merk
(Darmstadt, Germany).
Equipment used in the oven (with the brand of Shellab-
USA, Type: 1370 FX), microwave oven with Kris
brands with specification: 230V-50 Hz, 1400 W with a
frequency of 2450 MHz, and the Genesys
spectrophotometer 10S UV-VIS.
B. Methods
This study was conducted in January through March
2014. The processing of simulated chips was conducted
at the Laboratory of the Institute for Agricultural
Technology (BPTP) Bali, while the chemical analysis
was conducted at the Laboratory of Food Technology of
Agriculture, University of Udayana, the Center for
Postharvest Laboratory Testing Bogor, and the
Laboratory of Food and Nutrition Faculty of
Agricultural Technology of UGM.
Sample Preparation
Rice bran is derived from paddy varieties of Cigeulis.
The drying of the rice bran was conducted by using
microwave oven (OM) on the power of 200 watt for 15
minutes. Fruit pumpkin originated from the species of

International Journal of Scientific Research in Science and Technology (www.ijsrst.com)
100
Cucurbita moschata (yellow squash or pumpkin), dried
using OM to the power of 300 watt for 4 hours.
The processing of the simulated chips was made by
mixing all the ingredients into doughs that can be
formed. Subsequently made of thin sheets and molded
round. The drying of simulated chips using an oven at
60°C for 2 hours (until dry). Simulated chips that have
been dried were fried at a temperature of 190°C for 21
seconds.
Substitution treatment of TB and TF on simulated chips
is the addition of TB consists of seven levels: 0%, 5%,
10%, 15%, 20%, 25%, and 30% of the total flour. While
the addition of TLK consists of seven levels: 0%, 10%,
20%, 30%, 40%, 50%, and 60% of the total flour. The
design used in this research is CRD (completely
randomized design) which is repeated four times in each
treatment.
C. Chemical Analysis
1. Proximate Analysis
Proximate analysis was conducted on water content and
ash content using the oven method (Apriyanto, 1989),
protein content using the Micro-Kjeldahl (Apriyanto,
1989), fat content using Soxhlet (Apriyanto, 1989), and
the carbohydrate content using carbohydrate by
difference (Apriyantono , 1989).
2. Analysis of Food Fiber
Analysis of dietary fiber content was conducted by using
the Multi-Enzyme (Asp et al, 1983). The analysis was
conducted using three types of enzymes, the amylase
enzyme, the enzyme of pepsin and the pancreatic
enzymes.
3. Analysis of Vitamin E
Analysis of the levels of vitamin E was calculated using
HPLC. 2 g sample was weighed, ethanol and saponified
with KOH, then extracted with petroleum ether. Results
of concentrated sample was vaporized in the evaporator,
the rest of the concentrates was dissolved in 2 ml of
methanol. Chromatography using the mobile phase
methanol : water (97:3) with a flow rate of 1.2 ml/min.
Quantitative determination of vitamin E using UV at a
wavelength of 295 nm, the column at a temperature of
24oC.
4. Antioxidant Capacity
Test of antioxidant capacity was conducted by using the
DPPH (Blois, 1985). Antioxidants of gallic acid are used
as a comparison. The crude extract sample was
dissolved in methanol P.A. to obtain a concentration of
200, 400, 600, and 800 ppm. Extract solution and the
solution antioxidant of Gallic acid derived respectively
4.50 ml and treated with 500 mL of 0.1 mM DPPH
solution in a different test tube. The reaction reached at
37°C for 30 minutes and then the measure of the
absorbance was measured using a spectrophotometer at
a wavelength of 517 nm. Antioxidant capacity is
determined by a standard curve of gallic acid in reducing
free radical DPPH 0.1 mM by the formula of:
Antioxidant capacity (ppm) = X (mg/L) x fp x TV (L) x
1000000
w (mg)
Notes : X = concentration of gallic acid
standard regression equation
fp = dilution factor
TV = total volume
w = sample weight
Absorbance of the reference solution is measured to
perform the calculation of percent inhibition. The
reference solution prepared by reacting 4.50 ml of
methanol with 500 mL of 0.1 mM DPPH solution in a
test tube. IC 50 value searched by using a standard curve
equation of % inhibition as the y-axis and the
concentration of antioxidants as a fraction of the x-axis.
IC 50 is calculated by entering a value of 50% inhibition
in a standard curve equation as the y-axis is then
calculated the value of x as the concentration of IC 50.
IC 50 value declared the concentration of the sample
solution needed to reduce DPPH free radicals by 50%.
Inhibition of the sample extract against 0.1 mM DPPH
radical is determined by the formula of :
% inhibition = absorbance of the blank - sample
absorbance X 100%
absorbance of the blank

International Journal of Scientific Research in Science and Technology (www.ijsrst.com)
101
5. Sensory Test
The sensory tests used were the test of description, test
of preferences (hedonic) and test of ranking methods of
Soekarto (1995). The tests were carried out by using 10
panelists on the description of the quality attributes of
color, aroma, flavor, texture, taste and the after taste.
The rating scale of the simulation chips quality attributes
are: grade 1 = very weak; grade 6 = very severe. The
preference or hedonic test was performed by using 40
semi-trained panelists to assess the parameters of color,
aroma, texture, taste, and overall acceptance of the
simulation chips used in the assessment. There are 6
grades in the hedonic test assessment, namely 1 =
strongly dislike, 2 = dislike, 3 = somewhat dislike, 4 =
somewhat like, 5 = like, and 6 = very like. The ranking
test was used to determine the most preferred
formulations; rank 1 indicates the most preferred
product. Assessment is done by 40 semi-trained
panelists. Panelists of semi-skilled and well-trained
recruits are students of Food Technology of the Udayana
University.
Statistical Analysis
The observed data were analyzed by analysis of variance
(ANOVA) using SPSS 16. Results of analysis of
variance were significantly different (p <0.05) followed
by a further test of Duncan's multiple range test (DMRT).
III. RESULT AND DISCUSSION
Antioxidant capacity and IC 50
Results of analysis of variance of simulation chips
substitution of TB and TLK showed significant
differences (p <0.05) on antioxidant capacity and IC 50.
Increased antioxidant capacity of simulation chips was
comparable with the addition of TB and TLK, but the
reverse condition occurred in IC 50, in which IC 50
values decreased with the increasing substitution of TB
and TLK (Table 1). The high antioxidant capacity in
simulation chips was caused by TB contains the
antioxidant capacity of 92.13 ppm GAEAC, and TLK
contains the antioxidant capacity of 184.40 ppm
GAEAC.
Table 1. The Average antioxidant capacity and IC 50
simulation chips with TB and TLK
substitutions
Treatment
(TB% :
TLK%)
Antioxidant Capacity
(ppm GAEAC)
IC 50
(mg/mL)
F1 (Control) 284.21 ±74.04a 393.36 ± 28.46
e
F2 (5:10) 428.68 ±51.52b 239.27± 9.81
d
F3 (10:20) 545.00± 24.68c 185.83± 7.57
c
F4 (15:30) 668.52 ± 80.94d 145.19± 15.16
b
F5 (20:40) 685.09± 80.72d 138.45 ± 14.86
ab
F6 (25:50) 721.88± 55.43d 126.66± 5.94
ab
F7 (30:60) 761.28± 42.50d 120.59± 4.20
a
kk (%) 10.56 7.51
Description : Figures followed by the same letter in
each column, indicating no different at the level of 5%
Duncan test
IC50 value of simulation chips decreases with the
increasing of TB and TLK substitutions. The highest IC
50 value was found in the F1 treatment of 393.36
mg/mL and the lowest was for the treatment F7 of
120.59 mg/mL. According to June et al., (2003), IC 50
values of simulation chips on the treatment of F2 to F7
at 120.59 mg/mL to 239.27 mg/mL have the ability to
moderate antioxidant activity, whereas treatment F1 has
the capability of weak antioxidant activity with the value
of 393.36 mg/mL. This indicates that the substitution of
TB and TLK on simulated chips has the potential of
free-radical scavengers, with an average concentration
of 120.59 mg/mL have been able to ward off free
radicals by 50%.
The contents of the IDF, SDF and TDF
Results of analysis of variance of the simulation chips
significantly affect (p <0.05) the insoluble dietary fiber
(IDF), soluble dietary fiber (SDF), and total dietary fiber
(TDF), as presented in Table 2. The increased levels of
IDF, SDF, and TDF of simulation chips were
comparable with the addition of TB and TLK. This is
because the TB contain the IDF by 30.51% db, SDF
6.31% db, and TDF of 36.82% db while TLK contained
IDF of 5.00% db, SDF of 10.21% db, and TDF of 15.22%
db.
Table 2. The average of IDF, SDF and TDF simulation
chips, with the substitution of TB and TLK

International Journal of Scientific Research in Science and Technology (www.ijsrst.com)
102
Treatment
(TB% :
TLK%)
IDF
(% db)
SDF
(% db)
TDF
(% db)
F1 (Control) 3.90± 0.05a 3.09 ± 0.42
a 6.77± 0.22
a
F2 (5:10) 4.75± 0.37a 3.54± 0.28
ab 7.89± 0.10
b
F3 (10:20) 6.68 ± 0.35b 3.96± 0.63
bc 10.54± 1.03
c
F4 (15:30) 6.62± 0.43b 4.02± 0.08
bc 10.64±
0.50cd
F5 (20:40) 6.94± 0.74bc
4.07± 0.26c 11.01±
0.89cde
F6 (25:50) 7.49± 0.59cd
4.08 ± 0.15c 11.57±
0.69de
F7 (30:60) 7.76± 0.48d 4.17± 0.06
c 11.93± 0.44
e
kk (%) 7.57 7.57 6.35
Description : Figures followed by the same letter in each
column, indicating no different at the level
of 5% Duncan test
The content of TDF of simulation chips from the results
of the research can be used as a source of dietary fiber
because it contains TDF more than 6 g/100 g, the results
of this research is in accordance with the statement of
Friska (2002), which said food is the source of fiber if it
contains 3-6 g/100 g of TDF.
Vitamin E and β-carotene
The results of the analysis of the simulation chips
variant significantly affect (p<0.05) on the content of
vitamin E and β-carotene. The content of vitamin E and
β-carotene increased with increasing addition of TLK
for TB and TLK because TB is rich in vitamin E and
TLK containing β-carotene (Table 3). The increasing
amount of vitamin E and β-carotene was due to TB raw
materials of Cigeulis varieties contain vitamin E
amounted to 2.05 mg/100 g. The same was said by
Pongjanta (2006), that there was an increase in the
content of β-carotene on bread, cake, and cookies at 10-
50% substitution of TLK.
Table 3. The Average of Vitamin E and β-carotene
simulation chips substitution with TB and
TLK
Treatment
(TB% : TLK%)
Vitamin E
(mg/100 g)
β-carotene
(µg/g)
F1 (Control) 0.16 ± 0.07a 0.25 ± 3.23
a
F2 (5:10) 0.25 ± 0.02a 1.49 ± 36.41
b
F3 (10:20) 0.36 ± 0.07a 2.52 ± 23.87
c
F4 (15:30) 0.59 ± 0.15b 2.81 ± 17.28
cd
F5 (20:40) 0.71 ± 0.18bc
3.06 ± 10.83d
F6 (25:50) 0.80 ± 0.10c 3.71 ± 28.33
e
F7 (30:60) 0.88 ± 0.09c 4.13 ± 28.18
f
kk (%) 16.68 9.23
Description : Figures followed by the same letter in each
column, indicating no different at the level
of 5% Duncan test
The Content of Proximate
Results of analysis of variance substitution treatment of
TB and TLK of simulation chips significantly affect
(p<0.05) on moisture, ash, protein, fat, and
carbohydrates, as shown in Table 4. The highest water
content of the simulation chips was in treatment of F1
(5.26 %), followed by water content dropped with the
increasing substitution of TB and TLK. This was due to
reduced content of gluten on simulation chips. Gluten is
found in wheat flour water served as a binder and
forming the dough elasticity. The water content of
simulation chips was also affected by the water content
of TB and TLK used. The water content of TB that is
used has a moisture content of 10.54% and TLK water
containing of 7.64%, lower than the water content of
wheat flour by 14.5%.
The results of this research are consistent with the
results of research by Silvi et al., (2011), on a wet
noodle products, substitution of wheat flour with 20%
TLK has a water content of 32.12% lower compared
with controls, at 35.42%. The same thing happened to
sausage products, where fortification with TLK can
lower the water levels of sausage (Agus et al., 2009).
According to the SNI, the water content of the chips in
general is a maximum of 5-6%, while the moisture
content of simulation chips of the study has met the SNI
standards.
Table 4. The average content of the proximate of
simulation chips with TB and TLK
substitution
Description : Figures followed by the same letter in each
column, indicating no different at the level
of 5% Duncan test

International Journal of Scientific Research in Science and Technology (www.ijsrst.com)
103
Ash, protein, and fat contents of the simulation chips
increased with the increasing substitution of TB and
TLK (Table 4). This is because the ash, protein, and fat
contents of TB were greater than the wheat flour. The
research results of Damayanthi and Listyowati (2006),
showed that there was an increase in ash content of 3.01%
and amounted to 7.96% protein on the simulation chips
with the addition of 20% low-fat TB. The same results
were found in biscuit products substitution of wheat
flour with TLK by Kulkarini and Joshi (2013), who
mentioned that there were increased levels of fat in
biscuits with the increasing substitution of TLK. On the
contrary the carbohydrate levels dropped with higher
substitution of TB and TLK.
Carbohydrate content of the simulation chips decreased
significantly, with the increasing substitution of TB and
TLK (Table 4). The same results were expressed by El-
Demery (2011), stating substitution to 20% of TLK on
toast, which contain carbohydrates by 51.38% lower
than in the controls (57.03%). Statement of Damayanthi
and Listyorini (2006), the low-fat simulation chips are
TB control carbohydrate1 content (73.48%) is higher
than the carbohydrate content of simulation chips with
the addition of 20% of low fat TB, amounting to 71.48%.
It is also stated by See et al., (2007) in baked goods,
with the addition of 15% carbohydrates of TLK by
42.44%, lower than in the controls, at 46.28%.
Physical Analysis
The results of the analysis of the physical properties of
simulation chips significantly effect (p<0.05) on the
color parameters of L, a, and b, as shown in Figure 1.
Color L means brightness that indicates the value of L
decreases with the increasing substitution of TB and
TLK. Values of L simulation chips ranged from 53.79 to
69.89 that show the brightness range from 0-100. L
color change is proportional to the reduction in the
moisture content of the simulation chips. Chips with low
water content has a dense texture and hard, so that when
the frying process uses high temperatures, the water in
the material and the surface is out in the form of water
vapor and simultaneously hardening occurs on the
surface of the material that causing the dark color
(Jamaluddinet et al., 2011 and Wibawa et al., 2006). The
color L decreased is allegedly due to the mailard
reaction at high temperature (Jamaluddinet et al., 2011
and Norfezah, 2013) and because TLK has a high sugar
content (Norfezah, 2013).
Figure 1. Graph Values of L, a, and b of simulation
chips by substitution of TB and TLK
The a value of simulation chips increased with
increasing addition of TB and TLK. The value of a, is
the dimension of red-to-green. Simulating chips product
has a positive value between 0.74 to 4.76 which is
denoted by the red color. Simulating chips have a value
of b, between 28.13 to 33.67 which have a positive value
between 0-70 so it is denoted as the yellow color (Figure
1).
Sensory Test
Sensory tests used in products of simulation chips are
description test, test of preferences (hedonic), and test of
ranking. The test results description of sensory attributes
to determine the effect intensity of each attribute of the
experiment, as presented in graphical form of Spider
web (Figure 2).

International Journal of Scientific Research in Science and Technology (www.ijsrst.com)
104
Figure 2. Spider web graph description assessment of
simulation chips with the addition of TB and TLK
Description about the yellow color and aroma increases
with the increasing addition of TB and TLK, this was
due TLK has a stronger color and aroma than TB. The
texture of simulation chips hardened with the increasing
addition of TB and TLK. While the increase in TB and
TLK additions can increase the intensity of flavor and
the after-taste of the simulation chips to bitter taste. It is
associated with a color change of b toward yellow-
brown due to high frying temperatures, so that the water
at the surface and inside the material evaporated in large
quantities and the remain is hard solids that can affect
the taste of the product (Figure 2).
Results of analysis of hedonic test on the variants of
simulation chips significantly affect (p<0.05) on color,
aroma, texture, taste, and overall acceptance (Table 5).
Assessment of the panelists using hedonic test
(preference) of the color, aroma, texture, taste, and
overall acceptance of simulation chips was even lower
with the increasing addition of TB and TLK. Panelists
did not like the dark color of simulation chips; it is
because there was damage of carotenoids, and because
of the reaction of mailard due to high sugar levels of
TLK.
Table 5. The average of hedonic test of simulation chips
with TB and TLK substitution
Description : Figures followed by the same letter in each
column, indicating no different at the level
of 5% Duncan test
Panelists overall assessment is strongly influenced by
the flavors of the simulation chips, because the taste
plays an important role whether the food product is
accepted by the panelists. Winarno (1992), stating that
the preference and overall acceptance of the food in the
mouth is the chemical interaction with the receptor
through a process that is complicated and complex, so
through this process a favorite food can be known
through perception.
The results of test analysis on ranking of simulation
chips of TB and TLK substitutions can be seen in Figure
3. Treatment of F2 was based on assessment of the
panelists that achieved the first rankings, but not
significantly different (p>0.05) from treatment with F3.
The second ranking is the treatment of F3 and not
significantly different (p>0.05) from treatment with F1.
Treatment F4 achieved the fourth ranking that
significantly affect (p<0.05) on the treatment of F1, F2,
F3, F5, F6, and F7. While treatment F5, F6, and F7 are
not preferred by the panelists because it tends to be dark
in color, hard texture, and taste bitter.
Figure 3. Test chart ranking of simulation chips with the
treatment of TB and TLK addition
Description : TB treatment (%): TLK (%); where F1 (0:
0); F2 (5:10); F3 (10:20);
F4 (15:30); F5 (20:40); F6 (25:50); and F6 (30:60)

International Journal of Scientific Research in Science and Technology (www.ijsrst.com)
105
The Best Method Selection
The decision-making was to determine the best
treatment by using the method of Effectiveness Index.
The principle of this method is to compare the measured
parameters, namely proximate, antioxidant capacity, IC
50, dietary fiber, β-carotene, objective color, and
sensory testing. The best alternative is to compare the
value of chemical analysis and sensory test by looking at
the value corresponding to the desired goal in this
research.
Effectiveness Index analysis of the chemical analysis of
simulation chips that have the highest Total Value of
Products (TVP) was on F7 treatment followed by
treatments of F6, F5, F4, F3, F2 and F1. While on the
TVP that based on sensory testing, treatment F3 has the
highest TVP, followed by treatments of F1, F2, F4, F5,
F6 and F7 (Table 6). By comparing the TVP chemical
analysis, sensory testing and the expected goals, the F4
treatment is selected as the best treatment. This is
because the F4 treatment contains antioxidants, β-
carotene, dietary fiber, and high nutrient content and by
sensory was acceptable by the panelists. Although the
real value of TVP chemical analysis of 0.64 (the fourth
ranking) and the sensory value of TVP 0.62 (the fourth
ranking), with the assumption that if the treatment of F7
with a value of the highest TVP of 0.67 which was
selected but not accepted by the panelists because it has
the lowest TVP of 0.00.
Table 6. Selection of the best methods of simulation
chips with TB and TLK substitution
Treatment Total Value of Product (TVP)
(TB% : TLK%) Chemical
Analysis
Sensory
Test
F1 (Control) 0.34 0.92
F2 (5:10) 0.45 0.88
F3 (10:20) 0.57 0.98
F4 (15:30) 0.64 0.62
F5 (20:40) 0.63 0.34
F6 (25:50) 0.66 0.17
F7 (30:60) 0.67 0.00
IV. CONCLUSION
The conclusions of this research are :
1. The best formula of characteristics of physico-
chemical properties of simulation chips is on the
F4 treatment, with the addition of TB by 15%,
and TLK by 30%. Chemical characteristics of
the simulation chips have a water content of
3.71%, ash content of 5.09%, the protein
content of 10.67%, fat content of 16.94%, and
the carbohydrate content of 63.58%.
2. Simulation chips with the best formula contains
β-carotene of 2,81 g, vitamin E of 0.59 mg/100
g, the IDF amounting to 6.62% db, SDF 4.02%
db, TDF of 10.64% db, antioxidant capacity
amounted to 668.52 ppm GAEAC, and IC 50
amounted to 145.19 mg/mL.
3. Characteristics of the physical properties of the
best formula simulation chips is based on
objective measurement of color, that it has
value of L of 60.96 (brightness range 0-100),
value of a of 3.18 (as the red color), and the
value of b 30.37 ( as a yellow-to-blue).
4. Sensory characteristics of simulation chips best
formula is based on test description of the color
with the intensity of 4.40 quality attributes
(light yellow to yellow), the intensity of the
aroma quality attributes at 3.55 ( weak to strong
aroma), the intensity of the texture quality
attributes at 1.65 ( hard to crisp texture), the
intensity of flavor quality attributes of 1.60 (a
savory to bitter taste), and quality attributes
mouth-feel intensity of 1.80 (kind of like to
like).
5. The panelists assessment of the hedonic test on
simulation chips on the F4 treatment, on the
color of 3.63 (somewhat like, to like), on aroma
of 4.33 (somewhat like to like), on the texture of
4.50 (somewhat like to like), on the taste of 4.28
(somewhat like to like), and the overall
acceptance of 4.13 (somewhat like to like). The
assessment of the panelists was based on the
ranking test shows that the F1, F2, F3, and F4

International Journal of Scientific Research in Science and Technology (www.ijsrst.com)
106
formulas are preferred by the panelists
compared with F5, F6 and F7 formulas.
6. Treatment F4 is the best treatment with TVP on
chemical analysis of 0.64 and sensory analysis
of 0.62.
V. REFERENCES
[1] Agus, H.P., F. Miskiyah, A.V. Rachmawati, T.M.
Baghaskoro, B.P. Gunawan, dan Soeparno. 2009.
Karakteristik Sosis Dengan Fortifikasi β-Caroten
dari Labu Kuning (Cucurbitamoschata). Buletin
Peternakan. 33(2):111-118.
[2] Apriyantono, A., D. Fardiaz, N.L. Puspitasari,
Sedarnawati, dan S. Budiyanto. 1989. Petunjuk
Laboratorium Analisis Pangan. Bogor : IPB.
[3] Asp, N., G. Johansson, Halmer, and Siljestrom.
1983. Rapid Enzimatic Assay of Insoluble and
Soluble Dietary Fiber. Journal Agritech of Food
Chemistry, 31: 476-482.
[4] Astawan, M. 2009. Bekatul Gizinya Kaya Betul.
Diakses dari : http://www.kompas.com. Tanggal : 19
Pebruari 2012.
[5] Blois, M.S. 1958. Antioxidant Determination by the
Use of Electron Free Radical. Nature, 8: 1199-1200.
[6] Cerniauskiene, J., J. Kulaitiene., H. Danilcenko., E.
Jariene, dan E. Jukneviciene. 2014. Pumpkin fruit
flour as a source for food enrichment in dietary fiber.
Not Bot Horti Agrobo.42(1):19-23.
[7] Damayanthi, E dan D. I. Listyorini. 2006.
Pemanfaatan Tepung Bekatul Rendah Lemak Pada
Pembuatan Keripik Simulasi. Jurnal Gizi dan
Pangan, 1(2): 33-34.
[8] Damayanthi, E., L. Kustiyah., M. Khalid., dan H.
Farizal. 2010. Aktivitas Antioksidan Bekatul Lebih
Tinggi Daripada Jus Tomat Dan Penurunan Aktivitas
Antioksidan Serum Setelah Intervensi Minuman
Kaya Antioksidan. Jurnal Gizi dan Pangan, 5(3):
205-210.
[9] El-Demery, M.E. 2011. Evaluation of Physico-
chemical Properties of Toast Breads Fortified with
Pumpkin (cucurbita moschata) flour. Annual Sci.
Conf : The 6th Arab and 3rd International.
[10] Friska, T. 2002. Penambahan Sayur Bayam
(Amaranthus ticolor L.) Sawi (Brassica juicea L.)
dan Wortel (Daucus carota L.) pada Pembuatan
Crackers Tinggi Serat Makanan. Skripsi. Jurusan
Gizi Masyarakat dan Sumberdaya Keluarga. IPB.
Bogor.
[11] Hendrasty, H.K. 2003. Tepung labu kuning:
pembuatan dan pemanfaatannya. Yogyakarta :
Karnisius.
[12] Iqbal, S. M.I. Bhanger and F. Anwar. 2005.
Antioxidant Properties and Components of Some
Commercially Available Varietas of Rice in
Pakistan. Food Chem. 93:265-272.
[13] Jamaluddin, B. Rahardjo, P. Hastuti, dan Rochmadi.
2011. Model Perubahan Warna Keripik Buah
Selama Penggorengan Vakum. Agritech. 31(4):333-
343.
[14] June, M.H.Y., J. Fong, X., Wan, C.S., Yang, C.T,
dan HO. 2003. Comparison of antioxidant activities
of isoflavones from kudzu root (Pueraria labata
ohwl). J. Food. Sci. Inst. of Tech. 68:2117-2122.
[15] Kompas. 2009. Ngemil Gak Bikin Gemuk. Diakses
dari : http://www.female.kompas.com. Tanggal : 3
Mei 2013.
[16] Kulkarini, A.S dan Joshi, D.C. 2013. Effect of
Replacement of Wheat Flour With Pumpkin Powder
on Textural and Sensory Qualities of Biskuit. J. Int.
Food Research. 20(2):587-591.
[17] Matz, S.A. 1984. Snack Food and Technology. The
AVI Publishing Company, Wesport, Connecticut.
[18] Norfezah, MD. N. 2013. Development of Expanded
Snack Foods Containing Pumpkin Flour and Corn
Grits Using Extrusion Technology. Disertasi.
Massey University, Palmerston North. New Zealand.
[19] Pasha, I., M.S. Butt, F.M. Anjum, dan N. Shahzadi.
2002. Effect of Dietetic Sweeteners an the Quality of
Cookies. Int. J. Agric. Biol. 4(2). 245-248.
[20] Pongjanta, J., Naulbunrang, A., Kawngdang, S.,
Manon, T. dan Thepjaikat, T. 2006. Utilization of
pumpkin powder in bakery products. J. Sci. Technol.
28 (Suppl.1):71-79.
[21] Ramezanzadeh, F,M., R.M. Rao, M. Windhauser, W.
Prinyawiwatkul, dan W.E. Marshall. 1999.
Preventation of Oxidative Rancidity in Rice Bran
During Storage. Lousiana State University.
[22] See, E.F., Wan Nadiah, W.A, dan Noor Azizah, A.A.
2007. Physico-chemical and Sensory Evaluation of
Breads Supplemented with Pumpkin Flour. J. Food
Asean. 14(2): 123-130.
[23] Silvi, L.R., Indriyani, dan Surhaini. 2011.
Penggunaan Buah Labu Kuning Sebagai Sumber
Antioksidan dan Pewarna Alami pada Produk Mie
Basah. J. Penelt. Univ. Jember Seri Sains. 13(2):29-
36.
[24] Soekarto, S. T. 1995. Penilaian Organoleptik untuk
Industri Pangan dan Hasil Pertanian. Jakarta :
Penerbit Bharata Karya Aksara.
[25] Universitas Padjadjaran. 2012. Tentang Camilan.
Diakses dari : http://www.himatipan.ftip.unpad.ac.id.
Tanggal : 3 Mei 2013.
[26] Usmiati, S., D. Setyaningsih., E.Y. Purwani., S.
Yuliani, dan Maria O.G. 2005. Karakteristik serbuk
labu kuning (Cucurbita moschata). J. Tek. Dan Ind.
Pang.16(2):157-167.
[27] Winarno. 1992. Kimia Pangan dan Gizi. PT.
Gramedia, Jakarta.

IJSRST162415 | Received : 14 July 2016 | Accepted : 29 July 2016 | July-August 2016 [(2)4: 107-111]
© 2016 IJSRST | Volume 2 | Issue 4 | Print ISSN: 2395-6011 | Online ISSN: 2395-602X Themed Section: Science and Technology
107
Bioinformatics Tools for Protein Analysis
Mahin Ghorbani1*, Fatemeh Ghorbani2, Hamed Karimi3
1Department of Biotechnology, Fergusson College, F.C. Road, Pune, Maharashtra, India 2Centre for continuing education, John Abbott College, Montreal, Quebec, Canada
3Department of computer engineering, Azad university of Farsan, Chaharmahal va bakhtiari, Iran
ABSTRACT
Understanding of the relationship between amino acid sequence and three dimensional structure of protein is one of
the main objects of bioinformatics, if the relationship is known; it can be helpful for prediction of the protein
structure from its amino acid sequence. In this paper, you will learn the fundamentals of structures of proteins, and
we will discuss the basic tools and databases for protein visualization and classification. On the basis of such
reviews and discussions, you will be able to understand how to predict protein structure and function from its amino
acid sequence. The protein structure databases discussed in this paper are such as Protein Data Bank, NCBI
Structure Database (MMDB). The Protein structure visualization databases and tools discussed here are such as
Cn3-D, Chemscape Chine, Rasmol and Protein Explorer, SWISS PDB Viewer, Mage and Kinemages, and PDBsum.
The protein structure alignment discussed are such as VAST and DALI Server. The Domain Architecture databases
discussed here are CDD, CDART. Discussed tools for plotting protein-ligand interaction is Ligplot and the protein
classification approaches are SCOP and CATH.
Keywords: Bioinformatics Tools, Protein Prediction, Protein Visualization, Protein Classification, Protein Function.
I. INTRODUCTION
A. Protein Structure Overview
Proteins are biomolecules made up chains of 20 different
amino acid residues.For proper performance of
particular biochemical function, a certain number of
amino acid residues are essential and appearance of
lower limit for a functional domain size is around 40-50-
residues. The range for size of the protein is from this
lower limit to several hundred residues in multi-
functional proteins. Proteins normally consist of
thousands of atoms arranged in a 3-dimentional structure
that is specific for each type of protein. While a protein
is formed,it folds itself into a complicated 3-dimentional
shape. Each protein consist of one folded shape, and
regularly folds into it, normally in less than one
second.That complex folded shape directs how the
protein functions and also how it performs its interaction
with others molecules. For making up of each protein, a
gene in the DNA of living cells should code the
particular sequence of amino acid. Synthesis of protein
is not done without its mRNA being present but
persistence of a protein is possible in the cell when its
mRNA is no longer present. However the abundance of
mRNA may be present but there is no message
translation into protein unless genetically required.
There is thus no proper correlation between protein and
its mRNA in a living cell at any given time. Protein
synthesis is a very complex process. Ribosomes
employed as protein factories, RNA forms bridge in
ribosomes and work as support structures as well as
protein forming machinery.
There are four level of organization during protein
structure analysis: primary structure is the chain of
amino acid sequence of the protein. Every protein owns
a unique amino acid sequence. Secondary
structure :spatial arrangement of protein framework
without its side chain conformation. Tertiary structure is
three dimentional structre of entire protein. Quaternary
structure refers to 3-D structures of proteins that consist
of two or more polypeptide chains, referred as sub-units.
In primary structure of protein, the sequence is held
together by covalent peptide bond, in 3-D structure of

International Journal of Scientific Research in Science and Technology (www.ijsrst.com)
108
protein, the structure held together by variety of bonds
such as: ionic bonds, hydrogen bonds, covalent bonds
and hydrophobic interactions. Proteins and their
structures are made up of polypeptides and
domains(motifs). A short conserved region in a protein
is called as motif and domain refers to a distinct portion
of a protein estimate to fold independently of the rest of
the protein and has its own function.
In primary structure of proteins, amino acids are linked
together via the peptide bonds that are made up of the
reaction of alpha –carboxyl group of one amino acid
with alpha –amino group of another amino acid. For
characterization of a protein its unique amino acid is an
important part. For obtaining information about primary
structure of protein we can use PROWL. This site will
provide you with information about amino acid
properties, their allowed bond geometry, probability for
being interior residue versus exterior residues and which
amino acid substitution are likely to maintain function
and structure. This site also gives other information
required for prediction of protein structure and function
based on primary structure.
In secondary structure variety of structural elements are
present such as alpha-helix, Beta sheet and random coil.
In addition loops and turns, folds and motifs are present.
Each of these structures can be predicted using different
software which will be discussed in the next step.
In Tertiary structure, the arrangement of the polypeptide
in 3-D far from its linear sequence is represented. This
arrangement is as result of interactions between R-
groups via van der waals, hydrogen and hydrophobic,
ionic bonding. Motifs and domains are appeared in this
structure level. Some examples are: Hairpin Beta-
motif,Greek Key motif, Beta-alpha-beta motif.
Domains also appear in tertiary structure level.
Polypeptide chains are more than 200 amino acid in
length and fold into two or more compact globular
cluster are known as domain. usually there are three
types of domains: alpha domain, Beta domain and
alpha/Beta domains.In quaternary structure, those
proteins with more than one polypeptide chains are
considered like haemoglobin.
Classification of protein based on structure: There are
four types for classification of protein based on the
structure such as type 1: alpha (Predominantly or core,
exclusively alpha helices) example: Bundle and non-
bundle, Beta(predominantly or core, primarily beta
strand) example: Roll Barrel,Sandwich, single sheet,
Alpha/Beta (Predominantly alternating Alpha-helix and
beta-stand) example :Beta Alpha Beta motif, Alpha and
Beta (Alpha helices and beta strand regions as separate
grouping) example : Anti –parallel Beta sheet.[1-6].
II. METHODS AND MATERIAL
A. Protein structure Databases
Protein Data Bank (PDB) : PDB is a very large universal
storage place of processing and distribution of 3-
dimensional structure data of macromolecules. the
information in PDB derived from variety tools and
experiments like NMR, X-ray crystallography,
microscopy, cryoelectron and theoretical modeling,.
Accommodations of the database for users are access to
structural data, providing methods for visualizing the
structure and downloading structural information.[7]
NCBI Structure Database (MMDB): It includes database
of 3D structure of biomolecules which experimentally
determined.Most of these data derived from X-ray
crystallography and NMR spectroscopy. The database
provide biologists with a broad information on
biological functions of proteins, on mechanisms related
to their functions and on relationship between
biomolecules and their evolutionary history.Additionally
this database provide biologists with comparative
analysis of 3D structure of proteins. NCBI also called as
MMDB (molecular modeling database) and includes 3D
structure of macromolecules and visualization tools for
comparative analysis of proteins.[8]
Database and tools for protein structure visualization:
Cn3-D : "see in 3-D" is a viewer of structural sequence
alignment for MMDB database. It facilitates viewing of
3-Dstructure and alignment of sequence –structure of
structure-structure. It serves as a helper application for
the browser. Files can be downloaded to the pc and the
application can be launched.[9]
SWISS PDB Viewer:

International Journal of Scientific Research in Science and Technology (www.ijsrst.com)
109
It facilitates and network for analysis of several proteins
simultaneously. The proteins lay over each other in
order to analyze structural alignment and provide
comparison of their active sites, their amino acid
mutations angles, distances and H bonds between their
atoms. This viewer is joined to Swiss-Model server. [10]
Chemscape Chime, Rasmol and protein explorer:
This tool is one of the usual tools for visualization of
protein structure.It can read molecular structure files
from PDB. Chemscape chime serves as a plug in to
permit structure visualization with browser. Protein
explorer serves as a plug in to permit viewing of protein
structure with our browser. Both of these application
namely Chemscape chime and protein explorer are
primary derivation of Rasmol.[11]
Mage and Kinemages:
It is another tool for protein structure visualization. It is
able for rotation of entire image in real time, displaying
of parts by turning off and on them, selection of points
for their identification and animation of change between
different forms.[6]
PDBsum :
It is a database that facilitates a large illustrated graphic
summary of the main information on each biomolecular
structure from the protein data bank. It consists of
images of structure, detailed structural analysis derived
from PROMOTIF program, schematic graphs of
interactions, summary PROCHEK results [12]
Protein structure alignment tools:
VAST (vector alignment sequence tool): it is a tool
produced by NCBI and provides identification of similar
proteins with 3D structure. So it is structure similarity
and search service. [13].
DALI : It is an computational protein structure
alignment tool used for comparison of protein structure
in 3D.[14]
B: Domain architecture Database:
Conserved Domain Database :(CDD) : is a database
contain sequence alignment and profiles, showing
protein domain conserved during molecular evolution
course.[15]
CDART: (Conserved Domain Architecture Retrieval
Tool) used for searching protein having similar domain
architectures.[16]
C. Bioinformatics tools for plotting protein –ligand
interactions:
Ligplot : It is used to find out interaction between
protein and ligand also hydrogen and hydrophobic
contacts can be represented in this tool.[17].
D. Approaches for classification of proteins:
Classification of proteins b several databases usually is
on the basis of their structural similarities. Both
structural and evolutionary relationship is factors of their
classification. In hierarchy of proteins several levels
exist but the main level considered are such as Family,
superfamily and fold
Family: In this level proteins are grouped together into
family having clear and known evolutional relatedness
so called as clear evolutionarily relationship level.
Superfamily: In this level proteins are with low sequence
identities but their structural and functional characters
suggest a common evolutionary origin so the level called
as probable common evolutionary origin. This proteins
positioned in superfamily level.
Fold: In this level the proteins are not having
evolutionary origin but structural similarities derived
from physics and chemistry of proteins facilitating
certain chain topologies and packing arrangements. So
this level also called as major structural similarity level.
SCOP: It is a database for structural classification of
proteins. It provides comprehensive classification of
structural and evolutionary relationships between those
proteins with known structures.[18].
CATH: (Class, Architecture, Topology and Homologous
superfamily): This database facilitates a hierarchical
classification for domain structures of proteins, which
cause clustering of proteins at four different levels: C, A,
T, H means Class, Architecture, Topology and
Homologous superfamily, respectively.[19].

International Journal of Scientific Research in Science and Technology (www.ijsrst.com)
110
III. RESULT AND DISCUSSION
Understanding and analysis of proteins structure and
function is one of most important goal of bioinformatics
as proteins are important key in biological science
research and they are directly and indirectly related to
development of diseases, evolution. Mutations and drug
discovery. Knowing their structure and function as well
as structure-function relationship are very important and
helpful to biologists as experimental tools and
technologies are not fully support research studies on
proteins and their role in disease and other issues like
evolution, mutation an drug discovery, investigators help
bioinformatics tools for solving and u deep
understanding of the biological problems.
Experimental technologies possess disadvantages of
time and cost so bioinformatics tools as an alternative
method support biologists to process their research
studies for prediction of protein structures and their
functions.
For example research studies on many proteins like
CDKs, Aquaporins, Ion channels, G -protein coupled
receptors, Biomarkers and so on for drug discovery,
cancer treatment, classification of cancer and so on
depend on prediction of structure or structure-function
relationship of such biomolecules so for such new and
emerging research studies these bioinformatics tools as
accessory or alternative tools are very helpful. These
tools in combination of many other bioinformatics tools
can extent scope of research studies in many aspects for
example tools for gene finding, biological pathways,
SNP detection, bioinformatics tool of microarray
technology and biotechnology tools. [20-29].
IV. CONCLUSION
In this paper, the fundamentals of different structures of
protein discussed as basic information. Protein
visualization and classification tools help biologists to
predict protein structure from its amino acid sequence.
So for conducting the projects related to prediction of
protein structure or understanding protein function
structure, bioinformatics tools can be used in order to
provide precise, fast, low cost results. This paper helps
biologists to understand and learn basic information of
protein structure and bioinformatics tools for
identification, classification and visualization of proteins.
V. REFERENCES
[1] David Lee, Oliver Redfern & Christine
OrengoPredicting protein function from sequence
and structure Nature Reviews Molecular Cell
Biology 8, 995-1005 (December 2007)
[2] J. Westbrook, Z. Feng, L. Chen, H. Yang, H.M.
Berman,The Protein Data Bank and structural
genomics,Nucleic Acids Res, 31 (2003), pp. 489–
491
[3] Benkert P, Biasini M and Schwede T (2011)
Toward the estimation of the absolute quality of
individual protein structure models. Bioinformatics
27(3): 343–350.
[4] Haas J, Roth S, Arnold K et al. (2013) The protein
model portal – a comprehensive resource for
protein structure and model information. Database
(Oxford) 2013: bat031.
[5] Hildebrand A, Remmert M, Biegert A and Söding J
(2009) Fast and accurate automatic structure
prediction with HHpred. Proteins 77(Suppl 9):
128–132.
[6] Rastogi.S. C., Rastogi P and Mendiratta N., 2008.
Bioinformatics Methods and Applications:
Genomics.Proteomics And Drug Discovery PHI
Learning Pvt. Ltd
[7] Berman, H. M. (January 2008). "The Protein Data
Bank: a historical perspective" (PDF). Acta
Crystallographica Section A A64 (1): 88–95.
doi:10.1107/S0108767307035623. PMID
18156675
[8] 8Madej T, Lanczycki CJ, Zhang D, Thiessen PA,
Geer RC, Marchler-Bauer A, Bryant SH. MMDB
and VAST+: tracking structural similarities
between macromolecular complexes. Nucleic
Acids Res. 2014 Jan 1;42(1):D297-303. Epub 2013
Dec 6. doi: 10.1093/nar/gkt1208.
[9] 9Wang Y, Geer LY, Chappey C, Kans JA, Bryant
SH. Cn3D: sequence and structure views for
Entrez. Trends Biochem Sci. 2000 Jun; 25(6): 300-
2. PubMed PMID: 10838572]
[10] Guex, N. and Peitsch, M.C. (1997) SWISS-
MODEL and the Swiss-PdbViewer: An
environment for comparative protein modeling.
Electrophoresis 18, 2714-2723

International Journal of Scientific Research in Science and Technology (www.ijsrst.com)
111
[11] Richardson, D. C.; J.S. Richardson (January 1992).
"The kinemage: a tool for scientific
communication". Protein Science 1 (1): 3–9.
doi:10.1002/pro.5560010102. PMC 2142077.
PMID 1304880.
[12] Laskowski RA (Jan 2001). "PDBsum: summaries
and analyses of PDB structures". Nucleic Acids
Research 29 (1): 221–2. doi:10.1093/nar/29.1.221.
PMC 29784. PMID 11125097
[13] Gibrat JF, Madej T, Bryant SH. Surprising
similarities in structure comparison. Curr Opin
Struct Biol. 1996 Jun; 6(3): 377-85.
[14] Holm L, Sander C. Dali: a network tool for protein
structure comparisonTrends Biochem Sci. 1995
Nov;20(11):478-80.
[15] Marchler-Bauer A, Derbyshire MK, Gonzales NR,
Lu S, Chitsaz F, Geer LY, Geer RC, He J, Gwadz
M, Hurwitz DI, Lanczycki CJ, Lu F, Marchler GH,
Song JS, Thanki N, Wang Z, Yamashita RA, Zhang
D, Zheng C, Bryant SH. CDD: NCBI's conserved
domain database. Nucleic Acids Res. 2015 Jan
28;43(Database issue):D222-2. doi:
10.1093/nar/gku1221. Epub 2014 Nov 20
[16] Geer LY, Domrachev M, Lipman DJ, Bryant SH.
CDART: protein homology by domain architecture.
Genome Res. 2002 Oct;12(10):1619-23.
[17] Wallace A C, Laskowski R A, Thornton J M
(1996). LIGPLOT: a program to generate
schematic diagrams of protein-ligand interactions.
Protein Eng., 8, 127-134
[18] Murzin A. G., Brenner S. E., Hubbard T., Chothia
C. (1995). SCOP: a structural classification of
proteins database for the investigation of sequences
and structures. J. Mol. Biol. 247, 536-540.
[19] Sillitoe I, Lewis, TE, Cuff AL, Das S, Ashford P,
Dawson NL, Furnham N, Laskowski RA, Lee D,
Lees J, Lehtinen S, Studer R, Thornton JM, Orengo
CA,Nucleic Acids Res. 2015 Jan,CATH:
comprehensive structural and functional
annotations for genome sequences.
[20] Ghorbani M and Karimi H. Cyclin-Dependent
Kinases as valid targets for cancer treatment.
Journal of Pharmacy Research 2015,9(6),377-382
[21] Ghorbani M, Karimi H, 'Ion Channels Association
with Diseases and their Role as Therapeutic
Targets in Drug Discovery', International Journal of
Scientific Research in Science and
Technology(IJSRST), 1(3):65-69,July-August
2015.
[22] Ghorbani M, Karimi H, 'Role of Aquaporins in
Diseases and Drug Discovery', International
Journal of Scientific Research in Science and
Technology(IJSRST),1(3):60-64, July-August 2015
[23] Mahin Ghorbani, Hamed Karimi, 'Role of G-
Protein Coupled Receptors in Cancer Research and
Drug Discovery', International Journal of Scientific
Research in Science and Technology
(IJSRST),1(3), pp.122-126, July-August 2015.
[24] Mahin Ghorbani, Hamed karimi, 'Role of
Biomarkers in Cancer Research and Drug
Development', International Journal of Scientific
Research in Science and Technology(IJSRST),1(3),
pp.127-132, July-August 2015
[25] Ghorbani M,Karimi H,Ten Bioinformatics Tools
for Single Nucleotide Polymorphisms, American
Journal of Bioinformatics ;2014:3(2):45-48
[26] Mahin Ghorbani, Hamed Karimi, 'Bioinformatics
Approaches for Gene Finding ', International
Journal of Scientific Research in Science and
Technology (IJSRST),1(4),12-15, September-
October 2015.
[27] Mahin Ghorbani, Hamed Karimi, 'Bioinformatics
Methods for Biochemical Pathways and System
Biology Analysis', International Journal of
Scientific Research in Science and Technology
(IJSRST),1(4),75-79, September-October 2015.
[28] Mahin Ghorbani, Hamed Karimi, Role of
Biotechnology in cancer control, International
Journal of Scientific Research in Science and
Technology (IJSRST),,1(5),180-185, November-
December 2015
[29] Ghorbani M, Karimi H, 'Role of Microarray
Technology in Diagnosis and Classification of
Malignant Tumours', International Journal of
Scientific Research in Science and
Technology(IJSRST), 1(3):117-121, July-August
2015

IJSRST162419 | Received : 20 July 2016 | Accepted : 29 July 2016 | July-August 2016 [(2)4: 112-115 ]
© 2016 IJSRST | Volume 2 | Issue 4 | Print ISSN: 2395-6011 | Online ISSN: 2395-602X Themed Section: Science and Technology
112
Bioinformatics Analysis of Evolution of Secondary Structures of Protein Trypsin Beta
Mahin Ghorbani*
Department of Biotechnology, Fergusson College, F. C. Road, Pune, Maharashtra, India
ABSTRACT
Impact of divergence of amino acid sequences of protein during evolution on the secondary structures of
polypeptide and phylogenetic significance of different secondary structures such as alpha helix, beta sheet and
random coil in evolution are not known. Due to conservation of conformation ally identifiable regions through
evolution, in closely related species, the amino acid sequence will show close similarity, thereby giving rise to
similar structural motifs after folding the proteins. To understand the most conserved secondary structure element of
a protein, we have conducted a bioinformatics work for molecular evolution of protein trypsin beta as a sample in
order to analysis the phylogeny of secondary strucutres (alpha helix, beta sheet and random coil) of proteins Trypsin
Beta among 25 species. In this method we retrieved amino acid sequences of these proteins from 25 species from
protein data bank then folded each individually into 3-D structure using the software J-Pred. From the folded
sequence it was possible to identify sequences in regions forming alpha helix, Beta sheet, random coil, which we
retrieved and individually ligated end-end to obtain peptides made up of sequence in the random coil, alpha helix
and beta sheet conformations ( final functional shape). Then examined the phylogenetic trees built after aligning the
sequence using four different multiple alignment protocols. The result has assumed that random coil of Trypsin beta
was phylogentically most conserved. This project plays significant role in understanding the role of molecular
evolution of proteins and their phylogenic significance.
Keywords: Bioinformatics, Molecular Evolution, Secondary Structures, Trypsin Beta, Multiple Sequence
Alignment, Phylogeny.
I. INTRODUCTION
Proteins are sequences of amino acids which form
primary structure of the poly peptides. [1]. To become
active , a protein should be folded , this folding initially
started in the form of secondary structures which finally
led into three dimensional form of the protein. The
secondary structure elements of the proteins are called,
Alpha helix, Beta sheet and random coil. [1].
Description of Protein secondary structure focused on
the pattern of the hydrogen-bonding of the peptide
backbone of the protein. [1], [2], The alpha helix (α-
helix) is the most common, regular segment of the
secondary structure of proteins. [1, 2]This right-handed
coil shows donation of a hydrogen bone from backbone
of N-H group to the backbone C=O group of the amino
acid four residue earlier. It is also called as 3. 613-helix ,
denoted the number of residues per turn, and
involvement of 13 atoms in the ring formed by the
hydrogen bond. [1, 2]The β sheet (also β-pleated sheet)
is the second element of secondary structures in proteins.
[1, 2]. As compared to alpha helix, it is less common.
Beta sheets formed of beta strands joined laterally by
minimum two or three backbone hydrogen bonds, which
led in formation of twisted pleated sheets. A beta strand
is typically 3 to 10 amino acids long which formed a
stretch of polypeptide. The beta sheet exhibits in two
forms parallel and anti-parallel. [1, 2] The third element
contributed in secondary structure of protein is called
random coil, which is a polymer and it's monomer unit's
orientation take place randomly. It is a major portion of
the protein which lies at the surface of the protein. In
respect to the significance in function, alpha helix plays
the most important role and beta sheet plays scaffold
role. [1, 2]Secondary structures serve an important role
in stabilizing of the overall folding of protein by

International Journal of Scientific Research in Science and Technology (www.ijsrst.com)
113
providing the high amount of the enthalpy of
stabilization of folding which led in existence of polar
backbone groups in the hydrophobic of a folded
polypeptide. [3] Divergence of protein sequences
occurred during evolution, [4] but it is not known how
this divergence impact secondary structures segments,
nor significance of phylogenetic status of the secondary
structure members in evolution. For instance, some of
conformationally detectable regions shows conservation
throughout evolution, so that , in closely related species ,
the amino acid sequences will show high degree of
similarity thereby giving rise to similar structural motifs
after folding the proteins. [4]
To find out the degree of conservation of secondary
structure elements and phylogenetics status of individual
element in order to analysis their significance in
evolution , we have selected the trypsin beta protein as
material and performed it's bioinformatics analysis in
order to introduce this novel method for further
bioinformatics analysis of different secondary structures
of other important proteins and their role in evolution
and other evolution related issues relevant to the
secondary structures of the proteins.
II. METHODS AND MATERIAL
we have selected 25 species having Trypsin beta such as
Rarobacter faecitabidus, Boltenia villosa, Bos Taurus,
Canis lupus familiaris , Rattus norvegicus, Mus
musculus , Homospaiens, Macaca mulatta, Trimeresurus
jerdonii, Bitis gabonica, Anplopoma fimbria, Gadus
morhua, Salmo salar, Tryophagus putrscentiae, Lonomia
obliqua , Mamestra configurata, Hypoderma Diana,
Drosophila virillis, Drosophila melanogaster,
Phlebotomus papatasi, Lutzomyia longipalpis,
Anopheles stephensi, Cultex quinquefasciatus, Caligus
rogercresseyi, Radix peregra , Loligo bleekeri , from
Protein data bank and downloaded amino acids
sequences of them in FASTA format. Then using online
primary structure to secondary structure conversion
software j–pred , [5] by which the amino acid sequences
of proteins of each species converted into potential
secondary structures polypeptide. The converted folded
polypeptide ( contain all elements such as alpha helix ,
beta sheet and random coil) of all 25 species cut off into
the secondary structure elements serially and then
individually ligated end-end to obtain peptides made up
of sequence in the random coil, alpha helix and beta
sheet conformations. Then these insilco ligated
polypeptide along with original one subjected to four
multiple sequence alignments namely:
1. Clustal w: (http://www. ch. embnet.
org/software/ClustalW. html) [6] 2. ProbCon,
(http://toolkit. tuebingen. mpg. de/probcons) [7], 3.
Tcoffee, (http://toolkit. tuebingen. mpg. de/t_coffee[8] 4.
Mafft(http://www. ebi. ac. uk/Tools/msa/mafft/ )[9]
The results of all multiple sequence alignment saved in
separate notepads. , then the result of each multiple
sequence alignment softwares were subjected in Protdist
software, ( http://caps. ncbs. res. in/iws/protdist.
html )[10] then the out file result of protdist subjected in
neighbor software, [11] then the neighbor outtree ‘s
result saved in a separate notepad, then the outtree's
result opened with MEGA, [12]then species clustered
using tree view X software(http://darwin. zoology. gla.
ac. uk/~rpage/treeviewx/)[13]. and saving in separate
notepad and rename it as cluster file. txt, then outtree
result of each software saved in separate notepad and
rename as outtree. txt, then , then we opened python
cluster software and enter in first line cluster. txt and in
second line outtree. txt and click on enter the result
which will appear automatically in a notepad and open it
with Excel software, then calculation of the percentage
of fidelity of each secondary structure obtained and
saved in Excel file.
III. RESULT AND DISCUSSION
For each MSA methods, different percentages of
secondary structures conservation obtained, based on
their specific performances. Table 1. Molecular
evolution analysis of secondary structure (random coil,
alpha helix Beta sheet) of Trypsin Beta protein by 4
different MSA is discussed as below: According to the
result obtained from clustal w: The most conserved
secondary structure is alpha helix and the second one is
random and the least conserved( The most varied) is
Beta sheet , which indicates that the most mutation
occurred in Beta sheet during course of molecular
evolution. The conservation percentages obtained from
clustalw for Trypsin protein‘s secondary structure is as
below: Alpha helix >Random coil> Beta sheet (61.
78%>59. 17%>55. 47%respectively). On the basis of the
result obtained from Mafft method: The most conserved
part of secondary structure forTrypsin Beta is Random

International Journal of Scientific Research in Science and Technology (www.ijsrst.com)
114
coil and the second one is Beta sheet and the least one is
alpha helix as below: Random coil >Beta sheet> Alpha
helix (57. 17%>55. 73%>53. 78%respectively ). The
highest percentage is random coil which shows the most
conservation. On the basis of the result obtained from
ProbCons method: The most conserved part of
secondary structure is random coil and the second one is
beta sheet and the least one is alpha helix. The
conservation percentages obtained from probcons for
Trypsin protein ‘s secondary structure is as
below:Random coil > Beta sheet>Alpha helix (61. 08
%>55. 04% >54. 6 %respectively ). The highest
percentage is random coil which shows the most
conservation. On the basis of the result obtained from
Tcoffee Method: The most conserved part of secondary
structure is Random coil and the second is Alpha helix
and the least is Beat sheet. The conservation percentages
obtained from Tcoffee A for protein TIFIIA‘s secondary
structure is as below: Random coil >Alpha helix > Beta
sheet 60. 95%>56. 47%>55. 82% respectively). The
highest percentage is random coil which show the most
conservation. Overall results of these finding is
considered carefully and due to negotiable difference
between percentages in different MSA, the result has
shown that random coil phylogentically is the most
conserved part of the protein
Table 1: Percentage of conservation of secondary
structures of Trypsin beta by four different multiple
sequence alignment protocol:
Multiple
sequence
alignment
Random
coil
%
Alpha
Helix
%
Beta
sheet
%
Clustal w 59. 17 61. 78 55. 47
Mafft 57. 17 53. 78 55. 73
Probcons 61. 08 54. 6 55. 04
Tcoffee 60. 95 56. 47 55. 82
Phylogentic trees of secondary structures of trypsin beta
using four different multiple sequence alignments
constructed and compared with benchmark tree of
classification of 25 species and visual analysis of the
trees showed that in the tree constructed using clustal w ,
beta sheet element of mammalian underwent mutation
and human's beta sheet of trypsin beta is diverged from
other four mammalian speices. For the nine studied fly
species , the beta sheet is scattered and three of the fly
species come together and remaining six are evolved
together, also in this tree, tunicate and crustacean species
evolved together , bacteria specie come near by two
mollusca species but two snake species and three bony
fishes species evolved tightly together. For random coil
flies species are scattered in four regions and
mammalian species split into two places and two
mollusca underwent divergence but still snake and bony
fishes are evolved together tightly which showed high
degree of conservation of the element among these
species. and for alpha helix the conservation degree
showed maximum amount as there is no divergence of
this segment among mammalian species , snake and
bony fishes species but still divergence of one flies
species is shown , so visually alpha helix element
showed the maximum degree of conservation and beta
sheet most mutated one and random coil takes place an
intermediate place.
III. Discussion
Conversion of linear polymer of polypeptide into a
stable three dimensional functional protein is a
thermodynamically dependent process [13]. secondary
structures formation occurred during initial stages of
protein folding so their role in protein folding is crucial
as they provide much of enthalpy for stabilization of
protein during folding. [14] As the secondary structures
play significant role in protein folding, their
conservation, evolution and phylogenetic status are
significantly considered for understanding the entire
protein evolution and mutation and other phylogenetic
ally related issues. Here we have conducted an original
work to find out the molecular evolution of secondary
structure of trypsin beta. In this work, we have examined
performance of four different multiple sequence
alignments and for each MSA different percentages are
obtained. Due to negotiable difference between
percentages obtained from different multiple sequence
alignment, the result has shown that random coil
phylogentically is the most conserved. On the basis of
phylogentic analysis of trees constructed based on
secondary structures and compared with benchmark
trees in which the species clustered in accordance with
their taxonomy, it visualizes scattered distribution of

International Journal of Scientific Research in Science and Technology (www.ijsrst.com)
115
species and their genus , and evidences based on the
trees shows that evolution of secondary structures
occurred many times , although the exact reason of
evolution is not known but occurrence of evolution
within the secondary structures are well observed by this
method.
IV. CONCLUSION
This work is helpful in understanding how secondary
structures of a protein diverge or evolve among closely
related species and the most conserved part of secondary
structures of a protein is calculated by multiple sequence
alignment protocol. Although still the reasons for
evolution of secondary structures are open for discussion
but this work is a starting point to study the reason of the
molecular evolution and their significant role in the
evolution and function of the appropriate protein. This
projct can be helpful for understanding protein structure
and its evolution in drug discovery projects as many
targets are protein. For more information about protein
structure of drug targets please referee to the following
publications.[15-20].
V. REFERENCES
[1] Drenth, J.: Principles of Protein X-Ray Crystallography
2nd ed. (Springer-Verlag,New York, 1999).
[2] Evans, J.N.S.: Biomolecular NMR Spectroscopy
(Oxford University Press,Oxford, 1995).
[3] Schmidt, A. and Lamzin, V.S.: Veni, vidi, vici—atomic
resolution unravelling the mysteries of protein function.
Curr.Opin. Struct. Biol. 2002,12:698–703.
[4] Brooks DJ, Fresco JR, Lesk AM, Singh M.Evolution of
amino acid frequencies in proteins over deep time:
inferred order of introduction of amino acids into the
genetic code. Mol Biol Evol. 2002 Oct;19(10):1645-55.
[5] Cole C, Barber JD & Barton GJ. Nucleic Acids Res.
2008. 35 (suppl. 2) W197-W201 link]
[6] Larkin M.A., Blackshields G., Brown N.P., Chenna R.,
McGettigan P.A., McWilliam H., Valentin F., Wallace
I.M., Wilm A., Lopez R., Thompson J.D., Gibson T.J.
and Higgins D.G. (2007)ClustalW and ClustalX version
2.Bioinformatics 23(21): 2947-2948
[7] Do CB, Mahabhashyam MS, Brudno M, Batzoglou S.
ProbCons: Probabilistic consistency-based multiple
sequence alignment. Genome Res. 2005 Feb;15(2):330-
40.
[8] Magis C, Taly JF, Bussotti G, Chang JM, Di Tommaso
P, Erb I, Espinosa-Carrasco J, Notredame C. T-Coffee:
Tree-based consistency objective function for alignment
evaluation. Methods Mol Biol. 2014;1079:117-29. doi:
10.1007/978-1-62703-646-7_7.
[9] Katoh, Standley, MAFFT multiple sequence alignment
software version 7: improvements in performance and
usability. (Outlines version 7) 2013 (Molecular Biology
and Evolution 30:772-780
[10] Felsenstein, J. 1989. PHYLIP -- Phylogeny Inference
Package (Version 3.2). Cladistics 5: 164-166
[11] Wheeler, T.J. 2009. Large-scale neighbor-joining with
NINJA. In S.L. Salzberg and T. Warnow (Eds.),
Proceedings of the 9th Workshop on Algorithms in
Bioinformatics. WABI 2009, pp. 375-389. Springer,
Berlin.
[12] Kumar, S., K. Tamura, I. B. Jakobsen, and M. Nei
(2001) MEGA2 : Molecular Evolutionary Genetics
Analysis. Ver. 2.0, Bioinformatics 17:1244-1245
[13] Poland D. Contribution of secondary structure to the
heat capacity and enthalpy distribution of the unfolded
state in proteins, Biopolymers. 2002 Jan;63(1):59-65.
[14] Sathyanarayana N. Gummadi.What Is the Role of
Thermodynamics on Protein Stability, Biotechnology
and Bioprocess Engineering 2003, 8: 9-18
[15] Ghorbani M and Karimi H. Cyclin-Dependent Kinases
as valid targets for cancer treatment. Journal of
Pharmacy Research 2015,9(6),377-382
[16] Ghorbani M, Karimi H, 'Ion Channels Association with
Diseases and their Role as Therapeutic Targets in Drug
Discovery', International Journal of Scientific Research
in Science and Technology(IJSRST), 1(3):65-69,July-
August 2015.
[17] Ghorbani M, Karimi H, 'Role of Aquaporins in Diseases
and Drug Discovery', International Journal of Scientific
Research in Science and Technology(IJSRST),1(3):60-
64, July-August 2015
[18] Mahin Ghorbani, Hamed Karimi, 'Role of G-Protein
Coupled Receptors in Cancer Research and Drug
Discovery', International Journal of Scientific Research
in Science and Technology (IJSRST),1(3), pp.122-126,
July-August 2015.
[19] Mahin Ghorbani, Hamed karimi, 'Role of Biomarkers in
Cancer Research and Drug Development', International
Journal of Scientific Research in Science and
Technology(IJSRST),1(3), pp.127-132, July- August
2015
[20] Mahin Ghorbani, Hamed Karimi, 'Bioinformatics
Methods for Biochemical Pathways and System Biology
Analysis', International Journal of Scientific Research in
Science and Technology (IJSRST),1(4),75-79,
September-October 2015.

IJSRST162418 | Received : 18 July 2016 | Accepted : 29 July 2016 | July-August 2016 [(2)4: 116-125]
© 2016 IJSRST | Volume 2 | Issue 4 | Print ISSN: 2395-6011 | Online ISSN: 2395-602X Themed Section: Science and Technology
116
Inversion of Time in the Classical Kinematics of Material Point
Zvezdelin Ivanov Peykov*, Todor Peychev Spiridonov, Angel Todorov Apostolov
Department of Physics, University of Architecture, Civil Engineering and Geodesy, Sofia, Bulgaria
ABSTRACT
As a result of the fact that the time in classical physics manifests itself only through the movement of the bodies, in
the kinematics of material point the question of reversing the course of time (from the future to the past) is examined
theoretically. The method is defined for inversion of time and its impact on the kinematic quantities and principles
describing the motion. Three main types of motion in the kinematics have been discussed compared to reversal the
course of time.
a) Fully reversible motions - these are all constant motions. They can occur in the same way both in right and
reverse direction of passage of time but they only indicate that the time is running not determining its direction;
b) Semi reversible movements - these are all movements, in which the acceleration is an even function in case of
inversion of time. They amend their nature temporary only in right and reverse direction of passage of time for a
certain period. After that the semi-reversible movements run identically. They also show that the time is running but
not determining its direction;
c) Completely irreversible movements - these are movements in which the tangential acceleration is odd function
compared to the inversion of time. These can occur only in one direction of the time course; in the opposite direction
they are impossible. The irreversible movements can be used to determine the direction of time.
The reasons for these three types of movements have been examined and the relevant laws have been received: of
motion, velocity and acceleration in right and reverse direction of passage of time. Their relationship with some
basic quantities and laws of classical physics has been shown as well.
Keywords: Time, Inversion of Time, Fully Reversible Motions, Semi Reversible Movements ,
Completely Irreversible Movements Kinetic Energy
I. INTRODUCTION
The major nature of time is that it is manifested through
the movement of the bodies. Let we imagine for a
moment that time flows in the opposite direction - from
the future to the past. How this affects the movements in
the kinematics?
II. METHODS AND MATERIAL
A. Definition
To reverse the direction of time of one randomly moving
material point it means the same to go through the same
spatial positions in its movement, but in reverse order,
with the same size of velocity but in the opposite
direction [1]. The same definition is used also by the
other authors [2-12].
B. Description of the inversion of time
Suppose we examine a material point moving along the
axis Ox (Figure 1). During the interval of time
12 ttt it passes distance 12 xxx . Projection
of its velocity v
along Ox in the initial and final point is:
x2x1 vv . According to the definition, the inversion of
time means a point to go back the distance 12 xx
with the same size of velocity but in the opposite

International Journal of Scientific Research in Science and Technology (www.ijsrst.com)
117
direction. To reverse the course of time we shall use the
method described in [1], as in every moment of time t of
the movement of point a negative value is attributed:
Figure 1: Description of the inversion of time
tt
This is equivalent to a reflection on the time axis
compared to its beginning (Figure 1 – the left part), but
without changing the direction of the velocity of time:
tt vv
, although formally it now flows from the future
to the past. At the same time, the time moments change
their signs: 0 , 0 1221 tttt as the final
moment becomes initial one and vice versa, and the time
intervals preserve their sign.
0)( 122112 tttttttt
The attitude positions preserve their sign, but follow in
reverse order:
1221 ; xxxx
and spatial intervals change their sign:
xxxxxxxx )( 122112
The velocity of the point also changes its direction:
xx vv
t
x
t
x
thus satisfying the definition for inversion the course of
time.
C. Inversion of time in kinematic parameters describing
the motion.
We shall examine at how the inversion of time affects
the kinematic parameters describing the motion of a
material point. The change of time direction we shall
reflect as we shall substitute time moments t΄ with (- t)
as the initial moment becomes final one and vice versa,
and we shall change the directions of the velocities:
vv
, according to the mentioned above.
1. Positions and moments:
rr
- radius vector;
- positional angle at motion in a circle;
tt - instant of time.
2. Changes in the position and time:
rrrrrrrr 122112
)(
- displacement;
ss - distance;
)( 122112
- angle of rotation
tttttttt 122112 )(
- time interval.
(The same is relevant to the differential changes)
TT - period;
TT
11 - frequency;
tt - circular frequency
3. Velocities:
dt
d
td
d
dttdv
rdrdv
- odd
functions compared to inversion of time;
vrrv
- right-hand screw
rule preserves.
4. Velocity changes:
vvvvvvvv 12212
)(1
122112 )(
(The same is relevant to the differential changes.)
5. Accelerations:
First we shall believe that the acceleration is not
proportional to the velocity.
avdvd
a
dttd
aeeea vvv
dt
d
dt
d
td
d v)(
vv
(Here the unit vector indicating the direction of the
velocity, changes its direction: vv ee
).
nn anna
)( 22

International Journal of Scientific Research in Science and Technology (www.ijsrst.com)
118
(Here the radius of curvature of the trajectory and the
normal vector to it does not change in case of inversion
of time.)
aaaaaa nn
dt
d
td
d
arra
All accelerations are even functions in case of inversion
of time.
The time derivatives of higher order can be considered
similarly as well.
6. Law of motion, velocity and acceleration.
According to the first part of the definition of the
inversion of time - the material point to pass through the
same spatial positions, but in reverse order - it follows
that the law of motion has to be even function in case of
the inversion of time:
)()( tt rr
According to the second part of the definition of the
inversion of time – the velocity of the material point to
preserve its size, but to alter its direction backwards - it
follows that the law of velocity has to be odd function in
case of the inversion of time:
)()( tt vv
The above two laws require in case of the inversion of
time the law of acceleration to be even function as well:
)()( tt aa
But this condition is only necessary, but not sufficient,
because the acceleration is determined not by law of
movement but by the force acting on the point, and it
can be not an even function (see below).
7. Equations of motion:
We shall examine how the inversion of time affects the
fundamental equation of motion in classical mechanics -
the second law of Newton [11]:
Fpdvvd
v
vdv
vdv
vpdF
tdtd
md
tdm
td
md
tdm
td
md
dtm
dt
dm
dt
md
dt
)(
)(
)(
(Here vp
m - momentum of the body; mm -
body mass, which does not change in case of inversion
of time; td
md
dt
dm
- rate of change of mass in
reactive movements, which is odd function compared to
the inversion of time.)
It is seen that the equation of motion (the second
principle of dynamics) preserves in case of the inversion
of time i.e. it is reversible over time. But and here this is
only necessary but not sufficient condition.
D. Examples of movements inverted in time.
The question placed - can we use a particular motion in
order to determine the direction of course of time - from
the past to the future or vice versa? At first sight, the
answer is negative, because the equations of motion are
symmetric toward the inversion of time - movements
themselves can run in forward or reverse direction. But,
as we shall see below, this is not exactly so.
1. Movements fully reversible in time:
Rest
When the material point is at rest compared to the frame
of reference, the kinematic variables are: constr
;
0r
; s = 0; 0a
. Only the time interval t is
uncertain quantity. Reversing the direction of time does
not affect all these quantities - they will not change. This
is because the rest is a condition but not motion. We can
put the question – whether in this case the time is
running at all (t grows indefinitely) and if it is running
- in what direction? Kinematics cannot answer the
question in this case: the time may not run (t = 0, t =
const), and we cannot determine its direction as well (if
it is running) – from the past to the future, or vice versa.
The reason for this is that we define the time through the
movement, but in this case it is absent.
Constant straight-line motion (Fig. 2)
Let design the vector laws for acceleration, velocity and
movement along the axis Ox of the selected coordinate
frame of reference:
0)( tax
constt 0xx v)(v
)(v)( 0x0 ttxtx , t (-, +)
and to replace in them v΄x with -vx, v΄0x with -v0x and
moments of time t with: t = = - t, t0 = – t0 , which

International Journal of Scientific Research in Science and Technology (www.ijsrst.com)
119
corresponds to the reversal the course of time. We shall
receive:
0)()( tata xx
consttt 0xxx v)(v)(v
)()(v
)(v)(v)(
0x0
0x00x0
txttx
ttxttxtx
t (-, +)
Figure 2 : Inversion of time at Constant straight-line
motion
The resulting laws for acceleration, velocity and
movement show that the point moves constantly in a
straight line in the opposite direction of Ox, as it passes
through the same spatial positions with the same size of
velocity, but in reverse order. (This is also true when
t0 = 0).
It turns out that the law of velocity is odd, and the law
for the acceleration and movement - even function
toward the reversal of time t.
It is apparent that the inverted movement is completely
analogical to the initial, but in reverse direction. Such a
movement we shall call fully reversible in time.
Moreover, the direction of movement shall be
determined by the selection of coordinate frame of
reference. Please note that if we invert the spatial axis
Ох compared to its starting position accurate within an
additive constant the movement does not differ from the
initial one. What is more, if we consider two identical
material points, moving constantly in a straight line with
equal velocities against each other and if we turn the
direction of time, we shall receive again two material
points, moving against each other with the same
velocities. The only difference is that two points have
exchanged their places.
That is why we can draw a fantastic at first sight
conclusion that we not able a priori to define for which
bodies moving constantly in straight-line the time flows
in one direction or in the other direction, i. e. the
constant straight-line movements shows that the time is
running out, but not determine its direction.
Another important note: the process of constant straight-
line movement can be considered reversible, as there is
no reason for this movement.
There are many other movements fully reversible in time,
such as constant movement in a circle, ellipse, spread of
a flat sine wave in environment non-swelling energy,
etc., which will not be considered here by us.
General case of fully reversible movements.
We shall prove the following theorem: any unspecified
constant motion is completely reversible in time. Indeed,
for any unspecified constant movement (in a curve or in
straight-line) we have:
0)()( tt aa
constaat
tttat
nn
n
2
22
; )(
)( )( )()()(
n
n
a
nnna
0)()( tt
)()( tt aaaaaa nn
It is apparent that the law of acceleration is an even
function compared to the inversion of time, and this,
together with the requirements for odd function of the
law of velocity and for even function of the law of the
movement leads to the fully reversible movement. The
reason for this is that the force acting on the point in this
case is only normal (perpendicular to velocity) and such
force shall not modify the kinetic energy of the moving
body.
And here is in effect the claiming that all fully reversible
movements (whether they are periodical or not) do not
determine the direction of the arrow of time.
2. Movements semi - reversible in time:
Uniformly variable straight-line motion (Figure 3)

International Journal of Scientific Research in Science and Technology (www.ijsrst.com)
120
We shall consider the particular case of constant
accelerated straight-line motion. If we design the vector
laws for acceleration, velocity and movement along of
the coordinate axis Ox, we shall receive:
constata xx 0)(
)(v)(v 00xx ttat x
2
000x0 )(2
1)(v)( ttattxtx x
The inversion of time leads to the following laws for
acceleration, velocity and movement:
)()( 000 taconstaaata xxxxx
)(v)(v
)(v)(v)(v
x00x
00x00xx
ttta
ttattat
x
xx
)()(2
1)(v
)(2
1)(v
)(2
1)(v)(
2
000x0
2
000x0
2
000x0
txttattx
ttattx
ttattxtx
x
x
x
Figure 3. Inversion of time at uniformly accelerated straight-line
motion
It is apparent that the law of velocity is an odd function
and the laws of acceleration and movement are even
functions compared to the inversion of time t. The
reversed movement represents a uniformly decelerated
motion conversely to Ох, as the point goes through the
same spatial positions with the same size of velocity, but
in reverse order. Or the nature of the motion will be
amended temporarily – from uniformly accelerated
motion it will become uniformly decelerated motion.
After the interval of time at /v2 inverted
movement again becomes uniformly accelerated without
any difference from the initial one. We shall name such
movement semi - reversible in time because it amends
its nature only temporarily - for a certain time interval,
which we shall name a period of "whirlwind of time."
Here the fact is essential that the reversal of time flow
does not change the direction of acceleration. We shall
note something more: each uniformly decelerated
straight-line motion becomes uniformly accelerated in
the opposite direction after a certain interval of time
after the velocity passes through 0 and reverses its
direction. The opposite is impossible – any uniformly
accelerated straight-line motion will always remain the
same as the velocity will increase to infinity. Even in
case of reverse the time flow the uniformly accelerated
motion becomes uniformly decelerated in the opposite
direction only for a fixed time interval, only until the
velocity passes through 0, then the motion is again
uniformly accelerated in straight line direction as the
velocity increases to infinity.
Note: Formally, we can consider that in case of
uniformly decelerated straight-line motion when the
velocity becomes 0 and reverses its direction
(respectively its move), the time reverse occurs certainly!
The same consideration also applies when a non-
inverting movement is uniformly decelerated straight-
line motion.
Can such a movement to be used to determine the
direction of the "arrow" of time? Unfortunately it is not
possible. Here it only shows, as well, that the time is
running out, but its direction is not determined.
Many other examples could be given of semi reversible
movements - harmonic oscillation of the material point,
parabolic motion, hyperbolic motion, elliptic motion in
the field of gravitational force, etc., which will not be
considered here by us.
General case of semi - reversible movements
All results received above in the case of considered
cases of movement in kinematics are mainly due to fact
that the laws of motion and acceleration are even
functions compared to the inversion of time, which in
reflection (mirror image) in the course of time do not
alter their shape. Law of velocity is odd function
compared to t and in case of reversal in the course of
time the sign of the velocity changes. The requirement

International Journal of Scientific Research in Science and Technology (www.ijsrst.com)
121
the Law for acceleration to be even function is
significant as it does not follow from the definition of
inversion of time as at the other two laws. We shall
prove the following theorem: if tangential acceleration at
random movement of a material point is even function
compared to the inversion of time, the movement is
completely or semi - reversible in time.
We have
)()()( ttt naaa
For normal acceleration we have already proven that it is
always an even function at the inversion of time:
)()( tt nn aa
Then, from the condition that: )()( tt aa
is an
even function, it follows that the full acceleration is an
even function: )()( tt aa
.
Then the movement meets the conditions of reversibility
in time and is completely or semi - reversible.
The requirement )(ta
to be an even function is
fulfilled when the acceleration depends only on the
position in space and time, but does not depend on the
velocity of the body:
)),(( ttraa
This is true for homogeneous stationary field of the
acceleration (respectively the force) - completely
reversible movements - or for central stationary field -
semi - reversible movements. Non-stationary fields
require further consideration.
In all these cases the conclusion is in force that
completely or semi - reversible movements cannot be
used to determine the direction of the course of time.
3. Irreversible movements:
What will happen to the reversibility of movements
when acceleration is odd function compared to the
inversion of time? We shall consider that the
acceleration of the material point is proportional to a
power of velocity of the body:
veva n
k
where k is a coefficient of proportionality, and n = 0, 1,
2, 3, ... is an integer.
The mark (-) corresponds to the acceleration obtained
under the action of so-called dissipative forces of
friction and resistance at movement of the body in a
given environment.
Examples of such forces:
TABLE 1
n = 0 - Forces of dry friction at sliding of the body
on some surface [11];
n = 1 - the resistance forces in case of movement of
the body with minor velocity into a viscous
fluid - so-called resistance as a result of
friction [11];
n = 2 - vortex resistance on the body, moving at
high velocity in a fluid [11];
n = 3 - resistance due to shock wave at movement of
the body with a supersonic velocity in a fluid
[11], etc.
All of these forces tend to reduce the kinetic energy of
the moving body, which is dissipated to the environment
[11]. The work of these forces is negative.
The sign (+) corresponds to the accelerations, obtained
by the action of so-called cumulative forces that act on
the body, when the environment is moving along with it.
These forces increase the kinetic energy of the body at
the expense of energy from the environment and the
work they do is positive.
In both cases, the acceleration of the body is parallel to
the velocity and the movement is delayed or accelerating.
Movement with dry friction at sliding (Figure 4)
Lets a body moves in a straight line along the axis Ox
(glides loosely) on a support. Its movement will be
decelerated under the action of the friction force.
According to the first law of Coulomb for a dry friction
at sliding [11], the resistance force acting on the body is:
constfNfN vT ev
F
v

International Journal of Scientific Research in Science and Technology (www.ijsrst.com)
122
where f is the coefficient of friction at sliding, N - the
pressure of the body on the support, and ve
is the unit
vector having always the direction of the velocity.
From the second principle of the dynamics for the
acceleration of the body we shall receive:
constm
fNk vv eeva
0
where m is the mass of the body. What is important here
is that the direction of acceleration is always opposite to
the direction of the velocity. From the projection of the
above law of acceleration along the axis Ох and
integration, we get the law of the velocity.
tem
fNt v0xx v)(v
Figure 4: Inversion of time in case of movement with
dry friction at sliding
The movement is uniformly decelerated. Through re-
integrating in t, we receive the Law of movement as
well:
2
v0x02
1v)( te
m
fNtxtx
Let us now reverse to the direction of time:
)()()( vv taem
fNe
m
Nfta
which is an odd function of time;
tem
fN
tem
fNte
m
Nft x
v0x
v0xv0
v
))((vv)(v
which is neither even nor odd function. In the particular
case when v0 = 0, the law of velocity appears even
function, but such movement (decelerated motion with
zero initial speed) is impossible;
2
v0x0
2
v0x0
2
v0x0
2
1v
))((2
1))(v(
2
1v)(
tem
fNtx
tem
fNtx
tem
Nftxtx
which also is neither even nor odd function. The law
becomes an odd function only in the particular case
when x0 = 0 and v0 = 0, but such movement is
impossible.
Inverted movement should be uniformly accelerated in
the opposite direction of the Ox with acceleration a
,
opposite of the velocity v
! But such movement is
impossible!
Or the general conclusion at considered movement is
that it is absolutely irreversible in time. This is
illustrated in Figure 4. It is seen that the body cannot go
through the same spatial positions with the same size of
the velocity, but in reverse order. The reason for this is
that the acceleration changes its direction in case of
inversion of time - it is always reverse to the velocity,
and in this case it is an odd function of time.
Flow of body by fluid with a moderate velocity
(Figure 5)
Consider a body initially at rest, flown by fluid evenly
moving along it with small velocity constfv
. The
fluid will act on the body with cumulative force:
))(( tr vvF f
where )(tv
is the velocity of the body in a subsequent
moment of time, and r is a coefficient of proportionality.
The body will start to move accelerating in the direction
of the force while its velocity becomes equal to that of
the fluid. Accordingly, the acceleration of the body will
be:
vfvf evvevva 11
)()()( tm
rtkt

International Journal of Scientific Research in Science and Technology (www.ijsrst.com)
123
From the projection of the vector law along the axis Ох
by integrating we receive the law on velocity:
tm
r
et
fxfxx vv)(v
By reintegrating we receive the law on movement:
tm
r
er
mt
r
mxtx
fxfxfx0 vvv)(
Let us now reverse to the direction of time. The above
laws become as follows:
Figure 4: Inversion of time in the case when the body flowing by
fluid
)()()(
)())(()()(1
ttm
rt
m
r
tm
rt
m
rt
aevvevv
evvevva
vfvf
vfvf
which represents an odd function compared to the
inversion of time;
tm
rt
m
r
tm
r
ee
et
fxfx
)(
fxfx
fxfxx
vv)v(v
vv)(v
which is neither even nor odd function (it is odd only in
the initial moment (t = 0);
tm
r
tm
r
tm
r
er
mt
r
mx
er
mt
r
mx
er
mt
r
mxtx
fxfxfx0
)(
fxfxfx0
fxfxfx0
vvv
)v())(v()v(
vvv)(
which also is neither even nor odd function compared to
the inversion of time (it becomes even only at vfx = 0 at
the moment of time t = 0).
Inverted movement should be decelerated in the
opposite direction to the axis Ox with acceleration in the
same direction as the velocity, but such movement is
impossible. Or this movement is also fully irreversible
over time.
Other examples can be given of fully irreversible
movements with law of the motion:
n Attx )(
where n = 2, 3, …, and A is a constant, connecting with
the measure units: A = [mn/s], but because of the
unknown physical character of the forces leading to such
movements, they will be not considered here by us.
General case of completely irreversible movements
The main conclusion that can be made from these
examples is that, when the acceleration is an odd
function compared to the inversion of time ( a
has
always had a direction parallel to the direction of the
velocity), then the respective movement is fully
irreversible over time.
All that remains in force when the movement is
curvilinear as well, as in contrast to the normal
acceleration (which is always even function compared to
the inversion of time), the tangential acceleration
remains odd function.
The reason for the irreversibility of such movements is
that they become under the influence of dissipative or
cumulative forces which always dissipate the energy of
the moving object in the environment or vice versa. The
source of these forces is any point of the environment in
which the body moves, in contrast to all other forces, the
source of which is localized in space and does not
change in the case of inversion of time. Moreover, the
presence of such forces at presence of fully reversible or
semi - reversible movements radically alter their nature -
they become completely irreversible. For example, to
consider the constant straight line motion (which
otherwise is completely reversible) with dry friction at
sliding. Such movement accomplishes through the
action of force 0F
and force of friction TF
, whose
amount is always: 00 TFF
. Acceleration of the
point in this movement is: 0)()()( ttt T0 aaa
.
Inversion in time changes acceleration as follows:

International Journal of Scientific Research in Science and Technology (www.ijsrst.com)
124
0)()()()()( ttttt T0T0 aaaaa
, which
leads to irregular motion - movement becomes
irreversible in time.
We shall note the following fact: the irreversible
movements can still be carried out at the inversion of
time, but this requires the presence of additional force
adF
at inverted movement to compensate the
irreversibility of the movement. For example, in the
above case the inverted movement must be done under
the action of forces:
02 TadT0adT0ad FFFFFFFF
i.e. it cannot take place without external influence.
The question arises: can irreversible movements
completely to be used to determine the direction of the
arrow of time? Yes, because of their irreversibility they
can take place only in a certain direction of the course of
time. The question is what is this direction - from the
past to the future or vice versa? Classical kinematics
cannot answer this question. A priori here should be
postulated that completely irreversible movements occur
always in the direction of the arrow of time "past →
future."
III. RESULTS AND DISCUSSION
We shall summarize the conclusions made here.
1. The time and movement in kinematics are
inextricably linked. The very flow of time can only
be described by the movement of the bodies. The
rest does not allow determining whether time flows
at all.
2. Reversal of course of time in kinematics means
moving material point to go in reverse order through
the same spatial positions with the velocity with the
same size but opposite direction.
Upon inversion of time the spatial positions of the
body, covered distance and acceleration (when it
does not depend on speed) preserve but direction of
motion and velocity change.
3. Equations in kinematics (law of motion, velocity,
acceleration, etc.) are reversible when changing
direction of time in case of absence of dissipative or
cumulative forces. Similar results are obtained also
in the papers [6-10].
4. There are three types of movements concerning the
inversion of time:
a) Fully reversible movements - these are all
constant movements. They display that the time is
running out, but not determine its direction.
b) Semi reversible movements – they are all
movements, in which the acceleration is an even
function at the inversion of time. They also indicate
that time is running out, but not determine its
direction.
c) Completely irreversible movements - these are
movements in which the tangential acceleration is
odd function compared to the inversion of time.
They can be used to determine the direction of the
arrow of time.
5. Reversible and irreversible processes introduced in
the thermodynamics ([11], [2], [7], [8], [9], [10]),
connecting to the concept of entropy and its growth
in a closed thermodynamic system. As can be shown,
these processes and the entropy are associated with
reversibility and irreversibility of the movement in
the kinematics.
6. None movement in kinematics does not allow
individual moments of time to be measured directly,
but only to be determined time intervals (finite or
infinitesimal). This is because the time continuum is
assumed to be continuous, i.e. "quantum-time" does
not exist. The same applies to the space - we can
determine only the lengths (the difference between
the positions of two points in it), but we are not able
to determine directly the positions themselves of the
points in the space. The spatial continuum is
continuous and "quantum-space" does not exist as
well. The above mentioned is reflected in the main
measuring units of time and distance in the system
SI - second and meter that are interval values, but
not absolute ones.
IV. REFERENCES
[1]. Детлаф А., Б. Яворский. Курс физики. Высшая
школа, Москва, 1989. (Detlaf A., Iavorski B.
Kurs Fiziki. Vissha Shkola, Moskva, 1989.)
[2]. North J., Time in Thermodynamics, The Oxford
Handbook of Philosophy of Time, Oxford
University Press, p. 312-350, 2011.
[3]. Zelevinsky V., Discrete Symmetries, Quantum
Physics, v.1, p.187, 2011.
[4]. Roberts J.A.G., Quispel G.R.W., Chaos and Time-
reversal symmetry. Order and Chaos in Reversible

International Journal of Scientific Research in Science and Technology (www.ijsrst.com)
125
Dynamical Systems, Physics Reports, v.216, №
2,3, p.63-171, 1992.
[5]. Sargsian M., Lecture2: Classical Space-Time
Symmetries, Advanced Quantum Mechanics, 6645
(6), 2014.
[6]. Domingos J. M., Time Reversal in Classical and
Quantum Mechanics, International Journal of
Theoretical Physics, v.18, № 3, p.213-230, 1979.
[7]. Savitt S.F., Is Classical Mechanics Time Reversal
Invariant?, Brit. J. Phil. Sci., v.45, p.907-913,
1994.
[8]. Hollinger H., Zenzen M., Time Reversal
Invariance and Irreversibility, P. REIDER
Publishing Company, Tokyo, 1985.
[9]. Snieder R., Time-Reversal Invariance and the
Relation Between Wave Chaos and Classical
Chaos, Topics Appl. Phys., v.84, p.1-16, 2002.
[10]. Haddad W.M., Chellaboina V.S., Nersesov S.G.,
Time-reversal symmetry, Poincare recurrence,
irreversibility, and the entropic arrow of time:
From mechanics to system thermodynamics,
Nonlinear analysis: Real World Applications, v.9,
p250-271, 2008.
[11]. Надолийски М., З. Пейков, Учебник по физика,
УАСГ, София, 2011. (Nadoliiski M., Peykov Z.
Physics Textbook. UACG, Sofia, 2011.)

IJSRST16224 | Received : 26 July 2016 | Accepted : 30 July 2016 | July-August 2016 [(2)4: 126-129]
© 2016 IJSRST | Volume 2 | Issue 4 | Print ISSN: 2395-6011 | Online ISSN: 2395-602X Themed Section: Science and Technology
126
Appraising Use of Mobile Messaging Application as an Additional Tool for Undergraduate Teaching
Ruchi Kothari*1, Pradeep Bokariya2, Varun Kothari3
*1Department of Physiology, MGIMS, Sevagram, Wardha, Maharashtra, India
1Department of Anatomy, MGIMS, Sevagram, Wardha, Maharashtra, India
1Department of Public Health, LMCST, Jodhpur, Rajasthan, India
ABSTRACT
This article highlights how undergraduate medical students can use mobile messaging applications for academic
purposes with their peers and faculty. Few suggestions along with potential advantages of mobile messaging tools
are put forth. The major challenges that could be encountered are also encompassed in the paper.
Keywords: Mobile, Messaging, Students, Applications
I. INTRODUCTION
The profound influence of mobile in our lives today is
no news. It has permeated almost all spheres of our lives
allowing us to be better, faster and save time and money.
It is no different for the education sector as well. Over
the last decade, teaching learning modalities have seen
drastic change. Use of internet among students has
increased manifold and medical students form an
integral portion of its users. Moreover the uses of mobile
applications are also growing leaps and bounds among
the students and they are using it quite pervasively. They
are familiar with social networks and pretty comfortable
with them.
II. CONCEPT OF MOBILE LEARNING
It is one of the hot educational trends for the coming
years. Apps, and smartphones are storming into
classrooms around the world. Mid level and higher
education in developed and developing countries are
now trying to adopt the use of smartphones in the
learning process from different perspectives and
teaching methods.[1]
Mobile phones are becoming popular as many people
can afford them. Currently the use of mobile
communication devices has gone beyond the traditional
communication role that it is now used in supporting
teaching and learning. In education, mobile phones have
led to the evolution of new paradigm known as mobile
learning [2].
Mobile apps represent a potential breakthrough in the
way students can learn and the amount they can learn
while doing it. These apps can improve information
accessibility; facilitate communication enhancing
synchronous learning and increase cooperation among
students.
Mobile phones can be used for sharing information
resources through mobile applications such as
WhatsApp, hike, viber, wechat etc. which can be used
very well for sharing academic information resources.
WhatsApp and other messaging services could become
the next platforms to reach 1 billion users within a year
or two [3].
According to Common Wealth of learning [4], teachers
can share with students‟ movies, audio files and other
learning materials through their mobile phones.
A. Suggestions feasible for undergraduate teaching:
Considering these facts we intend to recommend use of
mobile applications such as WhatsApp, hike, viber etc.

International Journal of Scientific Research in Science and Technology (www.ijsrst.com)
127
amongst medical students as a valuable adjunct and an
important tool to be utilized for teaching, learning and
communicating in medical education.
We suggest that mini groups of students and
mentors on such applications can be made.
Students should be free to become group members
of the same.
It will create a good platform where they can
express their views without any fear.
Small quizzes, informative pictures, short surveys
pertaining to subjects can be posted.
Even a teacher can periodically upload educational
material in the form of videos, illustrations and
diagrams.
Visual impressions definitely have several advantages
like generating interest in class and improving attitude of
students towards content. It fosters in depth learning and
leaves indelible visual impact in their mind.
Medical Professionals have started appreciating the use
of intelligent, open source lectures available online to
supplement their classroom lessons (on myriad topics)
and even learn a few things they themselves didn‟t know
before.
It could serve as the best method to obtain feedback
from students. They can express difficulties which they
are facing in their academic as well as non-academic
life. Posts from students should be heartily accepted and
need to be encouraged from time to time.
The “new generation” will find something close to their
heart.
Though economic difference amongst students is
prevailing but smart mobiles are within the reach of
everyone. We agree that not all students are using such
applications and it may be its biggest limitation but it‟s
always good to start something innovative.
Implementation of change in teaching learning
methodology has been welcomed from time to time.
Every new idea fetches criticism and our suggestion
might encounter or may have to face some contradictory
or nasty comments. Nevertheless its better late than
never to start something new and if we from faculty
community won‟t change, our students might consider
us as "Obsolete". There is enormous potential of cloud-
based technology, which would allow students to log in
to specific mobile apps in order to access their curricular
assignments, thereby creating the scaffold for paperless
submission. According to Huang et al [5] mobile
learning applications can facilitate students not only
learning contents conveniently but also interacting with
others collaboratively anytime and anywhere. Hence, the
development of m- learning as a new strategy for
education has implications for the way students and
tutors in educational institutions interact.
According to Cui and Wang [6], SMS System can be
utilized to help students learn many a things and
teachers can `use SMS to communicate with one student
or even one group of students. For instance teachers in
higher education in UK have implicated SMS as prompt
for course requirements, polling classes, pop quizzes to
students and sending information about time table and
reminding students about dates for examination [7].
B. Benefits of mobile messaging tools:
1. Instantaneous
It has been found that students check for text messages
on their mobile phones frequently and always respond to
the arrival tone [8]. Therefore, a significant feature of
text messaging is the immediate capture of the
recipient‟s attention. Such attention-getting may lead to
an improvement in students‟ focus and motivation as per
Martinez-Torres et al [9] and result in an enhanced
learning experience. Allen, Witt, and Wheeless [10]
found that an immediate response from the instructor
increased students‟ motivation and the cognitive mastery
of material.
2. Pervasive
Text messaging is also an advantage because mobile
devices are nearly always turned on and owned by the
majority of students [11]
3. More fitting than email
It is notable that text messaging is perceived by students
to be more „„instant‟‟ than email and is the dominant
mode of e-communication among students Harley et al
[12]. Given its role as a primary communication
channel, text messaging has been identified as preferable
to email in building both social and academic
relationships.

International Journal of Scientific Research in Science and Technology (www.ijsrst.com)
128
4. Time management
Because of its immediacy and ubiquity, text messaging
is particularly well suited to providing time-management
assistance to students. Text messaging has been
suggested as a means of reminding students of
assignment or application due dates, and timetable or
procedural changes.
C. Key Challenging Issues
Despite the massive advantages that mobile phones do
have in the teaching and learning process, there are some
challenges of m-learning among tutors and students.
Some of the mobile phones do not have programs that
have direct compatibility with the academic programs
such as pdf, words, excel and PowerPoint. Screen size is
another limiting factor for mobile learning.
1. Short messages
Given that a single-text messages is limited to 140
characters, faculty and students may be challenged by
the short message length and brevity of language
required.
2. Divided attention
When students respond to the arrival tone of new text
messages, their attention is drawn away from the current
task in which they are engaged. This can be a significant
distraction when text messaging is used in class (Markett
et al [13] Similar problems exist for instant messaging
conversations. Junco and Cotton [14] observed that
instant messaging is detrimental to learning because it
requires students to split their attention in an academic
setting.
3. User fees
Until free services to the education market are provided,
cost could be a factor in adopting text messaging for
academic purposes [13]. The same challenge does not
exist for instant messaging, as nearly all services are
available for free. However, the unique challenge to
instant messaging is that the user has to be signed in to a
computer in order to participate.
4. Personal space
While text and instant messaging can serve to increase
familiarity between students and faculty, students were
seen to resent such communication when it was used for
academic purposes. Students consider their mobile
phones a personal technology, and in some cases,
disliked receiving text messages from faculty or tutors
because it encroached into their personal space as
quoted by Brett [15]. Instant messaging is also
considered a private, peer-to-peer communication tool,
and students do not always want to appear visible to
their instructor or to other students.
The teaching staff in many colleges makes calls and
sends text messages for alerting students and
communicating with colleagues on academic issues.
This article highlights how medical students can use
mobile messaging applications for academic purposes
with their peers and faculty. Specifically, comfort level,
frequency of use, usefulness, reasons for messaging and
differences between peer-to-peer and peer-to-instructor
interactions are key factors why the students feel that
they are very comfortable with using messaging.
Students consider mobile messaging as very useful for
academic purposes. Key reasons cited for using
messaging included saving time, resolving
administrative issues, convenience and ease of use. Text
messaging appears to be the preferred mode of
communication for students with respect to
communicating with both peers and instructors.
Since many institutes are offering free Wi-Fi to students,
therefore it should be channelized somehow for
constructive methods. Students will feel free to come out
with their expression on this media as compared to
directly expressing their view in front of their mentors or
teachers. It can be a reasonably good educational tool
despite the presence of certain distractions. Students
would agree upon the fact that social networking time
can be put to good educational use.
III. CONCLUSION
To conclude, the use of mobile applications can be
envisaged fundamentally as an adjunct to the
conventional teaching learning aids to improve students‟
learning ability. It can be a useful and viable tool for

International Journal of Scientific Research in Science and Technology (www.ijsrst.com)
129
augmenting student‟s communication among peers and
faculty in medical education.
IV.REFERENCES
[1] Johnson L, Becker AS, Estrada V, Freeman A.
NMC horizon report: 2014 higher education
edition. Austin, Texas: The New Media
Consortium.
[2] Muyinda, P.B., Mugisa, E. & Lynch, K. (2007).
M-Learning: The educational use of mobile
communication devices (pp. 290-301), in K.J.
Migga, J. Muhirwe, J. Aisbett, K. Getao, V.W.
Mbarika, D. Patel, A.J. Rodrigues (eds.),
Strengthening the Role of ICT in Development,
Fountain Publishers: United Kingdom
[3] http://tech.co/whatsapp-latest-trend-e-marketing-
2014-12
[4] Commonwealth of Learning (2008). Using of
mobile technology for learner support in open
schooling.
www.paddle.usp.ac.fj/collect/paddle/index/assoc/c
ol008.dir/doc.pdf
[5] Huang, Y-M., Hwang W-Y., and K,-E. (2010).
Innovations in designing mobile learning
applications.www.ifets.info/download_pdf.php?id
=48&a_id=1056. Educational Technologies and
societies, Vol. 13. No. 3 (2008) pp 1 – 2
[6] Cuing, G., and Wang, S. (2008).Adoption cell
phones in EFL Teaching and Learning.
www.notworthprinting.wordpress.com/category/m
obilelearning
[7] Ferry, B. (2008). Using of mobile phones to
augment teacher learning in environmental
education. In hello! Where are you in land scape
educational technology? Proceedings ascilite
[8] Jones G, Edwards G, Reid A. How can mobile
SMS communication support and enhance a first
year undergraduate learning environment?
Research in Learning Technology Vol. 17, No. 3,
November 2009, 201–218
[9] Martinez-Torres, M. R., et al. (2007) „Improving
learning performance in laboratory instruction by
means of text messaging messaging‟, Innovations
in Education and Teaching International, vol. 44,
no. 4, pp. 409422.
[10] Allen, M., Witt, P. & Wheeless, L. (2006) „The
role of teacher immediacy as a motivational factor
in student learning: using meta-analysis to test a
causal model‟, Communication Education, vol. 55,
no. 1, pp. 2131.
[11] Shih, Y. E. & Mills, D. (2007) „Setting the new
standard with mobile computing in online
learning‟, International Review of Research in
Open and Distance Learning, vol. 8, no.
2.Available at:
http://www.irrodl.org/index.php/irrodl/article/view
/361/872
[12] Harley, D. et al. (2007) „Using texting to support
students‟ transition to university‟, Innovations in
Education and Teaching International, vol. 44, no.
3, pp. 229–241
[13] Markett, C., et al. (2006) „Using short message
service to encourage interactivity in the
classroom‟, Computers & Education, vol. 46, no.
3, pp. 280293.
[14] Junco, R. & Cotton, S. R. (2011) „Perceived
academic effects of instant messaging use‟,
Computers & Education, vol. 56, no. 2, pp.
370387.
[15] Brett, P. (2011) „Students‟ experiences and
engagement with text messaging for learning in
higher education‟, Innovations in Education and
Teaching International, vol. 48, no. 2, pp. 137147.

IJSRST162425 | Received : 24 July 2016 | Accepted : 30 July 2016 | July-August 2016 [(2)4: 130-135 ]
© 2016 IJSRST | Volume 2 | Issue 4 | Print ISSN: 2395-6011 | Online ISSN: 2395-602X Themed Section: Science and Technology
130
Measurement of Uranium Concentration in the Soil Samples
by Using Solid State Nuclear Track Detectors (SSNTDs)
Bashair M. Saied1, Raad M. Al-Khafaji2, Auday T. Al-Bayati1
1Department of Physics, College of Education (Ibn Al-Haitham), University of Baghdad, Iraq
2Department of Biology, College of Education (Ibn Al-Haitham), University of Baghdad, Iraq
ABSTRACT
The research aims to measure the uranium concentration of soil samples collected from different regions are located
around the nuclear research center at Tuwaitha to a contamination ratio statement of these regions, which include
agricultural residential regions as well as being the regions for livestock of all kinds. The nuclear track detector
(CR-39) was used as a method to detect uranium of through calculations depended on comparison with standard
samples . Results indicate that the uranium concentration ranged between (1.07 ± 0.46 ppm) and (4.20 ± 0.50 ppm)
and with average weighted equal to (2.40 ± 0.22 ppm) , these results are within allowed limit that equals (11.7 ppm).
Keywords: Soil, Uranium Concentration, Contamination, CR-39 Detector, Tuwaitha, SSNTD
I. INTRODUCTION
Natural radiation has always been part of the human
environment. Its main components are cosmic and
cosmogenic radiation, terrestrial gamma radiation from
natural radionuclides in rocks and soil, and natural
radioactive substances in our diet and in the air we
breathe[1].
Radionuclides are found in the environment as naturally
occurring elements and as products or by-products of
nuclear technologies, one of the most common
radionuclides is uranium (U), all isotopes of uranium are
radioactive, so it is very important their quantity to be
under control [2].
Technique of the tracks count of the fission fragments
was used for find the concentration of uranium in soil ,
because of its ease and accuracy in determining the
emitting elements of the alpha particles even if the
concentration is very small, the CR-39 detector is
considered of the best detectors to record the tracks of
alpha particles and nuclear fission fragments , that is
because of the advantage of its high sensitivity and the
efficiency[3, 4].
The research aims to determine the concentration of
uranium in surface soil in the surrounding regions
nuclear research center Al-Tuwaitha, and identify
contaminated regions with uranium by using the solid
state nuclear track detection technique.
A. Radiation in Soil
Soil is the upper part of the earth's crust and is formed as
a result of rock deformation by complex
physicochemical processes, which include weathering,
decomposition and water movement, so the soil is the
result of the action of weather and human activities on
the crust rocks of the earth. The soil is naturally
radioactive, because of the mineral content. The natural
radioactivity may vary considerably from one type of
soil to another[5] .
Soil radionuclide activity concentration is one of the
main determinants of the natural background radiation.
Volcanic geographic structures as well as rocks that are
rich in phosphate, granite and salt contain natural
radionuclides like uranium-238, thorium-232 and
potassium-40. When rocks are disintegrated through
natural processes, radionuclides are carried in soil by
rain and flows. In addition to the natural sources, soil

International Journal of Scientific Research in Science and Technology (www.ijsrst.com)
131
radioactivity is also affected from man-made
activities[6] .
B. Natural Uranium
The natural uranium includes numerous isotopes, but the
most important are three isotopes: 238
U, 235
U,234
U. All
uranium isotopes are radioactive, as it is shown in Table
(1) .
Table 1. shown the Natural uranium isotopes [7, 8]
Natural Uranium Isotopes (Alpha emission)
Isotope
Natural
abundance
(%)
Half-life
(in years)
Decay
Energy
(Mev)
U14692238 99.284 4.46 billion 4.270
U14392235 0.72 704 million 4.679
U14292234 0.0055 245000 4.859
The nuclei of radioactive elements are unstable, meaning
they are transformed into other elements, typically by
emitting particles (and sometimes by absorbing
particles)[7].
Uranium is toxic for both humans and animals for two
basic reasons: as a heavy metal , it has toxic chemical
effects, and as an alpha-emitter , it also has radioactive
effects.
Exposure to uranium and its compounds can cause
adverse health effects due to radiological hazard caused
by absorption of radiation emitted from uranium and its
decay products. Radiation exposure can originate either
from external sources, e.g. an area contaminated with
uranium from projectiles which missed their targets, or
deposited uranium oxides released from damaged tanks
as well as from internal sources, like uranium taken up
by inhalation of UOx aerosols or ingestion of
contaminated food or water [9].
C. Solid State Nuclear Track Detectors (SSNTDs)
Solid state nuclear track detector (SSNTD) is a widely
used technique among the various known methods for
detection of nuclear radiation . This method owes its
popularity mainly to its simplicity, cost effectiveness
and capacity to store permanent records. Although
minerals and glasses have been tested as SSNTDs, the
higher sensitivity of the plastic materials to many
charged particles and ease of track development and
evaluation has made plastic materials more popular as
SSNTDs [10].
CR-39 (Polyallyl diglycol carbonate) is a commonly
used solid state nuclear track detector (SSNTD). CR-39
detectors are widely used in different branches of
sciences such as nuclear physics, radon dosimeter and
radiobiological experiments [11] . It was discovered in
1978 by Cartwright, Shirk and Price. Its density is 1.32
g.cm-3
. The monomer is containing two of Allyl groups:
(CH2 = CH – CH2)
The chemical form for CR-39 may be written as
(C12H18O7). It is illustrated in Fig. (1) [12].
Figure 1. The chemical form of CR-39 detector [12].
The detector (CR-39) has a high efficiency to record the
tracks in comparison with other detectors and it has
some specifications as [13]:
1) Optically transparent
2) Very sensitive to radiation
3) Highly isotropic and homogeneous
4) Not cross-linking after radiation damage has
broken the chemical bonds
5) Having a non-solvent chemical etchant
6) This polymer is resistant almost to all solvents,
and to the heating Weak links of Carbon
increase the sensitivity of the detector to
radiation because it breaks easily when exposed
to radiation. The lowest rate of charge can be
detected in CR-39 [12].

International Journal of Scientific Research in Science and Technology (www.ijsrst.com)
132
II. METHODS AND MATERIAL
Soil surface samples were taken from different locations
around the Tuwaitha nuclear research center in Iraq, as
shown in Table (2(.After collecting the samples, The
samples were cleaned, placing each soil sample in an
oven for drying at a temperature of 80°C for 2h until a
constant weight was reached, The dried samples were
grinded into a fine powder and passed through a
standard mesh with size 75 µm . 0.5gm of soil samples
was pressed into a pellet of 1cm diameter and 2mm
thickness.
Table 2. shows the location and the coordinates (GPS)
of the study samples
No. code Locations Coordinates
1 S1 Taha mosque near
square Salman
33°12'59.0"N
44°32'59.3"E S2
2 S3 Stores of the Center for
Research AL-Tuwaitha
33°13'15.9"N
44°32'22.7"E S4
3 S5 Municipal Council from
front of AL-Tuwaitha
N.R.C.
33°13'12.3"N
44°31'31.3"E S6
4 S7 Ibn Zahr hospital near
AL-Tuwaitha Research
Center
33°13'25.4"N
44°30'39.4"E S8
5 S9 Beginning AL-Tuwaitha
N.R.C.
33°13'19.6"N
44°30'40.7"E S10
6 S11 End AL-Tuwaitha
N.R.C.
33°12'14.3"N
44°29'42.3"E S12
7 S13 Towers high-pressure
behind the AL-Tuwaitha
N.R.C.
33°10'55.7"N
44°30'01.5"E
S14
S15
8 S16 An agricultural area near
to the high-pressure
Towers
33°10'40.6"N
44°29'49.8"E S17
9 S18 Al Bustan near the end
of the AL-Tuwaitha
N.R.C.
33°12'05.3"N
44°29'39.4"E
S19
S20
10 S21 Department liquefaction
water near AL-Tuwaitha
N.R.C.
33°12'54.5"N
44°30'17.5"E S22
11 S23 Near a large mound of
dirt AL-Tuwaitha
N.R.C.
33°12'37.0"N
44°30'36.2"E
S24
S25
S26
12 S27 Jabir Ibn Abdullah
Ansari neighborhood
(farm A)
33°11'46.8"N
44°32'45.5"E S28
13 S29 Jabir Ibn Abdullah
Ansari neighborhood
(farm B)
33°11'50.5"N
44°32'39.0"E S30
14 S31 Jabir Ibn Abdullah
Ansari neighborhood
(farm C)
33°11'43.8"N
44°32'41.7"E S32
15 S33 Jabir Ibn Abdullah
Ansari neighborhood
(farm D)
33°11'39.9"N
44°32'34.1"E S34
16 S35 Ishtar region near AL-
Tuwaitha N.R.C.
33°11'32.9"N
44°31'49.3"E S36
17 S37 Al -Waredya region near
AL-Tuwaitha N.R.C.
33°11'16.3"N
44°32'22.5"E
* (N.R.C) = Nuclear Research Center
The pellets were covered with (CR-39) detector as
shown in Fig (2) and put in a plate of paraffin wax at a
distance of (5cm) from the neutron source (241
Am-9Be)
as shown Fig. (3), with flux (105 n.cm
-2.s.
-1) and the
fluence of thermal neutron (6.048x10¹⁰
n.cm-2
) for (7
days), to obtain induced fission fragments according to
the equation (1) :
U + n01
92235 (Thermal)
→ U∗ → f. f. +(2 → 3) n + Q (1)01
92236
After irradiation CR-39 track detector and the samples,
the chemical etching process to the CR-39 detectors has
been done in order to show the fission tracks. This
operation is for the use of sodium hydroxide solution
NaOH as an etchant solution, with normality (6.25N)
and temperature (60oC) for (3.5 hours) as the most
favorable conditions. After the etching time (3.5h), the
detectors have been removed from the etchant solution
by forceps and washed with distilled water and then
dried.

International Journal of Scientific Research in Science and Technology (www.ijsrst.com)
133
Figure 2. The pellets are covered with (CR-39) detector
Figure 3. The irradiation of the detectors and samples
by the neutron source.
I. Calculations
After etching chemical, begin the process of the track
observation by optical microscope: (Novel) made in
China: It is capable of giving magnifications by an
objective (4x, 10x, 40x and 100x) and two eyepieces
(10x) to measure the number of nuclear tracks . After
counting the track of nuclear fission fragments and alpha
particles on the surface of the detector, the track density
was calculated by using the following equation [14]:
Tracks density (ρ) =Nave
A (2)
Where:
Nave : Average number of total pits(track).
A : Area of field view.
An example of the photograph of observed tracks with the
samples is shown in Figure (4).
Figure 4. photograph of tracks in a soil sample
corresponding to one location.
The uranium concentration in the soil samples was
measured by comparing between track densities
registered on the detectors of the sample pellet and that
of the standard geological sample pellets according to
the relation [14]:
CX= Cs(ρx/ ρs) (3)
Cx= ρx / slope (4)
Where:
CX : Uranium concentration in unknown sample (ppm).
Cs : Uranium concentration in standard sample (ppm).
ρx : Track density of unknown sample(tracks/mm2).
ρs : Track density of standard sample(tracks/mm2).
The fig. (5) Shows of the relation between uranium
concentration and track density in standard sample of the
soil.
Figure 5. The relation between track density and
uranium concentration (ppm) for standard soil samples.
Slope = 411.2 (track / mm2 .ppm)
R² = 0.996
0
1000
2000
3000
4000
5000
6000
7000
8000
9000
10000
0 5 10 15 20 25
Tra
ck D
ensi
ty(t
rack
/mm
2)
Concentration (ppm)

International Journal of Scientific Research in Science and Technology (www.ijsrst.com)
134
III. RESULT AND DISCUSSION
In this research, the soil samples were used from
surrounding regions of the nuclear research center at
Tuwaitha to know the extent of contamination of these
regions with uranium, uranium concentration has been
calculated by using technique of counting the tracks of
nuclear fission fragments using nuclear track detector
(CR-39), and the results were arranged in the Table (3).
The selection of these regions to measure the ratio of
uranium, depending on several factors, the most
important are:
1) Because this regions are surrounding the Tuwaitha
nuclear research center, which contained several
nuclear reactors.
2) Because of the nuclear research center at Tuwaitha
was looted by some population during the war in
Iraq.
Figure 6. the concentration of uranium in the soil
samples.
Therefore, it was necessary to monitor the level of
pollution in those regions for estimating the dangers
arising from pollution and processed as quickly and the
best ways to ensure the safety of the population.
Through the table (3), we find that the concentrations of
uranium in soil samples ranging from (1.07 ± 0.46 ppm)
in the sample (S29), which located in the region
( Jabir Ibn Abdullah Ansari neighborhood (farm B) ) and
(4.20 ± 0.50 ppm) in the sample (S36), which located in
the region (Ishtar region near AL-Tuwaitha N.R.C.) ,
and a weighted average equal to (2.40 ± 0.22 ppm).
These results are within allowed limit, which is equal to
(11.7 ppm)[15], the figure (6) shows the relationship
between the uranium concentration and the sample code.
Table 3. Results of the uranium concentration in the soil
samples.
No.
Locations
Sample
code
Tracks density
(track/mm2)
Uranium
concentration
(ppm)
1 S1 1308.9 ± 322.8 3.18 ± 0.79
S2 593.0 ± 179.1 1.44 ± 0.44
2 S3 1016.1 ± 454.7 2.47 ± 1.11
S4 937.5 ± 118.8 2.28 ± 0.29
3 S5 830.4 ± 448.2 2.02 ± 1.09
S6 887.5 ± 385.4 2.16 ± 0.94
4 S7 560.7 ± 510.8 1.36 ± 1.24
S8 510.7 ± 180.1 1.24 ± 0.44
5 S9 717.9 ± 265.4 1.75 ± 0.65
S10 1280.4 ± 175.0 3.11 ± 0.43
6 S11 1444.6 ± 274.1 3.51 ± 0.67
S12 442.9 ± 163.0 1.08 ± 0.40
7 S13 807.1 ± 339.7 1.96 ± 0.83
S14 1291.1 ± 179.6 3.14 ± 0.44
S15 771.4 ± 332.0 1.88 ± 0.81
8 S16 539.3 ± 258.5 1.31 ± 0.63
S17 821.4 ± 399.8 2.00 ± 0.97
9 S18 532.1 ± 326.3 1.29 ± 0.79
S19 821.4 ± 229.8 2.00 ± 0.56
S20 539.1 ± 261.9 1.31 ± 0.64
10 S21 1185.7 ± 340.7 2.88 ± 0.83
S22 698.2 ± 380.0 1.70 ± 0.92
11 S23 1466.1 ± 120.1 3.57 ± 0.29
S24 1101.8 ± 191.8 2.68 ± 0.47
S25 1432.1 ± 302.4 3.48 ± 0.74
S26 1325.0 ± 157.4 3.22 ± 0.38
12 S27 1194.6 ± 363.7 2.91 ± 0.88
S28 1419.6 ± 180.4 3.45 ± 0.44
13 S29 440.8 ± 189.2 1.07 ± 0.46
S30 978.6 ± 132.2 2.38 ± 0.32
14 S31 592.9 ± 356.0 1.44 ± 0.87
S32 585.7 ± 171.2 1.42 ± 0.42
15 S33 900.0 ± 485.4 2.19 ± 1.18
S34 778.6 ± 507.3 1.89 ± 1.23
16 S35 1137.5 ± 359.7 2.77 ± 0.87
S36 1726.8 ± 204.1 4.20 ± 0.50
17 S37 914.3 ± 330.0 2.22 ± 0.80
Weighted average 2.4 ± 0.22
Allowed limit [15] 11.7

International Journal of Scientific Research in Science and Technology (www.ijsrst.com)
135
IV. CONCLUSION
1) The highest concentration of uranium in the soil
samples was in the sample (S 36) which is equal to
(4.20 ± 0.50 ppm), this value is less than the allowed
limit, which is equal to (11.7 ppm).
2) The pollution ratio in the region (Ishtar region near
AL-Tuwaitha N.R.C.) with uranium is the highest in
the comparison with other regions, and this means
that the people of this region are the most vulnerable
to uranium from the other regions.
3) The uranium contamination ratio in (Ishtar region
near AL-Tuwaitha N.R.C.) and the region (Near a
large mound of dirt AL-Tuwaitha N.R.C.) despite
being within allowed limit, but it is the ratio cannot
be underestimated, the uranium ratio is relatively
high, so it is advisable to processed with all means
to ensure the safety of the population from
continuous exposure to uranium, while the rest of
the proportions of the other regions are reasonable
proportions.
V. REFERENCES
[1] F. Bochicchio, J. McLaughling and S. Piermattei,
(1995), “Radon in indoor air”, (European
Collaborative Action, Report No. 15 , P. 50).
[2] P. Todorov and E. N. Ilieva, (2006),
"Contamination with uranium from natural and
anthropological sources", Rom. Journ. Phys.,
Vol.51(1-2), (27-34).
[3] R. L. Fleischer, P. B. Price and R.M. Walker,
(1975), Nuclear Tracks in Solids, Principles and
Applications. (Berkeley, USA, University of
California Press).
[4] M. A. Misdaq and H. Ouabi, (2006), "238U and
232Th concentrations in various potable waters in
Morocco", J. of Rad. Analy. Nucl. Chem.,
Vol.270(3), (543-553).
[5] R. E. White, (2013), Principles and practice of soil
science: the soil as a natural resource. (John Wiley
& Sons).
[6] H. Taskin and et al. , (2009), "Radionuclide
concentrations in soil and lifetime cancer risk due
to gamma radioactivity in Kirklareli Turkey",
Journal of environmental radioactivity, Vol.100(1),
(49-53).
[7] A. Makhijani, L. Chalmers and B. Smith , (2004),
"Uranium enrichment: Just plain facts to fuel an
informed debate on nuclear proliferation and
nuclear power", Institute for Energy and
Environmental Research, Vol.15.
[8] M. Gavrilescu, L. V. Pavel and I. Cretescu , (2009),
"Characterization and remediation of soils
contaminated with uranium", Journal of Hazardous
Materials, Vol.163(2), (475-510).
[9] H. Bem and F. Bou-Rabee, (2004), "Environmental
and health consequences of depleted uranium use
in the 1991 Gulf War", Environment
international,Vol.30(1),(123-134).
[10] A. A. Mascarenhas and et al. , (2006), "New
polymers for solid state nuclear track detection",
Radiation measurements, Vol.41(1), (23-30).
[11] K. H. AL-Ubaidi, S. K. Nasri and Z. A. Saudany,
(2015), "Natural Radionuclides and Hazards in
Water and Sediment Samples of Tigris River in Al-
Amara city - Maysan - Iraq", Advances in Physics
Theories and Applications, Vol.44 (117-122).
[12] K. H. Al-Ubaidi, (2006), “Identification and
Measurements of Natural and Industrial
Radioactive Pollutants in Environment of Baghdad
City using Gamma Spectrometry and Solid State
Nuclear Track Detector CR-39 ”,PhD Thesis, Ibn
Al-Haitham College,Baghdad University , Iraq.
[13] M. A. Al-Baidhani, (2006), “Determination of the
Radioactivity in Soil and Water in Baghdad,
Karbala and Basrah Samples”,M. Sc Thesis, AL-
Nahrain University College of Science.
[14] N. F. Tawfiq, H. L. Mansour and M. S. Karim,
(2015), "Measurement of Radon Gas
Concentrations in Tap Water for Baghdad
Governorate by Using Nuclear Track Detector
(CR-39)", International Journal of Physics,
Vol.3(6), (233-238).
[15] (UNSCEAR) United Nations Scientific Committee
on the effect of Atomic Radiation, (1993),
“Sources, Effect, and Risks of Ionizing Radiation”,
(Report to the general Assembly with Scientific
Annexes, United Nation).
IJSRST162439 | Received: 25 July 2016 | Accepted: 31 July 2016 | July-August-2016 [(2)4: 136-151]
© 2016 IJSRST | Volume 2 | Issue 4 | Print ISSN: 2395-6011 | Online ISSN: 2395-602X Themed Section: Science and Technology
136
Design and Fabrication of Wind Mill for Power Generation
G. Balasubramanian*, P. Balashanmugam
Mechanical Engineering, Annamalai University, Chidambaram, Tamilnadu, India
ABSTRACT
The year 1973 has awakened the entire world from the energy crisis. Since then the entire focus of all developing
countries turned towards non-conventional sources of energy. Of all the non-conventional energy sources wind
energy is an inexhaustible, non-polluting, freely available energy. Enormous potential is associated with the kinetic
energy of the wind. Previously the KE of the wind was utilized to drive wind turbines mostly for pumping water and
grinding corns. The first wind turbine was employed for generation electricity in Denmark in 1890.India has started
its power generation through (WEGs) from 1986. Later on number of wind electric generators (WEGs) has been
installed every year. The paper deals with the technical details involved in the generation of power through wind
technology. It discusses the factors responsible for generation of wind power and the limitations of the generator.
While the emphasis is given on the various schemes used for production of electricity using wind power, the paper
also gives insight into energy storage methods, safety precautions and site selection criteria. Wind power gave rise
to public debate as the acceptance of wind turbines decreased during the expansion phase. These challenges were
countered by policies enacted by state actors at the regional and local levels. Decisive factors were the amount,
duration and reliability of the feed-in compensation, funding policy and the zoning and building laws. The
successful establishment of wind power has been possible in spite the fact that it has been difficult to integrate wind
power into the energy supply system due to wind power‟s intermittent nature, and despite resistance from actors of
the fossil-nuclear energy supply system. This has been possible as a result of continually adjusting the policy
approaches at various governance levels and reflecting various requirements in the different phases of the innovation
process. Wind Power Generation in Germany the timing of policies demands a flexible design that is both relevant
to a number of different public policy levels, yet tailored to the process in question.
Keywords: Power Generation, Wind Mill, Wind Speed, Aerodynamics, Local Ecology
I. INTRODUCTION
Wind result from air in motion. Air in motion arises
from a pressure gradient. On a global basis one primary
forcing function causing surface winds from the poles
toward the equator is convective circulation. Solar
radiation heats the air near the equator, and this low
density heated air is buoyed up. At the surface it is
displaced by cooler more dense higher pressure air
flowing from the poles. In the upper atmosphere near the
equator the air thus tend to flow back toward the poles
and away from the equator. The net result is a global
convective circulation with surface wins from north to
south in the northern hemisphere. It is clear from the
above over simplified model that the wind is basically
caused by the solar energy irradiating the earth. This is
why wind utilization is considered a part of solar
technology. It actuality the wind is much more complex.
The above model ignores the earth‟s rotation which
causes a carioles force resulting in an easterly wind
velocity component in the northern hemisphere. There is
the further complication of boundary layer frictional
effects between the moving air and the earth‟s rough
surface. Mountains, trees, buildings, and similar
obstructions impair stream line air flow. Turbulence
results and the wind velocity in a horizontal direction
markedly increase with altitude near the surface.
Local winds are caused by two mechanisms. The first is
differential hating of land and water. Solar isolation

International Journal of Scientific Research in Science and Technology (www.ijsrst.com)
137
during the day is readily converted to sensible energy of
the land surface but is partly absorbed in layers below
the water surface and partly consume in evaporating
some of that water. The land mass becomes hotter than
the water, which causes the air above the land to heat up
and become warmer than the air above water. The
warmer lighter air above the land rises and the cooler
heavier air above the water moves into replace it. This
is the mechanism of shore breezes. At night, the
direction of the breezes is reversed because the land
mass cools to the sky more rapidly than the water,
assuming a sky. The second mechanism of local winds is
caused by hills and mountain sides. The air above the
slopes heats up during the day and cools down at night,
more rapidly than the air above the low lands. This
causes heated air the day to rise along the slopes and
relatively cool heavy air to flow down at night. Wind
turbines produce rotational motion; wind energy is
readily converted into electrical energy by connecting
the turbine to an electric generator. The combination of
wind turbine and generator is sometimes referred as an
aero generator. A step-up transmission is usually
required to match the relatively slow speed of the wind
rotor to the higher speed of an electric generator.
In Indian the interest in the windmills was shown in the
last fifties and early sixties. A part from importing a few
from outside, new designs was also developed, but it
was not sustained. It is only in the last few years that
development work is going on in many institutions. An
important reason for this lack of interest in wind energy
must be that wind, in India area relatively low and vary
appreciably with the seasons. Data quoted by some
scientists that for India wind speed value lies between 5
km/hr to 15-20 km/hr. These low and seasonal winds
imply a high cost of exploitation of wind energy.
Calculations based on the performance of a typical
windmill have indicated that a unit of energy derived
from a windmill will be at least several times more
expensive than energy derivable for electric distribution
lines at the standard rates, provided such electrical
energy is at all available at the windmill site.
The above argument is not fully applicable in rural areas
for several reasons. First electric power is not and will
not be available in many such areas due to the high cost
of generation and distribution to small dispersed users.
Secondly there is possibility of reducing the cost of the
windmills by suitable design. Lastly, on small scales,
the total first cost for serving a felt need and low
maintenance costs are more important than the unit cost
of energy. The last point is illustrated easily: dry cells
provide energy at the astronomical cost of about Rs.300
per kWh and yet they are in common use in both rural
and urban areas.
Wind energy offers another source for pumping as well
as electric power generation. India has potential of over
20,000 MW for power generation and ranks as one of
the promising countries for tapping this source. The cost
of power generation from wind farms has now become
lower than diesel power and comparable to thermal
power in several areas of our country especially near the
coasts. Wind power projects of aggregate capacity of 8
MW including 7 wind farms projects of capacity 6.85
MW have been established in different parts of the
country of which 3 MW capacities has been completed
in 1989 by DNES. Wind farms are operating
successfully and have already fed over 150 lakes units of
electricity to the respective state grids. Over 25 MW of
additional power capacity from wind is under
implementation. Under demonstration programmer 271
wind pumps have been installed up to February 1989.
Sixty small wind battery charges of capacities 300 watts
to 4 kW are under installation. Likewise to stand-alone
wind electric generators of 10 to 25 kW are under
installation.
A. Utilization of Wind Energy
The utilization of wind energy can be dated back to 5000
B.C. when sail boats were propelled across the river
Nile. It was recorded that from 200 B.C. onwards wind
was used as an energy source to pump water, grind
grain, and drive vehicles and ships in ancient China and
Middle East. The first documented windmill was in a
book Pneumatics written by Hero of Alexandria around
the first century B.C. or the first century A.D.
Effectively, these wind mills are used to convert kinetic
energy into mechanical energy.
The use of wind energy to generate electricity first
appeared in the late 19th century but did not gain ground
owing to the then dominance of steam turbines in
electricity generation. The interest in wind energy was
renewed in the mid-1970s following the oil crises and
increased concerns over resource conservation. Initially,
wind energy started to gain popularity in electricity

International Journal of Scientific Research in Science and Technology (www.ijsrst.com)
138
generation to charge batteries in remote power systems,
residential scale power systems, isolated or island power
systems, and utility networks. These wind turbines
themselves are generally small (rated less than 100kW)
but could be made up to a large wind farm (rated 5MW
or so).
II. BASIC PRINCIPLES OF WIND ENERGY
CONVERSION
The circulation of air in the atmosphere is caused by the
non-uniform heating of the earth‟s surface by the sun.
The air immediately above a warm area expands; it is
forced upwards by cool, denser air which flows in from
surrounding areas causing a wind. The nature of the
terrain, the degree of cloud cover and the angle of the
sun in the sky are all factors which influence this process.
In general, during the day the air above the land mass
tends to heat up more rapidly than the air over water. In
coastal regions this manifests itself in a strong onshore
wind. At night the process is reversed because the air
cools down more rapidly over the land and the breeze
therefore blows off shore. The main planetary winds are
caused in much the same way: Cool surface air sweeps
down from the poles forcing the warm air over the topics
to rise. But the direction of these massive air
movements is affected by the rotation of the earth and
the net pressure areas in the countries-clockwise
circulation of air around low pressure areas in the
northern hemisphere, and clockwise circulation in the
southern hemisphere. The strength and direction of
these planetary winds change with the seasons as the
solar input varies.
Despite the wind‟s intermittent nature, wind patterns at
any particular site remains remarkably constant year by
year. Average wind speeds are greater in hilly and
coastal areas than they are well inland. The winds also
tend to blow more consistently and with greater strength
over the surface of the water where there is a less
surface drag. Wind speeds increase with height. They
have traditionally been measured at a standard height of
ten meters where they are found to be 20-25% greater
than close to the surface. At a height of 60 m they may
be 30-60% higher because of the reduction in the drag
effect of the earth‟s surface.
A. The Power in the Wind
Wind possesses energy by virtue of its motion. Any
device capable of slowing down the mass of moving air,
like a sail or propeller, can extract part of the energy and
convert is into useful work. Three factors determine the
output from a wind energy converter:
The wind speed;
The cross-section of wind swept by rotor; and
The overall conversion efficiency of the rotor,
transmission system and generator or pump.
No device, however well designed, can extract all of the
wind‟s energy because the wind would have to be
brought to a halt and this would prevent the passage of
more air through the rotor. The most that is possible is
for the rotor to decelerate the whole horizontal column
of intercepted air to about one-third of its free velocity.
A 100% efficient aero generator would therefore only be
able to convert up to a maximum of around 60% of the
available energy in wind into mechanical energy. Well-
designed blades will typically extract 70% of the
theoretical maximum, but losses incurred in the gearbox,
transmission system and generator or pump could
decrease overall wind turbine efficiency to 35% or loss.
The schematic diagram of turbine wheel is shown in
figure 1.The power in the wind can be computed by
using the concept of kinetics. The wind will works on
the principle of converting kinetic energy of the wind to
mechanical energy. We know that power is equal to
energy per unit time. The energy available is the kinetic
energy of the wind. The kinetic energy of any particle is
equal to one half its mass times the square of its velocity,
or 1/2m V2. The amount of air passing in unit time,
through an area A, with velocity V, is AV, and its mass
m is equal to its volume multiplied by its density of air,
or
m=AV
(m is the mass of air transverse the area A swept by the
rotating blades of a wind mill type generator).
Substituting this value of the mass in the expression for
the kinetic energy, we obtain, kinetic energy = 1/2
AV.V2 watts.
=1/2 AV3 watts

International Journal of Scientific Research in Science and Technology (www.ijsrst.com)
139
Equation tells us that the maximum wind available the
actual amount will be somewhat less because all the
available energy is not extractable-is proportional to the
cube of the wind speed. It is thus evident that small
increase in wind speed can have a marked effect on the
power in the wind. Equation also tells us that the power
available is proportional to air density 1.225 kg/m3 at sea
level). It may vary 10-15 percent during the year
because of pressure and temperature change. It changes
negligibly with water content. Equation also tells us that
the wind power is proportional to the intercept area.
Thus an aero turbine with a large swept area has higher
power than a smaller area machine; but there are added
implications. Since the area is normally circular of
diameter D in horizontal axis aero turbines, then A =
/4 D2, (sq.m), which when put in equation gives.
Figure 1: Line diagram of Turbine wheel
Available wind power P = ½ /4 D2V
3 watts
= 1/8 D2V
3
The power extracted by the rotor is equal to the product
of the wind speed as it passes through the rotor (i.e. Vr)
and the pressure drop p. In order to maximize the rotor
power it would therefore be desirable to have both wind
sped and pressure drop as large as possible. However,
as V is increased for a given value of the free wind
speed (and air density), increases at first, passes through
a maximum, and the decreases. Hence for the specified
free-wind speed, there is a maximum value of the rotor
power. Where power available is calculated from the air
density, rotor diameter, and free wind speed as shown
above. The maximum theoretical power coefficient is
equal to 16/27 or 0.593. This value cannot be exceeded
by a rotor in a free-flow wind-stream.
B. Maximum Power
The total power cannot be converted to mechanical
power. Consider a horizontal-axis, propeller-type
windmill, henceforth to be called a wind turbine, which
is the most common type used today. Assume that the
wheel of such a turbine has thickness b. Let pi and Vi
are the wind pressure and velocity at the upstream of the
turbine. Ve is less than Vi because the turbine extracts
kinetic energy. Considering the incoming air between I
and a as a thermodynamic system, and assuming that the
air density remains constant (since changes in pressure
and temperature are very small compared to ambient),
that the potential energy is zero, and no heat or work are
added or removed between i and a, the general energy
equation reduces to the kinetic and flow energy-terms
only:
C. Wind Energy Conversion
Traditional windmills were used extensively in the
middle Ages to mill grain and lift water for land
drainage and watering cattle. Wind energy converters
are still used for these purposes today in some parts of
the world, but the main focus of attention now lies with
their use to generate electricity. There is also growing
interest in generating heat from the wind for space and
water heating and for glass-houses but the potential
market is much smaller than for electricity generation.
The term “wind mill” is still widely used to describe
wind energy conversion systems, however it is hardly
adopt. Description any more. Modern wind energy
conversion systems are more correctly referred to as
„WECS‟, aero generations‟, „wind turbine generators‟,
or simply „wind turbines‟. The fact that the wind is
variable and intermittent source of energy is immaterial
of some applications such as pumping water for land
drainage – provided, of course, that there is a broad
match between the energy supplied over any critical
period and the energy required. If the wind blows, the
job gets done; if it does not, the job waits. However, for
many of the uses to which electricity is put, the
interruption of supply may be highly inconvenient.
Operators or users of wind turbines must ensure that
there is some form of back-up to cover periods when
there is insufficient (or too much) wind available. For
small producers, back-up can take the form of :

International Journal of Scientific Research in Science and Technology (www.ijsrst.com)
140
Battery storage,
Connection with the local electricity distribution
system; or
For utilities responsible for public supply, the integration
of medium – sized and large wind turbines into their
distribution network could require some additional plant
which is capable of responding quickly to meet
fluctuating demand.
III. WIND DATA AND ENERGY ESTIMATION
The seasonal as well as instantaneous changes in wind
both with regard to magnitude and direction need to be
well understood to make the best use of them in
windmill designs. Winds are known to fluctuate by a
factor of 2 or more within seconds (and thus causing the
power to fluctuate by a factor of 8 or more). This calls
for a proper recording and analysis of the wind
characteristics. There are various ways the data on wind
behaviour is collected depending on the use it is
intended to be put into. The hourly mean wind velocity
as collected by the meteorological observations is the
basic data used in a windmill designs. The holy means
is the one averaged over a particular hour of the day,
over the day, month, year and years. The factors, which
affect the nature of the wind close to the surface of the
earth, they are:
a) Latitude of the place,
b) Altitude of the place,
c) Topography of the place,
d) Scale of the ours, month or year.
Winds being an unsteady phenomenon, the scale of the
periods considered are an important set of date required
in the design. The hourly mean velocity (for many years)
provides the data for establishing the potential of the
place for tapping the wind energy. The scale of the
month is useful to indicate whether it is going to be
useful during particular periods of the year and what
storage if necessary is to be provided for. Since the
winds near the surface of the earth are derived from
large scale movements of atmospheric winds, the
location height above ground level at which the wind is
measured and the nature of the surface on earth have an
influence on the velocity of wind at any given time. The
winds near the surface of the earth are interpreted in
terms of boundary layer concept, keeping in mind the
factors that influence its development. The wind
velocity at a given height can be represented in terms of
gradient height and velocity.
In as much as the height of the windmill rotor depends
on the design wind velocity and cost of supporting
structure. The above factors have a bearing on the
design. Similarly, winds being an unsteady phenomenon,
the scale of periods considered for this the temporal
parameters (scale of our, month and year) is an
important set of data required in the design. While the
hourly mean velocity (for many years) provides the data
for establishing the potential of the place for tapping the
wind energy. The scale of the month is useful to
indicate whether it is going to be useful during particular
periods of the year and what storage if necessary is to be
provided for as already mentioned above. The data
based on scale of the hour is useful for mechanical
aspects of design. In addition to the data on the hourly
mean velocity, two other information‟s required are:
Spells of low wind speeds, and
Gusts
The site choice for a single or a spatial array of WECS
(wind energy conversion system) is an important matter
when wind electric is looked at from the systems points
of view of aero turbine generators feeding power into a
conventional electric grid. If the WECS sites are
wrongly or poorly chosen the net wind electric generated
energy per year may be sub optimal with resulting high
capital cost for the WECS apparatus, high cost for wind
generated electrical energy, and no returns on
investment. Even if the WECS is to the small generator
not tied to the electric grid, the sitting must be carefully
chosen if inordinately long break even times to the
avoided. Technical, economic environmental, social, and
other factors are examined before a decision is made to
erect a generating plant on a specific site. Some of the
main considerations are discussed below.
1. High annual average wind speed. A fundamental
requirement of the successful use of WECS,
obviously, is an adequate supply of wind has stated
above. The wind velocity is the critical parameter.
The power in the wind Pw, through a given cross
sectional area for a uniform wind velocity V is

International Journal of Scientific Research in Science and Technology (www.ijsrst.com)
141
Pw=KV3
Where K is a constant. It is evident; because of the cubic
dependence on wind velocity that small increases in V
markedly affect the power in the wind, EX. Doubling V,
increases Pw by a factor of 8. it is obviously desirable to
select a site for WECS with high wind velocity. Thus a
high average wind velocity is the principal fundamental
parameter of concern in initially appraising a WECS site.
For a more detailed estimate value, one would like to
have the average of the velocity cubed. Anemometer
data is normally based on wind speed measurements
from a height of 10m. For the most accurate assessment
of wind power potential it is absolutely essential that
anemometer data be obtained at the precise site and hub
height for any proposed WECS.
Strategy for sifting is generally recognized to consists of
Survey of historical wind data.
Contour maps of terrain and wind are consulted.
Potential sites are visited.
Best sites are instrumental for approximately one
year.
Choose optimal site.
2. Availability of anemometry data. It is another
important sitting factor. The principal object is to
measure the wind speed, which basically determines
the WECS output power, but there are many
practical difficulties with the instrumentation and
measurement methods. The anemometer height
above ground, accuracy, linearity, location on the
support tower, shadowing and inaccurate readings
there from, icing inertia of rotor whether it measures
the horizontal velocity component or vertical, and
temperature effects are a few of the many
difficulties encountered
3. Availability of wind V (t) curve at the proposed site.
This important curve determines the maximum
energy in the wind and hence is the principal
initially controlling factor in predicting the electrical
output and hence revenue returns of the WECS
machines.
4. Wind structure at the proposed site. The ideal case
for the WECS would be a site such that the V(t)
curve was flat, i.e. a smooth steady wind that blows
all the time; but a typical site is always less than
ideal. Wind especially near the ground is turbulent
and gusty, and changes rapidly in direction and in
velocity. This departure from homogeneous flow is
collectively referred to as “the structure of the
wind”.
5. Altitude of the proposed site. It affects the air
density and thus the power in the wind and hence
the useful WECS electric power output. Also, as is
well known, the winds tend to have higher velocities
at higher altitudes. One must be careful to
distinguish altitude from height above ground. They
are not the same except for a sea level WECS site.
6. Terrain and its aerodynamic. One should know
about terrain of the site to be chosen. If the WECS
is to be placed near the top but not on the top of a
not too blunt hill facing the prevailing wind, then it
may be possible to obtain a „speed up‟ of the wind
velocity over what it would otherwise be. Also the
wind here may not flow horizontal making it
necessary to tip the axis of the rotor so that the aero
turbine is always perpendicular to the actual wind
flow.
7. Terrain and its aerodynamic. One should know
about terrain of the site to be chosen. If the WECS
is to be placed near the top but not on the top of a
not too blunt hill facing the prevailing wind, then it
may be possible to obtain a „speed up‟ of the wind
velocity over what it would otherwise be. Also the
wind here may not flow horizontal making it
necessary to tip the axis of the rotor so that the aero
turbine is always perpendicular to the actual wind
flow. It may be possible to make use of hills or
mountains, which channel the prevailing winds into
a pass region, thereby obtaining higher wind power.
8. Local Ecology. If the surface is bare rock it may
mean lower hub heights hence lower structure cost.
If trees or grass or vegetation are present, all of
which tent to restructure the wind, then higher hub
heights will be needed resulting in large system
costs than the bare ground case.
9. Distance to Roads or Railways. This is another
factor the system engineer must consider for heavy
machinery, structures, materials, blades and other
apparatus will have to be moved into any chosen
WECS site.
10. Nearness of site to local center/users. This obvious
criterion minimizes transmission line length and
hence losses and costs. After applying all the

International Journal of Scientific Research in Science and Technology (www.ijsrst.com)
142
previous sitting criteria, hope fully as one narrows
the proposed WECS sites to one or two they would
be relatively near to the users of the generated
electric energy.
11. Nature of ground. Ground condition should be such
that the foundations for a WECS, destroying the
foundations for a WECS are secured. Ground
surface should be stable. Erosion problem should
not be there, as it could possibly later wash out the
foundations of a WECS, destroying the whole
system.
12. Favourable land cost. Land cost should be favorable
as this along with other sitting costs, enters into the
total WECS system cost.
13. Other conditions such as icing problem, salt spray or
blowing dust should not present at the site, as they
may affect aero turbine blades, or environmental is
generally adverse to machinery and electrical
apparatus.
If the area contains buildings, trees, wind machines, or
other obstacles, the variation of the wind speed with
altitude above ground level is usually greater for these
obstructed areas than for the case of open water and flat
plains. The characteristics of a good wind power site
may be summarized as follows:
A site should have a high annual wind speed.
There should be no tall obstructions for a radius of
3 km.
An open plain or an open shore line may be good
location.
The top of a smooth, well rounded hill with gentle
slopes lying on a flat plain or located on an island
in a lake or sea is a good site.
A mountain gap that produces to wind funnelling
is good.
The main components of a WECS are shown in Figure 2
in block diagram form. Summary of the system
operation is as follows :
Figure 2. The main components of a WECS
Aero turbines convert energy in moving air to rotary
mechanical energy. In general, they require pitch
control and yaw control (only in the case of horizontal or
wind axis machines) for proper operation. A mechanical
interface consisting of a step up gear and a suitable
coupling transmits the rotary mechanical energy to an
electrical generator. The output of this generator is
connected to the load or power grid as the application
warrants. For localities with the prevailing wind in one
direction, the design of the turbine can be greatly
simplified. The rotor can be in a fixed orientation with
the swept area perpendicular to the predominant wind
direction. Such a machine is said to be yaw fixed. Most
wind turbine, however, are yaw active that is to say, as
the wind direction changes, a motor rotates the turbine
slowly about the vertical (or yaw) axis so as to face the
blades in to the wind. The purpose of the controller is to
sense wind speed, wind direction, shafts speeds and
torques at one or more points, output power and
generator temperature as necessary and appropriate
control signals for matching the electrical output to the
wind energy input and project the system from extreme
conditions brought upon by strong winds electrical faults,
and the like.
The physical embodiment for such an aero-generator is
shown in a generalized form. The sub-components of
the windmill are:
Wind turbine or rotor
Wind mill head
Transmission and control, and
Supporting structure
Such a machine typically is a large impressive structure.
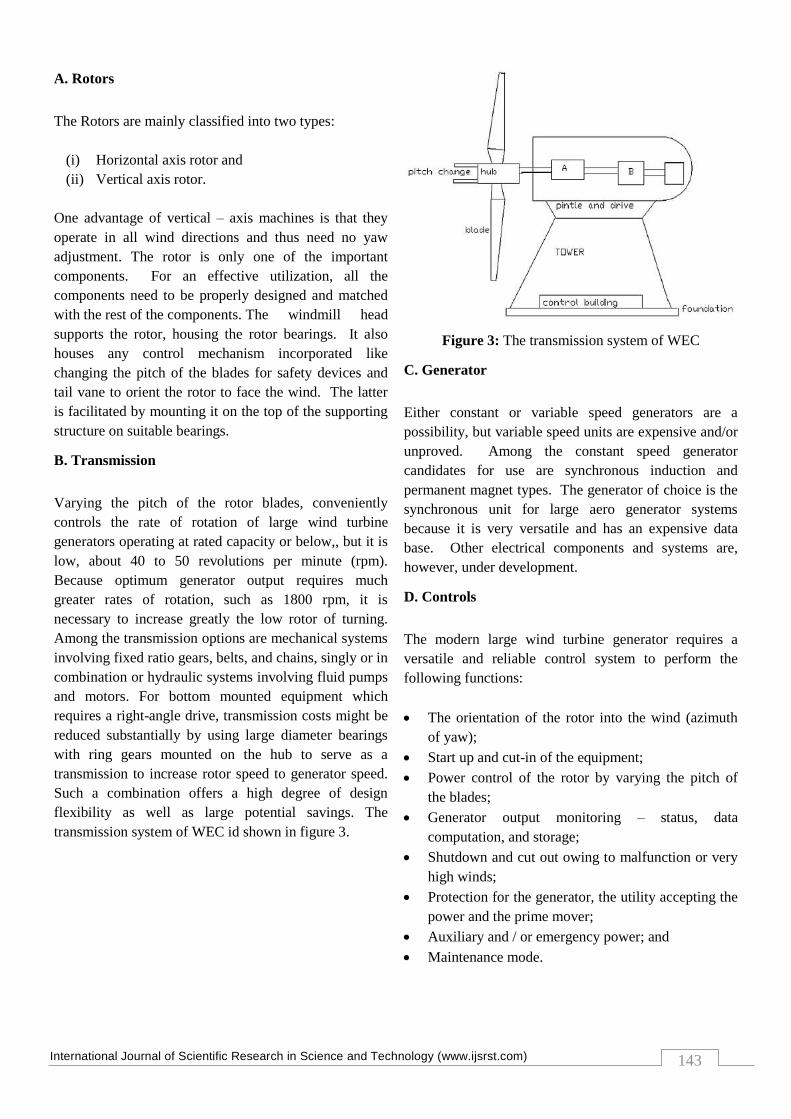
International Journal of Scientific Research in Science and Technology (www.ijsrst.com)
143
A. Rotors
The Rotors are mainly classified into two types:
(i) Horizontal axis rotor and
(ii) Vertical axis rotor.
One advantage of vertical – axis machines is that they
operate in all wind directions and thus need no yaw
adjustment. The rotor is only one of the important
components. For an effective utilization, all the
components need to be properly designed and matched
with the rest of the components. The windmill head
supports the rotor, housing the rotor bearings. It also
houses any control mechanism incorporated like
changing the pitch of the blades for safety devices and
tail vane to orient the rotor to face the wind. The latter
is facilitated by mounting it on the top of the supporting
structure on suitable bearings.
B. Transmission
Varying the pitch of the rotor blades, conveniently
controls the rate of rotation of large wind turbine
generators operating at rated capacity or below,, but it is
low, about 40 to 50 revolutions per minute (rpm).
Because optimum generator output requires much
greater rates of rotation, such as 1800 rpm, it is
necessary to increase greatly the low rotor of turning.
Among the transmission options are mechanical systems
involving fixed ratio gears, belts, and chains, singly or in
combination or hydraulic systems involving fluid pumps
and motors. For bottom mounted equipment which
requires a right-angle drive, transmission costs might be
reduced substantially by using large diameter bearings
with ring gears mounted on the hub to serve as a
transmission to increase rotor speed to generator speed.
Such a combination offers a high degree of design
flexibility as well as large potential savings. The
transmission system of WEC id shown in figure 3.
Figure 3: The transmission system of WEC
C. Generator
Either constant or variable speed generators are a
possibility, but variable speed units are expensive and/or
unproved. Among the constant speed generator
candidates for use are synchronous induction and
permanent magnet types. The generator of choice is the
synchronous unit for large aero generator systems
because it is very versatile and has an expensive data
base. Other electrical components and systems are,
however, under development.
D. Controls
The modern large wind turbine generator requires a
versatile and reliable control system to perform the
following functions:
The orientation of the rotor into the wind (azimuth
of yaw);
Start up and cut-in of the equipment;
Power control of the rotor by varying the pitch of
the blades;
Generator output monitoring – status, data
computation, and storage;
Shutdown and cut out owing to malfunction or very
high winds;
Protection for the generator, the utility accepting the
power and the prime mover;
Auxiliary and / or emergency power; and
Maintenance mode.

International Journal of Scientific Research in Science and Technology (www.ijsrst.com)
144
E. Towers
Four types of supporting towers deserve consideration,
these are:
The reinforced concrete tower,
The pole tower,
The built up steel- tube tower, and
The truss tower.
Among these, the truss tower is favoured because it is
proved and widely adaptable, cost is low, parts are
readily available, it is readily transported, and it is
potentially stiff. Shell-tube towers also have attractive
features and may prove to be competitive with truss
towers. The type of the supporting structure and its
height is related to cost and the transmission system
incorporated. It is designed to withstand the wind load
during gusts (even if the occur frequently and for very
short periods). Horizontal axis wind turbines are
mounted on towers so as to be above the level of
turbulence and other ground – related effects. The
minimum tower height for a small WECS is about 10m,
and the maximum practical height is estimated to be
roughly 60m.The turbine may be located either unwind
or downwind of the tower.
IV. CLASSIFICATION OF WEC SYSTEMS
The WEC are generally classified into two broad
classifications:
a) Horizontal Axis Machines. The axis of rotation is
horizontal and the aero turbine plane is vertical
facing the wind.
b) Vertical Axis Machines. The axis of rotation is
vertical. The sails or blades may also be vertical, as
on the ancient Persian windmills, or nearly, so, as on
the modern Derives rotor machine.
Then, they are classified according to size as determine
by their useful electrical power output.
i. Small Scale (up to 2 kW). These might be used
on farms, remote applications, and other places
requiring relatively low power.
ii. Medium Size Machines (2-100kW). These
wind turbines may be used to supply less than
100 kW rated capacity, to several residence or
local use.
iii. Large Scale or Large Size Machines (100 kW
and up). Large wind turbines are those of 100
kW rated capacity or greater. They are used to
generate power for distribution in central power
girds. As per the type of output power, wind
aero generators are classified as:
DC output
DC generator
Alternator rectifier
AC output
Variable frequency, variable or constant voltage
AC.
Constant frequency, variable or constant voltage
AC.
As per the rotational speed of the aero turbines, these are
classified as:
Constant Speed with variable pitch blades. This
made implies use of a synchronous generator with
its constant frequency output.
Nearly Constant Speed with fixed pitch blades.
This mode implies an induction generator.
Variable Speed with fixed pitch blades. This mode
could imply, for constant frequency output:
a) Field modulated system
b) AC-DC-AC link
c) Double output induction generator
d) AC commutation generator
e) Other variable speed constant frequency
generating systems.
Wind turbines are also classified as per how the
utilization of output is made:
a) Battery storage
b) Direct connection to an electromagnetic energy
converter
c) Other forms (thermal potential etc.) of storage.
d) Interconnection with conventional electric utility
grids.
The system engineer seeking to integrate WECS will,
naturally be most interested in the latter case but should
be aware that WECS will, naturally be most interested in
the latter case but should be aware that WECS offer
other options as well.

International Journal of Scientific Research in Science and Technology (www.ijsrst.com)
145
A. Advantage and Disadvantage of WECS
It is a renewable source of energy
Like all forms of solar energy, wind power
systems are non-polluting, so it has no adverse
influence on the environment.
Wind energy systems avoid fuel provision and
transport.
On a small-scale up to a few kilowatt system is
less costly. On a large-scale costs can be
competitive with conventional electricity and
lower costs could be achieved by mass
production.
B. Disadvantage of wind energy are:
Wind energy available in dilute and fluctuating
in nature.
Unlike water energy wind energy needs storage
capacity because of its irregularity.
Wind energy systems are noisy in operation; a
large unit can be heard may kilometres away.
Wind power systems have a relatively high
overall weight, because they involve the
construction of a high tower and include also a
gearbox, a hub and pitch changer, a generator
coupling shaft etc. for large systems a weight of
110 kg/kW (rated) has been estimated.
Large areas are needed, typically, propellers 1 to
3 m in diameter, deliver power in the 30 to 300
W ranges.
Present systems are neither maintenance free
not-practically reliable. However, the fact that
highly reliable propeller engines are built for
aircraft suggest that the present troubles could
be overcome by industrial development work.
C. Horizontal – Axial Machines
The common wind turbine with a horizontal (or almost
horizontal) axis, is simple in principle, but the design of
a complete system, especially a large one that will
produce electric power economically, is complex. Not
only must be individual components, such as the rotor,
transmission, generator, and tower, be as efficient as
possible, but these components must function effectively
in combination as shown in figure 4. Some of the
horizontal axis type wind machines are below.
Horizontal axis using two aerodynamic blades.
In this type of design, rotor derives generator
through a step up gear box. The blade rotor is
usually designed to be oriented downwind of the
tower. The components are mounted on a bed
plate which is attached on a pentle at the top of
the tower.
The rotors blades are continuously flexed by
unsteady aerodynamic, gravitational and inertia
loads, when the machine is in operation. If the
blades are made of metal, flexing reduces their
fatigue life with rotor the tower is also subjected
to above loads, which may cause serious
damage.
To reduce rotor cost, use of low cost counter
weight is recommended which balance long
blade centrifugally.
Figure 4 : Horizontal – Axial Machines
D. Horizontal axis Multibladed Type
This type of design for multiblades, made from sheet
metal or aluminium as shown in figure 5. The rotors
have high strength to weight ratios and have been known
to service hours of freewheeling operation in 60 km/hr
winds. They have good power coefficient, high starting
torque and added advantage of simplicity and low cost.

International Journal of Scientific Research in Science and Technology (www.ijsrst.com)
146
Figure 5: Horizontal axis multibladed type
E. Horizontal axis wind mill-Dutch type.
The blade surfaces are made from an array of wooden
slats which „feather‟ at high wind speeds as shown in
figure
Figure 6 : Horizontal axis wind mill-Dutch type
F. Sail Type
It is of recent origin. The blade surfaces are made from
cloth, nylon or plastics arranged as meet and pole or sail
wings. There is also variation in the number of sails
used.
V. POWER GENERATION
A. Generating Systems
Aero turbines convert wind energy into rotary
mechanical energy. A mechanical interface, consisting
of a step-up gear and a suitable coupling transmits the
energy to an electrical generator. The output of this
generator is connected to the load or system grid. The
controller senses the wind direction, wind speed, power
output of the generator and other necessary performance
quantities of the system and initiates appropriate control
signals to take suitable corrective actions. The system
should be protected from excessive temperature raise of
the generator, electrical faults and extra wind conditions
as shown in figures 7(top view) and 8.The choice of an
electrical generator and control method to be employed
(if any) can be decided by consideration of the following
three factors:
The basis of operation i.e. either constant tip speed
or constant tip speed ratio.
The wind-power rating of the turbine and
The type of load demand e.g. battery connection.
Wind power ratings can be divided into three convenient
grouping, small to 1kW, medium to 50 kW and large
200 kW to megawatt frame size.
Figure 7: The schematic view WEC
Figure 8: The schematic view WEC

International Journal of Scientific Research in Science and Technology (www.ijsrst.com)
147
Figure 9: The electrical components of WEC
B. Schemes for electric generation
Several schemes for electric generation have been
developed. These schemes can be broadly classified
under three categories:
Constant – speed constant frequently systems
(CSCF)
Variable speed constant frequency systems (VSCF)
Variable speed variable frequency systems (VSVF)
C. Constant speed constant frequency system (CSCF).
Constant speed drive has been used for large generators
connected directly to the grid where constant frequency
operation is essential.
Synchronous Generator.
For such machines the requirement of constant speed is
very rigid and only minor fluctuations about 1% for
short durations (fraction of second) could be allowed.
Synchronization of wind driven generator with power
grid also will pose problems with gusty winds.
Induction Generator.
If the stator of an induction machine is connected to the
power grid and if the rotor is driven above synchronous
speed Ns (Ns=120f/p), the machine becomes a generator
and delivers constant line frequency power to the
grid.(f=line frequency – and p=number of poles for
which the stator winding is made).Per unit slip is 0 and
0.05. The output power of wind drive n induction
generator is uniquely determined by the operating speed.
The pull out torque ™ condition should not be exceeded.
When this happens the speed continues to increase and
the system may „run away‟.
D Variable speed constant frequency scheme. (VSCF
scheme).
Variable-speed drive is typical for most small wind
generators used in autonomous applications, generally
producing variable frequency and variable voltage
output. The variable speed operation of wind-electric
system yield higher outputs for both low and high wind
speeds. This results in higher annual energy yields per
rated installed kW capacity. Both horizontal axis and
vertical axis turbines will exhibit this gain under variable
speed operation. The popular schemes to obtain
constant frequency output are as follows:
AC-DC-AC link.
With the advent of high powered thyristor and high
voltage D.C. transmission systems, A.C. output of the 3-
phase alternator is rectified using a bridge rectifier and
then converted back to A.C. using line commutated
inverters.
Double Output Induction Generator.
In this system a slip-ring induction motor is used. Rotor
power output at slip frequency is converted to line
frequency power by rectification and inversion output
power is obtained both from stator and rotor and hence
this device is called double output induction generator.
Rotor output power has the electrical equivalence of
additional impedance in the rotor circuit.
A.C. Communication generator
This system is also known as Scherbius system employs
two polyphone windings in the stator and a commutator
winding on the rotor. Basic problems in employing this
device for wind energy conversion are the cost and care
required by the commutator and the brush gear.
E. Site selection
Following factors are to be considered for selection of
good site for wind power generation:
a) High annual wind speed.
b) No tall obstructions for a radius of 3 Km.
c) Open plain or open shore
d) Top of a smooth, well rounded hill with gentle
slopes
e) Mountain gap which produces wind funneling.
F. Generating system
Wind - electric conversion system consists of the
following components
Wind Turbine (WT) - Converts wind energy into
rotational (mechanical) energy
Gear system and coupling (G/C) - It steps up the
speed and transmits it to the generator rotor
Generator (G) - Converts rotational energy into
electrical energy.

International Journal of Scientific Research in Science and Technology (www.ijsrst.com)
148
VI. APPLICATIONS OF WIND ENERGY
Wind power can also be used compress air for use in
various applications, including the operation of gas
turbines for generating electricity during the peak-
demand periods of a public utility system. For this type
of application, conventional gas turbines can be
modified to separate the compressor, generator, and
power stages by clutches. In one mode of operation, the
motor generator operating as a motor and powered by a
wind machine drives the air compressor as shown in
figure 10. The compressed air is fed into a storage tank
or into a large cavern, aquifer, or depleted natural gas
well. Under this mode, the power turbine is inoperative,
and no fuel is consumed. In a second mode of operation,
when the demand for power exceeds the supply of the
base-load utility system, the compressor is disengaged,
and the power turbine is connected to the generator. The
burner that drives the power turbine is fed fuel and
compressed air from storage to generate power for the
utility system. Wind powered pumps can be used to
desalinate water, using reverse osmosis units. Wind
powered pumps can also be used to save fuel and
electricity by compressing the working fluids used in
heat pumps for space heating applications.
Figure 10 : The mode of operation
A. Direct heat applications
Mechanical motion derived from wind power can be
used to drive heat pumps or to produce heat from the
friction of solid materials, or by the churning of water or
other fluids, or in other cases, by the use of centrifugal
or other types of pumps in combination with restrictive
orifices that produces heat from friction and turbulence
when the working fluid flows through them. This heat
may then be stored in materials having a high heat
capacity, such as water, stones, eutectic salts, etc.
B. Electric Generation Applications
Wind power can be used in centralized utility
applications to drive synchronous A.C. electrical
generators. In such applications. The energy is fed
directly into power networks through voltage step-up
transformers. WECS units can be integrated with
existing hydro electrical networks and used in a “water-
saver” mode of operation. When the wind is blowing,
electrical an amount equal to the being can reduce
generation at the hydroelectric plants in the network
produced by the WECS units. Thus, the wind turbines
supply part of the network load that is ordinarily
produced by the hydroelectric generators. Under these
conditions some of the water that would have been used
by the hydroelectric plant to supply the load is saved in
the reservoir and made available for later use when the
wind is not blowing.
C. Battery charger
The hydrogen and oxygen can be stored in liquid form in
tanks, or in gaseous form in tanks, caverns, aquifers,
depleted natural gas wells, etc. The stored hydrogen can
be used either as a fuel or direct space heating or
industrial process heat, or it can be reconverted to
electricity through the use of fuel cells, gas turbine
generators that burn hydrogen, or by other means as
shown in figure 11.
Figure 11: The battery charging unit of WEC
VII. SAFETY SYSTEMS
The Safety systems of the wind turbines comprise the
following features :
a) The computer. The wind turbine is controlled by a
computer which monitors the most important

International Journal of Scientific Research in Science and Technology (www.ijsrst.com)
149
gauging instruments and compares the results. If
errors are found the wind turbine is stopped.
b) Emergency stop. If a situation arises which calls for
the wind turbine to be stopped immediately, the
emergency stop is used. The wind turbine will stop
in few seconds by feathering the blades directly into
the wind. It cannot be stated again before what
caused the emergency stop has been rectified.
c) Revolution Counters. To prevent the rotor from
racing, two revolution counters have been mounted
on the shaft. These operate quiet independently and
activate the emergency stop if the revolutions of the
turbine exceed 24 rpm which is maximum.
d) Wind Velocity. This is measured and controlled by
the computer in two ways. First gusts of wind are
registered and if they are too strong the turbine is
stopped. Then average wind speeds are measured
over periods of 10 minutes, and the wind turbine is
also stopped if there are too high.
e) The Parachutes. Each blade tip has a parachute,
which is activated if the rpm exceeds 28. An iron
plumb bob, otherwise held in place by a magnet, is
released from the blade trip, the centrifugal force
exceeding the force of the magnet pulling out the
parachute. This decrease the speed of the wind
turbine con
f) Siderable enough to stop it from racing. The
parachute is an extra safety device should other fail.
Till now they never had been used.
g) Lightning Rods. The tree blades and the mill or
wind turbine cap are protected from lighting by
these rods going from the tip of each blade to the
ground.
A. Environmental Aspects
Wind turbines are not without environmental impact and
their operation is not entirely risk-free. Following are the
main effects due to a wind turbine.
a) Electromagnetic interference. Interference with TV
and other electromagnetic communication systems is
a possibility with wind turbines as it is with other
tall structures. TV interference is most likely in
areas where there is a weak signal because of the
distance from the transmitter, where existing
reception is none too good due to the surrounding
hills and where the wind turbine is exposed in good
position to receive and scatter the signals.
Dispensing with aerials and sending TV signals by
cable in areas that would otherwise be affected can
overcome interference.
b) Noise. The noise produced by wind farms falls into
two categories. The first type is a mechanical noise
from the gearbox, generating equipment and
linkages and the second type of aerodynamic in
nature produced by the movement of the turbine
blades. One component of the latter is the broad
band noise which ranges up to several kilo hertz and
the other is a low frequency noise of 15-20 Hz.
Revolving blades generate noise which can be heard
in the immediate vicinity of the installation, but
noise does not travel too far.
c) Visual Effects. Megawatts power generating wind
turbines are massive structures which would be quite
visible over a wide area in some locations. Variety
characteristics such as co lour pattern, shape,
rotational speed and reflectance of blade materials
can be adjusted to modify the visual effects of wind
turbines including the land scape in which they are
installed.
B. Advantages of wind energy conversion system
The major advantage of this design is that the rotor
blades can accept the wind from any compass.
Another added advantage is that the machine can
be mounted on the ground eliminating tower
structures and lifting of huge weight of machine
assembly, i.e. it can be operated close to the ground
level.
Since this machine has vertical axis symmetry, it
eliminates yaw control requirement for its rotor to
capture wind energy
Airfoil rotor fabrication costs are expected to be
reduced over conventional rotor blade costs.
The absence of pitch control requirements for
synchronous operation may yield additional cost
savings.
The tip speed ratio and power coefficient are
considerably better than those of the S-rotor but are
still below the values for a modern horizontal-axis,
two-bladed propeller rotor.
C. Disadvantages of wind energy conversion system
Rotor power output efficiency of a Darrieus wind
energy conversion system is also somewhat lower
than that of a conventional horizontal rotor.

International Journal of Scientific Research in Science and Technology (www.ijsrst.com)
150
Because a Darrieus rotor is generally situated near
ground proximity, it may also experience lower
velocity wind compared to a tower mounted
conventional wind energy conversion system of
comparable projected rotor disc area. This may
yield less energy output.
III. CONCLUSION
This work has provided us an excellent opportunity and
experience, to use our limited knowledge. We gained a
lot of practical knowledge regarding, planning,
purchasing, assembling and machining while doing this
project work. We feel that the project work is a good
solution to bridge the gates between institution and
industries.
We are proud that we have completed the work with
the limited time successfully. The Domestic Wind
Mill Power Generation is working with satisfactory
conditions. We are able to understand the
difficulties in maintaining the tolerances and also
quality. We have done to our ability and skill
making maximum use of available facilities.
In conclusion remarks of our project work, let us
add a few more lines about our impression project
work.
Thus we have developed a “wind mill power
generation” which helps to know how to achieve
non-conventional power generation. The application
of pneumatics produces smooth operation.
By using more techniques, they can be modified and
developed according to the applications.
IV. REFERENCES
[1] Subramanian (2008), "Pre-engineered Buildings
Selection of Framing System, Roofing and Wall
Materials", The Master builder, pp. 48-6.
[2] Gurusharan Singh, "Introduction to Pre Engineered
Buildings", pre -Enginered-buildngs.html.
[3] IS: 800 - 2007:- General Construction in Steel -
Code of Practice.
[4] IS: 875 (Part 1) - 1987:- Code of Practice for
Design Loads (Other than Earthquake) for
Buildings and Structures- Dead Loads.
[5] IS: 875 (Part 2) - 1987:- Code of Practice for
Design Loads (Other than Earthquake) for
Buildings and Structures- Live Loads.
[6] IS: 875 (Part 3) - 1987 :- Code of Practice for
Design Loads (Other Than Earthquake) for
Buildings And Structures- Wind Loads.
[7] John A. Rolphes (2006), "Industrial Building
Design - Seismic Issues", The Iron and Steel
Technology, pp. 282-298.
[8] Kirby technical handbook
[9] Metal Building Systems Manual 2006,
http://www.mbma.com.
[10] Ms. Darshana P. Zoad (2012), "Evaluation of Pre-
Engineering Structure Design by IS-800 as against
Pre-Engineering Structure Design by AISC",
International Journal of Engineering Research &
Technology (IJERT), Vol. 1, Issue 5.
[11] Paul Mc Entee, S.E. (2009), "Steel Moment Frames
- History and Evolution", Structural Engineer
Magazine.
[12] Sapna Kulshrestha (2012), 'Designing of Pre-
engineered Structures', The Buildotech Inida.
[13] Structural and crane load design criteria for steel
building systems, The National Building Code of
Canada, 2005.
[14] Syed Firoz (2012), "Design Concept of Pre-
engineered Building",International Journal of
Engineering Research and Applications (IJERA),
Vol. 2, Issue 2, 267-272.
[15] Ahmad M., Mazen A., M. and Tharwat (2006):
Vertical axis wind turbine modeling and
Performance with axial flux permanent magnet
synchronous generator for battery charging
applications..
[16] Bharanikumar R., Yazhini A.C., Kumar N., (2012):
Modeling and Simulation of Wind Turbine Driven
Permanent Magnet Generator with New MPPT
Algorithm. Asian Power Electronics journal, Vol.
4.
[17] Ece (2004): Modeling of Induction Motor using
qd0 Transformations.
[18] Heier S. (1998): Grid Integration of Wind Energy
Conversion Systems. John Wiley & Sons Ltd,
ISBN 0-471-97143-X.
[19] Matlab (2009): Overview of the MATLAB
Environment. Matlab Getting Started Guide, e
Math Works, Inc.
[20] Ming Y., Gengyin L., Ming Z., and Chengyong Z.
(2007): Modeling of the Wind Turbine with a
Permanent Magnet Synchronous Generator for
Integration.

International Journal of Scientific Research in Science and Technology (www.ijsrst.com)
151
[21] Pranamita B., and Aiswarya H. (2009): Power
System Stability Studies using Matlab. A Project
Report, Department of Electrical Engineering,
National Institute of Technology, Rourkela.
[22] Rolan A., Alvaro L., Gerardo V., and Daniel A.
(2009): Modelling of a Variable Speed Wind
Turbine with a Permanent Magnet Synchronous
Generator.
[23] SaifurR., and ManisaP. (2010): Modeling and
Simulation of a Distributed Generation- Integrated
Intelligent Microgrid, SERDP Project SI-1650.
[24] Simulink (2009): Modelling Process. Simulink
Getting Started Guide. The MathWorks, Inc.
[25] Sina L. and Mahyar S. (2011): Modeling and
Application of Permanent Magnet Synchronous
Generator Based Variable Speed Wind Generation
System. Department of Electrical Engineering,Ahar
Branch, Islamic Azad University, Ahar, Iran.
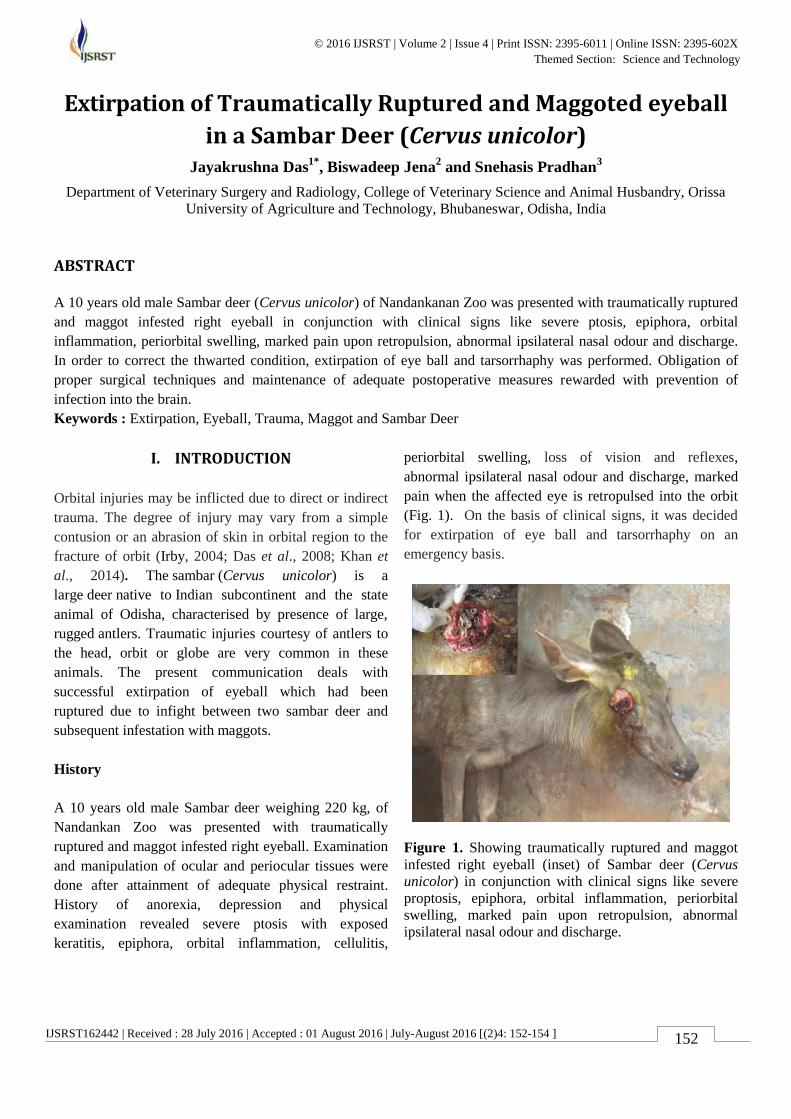
IJSRST162442 | Received : 28 July 2016 | Accepted : 01 August 2016 | July-August 2016 [(2)4: 152-154 ]
© 2016 IJSRST | Volume 2 | Issue 4 | Print ISSN: 2395-6011 | Online ISSN: 2395-602X Themed Section: Science and Technology
152
Extirpation of Traumatically Ruptured and Maggoted eyeball
in a Sambar Deer (Cervus unicolor)
Jayakrushna Das1*
, Biswadeep Jena2 and Snehasis Pradhan
3
Department of Veterinary Surgery and Radiology, College of Veterinary Science and Animal Husbandry, Orissa
University of Agriculture and Technology, Bhubaneswar, Odisha, India
ABSTRACT
A 10 years old male Sambar deer (Cervus unicolor) of Nandankanan Zoo was presented with traumatically ruptured
and maggot infested right eyeball in conjunction with clinical signs like severe ptosis, epiphora, orbital
inflammation, periorbital swelling, marked pain upon retropulsion, abnormal ipsilateral nasal odour and discharge.
In order to correct the thwarted condition, extirpation of eye ball and tarsorrhaphy was performed. Obligation of
proper surgical techniques and maintenance of adequate postoperative measures rewarded with prevention of
infection into the brain.
Keywords : Extirpation, Eyeball, Trauma, Maggot and Sambar Deer
I. INTRODUCTION
Orbital injuries may be inflicted due to direct or indirect
trauma. The degree of injury may vary from a simple
contusion or an abrasion of skin in orbital region to the
fracture of orbit (Irby, 2004; Das et al., 2008; Khan et
al., 2014). The sambar (Cervus unicolor) is a
large deer native to Indian subcontinent and the state
animal of Odisha, characterised by presence of large,
rugged antlers. Traumatic injuries courtesy of antlers to
the head, orbit or globe are very common in these
animals. The present communication deals with
successful extirpation of eyeball which had been
ruptured due to infight between two sambar deer and
subsequent infestation with maggots.
History
A 10 years old male Sambar deer weighing 220 kg, of
Nandankan Zoo was presented with traumatically
ruptured and maggot infested right eyeball. Examination
and manipulation of ocular and periocular tissues were
done after attainment of adequate physical restraint.
History of anorexia, depression and physical
examination revealed severe ptosis with exposed
keratitis, epiphora, orbital inflammation, cellulitis,
periorbital swelling, loss of vision and reflexes,
abnormal ipsilateral nasal odour and discharge, marked
pain when the affected eye is retropulsed into the orbit
(Fig. 1). On the basis of clinical signs, it was decided
for extirpation of eye ball and tarsorrhaphy on an
emergency basis.
Figure 1. Showing traumatically ruptured and maggot
infested right eyeball (inset) of Sambar deer (Cervus
unicolor) in conjunction with clinical signs like severe
proptosis, epiphora, orbital inflammation, periorbital
swelling, marked pain upon retropulsion, abnormal
ipsilateral nasal odour and discharge.

International Journal of Scientific Research in Science and Technology (www.ijsrst.com)
153
II. METHODS AND MATERIAL
Surgical Management
Animal was chemically restrained with a mixture of 330
mg of xylazine hydrochloride (Xylazil®; Troy
laboratories Pvt. Ltd.) and 660 mg of ketamine
hydrochloride (Ketamil®; Troy laboratories Pvt. Ltd.)
darted intramuscularly. After attainment of sedation, the
external jugular vein was catheterised and approximately
2 litres of dextrose and normal saline (DNS 5%) was
administered intra-operatively. In order to achieve
complete analgesia of eyeball four points retrobulbar
nerve block was performed by depositing 40 ml of 2%
lignocaine hydrochloride solution in the retrobulbar cone
using a slightly curved 8.75cm (31/ 2in) 18 gauge needle.
Surgical site was cleaned with 1% boric acid solution.
A circumferential approach around the ruptured, swollen
eyeball was made by blunt dissection around the orbit
until the optic stalk and blood supply were reached.
After cruciate ligation of the optic stalk with strong
absorbable suture (Catgut #2, Ethicon Inc.), extirpation
was performed (Fig. 2). Following surgery, a large dead
space was obliterated with sterilised gauge soaked with
povidone iodine and Vasocon. Then tarsorrhaphy was
done (Fig. 3). After surgery, 33 mg of yohimbine
hydrochloride (Antagozil®; Troy laboratories Pvt. Ltd.)
was injected intravenously. The deer regained
consciousness within two-three minutes. Post-operative
antibiotic with ceftriaxone sodium and tazobactam TM
3375 mg ( Intacef Tazo®, Intas Pharmaceuticals Pvt.
Ltd.) and analgesic (40 mg of Meloxicam; Melonex®,
Intas Pharmaceuticals Pvt. Ltd.) was continued for five
days with regular dressing of extirpated orbit and the
animal recovered.
Figure 2. Showing extirpation of thwarted eyeball
after cruciate ligation of the optic stalk with the
help of strong absorbable suture threads (Catgut #2).
Figure 3. Showing obliterated orbital space
followed by tarsorrhaphy.
III. RESULT AND DISCUSSION
Acquired ocular conditions used to occur at a higher
incidence than congenital conditions. Among those
acquired conditions serious head, ocular and orbital
trauma are always emergencies. Lacerations, ruptured
and protrusion of eye ball are the most common
traumatic injury in horned animals. Extirpation
technique is indicated following ocular trauma leading
to panopthalmia, painful glaucomatous eyes, extensive
ocular tumours, irrepairable injury, orbital abscess,
severe trauma with loss of globe. Complete and
permanent tarsorrhaphy usually followed to enucleation
and extenteration is the best mean of treatment with no
postsurgical complications and successful recovery (Irby,
2004; Das et al., 2008; Khan et al., 2014). Maggot
wounds are usually present in areas where animals
cannot lick and unable to repel the flies. Because of feral
nature of the animal, aforementioned condition was
lately detected which exacerbated to maggot infestation.
Local dressing with magacidal agents like oil of
turpentine is used to remove the maggots from the
wound, while treating maggoted wounds on the face
near eyes, the oil may accidentally seep into the eyes
causing conjunctivitis (Chawla et al., 2010). Therefore it
was decided to go for extirpation instead of daily wound
management for better prognosis. In many instances,

International Journal of Scientific Research in Science and Technology (www.ijsrst.com)
154
these procedures can be done in standing sedated animal.
However, general anaesthesia is certainly advantageous
when the animal is fractious or has a severe lesion or for
humane concerns (Irby, 2004).
IV. ACKNOWLEDGEMENT
The authors are thankful to the Dean, College of
Veterinary Science and Animal Husbandry,
Bhubaneswar and Doctor in charge, Veterinary Hospital,
Nadankanan Zoo, Bhubaneswar, Odisha for their
support and cooperation in carrying out the surgical
intervention.
V. REFERENCES
[1] Chawla, S.K., Panchbhai, V.S. and Gahlot, T.K.
(2010).The special sense organs In: Ruminant
Surgery Edited by Tyagi, R.P.S. and Singh, J. 3rd
edition. Bhola Nath Nagar, Shahdara, Dehli. pp
392-409.
[2] Das, B. C., William, B. J., Sankar, P., & Kumar,
R. S. (2008). Traumatized eye in an indigenous
buffalo. Tamilnadu J. Vet & Ani. Sci, 4(5), 198-
199.
[3] Khan, A., Gazi, M.A., Bashir, S., Dumralia, D.M.,
Bagate, M.S. and Tamdade, S. (2014).
Management of traumatic injury in goat
(extirpation) - a case study. Vet. Clin. Sci., 2(2),
28-30.
[4] Irby, N. L. (2004). Surgical disease of the eye in
farm animals. In: Fubini, S. L., & Ducharme, N.
(eds) Farm Animal Surgery, 1st ed, Saunders St.
Louis, Missouri, Pp: 436-440.
IJSRST162422 | Received : 22 July 2016 | Accepted : 02 August 2016 | July-August 2016 [(2)4: 155-161 ]
© 2016 IJSRST | Volume 2 | Issue 4 | Print ISSN: 2395-6011 | Online ISSN: 2395-602X Themed Section: Science and Technology
155
Treatment of Haemophilia A by Replacement Therapy using
Factor VIII Inhibitors
Maria Shahid, Sikander Ali
Institute of Industrial Biotechnology (IIB), GC University Lahore, Pakistan
ABSTRACT
Haemophilia A is a very severe disease which is caused due to deficiency of a protein clotting factor VIII.
Haemophilia A is X-linked recessive disorder which can be treated by the replacement therapy or by development of
an inhibitors or antibodies against the FVIII. Hemarthroses is a disease in which bleeding in the joint spaces occur.
This disease occurs approximately 70 to 80% in haemophilic patients. Then here we review about the epidimicity
that deals with the transformation of haemophilia A. Then the process of inhibition stated, in which under the
influence of some chemical substances the specific chemical process may inhibit. So, different replacement therapy
may be ineffective when an inhibitor affect the factor Vǀǀǀ gene. In the end here stated different treatments for the
management & control of disease, so among them the counselling between physician & patient is very effective.
Keywords : Hemarthroses, Haemophilia, Epidimicity, Epidemiology, DNA, AVD, IgG, TCR, Arthropathy,
Prophylaxis
I. INTRODUCTION
There are many different types of bleeding disorders in
which haemophilia A is known as a result of the
deficiency of the protein clotting factor VIII and is
genetically severe bleeding disorder. The deficiency of
factor VIII in 1 in every 5000 male births without racial
majority as X-linked recessive abnormality (Soucie et
al., 1998). Haemophilia A, as the most common disorder
in patients, is intra-articular hemorrhages. The cure of
haemophilia started from the last 40 years. In history,
patients of haemophilia, including adults and children,
had no ability of survival but now days this disease can
be controlled and helps the patients to do their work
activities in efficient way (DiMichele & Neufeld, 1998).
Proper treatment of these patients requires deeply
understanding of AHA path physiology by
anaesthesiologists.
There are different therapeutic treatments for other
bleeding disorders so that haemophilia A also cured by
specific medication and blood products. At present the
best treatment of haemophilia A is to replace the factor
VIII by using the plasma or recombinant FVIII in order
to stable its homeostasis. When a patient is develop an
inhibitor against the factor VIII then the replacement
therapy of haemophilia A becomes hopeless. Now a
day’s development of the inhibitor is the most important
treatment of haemophilic patient (Fig. 1). Although there
is decrease in death rate due to improvement in
homeostatic agent but still there is another complication
that is high rate of bleeding (Gringeri et al., 2003; Darby
et al., 2004; Morfini et al., 2007; Brown et al., 2009; Di
Minno et al., 2010).
Figure 1. Difference between a normal and haemophilic
blood vessel

International Journal of Scientific Research in Science and Technology (www.ijsrst.com)
156
II. METHODS AND MATERIAL
Epidemiology
The branch of medicines which deals with the
transmission and control of diseases in population is
known as Epidemiology. Haemophilia A is an x-linked
medical disease which is triggered due to deficiency or
deprivation of clotting FVIII. If we Talk about its
epidemicity then we can see that Europe and some parts
of North America is affected by Haemophilia A with the
approximate ratio of 1:5000 male births. In other words,
it prevails in 20.6 cases per 100,000 males, out of which
60% are severely affects by this disease. In other 40% of
the cases, mutation occurs which includes
transformation of Haemophilia A with FVIII gene. Other
cases involve mutation in the DNA like deletions and
insertion of genes (Tuddenham et al., 1994; Ghosh &
Shetty, 2009; Astermark 2010). Genetically haemophilia
is usually identified during or soon after birth, may be
possible during AVD (Assisted vaginal deliveries) and
circumcisions (Chorba et al., 1994).
Inhibitors
A substance capable of stopping or slowing a specific
chemical or biological process is known as inhibitor.
Antibodies are also known as inhibitors for example
immunoglobulin G (IgG) (Scandella et al., 1989).
Immune system utilize antibody to determine and
neutralize toxin objects for example viruses and bacteria.
As we know that antibody is a large Y-shaped protein
which is produced by the plasma cells (Fig. 2). There is
an increase in risk of inhibitors developing in those
chronic haemophilic patients which exposes about 10 to
20 days to FVIII concentrate. The treatment of
haemophilic patients with inhibitions is difficult as that
of prevention of orthopaedic complication. There is need
of improvement in clinical outcomes in order to get a
better result. With small exposure, chronic haemophilic
patients in childhood about 20 to 30% will develop
inhibitions to FVIII. Researchers tell us that there is a
mutual relation between the inhibitions and low quality
of life. When haemophilic patient is exposing to FVIII
again & again then it develops in those patients and
binds to inactivate FVIII. There are 2 types of inhibitors
which are reversible inhibitors and irreversible
inhibitors.
Figure 2. The antibodies working as inhibitors
Mechanism of the development of factor VIII
inhibitors
This mechanism is indicated by various studies that
FVIII is actually responsible for the activation of
immune response. As we know that FVIII is mainly T
helper cell-mediated and always present on the antigen
presenting cells for example dendritic cells, B cells and
macrophages (André et al., 2009; Astermark 2010).
Whenever antibodies combines against FVIII then
CAAs should incorporate FVIII and then after
degeneration it is important that it should introduces to
major histocompatibility complex molecules of Class II.
After the attachment of FVIII peptides with MHC
molecules this complex will accessible for the
determination by the CD4+ T cells then in result CAAs
will develop a plasma layer complex. Moreover,
peptides located or occurring within the cells particles of
FVIII, which incorporates in minute quantities in the
patient, are introduced via MHC Class I molecular
particles to CD8+ T cells which is accepted by antigen T
cells receptors (TCRs) (Chaves & Rodrigues, 2009). For
the arrangement of antigens to the TCRs in order to be
well organized and systemic, a second indication takes
place between CAAs and T cells which is the co-
triggered CD80/86 molecules declared in CAAs attached
to CD28 stated in T cells (Hoyer 1995; Wight & Paisley,
2003). T cells gets activated when both signals are there
which can be the type-1 helper T cell (Th1) activation,
in charge for the discharge of cytokines as that we know
about the work of interferon gamma tumour necrosis
factor alpha and interleukin 10 (IL-10), amid others that
are significant in humeral resilience or immunity.
In addition to this, the declaration of CD2, CD30, CD40
and CD28 expands on the CD4+ T cell surface
(Oldenburg & Pavlova, 2006; André et al., 2009; Ghosh
& Shetty, 2009; Pratt & Thompson, 2009). When
excreted by the Th1 or Th2 then these all cytokines
induces the distinction or divergence of B cells, which
alters the isotype of the immunoglobulin and yield
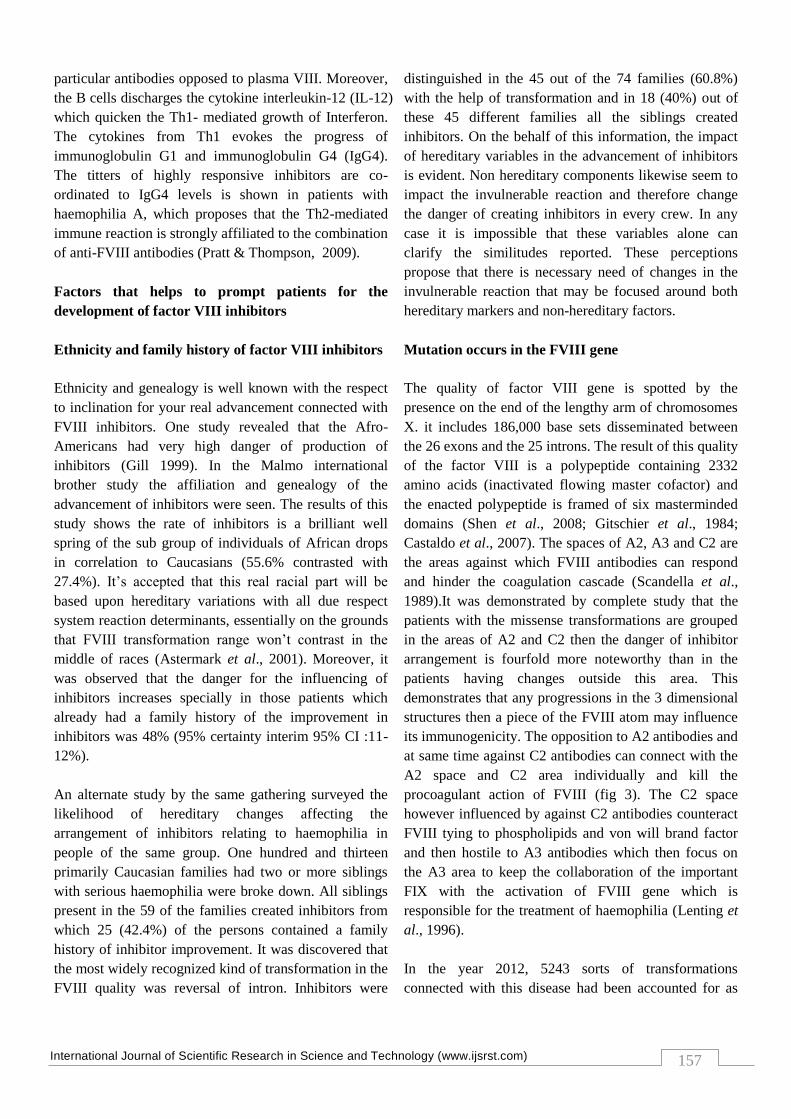
International Journal of Scientific Research in Science and Technology (www.ijsrst.com)
157
particular antibodies opposed to plasma VIII. Moreover,
the B cells discharges the cytokine interleukin-12 (IL-12)
which quicken the Th1- mediated growth of Interferon.
The cytokines from Th1 evokes the progress of
immunoglobulin G1 and immunoglobulin G4 (IgG4).
The titters of highly responsive inhibitors are co-
ordinated to IgG4 levels is shown in patients with
haemophilia A, which proposes that the Th2-mediated
immune reaction is strongly affiliated to the combination
of anti-FVIII antibodies (Pratt & Thompson, 2009).
Factors that helps to prompt patients for the
development of factor VIII inhibitors
Ethnicity and family history of factor VIII inhibitors
Ethnicity and genealogy is well known with the respect
to inclination for your real advancement connected with
FVIII inhibitors. One study revealed that the Afro-
Americans had very high danger of production of
inhibitors (Gill 1999). In the Malmo international
brother study the affiliation and genealogy of the
advancement of inhibitors were seen. The results of this
study shows the rate of inhibitors is a brilliant well
spring of the sub group of individuals of African drops
in correlation to Caucasians (55.6% contrasted with
27.4%). It’s accepted that this real racial part will be
based upon hereditary variations with all due respect
system reaction determinants, essentially on the grounds
that FVIII transformation range won’t contrast in the
middle of races (Astermark et al., 2001). Moreover, it
was observed that the danger for the influencing of
inhibitors increases specially in those patients which
already had a family history of the improvement in
inhibitors was 48% (95% certainty interim 95% CI :11-
12%).
An alternate study by the same gathering surveyed the
likelihood of hereditary changes affecting the
arrangement of inhibitors relating to haemophilia in
people of the same group. One hundred and thirteen
primarily Caucasian families had two or more siblings
with serious haemophilia were broke down. All siblings
present in the 59 of the families created inhibitors from
which 25 (42.4%) of the persons contained a family
history of inhibitor improvement. It was discovered that
the most widely recognized kind of transformation in the
FVIII quality was reversal of intron. Inhibitors were
distinguished in the 45 out of the 74 families (60.8%)
with the help of transformation and in 18 (40%) out of
these 45 different families all the siblings created
inhibitors. On the behalf of this information, the impact
of hereditary variables in the advancement of inhibitors
is evident. Non hereditary components likewise seem to
impact the invulnerable reaction and therefore change
the danger of creating inhibitors in every crew. In any
case it is impossible that these variables alone can
clarify the similitudes reported. These perceptions
propose that there is necessary need of changes in the
invulnerable reaction that may be focused around both
hereditary markers and non-hereditary factors.
Mutation occurs in the FVIII gene
The quality of factor VIII gene is spotted by the
presence on the end of the lengthy arm of chromosomes
X. it includes 186,000 base sets disseminated between
the 26 exons and the 25 introns. The result of this quality
of the factor VIII is a polypeptide containing 2332
amino acids (inactivated flowing master cofactor) and
the enacted polypeptide is framed of six masterminded
domains (Shen et al., 2008; Gitschier et al., 1984;
Castaldo et al., 2007). The spaces of A2, A3 and C2 are
the areas against which FVIII antibodies can respond
and hinder the coagulation cascade (Scandella et al.,
1989).It was demonstrated by complete study that the
patients with the missense transformations are grouped
in the areas of A2 and C2 then the danger of inhibitor
arrangement is fourfold more noteworthy than in the
patients having changes outside this area. This
demonstrates that any progressions in the 3 dimensional
structures then a piece of the FVIII atom may influence
its immunogenicity. The opposition to A2 antibodies and
at same time against C2 antibodies can connect with the
A2 space and C2 area individually and kill the
procoagulant action of FVIII (fig 3). The C2 space
however influenced by against C2 antibodies counteract
FVIII tying to phospholipids and von will brand factor
and then hostile to A3 antibodies which then focus on
the A3 area to keep the collaboration of the important
FIX with the activation of FVIII gene which is
responsible for the treatment of haemophilia (Lenting et
al., 1996).
In the year 2012, 5243 sorts of transformations
connected with this disease had been accounted for as

International Journal of Scientific Research in Science and Technology (www.ijsrst.com)
158
per the hamsters (test of mutation in haemophilia A and
also site of resource search) electronic database. The
gathering with the most astounding danger of delivering
hostile to FVIII antibodies is unified with the finest
variations in gene. One Meta investigation watched that
the danger of inhibitor development in the patients with
vast cancellations and babble changes is always greater
than in those patients which have intron 22 reversals
(pooled OR=3.6 as well as= 1.4, separately). The danger
of patients with intron 1 reversals and join site changes
is practically equivalent (pooled OR= 0.9 as well as=1.0
separately) and the danger of patients having small
amount of cancellations and insertions and missense
transformations are lower (pooled OR= 0.5 as well as=
0.3, respectively) (Gouw et al., 2012). Reversals in
intron 22 (30 half) and intron 1 (0-5%) are generally
connected with extreme haemophilia A phenotype and a
middle person hazard for structuring inhibitors. In Brazil,
an investigation of 86 Caucasian patients, examined the
event of reversal transformations present in the 47
patients from which 33 (70%) had serious haemophilia
and 14 (30%) with moderate or mellow haemophilia. An
increment in the recurrence of reversal transformations
(13/13; 39.4%) was seen in the subgroup named serious
with the larger part (11/13; 86.4%) being changes in
intron 22 (Soares et al., 2001).
Figure 3: Mutation in factor VIII gene
Arthropathy
Arthropathy is the term which is used for the diseases
and abnormalities of joints (ex. hemarthroses).
Hemarthroses is a condition in which there is bleeding in
the joint spaces and this condition occurs in haemophilic
patients about 70 to 80% (Parameswaran et al., 2005).
There are different causes of this disease like injury,
knee joint arthroplasty and inflammation in the joints
(DiMichele & Neufeld, 1998). This disease can be
treated by the administration of clotting factor.
Arthtropathy is most commonly occurs in haemophilic
patients. This condition occurs during the twenty to
thirty series of life. The condition can be quite painful
and they usually require treatment to inhibit further
degeneration of the joint. Uncontrolled bleeding is the
cause of severe arthropathy in haemophilic patients
usually in young patients. The symptoms of arthropathy
depend on the root cause. The risk of joint diseases and
other sicknesses can be reduced by staying active and
eating a balanced.
III. RESULT AND DISCUSSION
Treatment
Concentrated FVIII was first produced using a cry
precipitation method in 1965 that was simply duplicated
by blood banks to make use of it for routine analysis and
treating joint and muscle haemorrhage (Tullis et al.,
1965; DiMichele & Neufeld, 1998). In spite of the fact
that this method provided immense clinical advantages
to patients of haemophilia, it also caused rise in risk of
blood borne aggressive viral infectious disease.
Aggressive transmission of HIV and HCV happened in
the haemophilia group via contaminated human plasma
products (Tencer et al., 2007). It was estimated in 2004
that minimum one third of victims who got affected by
haemophilia were also affected with HIV and 80% with
HCV (Fig. 4).
Figure 4. Replacement therapy through additional factor
VIII
This calamity for the haemophilia group not only caused
the application of screening but also viral inactivation
procedures by using heat methodologies. In spite of the
fact that products obtained from plasma are more

International Journal of Scientific Research in Science and Technology (www.ijsrst.com)
159
secured it normally faces infectious instruments that
might be against the current procedures for viral,
chemical or even physical inactivation (non-lipid
enveloped diseases). There may not have been
announced cases of HIV or HCV transferrable
congealing factor since 1986 and 1997 (National
Haemophilia Foundation 2012). Recently, a HIV
transferred case from the exchange of fresh frozen
plasma in USA highlights the possibility of transferable
wrapped up diseases from human derived blood
products is not zero (Centers for disease control and
prevention, 2010).
Substantial developments have been witnessed in
haemophilic victims without inhibitors. Patients with
serious haemophilia had an expected life of 11 years in
1960 and it grew to 50 years in 1980s (Strine et al., 1994;
Chorba et al., 2001). Latest advancement in treatment of
haemophilia focuses to lessen the mortality rate and
upgrade the life standard of haemophilic patients.
Patients with inhibitors have less medical treatment
options compared with those without one. The focus is
to stop critical bleeding spells in patients with inhibitors
and maintain homeostasis. In these days, there are two
bypassing agents accessible ways for nursing
haemophilia A patients with inhibitors. Recombinant
factor 7a is approved to sustain homeostasis in
haemophilic patients with inhibitors. ITT is composed
by managing repeat high doses of F7. This method later
enables substituting F7 to restarting usage effectively.
ITT was victorious in more than 80% of the patients
with inhibitors according to international immune
tolerance registry. By comparing high dosage and low
dosage, only 69% patients were successful but bleeding
spells were considerably reduced in high dosage
community but unfortunately, these findings didn’t
affect the outcome significantly.
Prophylaxis and Episodic Treatment of Bleeding
Disorders
Patients of Chronic haemophilia suffer from continuous
bleeding in joints. The result of chronic haemophilia is
severe pain and weak joints. Prophylaxis is the
prevention of disease and control of its possible spread
over the society. Prophylactic treatment is the preventive
treatment of hemarthrosis and musculoskeletal disorders
which are common in haemophilic patients. If we talk
about the levels of prevention so in primary prevention
we can see that it is the method to avoid occurrence of
disease by removing disease agents and increases the
resistance to disease. For example by immunization, by
maintaining healthy diet, exercise and by avoid smoking.
The secondary level of prevention is the method which
is used to detect an existing disease before its symptoms
will appear. The treatment of hypertension by cancer
screening is one of the examples. Then the tertiary
prevention is the method which is used to reduce all the
negative impacts of disease, whose symptoms are known,
such as disability or death by the rehabilitation and
treatment e.g., by surgical procedures. When
prophylactic treatment begins before the age of three
years, best results are achieved.
Episodic treatment of haemophilic patients is also an
effective method. Episodic treatment is a pattern of
medical & nursing in which services are provided to a
particular patient, without an ongoing relationship being
established between person and health professionals. For
example in emergency department there are many
advantages of this type of treatment like orthopaedic
function becomes better and it also improves overall
quality of life. It also helps in rapid bleed control
(Lusher 1998). In USA 251u/kg to 40u/kg of FVIII three
times weak of haemophilia.
Primary Care and Haemophilia Treatment Centres
In the treatment of haemophilia A, interaction with a
physician is very important for patients and their
families. The relationship of patient with physician is
very critical for the long time treatment with the respect
to prophylaxis. In some cases, patients are responsible
for their own care (Geraghty et al., 2006). Recently, by
the studies of treatment centres it proves that increase in
only one physician per 10,000 individual populations
was associated with an average reduced in death rate of
49 per 100,000 people per year. These studies also
showed that a patient which is treated at HTCS has death
rate only 40% but in comparison with a patient which is
treated by local hospitals carries towards more severe
sickness (Soucie et al., 2000).

International Journal of Scientific Research in Science and Technology (www.ijsrst.com)
160
IV. CONCLUSION
Haemophilia A can by treated by the replacement of
FVIII and it may also treated by introducing an inhibitor.
This disease can be treated by complete contact with
consultant and by proper care. This may also be treated
by giving people awareness at each level starting from
schools. Episodic treatment is also very affective for
haemophilic patient.
V. REFERENCES
[1]. André, S., Y. Meslier, J.D. Dimitrov, Y. Repessé,
S.V. Kaveri and S. Lacroix- Desmazes, et al.
2009. A cellular viewpoint of anti-FVIII immune
response in haemophilia A. Clin. Rev. Allergy
Immunol., 37(2): 105-113.
[2]. Astermark, J. 2010. Inhibitor development:
patient-determined risk factors of Haemophilia.
16(102): 66-70.
[3]. Astermark, J., E. Berntorp, G.C. White, B.L.
Kroner. 2001. MIBS Study Group. The Malmö
International Brother Study (MIBS): further
support forgenetic predisposition to inhibitor
development in haemophilia patients.
Haemophilia, 7(3): 267-272.
[4]. Castaldo, G., V. Argenio, P. Nardiello, F. Zarrilli,
V. Sanna, A. Rocino, et al. 2007. Haemophilia A:
molecular insights. Clin. Chem. Lab. Med., 45(4):
450-461.
[5]. Centers for Disease Control and Prevention
(CDC). 2010 HIV transmission through
transfusion – Missouri and Colorado, 2008.
MMWR Morb. Mortal Wkly Rep., 59(41): 1335–
1339.
[6]. Chaves, D.G. and C.V. Rodrigues. 2009.
Development of factor VIII inhibitors in
haemophilia A. Rev. Bras. Hematol. Hemoter.,
31(5): 384-390.
[7]. Chorba, T.L., R.C. Holman, M.J. Clarke, B.L.
Evatt. 2001. Effects of HIV infection on age and
cause of death for persons with haemophilia A in
the United States. Am. J. Hematol., 66(4): 229-
240.
[8]. Chorba, T.L., R.C. Holman, T.W. Strine, M.J.
Clarke, B.L. Evatt. 1994. Changes in longevity
and causes of death among persons with
haemophilia A. Am. J. Hematol., 45(2): 112-121.
[9]. DiMichele, D., E.J. Neufeld. 1998. Haemophilia.
A new approach to an old disease. Hematol.
Oncol. Clin. North Am., 12(6): 1315-1344.
[10]. Geraghty, S., T. Dunkley, C. Harrington, K.
Lindvall, J. Maahs, J. Sek. 2006. Practice patterns
in haemophilia, A therapy - global progress
towards optimal care. Haemophilia, 12(1): 75-81.
[11]. Ghosh, K., S. Shetty. 2009. Immune response to
FVIII in haemophilia A Review of risk factors.
Clin. Rev. Allergy Immunol., 37(2): 58-66.
[12]. Gill, J.C. 1999. The role of genetics in inhibitor
formation. Thromb. Haemost., 82(2): 500-504.
[13]. Gitschier, J., W.I. Wood, T.M. Goralka, K.L.
Wion, E.Y. Chen, D.H. Eaton, et al. 1984.
Characterization of the human factor VIII gene.
Nature, 312: 326-330.
[14]. Gouw, S.C., H.M. van den Berg, J. Oldenburg, J.
Astermark, P.G. de Groot, M. Margaglione. et al.
2012. F8 gene mutation type and inhibitor
development in patients with severe haemophilia
A: systematic review and metaanalysis. Blood,
119(12): 2922-2934.
[15]. Hoyer, L.W. 1995. The incidence of factor VIII
inhibitors in patients with severe haemophilia A.
Adv. Exp. Med. Biol., 386: 35-45.
[16]. Lenting, P.J., J.W. van de Loo, M.J. Donath, J.A.
van Mourik, K. Mertens, 1996. The sequence
Glu1811-Lys1818 of human blood coagulation
factor VIII comprises a binding site for activated
factor IX. J Biol Chem, 271(4): 1935-1940.
[17]. Lusher, J.M. 1998. Early treatment with
recombinant factor VII a results in greater efficacy
with less product. Eur. J. Haematol. Suppl., 63: 7-
10.
[18]. Oldenburg, J., A. Pavlova. 2006. Genetic risk
factors for inhibitors to factors VIII and IX.
Haemophilia, 12: 15-22.
[19]. Parameswaran, R., A.D. Shapiro, J.C. Gill, C.M.
Kessler. 2005. Dose effect and efficacy of rFVIIa
in the treatment of haemophilia patients with
inhibitors: analysis from the Haemophilia and
Thrombosis Research Society Registry.
Haemophilia, 11(2): 100-106.
[20]. Pratt, K.P., A.R. Thompson. 2009. B-cell and T-
cell epitopes in anti-factor VIII immune responses.
Clin Rev Allergy Immunol., 37(2): 80-95.

International Journal of Scientific Research in Science and Technology (www.ijsrst.com)
161
[21]. Scandella, D., C. Kessler, P. Esmon, D. Hurst, S.
Courter, E. Gomperts. et al. 1995. Epitope
specificity and functional characterization of
factor VIII inhibitors. Adv. Exp. Med. Biol., 386:
47-63.
[22]. Scandella, D., M. Mattingly, S. Graaf, C.A.
Fulcher. 1989. Localization of epitopes for human
factor VIII inhibitor antibodies by immunoblotting
and antibody neutralization. Blood, 74(5): 1618-
1626.
[23]. Shen, B.W., P.C. Spiegel, C.H. Chang, J.W. Huh,
J.S. Lee, J. Kim, et al. 2008. The tertiary structure
and domain organization of coagulation factor
VIII. Blood, 111(3): 1240-1247.
[24]. Soares, R.P., D.A. Chamone, S.P. Bydlowski.
2001. Factor VIII gene inversions and
polymorphisms in Brazilian patients with
haemophilia A: carrier detection and prenatal
diagnosis. Haemophilia, 7(3): 299-305.
[25]. Soucie, J.M., R. Nuss, B. Evatt. et al. 2000.
Mortality among males with haemophilia:
relations with source of medical care. Blood,
96(2): 437-442.
[26]. Tencer, T., H.S. Friedman, J. Li-McLeod, K.
Johnson. 2007. Medical costs and resource
utilization for haemophilia patients with and
without HIV or HCV infection. J. Manag. Care
Pharm., 13(9): 790-798.
[27]. Tuddenham, E.G., R. Schwaab, J. Seehafer, et al.
1994. Haemophilia A: database of nucleotide
substitutions, deletions, insertions and
rearrangements of the factor VIII gene, second
edition. Nucleic Acids Res., 22(22): 4851-4868.
[28]. Tullis, J.L., M. Melin, P. Jurigian. 1965. Clinical
use of human prothrombin complexes. N Engl. J.
Med., 273(13): 667-674.
[29]. Wight, J. and S. Paisley. 2003. The epidemiology
of inhibitors in haemophilia A: a systematic
review. Haemophilia, 9(4): 418-435.

IJSRST162427 | Received: 23 July 2016 | Accepted: 03 August 2016 | July-August-2016 [(2)4: 162-166]
© 2016 IJSRST | Volume 2 | Issue 4 | Print ISSN: 2395-6011 | Online ISSN: 2395-602X Themed Section: Science and Technology
162
Electron Transfer Reaction of Pyridine with 12-
Tungstocobaltate (III) in Acidic Buffer Medium B. Dash, A. K. Patnaik, G. C. Dash, P. Mohanty
Utkal University, Vani Vihar, Bhubaneswar, Odisha, India
ABSTRACT
The electron transfer reaction of pyridine with 12-tungstocobaltate (III) was studied spectrophotometrically over the
range 3.8 104[Co
IIIW
5-]T 4.2, 4.2 10
2 [PyN]T 12.6, 3.8 pH 5.4 and 313K T 328K. The reaction
shows zero order dependence in [CoIII
W5-
]T and first order in [PyN]T and inverse dependence in [H+]T. kobs and
second order rate constant, k2 were found to increase with the increase in temperature. The activation parameters,
H (kJ/mol) and S (JK
-1mol
-1) were found to be 53.16 and -34.22. Negative value of
S indicates ordered
transition state for the electron transfer reaction.
Keywords : Pyridine, Tungstocobaltate(III), Spectrophotometer, Kinetics, Product Analysis, Activation Parameters.
I. INTRODUCTION
The oxidant Keggin type 12-tungsto cobaltate (III),
(CoIII
W12O405-
or CoIII
W5-
) Cluster has a reduction
potential of 1.0V1. Hence it can accept electrons from
pyridine. The above cluster is known for photochemical
hydrogen generation and is involved in multielectron
reduction process2-4
. The redox behaviour of above
cobalt cluster with few biomolecules like ascorbic acid5,
glutathione6, citric acid
7, DL-methionine
8 and cystine
9
have been investigated., In order to examine the redox
behavior of 12-tungstocobaltate(III), its reaction with
pyridine has been undertaken.
II. METHODS AND MATERIAL
A. Experimental
[CoIII
W12O40]5-
was prepared by the reported method10
and was characterized spectro photometrically11
and by
elemental analysis. All chemicals used were of AnalaR
grade. Pyridine (Merck) was used as such. Ionic strength
was maintained with NaClO4 (Merck). Electron transfer
reaction was studied at 3.8 < pH< 5.4 using a pre-
standardised Elico (India) digital pH meter equipped
with glass electrode. The pH of solution was maintained
by using potassium hydrogen phthalate, sodium acetate
and acetic acid buffer solution. The solutions were
prepared in freshly prepared doubly distilled water using
an all quartz distillation apparatus containing little
amount of KMnO4 crystals.
Kinetics Measurement
Kinetics measurements were performed using systronic
2202 UV-vis spectrophotometer. The kinetics was
followed under pseudo first order conditions keeping
large excess of [pyridine] over [oxidant]. The reaction
was initiated by mixing previously thermostated solution
of [pyridine] and [CoW12O40]5-
which contained required
amount of acidic buffer and double distilled water. The
progress of the reaction was followed
spectrophotometrically at 388 nm (spectral scan) by
monitoring decrease of absorbance of oxidant with time.
The pseudo-first order rate constant (kobs) were
determined from the slope of linear plot of ln ( )tA A
vs t (s) using EXCEL programme.
ln ( )tA A = ln ( )oA A - kobst (1)
where At and A are the absorbance of the reaction
mixture at time ‘t’ and at equilibrium respectively. The
reported data represents an average of duplicate runs.
The rate constant were reproducible within + 5% and the
reaction was studied upto 80% completion. The co-

International Journal of Scientific Research in Science and Technology (www.ijsrst.com)
163
relation coefficients of plots used to determine kobs were
found to be 0.99 in most of the cases.
Stoichiometry and Identification of the product
The stoichiometry of the electron transfer reaction was
determined in the following way. The pH of the mixture
containing tungstocobaltate (III) and pyridine in a mole
ratio (1:5) was maintained at pH = 5.4 and the
temperature of mixture was maintained at 500C and kept
about 6 hours. After the reaction was completed, the
solution was analysed by determining the unreacted
tungstocobaltate spectrophotometrically. It was found
that 2 moles of oxidant reacted with 1 mole of pyridine.
Therefore the stochiometry of reaction can written as
2[CoIII
W]5-
+ O + 2[CoIIW]
6- + 2H
+ (2)
At the end of the redox reaction, the solution was treated
with Dowex 50 x 8 (Na+ form) resin to remove metal ion.
A part of the solution shows the presence of Cobalt(II)
by Kitson method. The remaining solution was
evaporated at low temperature till the volume was
reduced to 1/3rd of the initial volume of the solution. It
was kept in refregerator overnight. The crystalline
product was isolated and it was filtered and dried in
desiccator. FTIR spectra of the product were determined.
Fig. 2.(a) is the FTIR spectra of the reactant which is
compared with the FTIR spectra of the product Fig.2(b).
Most of the peaks showing very slight shift and one new
peak appeared at 1315cm-1
in Fig.2(
stretching frequency without disturbing the molecular
frame of pyridine. Hence the isolated product was
identified as pyridine N-oxide.
III. RESULT AND DISCUSSION
Rate dependence on [CoIII
W5-
]T
Keeping all conditions constant, [Pyridine] = 12.6 x 10⁻²
mol dm-3
, pH= 5.4, temperature = 500C, [Co
IIIW
5-]T
was
varied from 3.8 x 10⁻⁴
to 4.2 x 10⁻⁴
mol dm-3
. The
average kobs value did not change appreciably and was
found to be (3.48+0.5)10-5
sec-1
. This fact indicates that
the reaction is showing zero order dependence in
[CoIII
W5-
]T.
Rate dependence on pH
Keeping all the conditions constant, [Pyridine] = 12.6 x
10-2
mol dm-3
and [CoIII
W5-
]T = 4.2 x 10⁻⁴
mol dm-3
,
temperature = 500C, when pH changes from 3.8 to 5.4,
rate constant increases from 16.8x10⁻⁵
sec-1
to 34.8x10-
5sec
-1. The rate of reaction was found to increase with
the increase in pH. Pkb of pyridine = 8.77 at 250C. So it
indicates that at pH= 8.77, there will be 50% protonated
form of pyridine. As pH increased from 3.8 to 5.4, the
percentage of neutral form was increased. Hence, the
rate of reaction was increased, because the protonated
form of pyridine could not participate in electron
transfer reaction.
Rate dependence on [pyridine]
With increasing [pyridine] at a given pH and at a given
temperature with constant [oxidant], the rate of the
reaction is found to increase (Table-1&2). Keeping
[CoIII
W5-
]T = 4.2 x 10⁻⁴
mol dm-3
, temp = 500C when

International Journal of Scientific Research in Science and Technology (www.ijsrst.com)
164
[Pyridine] were varied from 4.2x10⁻²
mol dm-3
to 12.6 x
10-2
mol dm-3
, 105 kobs
increased from 12.5 to 34.8 sec
-1
at pH = 5.4. This shows that as the [pyridine] is
increased at a given pH, the concentration of neutral
form was increased and hence the rate of reaction was
increased.
Table 1. Pseudo- first order rate constants for electron
transfer reaction of
12-tungstocobaltate(III) with pyridine
[CoIII
W5-
] T = 4.2 x 10⁻⁴
mol dm-3
, temp= 500C, =
388nm
102[PyN]T mold m
-3 pH 10
5kobs
12.6 5.4
5.0
4.6
4.2
3.8
34.8
24.8
22.0
18.5
16.8
10.5 5.4
5.0
4.6
4.2
3.8
25.7
23.5
21.8
19.2
16.2
8.4 5.4
5.0
4.6
4.2
3.8
21.0
19.2
18.2
15.7
14.5
6.3 5.4
5
4.6
7.2
3.8
16.3
14.7
10.3
9.83
7.66
4.2 5.4
5.0
4.6
4.2
3.8
12.5
10.66
8.66
7.50
6.83
Table -2. Pseudo- first order rate constants for electron
transfer reaction of 12-tungstocobaltate(III) with
pyridine
[CoIII
W5-
] T = 4.2 x 10⁻⁴
mol dm-3
, temp= 400C, =
388nm
102[PyN]T mold
m-3
pH 105kobs
12.6 5.4
5.0
4.6
4.2
3.8
19.5
15.2
11.5
9.66
7.83
10.5 5.4
5.0
4.6
4.2
3.8
17.0
13.3
10.7
8.50
6.85
8.4 5.4
5.0
4.6
4.2
3.8
14.2
12.4
9.4
7.6
5.9
6.3 5.4
5.0
4.6
7.2
3.8
10.5
9.4
8.6
6.3
5.8
4.2 5.4
5.0
4.6
4.2
3.8
5.0
4.3
3.8
3.2
2.98

International Journal of Scientific Research in Science and Technology (www.ijsrst.com)
165
Table 3. Electron transfer rate constant, activation
parameters and thermodynamic parameters for redox
reaction of12-tungstocobaltate (III) with pyridine.
Condition : pH=5.4, [PyN] = 12.6 x 10⁻²
mol dm-3
,
[Co(III)] = 4.2 x 10⁻³
mol dm-3
Tem
p (t)
(0C)
103kob
s
105kob
s (sec-
1)
-1 -1obs2
kk = (mol lit sec )
[PyN]
k2/T Log
(k2/T)
55
50
45
40
3.0
3.1
3.1
3.2
45.3
34.8
22.5
19.5
3.6 x 10⁻³
2.8 x 10⁻³
1.8 x 10⁻³
1.5 x 10⁻³
1.179
0.892
0.568
0.484
5
0.0715
7
-
0.0495
8
-
0.2456
-
0.3147
H = 53.16 kJ mol-1 S = -34.22 JK
-1 mol
-1
G (298K) =63.3kJ mol-1
Rate dependence on temperature
Keeping all the conditions constant, the rate of the redox
reaction was increased when temperature was increased.
This can be explained on the basis of Arrhenius equation.
Basing on the above facts, the mechanism of reaction
can be delineated and rate law can be derived.
Mechanism
bKPyN H PyNH (3)
[ ]
[ ][ ]b
PyNHK
PyN H
[ ] [ ][ ]bPyNH K PyN H
. .( ) ( )etk
r d sCo III PyN Co II PyN O
(4)
[ ] [ ( )]et eRate k PyN Co III
[ ] [ ] [ ]T e ePyN PyN PyNH
[ ] [ ][ ]e bPyN K PyN H
[ ] {1 [ ]}e bPyN K H
[ ] [ ] /{1 [ ]}e T bPyN PyN K H
[ ] [ ( )]
1 [ ]
et T
b
k PyN Co IIIRate
K H
(5)
[ ( )]obsRate k Co III
(6)
[ ]
1 [ ]
et Tobs
b
k PyNk
K H
(7)
(1 [ ]) [ ]obs b et Tk K H k PyN
(8)
The plot of L.H.S. = kobs (1+Kb[H+] vs [PyN]T, is linear.
Slope of the plot is equal to ket. The value of ket at
temperature range 313K to 328K are collected in Table
3. The H (kJ/mol) = 53.16 and S (JK-1
mole-1
) = -
34.22 has been calculated using Eyring equation. since
Kb(PyN) = 1.7 x 10⁻⁹
(250C), the product Kb[H
+] (in the
pH range 3.8 to 5.4) will be small in comparison to 1.0.
Hence plot of kobs vs [PyN]T is linear (fig 4 & 5).
Negative activation entropy indicates that the reaction is
passing through an ordered transition state.

International Journal of Scientific Research in Science and Technology (www.ijsrst.com)
166
Figure 5. FTIR spectra of Pyridine Oxide
Figure 6. FTIR spectra of Pyridine Oxide
IV. CONCLUSION
The Kinetics of redox reaction between 12-
tungstocobalate (III) and pyridine under varying pH,
temperature, concentration of pyridine shows first order
dependence in [PyN], inverse dependence in [H+], Zero
order in 12-tungstocobalate (III). The overall
stoichiometry found to be 2:1 corresponding to oxidant
and reductant. Second order electron transfer rate was
found to increase with increase in temperature. Moderate
activation parameters favour the electron transfer
process.
V. ACKNOWLEDGEMENT
One of the author B. Dash is thankful to HOD,
Chemistry, Department of Chemistry Utkal University,
Bhubaneswar for providing necessary facilities and also
thankful to principal, Dhamnagar College, Dhamnagar,
Bhadrak for allowing to complete research work for
Ph.D degree.
VI. REFERENCES
[1] L Eberson, JAm Chem Soc., 105, 3192, (1983).
[2] A loannidis and E Papaconstantinou, Inorg Chem.,
24, 439, (1985).
[3] T M Pope and E Papaconstantinou , Inorg Chem.,
6, 1147, (1967).
[4] T M Pope and M G Varga Jr, Inorg Chem., 5,
1249, (1966).
[5] Z Amjad, C J Brodovctch and A McAuley , Can J
Chem., 55, 3581, (1977).
[6] A G Ayoko and A M Olatunji, Inorg Chim Acta,
80, L15-L17, (1983).
[7] K S Saha, C M Ghosh and P Banerjee , Int J Chem
Kinet., 20, 699, (2004).
[8] K Satpathy, G C Dash, S Acharya and P Mohanty,
J Indian Chem Soc., 83, 891, (2006).
[9] K Satpathy, G C Dash and P Mohanty, Indian J
Chem., 47A, 1199-1203, (2008).
[10] B Keita, K Essaadi, L Nadjo, R Contant and Y
Justum, / Electro Anal Chem., ,404, 271(1996).
[11] G P Rasmussen and H L Brubaker, Inorg Chem.,
3, 977(1964).

IJSRST162426 | Received: 26 July 2016 | Accepted: 03 August 2016 | July-August-2016 [(2)4: 167-172]
© 2016 IJSRST | Volume 2 | Issue 4 | Print ISSN: 2395-6011 | Online ISSN: 2395-602X Themed Section: Science and Technology
167
Modelling and Structural Analysis of a Pressure Hull under Dynamic Load
P. Yamini Charishma*1, T. R. Sydanna2, M. Naga Kiran3, A. Salmon4 1,2
Department of Mechanical Engineering, JNTUA, Sreenivasa College of Engineering and Technology, Kurnool
Andhra Pradesh, India 3,4
Department Mechanical Engineering, JNTUA, Dr. K.V.Subba Reddy Institute of Technology, Kurnool, Andhra Pradesh,
India
ABSTRACT
Pressure hulls are the main load bearing structures of naval submarines, and autonomous underwater vehicles
(AUVs). A pressure hull is a structure that is designed to withstand the compressive forces associated with
hydrostatic pressure. In this thesis, the assembly of the pressure hull including Navigation compartment shell,
Battery compartment shell which is connected with bolts is designed which is used at present. Around 16 M12 bolts
are used to connect the Navigation compartment shell and Battery compartment shell. These shells are to be
dissembled very frequently for battery charging and other maintenance purpose. It is observed that the dissembling
and assembling process is a very time consuming because it requires unbolting and bolting of all the 16 bolts every
time. A new design of pressure hull is proposed where the bolts are removed and the navigation compartment and
battery compartment are welded. In the present paper, design calculations are done as per ASME codes to withstand
the pressure of 65 Bar. The design constraints considered for the analysis were stresses and deflections. The pressure
hulls have been modeled considering the elliptical cross section. The modeling of the pressure hull has been carried
out by pro-5.0 and analysis software is ANSYS 14.0 software packages
Keywords : Pressure hulls, steel, Static analysis, dynamic analysis.
I. INTRODUCTION
A light hull (casing in British usage) of a submarine is
the outer non-watertight hull which provides a
hydrodynamic ally efficient shape. The pressure hull is
the inner hull of a submarine; this holds the difference
between outside and inside pressure.
SUBMARINE HULL
Type XXI U-Boat, late WWII, with pressure hull almost
fully enclosed inside the light hull Modern submarines is
usually cigar-shaped. This design, already visible on
very early submarines is called a "teardrop hull", and
was patterned after the bodies of whales. It significantly
reduces the hydrodynamic drag on the sub when
submerged, but decreases the sea-keeping capabilities
and increases the drag while surfaced.
TYPES
All small modern submarines and submersibles, as well
as the oldest ones, have a single hull. However, for large
submarines, the approaches have separated. All Soviet
heavy submarines are built with a double hull structure,
but American submarines usually are single-hulled.
They still have light hull sections in bow and stern,
which house main ballast tanks and provide hydro
dynamically optimized shape, but the main, usually
cylindrical, hull section has only a single plating layer.

International Journal of Scientific Research in Science and Technology (www.ijsrst.com)
168
LIGHT HULL
The double hull of a submarine is different from a ship's
double hull. The external hull, which actually forms the
shape of submarine, is called the outer hull, casing or
light hull. This term is especially appropriate for Russian
submarine construction, where the light hull is usually
made of steel that is only 2 to 4 millimetres thick, as it
has the same pressure on both sides. The light hull can
be used to mount equipment, which if attached directly
to the pressure hull could cause unnecessary stress.
PRESSURE HULL
Inside the outer hull there is a strong hull, or pressure
hull, which actually withstands the outside pressure and
has normal atmospheric pressure inside. The pressure
hull is generally constructed of thick high-strength steel
with a complex structure and high strength reserve, and
is separated with watertight bulkheads into several
compartments. The pressure and light hulls aren't
separated, and form a three-dimensional structure with
increased strength. The interhull space is used for some
of the equipment which doesn't require constant pressure
to operate. The list significantly differs between
submarines, and generally includes different water/air
tanks. Incase of a single-hull submarine, the light hull
and the pressure hull are the same.
II. METHODS AND MATERIAL
A. Specification of the Problem
The objective of the present work is to design and
analyses, of steel pressure hull including Navigation
compartment shell; Battery compartment shell which is
connected with bolts is designed. These shells are to be
dissembled very frequently for battery charging and
other maintenance purpose. It is observed that the
dissembling and assembling process is a very time
consuming because it requires unbolting and bolting of
all the 16 bolts every time. A new design of pressure
hull is proposed where the bolts are removed and the
navigation compartment and battery compartment are
welded. Pressure hull is a created in Pro-E 5.0. Model is
imported in ANSYS 14.0 for analysis by applying
normal load and dynamic load conditions. After analyis
a comparison is made between exisisting in terms of
deflections and stresses, to choose the best one.
B. Structural Analysis of Pressure Hull
Dimensions of the structural and dynamic analysis the
design of pressure hull without bolts and pressure hull
with bolts. Pressure hull consists of 5 layers (thickness
of each layer, 0.6mm). Diameter of the pressure hull is
125mm. Since the properties of pressure hull vary with
directions of a 3-D model of pressure hull is used for
analysis in ANSYS 14.0. The loading conditions are
assumed to be static and dynamic. The element choosen
is SHELL LINEAR LAYER 99, which is a layered
version of the 8-node structural shell model. The
element has six degrees of freedom at each node:
translations in the nodal x, y, and z directions and
rotations about the nodal x, y, and z-axes. The finite
element analysis is carried out on pressure hull with
bolts as well as pressure hull without bolts .From the
analysis the equivalent stress (Von-mises stress) and
displacements were determined and are shown in figure
2-15. Table 2 - 4 shows the Comparative structural and
dynamic analysis of a pressure hull with bolts and
without bolts.
C. Specifications of Existing Pressure Hull
Table 1 shows the specifications of a steel pressure hull
of alister 3000. The typical chemical composition of the
material is 0.565C, 1.8% Si, 0.7%Mn, 0.045%P and
0.045% S.
Sr.no parameters value
1 Total length of pressure
hull(Eye to Eye)
245mm
2 Diameter of pressure Hull 125 mm
3 Thickness of pressure Hull 3 mm
4 Applying the pressure 6.326 N/mm2
5 Young’s modulus of steel 2.1e5 N/mm2
6 Density of pressure Hull 7860 kg/m3
7 Yield strength 500 N/mm2
8 Tensile strenth 620 N/mm2
9 Passion ratio 0.3

International Journal of Scientific Research in Science and Technology (www.ijsrst.com)
169
D. Structural and Dynamic Analysis of Pressure
Hull
A. Pressure Hull with Bolts
Figure 2. Analysis of pressure hulls without bolts
1. Structural Analysis
Figure 3. stress distribution for pressure hulls
Figure 4. Displacement pattern for pressure hulls
2. Dynamic Analysis : 10 Secs
Figure 5. Stress distribution for pressure hulls
Figure 6. Displacement pattern for pressure hulls
3. Dynamic Analysis : 20 Secs
Figure 7. Stress distribution for pressure hulls
Figure 8. Displacement pattern for pressure hulls

International Journal of Scientific Research in Science and Technology (www.ijsrst.com)
170
B. Pressure Hull with Out Bolts
Figure 9. Analysis of pressure hulls without bolts
1. Structural Analysis
Figure 10. Stress distribution for pressure hulls
Figure 11. Displacement pattern for pressure hull
2. Dynamic Analysis : 10 Secs
Figure 12. Stress distribution for pressure hulls
Figure 13. Displacement pattern for pressure hulls
3. Dynamic Analysis : 20 Secs
Figure 14. Stress distribution for pressure hulls
Figure 15. Displacement pattern for pressure hulls
III. RESULT AND DISCUSSION
A. Structural Analysis Results
Table 2 : Comparative structural analysis of a pressure
hull with bolts and without bolts

International Journal of Scientific Research in Science and Technology (www.ijsrst.com)
171
Sr. No PH Stress
(N/mm2)
Displacement
mm
Strain
1 WB 288.579 1.029 0.001861
2 WOB 7.341 0.000657 0.000046
Notes: 1. PH = pressure hull
2. WB = with bolts
3. WOB = without bolts.
1. Dynamic Analysis Results
Table 3 : Comparative dynamic analysis of a pressure
hull with bolts and without bolts.
Sr. No parameters Time PHWB PHWOB
1 STRESS
(N/mm2)
10 sec 288.97 7.341
20 sec 578.289 14.684
30 sec 867.749 22.06
2 Displacement
(mm)
10 sec 1.031 0.000899
20 sec 2.065 0.001798
30 sec 3.099 0.002697
3 Strain 10 sec 0.001863 0.000046
20 sec 0.003729 0.000094
4 STRESS
(N/mm2)
10 sec 288.97 7.341
30 sec 0.005595 0.000141
Notes: 1. PHWB = pressure hull with bolts,
2. PHWOB = pressure hull without bolts.
2. Modal Analysis Results
Table 4 : Comparative modal analysis of a pressure hull
with bolts and without bolts
Sr.No PH with bolts PH Without bolts
Displace
ment
(mm)
Frequenc
y (Hz)
Displacem
ent (mm)
Frequency
(Hz)
1 1.0029 0 0.218416 0
2 0.32194 21.646 0.19668 0
3 0.23168 25.742 0.10598 0.000007
4 0.276541 26.2929 0.228769 0.0000081
Notes: 1. PHWB = pressure hull with bolts,
2. PHWOB = pressure hull without bolts
B. Graphs
Pressure Hull with bolts and without bolts for
dynamic analysis
Figure 16. Time – Displacement curves for PHWB
AND PHWOB
Figure 17. Time – Displacement curves for PHWB
AND PHWOB
Notes: 1. PHWB = pressure hull with bolts,
2. PH WOB = pressure hull without bolts,
3. Series 1 = PHWB curve
4. Series 2 = PHWOB curve
IV. CONCLUSION
To observer the all results and to compare the pressure
hull with bolts and without bolts with respect to weight,
stiffness and strength.
By employing the pressure hull without bolts for the
same load carrying capacity, there is reduction in are
32%- 41% higher than pressure hull with bolts and 52%-
63% stiffer than pressure hull with bolt.
Present used material for pressure hull with bolts is
Stainless steel. I have considered pressure hull with bolts

International Journal of Scientific Research in Science and Technology (www.ijsrst.com)
172
and pressure hull without bolts. Based on the results, it
was inferred that pressure hull without bolts has superior
strength and stiffness and lesser in weight compared to
pressure hull with bolts.
From the results, it is observed that the pressure hull
without bolts is lighter and more economical than the
conventional pressure hull with bolts with similar design
specifications
V. REFERENCES
[1] Tsybenko A.S., Kuranov B.A., Chepurnoi A.D.,
Krishchuk N.G. &Shtefan E.V., State of Stress
and Strain of Pressure Vessel during
Pressurization, Plenum Publishing
Corporation(1989).
[2] Liang C.C., Optimum Design of Filament-wound
Multilayer- sandwich Submersible Pressure Hulls,
Pergamon Ocean Engineering,30 (2003) 1941-
1967.
[3] Ross C.T.F., A Conceptual Design of an
Underwater Vehicle, Elsevier Ocean Engineering,
33 (2006) 2087-2104.
[4] Ross, C.T.F., A Conceptual Design of an
Underwater Missile Launcher, Elsevier Ocean
Engineering, 32 (2005) 85-99.
[5] Ross C.T.F. & Etheridge J., The Buckling and
Vibration of Tube-stiffened Axisymmetric Shells
under External Hydrostatic Pressure, Pergamon
Ocean Engineering, 27 (2000) 1373-1390.
[6] Ross C.T.F., Little A.P.F. &Adeniyi K.A., Plastic
Buckling of Ring-stiffened Conical Shell under
External Hydrostatic Pressure, Elsevier Ocean
Engineering, 32 (2003) 21-36.
[7] Ross C.T.F., Little A.P.F. & Leonidas Chasapides,
Jeff banks, and Daniele Attanasio, Buckling of
Ring Stiffened Domes under External Hydrostatic
Pressure: Science Direct Ocean Engineering, 31
(2002) 239-252.
[8] Ross C.T.F. & Little A.P.F., The Buckling of a
corrugated Carbon Fiber Cylinder under External
Hydrostatic Pressure, Elsevier Ocean Engineering,
28 (2001) 1247-1264.
[9] Blachut J. & Smith P., Buckling of multi-segment
underwater pressure hull, Elsevier Ocean
Engineering, 35 (2007) 247-260.
[10] Derek Graham, Predicting the collapse of
externally pressurized ring-stiffened cylinders
using finite element analysis, Elsevier Marine
Structures, 20 (2007) 202-217.

IJSRST162441 | Received: 27 July 2016 | Accepted: 03 August 2016 | July-August-2016 [(2)4: 173-179]
© 2016 IJSRST | Volume 2 | Issue 4 | Print ISSN: 2395-6011 | Online ISSN: 2395-602X Themed Section: Science and Technology
173
Responsiveness of Unemployment to Inflation: Empirical
Evidence from Nigeria I. G. Okafor, Ezeaku Hillary Chijindu, Ugwuegbe S. Ugochukwu
Department of Banking and Finance, Caritas University, Enugu, Nigeria
ABSTRACT
The debate on the link between inflation and unemployment cuts across various economic interests. Researchers and
economists pick on the subject since unemployment remains one of the greatest challenges facing the developing
and emerging economies of the world. Other things being equal, achieving price stability is widely acknowledged to
have positive effect on unemployment and growth especially if the ideal threshold can be marked. However, finding
the perfect trade-off seems quite elusive and Central Banks across the globe contend to achieve high level of
employment without sacrificing price level stability. Hence in this study we attempt to determine the response of
unemployment to variation in price level in Nigeria using annualized data from 1989 to 2014.The error correction
Model (ECM) and the Johansen analytical tools were employed to process the data set. The results of the findings
show that inflation impact negatively on unemployment while money supply and exchange rate were found to have
positive influence on unemployment. Although unemployment and inflation have long-run association, there is
divergence along the equilibrium part which is corrected at 65 percent speed of adjustment each year. We
recommend rather than relying solely on monetary targeting as means balance between unemployment and inflation
level, output targeting through economic deepening can play a supporting role in maintaining optimal inflation rate
and minimal unemployment level.
Keywords: Inflation, Unemployment, Phillips Curve, Error Correction Model.
I. INTRODUCTION
Price stability remains the central objectives of Central
Bank monetary policy. To achieve this very objective,
the Central Bank employs forecasts of inflation. These
forecasts are useful to policymakers as they help to
determine the appropriate stance of monetary policy;
either expansionary or contractionary stance. Doh
(2011) writes that slack in economic activities is one of
the most commonly used short-term predictors for
inflation. Economic slack reflects the underutilization of
resources (such as labour and capital) in the economy.
Economists use the Phillips curve to describe the short-
term relationship between slow-moving economy and
inflation. Using unemployment as an indicator of
economic slack, the Phillips curve describes the cyclical
components of the unemployment rate and inflation. The
Phillips curve demonstrates that an increase in the
cyclical component of the unemployment rate
predictably exerts downward pressure on the cyclical
component of inflation (Doh, 2011).
Unemployment has become a global problem, and poses
serious challenge to both developed and developing
countries. The proportion of the active population that is
out of employment has grown to alarming rate and both
fiscal and monetary policy strategies have struggled to
plug this disturbing reality. Unemployment is a
condition where the active population of a country who
are willing and able to work stay out of job because
there is no opportunity for them to work. Economists
have for some time held the assumption that there is a
trade-off between unemployment and inflation, which
would be of great interest to policymakers. It then can be

International Journal of Scientific Research in Science and Technology (www.ijsrst.com)
174
inferred that lower unemployment could be achieved by
bearing a higher rate of inflation. But then, as regards
the long-run, that perception is no longer widely held.
While it is a desirable policy goal to keep
unemployment at a minimal level, some economists
argue that full employment is a situation where everyone
who wants a job automatically gets employed. However,
some would contend that full employment is realized
when unemployment rate is the lowest and inflation rate
is at the same time stable; a situation economists refer to
as the natural rate of inflation. Determining the natural
rate of unemployment will no doubt be very useful to
policymakers. One of the characteristics of inflation is
that it tends to respond slowly to monetary policy
changes designed to control it. For instance, the effects
of expansionary monetary policy stance on inflation
might not be immediately evident. Similarly, sometimes
when rate of inflation is rather high, there is the
likelihood that it will respond slowly to contractionary
monetary policy strategies designed to reduce it. As a
result of such attribute, and given the fact that policy
measures aimed at curtailing inflation possibly will have
short-term economic costs, it is generally believed that it
would be a better option to keep inflation rate as low as
possible (Cashell, 2004).
Phillips (1958) graphically represented a remarkable
inverse relationship between the unemployment rate and
the rate of inflation. The Phillips curve demonstrated
that decreases in unemployment rate (or increase in
employment level) correlate with increase in the rate of
inflation. In other words, at a lower rate of inflation,
unemployment level will increase. While this link is
widely acknowledged to subsist in the short-run, it may
however not be applicable in the long-run when
inflationary policies are unlikely to decrease
unemployment. Samuelson and Solow (1960) adopted
the Phillips’ hypothesis in their empirical study on the
unemployment-inflation connection in U.S. They made
explicit the fact that there is inverse relationship between
unemployment level and that rate of inflation. They state
that when unemployment was high, inflation was low,
and vice versa. In essences, it was adduced that pursuing
monetary or fiscal expansion, which might trigger
inflation, would effectively exchange for lower rate of
unemployment. In this case there is a trade-off, which
entails that it is difficult for governments to achieve full
high employment and at the same time maintain price
stability within the economy. While government deficit
spending stimulate the economy, increasing the gross
domestic product and lowering unemployment rate,
inflation rate would increase, which is the cost of
enjoying minimal unemployment. However, if such
policy measure is effectively executed, it could push
inflation rate to a level capable of undermining the
nation’s macroeconomic stability (Qin and Wang, 2013).
According to Cashell (2004), any indicator that helps
policymakers prevent higher Inflation rate in the first
place would be exceedingly useful An improvement
over the natural rate of unemployment concept is the
non-accelerating inflation rate of unemployment
(NAIRU). NAIRU is typically the level of
unemployment below which inflation rises. The
assumption is that while gradual increases in prices are
allowed, unemployment is tolerated and managed at a
certain level that would ensure stable rate of inflation
Figure 1. Phillips Curve
The figure above which illustrates the Phillips curve
explains that as the demand for labour increases,
unemployment rate decreases and workers might well
demand for wage increase. Conversely, when demand
for labour decreases, unemployment level increases and
workers are unlikely to have the opportunity to demand
for higher wages (Hussein, 2014). Wage and inflation
expectations could also have some effects on the
formation of the current wage as well as inflation. A
study by Zilli (2015) analyzed the ability of the Phillips
curve to explain the dynamics of Brazilian inflation,
utilizing aggregate data from 2002 to 2014. It was
discovered that the expected inflation had greater impact
on the formation of the current inflation than the past
inflation; a confirmation of the theory of rational
expectation.

International Journal of Scientific Research in Science and Technology (www.ijsrst.com)
175
II. METHODS AND MATERIAL
A. Empirical Review
The link between unemployment and inflation has long
been attracting attention not only from labour
economists but from analysts and researchers. We will
explore related works on this subject in other to embrace
dynamic nature of the two variables in different
economies of the world. For instance, on the South
African economy, Vermeulen (2015) applied the Engle-
Granger Error-Correction approach as he investigated
the effect of inflation on employment in South Africa.
The main objective of the study was to the sole aim of
find out whether higher inflation could lead to
employment creation. The findings reveal that a positive
long run relationship between employment and output,
which supports the claim that anything that negatively
effects output (such as high inflation), will by extension
impair employment creation. In the short-run, it was
found that the relationship between inflation and
employment creation was not significant.
Qin and Wang (2013) argue that the Phillips curve is
ineffective in determining the causal relationship
between unemployment and inflation in China. This was
revealed in the empirical study which investigated the
correlation of coefficient and causal link between
unemployment and inflation rate in China between 1978
and 2011. It was stresses that the non-applicability of the
Phillips curve on the communist state was as a result of
the complexity of the Chinese economy.
Similarly, the findings of Umoru and Anyiwe (2013)
opposed the Phillips curve position on inflation-
unemployment relation. The study assessed the
dynamics of inflation and unemployment in Nigeria over
a twenty seven years period, using the Vector Error
Correction Technique. Evidence of stagflation was
found in the Nigerian economy within the period
covered by the study. But Nitzan (1990) in his paper,
macroeconomic perspective of unemployment and
inflation stresses that though some factors like
stagflation may have posed serious challenge to the
Phillps curve, such contention only modifies and do not
nullify the hypotheses. He stated that in inverse relation
between inflation and unemployment is too significant
to be discarded hence auxiliary factor may come in
simply to augment.
In contrast to the inverse relation represented in the
Phillips curve, it was revealed a positive relationship
between inflation and unemployment in Nigeria thereby
invalidating the Phillips curve on the case of Nigeria.
However, the outcome of the study conducted by Mirza
and Mujahid (2015) on Pakistani economy supports the
Phillips Curve postulation by disclosing the existence of
indirect relationship between unemployment rate and
inflation rate in Pakistan within the period 1973 and
2014.
Using the Johansen cointegration test and the Granger
causality test, Hussein (2014) investigated a trade-off
relationship exists between unemployment and inflation
in the Jordan between 1984 and 2011. The result showed
there was no causal relationship between inflation rate
and unemployment in Jordan within the period covered
by the study, indicating that no trade-off relationship
existed between the two variables.
Gur (2015) used panel data analysis in examining the
factors that affect unemployment in the BRIC countries
(Brazil, Russia, India and China) from 2001 to 2012.
The results indicated that inflation and population
growth are the causes of rising unemployment among
the BRIC countries, whereas growth in GDP and
industrial product growth are among the factors that lead
to reduction in unemployment level.
Thayaparan (2014) contends that for the case of Sri
Lanka, only inflation has a significant effect in reducing
unemployment while the gross domestic product exerts
positive but non-significant positively influences on
unemployment. The study which examined the effect of
inflation and economic growth on unemployment in Sri
Lanka within the period 1990 and 2012 also established
a unidirectional causality between inflation and
unemployment, and bidirectional causal relationships
between unemployment and gross domestic product; and
between inflation and gross domestic product in Sri
Lanka.
Orji, Orji and Okafor (2015) examined the inflation and
unemployment connection in Nigeria with the aim of
finding out if the original Phillips curve proposition
International Journal of Scientific Research in Science and Technology (www.ijsrst.com)
176
holds for Nigeria. The result revealed that
unemployment is a major determinant of inflation and
that there is a positive relationship between inflation and
unemployment rate in Nigeria. This is in line with the
findings of Umoru and Anyiwe (2013) which
invalidated the Phillips curve hypothesis in Nigeria. On
the contrary, Resurreccion (2014) evaluated the linkage
between unemployment, inflation and economic growth
in Phillipines for the period 1980 to 2009. It was shown
that unemployment has indirect relationship with
inflation and economic growth. The finding confirms
Okun’s Law and Philips Curve in the Philippines.
Similarly, Furuoka and Munir (2014) argue that the
Phillips curve hypothesis holds in the Malaysian
economy. In the study, the Error Correction model
(ECM) to analyse the relation between unemployment
and inflation in Malaysia. The results indicate there is
long-run equilibrium relationship between the two
variables, and also found an inverse relationship
between unemployment and inflation in Malaysia
thereby supporting the validity of the original
proposition of the Phillips curve.
Umaru, Donga and Musa (2013) employed the Johansen
cointegration and the Granger causality test to
investigate the effect of unemployment and inflation on
economic growth in Nigeria from 1986 to 2010. The
results of Causality suggest that unemployment and
inflation are causal for real GDP and not real GDP is not
causal for unemployment and inflation. In other words it
is a one-way causality running from unemployment and
inflation to real GDP. The Johansen cointegration tests
confirm the existence of long run relationship between
economic growth, unemployment and inflation. The
results also showed that unemployment and inflation
exert a positive impact on economic growth.
Aurangzeb and Asif (2013) examined the
macroeconomic determinants of the unemployment for
India, China and Pakistan for the period 1980 to 2009,
using the Johansen cointegration, Granger causality test
and regression analysis. The result of granger causality
indicates that bidirectional causality does not exist
between unemployment, inflation and economic growth
for all three countries. Cointegration result revealed that
long term relationship does exist among the three
variables for all the models.
Kogid, et al (2013) examined the trade-off relationship
between unemployment and inflation in Malaysia using
ARDL bounds testing to cointegration, ECM based
ARDL and Toda-Yamamoto techniques for the period of
1975-2007 in Malaysia. The study showed the existence
of the long-run relationship between inflation and
unemployment, and revealed unidirectional causal
relationship running from inflation to unemployment,
which points to the fact that inflation influenced
unemployment. This study eventually found that there is
inflation-unemployment trade-off relationship in
Malaysia.
Umaru and Zubairu (2012) investigated the relationship
between unemployment and inflation in the Nigerian
economy within the period 1977 and 2009. The results
indicate that inflation has negative impact on
unemployment. The Granger causality test revealed that
there is no causal link between unemployment and
inflation in Nigeria during the period of study. Johansen
cointegration test showed that a long-run relationship
exists between the two variables.
B. Data and Methodology
Research design for this study is ex post-facto which
entails that the event we are studying indeed taken place
already. We are therefore using secondary data sourced
from World Bank National account data files and the
OECD National accounts data files. Variables of interest
include the unemployment rate, inflation rate, money
stock and exchange rate. This study covers the period
1960 to 2014. Because our study period is long-term and
we are using time series data, there is therefore the need
to ensure that our data is stationary before we subject
them to higher econometric estimations. This measure
will ensure that in the end our result will not be spurious
hence reliable. The Augmented Dickey-Fuller (ADF)
unit root test will be used to ascertain if our variables are
stationary or not. Further techniques of analysis
employed to evaluate the linkage between
unemployment and inflation are the Johansen co-
integration test, Error Correction Model (ECM).
Model Specification
This study is patterned after Furuoka and Munir (2014)
which examine inflation-unemployment relation in

International Journal of Scientific Research in Science and Technology (www.ijsrst.com)
177
Malaysia. The model adopted by the authors is of the
form:
Where α0 = constant, γ1 = slope coefficient, IFRt =inflation
rate in the year t, UERt = unemployment rate in the year t,
and εtis the errorterm. We modified the above model to arrive
at our baseline equation, which accommodates our peculiar
variables. We represent our distinct model thus:
Where UER = unemployment rate, INFL = inflation,
constant, parameter estimates, MS = broad money
stock relative to GDP, EXR = exchange rate, and = error
term.
There are three stages to our estimation. First we test our
variables for stationarity using the Phillip-Perron unit root test.
Time-series data is stationary if its mean and variance are
constant over time (Gujarati, 2003). The Phillip-Perron is
based on the following model:
∑
wheret = linear time trend, μ = constant, Δ = differencing
operator, and εtis the error term. If the variables are stationary
or integrated at order zero, 1(0), we can employ the Ordinary
least square (OLS). However, if our variables are integrated of
order one, 1(1), we will have the justification to run the
Johansen co-integration test.
This second stage enables us find out if long run relationship
exist among the variables. If at this point our variables are co-
integrated, we then move on to the third stage where we the
run the Error Correction model (ECM) by modifying our
baseline equation thus:
∑
∑ ∑
∑
Where ECTt-t = lagged value of the error correction term.
III. RESULT AND DISCUSSION
Figure 2. Graphical representations of proxied variables
Table 1. Descriptive Statistics
Source : Authors
Table 2. Unit root test at level
Source: Authors Eviews result
The result of the unit test as presented in the table 4.1 above
shows that all the variables included in the model are all not
stationary at level. This however will take us to the next step
in ADF approach which requires differencing of the variables
to see if it will be stationary at first difference.
Table 3. Unit root test at first difference
Source: Authors Eviews result
Table 4.2 presents the results of unit root test at first
differencewhich indicates that all the variables are stationary
at 5% level of significance. The stationarities so attained are
all at order one, 1(1), and are therefore integrated at same
order. This result now allows us to run the Johansen
coinegration test to establish if the variables move along
together in the long-run.
TEST FOR LONG-RUN ASSOCIATION
Johansen Cointegration Test
Table 4 : Result of Johansen Co-Integration Analysis
Hypothesized
No. of CE(s) Eigenvalue
Trace
Statistic
5%
Critical
Value
Prob.**
None * 0.704655 66.86688 47.85613 0.0003
At most 1 * 0.541628 33.93735 29.79707 0.0158
At most 2 0.333186 12.87535 15.49471 0.1195
At most 3 0.069116 1.933746 3.841466 0.1643
Source: Authors’Eview Result
0
100
200
300
19
86
19
89
19
92
19
95
19
98
20
01
20
04
20
07
20
10
20
13
EXR
MS
UER
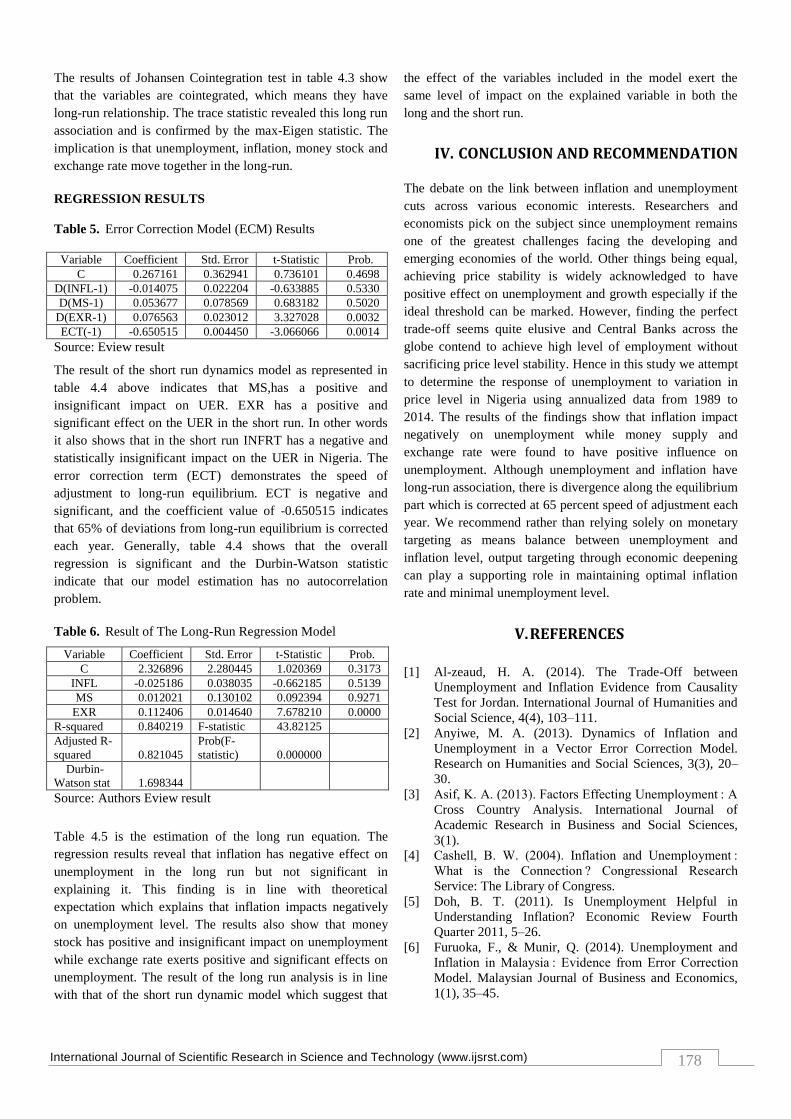
International Journal of Scientific Research in Science and Technology (www.ijsrst.com)
178
The results of Johansen Cointegration test in table 4.3 show
that the variables are cointegrated, which means they have
long-run relationship. The trace statistic revealed this long run
association and is confirmed by the max-Eigen statistic. The
implication is that unemployment, inflation, money stock and
exchange rate move together in the long-run.
REGRESSION RESULTS
Table 5. Error Correction Model (ECM) Results
Variable Coefficient Std. Error t-Statistic Prob.
C 0.267161 0.362941 0.736101 0.4698
D(INFL-1) -0.014075 0.022204 -0.633885 0.5330
D(MS-1) 0.053677 0.078569 0.683182 0.5020
D(EXR-1) 0.076563 0.023012 3.327028 0.0032
ECT(-1) -0.650515 0.004450 -3.066066 0.0014
Source: Eview result
The result of the short run dynamics model as represented in
table 4.4 above indicates that MS,has a positive and
insignificant impact on UER. EXR has a positive and
significant effect on the UER in the short run. In other words
it also shows that in the short run INFRT has a negative and
statistically insignificant impact on the UER in Nigeria. The
error correction term (ECT) demonstrates the speed of
adjustment to long-run equilibrium. ECT is negative and
significant, and the coefficient value of -0.650515 indicates
that 65% of deviations from long-run equilibrium is corrected
each year. Generally, table 4.4 shows that the overall
regression is significant and the Durbin-Watson statistic
indicate that our model estimation has no autocorrelation
problem.
Table 6. Result of The Long-Run Regression Model
Variable Coefficient Std. Error t-Statistic Prob.
C 2.326896 2.280445 1.020369 0.3173
INFL -0.025186 0.038035 -0.662185 0.5139
MS 0.012021 0.130102 0.092394 0.9271
EXR 0.112406 0.014640 7.678210 0.0000
R-squared 0.840219 F-statistic 43.82125
Adjusted R-
squared 0.821045
Prob(F-
statistic) 0.000000
Durbin-
Watson stat 1.698344
Source: Authors Eview result
Table 4.5 is the estimation of the long run equation. The
regression results reveal that inflation has negative effect on
unemployment in the long run but not significant in
explaining it. This finding is in line with theoretical
expectation which explains that inflation impacts negatively
on unemployment level. The results also show that money
stock has positive and insignificant impact on unemployment
while exchange rate exerts positive and significant effects on
unemployment. The result of the long run analysis is in line
with that of the short run dynamic model which suggest that
the effect of the variables included in the model exert the
same level of impact on the explained variable in both the
long and the short run.
IV. CONCLUSION AND RECOMMENDATION
The debate on the link between inflation and unemployment
cuts across various economic interests. Researchers and
economists pick on the subject since unemployment remains
one of the greatest challenges facing the developing and
emerging economies of the world. Other things being equal,
achieving price stability is widely acknowledged to have
positive effect on unemployment and growth especially if the
ideal threshold can be marked. However, finding the perfect
trade-off seems quite elusive and Central Banks across the
globe contend to achieve high level of employment without
sacrificing price level stability. Hence in this study we attempt
to determine the response of unemployment to variation in
price level in Nigeria using annualized data from 1989 to
2014. The results of the findings show that inflation impact
negatively on unemployment while money supply and
exchange rate were found to have positive influence on
unemployment. Although unemployment and inflation have
long-run association, there is divergence along the equilibrium
part which is corrected at 65 percent speed of adjustment each
year. We recommend rather than relying solely on monetary
targeting as means balance between unemployment and
inflation level, output targeting through economic deepening
can play a supporting role in maintaining optimal inflation
rate and minimal unemployment level.
V. REFERENCES
[1] Al-zeaud, H. A. (2014). The Trade-Off between
Unemployment and Inflation Evidence from Causality
Test for Jordan. International Journal of Humanities and
Social Science, 4(4), 103–111.
[2] Anyiwe, M. A. (2013). Dynamics of Inflation and
Unemployment in a Vector Error Correction Model.
Research on Humanities and Social Sciences, 3(3), 20–
30.
[3] Asif, K. A. (2013). Factors Effecting Unemployment : A
Cross Country Analysis. International Journal of
Academic Research in Business and Social Sciences,
3(1).
[4] Cashell, B. W. (2004). Inflation and Unemployment :
What is the Connection ? Congressional Research
Service: The Library of Congress.
[5] Doh, B. T. (2011). Is Unemployment Helpful in
Understanding Inflation? Economic Review Fourth
Quarter 2011, 5–26.
[6] Furuoka, F., & Munir, Q. (2014). Unemployment and
Inflation in Malaysia : Evidence from Error Correction
Model. Malaysian Journal of Business and Economics,
1(1), 35–45.

International Journal of Scientific Research in Science and Technology (www.ijsrst.com)
179
[7] Gur, B. (2015). An Analysis of Unemployment
Determinants in BRIC Countries Department of
Economics. International Journal of Business and Social
Science International Journal of Business and Social
Science, 6(1), 192–198.
[8] Kinabalu, K., & Lily, J. (2013). Inflation-
Unemployment Trade-Off Relationship In Malaysia.
Asian Journal of Business and Management
Sciences,1(1), 100–108.
[9] Mirza, M. H., & Amjad, N. (2015). The Impact of
Inflation on Unemployment to the Extent of. Developing
Country Studies, 5(12), 46–52.
[10] Nitzan, J. (1990). Macroeconomic Perspectives On
Inflation And Unemployment. Department of
Economics Discussion Paper.
[11] Orji, A., & Joan, O. I. A. (2015). Inflation And
Unemployment Nexus In Nigeria : Another Test Of The
Phillip ’ S Curve Contribution / Originality. Asian
Economic and Financial Review 5(5):766-778, 5(5),
766–778.
http://doi.org/10.18488/journal.aefr/2015.5.5/102.5.766.
778
[12] Ponzoni, G. A., & Zilli, J. B. (2016). Unemployment and
Inflation : An Estimated Phillips Curve for Brazil (
2002-2014). Journal of Finance and Economics, 3(5),77-
85.
[13] Qianyi, W. (2013). The research on inflation rate and
unemployment rate in china. Proceeding of the
International Conference on Social Science Research,
ICSSR 2013 (e-ISBN 978-967-11768-1-8). 4-5 June
2013, Penang, MALAYSIA. Organized by
WorldConferences.net 202, (June 2013), 202–220.
[14] Resurreccion, P. F. (2014). Linking Unemployment To
Inflation and Economic Growth : Toward a Better
Understanding of Unemployment In The Phillipines.
Asian Journal of Economic Modelling, 2(4), 156–168.
[15] Thayaparan, A. (2014). Impact of Inflation and
Economic Growth on. Global Journal of Management
and Business Research: B Economics and Commerce,
13(5).
[16] Umaru, A. (2013). An Empirical Investigation into the
Effect of Unemployment and Inflation on Economic
Growth in Nigeria. Nterdisciplinary Journal of Research
in Business, 2, 1–14.
[17] Umaru, A. A. A. Z. (2012). Empirical Analysis of the
Relationship between Unemployment and Inflation in
Nigeria from 1977-2009. Economics and Finance
Review, 1(12), 42–61.
[18] Vermeulen, C. (2015). Inflation , growth and
employment in South Africa : Trends and trade-offs.
ERSA Working Paper 547, (September).

IJSRST162437 | Received : 28 July 2016 | Accepted : 03 August 2016 | July-August 2016 [(2)4: 180-187]
© 2016 IJSRST | Volume 2 | Issue 4 | Print ISSN: 2395-6011 | Online ISSN: 2395-602X Themed Section: Science and Technology
180
Querying Unintelligible Data on Geospatial Trajectory Database
Dr. K. Sathesh Kumar1, Dr. S. Ramkumar
1
1Assistant Professor, Department of Computer Science and Information Technology, Kalasalingam University, Krishnankoil, Virudhunagar,
Tamil Nadu, India 1Assistant Professor, Department of Computer Applications, Kalasalingam University, Krishnankoil, Virudhunagar, Tamil Nadu, India
ABSTRACT
Current GPS technologies collect objects and its movement and store the trajectories periodically in the MOD
(Moving Object Database). In such environment, some location errors may arise and some models are unable to
capture the changes in trajectories dynamically. Especially, the uncertainty capturing is a challenging one. In order
to handle these issues in spatial database, the proposed system develops a new trajectory model to handle the
uncertainty and querying on uncertain spatial queries. Initially this develops an adaptable trajectory approach to
provide actual positions and temporal changes in uncertainty along with improbable uncertainty ranges. The next
part of ongoing implementation provides effective spatial query processing with successful indexing process. This
presents the temporal R+ tree indexing with inverted list. This provides an efficient mechanism to evaluate
improbable range objects and its spatial queries using Rife-density trajectories.
Keywords: RFID sensors, R+Tree, GSM, Trajectory Model, Road Network, Dynamic Route Map.
I. INTRODUCTION
The spatial database is defines special data types for
geometric objects and allows to store geometric data
(usually of a geographic nature) in regular database
tables. It provides special functions and indexes for
querying and manipulating that data using something
like Structured Query Language (SQL). While it is often
used as just a storage container for spatial data, it can do
much more than that. Although a spatial database need
not be relational in nature, most of the well-known ones
are [1]. Uncertainty management is a central issue in
trajectory databases. The research interests, optimization
goals, and methodologies in this domain are indeed rich
and diverse. Despite this diversity, these studies are
generally established upon a common principle location
uncertainty is captured by a certain range centered on
the position recorded in the database. This principle was
initially discussed by Poser and Jensen in the database
literature, which is longer than a decade ago [2]. As of
today, GPS is no longer the only primary means for
positioning, yet a wide spectrum of technologies are
being used to produce trajectory data, including RFID
sensors, location estimation with 802.11, smart-phone
sensors, infrared and ultrasonic systems, GSM beacons,
and even vision sensors. These positioning systems
typically yield different characteristics of trajectory data,
which also exhibit various properties as well as degrees
of uncertainty.
Uncertain Spatiotemporal Data: Query processing in
trajectory databases has received significant interest over
the last ten years. Initially, trajectories have been
assumed to be certain, by employing linear or more
complex types of interpolation to handle missing
measurements [12]. These interpolation techniques,
however can lead to impossible patterns of movement as,
for example, a car might be assumed to drive through a
lake. Other solutions such as computing the shortest path
between consecutive locations can produce valid results,
but do not provide probabilities for quantifying the result
quality. As a result, a variety of uncertainty models and
query evaluation techniques has been developed for
moving object trajectories [28].

International Journal of Scientific Research in Science and Technology (www.ijsrst.com)
181
A. Uncertain Trajectory Models
Uncertain Trajectory Models: There are two major
reasons why uncertainty occurs in trajectory data. One is
known as measurement error which is caused by limited
accuracy of positioning technology, e.g., GPS error. The
other is sampling error that originates from discrete
sampling of continuous movements of an object, the
locations of the object between two sampled positions
are unknown [8]. To deal with these uncertainty factors
in trajectory data management, a rich body of studies
have proposed various uncertainty models. These
models commonly represent a trajectory using a
sequence of uncertainty areas, so called uncertain
trajectory. Each of the uncertainty areas captures the
measurement and sampling errors. The main aim of this
paper is to establish core foundations for uncertain
trajectory management, based on the new modelling
method. This requires a wide variety of re-innovations;
particularly we focus on three important problems [15].
That are, for time-dependent constrains problem, we
introducing a new uncertain trajectory model that
represents a trajectory using Pearson distributions,
capturing the dynamicity of location uncertainty without
any unrealistic assumption and facilitating efficient
query processing that infer time-varying densities of
location data. For a multivariate positional data, we
develop [27] effective methods for estimating time-
dependent probability distributions. And finally we used
an effective mechanism that indexes evolving-density
trajectories, and efficiently evaluates probabilistic range
queries using the indexes. As the uncertainty ranges of
evolving-density trajectories are unbounded, and vary
over time.
II. RELATED WORKS
In this section, we review existing works in the domains
related with the current works Brakatsoulas, et al [1]
present three novel algorithms that exploit the trajectory
nature of the tracking data, i.e., considering the entire
path of a vehicle as opposed to its current position. The
incremental map-matching algorithm employs a greedy
strategy of sequentially matching portions of the
trajectory to the road network.
Li, Xu, et al [2]. Work carried on vehicular ad hoc
networks (VANET) by using these vehicles if we
imagine that vehicles can communicate with each other.
The taxi companies, though, often set sensor with a long
sampling period, such as 1-2 minutes, which is very
diverse from ordinary sampling rate of GPS device, such
as 1Hz. This is because taxi companies want to reduce
communication cost of sending sensor data to the data
centre and are only interested in the general location of
their vehicles. On the other hand, sensors with a short
sampling interval would produce enormous data traffic,
resultant in potential network jamming. In our work, we
utilize 4000 taxis and 1000 buses equipped with GPS-
based mobile sensors. Currently, vehicular ad hoc
networks (VANET) have been paid much concentration.
Also, we utilize 4000 taxis and 1000 buses prepared
with GPS-based mobile sensors in Shanghai city, which
constitute GPS-based vehicular networks.
Kuijpers, et al [3] focus on the trajectories that are
produced by moving objects and on organizing and
querying them in a database. Hence, they think it is more
suitable to talk about trajectory databases, rather than to
refer to the moving objects that produce these
trajectories. It can review our outcome as follows: they
give a data model for trajectory data; an capable way of
modeling uncertainty; we study transformations for
which significant physical properties of trajectories are
invariant and we give first-order complete and
computationally complete query languages for queries
invariant under these transformations. They propose two
types of trajectory data. Firstly, we have trajectories,
which are curves in the real plane R2 that are rationally
parameterized by time (R denotes the set of real
numbers).
Liu, Hechen et al [4] study the moving objects has
aroused a lot of interest in many fields such as mobile
networking, transportation management, weather report
and forecasting, etc. Moving objects describe the
continuous evolution of spatial objects over time. The
feature that their locations change continuously with
time makes them more complicated than static spatial
objects in some aspects; one aspect refers to the
topological relationships. Hajari, Hadi, et al [5] present
OGC-based models consisting of relations for modeling
spatial networks and a number of User Defined Types
(UDTs) and operations for optimal storage,
representation, and querying of static and moving
features on the extensibility interface of Object-
Relational database systems. They address some

International Journal of Scientific Research in Science and Technology (www.ijsrst.com)
182
implementation issues of the proposed framework on top
of the OGC-compliant Oracle spatial data model.
Karthikeyani, V. [6], focus the moving object in the
spatial temporal concept, the method for acquire and in
place of the movements in which the positions of
moving objects are sampled at selected points in time.
The algorithmic discussion and equation describe object
movement focusing accurately. The trajectory based
queries are classified in „topological‟ queries, which
involve the whole information of the movement of an
object and „navigational‟ queries which involve derived
information. Trajcevski, Goce, et al [7], deal in a
systematic way with the issue of uncertainty of the
trajectory of a moving object. Uncertainty is an inherent
aspect in databases which store information about the
location of moving objects. They introduce a set of
novel but natural spatio-temporal operators which
capture uncertainty, and are used to express spatio-
temporal range queries. We also devise and analyze
algorithms to process the operators. The operators have
been implemented as a part of our DOMINO project.
III. METHODOLOGY
The goal of this research is to establish core foundations
for uncertain trajectory management, based on the new
modeling approach. This requires a wide variety of re-
innovations; particularly, this focuses on three important
problems and makes the following significant
contributions: Moving objects produces trajectories,
where Uncertainty those trajectories produce improper
results. This section describes a set of data model for
trajectories and trajectory samples. This provides an
efficient way of modeling uncertainty via network for
trajectory samples. This work introduces a new
uncertain trajectory model which is named as Rife
Density trajectory (RDT) model. The RDT model
evolves the popularity of the navigation, query and
other aspects of objects. So this can able to easily
handle the uncertainty in moving objects.
Contributions
The study proposes a new model for Uncertain
Trajectory named as Rife Density Trajectory (RDT)
representing the motion along with a road network,
and provides an incorporated density clustering for
the possible locations of a moving object at a given
time-instant.
This formulates both spatial and Continuous
Probabilistic Range Query whose semantics captures
the uncertainty model.
This also designs an effective indexing structure as
well as efficient processing algorithms for spatial
continuous range queries.
This also facilitates the Temporal R+-Tree technique
to evaluate the query much faster on uncertain
environment.
A. Rife Density Trajectory Model
Covering the pitfalls of the existing uncertain trajectory
models, this proposes a new model for capturing and
representing the uncertainty of trajectory, termed Rife-
density trajectory.
The first contribution of this paper is to introduce a new
uncertain trajectory model that represents a trajectory as
time-dependent Pearson distributions. In each such
distribution, skewness and kurtosis values are acquired
with the mean value to represent an actual location,
while the standard deviation reflects the degree of an
uncertainty range. This model can effectively capture the
dynamicity of location uncertainty without any
unrealistic assumption, while facilitating efficient query
processing. This also provides a flexible framework that
allows various approaches including domain-specific
models to precisely infer such evolving normal
distributions. In the consequence, this introduces a set of
key principles that establish the new uncertainty model,
and then describe the system framework that supports
the model.
Process of RD
The Valuable information like location and uncertain
event reports must be converted into raw trajectories for
decision making purpose. While scrutinizing the object
mobility and uncertainty, a good indication of behavior
is vector and motion. Here vector is the direction of the
movement and the motion is captured by trajectories
which indicate the spatio-temporal characteristics of
objects and encode behavior.
A key examination for uncertainty analysis on
trajectories is that typical actions are repetitive while the

International Journal of Scientific Research in Science and Technology (www.ijsrst.com)
183
unusual do not occur often. In this process the objects
and trajectories were stored in the dataset. From the
dataset the trajectory status can be monitored.
Actual Position
In order to reduce the noisy data there are several
filtering schemes are applied in literature. Such schemes
are Kalman filtering for GPS data, particle filtering for
RFID and Map matching for network constrained object
locations. These approaches provide means that can
infer more reliable positions where an object was
actually located by eliminating the noisy and redundant
data‟s. The Rife-density trajectory model supports such
an inferred location as an actual location of the object
and helps to predict the future move based on the vector,
which serves as the center point of an uncertainty range.
Pearson distribution
The approach develops object‟s location prediction
using Pearson distributions. The main objective of using
Pearson distribution is as follows
1. This is used to describe the distribution of the
sample mean, which is a collection of samples
from normal population‟s .To Describe the
distribution of the sample mean, which is the
collection of samples from a population that is
not normal.
The normal distribution of a statistic is a probability
distribution for all possible values of the statistic
computed from a sample of size n. Here the sampling
distribution of the sample mean is the probability
distribution of all possible values of the random variable,
which are computed from a sample of size n from a
population with mean and standard deviation.
The followings are the steps involved in the density
calculation function to handle uncertainty.
Steps:
Step 1: Obtain a random sample of size n.
Step 2: Compute the mean.
Step 3: Assuming that the sample from a finite
population, repeat Steps 1 and 2 until all simple
random samples of size n have been obtained.
Approximate the sampling distribution of the sample
mean by obtaining 200 simple random samples of size n
= 20 from the population of weights of pennies minted
after 1982 (=2.46 grams and =0.02 grams)
Figure 1. Probability distribution using Pearson
The mean of the 200 sample means for n=20 is still 2.46,
but the standard deviation is now 0.0045 (0.0086 for
n=5). As expected, there is less variability in the
distribution of the sample mean with n=20 than with n=5.
Suppose that a simple random sample of size n is drawn
from a large population with mean and standard
deviation.
Figure 2. Proposed density trajectory model
B. Spatial Query Processing
The dynamic nature of the spatial attribute makes
dynamic location based queries in Location Based
Searches unique and challenging. Spatial queries at
different locations will be more challenging in uncertain
trajectory management. As a result the spatial query

International Journal of Scientific Research in Science and Technology (www.ijsrst.com)
184
results differ for different locations based on the spatial
property. To efficiently compute location-based results
with the trajectory model there are several number of
algorithms used in literature. The proposed Rife Density
trajectory model along with KNN query helps to process
the spatial query processing.. These algorithms assume
that the query location is an exact location point. Spatial
query processing which takes a spatial range as the input
of user location and performs the dynamic clustering
algorithm to a point or a line in existing location based
systems. The distance and mobility based spatial queries
are more practical when compared with static skyline
environments.
Query Processor supports efficient processing of
probabilistic range queries on the Rife-density
trajectories managed in the system. Specifically the
processor implements the well-known filter-and-
refinement paradigm. At the filter step, both a temporal
R+-tree and a hash table are used to quickly prune those
trajectory records whose time or position attributes are
irrelevant to a given query condition. At the refinement
step, the query processor evaluates whether each
candidate resulted from the filtering step actually
satisfies the given query (probability) condition. This
process is performed by calling probability computation
functions that are built-on Pearson densities in a precise
manner.
Spatial probabilistic range queries are possibly the most
common query type on uncertain trajectories, as they
can effectively retrieve uncertain objects or trajectories
using solid mathematical foundations in probability
theory.Algorithm 1 presents the overall mechanism for
processing spatial range queries, consisting of the
filtering phase in Lines 1, 2 and 3and the ranking phase
in Lines 7–12.
The proposal introduces an efficient mechanism for
probabilistic range queries on Rife-density trajectory
databases. The framework first extends the definition of
probabilistic range queries on Rife -density trajectories.
Then it presents access methods to index Rife -density
trajectories, as well as an algorithm for assessing the
optimal queries based the indexes. Note that other
probabilistic query types (e.g., probabilistic nearest
neighbor queries) can also be evaluated over rife-density
trajectories using existing KNN query-processing
methods, as the uncertain trajectory model offers full
information in terms of probability distribution at each
position, which is sufficient for the probabilistic distance
measures used in previous works.
C. Indexing Method
The third contribution is to present an effective
mechanism that indexes evolving-rife density
trajectories, and efficiently evaluates probabilistic range
queries using the indexes. The proposal introduces a
Indexing method to address the query processing in
uncertain environment problem. To address this
problem, the study utilizes a temporal R+–tree as well
as a reverse key index and hash table for quickly
identifying a candidate set of uncertain trajectories, by
dynamically computing the rank for each point and
service. This helps to satisfy a given query condition.
This process does not affect by any uncertainty object
queries and results. The process does not a part of
information loss during probabilistic query processing.
SR Index
The spatial Reverse list (SR-index) is essentially a
compressed version of an I-index with embedded
coordinates. Query processing with an SR-index can be
done either by merging or together with R+-trees in a
distance searching method. In addition the compression
eliminates the defect of a conventional I-index such that
an SR-index consumes much less space. R+-Trees can
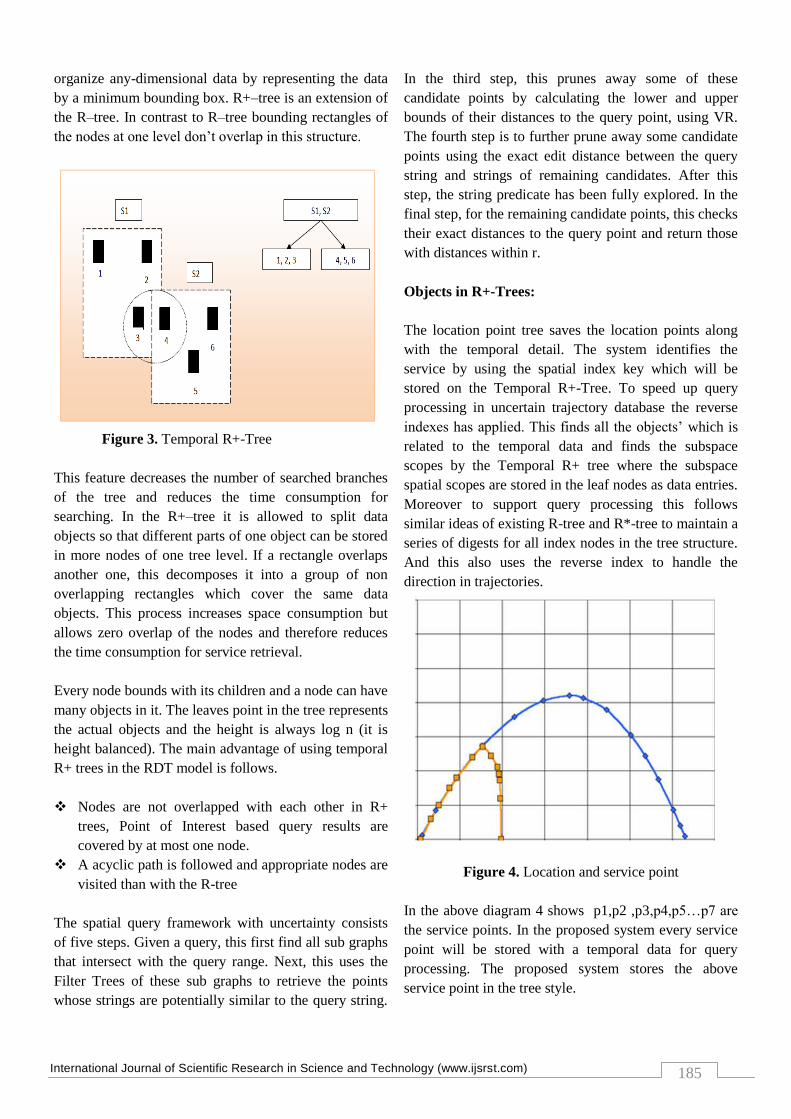
International Journal of Scientific Research in Science and Technology (www.ijsrst.com)
185
organize any-dimensional data by representing the data
by a minimum bounding box. R+–tree is an extension of
the R–tree. In contrast to R–tree bounding rectangles of
the nodes at one level don‟t overlap in this structure.
Figure 3. Temporal R+-Tree
This feature decreases the number of searched branches
of the tree and reduces the time consumption for
searching. In the R+–tree it is allowed to split data
objects so that different parts of one object can be stored
in more nodes of one tree level. If a rectangle overlaps
another one, this decomposes it into a group of non
overlapping rectangles which cover the same data
objects. This process increases space consumption but
allows zero overlap of the nodes and therefore reduces
the time consumption for service retrieval.
Every node bounds with its children and a node can have
many objects in it. The leaves point in the tree represents
the actual objects and the height is always log n (it is
height balanced). The main advantage of using temporal
R+ trees in the RDT model is follows.
Nodes are not overlapped with each other in R+
trees, Point of Interest based query results are
covered by at most one node.
A acyclic path is followed and appropriate nodes are
visited than with the R-tree
The spatial query framework with uncertainty consists
of five steps. Given a query, this first find all sub graphs
that intersect with the query range. Next, this uses the
Filter Trees of these sub graphs to retrieve the points
whose strings are potentially similar to the query string.
In the third step, this prunes away some of these
candidate points by calculating the lower and upper
bounds of their distances to the query point, using VR.
The fourth step is to further prune away some candidate
points using the exact edit distance between the query
string and strings of remaining candidates. After this
step, the string predicate has been fully explored. In the
final step, for the remaining candidate points, this checks
their exact distances to the query point and return those
with distances within r.
Objects in R+-Trees:
The location point tree saves the location points along
with the temporal detail. The system identifies the
service by using the spatial index key which will be
stored on the Temporal R+-Tree. To speed up query
processing in uncertain trajectory database the reverse
indexes has applied. This finds all the objects‟ which is
related to the temporal data and finds the subspace
scopes by the Temporal R+ tree where the subspace
spatial scopes are stored in the leaf nodes as data entries.
Moreover to support query processing this follows
similar ideas of existing R-tree and R*-tree to maintain a
series of digests for all index nodes in the tree structure.
And this also uses the reverse index to handle the
direction in trajectories.
Figure 4. Location and service point
In the above diagram 4 shows p1,p2 ,p3,p4,p5…p7 are
the service points. In the proposed system every service
point will be stored with a temporal data for query
processing. The proposed system stores the above
service point in the tree style.

International Journal of Scientific Research in Science and Technology (www.ijsrst.com)
186
Table 1. Location point and available services in the
location
Trajectory points Services (S)
P1 S1,S3
P2 S4,S6
P3 S5,S4
P4 S4,S7
P5 S2,S8
The above table 4.1 represents the location point and
available services in the location. The system can able
provide appropriate services for the query based on the
location point and temporal based service list. This helps
in two ways. One is the retrieval time has reduced. And
the next is managing uncertainty in trajectories in the
tree helps to avoid wrong results.
Algorithm 1 : Temporal R+- tree
Steps:
1. Initial location source with respect point
p1,p2..pn and time T1,T2..Tn
2. For every point in the source P do
a. Initialize service S1…Sn for respective
points.
b. Set index for every service
3. Get rank for each service and store into the
ascending order.
4. Store the node in the top level based on the rank
5. Prune the other items from the TR+tree.
The above algorithm represents the data extraction from
temporal R+ tree based on the user query. This initially
collects location points and its respective time. After that
this will enable the service extraction from repository
using TR+ tree.
Spatial Reverse index (SR-index)
The location based reverse index helps to track all the
service related to the user query. For fast search SR
index method has been proposed to provide appropriate
service, the point selection also helps to avoid the
uncertainty in service selection by location based servers.
The proposed system designed a variant of skyline
reverse index that is optimized for multidimensional
temporal points with reference keys and is thus named
the spatial reverse index (SR-index). This access method
successfully incorporates point coordinates into a
conventional reverse index with small extra space which
is owing to a delicate compact storage scheme for fast
accessibility. Meanwhile an SR-index preserves the
spatial locality of data points and temporal details, and
comes with an R+- Tree built on every reverse list at
little space overhead. Finally it offers two competing
ways for skyline query processing in location based
search. This can consecutively merge multiple lists very
much like merging traditional reverse lists by unique id
of each object. This can also leverage the LP trees to
browse the points of all relevant lists in ascending order
of their distances to the query point by CSP.
IV. CONCLUSION
This work re-modulates the existing trajectory models to
handle the uncertainty in trajectory database. The system
proposed a new and effective approach to modelling the
uncertainty of trajectories, as their modeling powers are
insufficient to capture several important properties of
trajectory data. To complement this, this proposed the
Rife-density trajectory model that represents a trajectory
as time-dependent Pearson distributions. This then
introduced Rife density trajectory model along with
effective indexing technique. The usage of temporal R+
Tree with inverted list improved the searching efficiency,
which is suitable for vector based data searching that
effectively infer time-varying densities of location data.
This also developed an efficient mechanism to process
spatial range queries on indexed Rife-density trajectories.
V. REFERENCES
[1]. Brakatsoulas, Sotiris, et al. "On map-matching vehicle
tracking data." Proceedings of the 31st international
conference on Very large data bases. VLDB
Endowment, 2005.
[2]. Li, Xu, et al. "A practical map-matching algorithm for
GPS-based vehicular networks in Shanghai urban

International Journal of Scientific Research in Science and Technology (www.ijsrst.com)
187
area." Wireless, Mobile and Sensor Networks,
2007.(CCWMSN07). IET Conference on. IET, 2007.
[3]. Kuijpers, Bart, and Walied Othman. "Trajectory
databases: Data models, uncertainty and complete
query languages." Database Theory–ICDT 2007.
Springer Berlin Heidelberg, 2006. 224-238.
[4]. Liu, Hechen, and Markus Schneider. "Querying
moving objects with uncertainty in spatio-temporal
databases." Database Systems for Advanced
Applications. Springer Berlin Heidelberg, 2011.
[5]. Hajari, Hadi, and Farshad Hakimpour. "A Spatial Data
Model for Moving Object Databases." arXiv preprint
arXiv:1403.3304 (2014).
[6]. Karthikeyani, V., and I. ShahinaBegam. "Different
Direction Flow Analysation Algorithm (DDFAA) Of
Moving Object Using Spatial
[7]. Trajcevski, Goce, et al. "The geometry of uncertainty in
moving objects databases." Advances in Database
Technology—EDBT 2002. Springer Berlin Heidelberg,
2002. 233-250.
[8]. Pelekis, Nikos, et al. "Clustering uncertain
trajectories." Knowledge and Information Systems 28.1
(2011): 117-147.
[9]. F. Diebold, T. Gunther, and A. Tay, “Evaluating
density forecasts with applications to financial risk
management,” Int. Econ. Rev., vol. 39, no. 4, pp. 863–
883, Nov. 1998.
[10]. Z. Ding, “UTR-Tree: An index structure for the full
uncertain trajectories of network-constrained moving
objects,” in Proc. 9th Int. Conf. MDM, Beijing, China,
2008, pp. 33–40.
[11]. Z. Ding and R. H. Güting, “Uncertainty management
for network constrained moving objects,” in Proc. 15th
Int. Conf. DEXA, Berlin, Heidelberg, Germany, 2004,
pp. 411–421.
[12]. E. Frentzos, K. Gratsias, and Y. Theodoridis, “On the
effect of location uncertainty in spatial querying,” IEEE
Trans. Knowl. Data Eng., vol. 21, no. 3, pp. 366–383,
Mar. 2009.
[13]. J. Hightower and G. Borriello, “Location systems for
ubiquitous computing,” IEEE Comput., vol. 34, no. 8,
pp. 57–66, Aug. 2001.
[14]. K. Hornsby and M. J. Egenhofer, “Modeling moving
objects over multiple granularities,” Ann. Math. Artif.
Intell., vol. 36, no. 1–2, pp. 177–194, Sept. 2002.
[15]. Jain, E. Y. Chang, and Y.-F. Wang, “Adaptive stream
resource management using Kalman filters,” in Proc.
2004 ACM SIGMOD Int. Conf. Manage. Data, pp. 11–
22.
[16]. A S. Jensen, H. Lahrmann, S. Pakalnis, and J. Runge,
“The INFATI data.” TIMECENTER, Tech. Rep. TR-
79. 2008.
[17]. H. Jeung, H. T. Shen, and X. Zhou, “Mining trajectory
patterns using hidden Markov models,” in Proc. 9th Int.
Conf. DaWaK, Regensburg, Germany, 2007, pp. 470–
480.
[18]. B. Kanagal and A. Deshpande, “Online filtering,
smoothing and probabilistic modeling of streaming
data,” in Proc. 2008 IEEE 24th
ICDE, Cancun, Mexico,
pp. 1160–1169.
[19]. D. E. Knuth, The Art of Computer Programming, Vol.
3, Sorting and Searching, 2nd ed. Redwood City, CA,
USA: Addison Wesley Longman Publishing Co., Inc.,
1998.
[20]. B. Kuijpers, B. Moelans, W. Othman, and A. A.
Vaisman, “Analyzing trajectories using uncertainty and
background information,” in Proc. 11th Int. Symp.
SSTD, Aalborg, Denmark, 2009, pp. 135–152.
[21]. B. Kuijpers and W. Othman, “Trajectory databases:
Data models, uncertainty and complete query
languages,” J. Comput. Syst. Sci., vol. 76, no. 7, pp.
538–560, Nov. 2010.
[22]. A. LaMarca and E. de Lara, Location Systems: An
Introduction to the Technology behind Location
Awareness. San Rafael, CA, USA: Morgan and
Claypool Publishers, 2008.
[23]. H. Liu and M. Schneider, “Querying moving objects
with uncertainty in spatio-temporal databases,” in Proc.
16th Int. Conf. DASFAA, Hong Kong, China, 2011, pp.
357–371.
[24]. H. Lu, B. Yang, and C. S. Jensen, “Spatio-temporal
joins on symbolic indoor tracking data,” in Proc. IEEE
27th ICDE, Hannover, Germany, 2011, pp. 816–827.
[25]. H. J. Miller, “A measurement theory for time
geography,” Geographical Anal., vol. 37, no. 1, pp. 17–
45, 2005
[26]. Emrich, T., Kriegel, H. P., Mamoulis, N., Niedermayer,
J., Renz, M., & Züfle, A. (2014, April). Reverse-nearest
neighbor queries on uncertain moving object
trajectories. In International Conference on Database
Systems for Advanced Applications (pp. 92-107).
Springer International Publishing.
[27]. Eleazar Leal, Le Gruenwald, Jianting Zhang and Simin
You, "TKSimGPU: A Parallel Top-K Trajectory
Similarity Query Processing Algorithm for GPGPUs",
Proceedings of the 2015 IEEE International Big Data
Conference, Oct 29-Nov 1 2015, Santa Clara
[28]. Jianting Zhang, Simin You and Le Gruenwald, "Spatial
Join Query Processing in Cloud: Analyzing Design
Choices and Performance Comparisons", Proceedings
of High Performance Computing for Big Data
Workshop (HPC4BD'15), colocated with the 44rd
International Conference on Parallel Processing (ICPP),
Sept 1-4, 2015

IJSRST162448 | Received : 31 July 2016 | Accepted : 03 August 2016 | July-August 2016 [(2)4: 188-192]
© 2016 IJSRST | Volume 2 | Issue 4 | Print ISSN: 2395-6011 | Online ISSN: 2395-602X Themed Section: Science and Technology
188
Surveillance of Helminthes and Molecular Phylogeny of Fasciola Gigantica Infecting Goats in Sadat District, Egypt
ElKhtam A. O.1, Khalafalla R. E*2 1Department of Parasitology, Faculty of Veterinary Medicine, University of Sadat City, Egypt
2Department of Parasitology, Faculty of Veterinary Medicine, University of Kafrelsheikh, Kafr El-Sheikh, Egypt
ABSTRACT
Helminthes cause health problems in ruminants as anemia, anorexia, weight loss, diarrhea, decreased production and
deaths therefore this study was aimed to identify helminthes of goats, their incidence and genotyping of Fasciola
gigantica recovered from Sadat district (Kafr Dawoud, Wadi Elnatron and ElKhatatba abattoirs) Egypt. The study
was applied on 790 animals from March 2014 to March 2015. The overall infection rate with helminthes was
23.54% among slaughtered goats at Sadat district, Egypt. Prevalence in different localities was recorded. The overall
prevalence rate of trematode helminth was 9.66% and the recovered trematode species and their associated infection
rates were Paramphistomum cervi (1.43%), Fasciola hepatica (0.41%), Fasciola gigantica (5.83%), Carmyerius
gregarious (1.99%). While the prevalence rate of cestodes was 9% and the recovered species and their correlated
infection rates were Moniezia expansa (4.28%), Moniezia benedeni (0.71%) and Avitellina centripunctata (4%).
Genotyping of Fasciola gigantica of the current study was done by amplifying 18S ribosomal RNA gene (656 bp of
nucleic acids), there are no Single Nucleotides Polymorphisms (SNPs) within the sequence of 18S-rRNA gene and
when aligned with isolates of the previous studies; the homology was very high (99.9%) and the divergence was
very low (0.1).
Keywords: Goat, Helminth, Surveillance, Fasciola Gigantica, Molecular, Phylogeny Egypt
I. INTRODUCTION
In Egypt, the incidence of parasitic infection among
farm animals varied according to many factors
including irrigation, season and frequency of
exposure of animal to infection, immune condition
of the animal, the geographic location and climatic
conditions [1]. Undoubtedly the most pathogenic
and economically important helminthes are the liver
flukes (Fasciola gigantica) where they cause
traumatic hepatitis, peritonitis and sudden death in
acute fascioliasis.
DNA studies and using of molecular tools aid in the
exact identification of helminthes parasites. In
ribosomal DNA (rDNA) the Internal Transcribed
Spacer 2 (ITS2) gene have proven useful for
diagnostic purposes at the level of species [2,3].
ITS2 sequences have also been used to characterize
and identify different Fasciola spp., [4,5]. While,
mitochondrial DNA (mtDNA) genes proves to be
excellent markers to differentiate in-between
closely-related species and testing the
polymorphism of Fasciola species [5]. In Egypt, F.
gigantica and Paramphistomum spp are prevalent
among livestock in the Nile delta [6], the aim of the
present work is to identify helminthes infecting
goats, their prevalence, morphology and molecular
characterization of Fasciola gigantica infecting
goats in Sadat district, Egypt.
II. METHODS AND MATERIAL
A. Samples collection and Morphological
identification
Samples were collected from 790 goats at Sadat
district from local abattoirs in 3 different localities;
Kafr Dawoud, Wadi Elnatron and ElKhatatba.
Worms were recovered from slaughtered goats from

International Journal of Scientific Research in Science and Technology (www.ijsrst.com)
189
different organs and during evacuation of
gastrointestinal tract. Worms were washed, relaxed,
fixed, stained and mounted [7]. Morphological
description and identification of the collected
worms were done on mounted specimens according
to [8].
B. DNA extraction from Fasciola gigantica and
PCR
Adults of F. gigantica were collected from the liver
of slaughtered goats and were identified according
to morphometric parameters and all other unclear or
doubtful samples were rejected [9,10]. These worms
were washed several times with PBS and then
preserved in tubes that stored at -20°C till DNA
extraction [11].
Genomic DNA was extracted using 12 individual
worms using the QIAamp DNA Mini Kit (Qiagen
Inc., Valencia, CA) according to the manufacturer’s
instructions. All DNA concentrations were
determined using an Epoch spectrophotometer
(Biotek, Winooski, VT).
ITS2 region was amplified by polymerase chain
reaction (PCR) using the forward primer (3S) 5`-
TTTTTTGGGCATCCTGAGGTTTAT-3` and the
reverse (A28) 5`-TAAAGAAAG AACATAAT
GAAAATAATC-3`, [12,13].
The PCR conditions were as follows: 94°C for 3
min, 50°C for 1 min, and 72°C for 3 min for 30
cycles. Amplification reactions were performed in a
final volume of 25 µl containing primers (3.2 pmol),
deoxynucleoside triphosphates (dNTPs, 0.2 mM),
and Taq polymerase (2.5 U/reaction). PCR products
were purified using GFX PCR DNA and Gel Band
Purification Kit (GE) according to manufacturer’s
protocol.
C. Sequencing and phylogenetic analysis
PCR products were sequenced using Big Dye
Terminator v 3.1 Cycle Sequencing Ready Reaction
kit (Applied Biosystems) in a 3100 Automated
DNA Sequencer (Applied Biosystems) as
recommended by the supplier. Amplicons were
sequenced in each direction using the NC5 and NC2
primers, in separate reactions. Bio Edit v7.0.4.1 and
DNASTAR Lasergene SeqMan v7.0.0 programs
were used for analyzing and editing the DNA
sequences.
Sequences of ITS2 regions from different isolates of
previous studies were aligned against the isolate of
the current study using ClustalW [14] multiple
sequences alignment and the Phylogenetic trees
were carried out using MEGA5 software [15].
III. RESULTS AND DISCUSSION
A. Incidence of the recovered helminthes
The overall incidence of different helminth species
among examined slaughtered goats was 23.54%
(186 out of 790) with variable infection rates in
different localities where it was at Wadi El-Natron
locality 32% (96 out of 300), at Kafr Dawoud was
6.25 % (70 out of 280) and at El-Khatatba locality
was 9.52% (20 out of 210) (see Fig. 1).
Z
Figure 1: Prevalence of helminth infections of
slaughtered goats in different localities (Wadi El-
Natron, Kafr Dawood and El-Khatatba) at Sadat
District, Egypt
The overall prevalence rate of trematode infection
was 9.66% and the recovered trematode species and
their associated infection rates were
Paramphistomum cervi (1.43%), F. hepatica
(0.41%), F. gigantica (5.83%), Carmyerius
gregarious (1.99%). While the prevalence rate of
cestodes was 9% and the recovered species and
their correlated infection rates were Moniezia
expansa (4.28%), Moniezia benedeni (0.71%) and
Avitellina centripunctata (4%) (See Table 1).

International Journal of Scientific Research in Science and Technology (www.ijsrst.com)
190
Table 1 : Prevalence of different helminth
infections in slaughtered goats (N=790) from
different localities at Sadat District, Egypt.
Infection rate %
Trematodes 9.66
Fasciola gigantica 5.83
Fasciola hepatica 0.41
Carmyerius gregarious 1.99
Paramphistomum cervi 1.43
Cestodes 9
Moniezia expansa 4.28
Moniezia benedeni 0.71
Avitellina centripunctata 4
The helminthes recovered from slaughtered goats
were F. gigantica, F. hepatica, Paramphistomum
cervi, Carmyerius gregarius, Moniezia expansa,
Moniezia benedeni, Moniezia denticulata and
Avitellina centripunctata. The infection rate of
Moniezia expansa, was agreed with the results
recorded in Rudolphi [16] and in Menofia
governorate, Egypt [17], but it was disagreed with
that recorded by [18] in north Sinai, Egypt.
B. Genotyping of Fasciola gigantica
The genotyping of F. gigantica which recovered
from goat in the current study is based on
amplification of 18S ribosomal RNA gene sequence
and its characteristics and sequence alignments (Fig.
2).
Figure 2. Complete sequences of the 18S-rRNA
gene from Fasciola gigantica isolate Y15 of the
current study.
For comparative purposes, pairwise and multiple
alignments of the gene sequences was done with
18S-rRNA gene sequence of Fasciolides from
different hosts and geographical regions obtained
from Gene Bank to evaluate sequence homology
and diversity (Fig.3).
Main variable regions were identified in the 18S-
rRNA gene sequences which were characterized by
a considerable number of indels (insertion and
deletion of nucleotides) as Single Nucleotide
Polymorphism (SNPs) with 18S-rRNA gene of F.
gigantica isolate BDF-Ct.109 (Accession number:
KC476170) and F. gigantica isolate ADC53
(Accession number: KJ728737). By using pairwise
and multiple alignment of 18S-rRNA gene of F.
gigantica isolate 124 (FJ756397) with that of our
strain, both sequences have revealed a high
sequence homology, due to only a few indels and
SNPs and shared a high number of identical
nucleotides with F. gigantica isolate 124 (FJ756397)
which was the most similar sequences (Fig.3).
Figure 3 : Sequence characteristics and Sequence
comparisons of the 18S-rRNA gene from Fasciola
gigantica isolate (Y15 represents the 18S-rRNA
gene from Fasciola gigantica isolate of the current
study)

International Journal of Scientific Research in Science and Technology (www.ijsrst.com)
191
Our isolate in the present study was very high
homologous (99.9%) with other F. gigantica
isolates, and the divergence was very low (0.1%),
they were the closest inter specific pair, but the
homology was much lower among F. hepatica and
F. gigantica isolate ADC53 (KJ728737) which
indicates that the ITS2 region allows discrimination
between species of Fasciolidae [19].
Inter specific variation (between species) in the
regions exceeded that within species. The variation
between species ranged between 0.1 and 1.4%, and
so, the alignments of the 18S rRNA gene sequence
of the different isolates showed that the species
differed from each other by single base substitutions
and indels, and the first 250 and last 190 nucleotides
of the gene were identical in all isolates.
C. The phylogenetic analysis
By reading the phylogenetic tree (Fig.4), F.
gigantica isolate in the present study was clustered
with F. gigantica isolate 124 (FJ756397) as they
was very identical to each other, but somewhat
differ from F. gigantica isolate BDC-Fsp.Bf.101
(KC424484), isolate BDF-Ct.109 (KC476170) and
isolate ADC57 (KJ728738) but it lying faraway
from F. hepatica isolate Persian 1 (GQ925431).
Fasciola hepatica (GQ925431) Persian1
Fasciola hepatica (KF982045) ADS8
Fasciola hepatica (AB207141) Ireland
Fasciola gigantica (KJ728738) ADC57
Fasciola Gigantica Sadat/Egypt (investigated isolate)
Fasciola gigantica (KJ728737) ADC53
Fasciola gigantica (FJ756973) Isolate 124
Fasciola gigantica (KC424484) BDC-Fsp.Bf.101
Fasciola gigantica (KC476170) BDF-Ct.109
Figure 4. Neighbor-Joining phylogenetic tree [20].
The phylogenetic distances were computed using
the Maximum Composite Likelihood method [21]
and are in the units of the number of base
substitutions per site. The analysis involved 9
nucleotide sequences. Codon positions included
were 1st+2nd+3rd+Noncoding. All positions
containing gaps and missing data were eliminated.
There were a total of 404 positions in the final
dataset. Phylogenetic analyses were conducted in
MEGA5 [15].
The phylogenetic tree based on ITS2 region
displayed a close relationship between investigated
F. gigantica isolate from Egypt and other parts of
the world (Fig.4).
In Egypt, F. hepatica and F. gigantica are prevalent
among livestock in the Nile delta [7] results showed
that identification of Egyptian Fasciola based only
on morphometric criteria is not a countable as the
presence of F. hepatica, F. gigantica besides the
hybrid form in Egypt was confirmed [22]. In a study
was done in Egypt [13], nucleotide sequences of the
mitochondrial DNA, cytochrome oxidase subunit 1
(CO1) and Internal Transcribed Spacer 2 (ITS2) of
the ribosomal RNA gene were used to identify
Fasciola species that infects cattle in Qena province,
Upper Egypt, and they concluded that, to
sequencing, amino acids analysis and studying the
phylogenetic relationship are pecise tools to identify
Fasciola species.
IV. CONCLUSION
The results displayed herein indicated that the using
of ITS2 region is a powerful tool for identification
and discrimination between the Fasciolidae species.
V. REFERENCES
[1] Cawthorne, R.J.C. 1984. Anthelminthics for
cattle, sheep, goats, pigs, horses and poultry.
MAFF publication lion house, willowbum
estate, Alinwick.
[2] Morgan, J. A. and Blair, D. 1995. Nuclear
rDNA ITS sequence Variation in the trematode
genus Echinostoma: An aid to establishing
relationships within the 37-collar spine group.
Parasitology, 111: 609-615.
[3] Leon-Regagnon, V.; Brooks, D.R. and de
Leon, G.P.P. 1999. Differentiation of Mexican
species of Haematoloechus Looss, 1899
(Digenea: Plagiorchiformes): Molecular and
morphological evidence. J. Parasitol., 85: 935-
94.
[4] Huang, W.Y.; He, B.; Wang, C.R. and Zhu,
X.Q. 2004. Characterization of Fasciola
species from Mainlad China by ITS-2
ribosomal DNA sequence Vet. Parasitol., 120:
75-83.

International Journal of Scientific Research in Science and Technology (www.ijsrst.com)
192
[5] Amer, S.; Dar, Y.; Ichikawa, M.; Fukuda, Y.;
Tada, C.; Itagaki, T. and Nakai, Y. 2011.
Identification of Fasciola species isolated from
Egypt based on sequence analysis of genomic
(ITS1 and ITS2) and mitochondrial (NDI and
COI) gene markers. Parasitol. Int., 60: 5-12.
[6] Lotfy, W.M. and Hillyer, G.V. 2003. Fasciola
species in Egypt. Experimental Pathology and
Parasitology, 6: 9-22.
[7] MAFF, 1986. Manual of Veterinary
Parasitological Laboratory Techniques.
Ministry of Agriculture, Fisheries and Food.
Reference Book No. 418. Her Majesty`s
Stationary Office, London, UK.
[8] Soulsby, E.J.L., 1986. Heminths, Arthropods
and protozoa of domesticated animals. 7th ed.
Baillier, Tidal and Cassel, London.
[9] Sahba, G.H., Arfaa, F., Farahmandian, I.,
Jalali, H., 1972. Animal fascioliasis in
Khuzestan, southwestern Iran. Journal of
Parasitology 58, 712–716.
[10] Muller, R., 2002. Worms and Human Diseases.
CABI International, Wallingford, Oxon, UK.
[11] El-Gozamy B.R. and Shoukry N.M., 2009.
Identification of Egyptian Fasciola species by
PCR and restriction endonuclease digestion of
the nuclear small subunit ribosomal RNA
gene. Journal of Egyptian Society of
Parasitology, 39, 429–439
[12] Bowles J, Hope M, Tiu WU, Liu X, McManus
DP (1993) Nuclear and mitochondrial genetic
markers highly conserved between Chinese
and philippine Schistosoma japonicum. Acta
Trop (Basel) 55: 217±229
[13] Omar, M.A., Metwally, A.M. and Sultan, K.,
2013. Molecular and Phylogenetic status of
Fasciola sp., of cattle in Qena, Upper Egypt.
Pak. J. Biol. Sci, 16(15): 726-730.
[14] Higgins, D.G. and Sharp, P.M., 1988.
CLUSTAL: A package for performing
multiple sequence alignment on a
microcomputer. Genetics, 73: 237-244.
[15] Tamura K., Peterson D., Peterson N., Stecher
G., Nei M., and Kumar S., 2011. MEGA5:
Molecular Evolutionary Genetics Analysis
using Maximum Likelihood, Evolutionary
Distance, and Maximum Parsimony Methods.
Molecular Biology and Evolution (In Press).
[16] Mir, M.R.; Chishti, M.Z.; Dar, S.A.; Katoch,
R.; Rashid, M.; Ahmad, F. and Tak, H. 2013.
Incidence and Histopathological Study of
Monieziosis in Goats of Jammu (J&K), India.
Cibtech Journal of Zoology, 2 (1): 19-23.
[17] Elkhtam, A.O. 2008. Studies on helminthes
infecting ruminants in Menofia governorate.
M. V. S., Fac. Vet. Med., Menofia Univ.
[18] Mazyad, S. and El-Nemr, H. 2002. The
endoparasites of sheep and goats, and shepherd
in North Sinai Governorate, Egypt. J. Egypt
Soc. Parasitol, 32 (1) : 119-126.
[19] Adlard, R.D.; Barker, S.C.; Blair, D. and
Cribb, T.H. 1993. Comparison of the second
internal transcribed spacer (Ribosomal DNA)
from populations and species of fasciolidae
(Digenea) .Int. J. Parasitol, 23: 423-425.
[20] Saitou N. and Nei M. 1987. The neighbor-
joining method: A new method for
reconstructing phylogenetic trees. Molecular
Biology and Evolution 4:406-425.
[21] Tamura K., Nei M., and Kumar S. 2004.
Prospects for inferring very large phylogenies
by using the neighbor-joining method.
Proceedings of the National Academy of
Sciences (USA) 101:11030-11035.
[22] Dar, Y.; Amer, S.; Mercier, A.; Courtioux, B.
and Dreyfuss, G. 2012. Molecular
identification of Fasciola spp., (Digenea:
Fascioladae) in Egypt. Parasite, 19: 177-182.

IJSRST162447 | Received : 30 July 2016 | Accepted : 04 August 2016 | July-August 2016 [(2)4: 193-202]
© 2016 IJSRST | Volume 2 | Issue 4 | Print ISSN: 2395-6011 | Online ISSN: 2395-602X Themed Section: Science and Technology
193
Bio-activity of Cabbage (Brassica oleracea var capitata) Plant Product as Insecticides to control mustard aphid, Lipaphis
erysimi Kaltenbach (Aphididae: Homoptera)
Monica Singh Chauhan, J. P. Shukla, Ashish Pandey
Department of Botany, Department of Zoology, D.A.V.P.G. College, CSJM University, Kanpur, India
ABSTRACT
Three botanical pesticides, Azadirachta indica leaves ex t rac t , Acacia catechu leaf and bark extract,
Carica papaya seed extract and three chemical pesticides Indocarb 15 SC, 0.006%, @30 a.i./ha, 200 ml /
g / ha, Fipronil 5EC 0.005%, 25-50 g ai / ha, 500 ml / g / ha and Endosulfan 35 EC, 0.05-0.07 %, 250-500
a.i. / ha 700-1004 ml / g / h were tested against 2nd
and 4th
instar larvae of the L. erysimi on field
cabbage under both laboratory and field conditions. In square dip experiment a highly significant
difference was recorded amongst the different treatments for mean mortality of L. erysimi. The maximum
mean mortality was obtained at NLE2.5% >NLE5%> NSE 10% >AcLE 2.5%> AcSE 2.5%. The order
was found to be descending. Repellency test through square dip experiments showed that the significant
difference was recorded amongst the different treatments for mean mortality of larvae. During larval
immersion method NLE2.5% was proved to be most significant followed by NLE 5%> AcLE 2.5% >
ASE (2.5-5%) > Fipronil 0.0005%. However, NLE was found superior than botanicals in both square dip
and larval immersion methods. The field spray schedule showed the significant results with the spray of
NSE (10%) > ALE (10%) >ASE10% CpLE5% > CpLE-10% while, the second spray was significantly
effective against CpLE 10% > Endosulfan [email protected]% > NLE5% while the spray by
CpLE10%and Endosulfan [email protected] were found significant and most promising.
Keywords: Lipaphis erysimi, Carica seed, Carica leaf, Neem leaf, Acacia bark, Acacia leaf, Extract,
Repellent.
I. INTRODUCTION
Today the rapid increase in population and
demand of food materials has initiated the large
use of insecticides and pesticides. These toxic
chemical insecticides and pesticides are resulting
in harmful effects and biomagnifications which is
continuously polluting fertile lands and acquiring
infertility. No doubt they provide results in
eradication of insects, pests and diseases but are
also killing useful organism the soil and affects
soil fertility. The conventional farming practices
based on chemical methods broadly kill arthopods,
resulting in the malfunctioning of food chain and
food web.
Bio-control is the best method to cope with the
losses done by the chemicals. In these method
insects, pests and pathogens are removed using
biological methods without harming the
environment and other organism. This is based on
natural predation rather than introduced chemicals.
The use of bio-insecticides and pesticides also
comes under this category. Today due to
awareness about the harmful effects of the
chemical insecticides and pesticides, most of the
farmers are diverting towards the organic farming.
In our local area many such plants, waste matter
etc. are available from which these bio-
insecticides and pesticides can be prepared by
using natural means only. Conventional pesticides

International Journal of Scientific Research in Science and Technology (www.ijsrst.com)
194
are generally synthetic materials that directly kill
or inactivate the pest. Being single chemical
entity, chemical pesticides have resulted in
increased resistance in pests.
Biological Pesticides are pesticides derived from
natural materials as animals, plants, bacteria, and
certain minerals. Bio pesticides are less toxic and
also reduce the pollution problems caused by
conventional pesticides. The use of bio-
insecticides and bio-pesticides also fall under this
category only. Organic agriculture is a unique
production management system which promotes
and enhances agro-ecosystem health, including
biodiversity, biological cycles and soil biological
activity, and this is accomplished by using on-
farm agronomic, biological and mechanical
methods in exclusion of all synthetic off-farm
inputs. Organic farming generally produces
somewhat lower yields but sustains better yields
during drought years, allowing it to reap higher
yields in some cases. Studies thus far have shown
that organic farming requires less water, uses few
and always natural pesticides, prevents soil
erosion, leaches dramatically fewer nitrates, and
has been shown to have improved nutrient
qualities including as much as double the
flavonoids, an important antioxidant.
“Biopesticides include naturally occurring
substances that control pests (biochemical
pesticides) , microorganisms that control pests
(microbial pesticides), and pesticidal substances
produced by plants containing added genetic
material (plant‐incorporated protectants) or PIPs.”
Agriculture has had to face the destructive
activities of numerous pests like fungi, weeds and
insects from time immemorial, leading to radical
decrease in yields. With the advent of chemical
pesticides, this crisis was resolved to a great
extent. But the over dependence on chemical
pesticides and eventual uninhibited use of them
has necessitated for alternatives mainly for
environmental concerns. Degraded soils and
groundwater pollution has resulted in nutritionally
imbalanced and unproductive lands. Violative
pesticide residues also sometimes raise food
safety concerns among domestic consumers and
pose trade impediments for export crops.
Therefore, an ecofriendly alternative is the need
of the hour. Biopesticides or biological pesticides
based on plant extracts specific to a target pest
offer an ecologically sound and effective solution
to pest problems. They pose less threat to the
environment and to human health. The potential
benefits to agriculture and public health
programmes through the use of biopesticides are
considerable. The interest in biopesticides is
based on the advantages associated with such
products which are: (i) inherently less harmful
and less environmental load,(ii) designed to affect
only one specific pest or, in some cases, a few
target organisms, (iii) often effective in very small
quantities and often decompose quickly, thereby
resulting in lower exposures and largely avoiding
the pollution problems and (iv) when used as a
component of Integrated Pest Management (IPM)
programs, biopesticides can contribute greatly.
Lipaphis erysimi is regarded as the most
important pest of cruciferous crops worldwide
(Prasad and Phadke 1988; Bonnemaison 1965).It
causes considerable yield loss to late season
cabbage crop. Several insecticides have been
recommended for its control (Murthy et al., 1982;
Yadava et al., 1988., Dhura and Hameed., 1990;
Zhu et al., 1996; Lal et al., 1999). In addition to
the damage it does as a sapsucker, it is also a
vector of several viral diseases (Guan and Wang
1980; Ahlawat and Chenulu 1982; Castleeta.1992;
Kennedy and Abou-Ghandir1987; Liu et al.1997;
Liu and Yue2001; Bridge et al.2001).Mohan et al;
(1981) found that L .erysimi and Crocidolomia
binotalis, are major pest of cabbage,
Methamidophos at 0.25 or 0.5 kg/h gave a
excellent control of both pests. Pandey et al(1987)
evaluated the 3 concentrations (0.5,1.0 and 1.5%)
of Neem seed kernal extract against L. erysimi
under laboratory conditions and found that 80
percent was given by1.5% concentration.1.0%
concentration was also effective.
Insect-pests are known to cause significant

International Journal of Scientific Research in Science and Technology (www.ijsrst.com)
195
damage to crops and affect agricultural
productivity. The environmental hazards posed
by synthetic pesticides. Due to high cost of
protecting crops from these pests with chemical
pesticides and the increasing resistance and
resurgence to many chemical pesticides (Armes
et al. 1992; Brewer & Trumble 1994) there is
growing interest in the use of biological
products such as bacterial and viral-based
insecticides, and parasitoids (Nagarkatti 1982),
predators (King et al., 1982) and botanical
pesticides (Rao et al. 1990). These groups have
different mode of action from conventional
products (Thompson et al. 1999) and their
properties may differ considerably from the
conventional chemicals with which growers are
familiar. It is therefore important to generate
information on the likely differences in the
performances of these products to educate
growers and facilitate adoption.
The objective of this study was to evaluate
commercially available biological and botanical
pesticides both individually and partly in
combination against mustard aphid species on
cabbage to determine their effects under
laboratory and field conditions. So, this
additional information would make existing
IPM programmes more effective and sustainable,
while decreasing the reliance on synthetic
insecticides.
II. METHODS AND MATERIAL
Extraction of Plant Materials
(A) Azadirchata Indica
The shade dried leaves of different neem plants were
ground in an electrical grinder to make a fine powder.
For extraction, 10gm powder of each plant leaves were
weighed for extraction through petroleum ether (40-
600C) and then another sample of 10 gm each was
taken for obtaining alcoholic extracts with the help of
soxhlet apparatus. The extraction was completed
within 4 hours. The extracts obtained in the reservoir
of the soxhlet apparatus evaporated on a water bath
till they remained about 15 ml and then transferred to
pre-weighed 50 ml beakers, through filtration from a
thick layer of anhydrous sodium sulphate made on
silica jel on glass wool plugged funnels. The extracts
were again dried over water bath so as to obtain a
semi-solid extractive of each plant. The extractives
were used to make the stock solution. One percent
stock solutions of all the fractions in methanol were
prepared from the residues obtained at each stage of
the purification process and the fractions were tested at
different concentrations.
(B) Acacia catechu: One kg of the dried leaves
and bark Acacia catechu was taken in an aluminium
pot to which ten litres of water were added so that the
chips completely immersed under water. It was boiled
over an open fire for four hours and allowed to stand
for 24 hours so that more catechu might diffuse into
the water. The extract was decanted off in a pot and
was filtered through a fine muslin cloth to remove
wood chips and other suspended materials. The filtrate
was evaporated and the residue obtained was air dried
and weighed (180g). Yield of catechu was 18%.
Isolated catechu (150g) was taken in a five-litre
stainless steel beaker containing one litre distilled
water. It was boiled with constant stirring for complete
dissolution and filtered through a filter paper. Then it
was evaporated to 500 ml and allowed to stand for 24
hours. The obtained precipitate was filtered using a
filter paper. The aqueous filtrate was rejected. The
residue was dissolve in ethanol and filtered. The
ethanolic solution was evaporated to dryness and the
residue was dissolved into hot water (500 ml). It was
allowed to stand for 24 hours. The precipitate was
filtered and dried in air (m.p. 95-6ºC, yield 37.5g,
25%).
(C) Carica papaya : papaya fruit was obtained
from market. Seeds were shade-dried for a minimum
of 15 days. Powdered seeds (1 kg) were extracted with
chloroform (3.0 L), under reflux, for 4 h; the extract
was cooled to room temperature and filtered. Solvent
was removed under reduced pressure by rotatory
evaporator and the extract was dried in a vacuum oven
at room temperature for 12 h (yield, 7.2% by weight).
Fatty acid methyl esters were prepared according to
the AOAC-IUPAC Method 969.33 [18].Chloroform
extract (90 mg) and 1 N solution of NaOH in methanol
(4 mL) were placed in a round-bottomed flask, and the
mixture was heated at boiling point with stirring for 15
min. Next,BF3-MeOH (5 mL, 15% w/w) were added
and heating continued for 5 min. Iso-octane (2 mL)

International Journal of Scientific Research in Science and Technology (www.ijsrst.com)
196
was added; the mixture was stirred for 5 min, more
and extracted with hexane (2 mL). The organic phase
was dried over anhydrous Na2SO4. The fatty acid
methyl esters were analyzed on an Agilent
Technologies 6890N GC equipped with an HP-5MS
column (30 m in length;25 mm internal diameter; 0.25
μm film thickness) equipped with an Agilent EM 5973
detector, at 150 °C. The carrier gas was helium, at a
flow rate of 1 mL/min; the split ratio was 2:1. The
column temperature was initially 60 °C (for 3 min) and
was gradually increased to 170 °C, at 3 °C/min; this
temperature was held for 1 min. Next, the temperature
was raised to 330 °C, at a rate of 10 °C/min; this
temperature was held for 10 min. The injector
temperature was 330 °C and 1 μL of organic phase
were injected by duplicate.
Insects
The larvae used for the study were collected from the
host plants of different vegetables in the fields and
brought to lab, under laboratory conditions. The
culture of L.erysimi was maintained in the laboratory
on semi synthetic diet as suggested by Nagarkatti and
Prakash (1974) with some modifications at a
temperature of 27± 1oC and relative humidity 60 ± 1
percent. They were reared on artificial diet in small
round plastic vials (3.5x2.0Cm) till pupation under
laboratory conditions. Studies were carried out using I-
VI instar larvae of L. erysimi against the leaf extract of
A.indica. The percentage mortality was calculated
after a period of 24h. Generally, second and fourth-
stage larvae were used in various experiments and they
were starved for 12 h before all experiments.
Bioefficacy Evaluation
The various botanical and synthetic preparations used
in laboratory and field are listed in Table 1 (Figure 1).
The host plants (Brassica oleracea var. capitata) used
for the spraying tests in the laboratory and field were 3
to 5 weeks old and with 7-8 branches. Under
laboratory conditions, the tests were carried out in
petri dishes (8.5 cm diameter).
In Square Dip Experiment, design was CRD with
three replications. The medium sized test leaves were
collected from unsprayed fields. A total of 30 equal
sized squares were dipped into each treatment for 20
seconds as shown in Table 1, and then air dried for
60 minutes. Weight of each larva was recorded before
treatment application using sensitive balance. The
treated leaves were placed into the Petri dishes on
moistened filter paper (one larvae per petri dish)
with the adaxial surface uppermost. L. erysimi
larvae were then placed onto the leaf disc and then a
cover was put onto the dish. For control treatments the
leaves were dipped in water only.
In larval immersion experiment, the larvae were
immersed into the respective treatments for 20
seconds and then transferred to paper padded tray in
order to remove excessive liquid from the body of the
larvae. The purpose of this experiment is to evaluate
the contact effect of pesticides on insects. The design
in this experiment is CRD with three replications.
Like in the square dip experiment, a total of 30 larvae
were tested in each treatment. Third instar larvae
were weighed before treatment application.
The experiments were conducted in the laboratory
with a temperature of 25 ± 1 °C light regime of 14 h
light 10 h dark and relative humidity of 65 ± 1 %.
Mortality was assessed every 24 h, 48 h, and 72 h in
all the experiments.
For the experiments under field conditions, the plants
of Brassica oleracea var. capitata were grown 3-5
weeks prior to conducting the experiments in plots.
The planting distances were 70 cm x30cm on plots that
measured 4.2mx4.0m. When the plants attained about
7-8 branches, the solutions of various treatments were
applied with a trigger sprayer, misting to run-off level.
Water was used as a control. The spray equipment was
drained and triple rinsed after each treatment to avoid
any contamination. Second and third instars of L.
erysimi were placed on each plant and ten plants were
used in each treatment (30 larvae per treatment) and
observations were recorded before and after 4 hrs, 8
hrs, 24 hrs and 32 hrs from the time of spray. In the
experimental field trial three replication for each
treatment were performed.
Statistical Analysis
For statistical analysis of efficacy of insecticides to
L . e r y s i m i m o r t a l i t y due to the different
insecticides was analysed using the Tukey ‟s
Studentized Rang (HSD) Test.

International Journal of Scientific Research in Science and Technology (www.ijsrst.com)
197
III. RESULT AND DISCUSSION
Toxicity of insecticides to L. erysimi
Our results show significant differences in the
mortality recorded from the different treatments
under laboratory and f i e l d conditions. The lowest
mean mortality was recorded by CpLE-10% and
control water treatment as shown in Table1(figure1).
S ignificantly higher mortality was detected in all
the treatments compared with the untreated controls
as shown in Table 2 (Figure 2 and Figure 2 continued)
and Table 3 (Figure 3). The effect of feeding on
larvae found highly significant at 72 hours after
treatment in Carica papaya leaf extract 2.5%
followed to 48 hours after treatment in Neem Leaf
extract 2.5%, 48 hours after treatment in Neem Seed
Extract2.5%,24 hours after treatment in Neem Seed
extract 5%, 24 hours after treatment in Carica papaya
leaf extract 2.5%, 24-72 hours after treatment in
Carica papaya leaf extract 5% while, other treatment
were not found significant. Bhatal et al.,(1993)
studied the effects of AZT-VR-K(an Azadirachtin
rich acetone extract of Neem seed kernel extract)and
commercial Neem products and reported that
development, reproduction and mortality of mustard
aphid (L. erysimi) reduced. Sontakke and Das (1996)
used Neem formulations for the control of L. erysimi
infesting mustard and found that quinolphos was the
most effective followed by Chlorpyrifos and
Endosulfan and result in the highest seed yield. The
results obtained on the effect of repellency, feeding
larvae, their weight loss through square dip and larval
immersion methods were found in conformity of
Klocke (1987). Azadirachtin- rich diets lead to
decreased feeding and weight gain, as well as
biomass conversion rates.
The field spray schedule for I, II, III spray showed the
significant results on I spray by Neem Seed Extract
10% followed to Acacia leaf extract 10%,Acacia Seed
Extract10%,Carica papaya leaf extract (5-10%) while,
the II spray was significantly effective against
CpLE10%, Endosulfan35@ 0.05-0.07% ,NLE5%
while the spray by CpLE 10% and Endosulfan 35
[email protected] were found significant and most
promising. These findings were found in conformity
of Kabir and Mia (1987), who found Neem reduced
the infestation and increased the yield.
Table 1 : Repellency Test, Mean number of Lipaphis
erysimi larvae died (Square Dip and Larval Immersion
Method)
Mean followed by the same letter within the column
are not significantly different from each other at P <
0.05, Tukey ‟s Studentized Rang (HSD) Test. NLE =
Neem Leaf Extract,; AcLE = Acacia leaf Extract;
CpLE =Carica Papaya leaf Extract
Figure 1: Repellency Test, Mean number of Lipaphis
erysimi larvae died (Square Dip and Larval Immersion
Method)
Table 2: Effect on Feeding: Mean number of
Lipaphis erysimi damaged square within 24, 48, 72 hrs
after treatment in square dip method
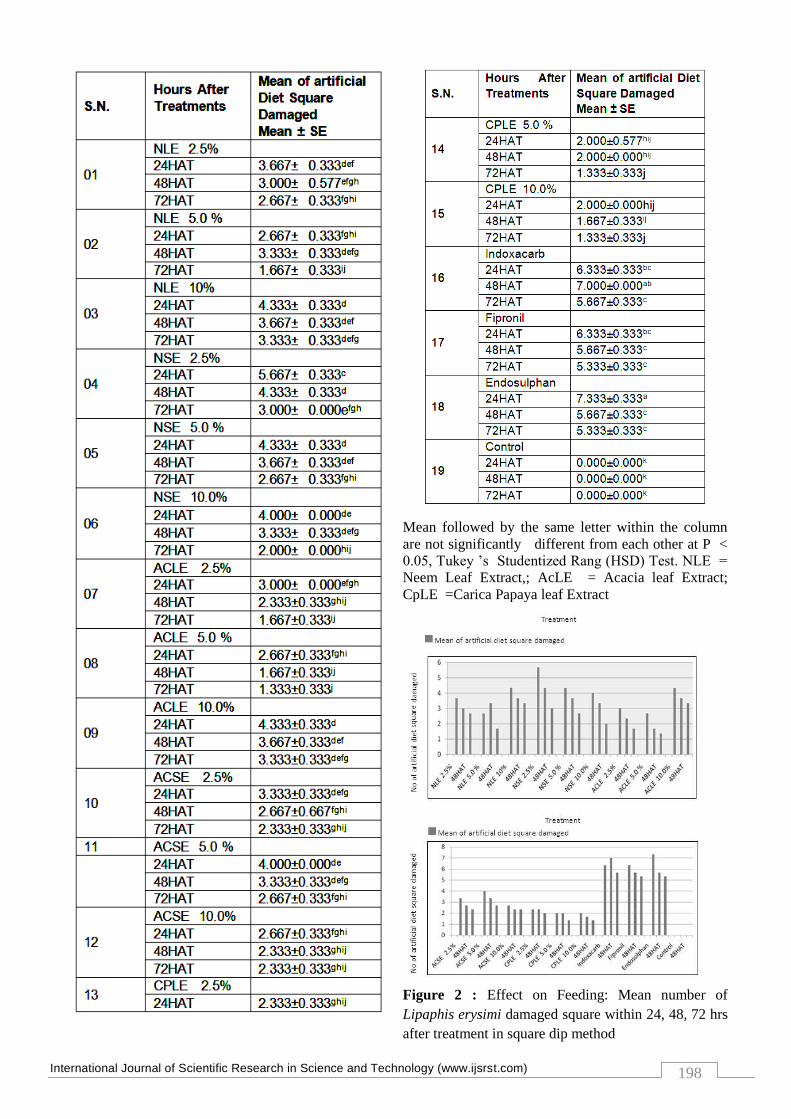
International Journal of Scientific Research in Science and Technology (www.ijsrst.com)
198
Mean followed by the same letter within the column
are not significantly different from each other at P <
0.05, Tukey ‟s Studentized Rang (HSD) Test. NLE =
Neem Leaf Extract,; AcLE = Acacia leaf Extract;
CpLE =Carica Papaya leaf Extract
Figure 2 : Effect on Feeding: Mean number of
Lipaphis erysimi damaged square within 24, 48, 72 hrs
after treatment in square dip method

International Journal of Scientific Research in Science and Technology (www.ijsrst.com)
199
Table 3 : Effects of Different field treatment on Lipaphis erysimi at Brassicae crop
Mean followed by the same letter within the column
are not significantly different from each other at P <
0.05, Tukey ‟s Studentized Rang (HSD) Test. NLE =
Neem Leaf Extract,; AcLE = Acacia leaf Extract;
AcSE = Acacia Seed Extract; CpLE =Carica Papaya
leaf Extract
Figure 3. Effects of Different field treatment on
Lipaphis erysimi at Brassicae crop
IV. CONCLUSION
A chemical pesticide is used to protect crops and to kill
pests. Use of synthetic pesticides causes some
unfortunate consequences like environmental pollution,
pest resistance and toxicity to other non-target
organisms. To ally the fear of the hazardous effect of
chemical residues to human and animal health, several
studies were conducted to determine the most effective
control methods without using insecticides. In this
research work we have used various botanicals against
one of the most notorious pest Lipaphis erysimi, Kalt
(Mustard: Aphid) belonging to order Homoptera:
Aphididae) is a serious pest on several cruciferae and
other economically important crops and is widely
distributed worldwide.
S.N. Treatments Pre-
count
I spray larvae
died/ 10 Plants
II Spray larvae
died/ 10 Plants
III Spray larvae
died/ 10 Plants
Fruit
damage
(%)
01 NLE 2.5% 10. 3.000±0.577de
1.667±0.333 def
0.333±0.333 f 2.50%
02 NLE 5.0 % 10. 3.000±0.577de
04.000±0.577c 1.667±0.333
bde 3.50%
03 NLE 10.0% 12. 3.000±1.528de
00.667±0.333f 0.333±0.333
f 2.50%
04 NSE 2.5 % 12. 2.333±0.333e 1.333±0.333
def 0.333±0.333
f 2.50%
05 NSE 5.0 10. 3.667±0.333de
2.333±0.333 de
0.333±0.333 f 2.50%
06 NSE 10.0% 10. 2.667±0.667de
1.667±0.333 def
0.333±0.333 f 2.50%
07 AcLE 2.5% 10 3.333±0.333de
2.000±0.577 def
0.667±0.333ef 2.50%
08 AcLE 5.0% 10 3.333±0.882de
1.333±0.333 def
0.333±0.333 f 2.50%
09 AcLE 10.0 10 1.667±0.667e 00.667±0.333
f 0.333±0.333
f 2.50%
10 AcSE 2.5 % 11 3.000±0.577de
2.333±0.333 de
1.333±0.333def
3.75%
11 AcSE 5.0 % 9. 3.000±0.577de
1.667±0.333 def
0.667±0.333ef 3.00 %
12 AcSE 10.0% 10 2.333±0.333e 1.333±0.333
def 0.333±0.333
f 2.50%
13 CpLE 2.5 % 10 3.000±0.577de
2.000±0.000 def
1.000±0.000 def
3.25%
14 CpLE 5.0% 11 02.333±0.882e 00.667±0.333
f 0.333±0.333
def 2.50%
15 CpLE 10.0 11 6.000±0.577bc
05.667±0.333 b 2.667±0.333
b 3.00%
16 CpFE 2.5 % 10 4.667±0.882cd
02.667±0.667 d 2.000±0.577
bcd 2.75%
17 Indoxacarb 09 3.000±0.577de
1.667±0.333 def
1.000±0.000def
3.25%
18 Fipronil 10 2.333±0.882e 01.000±0.577
ef 0.333±0.333
def 2.50%
19 Endosulphan 10 7.333±0.333b 05.667±0.333
b 2.667±0.333
b 3.00%
20 Control 11 13.67±0.333a 11.00±0.577
a 6.330±0.333
a 8.00%
International Journal of Scientific Research in Science and Technology (www.ijsrst.com)
200
The results of our study indicate that the plant
products could be the best alternatives for the
sustainable management of L.erysimi on cabbage with
less impact on the naturally occurring predatory
arthropods. Few botanicals have been reported as
effective managers of insect-pests and commercialized.
Much knowledge and experience of using these is
treasured in farmer‟s traditional knowledge. Derived
from the Neem tree (Azadirachta indica), this contains
several chemicals, including „Azadirachtin‟, which
affects the reproductive and digestive process of a
number of important pests. Recent research carried out
in India and abroad has led to the development of
effective formulations of Neem, which are being
commercially produced. As Neem is non-toxic to birds
and mammals and is non-carcinogenic, its demand is
likely to increase.
Our view has been supported by Lal (1996)
Nimbicidine and NeemMark caused 20-26%mortality
of winged adult aphid after 2 days application while
NeemGold and Jawan gave about 15% mortality. Patel
et al., (1996) Endosulfan (0.035%, Chlorpyriphos
(0.02%) and Neem Seed Kernal Suspension (NSKS
0.3%) were most effective in controlling the pest.
It is widely recognized that we face a major challenge
continuing to increase agricultural productivity to keep
pace with a population racing toward 9 billion within
the next few decades. Agricultural practices developed
and honed in the 20th century, from the development
of synthetic nitrogen fertilizers by Fritz Haber in the
early nineteenth century (Smil 2004) to the invention
of synthetic pesticides in the decades following,
(Casida & Ousted 1998, Knight et al. 1997) have
greatly improved crop productivity which has helped
cope with an ever-increasing global population to date.
While crop production has certainly benefited,
technological improvements have unfortunately also
led to unexpected consequences for non-target
organisms, soil and water quality. The development of
synthetic pesticides has additionally resulted in
challenges related to pest resistance which further
complicates the drive towards improving yields.
Growers struggle against a variety of pests during the
crop season. Plant pathogens, for example, are
responsible for dramatic yield losses. The Crop Life
Foundation‟s 2005 study reviewed and endorsed by 38
commodity groups (including the National Cotton
Council and United Soybean Board) says if left
untreated, yields of most fruit and vegetable crops
would plunge 50 to 95 percent (Gianissi 2005). Weeds
and insect damage contribute to substantial impact on
crop losses. In early agricultural practices, fungicides
such as sulfur and copper were used to cope with plant
diseases. These products have been used for centuries
and are still heavily relied upon today. However, a step
change in approach was experienced with the
discovery of single site mode of action fungicides,
often with systemic properties. These highly potent
molecules provided exceptional disease control with
much lower use rates.
Unfortunately, the ever-evolving pathogen population
has been able to adapt to these new chemical classes
quickly because of their selective modes of action. It is
found that more recently developed chemical
fungicides also correlate with more rapid reports of
resistance in the field (adapted from Thind, 2011). One
of the greatest challenges to agriculture today is the
paucity of new active ingredients with new modes of
action unrelated to previously introduced chemistries.
Since the use of agrochemicals with single site modes
of action became widespread in the last fifty years, this
has become of greater and greater concern. In recent
years, interest in the use of biopesticides in
conventional agricultural practices, both by growers
and the agrichemical companies, has grown (Reiter
2011). Biopesticides are appealing for a number of
reasons. According to the EPA, biopesticides are
usually less toxic than conventional pesticides,
generally affect only the target pest and closely related
organisms, often are effective in very small quantities
and decompose quickly, and can greatly decrease the
use of conventional pesticides while crop yields remain
high. Growers and agrichemical companies also see
biopesticides as potentially important tools in their
efforts to stave off the development of pesticide
resistance. Biopesticides are often complex in their
activities and modes of action, offering new tools in
the quest to develop programs that can manage
resistance. For example, products based on the Bacillus
Subtilis strain QST 713, including Serenade ASO®
fungicide, Serenade Max® fungicide and Serenade
Soil® fungicide have been demonstrated to have
several modes of activity. These include complex
secondary metabolite profiles responsible for both anti-
fungal and anti-bacterial activity. Detailed studies of
the biophysical interaction of the lipopeptide class of
compounds produced by this strain have shown
complex membrane interactions (Patel et al. 2011).

International Journal of Scientific Research in Science and Technology (www.ijsrst.com)
201
These require somewhat greater application rates (as
high as 1% active ingredient) and may require frequent
reapplication when used out-of-doors. It is known that
these extracts contain Azadirachtin in Neem, Catechin
in Acacia catechu and Palmitic acid in Carica papaya.
The management efficacy of these compounds in
comparison to the chemical pesticides was also
remarkable and cost effective. Neem pesticides do not
leave any residue on the crop. They also work as
systemic pesticide; absorbed into the plant, transported
to all the tissues and are ingested by plant feeding
insects. Azadirachtin is considered nontoxic to
mammals, fish and pollinators, having low mammalian
toxicity with LD50 of>5000 mg/kg for rat. It is
classified by Environment Protection Agency (EPA) as
class IV. It is felt that none of the synthetic pesticides
developed so far has the excellent virtues of Neem in
pest management Thus, opens opportunity for their
commercialization on large scale without any adverse
effects on crop and soil.
V. ACKNOWLEDGMENT
We thank Dr. P.N. Chowdhary, Former Principal
Scientist, IARI, New Delhi, India and Dr. Seema
Bhadauria, Reader, Department of Botany, Raja
Balwant Singh College, Dr.B.R.A.University, Agra,
India for providing all related guidance for field,
lab/experiment work and all required support for
certification of statistics work related for this research
work.
VI. REFERENCES
[1]. Ali Arshad, Rizvi Parvez, Khan Farmanur
(2010). Bio-Efficacy Of Some Plant Leaf
Extracts Against Mustard Aphid, Lipaphis
erysimi Kalt. On Indian Mustard, Brassica
juncea. Journal of Plant Protection Research.
Volume 50, Issue 2, Pages 130–132
[2]. Armes NJ, Jadhav DR, Bond GS, King
ABS. (1992). Insecticide resistance in
Helicoverpa armigera in South India. – Pestic.
Sci. 34: 355-364.
[3]. Bhathal SS, Singh D, Dhillon RS, Nayyer
K(1993). Effect of AZT-VRK and some
commercial Neem products on development,
reproduction and mortality of mustard aphid,
Lipaphis erysimi. In: World Neem Conference
held at 24-28 Feb., 1993, Bangalore, 48 p.
[4]. Biswas GC (2013). Comparative Effectiveness
of Neem Extracts and Synthetic Organic
Insecticide against Mustard Aphid Bangladesh
J. Agril. Res. 38(2): 181-187
[5]. Bonnemaison L (1965). Insect pests of
crucifers and their control. A. Rev. Ent. 10:
233-256.
[6]. Casida J, Ouistad B (1998). Golden age of
insecticide research: Past, present, or Future.
Annu. Rev. Entomol. 43: 1–16.
[7]. Gianissi L (2005). Benefits of Fungicides,
Crop Life Foundation, Washington, USA.
[8]. Guan ZH, Wang S (1980). The influence of
the aphids (Lipaphis erysimi and Myzus
persicae) salvia on the infestation of TPMV
(turnip mosaic virus) on Chinese cabbage. Acta
Chem Sinica : 83-85
[9]. Kabir KH, Mia MD (1987). Effectiveness of
some indigenous pesticides as repellent against
mustard aphid (Lipaphis erysimi Kalt.).
Bangladesh J. Zool., 15 (1) : 87-88
[10]. King EG, Powell JE, Smith JW (1982). Prospects for utilization of parasites and
predators for management of Heliothis spp. – In:
Proceedings of the International Workshop in
Heliothis Management,15-20 November, 1981.
Eds. REED, W.& KUMBLE, V. Pattencheru,
India: ICRISAT: 103-122.
[11]. Knight SC, Anthony VM, Brady AM,
Greenland AJ, Heaney SP, Murray DC,
Powell KA, Schulz MA, Spinks CA,
Worthington PA, Youle D (1997). Rationale
and perspectives on the development of
fungicides. Annu. Rev. Phytopathol, 35:349–72.
[12]. Lal OP (1996). Bio-efficacy of some Neem
formulations against mustard aphid, Lipaphis
erysimi Kalt. on cabbage plants, In: National
symposium Towards Green and Sustainable
Pesticides held on 4-6, December 1996 at IARI,
New Delhi, pp 20-21
[13]. Mohan NJ, Krishnaiah K, Kumar NKK
(1981). Chemical control of mustard aphid,
Lipaphis erysimi Kalt and leaf webber,
Crocidolomia binotalis Zell. on cabbage.
Pesticides, 15 (2): 29-32.
[14]. Murthy KSR, Lakshminarayana K, Rao
BHK (1982). Dissipation of certain commonly
used insecticides from cauliflower. Pestology, 6:
21-26.
[15]. Nagarkatti S (1982): The utilization of
biological control in Heliothis management in
India. – In: Proceedings of the International
Workshop in Heliothis Management, 15-20
November, 1981. Eds. REED, W. & KUMBLE,
V. Pattencheru, India: ICRISAT: 159-167.
[16]. Nagarkatti S, Prakash A (1974). Rearing of
Heliothis armigera (Hub.) on the artificial diet.
Tech. Bull. Commonwealth Inst. Of Biol.
Control, Banglore, India. 17: 169-173.
[17]. Pandey ND; Singh L, Singh VP, Tripathi RA
(1987). Effect of certain plant extract against,

International Journal of Scientific Research in Science and Technology (www.ijsrst.com)
202
Lipaphis erysimi Kalt; under laboratory
conditions. Indian J. Ent., 49 (2) : 238-242
[18]. Patel et al (1996). Assessment of yield losses in
mustard (Brassica juncea l.) due to mustard
aphid (Lipaphis erysimi kalt.) under different
thermal environments in eastern central India.
In Applied ecology and environmental research
2(1): 1–15.
[19]. Patel H, Tscheka C, Edwards K, Karlsson G,
Heerklotz H (2011). All-or-none membrane
permeabilization by fengycin-type lipopeptides
from Bacillus subtilis QST 713. Biochim
Biophys Acta. 1808(8):2000–8.
[20]. Prasad SK, Phadke KG (1988). Population
dynamics of Lipaphis erysimi Kalt on Different
varieties of Brassica species. Indian J. Entomol.
42:54-63.
[21]. Reiter S (2011). A bumper year for biopestides,
Chemistry & Industry, Issue 3
[22]. Singh AK, Lal MN (2012). Bio-efficacy of
some plant leaf extracts against mustard aphid,
Lipaphis erysimi Kalt. on Brassica campertris.
Journal
[23]. Asian Journal of Bio Science 2012 Vol. 7 No. 2
pp. 159-162
[24]. Smil V (2004). Enriching the Earth: Fritz Haber,
Carl Bosch, and the Transformation of World
Food Production. Cambridge, MIT Press.
[25]. Sontakke BK, Dash AN (1996). Studies on the
effects of insecticides and neem formulation
against major pests of mustard and their safety
to honey bees. Indian Journal of Environment
and Toxicology, 6: 87-88
[26]. Thind TS (2011). Fungicide Resistance in Crop
Protection: Risk and Management. Thind, T.S.
ed. Cambridge, CABI press.
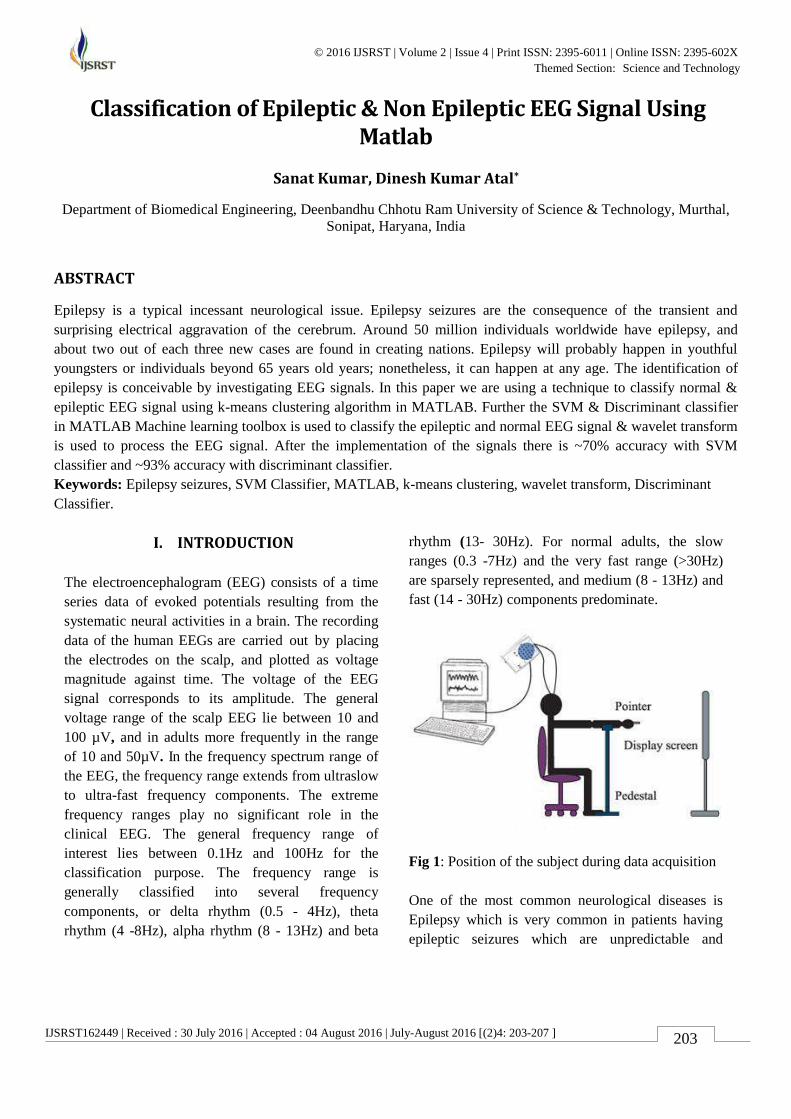
IJSRST162449 | Received : 30 July 2016 | Accepted : 04 August 2016 | July-August 2016 [(2)4: 203-207 ]
© 2016 IJSRST | Volume 2 | Issue 4 | Print ISSN: 2395-6011 | Online ISSN: 2395-602X Themed Section: Science and Technology
203
Classification of Epileptic & Non Epileptic EEG Signal Using Matlab
Sanat Kumar, Dinesh Kumar Atal*
Department of Biomedical Engineering, Deenbandhu Chhotu Ram University of Science & Technology, Murthal,
Sonipat, Haryana, India
ABSTRACT
Epilepsy is a typical incessant neurological issue. Epilepsy seizures are the consequence of the transient and
surprising electrical aggravation of the cerebrum. Around 50 million individuals worldwide have epilepsy, and
about two out of each three new cases are found in creating nations. Epilepsy will probably happen in youthful
youngsters or individuals beyond 65 years old years; nonetheless, it can happen at any age. The identification of
epilepsy is conceivable by investigating EEG signals. In this paper we are using a technique to classify normal &
epileptic EEG signal using k-means clustering algorithm in MATLAB. Further the SVM & Discriminant classifier
in MATLAB Machine learning toolbox is used to classify the epileptic and normal EEG signal & wavelet transform
is used to process the EEG signal. After the implementation of the signals there is ~70% accuracy with SVM
classifier and ~93% accuracy with discriminant classifier.
Keywords: Epilepsy seizures, SVM Classifier, MATLAB, k-means clustering, wavelet transform, Discriminant
Classifier.
I. INTRODUCTION
The electroencephalogram (EEG) consists of a time
series data of evoked potentials resulting from the
systematic neural activities in a brain. The recording
data of the human EEGs are carried out by placing
the electrodes on the scalp, and plotted as voltage
magnitude against time. The voltage of the EEG
signal corresponds to its amplitude. The general
voltage range of the scalp EEG lie between 10 and
100 µV, and in adults more frequently in the range
of 10 and 50µV. In the frequency spectrum range of
the EEG, the frequency range extends from ultraslow
to ultra-fast frequency components. The extreme
frequency ranges play no significant role in the
clinical EEG. The general frequency range of
interest lies between 0.1Hz and 100Hz for the
classification purpose. The frequency range is
generally classified into several frequency
components, or delta rhythm (0.5 - 4Hz), theta
rhythm (4 -8Hz), alpha rhythm (8 - 13Hz) and beta
rhythm (13- 30Hz). For normal adults, the slow
ranges (0.3 -7Hz) and the very fast range (>30Hz)
are sparsely represented, and medium (8 - 13Hz) and
fast (14 - 30Hz) components predominate.
Fig 1: Position of the subject during data acquisition
One of the most common neurological diseases is
Epilepsy which is very common in patients having
epileptic seizures which are unpredictable and

International Journal of Scientific Research in Science and Technology (www.ijsrst.com)
204
recurrent. To diagnose such disorder, EEGs or Scalp
are used clinically, also this can be detected by using
blood test. These signals can appear in many forms
like, spikes, poly-spikes and waves. Ictal (i.e. state
during epileptic seizure) EEG recordings are more
reliable in diagnosing epilepsy than interictal (i.e.
state between two epileptic seizures) recordings but
they are expensive and difficult to obtain in patients
with infrequent epileptic seizures.
Standard Frequency bands of the EEG signal
Most of EEG waves range from 0.5-500Hz, however
the following four frequency bands are clinically
relevant:
1. Delta waves: Delta waves frequency is up to 3 Hz.
It is slowest wave having highest amplitude. It is
dominant in infants up to one year and adults in
deep sleep.
2. Theta waves: It is a slow wave with frequency
range from 4 Hz to 7 Hz. It emerges with closing
of the eyes and with relaxation. It is normally
seen in young children and in adults.
3. Alpha waves: Alpha has frequency range from 7
Hz to 12 Hz. It is most commonly seen in adults.
Alpha activity occurs rhythmically on both sides
of the head. Alpha wave appears with closing
eyes (relaxation state) and disappears normally
with opening eyes/stress. It is treated as a normal
waveform.
4. Beta waves: Beta activity is fast with small
amplitude. It has frequency range from 14 Hz to
30 Hz. It is dominant in patients who are alert or
anxious or who have their eyes open. Beta waves
usually seen on both sides in symmetrical
distribution and is most evident frontally. It is a
normal rhythm and observed in all age groups.
These mostly appear in frontal and central portion
of the brain. The amplitude of the beta wave is
less than 30μV.
Figure 2. The five Frequency bands of normal EEG
Signal
II. METHODOLOGY
The main aim of this work is to analyse EEG signals
as epileptic or non-epileptic for the diagnosis of
Epilepsy by using machine learning algorithms. In
this, the signals which are epileptic in nature are
focused on ictal discharge and non-epileptic signals
are made up of normal and abnormal interictal
discharges. The algorithm used to achieve this is:
1. Extraction of EEG Signals and normalization of
the signal.
2. Extract statistical features to create a feature set.
3. Decompose the signal using wavelet
decomposition.
4. Reduce the number of features of the feature
set by using k-means Clustering to decrease
runtime.
5. Use the reduced feature set to train the Support
Vector Machine.
6. Compare the performance of the SVM
trained on original and reduced feature set to
separate epileptic from non-epileptic signals
on a test data set.
The proposed strategy utilizes MWT and Time and
frequency domain parameters and Machine learning
to characterize the EEG signal for epilepsy seizure
discovery. The underneath square graph demonstrates
stream of proposed procedure.

International Journal of Scientific Research in Science and Technology (www.ijsrst.com)
205
Figure 3. Flow chart for the Process
The EEG database is collected from Klinik for
Epileptologie, which provides free access to web to
large collections of recorded physiologic signals. EEG
signals are recorded with machines having sampling
frequency of 4090 Hz with 1000 samples/sec. This
data set contains the signals of 10 users of both
patients having epileptic seizures or non-epileptic
seizures. Each user contains 4090 sample values.
The EEG sign is changed over into ASCII arrange and
put away in the temp.txt record utilizing MAT to
ASCII converter. The yield of the converter is given
as a data to MWT, the mind sign is disintegrated and
the anomalies of the sign are dictated by utilizing the
T&F process. At that point the T&F yield is prepared
by utilizing Machine learning. The multi-wavelet
transform thought begins from the speculation of
scalar wavelets. Rather than one scaling capacity and
one wavelet, various scaling capacities and wavelets
are utilized. This prompts more level of opportunity
in developing wavelets. In this way contradicted to
scalar wavelets, properties, for example, smaller
backing, orthogonally, symmetry, vanishing minutes,
short backing can be accumulated all the while in
multi-wavelets.
In this T&F, MWT is utilized to separate the
components of EEG sign. The MWT utilizes
numerous scaling capacities and various wavelet
capacities. The vector documentation of scaling
capacity and wavelet capacity is as per the following.
( ) [ ( ) ( ) ( )]
( ) [ ( ) ( ) ( )]
Where, T is denoted as the vector response and n 1
is an integer. The wavelet relation of low pass filter
and high pass filter is as follows.
( ) √ ∑ ( )
( ) √ ∑ ( )
Where, Hk is the low pass filter coefficient and Gk is
the high pass filter coefficient. The initial basis
condition of scaling function and wavelet function is
given below.
( ) {
( ) {
These are the initial basis condition of scaling and
wavelet function of MWT.
The decomposition of MWT is calculated by using
the following formulas. The decomposition of low
frequency component is calculated as,
∑
The decomposition of high frequency component is
calculated as,
∑
Using the above two formulas, the decomposition of
MWT is calculated.
Model was created for identifying the most suitable
combination of dimensionality reduction technique
paired with SVM that gave the highest sensitivity and
specificity in classifying epileptic and non-epileptic
data.
EEG Signal
AAMI to ASCII
Time Frequenc
y
Wavelet
Transfor
MACHINE
LEARNING
TECHNIQUES
RESULT

International Journal of Scientific Research in Science and Technology (www.ijsrst.com)
206
III. RESULTS AND DISCUSSIONS
In this section a great amount of heed has been paid as
the entire research work deals with active results for
different EEG signals.
Ten different patients are taken for our existing
research work. In this research work a single patient
recording length is approximately 4090 samples,
recorded at a rate 1000 samples per second, for
duration of 4.9 seconds. In the advent of such
recordings it is important to analyze the time domain
representation of the signal in such cases. Figure 3
and 4 shows results of time domain waveforms as
given in the database for visualizing it with respect to
its mean.
Figure 4. Original non epileptic waveform showing
amplitude (µV) on y-axis and time(sec) on x-axis.
Figure 5. Epileptic waveforms measured for 1000
samples showing amplitude (µV) on y-axis and
time(sec) on x-axis.
Similarly visualizing waveforms evaluation will be
generated for both epileptic and non-epileptic signal
by applying fast fourier transform. Figure 6 and 7
shows a similar type of distinguished waveforms for
both signals.
Figure 6. EEG epileptic signal for frequency domain
visualization.
Figure 7: EEG non epileptic signal for frequency domain
Now it is most important for the current work to
introduce the classification technique which is of
utmost importance, when any arbitrary signal is given
in this then how much will be recognition score, so
most importantly there will be two different
techniques for complete work analysis, i.e. support
vector machine and discriminant analysis.
Table 1: Matching Score for two classification
techniques.
S.No Feature names Feature
classifier Score
1. T&F , wavlet SVM 70%
2. T&F , wavelet Discrminant 93%
IV. CONCLUSION
As per the work conducted in this paper the number
of observation taken was 10. Each observation as
EEG signal is composite signal of multiple
frequencies comprising 7200 samples. Similarly in a
similar manner the second important point is
complete analysis has been done in time and
frequency domain as well as wavelet transform has
been included as features. For individual signal three
time domain features were calculated one frequency

International Journal of Scientific Research in Science and Technology (www.ijsrst.com)
207
domain energy, and one level four decomposition has
been found. Later stage is a verification stage where
two different classifier has been used where first is
support vector machine the other is linear
discriminant analysis.
V. REFERENCES
[1] Sanei, S. & Chambers, J. A. EEG Signal Processing.
(Wiley, 2008).
[2] Subasi, A. & Ismail Gursoy, M. EEG signal
classification using PCA, ICA, LDA and support vector
machines. Expert Syst. Appl. 37, 8659–8666 (2010).
[3] Varsavsky, A., Mareels, I. & Cook, M. Epileptic
seizures and the EEG measurement, models, detection
and prediction. (CRC Press, 2011). at
<http://dx.doi.org/10.1201/b10459>
[4] Introduction to epilepsy. (Cambridge University Press,
2012).
[5] Hill, N. J. et al. Recording human electrocorticographic
(ECoG) signals for neuroscientific research and real-
time functional cortical mapping. J. Vis. Exp. JoVE
(2012). doi:10.3791/3993.
[6] Brain Basics: Know Your Brain: National Institute of
Neurological Disorders & Stroke(NINDS).
<http://www.ninds.nih.gov/disorders/brain_basics/know
_your_brain.htm>
[7] Acharya, U. R., Vinitha Sree, S., Swapna, G., Martis, R.
J. & Suri, J. S. Automated EEG analysis of epilepsy: A
review. Knowl.-Based Syst. 45, 147–165 (2013).
[8] Semmlow, J. L. Biosignal and Medical Image
Processing. (CRC Press, 2004).
[9] Tzanetakis, G., Essl, G. & Cook, P. Audio analysis using
the discrete wavelet transform. in Proc. Conf. in
Acoustics and Music Theory Applications (2001). at
http://masters.donntu.edu.ua/2010/fknt/prylepskyi/librar
y/tzanetakis.html
[10] Kandaswamy, A., Kumar, C. S., Ramanathan, R. P.,
Jayaraman, S. & Malmurugan, N. Neural classification
of lung sounds using wavelet coefficients. Comput. Biol.
Med. 34, 523– 537 (2004).
[11] Subasi, A. EEG signal classification using wavelet
feature extraction and a mixture of expert model. Expert
Syst. Appl. 32, 1084–1093 (2007).
[12] Principal Component Analysis 4 Dummies:
Eigenvectors, Eigenvalues and Dimension Reduction.
georgemdallas.
[13] Ng, A. CS229 Lecture notes: Principal Component
Analysis. CS229 Lect. Notes 1, (2000).
[14] Hyvärinen, A. & Oja, E. Independent component
analysis: algorithms and applications. Neural Netw. Off.
J. Int. Neural Netw. Soc. 13, 411–430 (2000).
[15] Fielding, A. H. Cluster and Classification Techniques
for the Biosciences. (Cambridge University Press, 2006).
[16] Ren, J. ANN vs. SVM: Which one performs better in
classification of MCCs in mammogram imaging.
Knowl.-Based Syst. 26, 144–153 (2012).
[17] Cristianini, N. & Shawe-Taylor, J. An Introduction to
Support Vector Machines and Other Kernel-based
Learning Methods. (Cambridge University Press, 2000).
[18] Hsu, C.-W., Chang, C.-C., Lin, C.-J. & others. A
practical guide to support vector classification. (2003)
[19] EEGLAB - Open Source Matlab Toolbox for
Electrophysiological Research. at
<http://sccn.ucsd.edu/eeglab/>
[20] Cardoso, J.-F. High-Order Contrasts for Independent
Component Analysis. Neural Comput. 157–192 (1999).
[21] Feature Transformation - MATLAB & Simulink.
[22] Blind source separation and Independent component
analysis. at <http://perso.telecom-
paristech.fr/~cardoso/guidesepsou.html>
[23] Klinik for Epileptologie at
<http://epileptologiebonn.de/cms/front_content.php?idca
t=193&lang=3&changelang=3>
[24] Sivasankari. N and K. Thanushkodi, "Automated
Epileptic Seizure Detection in EEG Signals Using Fast
ICA and Neural Network", International Journal
Advance. Soft Comput. Application, Vol.1, No.2, pp.91-
104, November 2009.
[25] Zhendong Mu, Dan Xiao and Jianfeng Hu,
"Classification of Motor Imagery EEG Signals Based on
Time–Frequency Analysis", International Journal of
Digital Content Technology and its Applications, Vol.3,
No.4, pp.116-119, December 2009.
[26] G.R. de Bruijne, P.C.W. Sommen and R.M. Aarts,
"Detection of Epileptic Seizures Through Audio
Classification", IFMBE Proceedings, Vol. 22, pp. 1450–
1454, 2008.
[27] Ganesan.M, Sumesh.E.P, Vidhyalavanya.R “Multi-
Stage, Multi-Resolution Method for Automatic”,
International Journal of Signal Processing, Image
Processing and Pattern Recognition, Vol 3, No 2, June,
2010.
[28] Ali Shoeb and john Guttag“Application of Machine
Learning To Epileptic Seizure Detection” Proceedings
of the 27th International Conference on Machine
Learning (ICML-10), June 21-24, 2010, Haifa, Israel.
Omnipress 2010, ISBN 978-1-60558-907-7
[29] Sharanreddy and Dr.P.K.Kulkarni“Literature Survey on
EEG based Automatic Diagnosis of Epilepsy seizures &
Brain Tumor using WT and ANN”, International
Conference on Biomedical Engineering (ICBME 2011),
Dec 10 - 12, 2011, Manipal, India.
[30] Sharanreddy and Dr.P.K.Kulkarni “Necessity for
Automated Analysis of EEG Signal for Detection of
Multiple Neurological Disorders,” International
Conference on Evolutionary Trends in Information
Technology (ICETIT 2012), Sep 15-17, 2012, VTU
Belgaum, India.
[31] Meenakshi sood,Vinay kumar and S V bhoosan
“Comaprison of Machine learning Methods for
prediction of epilepsy by neurophysiological EEG
signals,” International Journal of Pharma and
Biosciences, 2014 April.

IJSRST162443 | Received : 30 July 2016 | Accepted : 04 August 2016 | July-August 2016 [(2)4: 208-213]
© 2016 IJSRST | Volume 2 | Issue 4 | Print ISSN: 2395-6011 | Online ISSN: 2395-602X Themed Section: Science and Technology
208
Modular Neural Networks Chronicles in Biological Aspects Mohseena Thaseen
Department of computer science and information technology, Nanded Education Society‟s Science, Nanded Nanded,
Maharashtra, India
ABSTRACT
Modular Neural Network Is A One of The Model Of Artificial Neural Networks. This Manuscript Describes The
Urge Of Modular Neural Network (MNN) And How It Can Be Applied In The Biological Aspects, Since All The
Cell Functions Are Modular In Nature And Can Be Applied In All Most All Cell Structures And Function Through
The Connectionist Approach And The Weightless Logical Approach For Best Optimized Error.
Keywords : Modular Neural Network, Architechture, Evolutionary Approach, Connectionist Approach, Weightless
Logical Approach.
I. INTRODUCTION
As an artificial neural network is an information-
processing system that performs convinced features
on biological neural networks. Mathematical models
of cell functions can be accomplished by one of the
model of ANN i.e Modular neural networks. Modular
neural networking is the learning of networks of
flexible nodes interacting with other nodes /neurons
which are developed for generalization of neural
biology.
Our human body contains near about 100 trillion cells,
as cell is the basic structural, functional and biological
units with the help of this cell n number of system
runs in our body that is digestive system, endocrine
system, immune system lymphatic system nervous
system muscular system reproductive system skeletal
system respiratory system urinary system integument
system all this above system are computerized based
on the concept modularity.
II. METHODS AND MATERIAL
A. Modularity
Modularity is motivated by human body processes,
which involves a combination of serial and parallel
processing. Neuropsychologists study revealed that
the information processing system of humans is
focused particularly on a partly damaged brain. The
damage region of the brain has stopped implications
on the cognitive abilities which are situated in this
particular area. The non-damaged parts are still
working and its performance is improved to
compensate the loss in the other parts. These results
that the brain has a highly modular and parallel
structure
Modularity concept in the brain functioning results in
optimization of the information capacity in the brain
neural pathways. Since the brain consists of many
modules and some f the modules are repeating using
the feature of replication.
Modularity is the building block of Modular neural
network, this network is based on reverse
engineering2,3,4,5,6
Classification7
function
approximation, Iteration , Unsupervised clustering and
mathematical modeling. The basic concept depends on
replication and decomposition ,since replication
provide reusing phenomenon through which once a
module is created and can replicates many modules in
architecture. We observe in living organisms, our
hands legs and even hairs can be replicated by module
created once and decomposition feature provided will
rearrange the modules depending of its functionality
as cells function depends on integration of this
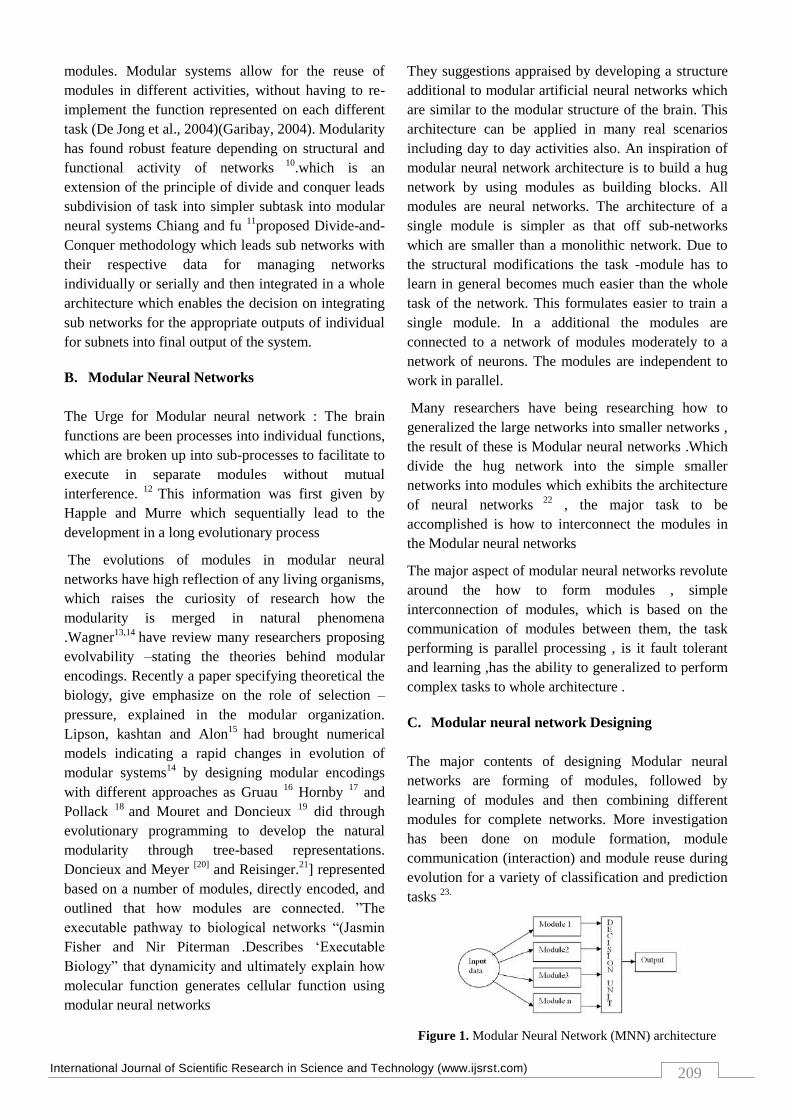
International Journal of Scientific Research in Science and Technology (www.ijsrst.com)
209
modules. Modular systems allow for the reuse of
modules in different activities, without having to re-
implement the function represented on each different
task (De Jong et al., 2004)(Garibay, 2004). Modularity
has found robust feature depending on structural and
functional activity of networks 10
.which is an
extension of the principle of divide and conquer leads
subdivision of task into simpler subtask into modular
neural systems Chiang and fu 11
proposed Divide-and-
Conquer methodology which leads sub networks with
their respective data for managing networks
individually or serially and then integrated in a whole
architecture which enables the decision on integrating
sub networks for the appropriate outputs of individual
for subnets into final output of the system.
B. Modular Neural Networks
The Urge for Modular neural network : The brain
functions are been processes into individual functions,
which are broken up into sub-processes to facilitate to
execute in separate modules without mutual
interference. 12
This information was first given by
Happle and Murre which sequentially lead to the
development in a long evolutionary process
The evolutions of modules in modular neural
networks have high reflection of any living organisms,
which raises the curiosity of research how the
modularity is merged in natural phenomena
.Wagner13,14
have review many researchers proposing
evolvability –stating the theories behind modular
encodings. Recently a paper specifying theoretical the
biology, give emphasize on the role of selection –
pressure, explained in the modular organization.
Lipson, kashtan and Alon15
had brought numerical
models indicating a rapid changes in evolution of
modular systems14
by designing modular encodings
with different approaches as Gruau 16
Hornby 17
and
Pollack 18
and Mouret and Doncieux 19
did through
evolutionary programming to develop the natural
modularity through tree-based representations.
Doncieux and Meyer [20]
and Reisinger.21
] represented
based on a number of modules, directly encoded, and
outlined that how modules are connected. ”The
executable pathway to biological networks “(Jasmin
Fisher and Nir Piterman .Describes „Executable
Biology” that dynamicity and ultimately explain how
molecular function generates cellular function using
modular neural networks
They suggestions appraised by developing a structure
additional to modular artificial neural networks which
are similar to the modular structure of the brain. This
architecture can be applied in many real scenarios
including day to day activities also. An inspiration of
modular neural network architecture is to build a hug
network by using modules as building blocks. All
modules are neural networks. The architecture of a
single module is simpler as that off sub-networks
which are smaller than a monolithic network. Due to
the structural modifications the task -module has to
learn in general becomes much easier than the whole
task of the network. This formulates easier to train a
single module. In a additional the modules are
connected to a network of modules moderately to a
network of neurons. The modules are independent to
work in parallel.
Many researchers have being researching how to
generalized the large networks into smaller networks ,
the result of these is Modular neural networks .Which
divide the hug network into the simple smaller
networks into modules which exhibits the architecture
of neural networks 22
, the major task to be
accomplished is how to interconnect the modules in
the Modular neural networks
The major aspect of modular neural networks revolute
around the how to form modules , simple
interconnection of modules, which is based on the
communication of modules between them, the task
performing is parallel processing , is it fault tolerant
and learning ,has the ability to generalized to perform
complex tasks to whole architecture .
C. Modular neural network Designing
The major contents of designing Modular neural
networks are forming of modules, followed by
learning of modules and then combining different
modules for complete networks. More investigation
has been done on module formation, module
communication (interaction) and module reuse during
evolution for a variety of classification and prediction
tasks 23.
Figure 1. Modular Neural Network (MNN) architecture

International Journal of Scientific Research in Science and Technology (www.ijsrst.com)
210
D. Modular Neural Network Designing
Requirement
Modular neural network design starts with the analysis
of problem to be solved, according to the approaches.
Basically there are two major 1. The Connectionist
Approach and 2.The Weightless Logical Approach
Connectionist Approach
Connectionist approach is applicable to neural
computing where a simple processors, known as
neurons are interconnected to form biological nervous
structure .Here the training is provided to solve the
problem rather than programming .This approach was
inspired by psychologist and biologist .A hug
contribution was provided by MC CulloCh49
and Pitts 50
, Heb 51
and Rosenblatt 52
for parallel and
interconnection of neural networks. Training and
learning is applied to this architecture
Weightless Approach
These approach provides logic to neural computing,
here the data is stored as part of patterns .In this
approach the neural network has no weights , due to
which the training is done fast and learning algorithm
is extremely simple but this approach doesn‟t support
biological and psychological model.
Figure 2. Modular Neural Network (MNN) design
III. RESULT AND DISCUSSION
A. Modular Neural Network Designing
Requirement
Modular neural network first proposed by Jacobs,
Jordan, Nowlan and Hinton 24,26,27,28
, It mainly deals
with what type of architecture should be used for
formation of module ( i.e Task decomposition )
depending on the input/output relation of a particular
problem , it does have any specific technique for it.
Naturally it can be attained, mostly used architecture
are (MLP,LNN,SOM,ART1,ART2) describes that the
complex problems is solved by dividing it into simpler
problems through “Divide and Conquer” algorithms
by Chiang and Fu 25
is applicable to the architecture
built out of sub networks able to manages a subsets of
the data and depending on its Modularizing learning
,the relevance task is decomposed and distributed over
sub-task separated in modules deals with
determination of the number and size of individual
module in the Modular neural network(MNN).
Decomposing of classification task entails clustering
(grouping)and then a separate classifier can be applied
to all groups. Finally the integration engine that
determines which is According this algorithms it
states that the connections between nodes, called
weights, carry activation levels from one neuron to
another or to itself. According to the interconnection
scheme used for a neural network, it can be
categorized as (feed-forward, recurrent) and the
integration Engine is trained to determine to which
module should be considered.
Modular neural networks –Modules are connected to a
network of modules rather than to a network of
neurons. The modules are independent to work in
parallel. For this modular approach it is always
necessary to have a control system to enable the
modules to work together in a useful way through
Training algorithm for increasing ability to
generalize the network.
Define abbreviations and acronyms the first time they
are used in the text, even after they have been defined
in the abstract. Abbreviations such as IEEE, SI, MKS,
CGS, sc, dc, and rms do not have to be defined. Do
not use abbreviations in the title or heads unless they
are unavoidable.
B. Design Structure
Figure 3. Modular Neural Network (MNN) design structure

International Journal of Scientific Research in Science and Technology (www.ijsrst.com)
211
Formation of Modules
The first step in designing MNN is formation of
modules or Task decomposition, here the input data is
naturally defined in a module .As it has to undergo the
feasibility by training and learning phenomena to
reduce error. Ishi describes the learning for modular
structured networks ,that overcomes the problem of
training hug networks
Combining of modules
Integration of module is very important task to be
performed
Figure 4. Modular Neural Network (MNN) design
structure
Modular neural networks are inspired by biological
concepts, which is simulates through defined
architectures. Basically to solve complex problems
ensemble-based and modular 29, 30 was
introduced .In ensemble architecture, the neural
networks can be formed with arbitrarily unstable set
of initial weights, with different topologies followed
by training 31, 32, this architecture is applicable in the
field of classification, function approximate and
learning mechanism 33, 34, 35, 36 through boosting
algorithm is been used 37, 38 more enforces is given
to initial weights varying with varying topology of
training data set of neural network .The main
advantage of using this architecture was linear
combination of the outputs of the particular sub-neural
network(39, 40, 41, 42, 43, 44, 45, 46, 47, 48)the
result of these combination is distribution .Another
architecture, which uses both supervised and
unsupervised learning in sequential order is
Decoupled modules architecture 53.In this
architecture first stage, an adaptive resonant theory
(ART) network was proposed by G. Bartfei 59, here
the input data is decomposed into its inherent clusters
in an unsupervised way as once the input data is
classified in a each module .Individual modules is
learned and then trained in parallel using supervised
learning .There is no communication between
modules results in input –output model
VII. EVOLUTIONARY APPROACH TO THE DESIGN OF
MODULAR ARCHITECTURES:
This approach is applicable to biological fields ,give
rise to diversity at every level of biological functions
.Here are some of the architecture inspire by
evolutionary approach for Modular neural
network(MNN)
.
Figure 5. Some Examples of Modular Architectures
IV. CONCLUSION
The proposed MNN model has inconsistent advanced
performance when the network topology is chosen
optimally. However, the proposed MNN model has a
drawback at some point of time. The connections
between the modules depend upon the architecture,
although it initializes to positive values at the
beginning of the training phase, can change the output
considering the desired output of the whole network.
This problem can be resolved by an introduction of a
more robust learning algorithm which ensures that the
training algorithm [54, 55, 56, 57, 58]can reduce the
error of particular model execution without respect of
working parallel or sequentially.
V. REFERENCES
[1] MICHAEL W. EYSENCK. Principles of
Cognitive Psychology. LEA. Hove 1993.
[2] E. Micheli-Tzanakou 1987, \A neural
networkmodel of the vertebrate retina," in 9th
Ann. Conf.IEEE Engineering in Medicine and
Biology Society (Boston, MA, USA), November
13{16.

International Journal of Scientific Research in Science and Technology (www.ijsrst.com)
212
[3] K. Cave, J. Rueckl and S. Kosslyn 1989, \Why
arewhat and where processed by separate cortical
visualsystems? A computational investigation,"J.
Cognitive Neuroscience1(2), 171{186.
[4] B. Happel and J. Murre 1994, \Design and
evolution of modular neural network
architectures,"Neural Networks7(6/7), 895{1004.
[5] T. Brashers-Krug, Reza Shadmehr and E.
Todorov1994, \Catastrophic interference in human
motorlearning," inNeural Info. Proc. Syst. { Nat.
Synth.(Denver, USA), pp. 18{26.
[6] I. Otto, E. Guigon and Y. Burnod 1990,
\Cooperation between temporal and parietal
networks for invariant recognition," inProc. Int.
Neural NetworkConf., Vol. 1 (Paris, France), pp.
480{483.
[7] P. Mundkur and U. Desai 1991, \Automatic target
recognition using image and network
decomposition," in1991 IEEE Int. Joint Conf.
Neural Networks(Singapore), pp. 281-286..
[8] D. Jimenez 1997, \Locating anatomical landmarks
for prosthetics design using ensemble neural
networks," inIEEE Int. Conf. Neural Net-works
(ICNN97), Vol. 1 (Houston, Texas, USA),pp. 81-
85.
[9] J.A.G. Nijhuis, A. Broersma en L. Spaanenburg,
“A modular neural network classifier for the
recognition of occluded characters in automatic
license plate reading”, to be presented at
FLINS‟02 (Gent, September 2002).
[10] LAURENE FAUSETT. Fundamentals of Neural
Networks. Arichtectures, Algorithms, and
Applications. Prentice-Hall. New Jersey 1994.
[11] BART L.M. HAPPEL & JACOB M.J. MURRE.
Design and Evolution of Modular Neural
Architectures. Neural Networks, Vol. 7, No. 6/7,
Pages 985-1004. 1994.
[12] G. P. Wagner, J. Mezey, and R. Calabretta,
“Natural selection and the origin of modules,” in
Modularity: Understanding the Development and
Evolution of Natural Complex Systems, W.
Callebaut and D. Rasskin-Gutman, Eds. MIT
Press, 2005.
[13] H. Lipson, J. Pollack, and N. Suh, “On the origin
of modular variation,” Evolution, vol. 56, no. 8,
pp. 1549–1556, 2002.
[14] Kashtan and U. Alon, “Spontaneous evolution of
modularity and network motifs,” Proceedings of
the National Academy of Sciences, vol. 102, no.
39, pp. 13 773–13 778, 2005.
[15] F. Gruau, “Automatic definition of modular neural
networks,” Adaptive Behaviour, vol. 3, no. 2, pp.
151–183, 1995.
[16] G. Hornby and J. Pollack, “Creating high-level
components with a generative representation for
body-brain evolution,” Artificial Life, vol. 8, no.
3, pp. 223–246, 2002.
[17] J.-B. Mouret and S. Doncieux, “Mennag: a
modular, regular and hierarchical encoding for
neural-networks based on attribute grammars,”
Evolutionary Intelligence, pp. 187–207, 2008.
[18] S. Doncieux and J.-A. Meyer, “Evolving modular
neural networks to solve challenging control
problems,” in Proceedings of the Fourth
International ICSC Symposium on engineering of
intelligent systems (EIS 2004), 2004
[19] Fisher J, Henzinger TA. Executable cell biology.
Nat Biotechnol 2007;25:1239–49.
[20] Spaanenburg, L., Jansen, W.J. and Nijhuis, J.A.G.
(1997), “Over multiple ruleblocks to modular
nets,” Proceedings Euromicro’97, pp. 698-705.
[21] Spaanenburg, L. (2000), “Knowledge fusion in
modular neural networks,” Proceedings of the
NC2000, pp. 356-362.
[22] Evolving modular neural-networks through
exaptation Jean-Baptiste Mouret St´ephane
Doncieux
[23] R. A. Jacobs, M. I. Jordan, S. J. Nowlan and G. E.
Hinton, "Adaptive Mixtures of Local Experts",
Neural Computation, vol. 3, pp. 79-87, 1991.
[24] CHENG-CHIN CHIANG AND HSIN-CHIA
FU.Divide-and-conquer methodology for modular
supervised neural network design. In: Proceedings
of the 1994 IEEE International Conference on
Neural Networks. Part 1 (of 7). Pages 119-124.
Orlando, FL, USA 1994.
[25] M. I. Jordan and R. A. Jacobs. A competitive
modular connectionist architecture. In Advances in
Neural Information Processing Systems 3, pages
767–773, San Maeto, CA, 1991. Morgan
Kaufmann Publisher Inc.
[26] D. N. Osherson, S. Weinstein, and M. Stoli.
Modular learning. Computational Neuroscience,
pages 369–377, 1990.
[27] M. I. Jordan and R. A. Jacobs. Task
decomposition through competition in a modular
connectionist architecture: The what and where
vision tasks. Cognitive Science, 15:219– 250,
1991.
[28] Haykins Simon. Neural Networks, A
comprehensive Foundation. Macmillan College
Publishing Company, New York, NY, 1994.
[29] A. J. Sharkey. On combining artificial neural
networks. Connection Science, 8(3& 4):299–313,
1996.

International Journal of Scientific Research in Science and Technology (www.ijsrst.com)
213
[30] A. J. Sharkey. On combining artificial neural
networks. Connection Science, 8(3& 4):299– 313,
1996.
[31] A. J. Sharkey. Modularity, combining and
artificial nueral nets. Connection Science, 9(1):3–
10, 1997.
[32] N. J. Nilsson. Learning Machines: Foundations of
Trainable Pattern-Classifying Systems. McGraw
Hill, New York, 1965.
[33] R. Clemen. Combining forecasts: A review and
annotated bibliography. International Journal of
Forecasting, 5:559–583, 1989.
[34] J. A. Barnett. Computational methods for a
mathematical theory of evidence. In Proceedings
of IFCAI, pages 868–875, 1981.
[35] C. W. J. Granger. Combining forecasts-twenty
years later. International Journal of Forecasting,
8, 1989.
[36] D. Hartline 1988, \Models for simulation of real
neural networks, in Int. Neural Network Soc.
(INNS) First Ann. Meeting (Boston, USA), p. 256.
[37] D. Gray, A. Michel and W. Porod 1988,
\Application of neural networks to sorting
problems," in Int. Neural Network Soc. (INNS)
First Ann. Meeting (Boston, USA), p. 441.
[38] Y. Anzai and T. Shimada 1988, \Modular neural
networks for shape and/or location recognition," in
Int. Neural Network Soc. (INNS) First Ann.
Meeting (Boston, USA), p. 158.39. R. E. Schapire.
Strength of weak learners. Machine Learnability,
5:197–227, 1990.
[39] Y. Freund and R. Y. Schapire. Experiments with a
new boosting algorithm. In Machine Learning:
Proceedings of the Thirteenth International
Conference, pages 148–156, 1996.
[40] R. A. Jacobs. Methods of combining experts‟
probability assessments. Neural
Computation,7:867–888, 1995.
[41] L. Xu, A. Krzyzak, and C. Y. Suen. Methods of
combining multiple classifiers and their
applications to handwriting recognition. IEEE
Transactions on Systems, Man and Cybernetics,
22:418–435, 1992.
[42] S. Hashem and B. Schmeiser. Approximating a
function and its derivatives using mseoptimal
linear combination of trained neural networks. In
Proceedings of the World Congress on Neural
Netwroks, volume 1, pages 617–620, 1993.
[43] M. Perrone and L. N. Cooper. When networks
disagree: Ensemble methods for hybrid neural
networks. In Neural Networks for Speech and
Image Processing. Chapman and Hall, London,
1993.
[44] L. K. Hansen and P. Salamon. Neural networks
ensembles. IEEE Transactions on Pattern
Analysis ans Machine Intelligence, 12:993–1000,
1990.
[45] K. Al-Ghoneim and V. Kumar. Learning ranks
with neural networks. In Applications and Science
of Artificial Neural Networks, Proceedings of the
SPIE, volume 2492, pages 446–464, 1995.
[46] G Rogova. Combining results of several neural
network classifiers. Neural Networks, 7:771–781,
1994.
[47] D. H. Wolpert. Stacked generalization. Neural
Networks, 5:241–259, 1992.
[48] L. Breiman. Bagging predictors. Machine
Learning, 24:123–140, 1996.
[49] L. MUI, A. AGARWAL, A. GUPTA, P. SHEN-
PEI WANG. An Adaptive Modular Neural
Network with Application to Unconstrained
Character Recognition. In: International Journal of
Pattern Recognition and Artificial Intelligence,
Vol. 8, No. 5, Pages 1189-1204. October 1994.
[50] D. O. HEBB The Organization of Behavior. John
Wiley & Sons. New York 1949.
[51] F. ROSENBLATT The Perceptron: a Probabilistic
Model for Information Storage and Organization
in the Brain. In: Psychological Review, Vol. 65.
Pages 386-408. 1958
[52] G. Auda and M. Kamel. Modular neural networks
classifiers: A comparative study. Journal of
Intelligent and Robotic Systems, 21:117–129,
1998.
[53] G. Bartfei. Hierarchical clustering with art neural
networks. In World Congress on Computational
Intelligence, volume 2, pages 940–944, Florida,
USA, 1994.
[54] J. Kivinen and M. K. Warmuth. Exponentiated
gradient versus gradient descent for linear
predictors. Information and Computation,
132(1):1–63, 1997.
[55] B. N. Cesa. Analysis of two gradient-based
algorithms for on-line regression. JournaL of
Computer and System Sciences, 59(3):392–411,
1999.
[56] D. Precup and R. S. Sutton. Exponentiated
gradient methods for reinforcement learning. In
Proceedings of the 14th International Conference
on Machine Learning, pages 272–277.Morgan
Kaufmann, 1997.
[57] A. Waibel, H. Sawai, and K. Shikano. Modularity
and scaling in large phonemic neural networks.
IEEE Transactions on Acoustics, Speech, and
Signal Processing, 37(12):1888–97, December
1989.

IJSRST162440 | Received : 29 July 2016 | Accepted : 08 August 2016 | July-August-2016 [(2)4: 214-221]
© 2016 IJSRST | Volume 2 | Issue 4 | Print ISSN: 2395-6011 | Online ISSN: 2395-602X Themed Section: Science and Technology
214
Using Concept Mapping to Remediate Chemistry Teacher Trainees’
Understanding of Chemical Phenomena – Before and After Hanson R., Kwarteng T. A.
Faculty of Science Education, University of Education, Winneba, Ghana
ABSTRACT
Researchers have shown interest in how beginning chemistry teacher trainees can improve on their technological
pedagogical content knowledge so as to be able to engage their students in concept-based and reflective activities.
This is a task that trainees have to build up on their own by first mastering their content knowledge. This article
focuses on 29 first year teacher trainees’ understanding of chemical phenomena and how their understanding could
be improved through concept mapping. An intervention was designed to enhance their basic conceptions upon
which other concepts could be built. We analysed concept maps on linkages of periodic properties and how they
affect chemical bonding. Their submissions were analysed based on three categories of conceptual understanding.
The results showed that their levels of conception improved after the concept mapping intervention.
Keywords: Alternative Conceptions, Chemical Phenomena, Periodicity, Teacher Trainees.
I. INTRODUCTION
Chemistry is a discipline that enables students to
develop acceptable ideas about the world in which they
live. However, naïve, alternative, or wrong ideas, often
called misconceptions could also be developed instead
in a variety of ways. Wesson (2001) explained that when
new information arrives in the cerebral cortex for
analysis, the brain attempts to match each component
with previously stored memory elements on the existing
neural network and then files the new data by making
connections to the old. If new information does not fit a
learner’s established pattern of thinking, they
unconsciously or consciously refashion it to somehow fit
their existing mental model. Thus, misconceptions are
unknowingly created and reinforced upon faulty
reasoning. Such misconceptions could be compounded
when linkages are formed to yet other misconstrued or
inaccurate ideas and further carried on from one
generation to another- thus, creating a vicious cycle of
misconceptions. The longer a misconception remains
unchallenged, the more likely it is to become entrenched.
Misconceptions are of considerable importance and
cannot be ignored in the learning process since prior
conceptions are foundations upon which knowledge is
built (Pine, Messer & John, 2001).
Students’ unscientific beliefs can influence them to have
misconceptions in their learning processes. These beliefs
can persist as lingering suspicions in their minds and
hinder further learning. Students must therefore confront
their own beliefs along with their associated paradoxes
and limitations and then attempt to reconstruct the
knowledge necessary to understand the scientific model
being presented (Hanson, 2015). According to Gooding
and Metz (2011), this process requires that teachers:
Identify students' misconceptions
Provide a forum for students to confront their
misconceptions, and
Help students reconstruct and internalize their
knowledge, based on scientific models.
If meaningful learning does not occur, rote learning
takes precedence. According to Clark, Nguyen and
Sweller (2006) cognitive load could also lead to rote
learning and subsequently, the formation of erroneous
concepts. A consequence of rote learning is that new
material is merely memorized, easily forgotten and not
transferred (Bretz, 2001). Science educators must
therefore improve their skills in such a way that students’
misconceptions can be identified and addressed during
teaching. Gooding and Metz (2011) stated that teachers

International Journal of Scientific Research in Science and Technology (www.ijsrst.com)
215
should focus not just on repairing that which is broken,
but also on preventive measures to help students avoid
misconceptions from occurring.
Chemistry is one of the most important branches of
science, but has been regarded as a difficult discipline by
young students and some educators (Haider & Naqabi,
2008). The reasons for the said difficulties vary from the
abstract nature of many chemical concepts to the
difficulty level of the language of chemistry (Ozem,
2004). Besides the identified abstract nature, words from
everyday language such as force, pressure and energy,
with different meanings in the world of science, pose
relational and interpretative problems for students during
lessons (Taber, 2002). Such misconceptions constitute a
major problem of concern to science educators,
scientists, researchers, and students (Taber & Tan, 2011).
Thus, this makes the identification of students’
understandings and misconceptions an important area of
research. Some of the conceptual areas in which most
studies have been conducted have been on elements,
compounds, and mixtures (Papageorgiou & Sakka,
2000), acids and bases (Boz, 2009), chemical
stoichiometry (Haider & Al Naqabi, 2008) and chemical
bonding (Ozmen, Demircioglu, & Demircioglu, 2009).
Although vernacular and factual misconceptions can
often be easily corrected, even by the students
themselves, it is not advised that teachers insist that
learners dismiss preconceived notions and ingrained
non-scientific beliefs without attending to the type or
source of misconception. This must be done
systematically and professionally. Recent research on
students' conceptual misunderstandings of natural
phenomena indicate that new concepts cannot be learned
if alternative models that explain a phenomenon already
exist in their minds (Hanson, Twumasi, & Antwi, 2015;
Supasorn, 2015). Although scientists commonly view
such erroneous models with disdain, they are often
preferred by the learner because they seem more
reasonable and perhaps more useful for the learner's
purpose. Too often, teachers’ zeal to get the right
answers from students overshadows the efforts and
implications behind students’ own analysis to answers,
especially if the student is wholly wrong. Incorrect
answers are simply dismissed, instead of identifying the
type of conception and seeing it as an opportunity for
reflection, conceptual teaching and change (Gooding &
Metz, 2011). Prior assessment of what students already
know is thus a critical component of curriculum change
and design which cannot be underestimated (Holme, et
al., 2010; Singer, Nielsen, & Scweingruber, 2012).
Tools for students’ knowledge structure
In order to assess what students know, which is a critical
component of curriculum change, chemistry education
researchers use a variety of diagnostic tools to uncover
students’ original, naïve, alternative, or prior conceptual
understanding. A few of the diagnostic methods include
think-aloud interviews (Cheung, 2009), concept
inventories (Barbera, 2013; McClary & Bretz, 2012),
conceptual text (Sevgi, Nurdane, Yezdan, Ayla, &
Oktay, 2009) and concept mapping (Lopez, Shavelson,
Nandagopal, Szu, & Penn, 2014; Greene, Lubin, &
Walden, 2013). Two-tiered and four-tiered test items
have also been used to identify students’ own
conceptions (Taber & Tan, 2011).This study will
employ concept mapping to remediate and enhance
teacher trainees’ understanding about chemical
phenomenon.
According to Nikita, Burrows and Suazette (2015),
concept maps give teachers insight into students’ ‘whole’
knowledge structures and allow them to pinpoint
specific gaps in their mental structures. Studies
conducted by Lopez, Shavelson, Nandagopal, Szu, and
Penn (2014) and Szu, Nandagopal, Shavelson, Lopez,
Penn, Scharberg and Hill (2011), have demonstrated that
concept maps can be used to represent students’ mental
models or knowledge structures in organic chemistry.
Specifically, their studies showed that concept map
scores were correlated with scores on problem sets and
final course grades. They also found that students’
knowledge structures measured by concept maps were
indicators of success in organic chemistry. Hanson,
Twumasi and Antwi (2015), found that teacher trainees
who could not provide appropriate links between science
concepts had low assessment scores. They thus
developed a concept test to scientifically assess their
understanding of chemical phenomenon. Twelve (12)
major misconceptions were identified in that study. They
recommended that teachers assess the validity of their
students’ prior understanding of basic science concepts
before teaching advanced topics that would require the
application of those prior basic concepts. This suggests
International Journal of Scientific Research in Science and Technology (www.ijsrst.com)
216
that educators of the sciences could improve teaching
and learning of science by ensuring that misconceptions
identified during teaching and evaluation exercises are
addressed. In this current study, an in-depth study into
trainees’ conceptions about further work on chemical
phenomena was carried out. This was because the level
of the trainees’ mastery of elementary concepts such as
electronegativity, ionization energy, shielding effect,
polarizability, effective nuclear charge and their linkages
required for advanced studies on chemical phenomena
was low.
Concept mapping is an ideal tool for assessing the depth
and breadth of students’ knowledge structures. It can
indicate how students organize information into logical
frameworks and allows teachers to visualise how
students relate concepts to each other (Wheeldon &
Faubert, 2009). Several studies have established the
validity and utility of concept maps as an evaluation tool
(Lopez et al., 2011).
Basically, concept maps are graphical tools used to
organise and represent an individual’s mental model or
knowledge structure as they create relationships between
a single concept and others in the same category in the
form of propositions (Novak & Canas, 2006). It is a two-
dimensional schema that illustrates mutual correlation or
inter-conceptual relationships in graphics and help
students to learn in a more meaningful way by relating
old ideas to new ones in their minds. This kind of
organisation prevents the formation of misconceptions
and results in the identification of relationships. In this
way, learning becomes more meaningful to students.
Concept maps consist of three components – concept
terms, linking arrows, and linking phrases. The linking
arrows provide a directional relationship between two
concepts while the linking phrases (words linking
concepts) represent the specific relationships between at
least two concepts. In chemistry studies, this could lead
to the improvement of deductive, critical, analytical and
reflective thinking skills, which are paramount to
enhance gains in cognition.
Aim of Study
This study was a follow up to an earlier one on chemical
phenomena (Hanson, Twumasi, & Antwi, 2015) in
which teacher trainees’ understanding about some basic
chemical principles were assessed. A number of
alternative conceptions about chemical phenomena were
identified. The purpose of this current study was to use
concept mapping to determine the trainees’ conceptions
after a treatment process related to bonding and
applications of some periodic trends through concept
mapping.
Research Questions
i. What conceptions do students have about the
applications of periodic parameters?
ii. What improvements are evident in students’
conceptions about chemical phenomena after
using concept maps?
iii. How useful are concept tools as an innovative
conceptual change strategy?
II. METHODS AND MATERIAL
Research Design
This was a case study which employed an intervention
to solve an identified problem in three phases. Thus,
concept mapping was used as a conceptual change tool
to re-uncover the knowledge structure of teacher trainees
before (pre-map) and after they had gone through a
treatment period (post-map). Twenty one (21) chemistry
undergraduate teacher trainees from the University of
Education participated in the study. Pre- and post-
intervention concept maps were constructed by trainees
to enable the researchers identify new conceptions
gained by them after the treatment period.
To begin with, the trainees were encouraged to use
concept mapping or flow diagrams to illustrate how 14
terms on periodic properties (given to them) connected
with each other to explain the concept of reactivity
among group one elements. These terms were taken
from their course text (Tro, 2010; McMurry, 2007). A
20-minute hands-on tutorial on how to construct concept
maps was given to the trainees, prior to the construction
of their mapping, so that they could all begin work with
the innovative strategy from a common work level. They
were encouraged to use extra terms which had not been
supplied, if required. They were then given 60 minutes
to complete their concept mapping, after which their
constructed maps were assessed and scored by two
trained chemistry senior lecturers of the Department of

International Journal of Scientific Research in Science and Technology (www.ijsrst.com)
217
Chemistry, University of Education, Winneba.
Adjustments were made to the treatment designs
(lessons) based on a review of the trainees’ submissions.
After the analysis of the pre-concept maps three lessons
on periodicity were taught in which the researchers
employed concept mapping. These treatment lessons
became necessary as they were meant to address trainees’
identified misconceptions from their pre-concept maps.
After this treatment period, they were given an exercise
akin to the pre-concept mapping assessment. These
were also assessed using the same scoring mode as for
the pre-concept maps.
Data Analysis
Concept Maps
The concept maps were scored by the trained researchers
using the following four-level scale proposed by Lopez,
Shavelson, Nandagopal, Szu and Penn (2014) and Szu
(2011). They proposed the following scoring codes: 0 –
incorrect or scientifically irrelevant, 1 – partially
incorrect, 2 – correct but scientifically ‘thin’ (i.e.
technically correct but answers are too general and/or
vague), and 3 – scientifically correct and precisely stated.
Each proposition in the concept map was therefore given
a score between 0 and 3, according to the grading scale.
The scores of pre- and post-map were compared and the
percentages of trainees who scored between 0 – 1.4, 1.5
– 2.4 and 2.5 – 3.0 were grouped under descriptions of
alternate conception (AC), partial conception (PC) and
correct conception (CC) respectively. This was done to
comparatively assess trainees’ revised conceptual
frameworks and gains after the treatment. According to
Wang and Barrow (2013) identification of levels of
conceptions for different group of students clarifies how
they explain and reason when asked to work with
targeted concepts. A typical concept map is presented as
Appendix A.
III. RESULT AND DISCUSSION
The results of the pre- and post-maps have been presented as Table 1.
Table 1 : Level of trainees’ performance in the pre-and post-concept mapping
CONCEPT
PRE-MAPS (%) POST-MAPS (%) Overall gains (Themes)
AC PC CC AC PC CC AC PC CC
Bond strength & temperature 51.3 32.1 16.6 20.1 48.0 31.9 0.64 0.23 0.18
Strength of hydrogen bond 25.5 51.0 23.5 21.0 35.5 43.5 0.06 0.32 0.26
Effect of nuclear charge on size 31.4 38.0 30.6 21.5 30.3 51.2 0.14 0.12 0.30
Electronegativity within groups 28.0 60.3 11.7 4.9 21.9 85.1 0.32 0.97 0.83
Strengths of bases within groups 20.2 51.4 28.4 15.0 36.4 48.6 0.07 0.31 0.28
Factors that affect lattice energy 53.5 26.3 20.2 31.5 36.0 32.5 0.47 0.13 0.15
Heat of hydration 42.1 30.5 27.4 34.0 33.2 32.8 0.14 0.04 0.07
Concept of electronegativity 36.7 55.6 7.7 15 37 48.0 0.34 0.42 0.44
Type of Bond 35.4 52.5 12.1 18 26.3 55.7 0.27 0.55 0.50
From Table 1, it is observed that moderate and high
gains were made in the concepts about relating bong
strength and temperature, the concept of
electronegativity and how it affects elements within
groups, and types of bonds. Not much gains were made
in students’ understanding about hydrogen bonding, the

International Journal of Scientific Research in Science and Technology (www.ijsrst.com)
218
effect of nuclear charge on sizes of atoms, and heat of
hydration. In all there were six (6) thematic conceptual
gains and five (5) partial conceptual gains, out of a total
of nine (9) themes.
Bond strength and temperature
After treatment, there was an increase in the percentage
of trainees (16.6% to 31.9%) who were able to give
conceptual explanation to bond strength and temperature.
The percentage of trainees who demonstrated alternate
and partial responses in the post-map was 20.1% and
48.0% respectively. They had difficulty in arranging
types of bonds in terms of their strength and could not
predict bonds that might have high boiling or melting
point.
Strength of hydrogen bond
The percentage of trainees who made logical
constructions increased from 23.5% to 43.5%. Most of
the partial answers did not show linkages of hydrogen
bonds to electronegative elements like nitrogen and
oxygen. Such concept maps indicated that trainees had
difficulty in identifying compounds which contained
hydrogen bonds. Most of them perceived that all
compounds containing hydrogen have hydrogen bond,
such that a H2 molecule was associated with hydrogen
bonding.
The effect of nuclear charge on size
An increase in percentage of correct linkages rose from
30.6% to 51.2% due to trainees’ ability to use more
correct linking words. Majority were able to relate
atomic size to nuclear effect. A few had difficulty in
comparing ionic radii and so failed to identify and
arrange isoelectronic species. Some also demonstrated
alternative conceptions as they inked nuclear charge to
the charge on atoms. All trainees correctly mapped that
nuclear charge increased across the period.
Electronegativity within groups
The percentage of trainees who had correct propositions
and links rose from 11.7% to 85.1% after treatment. This
indicates that most of the trainees who had alternate and
partial conceptions in their pre-maps reached correct
conceptions through the treatment and were able to link
correct propositions to explain the trend of
electronegativity within groups. Few trainees with
partial conceptions linked the trend of electronegativity
to either nuclear charge or screening and shielding effect
but not both.
Strengths of bases within groups
Only 48.6% constructed good maps about the trend of
basicity of elements within a group and across a period
with 36.4% and 15.0% showing partial and alternate
conception respectively. The trainees had difficulties in
comparing the basic strengths of elements in a period
and within groups. Most of them intimated that basicity
increased with electronegativity across the group and
from bottom to the top within a group.
Factors that affect lattice energy
The percentage of trainees with correct conception
increased marginally, from 31.2 to 32.5%. Results
indicated that they had difficulties in stating and
explaining factors that affect lattice energy. About 36%
of trainees who were able to associate lattice energy to
ionic charge and size of an ion could not give proper
reasons for their decisions. The remaining 31.5% were
those who had either wrong linkages or could not
provide any at all.
Concept of electronegativity
The percentages of trainees who demonstrated alternate,
partial and correct conceptions were about 15%, 37%
and 48% respectively. It appears that majority of
trainees could not reach full conception even after
treatment. The concept-maps showed that they had
difficulty on the concept of electronegativity which
would require further treatment through other strategies.
Trainees who gave alternate conceptions considered
polarity as a type of bond but not an additional
characteristic of bonding. Most of those who
demonstrated partial conception could not give specific
examples of polar and non-polar covalent bonds. A few
however, were able to relate the essence of
electronegativity values to bond polarity.
Type of bond
It was found that 55.7% of the trainees gained scientific
understanding after treatment while 18% and 26.3%
indicated alternative and partial conceptions respectively.
Most of them could state, explain and give examples of
types of bonds. For instance, a trainee linked ionic bond

International Journal of Scientific Research in Science and Technology (www.ijsrst.com)
219
to bonds that occur in opposite charges but later
indicated that the octet rule was the sole reason for bond
formation. Metallic bonding was the least used term.
Some major findings were that:
1. Analysis of constructed maps revealed that, trainees
used a lot of invalid prepositions and unlinked
conceptions in the pre-map than in the post-map.
2. Some trainees stuck to their old beliefs and wouldn’t
let go, but majority acquired scientific conceptions
as the naïve conceptions disappeared from their
post-maps
3. There was very little demonstration about
knowledge of metallic bonding.
4. Participants were able to use more scientific terms
and constructed more logical linkages with
propositions given to them than in their pre-maps.
5. Most trainees who demonstrated partial conception
lacked the knowledge to expand responses to
phenomena.
The purpose of the study was for students to use concept
mapping to express their conception of chemical
phenomenon after they had gone through a 21 day
treatment period. Results after treatment indicated that
concept mapping was useful and revealed differences in
conceptual frameworks between trainees with high and
low levels of content knowledge, and pinpointed some
key ideas lacking in their frameworks. There were
increases in the percentages of trainees who gave correct
responses in the post mapping. This happened because
their content knowledge and skills for constructing
concept maps were heightened during the treatment
period. This enabled them to use more understandable
concepts to form valid propositions. The use of concept
maps enabled the researchers to evaluate trainees’ own
mental models and identified essential concepts that
needed to be stressed to bridge learners’ understandings
to advanced levels (Nikita & Suazette, 2015). Findings
from the study are consistent with that by Mustafa and
Murset (2013) that concept mapping addresses different
forms of learning and individual differences between
students. The validity and utility of concept maps were
verified in this study as intimated by (Lopez, Shavelson,
Nandagopal, Szu, & Penn, 2014; Greene, Lubin, &
Walden, 2013). There was however, an apparent lack of
knowledge about metallic bonding which was quite
strange and will require further remediation.
IV. CONCLUSION
The depth and breadth of trainees’ knowledge structures
were easy to diagnose through concept mapping.
Findings showed the importance of using diagnostic
tools, especially concept mapping, to enable trainees to
relate current concept to explain chemical phenomenon.
Nahum, Mamlok-Naaman and Taber (2010) confirm
that learning about chemical bonding allows the learner
to make predictions, and give explanations, about
physical and chemical properties of substances. Science
educators must ensure that misconceptions of students
are addressed to enhance effective learning of science
(Greene, Lubin, & Walden, 2013).
V. ACKNOWLEDGEMENT
The authors wish to acknowledge the immense
contributions of trainees who participated in this study.
VI. REFERENCES
[1]. Barbera, J. (2013). A psychometric analysis of the
chemical concepts inventory. Journal of Chemical
Education, 90(5), 546-553.
[2]. Bretz, S. L. (2001). Novak's theory of education:
Human constructivism and meaningful learning.
Journal of Chemical Education, 78(8), 1107-1109.
[3]. Cheung, D. (2009). Using think-aloud protocols to
investigate secondary school chemistry teachers'
misconceptions about chemical equilibrium.
Chemical Education Research and Practice, 10,
97-108.
[4]. Clark, R. C., Nguyen, F., & Sweller, J. (2006).
Efficiency in learning: Evidence-based guidelines
to manage cognitive load. San Francisco: Pfeiffer.
[5]. Gooding, J., & Metz, B. (2011). From
misconceptions to conceptual change. The Science
Teacher, 34-37.
[6]. Greene, B., Lubin, I., & Walden, S. (2013).
Mapping changes in science teachers' content
knowledge: Concept maps and authentic
professional development. International Journal
of Science Education, 1, 1-13.
[7]. Haider, A. H., & Al Naqabi, C. A. (2008). Emirati
high school students' understandings of
stoichiometry and the influence of metacognition

International Journal of Scientific Research in Science and Technology (www.ijsrst.com)
220
on their understanding. Research in Science and
Technological Education, 26(2), 215-237.
[8]. Hanson, R. (2015). Identifying students'
alternative concepts in basic chemical bonding- a
case study of teacher-trainees in the University of
Education, Winneba. International Journal of
Innovative Research and Development, 4(1), 115-
122.
[9]. Hanson, R., & Acquah, S. (2014). Enhancing
conceptual understanding through the use of
microchemistry equipment and collaborative
activities. Journal of Education and Practice,
5(12), 120-130.
[10]. Hanson, R., Twumasi, A. K., & Antwi, V. (2015).
Undergraduate chemistry teacher trainees'
understanding of chemical phenomena. European
Journal of Basic and Applied Sciences, 2(3), 8-14.
[11]. Holme, T., Bretz, S. L., Cooper, M., Lewis, J.,
Paek, P., Pienta, N., . . . Towns, M. (2010).
Enhancing the role of assessment in curriculum
reform in chemistry. Chemical Education
Research and Practice, 11(2), 92-97.
[12]. Lopez, E. J., Shavelson, R. J., Nandagopal, K.,
Szu, E., & Penn, J. (2014). Factors contributing to
problem-solving performance in first semester
organic chemistry. Journal of Chemical
Education, 91(7), 976-981.
[13]. McClary, L. M., & Bretz, S. L. (2012).
Development and assessment of a diagnostic tool
to identify organic chemistry students' alternative
conceptions related to acid strength. International
Journal of Science Education, 34(15), 2317-2341.
[14]. McMurry, J. (2007). Organic Chemistry. Boston:
Cengage Learning.
[15]. Mustafa, K., & Murset, C. (2013). Concept maps
as a tool for meaningful learning and teaching in
chemistry education. International Journal on
New Trends in Education and Their Implications,
4(4), 10-15.
[16]. Nahum, T., Mamlok-Naaman, R., Hofstein, A., &
Taber, K. S. (2010). Teaching and learning the
concept of chemical bonding. Studies in Science
Education, 46(2), 179-207.
[17]. Nikita, L. B., & Suazette, R. M. (2015). Using
concept mapping to uncover students' knowledge
structures of chemical bonding concepts. Journal
of Chemistry Education Research and Practice,
16, 53-66.
[18]. Novak, J. D., & Canas, A. J. (2006). The theory
underlying concept maps and how to construct
and use them. Florida: Florida Institute for Human
and Machine Cognition.
[19]. Ozem, H. (2004). Some student misconceptions in
chemistry: A literature review of chemical
bonding. Journal of Science Education and
Technology, 13(2), 23-29.
[20]. Ozmen, H., Demircioglu, H., & Demircioglu, G.
(2009). The effects of conceptual change texts
accompanied with animations on overcoming 11th
grade students' alternative conceptions of chemical
bonding. Computers and Education, 23(3), 681-
695.
[21]. Papageorgiou, G., & Sakka, D. (2000). Primary
school teachers' views on fundamental chemical
concepts. Chemistry Education Research and
Practice in Europe, 1(2), 237-247.
[22]. Pine, K., Messer, D., & John, K. (2001). Chidren's
misconceptions in primary: A survey of teachers'
views. Research in Science & Technological
Education, 19(1), 79-96.
[23]. Ruiz-Primo, M. A., Schultz, S. E., Li, M., &
Shavelson, R. J. (2001). Comparison of the
reliability and validity of scores from two concept
mapping techniques. Journal of Research in
Science Teaching, 38(2), 260-278.
[24]. Sevgi, A., Nurdane, A., Yezdan, B., Ayla, C. D.,
& Oktay, B. (2009). The contribution of
constructivist instruction accompanied by
conceptual understanding of chemistry in the
laboratory course. Journal of Science Education
and Technology, 18, 518-534.
[25]. Singer, S. R., Nielsen, N. R., & Scweingruber, H.
A. (2012). Discipline-based education research.
Kluwer: National Academic Press.
[26]. Supasorn, S. (2015). Grade 12 students'
conceptual understanding and mental models of
galvanic cells before and after learning by using
small-scale experiments in conjunction wiyh a
model kit. Chemical Education Research and
Practice, 16, 393-407.
[27]. Szu, E., Nandagopal, K., Shavelson, R. J., Lopez,
E. J., Penn, J. H., Scharbeng, M., & Hill, G. W.
(2011). Understanding academic performance in
organic chemistry. Journal of Chemical
Education, 88(9), 1238-1242.

International Journal of Scientific Research in Science and Technology (www.ijsrst.com)
221
[28]. Taber, K. (2002). Chemical misconceptions-
Prevention, diagnosis and cure. Volume 1:
Theoretical background. London: Royal Society
of Chemistry.
[29]. Taber, K. S., & Tan, K. C. (2011). The insidious
nature of 'hard core' alternative conceptions:
Implications for the constructivists research
programme of patterns in high school students'
and pre-service teachers' thinking about ionisation
energy. International Journal of Science
Education, 33(2), 259-297.
[30]. Tro, N. J. (2010). Principles of chemistry: A
molecular approach. New York: Prentice Hall.
[31]. Wang, C. Y., & Barrow. (2013). Exploring
conceptual frameworks of models of atomic
structures and periodic variations, chemical
bonding, and molecular shape and polarity: A
comparison of undergraduate general chemistry
students with high and low levels of content
knowledge. Chemistry Education research and
Practice, 130-146.
[32]. Wesson, K. (2001). What recent brain research
tells us about learning. Independent School, 61(1),
58-69.
[33]. Wheeldon, J. P., & Faubert, J. (2009). Framing
experience: Concept maps, mind maps, and data
collection in quantitative research. International
Journal of Qualitative Methods, 8(3), 52-67.
Appendix A : Example of Concept Map on Periodic Trends

IJSRST162454 | Received : 06 August 2016 | Accepted : 11 August 2016 | July-August 2016 [(2)4: 222-231]
© 2016 IJSRST | Volume 2 | Issue 4 | Print ISSN: 2395-6011 | Online ISSN: 2395-602X Themed Section: Science and Technology
222
Forest Fires Model and SIR Model Used in Spread of Ebola Virus in Prediction and Prevention
Ning ZHANG*1, Jing TANG2
*1College of Information Science and Engineering, Shandong University of Science and Technology, Qingdao, Shandong, China 2College of Information Science and Engineering, Shandong University of Science and Technology, Qingdao, Shandong, China
ABSTRACT
Ebola has been repeatedly ravaged Earth. Since the end of 2013, Ebola swept West Africa, has caused tens of
thousands of people infected or death. Based on this, it is an effective way to establish an effective, workable,
practical significance of the mathematical model for health care workers and researchers to help in the fight against
the Ebola epidemic. We base on assumptions of population stability in West Africa, the epidemic is no longer
continue to expand, the drug can effectively reaches the hands of the patient once it put in; By SIR model, the most
classic model in infectious disease, and published data, we realize the epidemic prediction. And base on them, by
using forest fires model of cellular automata and two-compartment model of pharmacokinetic, we analyze and
forecast three aspects for Vaccine/drug Efficacy, Epidemic Area, Vaccine/drug Production and R&D Speed. We
propose drug distribution points in West Africa should be in accordance with changes by the strength of the
Epidemic area, and drug development should begin at the growth of the epidemic stage 1/3, and 1/2 of the growth of
the epidemic stage clinical trials in order to achieve the best results. Although limited ability, we analyze factors
with a single control and then propose solution. But we built the best model out.
Keywords: Ebola Virus Disease, Eradicating Ebola Epidemic, SIR Model, Forest-Fire Model, Two-Compartment
Model, Epidemic Prevention
I. INTRODUCTION
Ebola Virus Disease (EVD) is a human disease, which is
caused by the Ebola Virus (EBOV). EVD first appeared
in Central Africa Zaire (which is Democratic Republic
of Congo now) and South Sudan in 1976. After that,
EBOV has outbreak around 24 times in Central Africa,
all of these happened in remote areas away from the
local city. Ebola mortality rate of 90%, the incubation
period of infection ranging from 2 to 21 days. In the
early stages of the disease, Ebola virus may not be
highly contagious, so people don't be infected even they
touch patient in this period. As the disease progresses,
the body fluid from the patient will be excluded with a
high degree of biological risk. Also, Ebola Virus is
usually transmitted through blood and other body fluids.
Fortunately, there is no confirmation that it can spread
by air to anyone. [1, 2, 3, 4]
Figure 1: Ebola virus epidemic in West Africa (Since 30 Nov
2014) [6]
The spread of Ebola virus is an infectious disease
problem. In the field of mathematical modelling has
been a lot of research about it. The SIR model is more
complete one. SIR model by establishing a set of
differential equations, as a general propagation
mechanism establish a centralized model. We will select
the number of confirmed cases which published by the
World Health Organization (WHO) for the

International Journal of Scientific Research in Science and Technology (www.ijsrst.com)
223
establishment of SIR model. We choose West Africa as
the main research district of Ebola virus infection. It is
well known cases of Ebola virus infection in Liberia,
Sierra Leone and Guinea, such as the three countries are
becoming the focus of attention. [1, 2, 5, 6, 8]
In addition, we choose Forest Fires model to research
about any of possible factors which can affect the Ebola
outbreak. By using Forest Fires model of Cellular
Automata, we can analogy the patient to the ignition
point. And effective cure meaning Firemen
extinguishing, and the optimal solution is what we want.
First of all, we need to conduct a diagnostic population
in Ebola epidemic area, determine the epidemic stricken
area and the epidemic situation by SIR model. Then, we
discuss the theory on three aspects of Vaccine/Drug
Efficacy, Epidemic Area, Vaccine/Drug Production and
R&D Speed. Finally, through the establishment of
Forest Fires model to put forward a reasonable and
effective solution for Ebola epidemic.
II. ASSUMPTIONS
For an effective cure model, we require if a district
spent 42 days and found no new cases, we can
declare the end of Ebola virus outbreak, which is an
effective cure program. Here, 42 days showing the
twice than Ebola maximum incubation period (21
days). And this 42 days period from anyone in the
country with confirmed or probable cases of Ebola
appeared last contact date since the beginning.
For Ebola epidemic control has many factors, here,
we select the greatest impact in three factors:
Vaccine/Drug Efficacy, Epidemic Area,
Vaccine/Drug Production and R&D Speed, as
considerations for the relevant modeling and design.
Cure patients have immunity, after that no longer
suffer Ebola anymore.
The incubation period is obtained from virus
infection to the onset of symptoms in the time
interval, it lasts 2 to 21 days. When the patient
began showing symptoms, he/she is contagious.
In each model, is not considered drug loss during
transport.
Because Ebola epidemic has been controlled
effectively, so we will not discuss uncontrolled, no
latency infection model.
III. SYMBOL DESCRIPTION
In the section, we use some symbols for constructing the
model as follows.
Table 1: The Description and Explanation of Symbol in
this Paper
Symbol Description
( )S t Susceptible group people per unit time
( )I t Incidence group people per unit time
( )R t Exit group people per unit time
( )E t Latent group people per unit time
Week Contact Rate Constant
Rescue Rate/ The speed of each ambulance
personnel
0 ( )f t The rate of administration
1 The speed of production of medicines
,M N Constant coefficient
Ps: Other symbols instructions will be given in the text.
IV. PREPARED MODEL ABOUT EBOLA
OUTBREAK
4.1 Model in Non-considering Latency
4.1.1 Assumption
1) In the period of Ebola Virus spreads, the total
number of people within West Africa for N
unchanged, Neither consider life and death, nor
migration, the crowd divided into four groups:
Susceptible S , Incidence I and Exit R (including
those who died and recovery). In the time t , These
three types of people in the proportion of the total
number of people are ( ), ( ), ( )S t I t R t .
2) The growth rate with time of ( )I t and ( )S t are
proportional. The constant of proportionality is .
The speed of reduce the number of patients is
directly proportional to the total number of patients.
The constant of proportionality is . Cure patients
have immunity, after that no longer suffer Ebola
anymore.
3) The sum of ( ), ( ), ( )S t I t R t is a constant 1.

International Journal of Scientific Research in Science and Technology (www.ijsrst.com)
224
4.1.2 Constitution
Here is the West African Ebola epidemic WHO
confirmed the number of cases; we pick up some days in
the whole chart:
Table 2: West African Ebola epidemic WHO confirmed
the number of cases [2]
DATE CASES DEATHS
13-May 245 164
20-May 270 181
27-May 309 200
4-Jun 354 208
11-Jun 438 231
18-Jun 528 337
25-Jun 599 338
2-Jul 759 467
9-Jul 888 539
16-Jul 1048 632
21-Jul 1201 672
28-Jul 1440 826
4-Aug 1711 932
11-Aug 1975 1069
18-Aug 2473 1350
25-Aug 3069 1552
1-Sep 3707 1848
8-Sep 4366 2177
15-Sep 5339 2586
22-Sep 6574 3043
29-Sep 7192 3286
6-Oct 8386 3988
Susceptible people become patient after effective contact
with other patient. Set ( )S t as the number of
susceptible people contact effective to patient per day.
The patients with number of ( )NI t can make
( ) ( )S t NI t susceptible people become latent virus
people. So we can conclusion as:
( )( ) ( )
dS tS t I t
dt
(1)
And the change of Exit in unit of time is equal to
reducing the incidence as follows:
( )( )
dR tI t
dt
(2)
The change of incidence is equal to the part of
susceptible-in, we can express as:
( )( ) ( ) ( )
dI tS t I t I t
dt
(3)
We define the healthy people are 0S and the patients are
0R at the start time. And set 0 0R
.
4.1.3 Solution
The equations (1), (2), (3) cannot find out the analytical
solution, so we set a new variable , which is equal
/ .
So, we can solute the equation as follows:
0 0
0
1( ) ln
si s i s
s
(4)
Now, we are analysis of the change of the
( ), ( ), ( )S t I t R t as follow:
1) Whatever 0 0,S R, patients will be disappear, its
0i .
2) The proportion of heathy people who don’t be
infected at the last time is s , and it’s
0 0
0
1( ) ln 0
ss i s
s
root in (0,1/ ) .
3) If 0 1/s , then at first beginning: ( )i t will be
increase first. When 0 1/s , ( )i t reach the
maximum, then ( )i t decrease and tends to zero,
and ( )s t monotone decreasing to s .
4) If 0 1/s , then ( )i t monotone decreasing to
five, and ( )s t monotone decreasing to s .
We found that the people health level is higher, the
smaller weekly contact rate gets; and medical level is
higher, on the higher cure rate, and the is smaller. So
improve the level of health and medical level can
prevent infectious diseases from spreading.

International Journal of Scientific Research in Science and Technology (www.ijsrst.com)
225
We can combine with the specific situation of West
Africa and assumptions analysis as follows:
According to the obtained data to draw a West African
Ebola prevalence curves and cure number change curve:
Figure 2: The number of patients change chart
Figure 3: The number of cure (including death) people
change chart
According to the figure, Ebola virus shows the form of
spread in West Africa, which is now, belongs to the case
of 0/ 1/ s . From the range of assumptions, we
can know between 1400~1600. Now we take
=1600, it shows 0/ (1/ )s = 1600. In other
words, the average number of West African cure for a
maximum is 1600 people per week; this is different from
the data released by World Health Organization. If that,
the number of cure people in 30-Sep is 1600*23=36,800;
this is far away from the actual situation. The reason of
this problem has the following several aspects:
Firstly, the average number of each patient’s weekly
effective contact estimate is smaller. It’s not a direct
relationship simply; it should be a multiple party
relationship, even exponential relationship.
Secondly, West African Ebola epidemic data from WHO
has hysteresis.
Thirdly, 0 0s may not be set up in West Africa. We
can put those strong, pay attention to their personal
health people are excluded.
4.2 Model in Considering Latency
4.2.1 Assumption
1) In the period of Ebola Virus spreads, the total
number of people within West Africa for N
unchanged, Neither consider life and death, nor
migration, the crowd divided into four groups:
Susceptible S , Latent E , Incidence I and Exit
R (including those who died and recovery). In the
time t , These four types of people in the proportion
of the total number of people are
( ), ( ), ( ), ( )S t E t I t R t .
2) The average number of effective contacts for each
patient weekly is , we can call Weekly Contact
Rate. When infected people and susceptible people
make effective contact, the susceptible one will
change into the latent group. And the latent crowd
converted into patient group later again, patient
group be cured.
4.2.2 Constitution
Susceptible contact patients effectively and be
incubation. Let ( ) ( )t S t be a weekly average number of
effective contact susceptible of each patient. The number
of ( )NI t patients can make number of ( ) ( ) ( )t S t NI t
susceptible become latent group per week. So we have
an equation as follow:
( )( ) ( ) ( )
dS tN t S t NI t
dt
(5)
The simplification as follow:
( )( ) ( ) ( )
dS tt S t I t
dt
(6)

International Journal of Scientific Research in Science and Technology (www.ijsrst.com)
226
The latent group change is equal to the transfer number
of susceptible group minus a transfer number of patients.
So the equation is
( )( ) ( ) ( ) ( ) ( )
dE tt S t I t t E t
dt
(7)
Among them, ( )t says the latency weekly morbidity,
each latent average effective number of patients.
The change for Exit group in unit time is equal to
patients decrease. The equation is ( )
( ) ( )dR t
t I tdt
(8)
Wherein ( )t represent Week Withdrawal Rate, the
number of average effective condition of each patient
recover or death.
Changes in incidence of people are equal to the number
of people into the latent. The equation is
( )( ) ( ) ( ) ( )
dI tt E t t I t
dt
(9)
And
( ) ( ) ( ) 1S t I t R t (10)
The initial time susceptible group, infected group and
recover immune group are 0 0 0 0 0( 0), ( 0), 0s s i i r .
4.2.3 Solution
The incubation period is obtained from virus infection to
the onset of symptoms in the time interval; it lasts 2 to
21 days. When the patient began showing symptoms,
he/she is contagious. Because the incubation period of
group cannot be determined, so they can be regarded as
part of a susceptible group. Therefore, the solving
process is same as non-considering latency.
V. MODEL BASED ON FACTORS & PREPARED
MODEL AS ABOVE
5.1 Vaccine/Drug Efficacy
5.1.1 Assumption
For the efficacy of the drug in the human body, we will
be distributed in the human body which to build a two-
compartment model. Use differential equation model
describing the dynamic characteristics. In order to
further simplify the problem, to obtain linear equations
with constant coefficients, the following assumptions are:
1) The body is divided into the central compartment
(Compartment I) and peripheral compartment
(Compartment II), the volume of the two chambers
(i.e. blood volume or volume of drug distribution)
remains unchanged in the process.
2) Drugs transfer rate from a compartment to another
and vitro rate to the exclusion, is proportional to the
plasma concentration of the chamber.
3) Only the central compartment exchange drug with
vitro that is drug from the vitro into the central , and
finally excreted from the central compartment.
Compared with the number of metastatic and
exclusion, absorption of the drug can be ignored.
5.1.2 Constitution
According to the model assumptions, and make a
schematic diagram of a two-compartment model:
Figure 4: A schematic diagram of a two-compartment
model
Where ( ), ( ), ( )i i ic t x t V t denote compartment of i ( 1,2i )
plasma concentration, dose and volume. 12k and 21k is the
rate coefficient of drug transfer between the two
compartments. 13k is the excluded rate coefficient of the
drug from the Compartment I to the vitro. 0 ( )f t is the rate
of administration.
According to the assumptions and Figure 4 can write the
dosage volume of two compartments 1 2( ), ( )x t x t . 1( )x t
satisfies the differential equation of the rate of change is
combine with transfer Compartment I to II 12 1k x ,

International Journal of Scientific Research in Science and Technology (www.ijsrst.com)
227
Compartment I exclude to vitro 13 1k x , transfer
Compartment II to I 21 2k x and Administration 0 ( )f t . 2 ( )x t
satisfies the differential equation of the rate of change is
combine with transfer Compartment I to II 12 1k x and
transfer Compartment II to I 21 2k x . So here we give
equations as follow:
1 12 1 13 1 21 2 0
2 12 1 21 2
( ) ( )
( )
x t k x k x k x f t
x t k x k x
(11)
( )ix t and plasma concentration ( )ic t , is clearly the
relationship between the atrioventricular volume ( )iV t .
So, here is the equation:
( ) ( ), 1,2i i ix t V c t i (12)
Equation (12) assignment equation (11) can be given:
021 12 13 1 21 2
1 1
12 12 1 21 2
2
( )( ) ( )
( )
f tVc t k k c k c
V V
Vc t k c k c
V
(13)
We can get the general solutions as follow:
t - t
1 1 1
t - t
2 2 2
( ) +N e
( ) +N e
c t M e
c t M e
(14)
Among them, the equations are established as follow:
12 21 13
21 13
k k k
k k
(15)
5.1.3 Solution
Taking into account the Ebola virus infection commonly
used method of administration; here we give two
methods as the following:
1) Rapid intravenous injection
Setting the rate of administration 0 ( )f t, in this condition,
we can make the model simply at t = 0, the
instantaneous drug dose 0D input central compartment,
immediately rose to 0 1D V. So we can get equations:
00 1 2
1
( ) 0, (0) , (0) 0D
f t c cV
(16)
Solution of equations (13) (16) can be obtained:
0 21 0 211
1 1
0 122
2
( ) ( )( ) , ,
( ) ( )
( ) ( )( )
t t
t t
D k D kc t Me Ne M N
V V
D kc t e e
V
(17)
So, as above, we can conclude:
Equation shows a rapid intravenous injection model.
While in clinical trials, the people who infected with
Ebola virus immune responses were damaged. And
currently developed drugs for human use, either ZMapp,
TKM-Ebola or JK-05, requires repeated dosing in order
to maintain effective plasma concentrations during
treatment. Based on this, we fixed a dosing interval, an
interval of every treatment administered, modeling
impulsive differential equations. But this is beyond our
ability, and then we will fight with Ebola by other
modeling tools.
2) Constant rate infusion
When intravenous infusion at a rate of constant 0k, set
dosing rate 0 ( )f t, the initial condition is
0 0 1 2( ) , (0) 0, (0) 0f t k c c (18)
Solution of equations (13) (18) can be obtained: 0 12 0
1 1 1 2 2 2
13 1 21 13 2
1 12 13 1 12 132 1 2 1
21 2 21 2
( ) , ( )
( ) ( ),
t t t tk k kc t M e N e c t M e N e
k V k k V
V k k V k kM M N N
k V k V
(19)
So, as above, we can conclude:
When t is large enough, 1 2( ), ( )c t c t will tend to 3
rd of
equations (19), the right side represents a constant value.
In fact, after the infusion is stopped if t T (T is the
time when stopping injection or infusion), then
1 2( ), ( )c t c t exponentially decays to zero after t T .
Derived from human infections EBOV valid data
obtained, was acquired immunity in fatal and non-fatal
cases, significantly different. This implies that the
acquired immunity in EBOV infection important role.
Study of survivors showed the body to produce specific
IgM antibody was 2 days after the attack, after 5 ~ 8
days to produce specific IgG antibodies. In contrast, in
fatal cases, only 30% of patients were detected low
levels of specific IgM, and specific IgG is not detected.
In the early days after the onset of symptoms appearing
acquired immune response can have a major impact on
patient survival; survivor after EBOV infection occurs
early inflammatory response supported this
conclusion.[10,11,12]

International Journal of Scientific Research in Science and Technology (www.ijsrst.com)
228
5.2 Epidemic Area
5.2.1 Analysis
Rescue progress generally proportional to the range of
the virus infection, but the infection scope of the
outbreak of Ebola virus, and treatment time are required
to cure, and treatment time depends on the number and
speed of drug delivery, the drug in the shortest possible
time delivery of more treatment sooner. Rescue costs
and the number of delivery of both drug-related, but also
with the duration of drug delivery related. Setting time
0t for Ebola outbreak start, begin rescue work time
for 1t t, the rescue is completed in time for 2t t
. Set
time t with affected by the Ebola virus area range is
1( )B t, After the affected areas by Ebola is 2( )B t
. To do
rough statistics for the area affected by the Ebola virus:
Figure 5: Rough statistics for the area affected by the
Ebola virus [6]
Figure 6: Ebola outbreak in 2014 and the cumulative
infections and deaths has evolved [6]
(It is easy to see that it's similar with the first half of the
evolution trend of our model)
Because analysis of x is more difficult, we explore, the
spread of the Ebola virus in the region per unit time
dB
dt ,
represents the propagation velocity of Ebola virus. In the
ambulance before that 10 t t , expand the scope of the
Ebola virus is growing, that
dB
dt increases with increasing
t ; when begin a large-scale rescue work, that 1 2t t t .
If the rescue work fully enough, the Ebola virus will be
contained, that
dB
dt should be reduced, and when the
equation is zero when 2t t.
5.2.2 Assumption
We need make assumptions about form of degree dB
dt of
the transport rescue in speed and spread of fire:
1) Ebola virus outbreak in the original point as the
center, spread evenly rounded to four weeks, the
radius r is proportional to t .
2) The number of people infected with Ebola virus is
proportional to the area of spreading Ebola virus is
2( )B t, scale factor 1c
is the number of rescue
medicines for unit area.
3) From the outbreak of the Ebola virus to begin
rescue operations 10 t t , Ebola virus degree of
diffusion is directly proportional to the time t , scale
factor β (Ebola virus from spreading rate).
4) Ambulance personnel were dispatched x , after
start of rescue work ( 1t t), Ebola virus from
spreading rate dropped x , Where λ can be
regarded as the speed of each ambulance personnel.
Obviously x .
5) Each rescue ambulance unit time required for the
number of drug 2c, so every ambulance crew
rescue medication is 2 2 1c t t
, and the total
number of drug required for each patient is 3c.
5.2.3 Constitution
According to 3) 4) of assumptions as above, the extent
of the spread of the Ebola virus
dB
dt , increased linearly at
10 t t , decreases linearly at 1 2t t t . ~
dBt
dt pattern as
shown in Figure 6.

International Journal of Scientific Research in Science and Technology (www.ijsrst.com)
229
Figure 7: ~
dBt
dt linear graph
Set 1t t, and then
dBb
dt
. The number of Ebola virus
infection 2
20
( )t dB
B t dtdt
is precisely the area of the triangle
diagram, clearly 2 2
1( )
2B t bt
.
And 2t satisfy:
12 1
tbt t
x x
(20)
So 2 2 2
1 12( )
2 2( )
t tB t
x
(21)
5.2.4 Solution
According to 2) 5) of assumptions, the number of
assumptions for Ebola virus is 1 2( )c B t , rescue medication
need 2 2 1 3( )c x t t c x . Substituting into equation (20),
(21), to obtain the desired drug to total relief is 2 2 2
1 1 1 1 2 13( )
2 2( )
c t c t c t xC x c x
x x
(22)
For the sake of x , so that ( )C x to a minimum, we can
get the number of rescue workers should be sent is 2
1 1 2 1
2
3
2
2
c t c tx
c
(23)
Based on this, we propose we should set drug
distribution points in West Africa should be in
accordance with changes by the strength of the Epidemic
area. Based on this model of computing and serious
epidemic situation, each radiation locale should set 2 to
5 points. At the same time, we want to deploy second
“mobile lab” in guinea and mali border line at the
midpoint, in order to carry out the epidemic diagnosis
faster and medical issuance.
5.3 Vaccine/Drug Production and R&D Speed
5.3.1 Assumption
We assume that the speed and degree of development of
vaccine production is analogous to the infection distance
and disaster area. So we can still use the Forest-Fire
model to building a specifically, intuitive, and effective
model to solve the problem. So, the assumptions as
above section will be reuse. So, the assumptions are
rewritten as follows:
1) The number of people infected with Ebola virus is
proportional to the area of spreading Ebola virus is
2( )B t, scale factor 1d
is the number of production
of drugs for unit area.
2) From the outbreak of the Ebola virus to end of the
first drug production operations 10 t t , Ebola
virus degree of diffusion is directly proportional to
the time t , scale factor β (Ebola virus from
spreading rate).
3) The number of each production for drug x , after
production of drug ( 1t t), Ebola virus from
spreading rate dropped 1 x , Where 1 can be
regarded as the speed of production of medicines.
Obviously 1 x .
4) In order to ensure efficient use of time speed, the
speed of the production of drugs and transportation
of drugs should be the same. That is 1 .
5.3.2 Constitution & Solution
As the above section mentioned, we can deduce
1 2 1
1
,b
b t t tx
, in other words,
12 1
1
tt t
x
.
So, the number of Ebola virus infection is
2
20
( )t dB
B t dtdt
,
and the total number of drugs needed to cure is 2 2 2
1 1 1 1 2 13
1 1
( )2 2( )
c t c t c t xC x c x
x x
(24)
According to equation solving, Ebola virus from
spreading area is 2
2 2
2 1 2 12
01
( )2 2 2( )
t bt t tdBB t dt
dt x
(25)

International Journal of Scientific Research in Science and Technology (www.ijsrst.com)
230
Find x so that ( )C x minimum: 0
dC
dx
, the result is
2
1 1 1 2 1
2
1 3 1
2
2
c t c tx
c
(26)
Based on this, we propose drug development should
begin at the growth of the epidemic stage 1/3, and 1/2 of
the growth of the epidemic stage clinical trials in order
to achieve the best results. Now the main reason for the
slow progress in Ebola drug development is the outbreak
stabilizes. But we still want to the company which is in
the development as soon as possible to develop drugs or
vaccines to deal with Ebola outbreak.
VI. MODEL RESULTS AND CONCLUSION
Advantage and improve:
How to determine the Week Contact Rate value of .
How to determine the week contact rate can be
improved, according to the epidemic cure rate before
this Ebola outbreak, we can calculate the weighted
average value, rather than simply a proportional
relationship. The spread of the virus in the crowd is
stage with a burst phase at first, Week Contact Rate
of will be greatly at this period; we can set it to an
impulse variable.
For Epidemic Area of Forest-Fire model, this model
assumes that the Ebola virus outbreak in the original for
the center, a radial spread around, the actual situation
may be due to the terrain, lifestyle and other reasons for
the differences. For the treatment of patients with an
average speed of rescue workers λ, may be related to the
rescue start time t. As t grows, the rescue rate λ is also
growing.
Disadvantage:
For Vaccine/Drug Production and R&D Speed of
Forest-Fire model, because the trial drug itself has some
limitations and latency, total drug production scheme of
arrangement exist error. And we choose the averaging
method to use in the drugs used at the treatment of the
amount recovered; such simple treatment will affect the
calculation of the total demand for drugs.
Overall, for the Eradicating Ebola, we should be a
comprehensive analysis of a model by normalized all of
models as above, the results will be an optimal solution.
But limited ability, we did not do so. But we have the
optimal solution for a single model was a good deal. So
the result of us compare with the integrated optimal
solution will not be much apart.
VII. REFERENCES
[1] World Health Organization. World health
statistics 2014[J]. 2014.
[2] Jiang QY, Xie JX, Ye J. The Mathematical Model
[M]. 4th Edition. Beijing: Higher Education Press,
2011.
[3] WHO. Ebola data and statistics[G/OL]. [2015-2-
7]. http://apps.who.int/gho/
[4] data/node.ebola-sitrep.quick-downloads?lang=en.
[5] Zhou HP, Cai SH. A spreading model of the SIRS
virus based on a two-dimensional regular lattice
[J]. Journal of Shandong University (Natural
Science),2007,11:94-97+100.
[6] Wikipedia. Ebola virus epidemic in West
Africa[G/OL]. [2015-2-7].
http://en.wikipedia.org/wiki/Ebola_virus_epidemi
c_in_West_Africa.
[7] Wikipedia. Forest-fire model[G/OL]. [2015-2-7].
http://en.wikipedia.org/
[8] wiki/Forest-fire_model.
[9] Wikipedia. Pharmacokinetics[G/OL]. [2015-2-7].
http://en.wikipedia.org/
[10] wiki/Pharmacokinetics.
[11] Basler C F. New Hope in the Search for Ebola
Virus Treatments[J]. Immunity, 2014, 41(4): 515-
517.
[12] Geisbert T W, Young H A, Jahrling P B, et al.
Pathogenesis of Ebola hemorrhagic fever in
primate models: evidence that hemorrhage is not a
direct effect of virus-induced cytolysis of
endothelial cells[J]. The American journal of
pathology, 2003, 163(6): 2371-2382.
[13] Tosh P K, Sampathkumar P. What clinicians
should know about the 2014 Ebola
outbreak[C]//Mayo Clinic Proceedings. Elsevier,
2014, 89(12): 1710-1717.
[14] Tseng C P, Chan Y J. Overview of Ebola virus
disease in 2014[J]. Journal of the Chinese Medical
Association, 2015, 78(1): 51-55.

International Journal of Scientific Research in Science and Technology (www.ijsrst.com)
231
[15] Borchert M, Mutyaba I, Van Kerkhove M D, et al.
Ebola haemorrhagic fever outbreak in Masindi
District, Uganda: outbreak description and lessons
learned[J]. BMC infectious diseases, 2011, 11(1):
357.
[16] Kinsman J. A time of fear”: local, national, and
international responses to a large Ebola outbreak
in Uganda[J]. Global Health, 2012, 8: 15.
[17] Rebaudet S, Moore S, Piarroux R. Ebola virus
disease in West Africa--the first 9 months[J]. The
New England journal of medicine, 2015, 372(2):
188-188.
[18] Sayburn A. WHO gives go ahead for experimental
treatments to be used in Ebola outbreak[J]. BMJ,
2014, 349: g5161.
[19] Qiu X, Wong G, Audet J, et al. Reversion of
advanced Ebola virus disease in nonhuman
primates with ZMapp[J]. Nature, 2014.
[20] Martin-Moreno J M, Llinás G, Hernández J M. Is
respiratory protection appropriate in the Ebola
response?[J]. The Lancet, 2014, 384(9946): 856.
[21] McCarthy M. US signs contract with ZMapp
maker to accelerate development of the Ebola
drug[J]. BMJ, 2014, 349: g5488.
[22] Okware S I. Three ebola outbreaks in Uganda
2000-2011[J]. 2015.
[23] Yu YL. Ebola virus/Ebola virus disease out broke
in 2014 [J]. Prog in Microbiol
lmmunol,2014,06:1-7.
[24] Li C, Yang M, Mu D, Sui HT, Zhao J, Meng YJ,
Tu WX. Epidemiology of Ebola virus disease
outbreak in West Africa, 2013-2014 [J].DISEASE
SURVEILLANCE,2014,11:925-928.
[25] Deng HP. Preliminary Analysis of the
Relationship between Physical Geography Factors
and Diseases [J]. Journal of Capital Normal
University (Natural Science Edition),1995,03:88-
92.
[26] Meng XM, Dong P, Lu HZ. Progress in the
treatment of and new drug research on Ebola virus
disease [J]. Shanghai Pharmaceutical,2014,21:1-5.
[27] Drossel B, Schwabl F. Self-organized critical
forest-fire model[J]. Physical review letters, 1992,
69(11): 1629.
[28] Bak P, Chen K, Tang C. A forest-fire model and
some thoughts on turbulence[J]. Physics letters A,
1990, 147(5): 297-300.
[29] Chen K, Bak P, Jensen M H. A deterministic
critical forest fire model[J]. Physics Letters A,
1990, 149(4): 207-210.
[30] Ritschel W A. Handbook of basic
pharmacokinetics[J]. 1976.
[31] China National Knowledge Infrastructure.
CNKI[G/OL]. [2015-2-7]. http://www.cnki.net/.

IJSRST162456 | Received: 09 August 2016 | Accepted: 15 August 2016 | July-August-2016 [(2)4: 232-235]
© 2016 IJSRST | Volume 2 | Issue 4 | Print ISSN: 2395-6011 | Online ISSN: 2395-602X Themed Section: Science and Technology
232
Effect of Al Dopants on the Optical and Dispersion Parameters of
Iron Oxide thin Films Hadi Ahmed Hussin
Department of Physics, College of Education, Al-Mustansiriyah University, Baghdad, Iraq
ABSTRACT
Uniform and adherent Fe2O3:Al thin films were deposited on glass substrate using spray pyrolysis technique. The
optical properties and dispersion parameters of iron oxide thin films have been studied as a function of doping
concentration with Aluminum (Al). It has to be mentioned that changed in direct optical energy band gap of iron
oxide was recorded, as expected, after doping. The data show that the optical energy gap Eg decreased from 2.52 eV
for the undoped Fe2O3 to 2.46 eV with the increasing of doping concentration of Al to 5%. Therefore, the changes in
dispersion parameters and Urbach tails were investigated. An increase in the doping concentration causes a decrease
in the average oscillator strength. The single-oscillator parameter has been reported.
Keywords : Dispersion parameters, spray pyrolysis, iron oxide, Fe2O3:Al
I. INTRODUCTION
There are about 15 phases formed by Fe and O, as
oxides of iron [1]
. They can be synthesized in pure,
mixed oxides as well as doped structures. Iron oxide is
used as an electrode in non-aqueous and alkaline
batteries [2, 3]
and as a cathode in brine electrolysis [4]
. As
is known, Fe2O3 belongs to wideband gap
semiconductor group. Iron oxide is widely used for
direct water splitting under solar illumination due to
their band gap, high resistivity toward corrosion,
stability in solution, ease of manufacturing and material
availability, and low cost [5]
. Furthermore, the iron oxide
is essential material for humidity and gas sensors,
catalyst, magnetic recording and medical fields [6–8]
.
Many methods have been adopted to grow Fe2O3 film
such as sol gel [9]
, metal organic [10]
, pulsed laser
deposition [11]
, spray pyrolysis [12]
, filtered arc deposition
[13] and MBE
[14]. In this work, the spray pyrolysis was
adopted to prepare this film.
Generally, selective elements as dopant materials in
Fe2O3 can be classified into two groups of materials.
One group can substitute for Iron and the other can
substitute for Oxide. These different types of doping
materials can exhibit different optical properties for
Fe2O3 due to the different treatments of Fe and O in the
Fe2O3 structure. Each exhibits very different behavior as
dopant material in Fe2O3 nanostructures. Aluminum can
be applied as an impurity that changes the band-gap of
Fe2O3. By alloying Fe2O3, with other material of a
different band-gap, the band-gap of Fe2O3 can be fine-
tuned. In this work, un-doped and Al-doped Fe2O3 films
have been prepared by using the spray pyrolysis
technique.
This paper reports the influence of doping with
Aluminum on the preparation and properties of Iron
Oxide Fe2O3 thin films by spray pyrolysis technique
(SPT). The optical features are significant to be
determined accurately, not only to know the basic
mechanisms underlying these phenomena, but also to
exploit and develop their interesting technological
applications
II. METHODS AND MATERIAL
Experimental Procedure
Iron chloride (FeCl3.6H2O), 0.1 M, as matrix material
and aluminum chloride (AlCl3.6H2O), 0.1, as a doping
agent with a concentration of 3% and 7% have been
dissolved in de-ionized water in order to form the final
spray solution. Few drops of HCl were added to make

International Journal of Scientific Research in Science and Technology (www.ijsrst.com)
{ PAG
the solution clear, the total volume of 50 ml was used in
each deposition, these two starting solutions were used
for deposition of Fe2O3:Al thin films. The spray
pyrolysis was done by using a laboratory designed glass
atomizer, which has an output nozzle of 1 mm. The
films were deposited on preheated glass substrates at a
temperature of 400°C. The preparation conditions,
however, have been optimized such as spray time was 8
seconds and the stopping period was two minutes. The
latter period is enough to avoid excessive cooling of
glass substrate. The carrier gas (filtered compressed air)
was maintained at a pressure of 105
Pascal, distance
between nozzle and substrate was about 28 cm, solution
flow rate 5 ml/min. Thickness of the sample was
measured using the weighting method and was found to
be around 350 nm., Optical transmittance and
absorbance were recorded in the wavelength range (300-
900nm) using UV-visible spectrophotometer (Shimadzu
Company Japan). Optical transmittance and absorbance
were reported in order to find the effect of doping on the
parameters under investigation.
III. RESULT AND DISCUSSION
It is quite important to get information about the optical
transmittance in order to assess the optical performance
of a conductive oxide film. Fig.1 shows the
transmittance spectra in UV and visible wavelength
regions of the films. The optical transmission in the
visible wavelength region of un-doped (pure) and Al-
doped Fe2O3 (with different percentages) films increases
with increasing the wavelength. Furthermore, the
average values of the optical transmission in the visible
range (400-800 nm) were estimated. It is found that the
average transmittance values for different films were 40%
45% and 50% in the near infrared region for Fe2O3,
Fe2O3:Al 3%, and Fe2O3:Al 7% thin films, respectively.
It is observed in Fig. 2 that in the visible region, the
reflectance value ranges from 0.38 % to 0.41% passing
through a maximum value of about 0.64 %.
It has to be mentioned that this maximum value of
reflectance is valid to all doping percentages at a
wavelength of about 540 nm. It is also noticed that all
different doping percentage films have the same
behavior in which the reflectance increases with the
increase of wavelength, however, they reach a maximum
value (aforementioned) and then decreases with
increasing the wavelength. This feature is actually quite
interested and could be used in duality-based
applications.
Figure 1. Transmittance versus wavelength
Figure 2. Reflectance versus wavelength
The incorporation of impurity into semiconductors often
results in the formation of band tailing in the band gap.
The tail of the absorption edge is exponential, which
indicates the presence of localized states in the energy
band gap. The amount of tailing can be predicted by
means of plotting the absorption edge data in terms of an
equation originally given by Urbach [15]
. The absorption
edge gives a measure of the energy band gap and the
exponential dependence of the absorption coefficient, in
the exponential edge region Urbach rule is expressed as [16, 17]
.
{ EMBED Equation.3 }
………………… (1)
where αo is a constant, EU is the Urbach energy which
characterizes the slope of the exponential edge. Figure 3
shows Urbach plots of the different films. In order to
obtain the value EU, the inverse of the slope of lnα
versus hυ has to be calculated and is given in Table 1.
The dopants would result in change the width of the
localized states in the optical band. The Urbach energy
value changes inversely with the optical band gap. The
EU values of pure Fe2O3, Fe2O3:Al 3%, and Fe2O3:Al 7%

International Journal of Scientific Research in Science and Technology (www.ijsrst.com)
{ PAG
thin films were measured to be 724,735 and 793 meV
respectively. The decrease in EU can be attributed to the
atomic structural disorder of Fe2O3 films increase by
Aluminum doping. This behavior comes as a result of
increasing the concentration of point defects induced by
the dissolution of Al atoms in Fe2O3 crystals and
formation of solid solutions. Therefore, this decreasing
leads to a redistribution of states, from band to tail.
Consequently, an increase in the optical gap and a
narrowing in the Urbach tail have taken place.
Figure 3. lnα versus photon energy for Fe2O3 and
The refractive index dispersion plays an important role
in optical communication as well as designing the
optical devices. Therefore, dispersion parameters have to
be determined. The dispersion parameters of the films
were evaluated according to the single-effective-
oscillator model using the following relation [18, 19]
.
{ EMBED Equation.3 }
………. (2)
where Eo stand for single-oscillator energy which has a
physical meaning. Its physical meaning is simulates all
the electronic excitation involved and Ed is the
dispersion energy related to the average strength of the
optical transitions [20]
. The latter is defined as a measure
of the intensity of the entire band optical. This model
describes the dielectric response to transitions below the
optical gap. The quantity of (n2 − 1)
-1 has been plotted vs.
(hυ)2 as shown in Fig. 4. Eo and Ed values were
determined from the slope, (EoEd)-1
and intercept (Eo/Ed),
on the vertical axis and are given in Table 1. Eo values
increased with the dopants as the optical band gap
increase. According to the single-oscillator model, the
single oscillator parameters Eo and Ed are related to the
imaginary part of the complex dielectric constant, the
moments of the imaginary part of the optical spectrum
M-1 and M-3 moments can be derived from the following
relations [21]
.
{ EMBED Equation.3 }
……….. (3)
{ EMBED Equation.3 }
………. (4)
The values obtained for the dispersion parameters Eo, Ed,
M-1, and M-3 are listed in Table 1, Table2 The obtained
M-1 and M-3 moments changes with the dopants. For the
definition of the dependence of the refractive index (n)
on the light wavelength (λ), the single-term Sellmeier
relation can be used [18]
.
{ EMBED Equation.3 }
………. (5)
where λo is the average oscillator position and So is the
average oscillator strength .The other parameters in the
above equation, namely, So and λo can be obtained
experimentally by plotting(n2 − 1)
-1 versus λ
-2 as shown
in Fig. 5. The slope of the resulting straight line gives
1/So, while the infinite interception of wavelength yields
1/So{ QUOTE }. The results reveal an increase in the
band gap which can be attributed to the presence of
unstructured defects. The latter in turn decrease the
density of localized states and cause a narrowing in the
Urbach tail and hence increasing the energy gap.
Figure 4. Variation (n2 − 1)-1 as a function of (hυ)2 for
Fe2O3, Fe2O3:Al films.

International Journal of Scientific Research in Science and Technology (www.ijsrst.com)
{ PAG
Figure 5. Variation (n2 − 1)
-1 as a function of (λ)
-2 for
Fe2O3, Fe2O3:Al films.
Table 1. The optical parameters
Table 2. The optical parameters
IV. CONCLUSION
Fe2O3:Al thin films were prepared by means of spray
pyrolysis technique. In this work, the doped and
undoped samples were characterized. Due to doping, the
optical band gap was increased. Likewise, optical
transmittance was affected for moderate doping.
Furthermore, the single-oscillator parameters were
determined. In this paper, it is shown that the dispersion
parameters of thin films obeyed the single oscillator
model, the change in dispersion energy was investigated
and its value decreased from 79.05 to 61.54 eV for
Fe2O3:Al films with increasing doping concentration .
V. REFERENCES
[1] R. M. Cornell, U. Schwertmann, the Iron Oxides,
second ed.,Wiley-VCH, p. 11, 2003.
[2] S. Kenichi, J. Akinide, T. Kiyohide, Japan Patents
61 (24) 147 (1986).
[3] F. Sanehiro, Y. Sejji, N. Toshiyuki, Japan Patents
62 (160) 651 (1981).
[4] K. Keiji, M. Itsuaki, Japan Patents, 79 (106) 78
(1979).
[5] J. Chen, L. Xu, W. Li, and X. Gou, Adv. Mater.
17, 582 (2005).
[6] G. Neri, A. Bonavita, S. Galvagno, C. Pace, S.
Patane, and A. Arena, Sensors and Actuators B
73, 89 (2001).
[7] K. Cheol and C. Han, J. Phys. IV France 132, 185
(2006).
[8] L. Huo, Q. Li, H. Zhao, L. Yu, S. Gao, and J.
Zhao,Sensors and Actuators B 107, 915 (2005).
[9] W. Luo, T. Yu, Y. Wang, Z. Li, J. Ye, and Z. Zou,
J.Phys. D: Appl. Phys. 40, 1091 (2007).
[10] T. Kawahara, K. Yamada, and H. Tada, J. Colloid
and Interface Sci. 294, 504 (2006).
[11] S. Tiwari, R. Prakash, R. Choudhary, and D.
Phase, J.Phys. D: Appl. Phys. 40, 4943 (2007).
[12] L. Dghoughi, B. Elidrissi, C. Bernede, M. Addou,
M. Alaoui, M. Regragui, and H. Erguig, Appl.
Surf. Sci. 253, 1823 (2006).
[13] J. Glasscock, P. Barnes, I. Plumb, A. Bendavid,
and P. Martin, Thin Solid Films 516, 1716 (2008).
[14] S. Gota, E. Guiot, M. Henriot, and M. Gautier,
Phys.Rev. B 60, 141387 (1999).
[15] Urbach F., Phys. Rev. 92(5) (1953) 1324.
[16] J. Tauc, Amorphous and Liquid Semiconductors,
Plenum Press, New York, 1974.
[17] J. Tauc, R. Grigorovici, A. Vancu, Phys. Status
Solidi 15 (1966) 627-637.
[18] Wemple S. H., DiDomenico, J. Appl. Phys. 40 (2)
(1969) 720-734.
[19] Wemple S. H., DiDomenico, Phys. Rev. B3
(1971) 1338-1351.
[20] Wemple S. H., Phys. Rev. B7 (1973) 3767-3777.
Sample Ed
(eV)
Eo
(eV)
Eg
(eV)
{ EMB
ED
Equati
on.3 }
n(o)
Pure 79.05 5.05 2.52 16.62 4.07
3% 71.42 5.00 2.50 15.28 3.90
5% 61.54 4.92 2.46 13.50 3.67

International Journal of Scientific Research in Science and Technology (www.ijsrst.com)
{ PAG
[21] Atyia H. E., Optoelectron. Adv. M., 8 (2006)
1359-1366.

IJSRST1622111 | Received: 03 August 2016 | Accepted: 15 August 2016 | July-August-2016 [(2)4: 236-242]
© 2016 IJSRST | Volume 2 | Issue 4 | Print ISSN: 2395-6011 | Online ISSN: 2395-602X Themed Section: Science and Technology
236
A Review on Anticancer Drug from Marine
Omkar A Patil*, Prajkta S Patil,Trupti D Dudhgaonkar, Shriniwas K Mohite, Chandracanth S Magdum
Rajarambapu College of Pharmacy, Kasegaon, Kasegaon, Walwa, Sangali, Maharashtra, India
ABSTRACT The marine environment is a rich source of both biological and chemical diversity. It is very much likely that marine
organisms would be wonderful source of biologically active molecules The collection of the marine therapeutics
includes molecules with antibiotic, antiviral, antiphrastic, analgesic and anticancer agent from bacteria,
cyanobacteria, tunica, fungi, sponge This reviewfocuses on the latest studies and critical research in this field and
evidences the immense potential ofmarine organisms as sources of bioactive peptides and other anticancer
biomolecules Various anticancer compounds like Aplidine, Bryostatin-1, Didemin B, Dolastation, Ecteinascidine
with diverse modes of action, such as, anti-proliferative, antioxidant, anti-microtubule havebeen isolated from
marine sources. Traditional chemotherapeutic agents have a range of side effects likefatigue, gastrointestinal distress
and depression of immune system which introduces the these sources have been shown to have antioxidantactivity
and cytotoxic effect on several human cancers such as leukemia, lymphoma, ovarian, melanoma, breast, bladder,
neuroendocrine, prostatic, colon and non-small cell lung cancer very potently.
Keywords: Marine Organisms, Bryostatin-1, Dolastation, Human Cancers
I. INTRODUCTION
Over the past few years, about 3000 new compounds
like anti-tumor, anti-microtubule, anti-proliferative,
photoprotective, antibiotic and anti-infective discover
from various marine sources some have entered clinical
trials.This activity has been largely due to improvements
in the technologies involved in deep-sea sample
collection and large-scale drug production through
aquaculture and drug synthesis7 which took place in the
1980s. These developments suggest that, in the future,
the oceans will become an important source of novel
chemical classes not found in the terrestrial environment.
II. METHODS AND MATERIAL
Therapeutic Agents from Marine Sources
Bacteria
Marine microorganisms are a rich source of newgenes,
exploitation of which is likely to lead tothe discovery of
new drugs and therapeutic approaches. Only a few
marine bacteria can beisolated under laboratory
conditions and there is an urgent need to develop new
culture techniques to isolate slow-growing bacteria and
also toisolate the bacteria that are unique in production
of novel natural products. (e.g.Seudopterosins,
Topsentins, Scytonemin and Manoalide), anticancer
agents (e.g., Bryostatins, Discodermolide, Eleutherobin
and Sarcodictyin) and antibiotics (e.g.Marinone). Anti-
Parasitic compound Valinomycinis isolated
fromStreptomyces sp. strains of Mediterranean
Cyanobacteria
The cyanobacteria population comprises 150genera and
about 2000 species of considerablediversity. The
potency of marine cyanobacteria asanticancer agents is
the most explored among allmarine derived chemicals.
Besides cytotoxicity in tumor cell lines, several
compounds haveemerged as templates for the
development of newanticancer drugs. Well studied
species of marine cyanobacteria includes Nostoc,
Calothrix, Lyngbya, Symploca
Fungi
Marine derived fungi provide plenty ofstructurally
unique and biologically activesecondary metabolites.
The Anthracenedione derivatives acting as the potent

International Journal of Scientific Research in Science and Technology (www.ijsrst.com)
{ PAG
anticancer agents screened from the mangrove
endophytic fungus Halorosellinia sp. and Guignardia sp.
Forexample, Cytarabine, an antileukemic drug
andTrabectedin, an agent for treating soft tissuesarcoma
are developed from marine fungi sources [8]. Besides,
marine-derived fungi are known tobe a source of
antioxidative natural products suchas Acremonin A from
Acremonium sp. AndXanthonederivative from
Wardomycesanomalus[9].
Sponge
Approximately 10,000 sponges have been
foundworldwide [11] and most of them live in
marineenvironments [12]. Marine sponges have
yieldedover 70 novel compounds to date that exhibit
significant inhibitory activity towards a range ofprotein
kinases. A range of bioactive compoundshas been found
in about 11 sponge genera. Threeof these genera
(Haliclona, PetrosiaandDiscodemia) produce influential
anticancer and anti-inflammatory agents [13].
SOURCE COMPOUND BIOACTIVITY
Bacteria Valinomycin Anti-Parasitic
Cyanobacteria Calothrixin A
and B
Antimalarial
Cyanobacteria Curacao extracts Antiproliferative
Fungi Cephalosporins Antibiotic
Fungi Antioxidants Atherosclerosis,
dementia
Soft coral Methanol
extracts
Anticancer
Sponge Kuanoniamines Growth inhibitor
Sponge Steroid Inflammation,
asthma
Sponge Ara-c Antiviral
BRYOSTATIN-1
Figure 1. The Bryozoan Bugula neritina
Source organism: Bugula neritina (Bryozon)
Bryostatin-1 is a macrocyclic natural lactone isolated
from the marine Bryozoan, Bugulaneritina(Fig.1). It has
shown both antitumour as well as immunomodulatory
effects [1,2]. It is a potentactivator of the protein kinase
C (PKC) family, lacking tumour-promoting activity and
with antagonisticeffects on tumour-promoting phorbol
esters. This effect isprobably related to down-regulation
ofPKC or by specific isoform activation. It
alsostimulates cytokine production, bone marrow
progenitorcells and neutrophils [3,4]. In vitro,
bryostatin-1 has cytotoxic activity against various
leukaemia and solid tumour cell lines. It has also in vivo
antitumouractivity in various murine models, including
leukemia, lymphoma, ovarian cancer and melanoma. It
was shown to enhance the antitumour effects of various
anticancer agents, suchas vincristine, cytosine
arabinoside, cisplatin, melphalan,paclitaxel and others.
Bryostatin-1
These effects may beschedule-dependent [1,2,5].This
agent was studied in phase I trials at different infusion
schedules. The recommended doses for phase II trials
were 25-35 M-g/m2 when administered over one hour
for three of every four weeks; 25 u.g/m2 given as a
weekly 24 hour infusion. Myalgia was the DLT in all
trials. Other toxicities werejoint aches and a transient
decrease in platelet counts [6,7]. Notably, partial
responses were reported inpatients with melanoma,
ovarian cancer and. Phase II trials of bryostatin-1 are
being conductedat various infusion regimens in a large
number of tumour types in both solid and
haematological malignancies.In addition, phase I trials
of brystatin-1in combination with other agents, such as
cisplatin,paclitaxel, fludarabine, vincristine, cytosine
arabinoside and 2-CDA are also being conducted.

International Journal of Scientific Research in Science and Technology (www.ijsrst.com)
{ PAG
APLIDINE
Figure 2. The tunicate Aplidium albicans
Source Organism: Aplidium albicans (tunicate)
Aplidine was obtained from a Mediterranean colonial
tunicate, Aplidiumalbicans. It has a pyruvylgroup
replacing the lactyl group in DB and its synthesis has
been achieved. It appears more active than DB in
preclinical models and apparently not
cardiotoxic.Aplidine entered clinical trials in 1999 both
in Europe and in the US under the sponsorship of the
Spanish company Pharma Mar. It is appearedthat these
cancer cells are sensitive to lowconcentrations of this
compound. Aplidine’s mode of action involves several
pathways; that’s why Aplidineis described as
multifactorial apoptosis inducer. The compound induces
rapid cell cycle arrest at G1-G2 and inhibition of protein
synthesis, thus introduce apoptosis ofcancer cells [9]
Aplidinealso inhibits the expression of the vascular
endothelial growth factor gene, having antiangiogenic
effects [10].However, Aplidineis appeared as more
active than Didemninin preclinical models and so far has
not shown evidence of life threateningneuromascular
toxicity [8,9,4].
Aplidine
The dose limiting toxicity with the protracted schedule is
muscular with a remarkable lack ofhaematological
toxicity in spite of the cytotoxicity noted at low
concentrations in leukemic blasts explanted from
patients [11,12]. Consistent evidence of activity has
been noted in pretreatedneuroendocrine tumors [13] and
other tumor types. Phase II studies are now ongoing with
an every other week schedule giving APL as a
protracted or 3 hours intravenous infusion at a dose of
5mg/m2.
DOLASTATINS
Figure 3. Dolabellaauricularia
Source Organism: Dolabellaauricular
The dolastatins are cytotoxic peptides, which can be
cyclic or linear, derived from the sea hare,
Dolabellaauricularia, amollusc from the Indian Ocean.
Dolastatin10 and 15 are small peptides that were shown
to interact with tubulin. Dolastatinwas selected for initial
clinical development because of its more favourable
preclinical profile. It is extremely potent in vitro and it
was shown to inhibit microtubule assembly, tubulin-
dependent guanosinetriphosphate (GTP) binding and
inhibit vincristine and vinblastine binding to tubulin. It
causes cells toaccumulate in metaphase arrest and is
modulated by the MDR gene product
[14,15].Dolastatinhas in vitro activity against several
human leukaemia, lymphoma and solid tumour cell lines.
Dolastatins
It has documented antitumour activity in various human
solid tumour models, such as LOX#IMVI melanoma,

International Journal of Scientific Research in Science and Technology (www.ijsrst.com)
{ PAG
OVCAR-3 ovarian carcinoma and NCI-H522 NSCLC
cell lines. In animal toxicology studies, myelo
suppression was the dose-limiting toxicity. This agent is
highly bound to plasma proteins and pharmacokinetic
studies in animals showed a rapid degradation probably
by hepatic metabolism [16,17].This agent entered phase
I trials as an i.v. bolus injection every 3 weeks. The
maximum tolerated dose (MTD) was 300 mg/m2 for
heavily pretreated patients, while 400 mg/m2 appears to
be the MTD for minimally pre-treated patients. The
dose-limiting toxicity (DLT) was myelo suppression,
and local irritation and phlebitis, and mild peripheral
neuropathy were also observed. Phase II trials are being
initiated in breast, colon, lung, ovarian and prostate
cancer, as well as lymphomas and leukaemias [18,
19].side effects observed were peripheral sensory
neuropathies, pain, swelling, and erythematic at the
injection site. Complexity and low yield of chemical
synthesis of Dolastatins together with low water
solubility
ECTEINASCIDINS(ETS)
Figure 4. The tunicate Ecteinascidiaturbinata
Source Organism: Ecteinascidiaturbinata
The ecteinascidins (Ets) are derived from the Caribbean
tunicate Ecteinascidiaturbinata. Following a period of
supply problems, enough amounts of this compound
could be obtained from aquaculture and synthesis. The
derivative Ecteinascidin 743 (ET 743) showed
promising activity in murine and human tumour models,
and is currently in early clinical development. It is a
tetrahydro isoquinoline alkaloid that alkylates
selectively guanine N2 from the DNA minor groove,
and this alkylation is reversed by DNA denaturation.
Therefore, it differs from other DNA alkylating agents
so far used in the clinic.
Recent mechanistic data demonstrates that ET-743
induces a broad inhibition of activated transcription with
no effect on the constitutive transcription [20,21,22]:
ET-743 inhibits the activation of the multidrug resistant
pathway [23] that is considered to be the main
mechanism of primary and acquired resistance of cancer
cells to natural drugs such doxorubicin and taxanes. ET-
743 is the only known anticancer entity for which there
is an inverse correlation between the DNA repair
efficiency and the sensitivity/resistance pattern [24,25];
such evidence offered a rationale to Marine Drugs 2004,
2 18implement combinations studies with platin salts
[26] and to seek for correlations in patients between the
DNA efficiency and the response to ET-743 [27]An
extensive phase I program assessing different schedules
of administration was completed[28,29,30]: The dose
limiting toxicities were bone marrow toxicity and
fatigue. As predicted inthe preclinical toxicology,
transaminitis is noted in the majority of the patients but
such a drug induced effect is transient/reversible and non
cumulative and therefore does not represent a limiting
factor for long-term therapy.
Ecteinascidins
Consistent evidence of antitumor activity in patients
bearing resistant disease was reported in the phase I
program. In fact, objective remissions in breast cancer,
melanoma and mesothelioma were observed together
with a consistent evidence of antitumor activity in
patients with advanced resistant sarcoma. Such evidence
was the starting point for a fast track pivotal phase II
program in patients with advanced soft tissue sarcoma
resistant or relapsed to conventional therapies. Long-
term results from such studies have clearly confirmed a
significant therapeutic impact in this disease setting [36,

International Journal of Scientific Research in Science and Technology (www.ijsrst.com)
{ PAG
37, 38, 39, and 40]. In these studies ET-743 has been
given as a 24 hours intravenous infusion every 3 weeks
at a dose of 1.5 mg/m2.
DIDEMNIN B
Figure 5. Trididemnum Solidum
Source Organism: Trididemnum Solidum
Different types of tunicates and ascidia are inhabitants
of sea floor. They produce complex antitumor
compounds that are estimated as more effective than any
other cancer medicine now in use. One of these potent
compounds is Didemnin which was isolated first from
Caribbean tunicate Trididemnum solidum[41]. But later
has also been extracted from other species of the same
genus [42]. Among various Didemnin, Didemnin B has
the most potent antitumor and antiproliferative activity
against human prostatic cancer cell lines [41].
DidemninB is the first marine peptide to enter into
clinical trial as a potent anticancer drug [43]. This is
acyclic depsipeptide which exerts antitumor activity via
protein synthesis inhibition [44].However, high toxicity,
poor solubility and short life span led to the
discontinuation of clinical trials of Didemnin B [43].
Didemnin
It has shown impressive antitumour activity in human
tumour models in vitro as well as in tumours growing in
athymic mice.10 In initial clinical trials, patients with
various solid tumours or non-Hodgkin lymphoma were
given a short intravenous infusion of didemnin B every
3 weeks, and antitumour effects were observed.
However, severe neuromuscular and cardiotoxic effects
led to the discontinuation of clinical trials.11,12
III. CONCLUSION
The marine environment is a rich source of both
biological and chemical diversity. It is very much likely
that marine organisms would be a wonderful source of
biologically active molecules .The collection of the
marine therapeutics includes molecules with antibiotic,
antiviral, antiphrastic, analgesic and anticancer agent
from bacteria, cyanobacteria, tunica, fungi, sponge .This
review focuses on the latest studies and critical research
in this field and evidences the immense potential of
marine organisms as sources of bioactive peptides and
other anticancer biomolecules Various anticancer
compounds like Aplidine, Bryostatin-1, Didemin B,
Dolastation, Ecteinascidine with diverse modes of action,
such as, anti-proliferative, antioxidant, anti-microtubule
have been isolated from marine sources. Traditional
chemotherapeutic agents have a range of side effects like
fatigue, gastrointestinal distress and depression of
immune system which introduces the these sources have
been shown to have antioxidant activity and cytotoxic
effect on several human cancers such as leukemia,
lymphoma, overian, melanoma, breast, bladder,
neuroendocrine, prostatic, colon and non-smallcell lung
cancer very potently..
IV. REFERENCES
[1]. Wender PA, Hinkle KW, Koehler MF, Lippa B. The
rational design of potential chemotherapeutic agents:
synthesis of bryostatin analogues. Med Res Rev
1999; 19(5): 388-407.
[2]. Wall NR, Mohammed RM, Nabha SM, et al.
Modulation of Ciap-1 by novel antitubulin agents
when combined with bryostatin 1 results in increased
apoptosis in human early pre-B acute lymphoblastic
leukemia cell line REH. Biochem Biophys Res
Commun 1999; 266: 76-80.

International Journal of Scientific Research in Science and Technology (www.ijsrst.com)
{ PAG
[3]. Trenn G, Pettit GR, Takayama H, et al.
Immunomodulating properties of a novel series of
protein kinase C activators. The bryostatins. J
Immunol 1988; 140: 433—439.
[4]. Hornung RL, Pearson JW, Beckwith M, Longo DL.
Preclinical evaluation of bryostatin as an anticancer
agent against several murine tumor cell lines: in vitro
and in vivo activity.Cancer Res 1992; 52(1): 101-
107.
[5]. Varterasian ML, Mohammad RM, Eilender DS, et
al. Phase I study of bryostatin-1 in patients with
relapsed non-Hodgkin's lymphoma and chronic
lymphocytic leukemia. J Clin Oncol 1998; 16(1):
56-62.
[6]. Basu A, Lazo JS. Sensitization of human cervical
carcinoma cells to cis diamminedichloroplatinum(II)
by bryostatin 1. Cancer Res 1992; 52(11): 3119-
3129.
[7]. Jayson GC, Crowther D, Prendiville J, et al. A phase
I trial of bryostatin 1 in patients with advanced
malignancies using a 24 hour intravenous infusion.
Br J Cancer 1995; 72: 461-468.
[8]. Prendiville J, Crowther D, Thatcher N, et al. A phase
I study of intravenous bryostatin 1 in patients with
advanced cancer. Br J Cancer 1993; 68: 418-424.
[9]. Faivre, S.; Chieze, S.; Delbaldo, C.; Ady-Vago, N.;
Guzman, C.; Lopez-Lazaro, L.; Lozahic, S.; Jimeno,
J.; Pico, F.; Armand, J.; et al. Phase I and
pharmacokinetic study of aplidine, a new marine
cyclodepsipeptide in patients with advanced
malignancies. J. Clin. Oncol. 2005, 23, 7871–7880.
[10]. Garcia-Fernandez, L.F. et al. (2002) Aplidin™
induces the mitochondrial apoptotic pathway via
oxidative stress-mediated JNK and p38 activation
and protein kinase Cδ. Oncogene 21, 7533–7544.
[11]. Broggini, M.; Marchini, S.V.; Galliera, E.; Borsotti,
P.; Taraboletti, G.; Erba, E.; Sironi, M.; Jimeno, J.;
Faircloth, G.T.; Giavazzi, R.; et al. Aplidine, a new
anticancer agent of marine origin, inhibits vascular
endothelial growth factor (VEGF) secretion and
blocks VEGF-VEGFR-1 (flt-1) autocrine loop in
human leukemia cells MOLT-4. Leukemia 2003, 17,
52–59.
[12]. Armand, J.-V.; Ady-Vago, N.; Faivre, S. Phase I and
Pharmacokinetic Study of Aplidine (apl) Given as a
24-Hour Continuous Infusion Every Other Week
(q2w) in Patients (pts) with Solid Tumor (st) and
Lymphoma (NHL). In Proceedingof 2001 ASCO
Annual Meeting; American Society of Clinical
Oncology: San Francisco, CA, USA,2001.
[13]. Bai, R., Friedman, S. J., Pettit, G. R. & Hamel, E.
Dolastatin-15, a potent antimitotic depsipeptide
derived from Dolabella auricularia: interaction with
tubulin and effects on cellular microtubules.
Biochem. Pharmacol. 43, 2637–2645 (1992).
[14]. García-Rocha, M.; Bonay, P.; Avila, J. The
antitumoral compound Kahalalide F acts on
celllysosomes. Cancer Lett. 1996, 99, 43–50.
[15]. Faircloth, G.T.; Smith, B.; Grant, W. Selective
antitumor activity of Kahalalide F, a marine derived
cyclic depsipeptide. Proc. Am. Assoc.Cancer Res.
2001, 42, 1140
[16]. Pettit GR, et al. The isolation and structure of a
remarkable marine animal amineoplastic constituent:
Dolastatin 10. J Am Chem Sec 1987; 109: 6883-
6885.
[17]. Bai R, Pettit GR, Hamel E. Dolastatin 10, a powerful
cytostatic peptide derived from a marine animal.
Inhibition of tubulin polymerization mediated
through the vinca alkaloid binding domain. Biochem
Pharmacol 1990; 39(12): 1941-1949
[18]. Pathak S, Multani AS, Ozen M, et al. Dolastatin-10
induces polyploidy, telomeric associations and
apoptosis in a murine melanoma cell line. Oncol Rep
1998; 5(2): 373-376.
[19]. Maki A, Mohammad R, Raza S, et al. Effect of
dolastatin 10 on human non-Hodgkin lymphoma cell
lines. Anticancer Drugs 1996; 7(3): 344-350.
[20]. Anticancer agent: a phase I clinical, pharmacological
and pharmacodynamic study of dolastatin 10 (NSC
376128) in patients with advanced solid tumors. Clin
Cancer Res 2000; 6: 1293-130.
[21]. McElroy EA, Pitot HC, Erlichman C, et al. Phase I
trial of dolastatin-10 in patients with advanced solid
tumors. Proc Am Soc Clin Oncol 1997; abstr. #782.
[22]. Minuzzo M, Marchini S, Broggini M, Faircloth G,
D'incalci M And Mantovani R: Interference of
transcriptional activation by the anti-neoplastic drug
ET-743. Proc.Natl.Acad.Sci.USA. 2000, 97: 6780-
6784
[23]. Jin S, Gorfajn B, Faircloth G And Scotto K:
Ecteinascidin 743, a transcription-targeted
chemotherapeutic that inhibits MDR1 activation.
Proc.Natl.Acad.Sci.USA. 2000, 97, 6775-6779.
[24]. Friedman D, Hu Z, Kolb EA, Gorfajn B And Scotto
KW: Ecteinascidin-743 inhibits activated but not
constitutive transcription. Cancer Res. 2002, 62,
3377-3381.
[25]. Kanzaki A, Takebayashi Y, Ren XQ, Akiyama S.,
Bates S., Pommier Y., : Overcoming multidrug drug
resistance in P-glycoprotein/MDR1-overexpressing

International Journal of Scientific Research in Science and Technology (www.ijsrst.com)
{ PAG
cell lines by ecteinascidin 743. Mol Cancer Ther.
2002, 1, 1327-1334.
[26]. Damia G; Silvestri S; Carrassa L; Filiberti L;
Faircloth G T; Liberi G; Foiani M; D'Incalci
M:Unique pattern of ET-743 activity in different
cellular systems with defined deficiencies in DNA-
repair pathways. Int J Cancer. 2001, 92, 583-588.
[27]. Takebayashi Y; Pourquier P; Zimonjic D B;
Nakayama K; Emmert S; Ueda T; Urasaki Y;
Kanzaki A; Akiyama S I; Popescu N; Kraemer K H;
Pommier Y: Antiproliferative activity of
ecteinascidin 743 is dependent upon transcription-
coupled nucleotide-excision repair. Nat Med. 2001,
7, 961-966. 30 D'incalci M, Colombo T, Ubezio P.,
Nicoletti I., Giavazzi R., Erba E., Ferrarese L., Meco
D.,Riccardi R., Sessa C., Cavallini E., Jimeno J.,
Faircloth G: The combination of yondelis and
cisplatin is synergistic against human tumor
xenografts. Eur J Cancer. 2003, 39, 1920-1926.
[28]. Sarries C., Haura E., Roig B. Pharmacogenomic
strategies for developing customized chemotherapy
in non-small cell lung cancer. Pharmacogenomics.
2002, 3(6), 763-780.
[29]. Taamma A, Misset JL, Riofrio M, Guzman C, Brain
E, Lopez Lazaro L, Rosing H, Jimeno J, Cvitkovic
E.: Phase I and pharmacokinetic study of
ecteinascidin-743, a new marine compound,
administered as a 24-hour continuous infusion in
patients with solid tumors. J Clin Oncol. 2001, 19,
1256-1265.
[30]. Ryan DP, Supko JG, Eder JP, Seiden M, Demetri G,
Lynch TJ, Fischman AJ, Davis J, Jimeno J, Clark
JW: Phase I and pharmacokinetic study of
ecteinascidin 743 administered as a 72-hour
continuous intravenous infusion in patients with
solid malignancies. Clin Cancer Res. 2001, 7, 231-
242.
[31]. Villalona-Calero MA, Eckhardt SG, Weiss G,
Hidalgo M, Beijnen JH, van Kesteren C, Rosing H,
Campbell E, Kraynak M, Lopez-Lazaro L, Guzman
C, Von Hoff DD, Jimeno J, Rowinsky EK.: A phase
I and pharmacokinetic study of ecteinascidin-743 on
a daily x 5 schedule in patients with solid
malignancies. Clin Cancer Res. 2002, 8, 75-85.
[32]. Twelves C., Hoekman K., Bowman A., Vermorken
J.B., Anthoney A., Smyth J., Van Kesteren C.,
Beijnen J.H., Uiters J., Wanders J., Gomez J.,
Guzmán C., Jimeno J., Hanauske A..: Phase I and
pharmacokinetic study of Yondelis (Ecteinascidin
743; ET-743) administered as an infusion over 1h or
3h every 21 days in patients with solid tumors. Eur J
Cancer. 2003, 39, 1842-1851.
[33]. Delaloge S, Yovine A, Taamma A, Riofrio M, Brain
E, Raymond E, Cottu P, Goldwasser F,Jimeno J,
Misset JL, Marty M, Cvitkovic E. Ecteinascidin-743:
a marine-derived compound inadvanced, pretreated
sarcoma patients-preliminary evidence of activity. J
Clin Oncol. 2001,19(5), 1248-1255.
[34]. Demetri G., Manola J., Harmon D., Maki R., Seiden
R., Supko J., Ryan D., Puchlaski T., Goss G.,
Merriam P., Waxman A., Slater S., Potter A.,
Quigley T., Lopez T., Sancho MA., Guzman C.,
Jimeno J., Garcia Carbonero R. Ecteinascidin-743
(ET-743) induces durable responses and promising
1-year survival rates in soft tissue sarcomas (STS):
Final results of Phase II and Pharmacokinetic studies
in the U.S.A American Society of Clinical
Oncology, San Francisco, CA, May 12 –15,.2001.
Procc. 352a. Abstract 1406.
[35]. Le Cesne A., Blay J.,. Judson I, Van Oosterom A,
Verweij J, Radford J, Lorigan P, Rodenhuis S,
Donato De Paola E, Van Glabbeke M., Jimeno J.,
Nielsen O. ET-743 is an active drug in adult soft-
tissue sarcoma: a STBSG-EORTC Phase II trial.
American Society of Clinical Oncology,
[36]. The Annual Meeting . San Francisco, CA, May 12 –
15, 2001. Procc. 353a. Abstract 1407.
[37]. Yovine A., Riofrio M., Brain E., Blay JY., Kahatt
C., Delaloge S., Beautier L., Cottu P., Jimeno J.,
Cvitkovic E., Misset JL. Ecteinascidin-743 given as
a 24 hour (H) intravenous continuos infusion (IVCI)
every 3 weeks: results of a Phase II trial in patients
(PTS) with pretreated soft tissue sarcomas (PSTS).
American Society of Clinical Oncology. 37th
Annual Meeting . San Francisco, CA, May 12 – 15,
2001. Proc. 363a. Abstract 1449.
[38]. Jimeno J., Maki R., Casali P., Faircloth G., Martinez
N., Nieto A., Cañigueral S. Therapeutic impact of
ET-743 (Yondelis®, Trabectidin) a new marine
derived compound in Sarcoma.Current Opinion in
Orthopedics. Submitted September 2003.solid
tumors. Eur J Cancer. 2003, 39, 1842-1851

IJSRST1622112 | Received: 25 July 2016 | Accepted: 15 August 2016 | July-August-2016 [(2)4: 243-249]
© 2016 IJSRST | Volume 2 | Issue 4 | Print ISSN: 2395-6011 | Online ISSN: 2395-602X Themed Section: Science and Technology
243
Microwave Assisted Synthesis, Characterization and Antibacterial Activity of
2- Chloromethyl Benz Imidazole Derivatives
Ruchita A Patil*, Sharmila T Patil, Trupti D Dudhgaonkar, Archana R Dhole, Shriniwas K Mohite,
Chandrakant S Magdum
Rajarambapu College of Pharmacy, Kasegaon, Kasegaon, Walwa, Sangali, Maharashtra, India
ABSTRACT
Objective-the objective of present research work to synthesize and screen novel 2-chloromethyl-1-h-benzimidazole
derivative for antibacterial activity. Method-2-chloromethyl-1-H-benzimidazole was prepared by condensing 2-
chloromethyl-1-h-benzimidazole with different aromatic amines and heterocyclic. The synthesized compounds were
screened for their antibacterial activity against stap. Aurious by well plate method. 2-chioromethyl benzimidazole
can be synthesized by the reaction of o-phenylenediamine with chloroaceticacid. This on reaction with substituted
anilines in presence of ethanolic KOH gives corresponding benzimidazolederivatives. The synthesized compounds
were characterized by TLC & IR data.
Keywords : 2-Chloromethyl Benzimidazole, O-Phenylenediamine, Chloroacetic Acid Aniline.
I. INTRODUCTION
In the field of science of technology, medicinal
chemistry has been a fascinating subject. The rapid
development in the last 7 decades has been truly a
challenging and very exciting. Medical chemistry
according to Burger, tries to be based on the ever
inceasing hope that biochemical rationals for drug
discovery may be found.
Medicinal chemistry is the branch of science, which has
remarkable value for synthesis of novel drugs with
intense therapeutic activity. It concern with discovery,
development, identification and interpretation of mode
of action of biologically active compounds at molecular
level.
These developments have provided new challenges and
opportunities for drug research in general and drug
desings in particular. Pure organic compounds, natural
or synthetic products are the chief source of agents for
the cure, the mitigation or the prevention of disease
today. The major objectives of the medicinal chemists
are transformation of path biochemical and
physiological data into a „chemical language‟ with the
aim of designing molecules interacting specifically with
the derailed or degenerating processes in the diseased
organisms.
The development of chemotherapy during past 60 years
constitute one of most important therapeutic advances in
history of medicine and antibacterial drugs are the
greatest contribution of present century to therapeutics.
Potential therapeutic targets are being disclosed with
increasing frequency and the exponential growth will
continue during the next decates.
A. Benzimidazole
The benzimidazole contain a phenyl ring fused to an
imidazole ring,was shown in structure (1).
Figure 1. Benzimidazole

International Journal of Scientific Research in Science and Technology (www.ijsrst.com)
{ PAG
Compounds bearing Benz imidazole nucleus have been
of great interest to synthetic and medicinal chemists for
a long time due to their unique chemical and biological
properties. Historically the first Benz imidazole was
prepared in 1872 by Hoebrecker who obtained 2,5 or
2,6-dimethyl Benz imidazole by the reduction of 2-nitro-
4-methylacetanilide. Several years later Ladenburg
obtained the same compound by refluxing 3,4-
diaminotoluene with acetic acid. The Benz imidazole are
known also as Benz imidazole or
benzoglyoxalines.Thus,Benz imidazole according to this
nomenclature would be called methyl-o-
phenylenediamine and 2-methyl Benz imidazole.
This tautomerism is analogous to that found in the
imidazole and amidines. In fact,the Benz imidazole may
be considered as cyclic analogs of the amidines.
Benz imidazole is a aromatic heterocyclic compound
having imidazole ring fused to benzene. The most
prominentBenz imidazole compound in nature is N-
ribosyl –dimethyl Benz imidazole,which serves as an
axial ligand for cobalt in vitamin B12. The nucleus is
present in some drugs such as proton pump inhibitors
and anthelmintic agents.
Mebendazolethiabendazolewhich have anthelmintic and
antifungal properties are Benz imidazole class of
compounds.Benz imidazole and its derivatives are
widely used as intermediate in synthesisof organic target
compound
includingpharmaceuticals,agrochemicals,dyes,photograp
hic chemicals, corrosion inhibitors ,epoxy curing
agents ,adhesives and plastic modifiers Benz imidazole
is a white to slightly being solid; melting at 145-150 c,
boils at 360°c,slightly soluble in water, soluble in
ethanol. Benz imidazole and its derivatives are used in
organic synthesis and vermicides and fungicides.
Melting points of the synthesized compounds were
determined by open capillary method and were
uncorrected.IR spectral analysis was carried out using
FTIR-410 ,Jasco at Rajarambapu college of
pharmacy,Kasegaon.
Physical properties of Benzimidazole:
1) Benzimidazoleshaving high melting points.The
introduction of substituents at 1-position lowers the
melting point.
2) Benzimidazoles are usually soluble in polar solvents
and sparingly soluble in non-polar solvents.
3) Benzimidazoles are weakly basic,being somewhat
less basic than imidazole.
4) Benzimidazoles are also sufficiently acedic to be
generally soluble in aq. alkali and form N-
metaliccompounds.The acidic properties of
benzimidazole,like those of imidazole,seem to be
due to stabillisation of the ion by resonance.
5) The pKa value of BenzimidazolespKa=5.30 for 2-
methyl Benzimidazoles and pKa=12.33 for 2-amino
Benzimidazoles.
B. Role of Pharmaceutical Chemistry in Drug
Discover
Pharmaceutical chemistry plays important role in
identification of lead compound it is also known as Hit.
So 1) Identification of lead, 2) Optimization of lead,3)
Lead Development these are most important steps in
discovery.
Further chemistry and analysis is necessary, first to
identify and “triage” compounds that do not provide
series displaying suitable SAR and chemical
characteristics associated with long-term potential for
development, then to improve remaining hit series with
regard to the desired primary activity,as well as
secondary activities and physicochemical properties
such that agents will be useful when administered in real
patients.
The next through final synthetic chemical stages involve
production of lead compound in suitable quantity and
quality to allow large scale animal and eventual,
extensive human clinical trials. This involves the
optimization of the synthetic route for bulk industrial
production, and discovery of the most suitable drug
formulation.

International Journal of Scientific Research in Science and Technology (www.ijsrst.com)
{ PAG
Review of Literature:
1) Z. Kazimirerczuk, M. Anderzejewska ET; al. Are
evaluated the synthesized compound for their
activity agaist 4 mycobacterium strains.
2) A. Idhaya Dhullaet. Al.(2011) reported synthesis of
Benz imidazole derivative and their antimicrobial
activity.
3) R. K. Bansal (2005) Heterocyclic chemistry reported
I.R and NMR interpretation.
C. Need of Investigation
Many important biochemical compounds and drugs of
natural origin contain heterocyclic ring
structure .Among thisee. Gcarbohydrate, essential amino
acid, vitamins, alkaloids, glycosides, etc the presence of
heterocyclic structures in diverse type of compounds is
strongly indicative type of the pharmacological activity
and recognition of this is reflected in efforts to find
useful synthetic drugs.
The development of resistant to current antibacterial
therapy continuous to stimulate search for more agents,
the increasing clinical importance of drug resistant and
bacterial pathogens has lent additional urgency to
microbiological research and development of novel
biologically active compounds. Hence the aim of this
work is to synthesize some novel 2-chloromethyl 1-H-
Benzimidazole derivative and carry out antibacterial
potentials with good activity and less toxic effects .the
biological activity of the compounds containing basic
moiety have been well documented.
(1) The present work describes the 2-chloromethyl
1-H-Benzimidazole and their derivatives in
search of bioactive molecules.
(2) Work also emphasized on the structural
elucidation and pharmacological screening for
antibacterial activity of synthesized compounds.
D. Objectives
The discovery and development of pharmacologically
active molecules has been guided not only by classical
medicinal chemistry but also by the use of sophisticated
mechanistic approaches and biochemical assay.
The reviews clearly emohasizes the importance of
heterocyclic in naturally occurring as well as synthetic
agents and does an important class itself posses
diversified pharmacological actions such as
antimicrobial, antiprotozoal, antimalarial and antiallergic
etc. This point encouragement further investigation in
the field. The logic supporting the work presented in this
dissertation was formulated, bearing in mind that the
biological activities of known moieties and attempting
certain structural modification or adaptation in light of
the recent trends in drug research incorporating newly
emerged pharmacophores on existing moiety.
The development of resistance to current anti-bacterial
therapy continues to stimulate the search for more
effective agents. The increasing clinical importance of
drug resistant and bacterial pathogens has lent additional
urgency to microbiologicl research and development of
novel biologically active compounds. Hence in the
present study we plan synthesized some novel
benzimidazoles with good activity and less toxic effect.
E. Microwave Technique
Some derivatives were synthesized by using Microwave
technique. This technique also refers as Green
chemistry.By this technique required time was less and
yield was higher as compare to conventional technique.
Melting points were taken by using Thiele‟s tube
apparatus and were uncorrected. Thin layer
chromatography was used to assess the course of
reaction and the purity of intermediate and final
compounds, giving single spot on TLC plate (silica gel) ,
using various solvent systems. Visualization of spot on
plate was done by exposure to iodine vapours.
Infrared(IR) spectra were recorded in KBR disc on
aJasco FT-IR-410 spectrometer.
F. Chemicals
All chemicals and solvents werw produced from
commercial sources and purified and dried using
standard procedures from literature whenever required.
Chemicals used for the synthesis were enlisted below
with their manufacturer mentioned in parentheses.

International Journal of Scientific Research in Science and Technology (www.ijsrst.com)
{ PAG
O-phenylenediamine - Research laboratory, Islampur
Hydrochloric acid - Research laboratory, Islampur
Chloroacetic acid - Research laboratory, Islampur
Ethanol - Research laboratory, Islampur
Potassium hydroxide - Research laboratory, Islampur.
Ammonium hydroxide - Research laboratory, Islampur
Dimethyl sulfoxide (DMSO).- Research laboratory,
Islampur
G. Preparation of TLC Reagent
For the identification of benzimidazoles using thin layer
chromatographic technique the reagent used is a mixture
of Chloroform and methanol was taken in a ratio of
9:1as shown in fig no. 2
Figure 2. TLC plate of intermediate
Mobile phase: Chloroform:Methanol-9:1
Rf value= Distance travelled by solute/ Distance
travelled by solvent
= 6/9
=0.66
H. Methodology- Scheme of The Experiment
O-Phenylenediamine was condensed in microwave by
using chloroacetic acid in the presence of 5N NaCl to
give 2-chloromethyl-1-h-benzimidazoles using different
aniline derivatives.
Figure 3. Scheme of the Experiment
1st step-Procedure-
In a 250ml three necked flask a solution containing 3gm
of chloroacetic acid and 3gm of O-phenylenediamine
dissolved in a 30ml of 5N HCL. The mixture was heated
for 35 min. on 7th power with constant stirring in
microwave. The reaction mixture is cooled to about 5˚c.
It was neutralized with aq. Ammonium hydroxide or dil.
NaOH. The product was filtered and washed with water
to remove traces of chloromethyl-1 H-benzimidazole
derivatives by using different aromatic amines and
heterocyclic and to evaluate them for antibacterial
activity.
Scheme-1
Figure 4. 1
st step
Scheme-2
2nd
step- procedure
General procedure for synthesis of 1-H-benzimidazole
2-yl-methyl-amine derivatives.
In the ethanolic KOH solution 2-chloromethyl
benzimidazole and substituted anilines were added and it
was heated for 35 min. on 7th power in microwave.Hot
mixture was poured in crushed ice with constant stirring.
Seperated solid was filtered, dried and recrystallized
from ethanol .The yields ranged from 30-45%.

International Journal of Scientific Research in Science and Technology (www.ijsrst.com)
{ PAG
Figure 5. 2
nd step- procedure
Physiochemical data of intermediate and derivatives
(1A, 1B, 1C):
Table 1. Physiochemical data of intermediate and
derivatives
I.R of compound 1A N(1-H-benzimidazole-
2ylmethyl)3-phenyldiazonyl aniline:
Figure 6. I. R. spectrum of comp. 1A
Table 2. I.R spectral data of comp. 1 A
Figure 7. Structure of comp. 1A
I.R of comp. N(1-H-benzimidazole 2ylmethyl) 3-bromo
aniline.
Figure 8. I.R. spectrum data of compound 1B
Figure 9. Structure of compound 1B
Table 3. I. R. spectral data of compound 1B
I. R. of comp. N(1-H-benzimidazole-2ylmethyl) 3-
methoxy aniline:
Figure 10. I. R. spectrum data of comp. 1C
Figure 11. Structure of compound 1C

International Journal of Scientific Research in Science and Technology (www.ijsrst.com)
{ PAG
II. METHODS AND MATERIAL
A. Chemicals
All chemicals and solvents were procured from
commercial sources, purified andsterilized using
standard procedures from literature whenever required.
Nutrient agar medium (Research lab, Mumbai)
B. Dilution of the compounds
All the synthesized compounds were dissolved in
dimethyl sulfoxide (DMSO) so as to get concentration of
200μg/ml and standard drugs Ciprofloxacin in DMSO as
aconcentration of 10mg/ml.
C. Preparation of nutrient agar medium slant:
Nutrient agar medium 112 mg and agar powder 100 mg
was dissolved in 4 ml distilled water, boiled and then
poured in the test tube then plugged with cotton and
sterilized in autoclave at 15lbs pressure (121⁰C) for 15
min. after sterilization thetubes containing the nutrient
agar medium were kept in inclined position for
30min.then on the surface of slants pure culture of
bacillus Substiles, Escherichia coliwere streaked in
aseptic condition and incubated at 37⁰C for 24 hrs.
Antimicrobial Drug sensitivity Tests : Antimicrobial
sensitivity test have been carried out by using disc-
diffusion method, performed in nutrient agar for
bacterial and saboraud‟s agar for fungi. Inoculation of
suspension of bacteria and fungi on culture media:
Sterile, non-toxic cotton swab were dipped in to the
standardized inoculums (turbidity as adjusted as to
obtained confluent growth on the Petri plate) and then
the entire agar surface of the plate was streaked with the
swab three times, turning the plate at 60°angle between
streaking. Then the streaked inoculums were allowed to
dry for 5-15mins with lid in place.
Figure 12. Inoculation of suspension of bacteria and
fungi on culture media
Sterile paper disc made by punching whatman (No.41)
paper were dipped separately in to the solutions
containing synthesized drug (300μg/ml of DMSO) and
standard drug ciprofloxacin (10 mg/ml of DMSO.) &
Flucanazole (10 mg/ml of DMSO) in aseptic condition
with help of sterile forceps and were then placed on the
surface of inoculated culture media after which the
plates were kept in refrigeration for 30 mins. For the
diffusion of the drug from the paper disc in to the culture
media. After 30 mins the plates were incubated at 37⁰C.
Figure 13. Standard (ciprofloxacin) derivative (1A)
SR. NO. COMP. NO NAME OF ORGANISM
E. Coli B.Subtilis
1 1A ++ ++
2 Ciprofloxacin +++ +++
Table 5. Zone of inhibition
Below 6 mm it shows negative activity (-)
Between 6 mm -9 mm (and) sign. (Slight activity)
In between 9 mm – 12 mm (++) sign. (Moderate activity)
In between 12 mm-16mm (+++) sign. (Higher activity)

International Journal of Scientific Research in Science and Technology (www.ijsrst.com)
{ PAG
III. RESULT AND DISCUSSION
The antibacterial activities of synthesized (1A) was
carried out by using disc diffusion method and screened
against Bacillus subtilis, E. Coli microorganism using
standard ciprofloxacin (300µg/ml) and derivative
compound 300,500,700 per ml.
Discussion
Novel compounds 1A, 1B and 1C were found to show
antibacterial activity when checked with Ciprofloxacin
as standard .Compound 1A showed moderate
antibacterial activity against Gram positive, Bacillus
subtilis, while higher activity against Gram negative
(Escherichia-coli).
IV. CONCLUSION
Evaluation of the novel compounds established that
some of the synthesized comp. N (1-H-benzimidazole-
2ylmethyl) 3-phenyldiazonyl aniline, N (1-H-
benzimidazole-2ylmethyl)3-bromoaniline, N (1-H-
benzimidazol-2ylmethyl) 3-methoxy aniline. Showed
antibacterial activity which was not found to be less than
that of ciprofloxacin in case of Gram positive (Bacillus
subtilis) while moderate activity against Gram negative
(E.coli).
V. REFERENCES
[1] Abhishek Tiwari,Anita Singh and Varsha Tiwari.
By Asian journals of Chemistry vol. 23, no.
6(2011). Page no.-2823-2824.
[2] Synthesis of 2-Chloromethyl1-H-benzimidazole
derivatives as antifungal agents.KomalPetkar,
Pranav, PreetiMehta,AnjanaBaro. International
journals of Pharmacy and Pharmaceutical
sciences. Vol.-5 (2013).
[3] ShreenivasBethi, Matta Vidyasagar, Rajmanohar.
K, VenkateshwarRao and Sandeep
Gummudavelly, “Synthesis and Pharmacological
evaluation of new benzimidazol derivatives,” Der
Chemicasinica, 2011;2(1): 84-90.
[4] Kokare, C.C. In pharmaceutical Microbiology,
NiraliPrakashan, 4th edition 2007; 1.1-1.11, 2.1-
2.11.
[5] Y.R.Sharma and John Coates, Interpretation of
Infrared Spectra , A practical approach,
Encyclopedia

IJSRST162457 | Received : 12 August 2016 | Accepted : 16 August 2016 | July-August 2016 [(2)4: 250-254]
© 2016 IJSRST | Volume 2 | Issue 4 | Print ISSN: 2395-6011 | Online ISSN: 2395-602X Themed Section: Science and Technology
250
Opinion Classification from Online Reviews based on Support Vector Machine
Sangram Ashok Patil*1, Prof. K. B. Manwade2
1ME (CSE ) Student,Ashokrao Mane Group of Institutons,Vathar, Kolhapur, Maharashtra, India 2Asst. Prof., Ashokrao Mane Group of Institutions, Vathar, Kolhapur, Maharashtra, India
ABSTRACT
With the rapid growth of internet, a huge number of product reviews are evolved up on the Web. From these
reviews, customers can get direct assessments of product information and direct supervision of their purchase
actions. Meanwhile, manufacturers can obtain immediate advice and opportunities to improve the quality of their
products in a timely fashion. Any customers who buy a product can place their opinion about product features. New
customers who want to buy a product he reads the reviews of the previous customers. So reviews are helps to new
customers to decide to buy a product or not. Product manufacturer are also use the reviews of customer for product
development. Opinions of customers are sentiments about product. Opinions given by customers are not in specific
format and it does not have any syntax to define it. Reviews may be in single word or may be in one sentence or it
may be in multiline format. And every customer has different opinions about product so that new customer need to
read all the reviews this process is difficult and time consuming process. Here we have implement a system for
online reviews classification based on polarity by using support vector machine and provide a review based rating
system. From these online reviews we also find opinion target and opinion word using word alignment model and
shows the topical relation.
Keywords: Feature Extraction, Opinion target and word, Text Classification
I. INTRODUCTION
Now a day’s due to the rapid growth of ecommerce
and increase in online merchants online shopping
dramatically increases. Due to the number of online
merchant sites large number of user’s increases. This
number of customers which purchase online products
increases rapidly. To improve the customer
fulfillment, product manufacturers and merchants
allow customers to review or express their feelings or
opinion about the product or sevices. The customers
can now place a review for products at merchant sites.
These online customer reviews, thereafter, become an
important source of information which can be useful
for both potential customers and product
manufacturers. New customers will use this
information to support their decision on whether to
purchase the product or not. For product manufacturer
customers feedback is more important and
valuable.for product development and marketing.
Since feedbacks of customer affects decision of other
customer's decision, the review documents have
become an important source of information for
business organizations and useful to take development
plans. Opinion Mining deals with the broad area of
natural language processing and text mining involving
the computational study of opinions, sentiments and
emotions expressed in text. Hence, an alternate term
for Opinion Mining is also called as Sentiment
Analysis. Opinion mining has many application
including science and technology, entertainment,
education, politics, marketing, accounting, law,
research and development. But with the tremendous
growth of the World Wide Web, has large number of
text opinions in the form of blogs, reviews, discussion
groups are available for analysis making the World
Wide Web the fastest, most broad and easily
accessible medium for sentiment analysis.

International Journal of Scientific Research in Science and Technology (www.ijsrst.com)
251
II. METHODS AND MATERIAL
A. Literature Review
1. According to Hu and Liu, Ding et al., Li et
al[1],[2], opinion target extraction can be divided
into two main categories: supervised and
unsupervised methods. In supervised approaches,
the opinion target extraction task was usually
regarded as a sequence labeling task where
several classical methods are used such as CRFs.
2. According to Li, Jin, Huang, Ma and Wan Wu
et al[3], [4], et al., the main limitation of
supervised and unsupervised methods is that
labeling training data for each domain is time
consuming and impracticable. In unsupervised
methods, approaches regarded opinion words as
the important indicators for opinion targets.
3. Hu, Liu et al [5], exploited an association
(Nearest Neighbor rule) mining rule algorithm
and frequency information to extract relation
among words.
4. Qiu et al [6], proposed a Double Propagation
method to expand sentiment words and opinion
targets iteratively, where they also exploited
syntactic relations between words. The main
limitation of Qiu’s method is that the patterns
based on dependency parsing tree may introduce
many noises for the large corpora. Besides the
patterns used in Qiu’s method, they adopted some
other special designed patterns to increase recall.
5. Lui et al[5], employed word alignment model to
capture opinion relations rather than syntactic
parsing. These alignment methods are more
effective than syntax based approaches for online
informal texts.
6. The Naive Bayes algorithm [8] is generally used
algorithm for document classification. Naive
Bayes is a simple and effective classification
algorithm. The basic idea is to find probabilities
of categories for given a test document by using
the joint probabilities of words and categories.
The naïve part of model is the assumption of
word independence. The simplicity makes the
computation of Naive Bayes classifier far more
efficient.
7. The K-nearest neighbor (KNN) [9]is example
based classifier that does not build an explicit,
declarative representation of the category. For
given a test document d, then among training
documents system finds the k nearest neighbors.
The resemblance score of each nearest neighbor
document to the test document is used as the
weight of the classes of the neighbor document
(Songho tan, 2008). Besides this classifier other
classifiers like ID3 and C5 are also investigated
(Rudy Prabowo, 2009).
8. Rui Xia, Ziqiong, Songho tan, Rudy Prabowo,
[7] [8]et.al. proposed a Support vector machines
(SVM). SVM is a discriminative classifier is
considered the best text classification method.
The support vector machine is a statistical
classification method. SVM seeks a decision
surface to separate the training data points into
two classes and makes decisions based on the
support vectors that are selected as the only
effective elements in the training set. Multiple
variants of SVM have been developed in which
Multi class SVM is used for Sentiment.
B. Proposed Work
Opinion mining is viewpoint of text mining. To
conclude some decision from the reviews or the
feedbacks retrieved from the user customers opinions
are generally taken to collect the thoughts and various
aspects of the product that also include the technical
details. Once the opinions are collected the filtration
over reviews are performed to identify most relevant
information in the form of opinion class or sentiment
class.
The proposed work has following objectives
To design a system to perform feature extraction
from user reviews and relevant feature selection
from multi sentence reviews.
To implement opinion classification based on
polarity.
To implement rating system based on data which
is classified in different polarities.
To design and implement a system which
construct topical relation between sentences of
reviews
Following techniques are used for proposed work
Feature Relational Network (FRN) algorithm can
be used to for feature extraction. FRN is based on
N-gram technique which is used for separating

International Journal of Scientific Research in Science and Technology (www.ijsrst.com)
252
text in different grams such as N-char or N-
words. These N-grams are used for feature
extraction and to find association that will be used
in classification further.
The Support Vector Machine is discriminative
(SVM) classifier used for text classification. SVM
is based on decision planes that define decision
boundaries. Decision plane separates set of
objects having different class membership. When
SVM is used with FRN it gives good performance
Calculating the rating for product based on the
reviews.
The Word alignment model used to find the
opinion target and words in the reviews. We use
here phrase based technique which use noun verb
phrases in the review.
C. Proposed Architecture
Figure 1: System Architecture
The proposed architecture consists of four modules.
1. Feature Extraction Module
Feature Extraction Module take review dataset as
input. The dataset contains the product reviews which
are given by customer on merchant’s site. This review
dataset is used for preprocessing to remove noisy,
erroneous, and inconsistent data. This preprocessed
data is then used for feature extraction. All text
features are extracted using n-gram feature set. The n-
gram feature set using character level n-gram, word
level n-gram, and part of speech tag n-grams and so
on. Character N-gram based on set of characters.
Word level N-gram is based on group of words. It
extracts all the feature text from reviews. Suppose the
sentence is like “I love this smart phone”
N-gram Category Examples
1-char I, l, o, v, e, t, h, i, s, s, m, a, r,
t, p, h, o, n, e
2-char Il, ov, et, ,hi, ss ma, rt, ph
1-word I, love, this, smart, phone
2-word I love, this smart
Table 1 : N-gram Feature set
2. Feature Selection Module
Text features selected by Feature Extraction Module
are used by Feature Relational Network (FRN). FRN
algorithm is used to select text feature considering
relevance between features and redundancy factors. It
uses a rule based multivariate text feature selection
method that considers semantic information and
syntactic relationship between n-grams features in
order to efficiently remove redundant and irrelevant
features. FRN utilizes subsumption relation which
enables intelligent comparison between features to
facilitate removal of redundant and irrelevant features.
FRN also assigns numeric values called as weight to
the features.
Feature
group
Subsumption Relation
N-Char 1-char -> 2-char, 1-char -> 3-char, 2-char
-> 3-char,
N-Word 1-word->2-word, 1-word->3-word, 2-
word->3-word
Table 2 : Subsumption relation
3. Feature Classification Module
Features are classified by using Support Vector
Machine (SVM) classifier SVM is discriminative
classifier and it is the best text classifier. It is a
statistical classification method. SVM separates
decisions surface into separate training data points
into classes and perform classification based on
Support vector. Reviews are in the form of text so

International Journal of Scientific Research in Science and Technology (www.ijsrst.com)
253
reviews need to be converting in SVM representation
to perform classification. Each review is then
converted into numeric value names as data points.
Each review is considered as four dimensional points.
Using numeric representation of review text SVM
perform classification on input data. Features are
placed in different classes depends on polarity.
4. Rating Module
Rating module used to calculate the rate for test
review and its following class of review. This module
also used to calculate the overall rating of the product
from all reviews.
D. Implementaion Steps
Figure 2: Implementation Steps
The implementation steps are as follows:
Step 1: In first step we load the dataset which is used
for training. The data set is in the json format we first
extract and then transform it mysql database for easy
access and then extract only reviews in single file.
Step 2: In step 2 preprocessing is done on the reviews
from file to remove stopwords.
Step 3: Feature extraction is done using n-gram in
step 3.
Step 4: Feature Selection is performed by using
feature relational network.
Step 5: In step 5 SVM data points are calculated
which are used for SVM training. These data points
are numeric values on which SVM is works.
Step 6: By using SVM data points SVM is trained in
step 6.
Step 7: Test on single and multiple reviews are
performed and ratings are calculated.
Step 8: In last step opinion words and targets are
calculated and we show the relation between them
graphically.
E. Scope
Proposed work is based on opinion mining and text
classification. Classification is done on based on
polarity.
Using N-gram feature set we find the features from
text review. N is any positive number used in feature
extraction. Here we use value of N is 3 because to
find feature relational network it requires the same
value.
Feature relational network (FRN) finds the relation
between features and association between them.
Support Vector Machine is classifier which classifies
text in classes. Classes need to be predefined. It works
on numeric data so here needs to convert text into
numeric value and based on these values SVM is
trained.
Word alignment model finds the opinion words and
opinion targets from reviews. Target is entity on
which opinion is given and opinion word is opinion
about the product or target.
III. RESULTS AND DISCUSSION
The experiment for the classification on data is
performed by SVM algorithm carried out on review
dataset. The approach proposed for text review data
and classifies the review in positive, negative and
neutral classes. The result analysis is done on the

International Journal of Scientific Research in Science and Technology (www.ijsrst.com)
254
classification for accuracy factor. The accuracy is
calculated by calculating precision and recall for the
input data. In graph following graphs horizontal axis
represent number of input reviews to system and
vertical axis represent precision and recall of review
classification for first graph and percentage accuracy
of classification for second graph. The graph 1 shows
that for less number of reviews precision is less than
the recall. After gradually increasing the number of
input reviews precision gets increases and recall
decreases. Graph 2 is for accuracy which is based on
precision. Accuracy increases as the number of
records increases.
Graph 1: Precision and recall for proposed system
(Classification)
Graph 1: Accuracy of Classification
IV.CONCLUSION
In the proposed work classification of online reviews
are and rating calculation is performed. In proposed
framework is combination of feature extraction from
reviews by feature relational network and
classification of these reviews based on support vector
machine. Feature relational network allows finding
relevant feature by using N-gram technique and
selecting the features by using FRN. Support vector
machine takes review text as input and classify them
to the different classes like positive, negative or
neutral depending on the training pattern. Here we
also perform a rating of the product based on the
review. The proposed system gives classes of reviews
with rating which is useful for the user for to take
decision about purchasing product and they can easily
supervise the product.
V. REFERENCES
[1] Kang Lui, Liheng Xu, and Jun Zhao,
"CoExtracting Opinion Targets and Opinion
Words from Online Reviews Based on the Word
Alignment Model", IEEE Transactions on
Knowledge and Data Engineering, Vol.27 No.3
March 2015
[2] Ding et al., Xiaowen Ding, Bing Liu, and Philip
S. Yu, "A holistic lexicon-based approach to
opinion mining", In Proceedings of the
Conference on Web Search and Web Data Mining
(WSDM), 2008.
[3] Fangtao Li, Chao Han, Minlie Huang, Xi-aoyan
Zhu, Yingju Xia, Shu Zhang, and
HaoYu,"Structure-aware review mining and
summarization", In Chu-Ren Huang and Dan
Jurafsky, editors, COLING, pages 653–661.
Tsinghua University Press, 2010.
[4] Wei Jin and Hay Ho Huang, "A novel lexicalized
hmm-based learning framework for web opinion
mining", In Proceedings of International
Conference on Machine Learning (ICML), 2009.
[5] Mingqin Hu and Bing Liu, "Mining opinion
features in customer reviews", In Proceedings of
Conference on Artificial Intelligence (AAAI),
2004.
[6] Guang Qiu, Bing Liu, Jiajun Bu, and Chun Che,
"Expanding domain sentiment lexicon through
double propagation", 2009.
[7] Ahmad Abbasi, Stephen France, zhu zhang, and
Hisinchun Chen, "Selecting Attributes for
Sentiment Classification using Feature Relational
Network", IEEE Transactions on Knowledge and
Data Engineering. Vol 23. No 3. Page 447-462.
2011
[8] Loubes, J. M. and van de Geer, S "Support vector
machines and the Bayes rule in classification",
Data mining knowledge and discovery 6 259-
275.2002
[9] Gongde Guo, Hui Wang, David Bell, Yaxin Bi
and Kieran Greer, "KNN Model-Based Approach
in Classification", Proc. ODBASE pp- 986 – 996,
2003

IJSRST162451 | Received : 01 August 2016 | Accepted : 17 August 2016 | July-August 2016 [(2)4: 255-258]
© 2016 IJSRST | Volume 2 | Issue 4 | Print ISSN: 2395-6011 | Online ISSN: 2395-602X Themed Section: Science and Technology
255
Correlation Analysis of Irrigation Water Quality parameter from the major rivers in the Amansie West District, Ashanti Region,
Ghana Gabriel W. Quansah*1, Joseph Fening2, Kwabena Nketia3, Eric Asamoah3, Ekow Gaisie4
*1Soil Chemistry and Mineralogy, Soil Research Institute, Kumasi, Ghana
2Soil Microbiology, Soil Research Institute, Kumasi, Ghana
3Soil Genesis, Survey and Evaluation, Soil Research Institute, Kumasi, Ghana
4Soil and Water Conservation, Soil Research Institute, Kumasi, Ghana
ABSTRACT
A research was conducted at Amansie West District in the Ashanti Region of Ghana to establish the correlation
between irrigation water quality parameters from the major rivers and their tributaries. Data collected were
subjected to statistical analysis SPSS version 20. Pearson correlation coefficient was estimated to test the degree of
relationship between irrigation water quality parameters. There was positive correlation between SAR and Ca, Mg,
K, Na, ECw, and TDS except the ratio of Ca: Mg which showed negative correlation. Analysis of the correlation
between SAR and HCO3- and CO3
2- is highly recommended.
Keywords: Irrigation, Water Quality, Correlation, Rivers
I. INTRODUCTION
The mining industry is the backbone of many economics
in the developing countries. Its recovery in Ghana since
1989 was compelled by the global paradigm which
emphasizes private sector-led development as the engine
of economic growth in developing countries. The
historical importance of mining in the economic
development of Ghana is evident in the country’s
colonial name, Gold Coast (Akabzaa T. and Darimani
A., 2001).
The mining industry of Ghana accounts for 5% of the
country's GDP and minerals make up 37% of total
exports, of which gold contributes over 90% of the total
mineral exports. Export earnings from minerals
averaged 35%, and the sector is one of the largest
contributors to Government revenues through the
payment of mineral royalties, employee income taxes,
and corporate taxes and employment generation. The
mining industry therefore remains critical to Ghana’s
socio-economic growth and development. (Ghana
Chamber of Mines, 2008).
Small and large-scale mining operations are inherently
affecting the environment, producing enormous
quantities of waste that can have negative impacts for
decades (UNEP, 1997). Mining activities that affect
water quality include the disposal of waste rock, tailings
deposition, and effluent discharges from different stages
of mineral processing (Dock, 2005). According to
Ripley (1996) effluent released from gold mines is made
up of heavy metals mainly from pyrite (FeS2) and
chalcopyrite (CuFeS2). Koryak (1997) argues that the
effluent produced from waste rock dumps has a potential
of causing acid mine drainage (AMD) in stream and
river waters.
An important chemical parameter for assessing the
degree of suitability of water for irrigation is sodium
content, which is expressed as the sodium adsorption
ratio (SAR) measures the potential dangers posed by
excessive sodium in irrigation water (Alagbe, 2006).
When residual sodium carbonate (RSC) is positive,
calcium is lost from the soil solution and increases SAR
in the soil solution, thereby increasing the sodium
hazard (Hopkins et al, 2007).

International Journal of Scientific Research in Science and Technology (www.ijsrst.com)
256
The quality of freshwater is mainly affected by natural
processes such weathering and soil erosion as well as
anthropogenic activities. The anthropogenic activity
represents a constant polluting source whereas surface
runoff is a seasonal phenomenon, mainly affected by
climatic conditions (Singh et al., 2004). Water quality
monitoring has a high priority for the determination of
current conditions and long term trends for effective
management.
The purpose of the study was to use correlation analysis
in assessing irrigation water quality parameters of water
from the major rivers and their tributaries in the
Amansie west district.
II. METHODS AND MATERIAL
A. Description of the study area
Amansie West District is located in the Ashanti Region
of Ghana, and it is an area where Galamsey activities
(illegal mining) are very rampant (Figure 1).
Rivers served as a source of drinking water for the local
people living in the area and currently serves as
irrigation water for the farmers in the area especially
during dry season and erratic weather condition.
Figure 1: Map of Ashanti Region showing the
location of the study area
The climate is characterized by a dry season between
December and February, highest rainfall in June (major
season), and a cooler and drier period in August with
smaller rainfall in October (minor season).
The average monthly temperature ranges from 23.2o C
in August to 26.8o C in February, and average monthly
humidity range from 84.7% in August to 75.3% in
January (Quansah et al., 2016).
The data used for the correlation analysis was obtained
from the research previously done by Quansah et al,
2016. These data were used to estimate the Sodium
Adsorption Ratio (SAR) and the ratio of calcium to
magnesium.
B. Statistical analysis
Data collected were exposed to statistical analysis SPSS
version 20. Pearson correlation coefficient was
evaluated to test the degree of relationship between
irrigation water quality parameters. This was calculated
using the relation:
2222
yynxxn
yxxynr
According to Pallant (2011, p. 134), a correlation
coefficient can be described as: small correlation -0.10 ≤
r ≤ 0.29, medium correlation - 0.30 ≤ r ≤ 0.49 and large
correlation - 0.50≤ r ≤ 1.0. The positive and the negative
point to the direction of the relationship, where the
positive indicates an increase in one variable associated
with an increase in the other, whilst the negative
correlation means an increase in one variable related to a
decrease in the other. The coefficient of determination
which explains the changes in one variable as explained
by the changes in the other variable (r2) was calculated.
III. RESULTS AND DISCUSSION
Tables 1 and 2 show average values of the irrigation
water quality parameters and the correlation between
these parameters from major rivers and their tributaries
in the Amansie West District in the Ashanti Region of
Ghana.
The range of pH in the samples is from 5.8 to 6.9 with
mean of 6.5 which is moderately acidic and suitable for
irrigation purpose according to Chiroma et al., 2014.
(Table1). Temperature, electrical conductivity (ECw) and

International Journal of Scientific Research in Science and Technology (www.ijsrst.com)
257
Total dissolve solids recode maximum of 24.30oC,
184.70µscm-1
and 92.50mg/l with mean of 24.09oC,
121.1 µscm-1
and 60.67mg/l.
A. Correlation analysis
From the Pearson correlation coefficient SAR showed
positive correlation with Ca (+0.126), ECw (+0.025), K
(+0.771), Mg (+0.100) and Na (+0.872), but the
correlation is very strong in K+ and Na
+ indication that
an increase in Na+ and K
+ lead to increase in SAR. This
is so because SAR is determined using Na+. This is
expected for Na+ since an increase in SAR indicate high
availability of Na+ in the irrigation water and hence in
soils. A high SAR value implies a hazard of sodium
(alkali) replacing Ca2+
and Mg2+
in the soil through a
cation exchange process that damages soil structure,
mainly permeability, and which ultimately affects the
fertility status of the soil and reduces crop yield (Gupta,
2005).
SAR also showed weak negative correlation with Ca:Mg
ratio and this could be explained by the fact that
according to Michael, 1992, the bonding energy of Mg2+
is less than that of Ca2+
, allowing more Na+ adsorption
and this can be seen clearly when the ratio exceeds 4.0
The presence of high Na+ in irrigation water promotes
soil dispersion and structure breakdown when Na+ to
Ca2+
ratio exceeds 3.1(Michael, 1992). This also results
in severe water infiltration problems, mainly due to
insufficient Ca2+
to suppress the dispersing effect of Na+
(Ayers and Westcot, 1985). Excessive Na+ also creates
problems in crop water uptake, poor seedling emergence,
lack of aeration, plant and root disease (Ayers and
Westcot, 1985).
TABLE I
MEAN VALUES OF THE IRRIGATION WATER QUALITY
PARAMETERS
Sample pH Temp ECw TDS Ca
oC µscm
-1 mg/l
Mean 6.451 24.09 121.1 60.67 6.77 4.75 0.04 0.06 0.75 0.002
Range 5.8-6.9 23.90-
24.30
72.60-
184.7
36.30-
92.50
3.20-
12.82
1.46-
7.78
0.01-
0.07
0.010-
0.013
0.30-
1.33
0.001-
0.004
TABLE II
MEAN VALUES OF THE IRRIGATION WATER
QUALITY PARAMETERS (CONTINUATION)
Sample Mg Na K Ca:Mg SAR
mg/l
Mean 4.75 0.04 0.06 0.75 0.002
Range 1.46-
7.78
0.01-
0.07
0.010-
0.013
0.30-
1.33
0.001-
0.004
TABLE III
CORRELATION COEFFICIENTS AMONG
SELECTED WATER QUALITY PARAMETERS
Variates Ca Ca:Mg ECw K
Ca -
Ca:Mg -0.3796 -
EC 0.7152 0.1275 -
K 0.5157 0.0814 0.5172 -
Mg 0.5047 0.5538 0.8011 0.5779
Na 0.3955 0.0457 0.4214 0.9414
SAR 0.1256 -0.0682 0.0248 0.7705
TDS 0.7134 0.1286 1.0000 0.5160
TABLE IV
CORRELATION COEFFICIENTS AMONG
SELECTED WATER QUALITY PARAMETERS
(CONTINUATION)
Variates Mg Na SAR TDS
Ca
Ca:Mg
EC
K
Mg -
Na 0.4754 -
SAR 0.0998 0.8716 -
TDS 0.8013 0.4205 0.0233 -
IV. CONCLUSION
The quality of irrigation water available to farmers and
other irrigators has considerable impact on what plant
can be successfully grown, the productivity of these
plants, water infiltration and other soil physical

International Journal of Scientific Research in Science and Technology (www.ijsrst.com)
258
conditions. It is obvious that the quality are within the
permissible limits for irrigation water and therefore
suitable for irrigation purpose. SAR showed positive
correlation with all the parameters except the ratio of Ca
to Mg.
V. REFERENCES
[1] Akabzaa T. and Darimani A. (2001) - Impact of
Mining Sector Investment in Ghana: A Study of
the Tarkwa Mining Region, SAPRI, Accra.
[2] Alagbe, S. A. (2006). Preliminary evaluation of
hydrochemistry of the Kalambaina formation,
Sokoto Basin, Nigeria, Environmental Geology.
51, 39-45.
[3] Amfo-Otu, R. Wiafe, E. D., Kocke, B. B. (2011).
Assessment of water quality in Ahor Lake-Ghana.
African Journal of Environmental Science and
Technology Volume 5(12) pp. 1093-1099).
[4] Ayres, R. S., Westcot D.W., (1985). Water
Quality for Agriculture. Irrigation and Drainage
Paper No. 29. Food and Agriculture Organization
of the United Nations. Rome. p. 1-117.
[5] Chiroma T. M., Ebewele R. O. and Hymore F. K.
(2004). Comparative assessment of heavy metal
levels in soil, vegetables and urban grey waste
water used for irrigation in Yola and Kano.
International Journal of Engineering and Science.
P. 01-09.
[6] Dock, L., 2005. Mining and Environment. Acid
Mine Drainage and its effects on the environment.
University Lecture Notes. Lulea, Sweden.
[7] Quansah, G., Sadick, A., Fening, J., Nketia, K.
and Asamoah, E. (2016). Effect of Illegal Mining
Activities on Water Resources for Irrigation
Purposes, Amansie West District, Ghana.
International Journal of Scientific Research,
Engineering and Technology. (Under Review)
[8] Ghana Chamber of Mines (2008) - Factoid,
www.ghanachamberofmines.org
[9] Gupta, P.K. (2005). Methods in Environmental
Analysis: Water, Soil and Air. Agrobios, Jodhpur,
India, pp. 1-127.
[10] Koryak, M., 1997. Origins and ecosystem
degradation impacts of acid mine drainage. U.S.
Army Corps of Engineers. Available at
http://www.army.mil/misc/AMD_Impacts.htm.
Accessed (24/11/2007).
[11] Michael, A. M. (1992). Irrigation Theory and
Practices. Vikash Publishing House Pvt. Ltd.,
New Delhi, India. pp. 686- 740.
[12] Pallant, J.( 2011). SPSS Survival Manual: A Step
by Step Guide to Data Analysis Using SPSS
fourth Edition. Allen & Unwin, Australia.
[13] Raihan, F. and Alam, J.B. (2008). Assessment of
groundwater quality in Sunamganj of Bangladesh.
Iranian Journal of Environmental Health Science
& Engineering. 5, 155-166.
[14] Richards, L. A. (1954). Diagnosis and
Improvement of Saline and Alkali Soils, U. S.
Department of Agriculture Handbook, Vol. 60,
Washington D. C., USA. p.160.
[15] Ripley, E.A., 1996. Environmental effect of
Mining. Delray Beach, St Lucie press. Florida,
USA.
[16] Singh. K.P., A. Malik. D. Mohan and S. Sinha.
(2004). Multivariate Statistical Techniques for the
Evaluation of Spatial and Temporal Variations in
Water Quality of Gomti River (India) - a Case
Study. Water Research, 38 (18): 3980-3992.
[17] [19] UNEP (United Nations Environment
Program), 1997. Industry and environment,
mining and sustainable development. Available at
http://www.uneptie.org/vol20no4.html

IJSRST1624522 | Received: 02August2016 | Accepted:22August2016 | July-August-2016 [(2)4: 259-265]
© 2016 IJSRST | Volume 2 | Issue 4 | Print ISSN: 2395-6011 | Online ISSN: 2395-602X Themed Section: Scienceand Technology
259
The Technical Teacher, Teaching and Technology: Grappling with the
Internationalization of Education in Nigeria Okworo Gibson Samuel
1, Caleb E. E.
2,Touitou Tina C.
3
1Department of Educational Technology and Library Science, Faculty of Education, University of Uyo, Uyo, Akwa
Ibom State, Nigeria 2Department of Vocational Education, Faculty of Education, University of Uyo, Uyo, Akwa Ibom State Nigeria
3Department of Mass Communication, Babcock University, Iishan-Remo, Ogun State Nigeria
ABSTRACT
This paper discussed the challenges faced by the technical teacher in the light of heightened societal expectations.
The identity and functions of the technical teacher is changing with respect to new trade areas and skills occasioned
by new technologists, objectives of education, new policy thrust tilting towards entrepreneurship as well as the
issues of internalization of education. These issues are discussed in details using relevant subheadings. It is
concluded that the technical teacher, then, needs to be knowledgeable himself, improving on his skills, knowledge
and experience for him to be able to impart new and relevant skills to the students. Until the education of the
teacher is taken as paramount as that of the student, no student will ever be better than his/her teacher. It was
recommended amongst others that the ministry of education should engage in periodic training of technical teachers
on new trends in their chosen fields, to improve their knowledge of their chosen professions and the ministry of
education should consider credit transfer system for the west African sub region, where a student can start a
technical course in Nigeria and finish in any other participating country in west Africa.
Keywords : Education; Quality of teaching; Technical Teacher; Technology; Globalization
I. INTRODUCTION
The question of what knowledge, attitudes, behaviours
and skills teachers should possess has been a
longstanding issue of debate. This is simply because
teachers are saddled with the responsibility of
developing students through the provision of
information, advice, wisdom and facilitating learners'
acquisition of the key knowledge, attitudes and
behaviours that they will need to be active participants
in society. However, with heightened societal
expectations from education and the challenge of
internalization of education, upon the dynamic role of
technology in shaping educational outcomes, the identity
and functions of the Technical teacher as well as the
environment in which they function, needs to be
reviewed. Nonetheless, such reviews can only be
effective only when an appraisal of current trends in the
technical teaching profession is carried out. This study
explores the roles of technical teachers; Issues in
teaching technology education/industrial programmes as
well as the challenges of internalization of education
with respect to the Nigerian context.
II. METHODS AND MATERIAL
A. The Changing Roles of the Technical Teacher
The technical teacher is an essential factor in the
delivery of instruction to students, regardless of the
mode of instruction. A teacher has professional
knowledge and skills gained through formal preparation
and experience. Teachers provide personal, caring
service to students by diagnosing their needs and by
planning, selecting and using methods and evaluation
procedures designed to promote learning. The
educational interests of students are best served by
teachers who practice under conditions that enable them
to exercise professional judgment.

International Journal of Scientific Research in Scienceand Technology (www.ijsrst.com)
260
Teachers have been portrayed in a number of ways in
media, more often than not, with detrimental images and
some, they take the face of the hero of societies, as the
one who masters his/her craft and helps students excel.
The effective teacher can be seen, heard and sensed.
Teachers are the front-line service providers in
education. Good teachers do more than teach
curriculum content: they inspire and enthuse their pupils
while also serving as role models, in terms of attitudes
and social relationships as they model behaviours. The
role of technical teachers is to promote the acquisition of
technical skills as well as scientific knowledge that will
help the students develop employability skills as well as
become participative and responsible citizens.
Mahmood (2013) observed that teachers performance
consists of teachers academic qualification, quality of
teacher training, teaching experiences, pedagogical
practices, professional development, mentoring,
coaching, subject knowledge, dedication, commitment
level and classroom management abilities. The demands
made on teachers, school leaders, and teacher educators
are increasing and changing. They are called on to play a
key role in modernising education. The challenges
facing vocational education and technical training
systems in developing countries and transition
economies like Nigeria and indeed, Africa are immense.
They must equip learners with new skills and
competencies and educational institutions must do all of
this for more learners with different backgrounds,
experiences, levels of motivation and preferences.
According to Harden and Crosby(2000), implicit in the
widely accepted and far reaching changes in education
is the changing role for the teacher. twelve roles for the
teacher have been identified in this regard and these
can be grouped into six areas in the model presented;
The Information Provider; the role model on the job and
in more formal teaching settings; the facilitator as a
mentor and learning facilitator; the student assessor and
curriculum evaluator; the curriculum and course planner;
the resource material creator and study guide producer.
The teacher is the yardstick that measures all the
achievements and aspirations of the society. The worth
and potentials of country get evaluated in and through
the work of the teacher. The people of a country are
enlarged versions of their teacher and they are the real
nation builders. There should therefore be adequate
quality provision for effective learning to occur. This
requires taking measures to including increase in teacher
employment and improvement in the quality and status
of the teaching force.
A key element of education in Nigeria is the Technical
Education, aimed at developing manpower for the
nation’s economy. This is done through occupational
training in specific trades by mostly Technical colleges
and Polytechnics across Nigeria. Education for
employability and self-reliance has been gaining
momentum amongst policy makers and the policy thrust
in recent times has been towards entrepreneurship
education through vocational and technical education
training. The burden of transformation rests on the
training institutions and the teachers, to turn policies into
practice, implement educational reforms while also
bringing learning closer to the students of today, by
introducing technology and student centred approaches
to instruction.
B. The Technical Teacher and the Quality of
Teaching in the Knowledge Economy
In its broadest sense, teaching is a process that facilitates
learning. Teaching is the specialized application of
knowledge, skills and attributes designed to provide
unique service to meet the educational needs of the
individual and of society. The choice of learning
activities whereby the goals of education are realized in
the school is the responsibility of the teaching
profession. In addition to providing students with
learning opportunities to meet curriculum outcomes,
teaching emphasizes the development of values and
guides students in their social relationships. Teachers
employ practices that develop positive self-concept in
students. Although the work of teachers typically takes
place in a classroom setting, the direct interaction
between teacher and student is the single most important
element in teaching.
What society expects of teachers depends in large part
on what it wants from education per time. National
educational policies have been marked by an increasing
concern for quality and relevance, especially in practical
skills acquisition. Education systems in Nigeria, it is
widely felt, are not performing effectively, not doing
what they should be doing to ensure that the young

International Journal of Scientific Research in Scienceand Technology (www.ijsrst.com)
261
people passing through them learn well what they are
supposed to learn and are well prepared to assume their
future adult roles and responsibilities in the family, the
workplace and the wider community and society. In
many countries in Africa, Nigeria inclusive, there is a
growing sense that education is the key to the future and
that the challenges and jobs of tomorrow will require an
education of better quality than that which most students
receive today.
Increasingly, educational quality and relevance are
defined by reference to students’ learning outcomes. Yet
if learning is to improve, teaching will need to contribute
to that improvement. The importance of the quality of
teaching, and therefore of teachers, cannot be
overemphasized (Asia-Pacific Centre of Educational
Innovation for Development, 1996).
Traditional educational systems, in which the teacher is
the sole source of knowledge, are ill suited to equip
people to work and live in a knowledge economy. Some
of the competencies such a society demands includes
teamwork, problem solving, motivation for lifelong
learning cannot be acquired in a learning setting in
which teachers dictate facts to learners who seek to learn
them only in order to be able to repeat them. A lifelong
learning system must reach larger segments of the
population, including people with diverse learning needs.
It must be competency driven rather than age related.
Within traditional institutional settings, new curricula
and new teaching methods are needed. At the same time,
efforts need to be made to reach learners who cannot
enroll in programmes at traditional institutions.
According to the World Education report of 2008,
corroborated by National reports presented at the 45th
session of the International Conference on Education
(1996), providing people with the tools they need to
function in the knowledge economy requires adoption of
a new pedagogical model. This model differs from the
traditional model in many ways. Teachers and trainers
serve as facilitators rather than transmitters of
knowledge, and more emphasis is placed on learning by
doing, working on teams, and thinking creatively.
According to Kirimi and Wycliffe (2013), the increased
emphasis on student autonomy in education has shifted
the centre of gravity away from the teacher and closer to
the student. Indeed, it has become the trend to focus on
the learning and the learner than on teaching and the
teacher. However, it has to be recognized that teaching
and learning are closely linked and that the purpose of
teaching is to enhance learning. It is important to state
that the changing role of the teacher is not neglected.
The role of the teacher becomes that of facilitating
learning rather than primary sources of information,
instruction becomes interaction in the classroom and the
students assume a more active role in the teaching and
learning process. The students become increasingly
responsible for their learning, giving them more
motivation and setting the pace for them to become
successful life-long learners. The teacher in turn
becomes a resource, tutor and evaluator, guiding the
students in their problem solving efforts. Though the
teacher instructs the students, the teacher gradually
removes the support offered to the learners as instruction
and interaction continues and as the learners gradually
internalizes and understands the content and are able to
do more on their own.
C. Teaching Technology Education: Integration and
Professional Use of Technology
From investigating instructor attitudes toward
technology and the utilization of computers in schools,
researchers concluded that the use of technology for
curricular purposes is almost exclusively a function of
teachers’ access to that technology (Norris, 2003).
Questions concerning teachers and teaching have
emerged at the centre of debate over how education can
make best use of the new information and
communication technologies. This is a new key feature
of professionalism in teaching, requiring an
understanding of the pedagogical potential of technology
and the ability to integrate it into teaching strategies.
The use of technology has long been the strength of
Vocational/Technical education, but changing
technologies and automation continue to alter the nature
of work tasks in industries for engineers and technicians
(Thach & Woodman, 1994), requiring employees to
learn new ways to perform their jobs. The technical
teachers as Educators, increasingly recognize that in
order to teach creatively, teachers need to shift from
traditional teaching toward approaches that help students
incorporate technology into their learning. However,
such a transformation of curriculum and pedagogy is a
complex task for teachers who must develop new

International Journal of Scientific Research in Scienceand Technology (www.ijsrst.com)
262
knowledge, skills and attitudes themselves (Wiske, Sick,
and Wirsig, 2001). To bring learning closer to the
technology savvy students of the information society,
Technical teachers need to develop technological
competencies. The Teacher Technology Competencies
are a set of technology standards that define proficiency
in using computer technology in the classroom. The
competencies consist of computer-related skills grouped
into personal and professional use of technology tools
and application of technology in instruction. the
competencies are grouped into:basic technology
operations; personal/professional use of technology;
social and ethical issues and application of technology to
instruction. In Basic Technology Operation, the
Technical teacher must be able to demonstrate the use
of a multimedia computer system with related devices in
order to run programs; to access, generate, and
manipulate data; and to communicate results. At this
level, technical teachers need to be conversant with
technological tools and their operations.
In the Personal/Professional Use of Technology Tools,
Instructional staff will apply tools for enhancing their
own professional growth and productivity. Technical
teachers will use technology in communicating,
collaborating, conducting research, and problem solving.
Activities here include: specialized technical packages
such as Auto CAD, electrical design softwares, building
design softwares; databse management skills; Word
processing; Database; Spreadsheet; Graphics;
Multimedia applications; Telecomputing and
Teacher/administrative Applications.
The Social, Ethical, and Human Issues- the technical
teacher is expected to demonstrate knowledge of equity,
ethics, legal, and human issues concerning the use of
computers and technology. Issues of national policy on
education, technology guidelines - ethics / Acceptable
Use Policy.
In the Application of Technology in Instruction - the
technical teacher is expected to apply computers and
related technologies to support instruction in their grade
level and subject areas. Technical teachers must plan
and deliver instructional units that integrate a variety of
software, applications, and learning tools. Lessons
developed must reflect effective grouping and
assessment strategies for diverse populations.
The single most important factor in determining the
success of technology in the classroom is a teacher who
is comfortable with and knowledgeable about computers.
Yet many teachers, especially those who entered the
teaching profession before technology assumed such a
pervasive role in society, have had little or no special
training in computers. Even teachers who can
demonstrate basic computer literacy are unlikely to be
familiar with the full range of tools that technology can
offer, from spreadsheets to digital graphics to
instructional software.
Just as technology pervades all walks of life and almost
every field of human endeavor, technology skills are
becoming essential in all subject areas because the
computer is now the universal vehicle for the acquisition
and dissemination of information in all fields.
Technology belongs throughout the entire curriculum
because of its extraordinary potential for enhancing
learning. The learning process becomes active instead of
passive because students control their own learning:
students must think about and interact with what is on
the computer screen. Since computers can radically
expand information access and communication, they
especially benefit industrial technology students by
increasing their participation in the learning process. Just
as other professionals utilize specific technologies as
tools to enhance their work, teachers must likewise
become adept in putting technology to use as the field of
educational software evolves with the various academic
disciplines. Regardless of grade level or subject,
technology can support teachers in numerous
professional activities — first and foremost in
stimulating learning in the classroom but also in
simplifying their administrative duties, improving
personal productivity, and advancing professional
growth.
According toMuir-Herzig, (2004), Technology itself is
an interactive medium for manipulating our world, so
the process of acquiring the technology competencies
must necessarily involve ample hands-on practice,
access to a wide range of tools, and, most important, an
opportunity to discover the impressive possibilities of
technology. Technology integration refers to the use of a
wide range of technology tools across a broad spectrum
of relevant and meaningful contexts. Although it must
begin with fundamental computer skills, it includes any

International Journal of Scientific Research in Scienceand Technology (www.ijsrst.com)
263
technology application that enhances creativity, decision
making, problem solving, collaboration, and overall
productivity in the learning process.
In a learning environment where technology is truly
integrated and not an adjunct, students and teachers use
technology tools to enhance all areas of the teaching and
learning process. For example, with computers students
can access, organize, and analyze a vast world of rich
resources — whether downloading original source
documents from the Library of Congress or taking a
virtual tour of a museum. Students on different
campuses can collaborate on projects, sharing and
accommodating their diverse perspectives. They can
participate in original research projects that put them in
touch with actual researchers in the field, and they can
receive electronic mentoring from noted experts around
the world. Technology gives students powerful tools for
communicating what they have learned, motivating them
to learn more.
Effectively managing a classroom where students
engage in these activities in a manner that improves
academic achievement requires a teacher with expertise
in the sophisticated and increasingly complex field of
instructional technology. The Teacher Technology
Competencies are designed to give teachers this
expertise to select and use the technological resources
that not only meet students' learning needs but also
equip them with appropriate skills for the future.
III. RESULT AND DISCUSSION
The Technical Teacher and the Challenge of the
Internationalization of Education
According to Eugeniusz (2012), the globalisation
process is a process in which the markets and economies
of individual countries become more and more
dependent on one another as a result of the continuous
increase in the dynamics of goods, services, capital and
people exchange. As the priorities of education have
changed, so also have the training systems. Education,
especially, vocational training systems is directly
affected by the trend towards globalization. It has to be
said that gloablisation has contributed immensely to the
growth of African economies. However, it has also
brought about changes to educational goals. As a follow
up to internationalization, education has become global
and national systems are becoming obsolete.
Globalisation has opened the door to competition, not
just for market share, but job competition, one that
favours occupationally mobile workers from anywhere
in the world. For technical teachers in Nigeria, whose
responsibility is to train skilled personnel for industries
and multinational companies operating in Nigeria, the
job is made more daunting, because the teacher has to
develop skills in the student that will give the student-
worker the level playing field to compete for jobs with
other job seekers from other countries. A technologist
trained in Nigeria should be able to compete with other
technologists trained elsewhere in the world for jobs in
his home country and abroad. This is only possible if
the technical training received in his home country is
world class and relevant. Furthermore, the goals of
education in the knowledge economy have changed. In
the knowledge economy, the labour force is called
knowledge workers, engaged in handling information as
opposed to more tangible factors of production. As the
world economy transforms itself from the industrial era
to the knowledge economy, it is the challenge of
educators and training institutions to develop workers
that can produce knowledge by learning how to source
and utilize information.
In traditional post-secondary institutions like Technical
colleges, internationalization initiatives include creating
a more international curriculum, fostering opportunities
for students to study abroad, encouraging faculty
(technical teachers) and student exchanges, increasing
international student recruitment efforts, and exporting
or importing programmes and most importantly, creating
a credit transfer system for sub-Saharan region.
The globalisation process requires the school to prepare
students to play future social roles, and in particular for
effective functioning in a modern democratic society,
with special emphasis on effective functioning on the
labour market. The point is to make them able to
compete for a position with other potential candidates,
not only from their own country, but from any country.
According to Yang (2004) the school should equip
students with suitable knowledge and skills that must be
perceived as understanding the reality through personal
experience and emotional reactions with the surrounding
world of objects and specific situations. Such knowledge

International Journal of Scientific Research in Scienceand Technology (www.ijsrst.com)
264
should be preceded by appropriately designed and
organised learning process – learning that brings about
substantial changes in the perspective of individual
vision and perception of the world (O’Sullivan, 2008).
Referring to and adapting the approach of Graham and
Phelps (2003) to the issue of teacher’s role in the
modern world, the teacher’s most important tasks
include: (1) Understanding and working in a defined
school system; (2) Developing skills as well as the
applied strategies and methods; (3) Teaching in the
context of extended existing programme; (4) Integrating
theory with practice, (5) Responding to social demands
and problems; (6) Creating an atmosphere that facilitates
learning; (7) Working in a group as a team member; (8)
Assessing and forming lifelong learning habits.
IV. CONCLUSION
The teacher is made to teach in environments as
provided by the government. Governments on the other
hand are setting lofty standards and policies, expecting
teachers to implement them. While the pressure from
governments and the need to reform education is being
grappled with by the teacher, changing roles of work
occasioned by new occupational areas created by
technology as well as new frontiers created by
internationalization are opening new challenges for the
technical teacher. The technical teacher, then, needs to
be knowledgeable in him, improving on his skills,
knowledge and experience for him to be able to impart
new and relevant skills to the students. Until the
education of the teacher is taken as paramount as that of
the student, no student will ever be better than his/her
teacher. Then, it is possible, the educational system in
Nigeria may just be going round in circles, without
having to break free into the mainstream and join the
elite educational systems in Africa.
V. RECOMMENDATIONS
Based on the issues discussed, the following
recommendations were made
1. The ministry of education should engage in periodic
training of technical teachers on new technologies
and applications to enhance their technical skills.
2. The ministry of education should engage in periodic
training of technical teachers on new trends in their
chosen fields, to improve their knowledge of their
chosen professions.
3. The ministry of education should consider credit
transfer system for the West African sub region,
where a student can start a technical course in
Nigeria and finish in any other participating country
in West Africa.
4. The introduction of technology both as a
professional tool for teachers and as an instructional
tool should be promoted and supported by the
ministry of education.
5. The federal ministry of education should consider a
review of technical college training programmes in
the light of internationalization of education.
6. The ministry of education should consider
employment of new technical teachers to meet the
shortfall in technical college teachers.
VI. REFERENCES
[1] Asia-Pacific Centre of Educational Innovation for
Development (1996). Partnerships in Teacher
Development for a New Asia, pp. 391–2,
Bangkok, UNESCO. Report of an International
Conference organized by UNESCO and UNICEF
in association with the Office of the National
Education Commission, Thailand, held in
Bangkok, 6 – 8 December 1995.
[2] Canada.(1996). The Development of Education.
National reports presented at the 45th session of
the International Conference on Education.
Toronto, Council of Ministers of Education .
[3] Eugeniusz Stanislaw (2012). The Professional
Role of a Teacher in the Era of Globalization on
the Example of Poland. Educational Research
eJournal. 1(1): 61-70
[4] Graham, A. & Phelps, R. ( 2003). Being a teacher:
developing teacher identity and enhancing practice
through metacognitive and reflective learning
processes , Australian Journal of Teacher
Education, Sydney , Austaralia. 27 (2): 11-24.
[5] Harden, R.M and Crosby, J (2000). The Good
Teacher is more than a Lecturer. The Twelve
Roles of the Teacher. Medical Teacher, 22(4):334-
347.
[6] Kirimi, J.K and Wycliffe, A. (2013). Teacher’s
Productivity in Promoting Quality Education in

International Journal of Scientific Research in Scienceand Technology (www.ijsrst.com)
265
Public Secondary Schools in Kenya. Academic
Journal of Interdiciplinary Studies, 2(2):365-378.
[7] Thach, L., & Woodman, R. W. (1994).
Organizational Change and Information
Technology: Managing on the Edge of
Cyberspace. Organizational Dynamics, 23 (1): 30-
46.
[8] Mahmood, T. (2013). Assessing the Pedagogical
Competencies of Teacher Educators in the
Teacher Education Institute of Pakistan. 2(1)
[9] Muir-Herzig, R.M. (2004). Technology and its
impact in the classroom. Computers & Education,
42, 111-131.
[10] O’Sullivan, E. (2008). Finding our way in the
great work. Journal of Transformative Education,
6, 27-32.
[11] World Education Report (1998). Teachers and
teaching in a changing world. United Nations
[12] Educational, Scientific and Cultural Organization,
Place de Fontenoy, Paris.
[13] Yang, B. (2004), Holistic Learning Theory and
Implications for Human Resource Development,
Advances in Developing Human Resources, 6,
241. SAGE, online version:
http://adh.sagepub.com/cgi/content/abstract/6/2/24
1.

IJSRST162464 | Received : 22 August 2016 | Accepted : 27 August 2016 | July-August 2016 [(2)4: 266-270]
© 2016 IJSRST | Volume 2 | Issue 4 | Print ISSN: 2395-6011 | Online ISSN: 2395-602X Themed Section: Science and Technology
266
A Paper on Multisite Framework for Web page Recommendation Using
Incremental Mining Mr. Rahul B. Patil
1, Prof. K. B. Manwade
2
PG Student, Ashokrao Mane Group of Institution, Vathar, Kolhapur, Maharashtra, India
Associate Professor, Ashokrao Mane Group of Institution, Vathar, Kolhapur, Maharashtra, India
ABSTRACT
Large amounts of information present on web due to that web user finds difficulty when surfing the web. Useful and
Effective suggestions provided by Recommendation systems which help web users. User’s future interest evaluate
by using the learning and prediction models which learn user’s behavior. Web page recommendation improves web
user satisfaction and website usage. Semantic enhanced “Multisite framework for Web page Recommendation using
Incremental Mining” improves web page recommendation. In which web page recommendation will be done by
using multiple website in same domain. Will be give effective recommendation results given by Different sites. To
identify and collect more appropriate web usage data Dynamic web page recommendations tool is generated.
Related terms identified which help to generate more appropriate data. Incremental mining update web usage
knowledge and updates the knowledge base.
Keywords: Incremental Mining, IPNAR, Semantic Network Model, Ontology, Semantic Knowledge, FWAP
I. INTRODUCTION
Web users make poor decisions because of enormous
amounts of information. Recommendation systems
have proved in recent years to be a valuable means of
helping web users by providing useful and effective
suggestions. The core techniques in recommendation
systems are the learning and prediction models which
learn user’s behaviour and evaluate what users would
like to view in the future.
Web page will be recommended to particular user
based on his current web navigation behaviour. It will
be improved web user satisfaction and website usage.
Knowledge bases used in web page recommendation
system includes web usage knowledge domain and
website knowledge domain. Web page
recommendation system extracts the semantic of web
pages from web pages title. It generates domain term
of web pages from single site only. This can be
improved by Semantic enhanced multisite framework
for Web page Recommendation using Incremental
Mining.
II. METHODS AND MATERIAL
A. Literature Review
1. Thi Thanh Sang Nguyen, Hai Yan Lu, and Jie Lu
et al proposed a novel method to efficiently
provide better web page recommendation through
semantic enhancement by integrating the domain
and Web usage knowledge of a website.
2. M.Venu Gopalacharii, Po Sammulal et al
presented an effective method to integrate the
domain knowledge and web usage knowledge of
a website through semantics. A new model is
framed to construct a semantic hierarchy of the
web log data and the domain contents, which
represents the integrated usage knowledge and
domain knowledge.
3. Nazneen Tarannum, S.H.Rizvi, Prof. R.R. Keole
et al proposed a desktop search utility which uses
web usage mining process for finding term
patterns in web query data which can be used for
predicting the possible next pages in browsing
sessions.
4. Mohammad Amir Sharif, Vijay V. Raghavan et al
presented a novel hybrid recommendation system
based on clustering of items using co-occurrence

International Journal of Scientific Research in Science and Technology (www.ijsrst.com)
267
information of pages and content information of
pages. These two different types of clusters are
used in a parametric form to get aggregated
recommendations based on the available
preference information of users.
5. Anuradha Veleti, T.Nagalakshmi et al proposed
an incremental algorithm (IPNAR) that mines
positive and negative association rules in web
usage data. The incremental based algorithm
incrementally update web log association rules by
utilizing the metadata of old database transactions
as well as old mined rules, performs single scan
over the dataset.
6. Archana Godbole, Mahendra Kumar Rai et al
explores the deployment of clicking pattern
algorithms in a distributed grid computing
environment and demonstrates its effectiveness
by empirical cases. The basic task is a weblog
analysis for huge, widely distributed, hypertext
information repository of World Wide Web.
B. Why Incremental Mining
Websites and the knowledge bases have been
evolving with respect to time, Therefore domain and
Web usage knowledge bases need to be updated with
respect to time. Web usage data source is the Web log
file. So for the updating domain and Web usage
knowledge bases the system can take a limited
segment of the log file. Because to build the Web
usage knowledge base the size of the log file can be
huge. So we can use incremental mining method for
discovered Web usage knowledge and keeping it
updated, incremental mining method can dynamically
update the knowledge bases.
C. Proposed Work
In proposed system, web page recommendation will
be done by using multiple website in same domain.
The system will take the log files from the websites as
the input. The semantic analysis of domain terms in
different sites will be give effective recommendation
results. The existing system works with static Web
pages. For dynamic web page recommendations
advanced tools will be generated to identify and
collect more appropriate web usage data than web
logs. Dynamic web click stream analysis will be
conducted in the data preparation stage, in which the
web page will be identified as dynamic contents
rather than static pages. Synonyms of the domain
terms will be identified and clustered into common
topics. This would help to cluster web page in to
relevant topics and there by optimize the semantic
network model of web page. Websites have been
evolving over time therefore the knowledge bases,
including the domain and Web usage knowledge
bases need to update accordingly. To keep discovered
web usage knowledge up to date, incremental mining
will be developed for dynamically update the
knowledge base.
The proposed work has following objectives,
1. To build multisite framework for the web page
recommendation.
2. To develop tools for identify and collect
appropriate web usage data from dynamic web
page.
3. To enhance domain knowledge discovery by
using synonyms of domain terms.
4. To update web usage knowledge base by using
incremental mining method.
D. Proposed Architecture
Following terms will be used for proposed work.
1. Data Collection
Frequent web access pattern will generated from web
usage data by using crawler from dataset. It will give
the count of term. Domain Ontology will be generated
from web usage data. It will give domain knowledge

International Journal of Scientific Research in Science and Technology (www.ijsrst.com)
268
of extracted term. Symantec knowledge will
generated from web structure data. It will give
association between domain term and web pages. In
the dataset, users will be identified by id and web
pages will be identified by their titles and URLs. The
dataset is divided into two subsets, one for training
and one for testing. Pre-processing step will be
performed on log data to analyze the web log files and
produce a list of URLs of web pages that were
accessed by users. Crawler will access the current
web page browsed by user and to extract the titles
from web pages. Similar domain term data will be
collected from multisite. Dynamic web click stream
will be used to collect data dynamically
2. Generation of Frequent View Term Pattern
Frequent view term pattern will be generated by
extracting frequent web access pattern, domain
ontology and semantic knowledge from web usage
data and web structure data. Frequent web access
pattern will give the count of term which is used by
user frequently. It will be extracted from web usage
data. Domain ontology represents domain knowledge
of extracted term. Taxonomic and non-taxonomic
relation of term will find in domain ontology.
Semantic Knowledge is kind of knowledge map
which represent domain terms, web pages and relation
of domain term. Semantic Knowledge also represents
association between domain term and web pages.
Symantec knowledge will be updated using clustering
method where similar domain term will be used for
multisite framework.
3. Generation of Prediction Model
Prediction model will develop for generating
weighted semantic knowledge of frequently viewed
terms pattern. Synonyms of domain term will be used
for enhancing domain knowledge discovery. Also to
update knowledge bases dynamically incremental
mining method will be used. This model will use
frequent view term pattern for giving the weight to
frequently viewed terms pattern. Weight is probability
of the transition between two adjacent terms based on
frequently viewed term patterns. Also synonyms of
users domain term will be find out and weight is
applied to it. Weighted semantic knowledge of
frequently viewed terms will use for semantic
enhanced web page recommendation.
4. Web Page Recommendation
This model will develop for web page
recommendation to web user by using weighted
semantic knowledge. User query will take and terms
will be compared with weighted semantic knowledge
of frequently viewed terms pattern. Term having high
probability will be compared with users query. Web
page recommendation will use high probability term
for web page prediction. Frequently viewed term
related with user query will find out and most
probable web page will be recommended to web user.
First part of this module will work in order to collect
data. Data will be collected from data set of web
server. Collection of data consists of web log files and
web structure data from multisite. Pre-processing unit
will analyze web log file and produce list of URLs of
web pages that were accessed by user. Crawler will
use for pre-processing unit to extract the titles.
Advanced tool will develop to collect more
appropriate web usage data like Click stream data.
In second part, frequent web access pattern, domain
ontology and semantic knowledge will be generated
from collected data. Frequent web access pattern will
give the count of term which is used by user
frequently. Domain ontology represents domain
knowledge of extracted term. Semantic Knowledge is
kind of knowledge map which represent domain
terms, web pages and relation of domain term.
Semantic Knowledge also represents association
between domain term and web pages. This module
will generate frequent view term pattern by using
frequent web access pattern, domain ontology and
semantic knowledge.
Prediction model will develop for generating
weighted semantic knowledge of frequently viewed
terms pattern. This model will use frequent view term
pattern for giving the weight to frequently viewed
terms pattern. Weight is probability of the transition
between two adjacent terms based on frequently
viewed term patterns. Also synonyms of users domain
term will be find out and weight is applied to it.
Weighted semantic knowledge of frequently viewed
terms will use for semantic enhanced web page
recommendation.
In web page recommendation, users query will take as
input and compare this query to frequently viewed

International Journal of Scientific Research in Science and Technology (www.ijsrst.com)
269
term. The term having most probability will be used
for recommend of web page. Finally predicted web
page will recommend given to user.
E. Implementation Steps
The implementation steps are as follows:
Step I: In step I Frequent web access pattern will
generated from web usage data by using crawler from
dataset. It will give the count of term which is used by
user frequently. Further frequent web access pattern
will used in Generation of Frequently Viewed Term
Pattern.
Step II: In step II Domain Ontology will be generated
from web usage data. It will give domain knowledge
of extracted term. Further this domain knowledge will
used in Generation of Frequently Viewed Term
Pattern.
Step III: In step IV Symantec knowledge will
generated from web structure data. It will give
association between domain term and web pages.
Further this semantic will used in Generation of
Frequently Viewed Term Pattern.
Step IV: In step V term generated in above step i.e.
Symantec knowledge, Domain Ontology and frequent
web access pattern will used to generate frequently
viewed terms pattern.
Step V: In this step Prediction model will develop for
generating weighted semantic knowledge of
frequently viewed terms pattern. Also to update
knowledge bases dynamically incremental mining
method will be used.
Step VI: In this step using weighted semantic
knowledge, web page will recommend to the user by
web page recommendation module.
F. SCOPE
Web page recommendation system generates domain
term of web pages from single site only. The
proposed framework makes web page
recommendations for multiple websites in the same
domain. The system should take the log files from
these websites as the input.
With the advancement in Web technology, pages have
been evolving in to dynamic structures. The system
will works with dynamic web pages and develop
advanced tools to identify and collect more
appropriate web usage data than web logs such as
click stream data. In proposed system dynamic web
click stream analysis will be conducted in the data
preparation stage.
System will make usage of synonyms of the domain
terms; need to be clustered into common topics. This
would help to cluster web pages into relevant topics
and thereby optimize the semantic network model of
web page.
In the traditional web usage data source like web log
file, the system can only take a limited segment of the
log file to build the web usage knowledge base due to
the fact that the size of the log file can be huge.
Incremental mining method will keep the discovered
web usage knowledge up to date and dynamically
update the web usage knowledge bases.
III. RESULT AND DISCUSSION
For Result and analysis we have divided our data set
in to training and testing set .we use minsup as
threshold value for analysis. It is minimum support
value for web access sequence on Frequent Web
Access Patten (FWAP).Minsup ranges from 0.3 to
1.Measure value foe evolution decided. They are
Precision and Satisfaction.
PRECISION: -LetRc be the sub-set of R, which
consists of all correct recommendation rules. The
Web-page recommendation precision is defined as:
Precision =|Rc|/|R| .

International Journal of Scientific Research in Science and Technology (www.ijsrst.com)
270
Precision specify ratio of correct recommendation
against all recommendation.
SATISFACTION: - Let Rs be the sub-set of R,which
consists of all satisfied recommendation rules. The
Satisfaction for Web-page recommendation is defined
as:
Satisfaction =|Rs|/|R| .
Satisfaction specifies ratio of satisfactory
recommendation against all recommendation. Result
proves that with our approach results are better than
previous technique.
IV. CONCLUSION
In proposed work three modules are proposed. Three
modules has been completed, namely
1. Generation of frequent view term pattern
2. Generation of prediction model
3. Web page Recommendation
V. REFERENCES
[1] Thi Thanh Sang Nguyen, Hai Yan Lu, and Jie
Lu, "Web-Page Recommendation Based on
Web Usage and Domain Knowledge", IEEE
Transactions on Knowledge And Data
Engineering, October 2014.
[2] M.Venu Gopalacharii,
PoSammulal,"Personalized web page
Recommender System using integrated Usage
and Content Knowledge", IEEE International
Conference on Advanced Communication
Control and Computing Technologies
(ICACCCT), 2014.
[3] Nazneen Tarannum, S.H.Rizvi, Prof. R.R.
Keole "Web-Page Recommendation In
Information Retrieval Using Domain
Knowledge And Web Usage Mining",
International Journal of Science, Engineering
and Technology Research (IJSETR).
[4] Mohammad Amir Sharif, Vijay V. Raghavan,
"A Clustering Based Scalable Hybrid Approach
for Web Page Recommendation", IEEE
International Conference on Big Data, 2014.
[5] Anuradha Veleti, T.Nagalakshmi, "Web Usage
Mining: An Incremental Positive and Negative
Association Rule Mining Approach", (IJCSIT)
International Journal of Computer Science and
Information Technologies, 2011.
[6] Archana Godbole, Mahendra Kumar Rai,"A
Novel Approach for Web Usage Mining with
Clicking Pattern in Grid Computing
Environment", IJARCSS,February,2014.
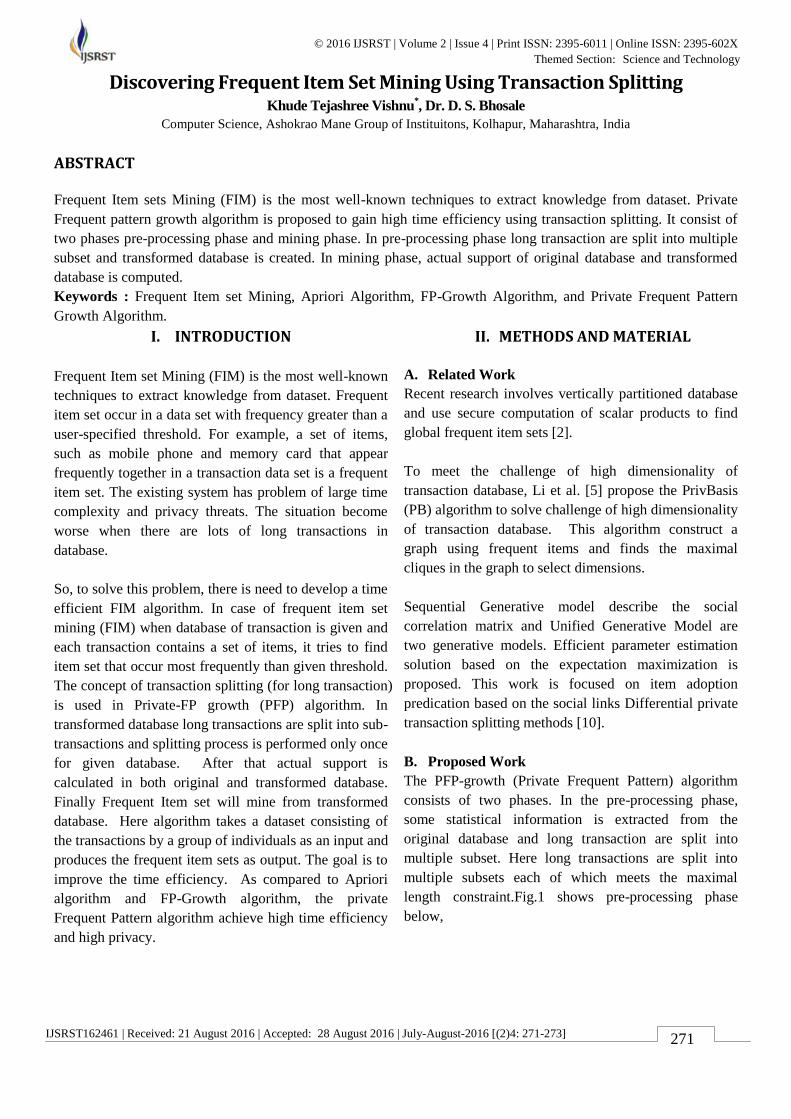
IJSRST162461 | Received: 21 August 2016 | Accepted: 28 August 2016 | July-August-2016 [(2)4: 271-273]
© 2016 IJSRST | Volume 2 | Issue 4 | Print ISSN: 2395-6011 | Online ISSN: 2395-602X Themed Section: Science and Technology
271
Discovering Frequent Item Set Mining Using Transaction Splitting Khude Tejashree Vishnu
*, Dr. D. S. Bhosale
Computer Science, Ashokrao Mane Group of Instituitons, Kolhapur, Maharashtra, India
ABSTRACT
Frequent Item sets Mining (FIM) is the most well-known techniques to extract knowledge from dataset. Private
Frequent pattern growth algorithm is proposed to gain high time efficiency using transaction splitting. It consist of
two phases pre-processing phase and mining phase. In pre-processing phase long transaction are split into multiple
subset and transformed database is created. In mining phase, actual support of original database and transformed
database is computed.
Keywords : Frequent Item set Mining, Apriori Algorithm, FP-Growth Algorithm, and Private Frequent Pattern
Growth Algorithm.
I. INTRODUCTION
Frequent Item set Mining (FIM) is the most well-known
techniques to extract knowledge from dataset. Frequent
item set occur in a data set with frequency greater than a
user-specified threshold. For example, a set of items,
such as mobile phone and memory card that appear
frequently together in a transaction data set is a frequent
item set. The existing system has problem of large time
complexity and privacy threats. The situation become
worse when there are lots of long transactions in
database.
So, to solve this problem, there is need to develop a time
efficient FIM algorithm. In case of frequent item set
mining (FIM) when database of transaction is given and
each transaction contains a set of items, it tries to find
item set that occur most frequently than given threshold.
The concept of transaction splitting (for long transaction)
is used in Private-FP growth (PFP) algorithm. In
transformed database long transactions are split into sub-
transactions and splitting process is performed only once
for given database. After that actual support is
calculated in both original and transformed database.
Finally Frequent Item set will mine from transformed
database. Here algorithm takes a dataset consisting of
the transactions by a group of individuals as an input and
produces the frequent item sets as output. The goal is to
improve the time efficiency. As compared to Apriori
algorithm and FP-Growth algorithm, the private
Frequent Pattern algorithm achieve high time efficiency
and high privacy.
II. METHODS AND MATERIAL
A. Related Work
Recent research involves vertically partitioned database
and use secure computation of scalar products to find
global frequent item sets [2].
To meet the challenge of high dimensionality of
transaction database, Li et al. [5] propose the PrivBasis
(PB) algorithm to solve challenge of high dimensionality
of transaction database. This algorithm construct a
graph using frequent items and finds the maximal
cliques in the graph to select dimensions.
Sequential Generative model describe the social
correlation matrix and Unified Generative Model are
two generative models. Efficient parameter estimation
solution based on the expectation maximization is
proposed. This work is focused on item adoption
predication based on the social links Differential private
transaction splitting methods [10].
B. Proposed Work
The PFP-growth (Private Frequent Pattern) algorithm
consists of two phases. In the pre-processing phase,
some statistical information is extracted from the
original database and long transaction are split into
multiple subset. Here long transactions are split into
multiple subsets each of which meets the maximal
length constraint.Fig.1 shows pre-processing phase
below,
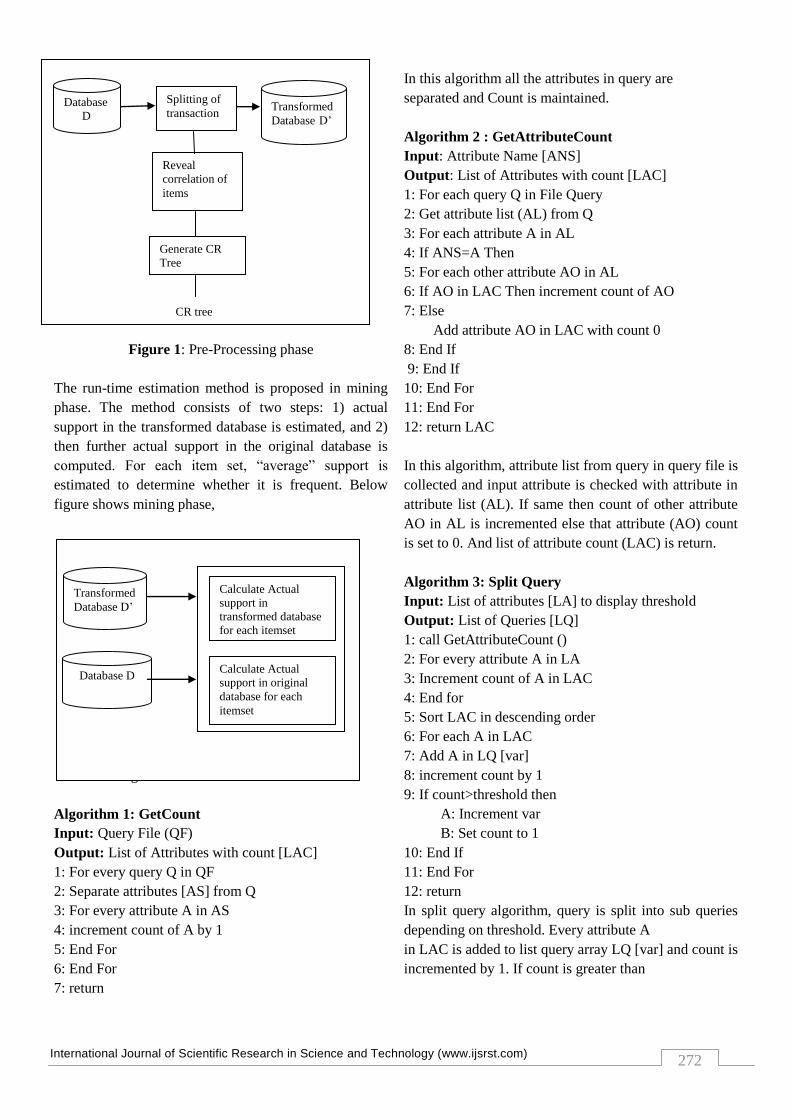
International Journal of Scientific Research in Science and Technology (www.ijsrst.com)
272
Figure 1: Pre-Processing phase
The run-time estimation method is proposed in mining
phase. The method consists of two steps: 1) actual
support in the transformed database is estimated, and 2)
then further actual support in the original database is
computed. For each item set, “average” support is
estimated to determine whether it is frequent. Below
figure shows mining phase,
Fig.2:Runtime Estimation method
Fig.2: Runtime Estimation Method
Algorithm 1: GetCount
Input: Query File (QF)
Output: List of Attributes with count [LAC]
1: For every query Q in QF
2: Separate attributes [AS] from Q
3: For every attribute A in AS
4: increment count of A by 1
5: End For
6: End For
7: return
In this algorithm all the attributes in query are
separated and Count is maintained.
Algorithm 2 : GetAttributeCount
Input: Attribute Name [ANS]
Output: List of Attributes with count [LAC]
1: For each query Q in File Query
2: Get attribute list (AL) from Q
3: For each attribute A in AL
4: If ANS=A Then
5: For each other attribute AO in AL
6: If AO in LAC Then increment count of AO
7: Else
Add attribute AO in LAC with count 0
8: End If
9: End If
10: End For
11: End For
12: return LAC
In this algorithm, attribute list from query in query file is
collected and input attribute is checked with attribute in
attribute list (AL). If same then count of other attribute
AO in AL is incremented else that attribute (AO) count
is set to 0. And list of attribute count (LAC) is return.
Algorithm 3: Split Query
Input: List of attributes [LA] to display threshold
Output: List of Queries [LQ]
1: call GetAttributeCount ()
2: For every attribute A in LA
3: Increment count of A in LAC
4: End for
5: Sort LAC in descending order
6: For each A in LAC
7: Add A in LQ [var]
8: increment count by 1
9: If count>threshold then
A: Increment var
B: Set count to 1
10: End If
11: End For
12: return
In split query algorithm, query is split into sub queries
depending on threshold. Every attribute A
in LAC is added to list query array LQ [var] and count is
incremented by 1. If count is greater than
Database
D
Splitting of
transaction Transformed
Database D’
Reveal
correlation of
items
Generate CR
Tree
CR tree
Transformed
Database D’
Database D
Calculate Actual
support in
transformed database
for each itemset
Calculate Actual
support in original
database for each
itemset
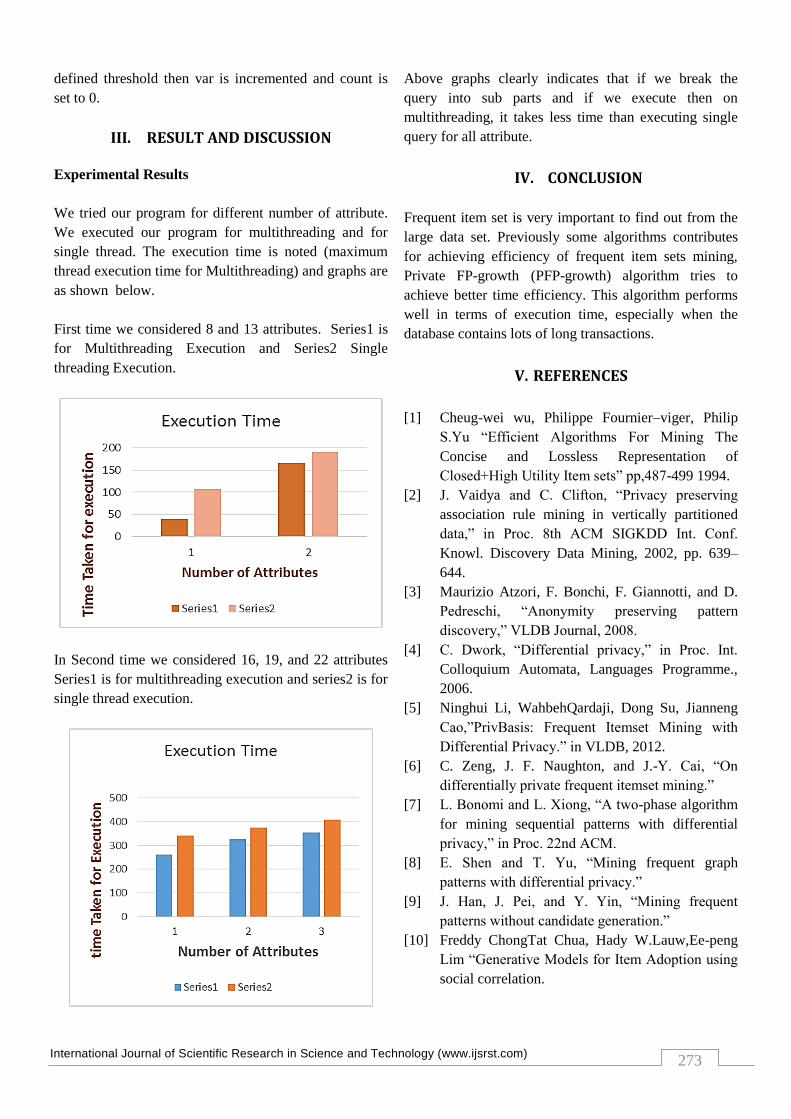
International Journal of Scientific Research in Science and Technology (www.ijsrst.com)
273
defined threshold then var is incremented and count is
set to 0.
III. RESULT AND DISCUSSION
Experimental Results
We tried our program for different number of attribute.
We executed our program for multithreading and for
single thread. The execution time is noted (maximum
thread execution time for Multithreading) and graphs are
as shown below.
First time we considered 8 and 13 attributes. Series1 is
for Multithreading Execution and Series2 Single
threading Execution.
In Second time we considered 16, 19, and 22 attributes
Series1 is for multithreading execution and series2 is for
single thread execution.
Above graphs clearly indicates that if we break the
query into sub parts and if we execute then on
multithreading, it takes less time than executing single
query for all attribute.
IV. CONCLUSION
Frequent item set is very important to find out from the
large data set. Previously some algorithms contributes
for achieving efficiency of frequent item sets mining,
Private FP-growth (PFP-growth) algorithm tries to
achieve better time efficiency. This algorithm performs
well in terms of execution time, especially when the
database contains lots of long transactions.
V. REFERENCES
[1] Cheug-wei wu, Philippe Fournier–viger, Philip
S.Yu “Efficient Algorithms For Mining The
Concise and Lossless Representation of
Closed+High Utility Item sets” pp,487-499 1994.
[2] J. Vaidya and C. Clifton, “Privacy preserving
association rule mining in vertically partitioned
data,” in Proc. 8th ACM SIGKDD Int. Conf.
Knowl. Discovery Data Mining, 2002, pp. 639–
644.
[3] Maurizio Atzori, F. Bonchi, F. Giannotti, and D.
Pedreschi, “Anonymity preserving pattern
discovery,” VLDB Journal, 2008.
[4] C. Dwork, “Differential privacy,” in Proc. Int.
Colloquium Automata, Languages Programme.,
2006.
[5] Ninghui Li, WahbehQardaji, Dong Su, Jianneng
Cao,”PrivBasis: Frequent Itemset Mining with
Differential Privacy.” in VLDB, 2012.
[6] C. Zeng, J. F. Naughton, and J.-Y. Cai, “On
differentially private frequent itemset mining.”
[7] L. Bonomi and L. Xiong, “A two-phase algorithm
for mining sequential patterns with differential
privacy,” in Proc. 22nd ACM.
[8] E. Shen and T. Yu, “Mining frequent graph
patterns with differential privacy.”
[9] J. Han, J. Pei, and Y. Yin, “Mining frequent
patterns without candidate generation.”
[10] Freddy ChongTat Chua, Hady W.Lauw,Ee-peng
Lim “Generative Models for Item Adoption using
social correlation.

IJSRST162462 | Received: 23 August 2016 | Accepted: 31 August 2016 | July-August-2016 [(2)4: 274-285]
© 2016 IJSRST | Volume 2 | Issue 4 | Print ISSN: 2395-6011 | Online ISSN: 2395-602X Themed Section: Science and Technology
274
Evaluation of Resource Needs and Service Delivery of Performance Contracting in Public Primary Teachers Training Colleges in Kenya
Simon K Kipkenei1, Judah Ndiku
2 Julius Maiyo
3 Rodgers Cherui
4
1 & 2 Masinde Muliro University of Science and Technology
P.O. Box 190, Kakamega Ministry of Education, Western Province 3Kibabii University, PO Box 1699, Bungoma, Kenya
4Tambach Teacher Training College, P.O Box Private Bag, Tambach
ABSTRACT
Performance contract as a branch of management science refers to a management control systems which is a
contractual agreement to execute a service according to an agreed upon terms, within an established time period
and with a stipulated use of resources and performance standards. The government of Kenya introduced
performance contract signing in 2004. The aim was to improve service delivery and resource utilization in public
institutions among other objectives. The introduction of performance contracting in public primary teachers training
colleges was an effort to institute a framework of accountability and enhance service delivery in Kenya. This study
sought to establish the availability of resources for implementing Performance contracting with an aim of improving
service delivery to the public. It employed descriptive survey design. The target population was 2270 employees and
783 members of the students’ councils of Public Primary Teachers Training Colleges. Purposive sampling, simple
random sampling and stratified random sampling were used to identify the sample population. A total of 429
respondents formed the sample size representing 30% of the study population. The study revealed several challenges
in the implementation process which included lack of funds, lack of training and capacity building of employees
regarding performance contracting, ambiguity in the process and resistance by personnel to participate in the process
hence these challenges had hindered the successful implementation of Performance contracts in PPTTCs. It is
recommended that performance contracting strategy should be strengthened with the availing of more financial
resources to ensure that the required learning and teaching resources are all made available.
Keywords : Ranking, Resources, Targets, Tutors, Service Delivery, Training.
I. INTRODUCTION
The term performance contracting can be traced from
France in the late 1960s and in other countries including
India, Pakistan and Korea (OECD, 1997). Kenya
Sensitization Training Manual (2004), defines
performance contract as a freely negotiated performance
agreement between Government Organizations and
individuals on one hand and the Agencies on the
other hand. Gathai (2012), looks at performance
contract as a branch of management science referred to
as management control systems which is a contractual
agreement to execute a service according to an agreed
upon terms, within an established time period and
with a stipulated use of resources and performance
standards. From the above definitions, it can be
concluded that performance contracting is all about
mutual agreement between two or more groups where
one party acts as the owner or representative of the
Public Agency and the management of the Agency on
the other hand agreeing to perform well in a contractual
activity at hand.
In Latin America for example, PC has been used at
different times in Argentina, Brazil, Bolivia, Chile,
Colombia, Mexico, Uruguay and Venezuela with
success in improving the performance of their own
public sector. This was done after carefully examining
an adapting to their particular needs and learning from
the lessons of the vast international experience with
regards to performance contracts. It has also been
adopted by developing countries in Africa including
Nigeria, Gambia, Ghana, Rwanda and now Kenya
(Kobia and Muhamed, 2006). In Nigeria for example,

International Journal of Scientific Research in Science and Technology (www.ijsrst.com)
275
performance contracts are based on the premise that-:
“what gets measured gets done; if you cannot see
and measure success you cannot reward it, if you
cannot recognize failure, you cannot correct it and if
you can demonstrate results, you can win public support”
(Darma, 2013).
Darma looks at performance contract as a method of
establishing defined expectations, accountability and
consequences for meeting or not meeting a set standard
of execution excellence. Two or more parties agree on
the actions the performer will execute and the
expected results from implementing those actions. He
continue to explain that in the absence of a
national development intervention within the context
of a result based framework, performance cannot be
defined and measured hence tracking performance
and measuring results is next to impossible. The
introduction of performance contacts in Nigeria was
aimed at enabling the federal government of Nigeria
to measure performance of Ministries, Department and
Agencies (MDAs) in a fair, objective and
comprehensive manner and to create a results-
oriented public service delivery mechanism. Many other
African countries have adopted the practice of
performance contract and they include South Africa,
Gambia, Mali and Botswana among others. Performance
contract has been found to be quite successful in these
countries.
Performance contract was introduced in Kenya on 1st
October, 2004, in 16 largely commercial state
corporations. This would see institutions freely negotiate
performance agreement with the Government every year.
Regular monitoring of the implementation of the
contract agreed upon has been a vital aspect for its
success. The institution provides feedback by
forwarding quarterly reports and taking corrective action
where necessary. Kenya is still at the first stage of
development and was ranked number 93 in the Global
competitive index with a score of 3.84, in 2009,
compared with countries such as Singapore which
was ranked number 5 with a score of 1.53 according
to the world Economic Forum (2008-2009). In 2007, the
Government of Kenya published Kenya vision 2030 as
its long term strategy for achieving global
competitiveness and prosperity. The country also aims
at linking reforms and economic growth to actual quality
of life of Kenyans, increase customer satisfaction with
government services and to build trust in the government.
Thus, one of the foundations of the Kenya vision 2030 is
an efficient, motivated and well trained public service.
Among the key strategies should be to link result based
management and performance contracting to the
implementation of the visions’ goals making it easier
to reward public servants on merit and performance.
In order to be effective in conducting business or
rendering services, organizations need to implement
management procedures and practices that will yield the
desired results. Under PCs, targets are set and although
the areas of concern are the outcomes rather than the
processes, the processes do determine the outcomes. A
performance contract is anchored on two items, the
strategic plan and service delivery charter. The
development of strategic plans is one of the things that
state corporations are required to do before entering into
performance contacts. A strategic plan enables an
organization to be better focused on its core
business. It also helps the organization to clearly set
out its objectives and action plans that will enable it
achieve the objectives. In effect what the institutions are
called to do is to plan performance, thus the
development of strategic plans (Republic of Kenya
2005).
Operational plans are a critical component for any
organization thus the planning performance stage is
important in setting targets against available resources.
The resources then provide the much needed support
whether in terms of skilled personnel, facilities and
equipment or even much needed funds. Regular
monitoring and evaluation of the set targets and their
achievement set basis for review of performance and
drawing up of relevant objectives for the planning
stage (Republic of Kenya 2007). One of the advantages
of the performance contract system is that it makes
the strategy of the department clear to all its
operational units and, above all, spells out the
resources that will be made available for achieving
the targets that they have formally undertaken to
meet. Since performance contracting has been seen to
yield positive results in terms of better service delivery
in countries which have implemented it, it was the
expectation of the researcher that the introduction of
PC in PPTTCs must have improve service delivery to
International Journal of Scientific Research in Science and Technology (www.ijsrst.com)
276
clients. From previous evaluation results, it had been
observed that most tertiary institutions were
performing poorly in annual evaluation results.
Whereas the general public and even some high
ranking public servants may very much welcome the
idea of performance contracting and measuring
performance, it might not have been readily accepted by
everybody. In state corporations and tertiary institutions,
there is a general feeling that it is unfair to grade state
corporations operating in different sectors of the
economy together with tertiary institutions which
function below the expected amount of resources
supposed to be allocated to them annually. Another
challenge is the applications of the composite score
which allows for comparisons of different ministries and
state corporations. Some ministries and even state
corporations prefer to be grouped and ranked differently
citing their uniqueness emerging from the areas of
service delivery, size in terms of turnovers, number of
employees and even their mandate (Obong’o, 2009).
Performance contracting is a system that operates on the
premise that resources for development would be
available in good time. However, due to a myriad of
reasons, these resources are not always available as
envisaged. The affected institutions therefore feel
disadvantaged and would not comfortably identify with
the outcome of PC. Government services are meant to
be available to all citizens throughout the country as it
imparts a sense of national belonging in that citizen.
The critical argument from several quarters is the
disparities in allocation of the available resources and
yet the evaluation measurement is the same for all
institutions. The study therefore attempted to find out
from college employees whether resource reasons could
have contributed to their low ranking in the National
performance evaluation results of the first seven years
after the signing of Performance contracting took effect
in PPTTCs in Kenya.
II. METHODS AND MATERIAL
A. Statement of the problem
The survival of an organization, its increased
productivity and high profit margins are dependent on
resources and in particular human resource. Without
proper resources, even the best designed organization
that is guided by well made plans with necessary
equipment cannot achieve its performance potentials. It
is the people who supply the organization with their
human efforts and work. Workers use their talent to
creatively combine and utilize the equipment, machines,
tools and other non-human resources which include
facilities, structures, time, technology, land,
transportation, the organization climate, geographical
orientation and information (Umunadi, 2012). The
introduction of performance contracting in Kenya was
aimed at among other things to bring about a radical
transformation in resource utilization in public
institutions.
However, dissatisfaction with the way some of these
institutions approach the subject of resource utilization
is ripe. Public Primary Teachers Training Colleges for
example have expressed dissatisfaction with the way
financial resources are managed as it has sometimes
resulted in public outcry over poor performance in
service delivery leading to satisfactory results in PTE
examinations, their core function. Stakeholders have
complained of inability of Government institutions to
meet their set targets in PC evaluation areas among them
Teacher Training Colleges. Tutors have complained of
lack of motivation and support by administrators
especially in the process of acquiring teaching and
learning resources for their departments. This might
have contributed to reduced efforts in attainment of the
required standards in service delivery. Another group of
complainants are the suppliers of goods and services.
They claim that they are not paid on time and sometimes
are paid at a period exceeding one year which has seen
some of them close their businesses. Students have also
expressed their dissatisfactions in the way complains are
handled especially when it comes to students affairs.
This study aimed at finding out why targets are not met
even when set using all the agreed performance
indicators and a surety of availability of resources by
Government and the institution concern. Majority of
stakeholders who are affected by this low ranking feel
disadvantaged and would not comfortably identify with
the outcome of PC. They are not in a position to own up
the results and yet they are the target setters. This
therefore means that there is something these institutions
are not getting right. It is against this background that
this study was carried out to establish the amount of
resources allocated to colleges for the implementation of

International Journal of Scientific Research in Science and Technology (www.ijsrst.com)
277
performance contracts for the sole purpose of improving
service delivery in Teacher Training Colleges in Kenya.
B. Objective of the Study
The objective guiding the study was:
To assess the adequacy of resources for implementing
performance contract to improve service delivery in
Public Primary Teachers Training Colleges in Kenya.
C. Research Design and Methodology
This study adopted a descriptive survey design. Surveys
are used in preliminary and exploratory studies to allow
researchers to gather information, summarize, present
and interpret data for the purpose of clarifications
(Orodho, 2002). This approach was also to enable the
researcher to establish the feelings, opinions and
perceptions of tutors teachers training colleges about
performance contracting and its impact on
teaching/learning resources’ utilization. The design was
used by the researcher because it enabled him collect
information on the subject of the study in its current
state. It was also to enable the researcher to receive
detailed information from respondents who are either
directly or indirectly involved in issues of performance
contracting in Public Primary Teachers Training
Colleges. It helped in getting their opinions about other
components like performance assessment, performance
targets and performance rewards. That enabled the
researcher to find out the impact performance contracts
had on resource utilization.
D. The Study Location
The study was carried out in Public Primary Teachers
Training Colleges in Kenya. These institutions were
found to have been ranked way below other tertiary
institutions in most annual PC evaluation by the
Government. Ranking depends on evaluation matrix
where marks are awarded depending on the level of
achievements of targets. There are 21 PPTTCs and these
are Igoji, Kamwenja, Machakos, Kilimambogo, Thogoto,
Kigari, Bondo, Mosoriot, Migori, Asumbi, Tambach,
Kaimosi, Shanzu, Garissa, Murang’a, Baringo, Meru,
Kitui, Narok, Eregi, and Kericho.
E. The Target Population
In this study, the target population consisted of teacher
trainees, Tutors (Principals, Deputy Principals, Deans,
PC committee members and the rest of the teaching staff)
and members of the Non-teaching staff of PPTTCs in
Kenya. The respondents were targeted because of the
structure of college administrations where there are
service providers and service recipients. PC committees
who are part of the teaching staff oversee the
implementation process of Performance contracts and
the College Principals who are the chief executive
officers of their institutions and chairs PC meetings were
in a position to explain the success of PC
implementation in their colleges. The respondents were
1414 tutors (Principals, Deputy Principals, Deans, Heads
of Departments and the rest of the teaching staff) and
856 Non- teaching staff together with all Heads of
sections and a total of 783 members of the student
councils.
F. Sample Size and Sampling Procedures
The researcher used probability sampling techniques
namely cluster sampling, simple random sampling and
stratified random sampling. It also used non-probability
sampling techniques of purposive sampling to select a
sample from the populations. These were appropriate to
the research objectives. Stratified random sampling was
used to ensure that the sample represents key subgroups
of the population. It was also used to determine the
sample size in the study because it gave equal
opportunities to all subjects in the target population who
were to be selected for the study. Colleges were
clustered in to six Zones. From the 21 colleges, 12 were
selected using stratified technique to capture all colleges
representing all regions of Kenya. The entire sampling
matrix comprised of 12 Principals, 65 PC Committee
members, 129 teaching staff members, who are not in
PC committees, 85 NTS and 116 members of the student
council; yielding a total sample of 429 respondents for
the study.

International Journal of Scientific Research in Science and Technology (www.ijsrst.com)
278
Table 1: Sample Size Distribution for The Study
Respondents Population
(N)
Sample
population
Percentage
(%)
Principals
PC Committee
Tutors
NTS.
Student
council
Total
12
216
430
354
386
1398
12
65
129
107
116
429
100
30
30
30
30
30.7
Source: Field Data (2014)
Stratified random sampling technique was used to group
the teaching staff and student councils according to their
departments and areas of operation respectively. Each
college has 8 departments but the population of the
teaching staff in each department varies from institution
to institution depending on the population of the students.
A sample of 129 members of the teaching staff was
selected to participate from a population of 430 and a
sample of 116 members of the student council was also
selected from a population of 386. Simple random
sampling was used to select members of the Non-
teaching staff were 107 participants were expected to
respond to the questionnaires. A total of 41
questionnaires were returned while 44 participate
through interviews making a total of 85 respondents
representing 80% of the expected responses from this
group which was a representative sample enough to give
findings that can be generalized. O’Connor (2011)
argued that there are formulas for determining sample
size, but the main thing is to be practical and for a small
population of interest, you would most likely need to
sample about 30% of the population. The study
considered utilizing this formula to obtain the sample
population. The rationale for this study was informed by
poor evaluation results posted by PPTTCs in all PC
evaluation results since its signing in 2007.
III. RESULT AND DISCUSSION
A. Findings
Resource allocation for performance contract
activities
The objective of this study was to establish whether the
level of availability of resources was a contributor to
poor performance in annual performance contacting
evaluation in Public Primary Teachers Training Colleges
in Kenya. Previous annual evaluation result show that
PPTTCs were not at bar with other tertiary institutions
under the same category when it comes to PC annual
evaluation of all tertiary institutions. The Principals
pointed out that proper utilization of learning and
teaching resources were hindered by scarcity of financial
resources. The lack of finances made some of the
resources not to be availed in time or not to be procured
at all hence hindering the impact of PC on the ground.
Some tutors claimed that there was no much change on
the ground as far as the availability of teaching and
learning resources were concerned. They claimed PC as
a strategy was hampered by too much paper work and
lack of enough training in resource utilization for its
impact to be strongly felt on the ground. Heads of
Departments however indicated that the utilization of
resources was hindered by the fact that the teaching
staffs were not properly prepared to implement the
planned performance strategy that had in turn made
them not to appreciate the strategy positively.
Performance contract system makes the strategy of a
department clear to all its operational units and above all
spells out the resources that will be made available for
achieving the targets they have formally undertaken to
meet. Teachers training colleges suffer from inadequate,
old and poorly maintained transport facilities which
affect some of the PC target areas such as teaching
practices for teacher trainees. The study intended to find
out from the groups of respondents whether the
resources available in their institution could help meet
the set PC targets to enable them get a good ranking.
Table 2 indicates the responses of employees on this
matter.
Table 2 : Employees’ responses on adequacy of
resources for PC implementation
Respondents
Str
on
gly
agre
e
Ag
ree
Neu
tral
Dis
agre
e
Str
on
gly
dis
agre
e
Principals 3(25
%)
1(8.3%
0
0 5(41.7
%)
3(25
%)
PC
Committee
2(3.1
%)
28(43.
1%)
12(18.
5%)
14(21.
5%)
8(12.3
%)
Non- teaching
staff
5(12.
2%)
14(34.
1%)
12(29.
3%)
6(14.6
%)
2(4.9
%)
Source : field data 2014

International Journal of Scientific Research in Science and Technology (www.ijsrst.com)
279
As to whether colleges have adequate resources for the
implementation of PC the table above indicates the
results from all participants where 4(33.3%) of the
Principals agreed that resources were adequate but
8(66.7%) disagreed meaning this is one of the
challenges affecting the success of PC in PPTTCs in
Kenya. On the same question, 46.2% of PC Committees
were in agreement while 46.3% of the Non-teaching
staffs agreed that PC had adequate resource for PC
implementation in their institutions meaning there was a
likelihood that lack of clarity existed in the use of
resources. Interviews conducted revealed that NTS were
not aware of what was being contracted as they claimed
that their routine work had remained the same.
According to Kobia and Mohammed (2006), stability of
resources enhances the Motivating effect of the contract
and yet organizations still experience challenges such as
the lack of adequate resources, resources not being
released on time; some performance targets being highly
ambitious and unplanned transfer of staff. When
resources are not available or availed late, the staff
involved gets frustrated.
Hooker (2011) and Umunadi (2012) argue that the
survival of an organization, its increased productivity
and high profit margins are dependent on resources and
in particular human resource. The researchers’
interviews and observations revealed that PPTTCs suffer
from low funding especially at their learning resource
centers. It was also found that Teacher trainees are
trained on the use of modern technology in lesson
presentation. There was inadequate ICT infrastructure
equipment and materials which affected ICT programs
in the training of teachers. Currently computer lessons
and the use of computers by both pupils and teachers
seem to be the way forward in copying with changes in
technology. Respondents’ suggestions were that one
way to mitigate the problem of resource scarcity was to
encourage creativity and innovative practices internally
within an institution. Utilization of allocated funds
ensures that funds are applied to programs, projects and
activities for which they were appropriated and were
planned for. Allocated funds include financial resources
from outside the exchequer, including donor funds. This
links the process of budgeting to performance target
setting. The PC committees explained that variance
analysis was always carried out on all budget items to
establish conformity and absorption capacity. The study
wanted to find out if compliance to the set budget, 100%
collection of levies, proper utilization of funds and cost
savings and reduction was being adhered to as expected.
The most difficult of all these is fee collection from
students as majority of them are believed to be coming
from humble backgrounds. This makes 100% collection
of fees as a target next to impossible hence affecting
most target areas which depend on money paid in terms
of fees. The findings had mixed reactions from
employees of different colleges. The table below
provides this information.
Table 3 : Responses of Principals and PC Committees
on finance
Source: field data 2014
From Table 3 above 100% of the principals and 76.9%
of PC committee agreed that college administrators do
comply with college budgets. Both the Government and
PC guidelines require all college principals to strictly
adhere to the planned budget and spend 100% of all
collected levies. Colleges are expected to collect 100%
levies from various sources. This is shown through
audited financial reports or accounts, showing all monies
collected from fees, house rent and seminars among
others during any given financial year. For example,
from Table 3 above, 100% of the principals agreed that
it was possible to comply with the set targets in PC. This
is a confirmation that setting of targets was within the
means and the ability of any institution. The findings
also indicate that 50% of the principals and 21.5% of PC
committees were able to collect 100% of their levies.
The same table also reveals that 83.3% of the principals
and 66.2% of the PC committees agreed that there was
proper utilization of funds in PPTTCs. Proper utilization
of funds can be obtained through the audited accounts,
receipts supporting purchases, payment vouchers and
other relevant documentary evidence. All institutions
must show convincing vote by vote compliance and

International Journal of Scientific Research in Science and Technology (www.ijsrst.com)
280
provide authenticated proof of reasons for partial and/or
non-compliance and the authorization so as to be
evaluated using the standard criteria for PC. That is if
they have to be said they complied with the set budget.
Majority of the institutions had evidence showing their
expenditure as was found in the document analysis. The
study also found out that 75% of the principals agreed
that PC had made them experience reduction in cost of
goods and services. In this case of cost savings and
reduction, institutions must show by way of evidence the
savings such as costs reduced through bulk purchases,
discount given by suppliers and the official
communication between the Agency and the suppliers,
comparative cost for purchases made at different times
during the financial year in question. Table 4 below is a
practical example of one of the institutions which had
documented the way they planned to spend their
expected income 2014/2015 financial year.
Table 4 : A Colleges’ expected income for 2014/2015
financial year in on PPTTC
s/n ITEMS COST (Kshs)
1 Fees from students 66,122,650.00
2 House rent 1,350,000.00
3 Grants 13,376,568.00
4 The farm 1,302,850.00
5 Seminars 4,200,000.00
Total 86,200,000.00
Source: Field Data 2015
The table indicates a classic example of the sources of
income for most PPTTCs in Kenya. The guidelines
expected the institution concern to collect 100% of all
the indicated monies which in normal cases may be not
possible within the period in question. Colleges do not
allocate any money to PC activities as a vote head.
However, the PC activities are footed under the general
college vote. It should be noted that all activities to be
undertaken by the college are evaluated under
performance contracting. Information on PC activities
can be obtained in commitments’ manual of the board of
management in every institution under PC. The BoM is
accountable to the membership base to adopt the best
possible practices of Governance, management and
operations in order to ensure and provide the best
possible experience for service users (GoK 2011). It is
therefore necessary for college administrators to fully
involve all employees in the activities of performance
contracting. This will make them understand well the
content of agreement, what they are expected of, and
what their clients expects from them and to strictly
adhere to the planned institutional budget of the year.
According to U.S Department of education retrieved on
7th April 2015, a major element of financial data activity
rests in the act of budgeting. Budgeting is the process of
allocating finite resources to the prioritized needs of an
institution. In most cases, for a Governmental entity, the
budget represents the legal authority to spend money.
Adoption of a budget in the public sector implies that a
set of decisions has been made by the Governing board
and administrators that culminates in matching a
Government's resources with the entity's needs. As such,
the budget is a product of the planning process. The
budget also provides an important tool for the control,
evaluation and the uses of resources.
Using the accounting system to enact the will of the
Governing body, administrators are able to execute and
control activities that have been authorized by the
budget and to evaluate financial performance on the
basis of comparisons between budgeted and actual
operations. Thus, the budget is implicitly linked to
financial accountability and relates directly to the
financial reporting objectives. Client visiting the
institution face some challenges at some point and
therefore they need to be assisted. This brings about the
necessity of a customer care desk and complains
handling department.
Table 5 indicates the responses of employees on how
problems relating to customers are handled. Service
delivery begins at the entrance of any institution and
clients are given direction at a reception room or desk.
From the reception area, clients are able to access the
service delivery charters and gauge how long they are
likely to be served in that particular institution.
Table 5 : Availability of customer desk and a complains
handling department
Source: field data 2014

International Journal of Scientific Research in Science and Technology (www.ijsrst.com)
281
The results in Table 5 above shows that 91.7% of the
principals were in agreement that customer desk and a
department for handling complain was available in their
institutions. On the contrary only 36.5% of the teaching
staff, 36.6% of the Non-teaching staff and 35.4% of the
student council were in agreement of the same indicating
that majority of the employees do agree that the resource
was not available. The observation schedule showed that
majority of the institutions visited had a customer desk
only. None of them had complains handling department.
From this result, the important aspect of quality service
delivery at a point of service level is the existence of
easily accessible, acceptable and transparent complains
handling mechanisms to which customers can have
recourse to if they are dissatisfied with the services
received. This can only happen if the resources
mentioned above are available. It is therefore prudent for
institutions to use friendly customer complains handling
mechanisms which are consistent with the promises
contained in the service delivery charters in every
institution. The study sought to find out whether the
respondents had been trained on Performance Contract
or not. Human resource is a very important element in
any organization. This kind of resource should be well
equipped with the right kind of skills needed in that
particular organization.
Table 6 below indicate the responses of college
employees on the training of staff in PC activities from
the period PC was signed by the college administration
as part of a college program to the time this research was
being undertaken.
Table 6 : PPTTCs Staff have been train on PC activities
Source; field data 2014
According to the findings, 8.3% of the principals
indicated that they had trained staff on Performance
Contract while 66.7% of these respondents indicated that
they had not trained their staff. Majority 61.5% of PC
Committee in answering the question on training of staff
disagreed that there is any training given to the staff
while 30.3% were in agreement. Form this results it is
possible to conclude that this could be one of the reasons
why PPTTCs are tailing in PC annual evaluation. The
study findings revealed also that 48.8% of the Teaching
staff disagreed that there was any kind of PC training in
their institution and only 30.3% agreed while 17.8%
remain uncommitted. This could be another cause of
poor achievements as lack of training is a thread to
implementation process. At least all PC committee
should have been trained on PC activities. On the same
item, 56.7% of the NTS disagreed that staff had been
trained on PC while 26.9% agreed. This is an indication
that training is necessary in PPTTCs if at all there is
need for proper PC implementation. This is an indication
that majority of the respondents have no idea on how to
go about PC activities. It is therefore necessary for
PPTTCs to improve on their human resource. The
research findings gave a clear indication that most
employees were not trained and therefore BoM should
intensify the training of all employees on PC. OECD
(1999) identifies training as a key determinant in
Performance Contracting related activities. Training
improves management capabilities and abilities to take
advantage of the opportunities that can add value to the
institutions’ day to day operations. Training on PC is of
great importance because it would deepen the
understanding of PC concept. The fact that training had
not been done for the majority of the employees was
something to get worried of the researcher tested the
objective of the study to find out whether there was any
relationship between resource allocation and service
delivery in PPTTCs in Kenya. Resource allocation here
includes both human and material resource necessary for
the implementation of PC in PPTTCs. The objective
stated as: Ho3: There is no significant relationship
between availability of adequate resources for
implementing performance contract and service delivery
in Public Primary Teachers Training Colleges in Kenya.
Table 7: X2 results of adequacy of resources and service
delivery in PPTTCs
Source: field data 2014

International Journal of Scientific Research in Science and Technology (www.ijsrst.com)
282
From table 7 above, it is evident that chi-square test has
all values of P < .05 hence the hypothesis above was
rejected in favor of an alternative hypothesis. The results
indicate that there is a significant relationship between
availability of adequate resources for PC implementation
and service delivery. The implication of these results is
that for service delivery to improve there must be
adequate resources for the program. Availability of
resources will also eliminate excuses for non-
performance. We can conclude that resource availability
will improve service delivery in PPTTCs.
B. Discussions of the Findings
Performance Contract is a challenging program full of
complex activities. In some cases, it may be difficult to
identify concrete outcomes or results for a service. For
example, training and education services might be
provided with the goal of disseminating information and
modifying people’s behavior. However, it may be
difficult or impossible to track participants and
determine whether the training helped them to think and
act differently. In these cases, the development of / or
output measures such as the number of people served or
the number of training sessions or outcome measures to
evaluate the impact of the training effort such as pre or
post test scores should be developed. This requires well
trained personnel to undertake the program. If a
department is unable to identify performance outcomes
for a specific service type, a meeting with head of the
section and other departments may be useful to stimulate
new ideas and share best practices (Korir, 2005). The
Government exaggerates its expectations especially in
relation to funding projects within a contract period.
Government funds are not released on time while at the
same time Students pay fees when they are about to do
exams. This delays the achievement of set targets in the
contract period as PC is evaluated quarterly. In giving
their general views on PC, employees agreed that
signing of Performance contract should be done in
conjunction with provision of all the resources; finances,
facilities and staff motivation. Professor Guest of United
Kingdom College concurs with the above argument in
that good performance management involves ensuring
that people have the resources for accomplishing set
goals in a contract period. Republic of Kenya (2010)
asserts that Government officers are being publicly
challenged to account for public resources entrusted to
them on a day-to-day basis as the bar of achievement is
raised each year. This implies that the Government
dictates the goals in the contract period and also raising
the bar of achievement every year and does not provide
funding on time as claimed by majority of the
administrators who participated in the research.
Opondo (2004) claim that an institution with employees
who are specialized will achieve targets more than those
with little training. This implies that staffs that do not
have the necessary knowledge regarding PC are likely to
miss out of their target and therefore there is need for
training so that they get the necessary knowledge and
skills on PC. Effective training and sensitization on PC
to all employees of PPTTCs is therefore a critical aspect
that needs to be urgently addressed so that there is
synergy in the implementation of PC (Gatere, 2013).
The principal factor which is clearly seen to be
impacting negatively on quality of services offered by
various institutions are inadequate preparation, lack of
proper supervision at both department or section and
institution level and sensitization of employees on the
role and importance of PC and the need to participate
fully by enabling them to cope up with the changes in
service delivery systems and information technology.
Another factor is unavailability of adequate resources
and physical facilities, inadequate mechanisms for
assessing customer satisfaction and limited professional
commitment to quality service provision by some
employees. For customers to be served well, a customer
desk must be available to address the challenges facing
those who are seeking services in various sections of an
institution. Complain handling department must also be
set so as to address challenges facing clients at all times.
According to the interviews conducted on the
availability of resources for implementation of PC in
teacher training colleges, it was found out that
performance contracts had little impact on adequacy of
teaching and learning materials as well as the use of ICT.
The teaching staff had challenges in procuring teaching
and learning materials as they had no direct means of
acquiring the funds. According to Abdulkaram, Fassas,
and Akinubi (2001), all educational resources are vital to
the achievement of Institutional and a National objective
hence availing resources is mandatory. The research
continue to report that most PPTTCs had not trained
their human resource on PC implementation process;
therefore, most of them end up working so hard but
International Journal of Scientific Research in Science and Technology (www.ijsrst.com)
283
without targeting PC indicator areas simply because they
are not aware. Afolabi (2005) observes that no matter
how beautiful the programs and assets of an institution
are, without a well-trained academic staff and
availability of other resources, attainment of institutional
goals and objectives would prove abortive. This is
because human resources constitute a workforce in an
institution.
Guven and Gulbaher (2008), observes that the
integration of ICT as a resource has the potential to help
revitalize teachers and students. This could help to
improve and develop the quality of education by
providing curricular support in difficult subject areas.
The study findings also found out that there is
inadequate ICT infrastructure equipment and materials
to incorporate ICT programs in the training of teachers.
The use of ICT in all areas of teaching and learning and
other service areas in Colleges should be made
mandatory as this can be the only sure way of improving
service delivery and improving transparency. The
research findings indicated that all Public Primary
Teachers Training Colleges operate on vote-head based
budgets and therefore faces serious constraints at the
resource level to implement the various commitments in
the contract. Moreover, fees chargeable to Students are
seldom collected 100% since students cannot be send
home for fees as it is also the ministry of educations’
policy to ensure that there is a 100% completion rates by
all the students enrolled in public learning institutions
was achieved. In general the research findings revealed
that 8(66.7%) of the principals disagreed that resource
were available to implement PC activities. Resources
here mean other support mechanisms other than
monetary support. At the same time 46.3% of the Non-
teaching staff agreed that PC had improved utilization of
the available resources in their institutions. It was also
found that it is possible to comply with set budgetary
levels according to 76.9% of the PC Committees. If this
is to be true then college administrators have to comply
and reduce wastage so as to improve their service
provision and raise their ranking. Majority 83.3% of the
principals accepted that utilization of funds from their
institutions were of the required standards. This means
most of the principals were accountable for the funds
they receive in their institutions. Clients expect quick
solutions to their problem. Solutions to problems are one
of the best indicators of quality service delivery. On the
part of the teaching staff, the study revealed that 36.5%
of them agreed that they had both a customer care desk
and complains department.
Efficiency and transparency in management of public
resources has been the desire of every citizen all over the
world and especially in Kenya, (AAPAM, 2005).
Principals of Colleges have failed to complete the
automation program as expected in PC manual.
Automation has been proven to lead to a more
competitive and customer oriented employees’ Service
delivery. It also improves employees’ accountability and
transparency in an institution. The findings of this study
through observation check list indicated that service
charters where available in most PPTTCs but what was
lacking in all of them was an office or department where
users would seek redress in case of dissatisfaction.
Service charter is therefore not an option for an
institution. Performance contracting is anchored on
strategic plans and service charters. Less than 50% of
the employees think that service charters and strategic
plans are adhered to which is a worrying trend.
Another PC indicator which proved difficult to achieve
was the collection of levies. The Government expects
institutions to collect 100% levies from various sources
under their mandate. This is difficult because a number
of Students enrolled in PPTTCs cannot afford to pay
fees because of their humble background. They expect
assistance from the Government through bursaries and
donations from friends. As a result the bursaries given
are not enough hence they continue to study with huge
arrears of college fees making the indicator difficult to
be achieved. Institutions are expected to comply with set
budgetary levels. Majority of the respondents agreed that
the indicator is achievable if resources are well managed
to avoid wastage. Colleges have innovated ways of
improving their resource base through the introduction
of self-sponsored programs where students who were
not selected to join PPTTCs through the Government
selection program are selected and integrated into the
system but have to pay a higher fee to the institution.
Programs like school based have also been introduced in
some colleges as a way of boosting their resource base.

International Journal of Scientific Research in Science and Technology (www.ijsrst.com)
284
IV. CONCLUSION
The study reveals that most PPTTCs have not trained
their human resource on PC implementation process;
therefore, most of them end up working so hard but
without targeting PC indicator areas simply because they
are not aware. Opondo (2004) claim that an institution
with employees who are specialized will achieve targets
more than those with little training. This implies that
staffs that do not have the necessary knowledge
regarding PC are likely to miss out of their target and
therefore there is need for training so that they get the
necessary knowledge and skills on PC. The research
findings gave a clear indication that most employees
were not trained and therefore BoM should intensify the
training of all employees on PC. The research findings
also indicates that all Public Primary Teachers Training
Colleges operate on vote-head based budgets and
therefore faces serious constraints at the resource level
to implement the various commitments in the contract.
The study found out that Principals of Colleges have
failed to complete the automation program as expected
in PC manual. Automation has been proven to lead to a
more competitive and customer oriented employees’
Service delivery. It also improves employees’
accountability and transparency in an institution. It is
because of this reason that none of the 21 PPTTCs
qualifies to be ISO certified. The findings of this study
through observation check list reveals that service
charters where available in most PPTTCs but what was
lacking in all of them was an office or department where
users would seek redress in case of dissatisfaction.
Colleges were not able to collect levies as expected. The
Government expects institutions to collect 100% levies
from various sources under their mandate. This is
difficult because a number of students enrolled in
PPTTCs cannot afford to pay fees because of their
humble background. Government funds are not also
released on time which includes bursaries for students
while at the same time students pay fees when they are
about to do exams. This delays the achievement of set
targets as PC is evaluated quarterly. Colleges do not
allocate any money to PC activities as a vote head.
However, the PC activities are footed under the general
college vote. It should be noted that all activities to be
undertaken by the college are evaluated under
performance contracting. This means the colleges must
have enough funds to run all activities under PC
evaluation otherwise the PC activity area without
resources will score the least mark. HoDs, however
indicated that the utilization of resources was hindered
by the fact that the teaching staffs were not properly
prepared to implement the planned performance strategy
that had in turn made them not to appreciate the strategy
positively.
V. RECOMMENDATIONS
1. Colleges should partner with the Government in
providing adequate resources.
2. A vote head should be designed for PC program.
3. Board of Managements should intensify the training
of all employees on PC
VI. REFERENCES
[1]. Abdulkaram A, Fasasi V, Akinubi O (2011).
Human Resource Utilization & Internal Efficiency
in State owned Universities in Nigeria. Int. J.
Acad. Res. Bus. Soc. Sci. 1(1).
[2]. Afolabi S. O (2005). 'Influence of Resource
Utilization on Organizational Effectiveness in
Kwara State Government Owned Tertiary
Institutions.' Unpublished P.hD thesis. Retrieved
online on 10/11/2012.
[3]. Carmines, E. G and Zeller, R.G (1999). Reliability
and Validity assessment. Bevery Hills, CA: Sage
publications.
[4]. Darma, N.A (2013). Examining performance
contract in Nigeria: Retrieved on 24th July 2013,
posted on March 9, 2013.
[5]. Gathai, E.W et al (2012).Analysis of factors that
influence implementation of performance
contracts in state corporations (A case of Kenya
civil Aviation Authority) international journal of
Humanities and social sciences Vol2 No. 17
Nairobi Kenya.
[6]. GOK (2005). Office of the president: Performance
contract steering committee, sensitization manual,
Government printers, Nairobi, Kenya.
[7]. GOK (2005). Information booklet on performance
contracts in the public service. Directorate of
personnel management.
[8]. GOK (2011). A strategy for performance
improvement in the public service. Government
printers Nairobi, Kenya.

International Journal of Scientific Research in Science and Technology (www.ijsrst.com)
285
[9]. GOK (2012). Report on Evaluation of the
performance of public agencies for the financial
year 2010/2011 Government Printer; Nairobi.
[10]. Hardina, D, Middleton, J, Montana, S and
Simpson, R. A (2007).An empowering approach
to managing social service organizations. Springer
publishing company, New Nerk.
[11]. Kobia, M & Mohammed, N (2006).The Kenyan
experience with performance contracting.
Discussion paper, 28th AAPAM .Annual
roundtable conferences Tanzania 4th-8
thDec
2006.Arusha, Tanzania.
[12]. Korir, P.K.(2006). The impact of performance in
state corporations. The case of East Africa
Portland Cement. An unpublished MBA
Management Project. University of Nairobi,
Nairobi.
[13]. Mugenda, and Mugenda, A (1999). Research
Methods, qualitative approaches; Acts press,
Nairobi.
[14]. Musa, M (2001). Economic Recovery Strategies
for wealth and employment creation 2003-2007.
Civil service reform Agenda Africa.
[15]. Nyongesa, W.J, Sewe, T. and Naiange, A. (2012).
Challenges facing the implementation of
performance contracts in state corporations in
Kenya: Unpublished: Masai Mara University.
Narok, Kenya.
[16]. Obongo, S.O (2000). Transferring new public
management to development countries. The case
of civil service reforms in Kenya. Manchester,
U.S.A.
[17]. Obongo, O. S (2009). Implementation of
performance contracting in Kenya. International
Public Management Review. Electronic Journal at
http:// www.ipmr.net Vol. 10.Issue 2009.
[18]. O’Connor, T. (2011). “Sampling,” megalinks in
criminal justice. Retrieved from
http://www.drtomoconnor.com/3760/lec03.htm.
October 10, 2015.
[19]. OECD (1997). Issues and development in pubic
management. Paris, France.
[20]. Omboi, B.M (2011). Factors affecting
implementation of performance contract initiative
at Municipal council of Maua- Kenya. Research
journal of Finance and accounting Vol 1. Kenya
Methodist University, Kenya.
[21]. Orodho (2002, 2003). Essentials of educational
and Social Sciences Research method. Masola
Publishers, Nairobi.
[22]. Pablo, T. S (1993). An institutional theory of
public contracts; Regulatory implications.
Website; http://www.nber.org/papers/w14152.
[23]. Performance Contracts Steering Committee,
Kenya, (2004): Sensitization/Training Manual on
Performance Contracts in the Public Service.
[24]. Republic of Kenya, (2003). Economic Recovery
strategy for wealth and Employment creative
(2003-2007). Nairobi. Office of the president.
[25]. Republic of Kenya, (2005). Sensitization/ Training
Manual on performance contracts in the public
service. Government Printer. Nairobi
[26]. RoK (2007). State corporations ranking
evaluation: Office of the president. Government
printers, Nairobi, Kenya.
[27]. Republic of Kenya (2010). Review of
performance contracting in the public sector,
Government Printers Nairobi.
[28]. Republic of Kenya (2014). Report on evaluation
of the performance of public agencies,
Government Printers, Nairobi.
[29]. RoK (2012). Performance contracting guidelines
on the vision 2030 project indicators. Government
printers, Nairobi Kenya.
[30]. Scott, W.R (2001). Institute and organizations.
(2nd
ed.) Sage publication inc.California.
[31]. Umunadi EK (2012). Resource Management and
Planning in Vocational and technical Education
for National Development: An Assessment. Afr. J.
Educ. Technol. 2(1):48-59.

IJSRST16224 | Received: 01August2016 | Accepted:18August2016 | July-August-2016 [(2)4: 286-292]
© 2016 IJSRST | Volume 2 | Issue 4 | Print ISSN: 2395-6011 | Online ISSN: 2395-602X Themed Section: Scienceand Technology
286
Diversity of Phytoplankton inAyyanakere Lake, Chikmagalur
District, Karnataka N. B. Mruthyunjaya
1, M.Venkateshwarlu
2,B. R. Kiran
3, D.S.Somashekar
4
1Government P.U College, ChowlaHiriyuru, KadurTaluk, Chikmagalore, Karnataka, India
2Registrar, Tumkur University, Tumkur, Karnataka, India
3Research & Teaching Assistant in Environmental Science, DDE, Kuvempu University, Shankaraghatta, Karnataka, India
4Department of Zoology, IDSG Government College, Chikkamagaluru, Karnataka, India
ABSTRACT
In the present study, phytoplankton belonging to 40 species under 27 genera was recorded from Ayyanakere lake,
Chikmagalur, Karnataka during the period from April 2008 to March 2009. Results revealed that, Zygnemophyceae
was found to be the dominant group of phytoplankton (25.0 %) followed by Chlorophyceae and Bacillariophyceae
with 22.5 % and 20.0 % respectively and Euglenophyceae with 15%. Ayyanakere lake is found to be rich in
phytoplankton diversity and hence productive. Physico-chemical factors were found to be the important factors
influencing the growth of phytoplankton. The lake is said to be moderately oligotrophic.
Keywords : Diversity, Phytoplankton , Physico-chemical parameters, Ayyanakere lake.
I. INTRODUCTION
Phytoplankton is a functional aquatic community based
upon which the aquatic food web is culminating
(Reynolds, 1984). Studies on physicochemical factors
and phytoplankton standing crop of its habitat are
essential for the proper management of water resources
and for the prediction of the potential changes in the
aquatic ecosystem (Kobbia, 1982; Descy, 1987).
Sheehan (1984) reported that phytoplankton populations
are mostly structured by the physical and chemical
variables of their environment. These factors have also
been reported to be responsible for the heterogeneity in
phytoplankton composition and biomass (El-Ayoutyet
al., 1994, 1999; Ahmad et al., 2001; Ibrahim et al.,
2003).
The present study has been carried out to know the
diversity and distribution ofphytoplankton in
Ayyanakere Lake of Karnataka. This study is relevant
since the present water body forms the source of water
for irrigation, drinking and fisheries.
II. METHODS AND MATERIAL
Study Area
Ayyanakere is an Anicut lake ( Figure 1) constructed by
Rukumanda Raya, chief of Sakharayapatna and
renovated later in 1156 A.D. during the Hoysalas period.
The large lake situated at the eastern base of Dattapeetha
(Baba Budan) range, 18 kms northeast of Chikmagalur
town provides irrigation facilities to more than 1574
hectares of registered land on a hillock adjacent to the
lake.
Figure 1: A View of Ayyanakere lake

International Journal of Scientific Research in Scienceand Technology (www.ijsrst.com)
287
Ayyanakere area possess evergreen to deciduous forest
type. It is one of the most coffee and tea growing regions
in India. The climate of the region is cool and
dominated by many hillocks. The water body is
completely surrounded by the small to larger hillocks
with perennial streams.
Figure 2 shows location of the study area. The
geographical location of this lake is 1341’42” north
latitude and 7504’46” eastern longitude. This lake
constructed to the upper Veda river. The water from this
lake along with some other small tributaries forms river
Veda and joins the river Avathi at Yagatipura to form
Vedavathi. The Vedavathi joins to Krishna river which
ultimately joins Bay of Bengal.
Figure 2: Location of the Ayyanakere Lake
Many hillocks surrounded to the lake which forms the
natural reservoirs. It is a shallow lake has an area of 15
sq. kms. The catchment area of 116.59 sq. kms water
spread area 118.54 ha. The bund forms from the natural
hills and stones with length of 450 m and height 4.80 m.
The maximum depth of the lake is 30 m and an average
depth is 20 m.
Water Quality Parameters
The sampling was carried out during morning between
8.00 AM to 9.00 AM. For physico-chemical analysis
samples were collected weekly during April 2008 to
March 2009. Water samples were collected in 2 litre
capacity plastic cans. The water and air temperature
were recorded at the sampling site itself by mercury
thermometer. Dissolved oxygen was fixed on the spot
itself in BOD bottles. The parameters like free CO2,
alkalinity, total hardness, total dissolved solids, Calcium,
magnesium, phosphates and chlorides were estimated as
per the standard methods ( APHA ,1995; Trivedy and
Goel, 1986).
Phytoplankton Diversity
For the estimation of phytoplankton, the water samples
were transferred to cleaned 500 ml polyethylene bottles.
Then, 5 ml of lugols iodine solution and 10-15 ml of 4%
formaldehyde were added to it for fixation and
preservation of planktonic cells. Plankton were
enumerated using SedgewickRaftar cell (Welch, 1948)
and expressed as numbers per litre. Qualitative
identification of phytoplankton organisms was done
with the help of monographs and they are identified upto
species level (Edmondson,1959; Prasad and
Mehrotra,1977; Needham & Needham,1978; Bharathi
and Hegde, 1982; Digamber and Vidyavathi, 1985;
Adoni et al. 1985; Hegde and Bharathi, 1985 and
Coesel, 1996).
III. RESULT AND DISCUSSION
Water Quality
Seasonal variations in the physico-chemical parameters
of water of the present lake is summarized in Table 1.
Seasonal analysis of water temperature showed that it
was highest in summer and relatively lower in monsoon
and winter (Table 1). pH is considered as important
chemical parameter in waterbody since most of the
aquatic organisms are adapted to an average pH and do
not withstand abrupt changes. The maximum pH was
recorded in pre-monsoon it may due to leaching of soil
followed by the decomposition of plankton (Swarnalatha
and NarasingaRao, 1993) and minimum in monsoon.
The present study shows the acceptable range of pH for
fish culture.
Maximum CO2 recorded during post-monsoon and low
during monsoon season (Table 1). It has been found that
CO2 content is inversely proportional to the oxygen
content due to photosynthesis and respiratory activities
(Deshmukhet al., 1964; Wetzel, 2001).

International Journal of Scientific Research in Scienceand Technology (www.ijsrst.com)
288
The present investigation showed that maximum
dissolved oxygen recorded during monsoon because of
increased phytoplankton high primary productivity and
low metabolic activity of organisms, DO is high due to
photosynthetic activity, minimum in pre-monsoon.
These observations are in agreement with earlier work of
Kumar and Singh (2000), Munwar (1970), Honneshappa
(2008) and Rajashekar and Vijaykumar (2008). The
present study also reveals that the total DO is suitable
for fish growth.
The seasonal variation of calcium concentration is
maximum in monsoon,but less in pre-monsoon. Similar
observation was recorded by Kamran Tasaduqueet al.
(2003). The seasonal variation of magnesium
concentration is maximum value in post-monsoon and
slightly less in monsoon. The minimum value recorded
during pre-monsoon. This is in conformity with the
findings of JanardhanaRao (1982), Zutshi and Khan
(1988), Shardendu and Ambasht (1991) which have
concluded that normally natural water contains
magnesium concentration lower than the concentration
of calcium.
Regarding TDS seasonal analysis states that low in pre-
monsoon and maximum value was recorded in post-
monsoon (Table 1). The higher values may be due to
lower water level and perhaps various kinds of ions
present in the waterbody. Similar, observations were
found by Rajashekaret al. (2003) in the river Umshyripi
as Shillong Meghalaya. In the present study also reveals
that the total dissolved solids is suitable for fish growth.
The seasonal values of chloride was recorded maximum
in post-monsoon and low in pre-monsoon (Table 1).
This in close agreement with that of the observation
made by Patilet al. (1986), Swarnalatha and
NarasingaRao (1993) and Sinha (1995). The reduced
concentration of chloride content recorded during
monsoon season when compared to pre-monsoon season
and may be due to dilution, caused by rain water.
Similar opinion has been given by Orborneet al. (1980)
and Lowe (1980).
Highest total alkalinity recorded during post-monsoon
and lowest in the monsoon (Table 1). The present
study the total hardness is 92, 96 and 108 mg/l during
the period of pre-monsoon, monsoon and post-monsoon
respectively. Highest total hardness recorded during
post-monsoon and lowest in the pre-monsoon (Table
1). Values for the total hardness in the present
investigation falls in the range of moderately hard
category (Mitra, 1982; Birsalet al., 1985).
The phosphate level minimum during monsoon and
maximum in post-monsoon period (Table 1). Many
researchers such as Venkateshwarlu (1969a), Sampath
Kumar (1977) and NirmalKumari (1984) have observed
an increase in phosphate concentration in such water
bodies they may receive domestic waste. This was
contributed by the surface runoff draining the
agricultural fields and mixing with the influent water of
the pond.
Phytoplankton diversity
Phytoplankton population in the Ayyanakere was
summarized in Table 2. The percentage composition of
phytoplankton was shown in Table 3 and Fig. 3. The 5
classes of phytoplankton were Bacillariophyceae,
Chlorophyceae, Zygnemophyceae, Cyanophyceae and
Euglenophyceae formed 20%, 22.5%, 25 %, 17.5% and
15% respectively.
Figure 3.Percentage of the phytoplankton diversity of
different classes
Among these, Zygnemophyceae dominated the other
groups in the lake. Phytoplankton diversity was found
in the order of
Zygnemophyceae>Chlorophyceae>Bacillariophyceae>C
yanophyceae>Euglenophyceae. The Zygnemophyceae,
formed the dominant group of phytoplankton
community and its numerical abundance was relatively
high in all three seasons. Water temperature plays an
important role in controlling the occurrence and
abundance of phytoplankton (Nazneen, 1980). The pH

International Journal of Scientific Research in Scienceand Technology (www.ijsrst.com)
289
has got its effects on phytoplankton population
abundance (Nandan and Patel, 1992). Observed that
high pH values promote the growth of algae and results
in blooms.
Table 1.Seasonal variations in Physico-chemical
parameters of water of Ayyanakere lake
during 2008-09
Parameters Pre-
monsoon
Monsoon Post-
monsoon
Air temp. 32 27 22
Water temp. 29.5 25 21
pH 7.5 7 7.2
DO 6.4 12.2 9.75
Free CO2 6.83 5.06 7.05
Total hardness 92 96 108
Calcium 16.03 19.63 18.83
Magnesium 12.67 13.20 15.10
TDS 100.31 127.13 134.70
Chlorides 24 23.90 28.4
Total
alkalinity
63.18 50.65 66.25
Phosphates 0.45 0.28 0.59
All the parameters are in mg/l except air and water
temperature (C), pH
Among phytoplankton community, diatoms play a very
important role ecologically as they comprise of major
components of producers in wetland ecosystem
(Zalewski et al., 1997; Murulidhar and Yogananda
Murthy, 2015). Diatoms are ubiquitous, unicellular
microorganisms form the basic bulk of planktonic
population in freshwaters characterized by siliceous cell
wall (Round et al., 1990). Blue-greens exhibited heavy
growth in polluted water bodies and dominated over
Chlorophyceae and Bacillariophyceae (Paramasivam
and Srinivasan, 1981; Murulidhar and Yogananda
Murthy, 2015). Desmids are sensitive organisms, act as
indicators of water pollution. Abundance of desmids
clearly indicates the unpolluted condition of the wetland
(Sabir et al., 2007; Murulidhar and Yogananda Murthy,
2015). AsheshTiwari and Chauhan (2006) reported that,
in Kithamlake, Agra, euglenoids density was maximum
during summer followed by rainy and minimum during
winter months. Euglenoids occur in greater number in
polluted water bodies. Tripathi and Pandey (1995) have
recorded maximum euglenoids during monsoon and low
during post-monsoon. In the present study,
Zygnemophyceae is dominant followed by
Chlorophyceae.
Table 2. Distribution of phytoplankton in Ayyanakere
lake
CHLOROPHYCEAE -
Chlorococcales
CYANOPHYCEAE -
Blue-greens
1 Coelastrum
microporum
1. Anabena spiroides
2 Pediastrum
simplex
2. Merismopedia
glauca
3 Scenedesmus
platydiscus
3. Arthrospira
platensis
4 Scenedesmus
quadricauda
4. Oscillatoria
subrevis
5 Tetraedon
trigonum
5. Phormidium fragile
6 Tetraedon
minimum
6. Microcystis
aeruginosa
7 Korshikoviella
limnetica
7. Oscillatoria
auguina
8 Ankistrodesmus
falcatus
9 Micractinium
pussillum
ZYGNEMOPHYCEAE -
Desmids
BACILLARIOPHYCEAE-
Diatoms
1 Micrasterias
inciser 1. Synedra ulna

International Journal of Scientific Research in Scienceand Technology (www.ijsrst.com)
290
2 Cosmarium
tumidum 2. Pinnularia major
3 Closterium lunula 3. Navicula hustedtii
4 Cosmarium
constactum 4. N. palea
5 Closterium
accutum 5. N. radiosa
6 Euastrum
rublobatum 6. N. rhomboides
7 Cosmarium
constactum 7. Epithemia turgida
8 C.
pseudoconnatum 8. Melosira granulata
9 C. retusiformii EUGLENOPHYCEAE -
Euglenoids
10 Desmidium
baileyii
1. Euglena acus
2. E. elatica
3. E. polymorpha
4. E. minuta
5. Phacus tortus
6. Trachelomonas
robusta
Table 3.Percentage composition of Phytoplankton
during the study period
Class Nos. Percentage
(%)
Bacillariophyceae 8 20.0
Chlorophyceae 9 22.5
Zygnemophyceae 10 25.0
Cyanophyceae 7 17.5
Euglenophyceae 6 15.0
IV. CONCLUSION
Plankton are important food sources of fishes specially
the commercially culturing fish species. The present
study shows the rich inphyto plankton diversity they are
chlorococcales, diatoms, desmids, euglenoids and blue-
greens .The commercially culturing fishes are almost
plankton feeders. So the lake is suitable for fish culture.
Based on the present investigations the water is soft
water, it is dominating phytoplankton diversity.
Ayyanakere lake harboured 40 species belonging to 27
genera is rich in phytoplankton diversity and hence
productive. Based on the data on physico-chemical
parameters in relation to phytoplankton distribution and
abundance forms a useful tool for further ecological
assessment and monitoring of water bodies. They are the
risk of pollution by human anthropogenic and
agricultural activities. It is suggested that continuous
assessing of water body and make a plan to protect it
from pollution.
V. REFERENCES
[1]. Adoni, A.D., Gunwant Joshi, Kartikghosh,
Chourasia, S.K., Vaishya, A.K., ManojYadav and
Verma, H.G. 1985. Work book on Limnology.
Prathiba publishers, Sagar, India.
[2]. Ahmad, M.H., A.E. Abdelghany and M. Abdel-
Tawwab. 2001. Phytoplankton dynamics in fertilized
earthen ponds received supplemental feed at
different timing for different periods. Egypt. J.
Botany, 41(1) : 79-98.
[3]. APHA. 1995. Standard Methods for the Examination
of Water and Wastewater. 19th
ed., American Public
Health Association, New York, 1143.
[4]. AsheshTiwari and Chauhan, S.V.S. 2006. Seasonal
phytoplanktonic diversity of Kitham lake, Agra.
Journal of Environmental Biology, 27, 35-38.
[5]. Bharati, S.G. and Hegde, G.R. 1982. Desmids from
Karnataka State and Goa part III. Genus
Cosmariumcorda. Nova Hedwigia. Band XXXVI.
Braunschweig : 733-757.
[6]. Birsal, N.R., V.K. Deshpande., B.V.M. Gouder and
V.B. Nadakarni. 1985. Chemical changes in the
surface waters during the filling phase of a tropical
reservoir on Kali reservoir North Kanara district,
Karnataka state. In : Proceedings of the
International Symposium on Environmental Impact
Analysis of Water Resources Projects.Roorkee,
India, 2 : 801-810.
[7]. Coesel, P. F. M. 1996. Biogeography of desmids.
Hydrobiologia336 : 41-53.
[8]. Descy, J.P. 1987. Phytoplankton composition and
dynamics in river Meuse (Belgium). Arch. Hydrbiol.,
(Suppl. 78), 2: 225-247.
[9]. Deshmukh, S.B., N.S. Phadke and V.
Kothandaraman. 1964. Physico-chemical

International Journal of Scientific Research in Scienceand Technology (www.ijsrst.com)
291
characteristics of Ambazari lake water.
Environmental Health, 6 :186-188.
[10]. Digamber, B. and Vidyavathi. 1985. Gibberellic
acid effect on EuastrumVerrucosumEhrenb. J. Indian
bot. Soc., 64 : 357-361.
[11]. Edmondson W.T. 1959. Freshwater biology.
University of Washington Seattle. London.
[12]. El-Ayouty, Y.M., A.A. El-Essawy and A.A. Said.
1999. The assessment of water quality of Enan and
El-Abbassa ponds. Egypt. Acta. Hydrobiol., 41(2) :
117-137.
[13]. El-Ayouty, Y.M., A.A. El-Essawy, A.E. Abdelghany
and M. Abdel-Tawwab. 1994. Effect of different
N/P/K ratios on physico-chemcial changes and
phytoplankton standing crop in fish pond. Bull. Fac.
Sci. Zag. Univ., 16(1) : 216-239.
[14]. Hegde, G.R. and Bharati, S.G. 1985. Comparative
phytoplankton ecology of fresh water ponds and
lakes of Dharwad, Karnataka state, India. Proc. Nat.
Symp. Pure and Appl. Limnology. (Ed. Adoni,
A.D.). Bull. Bot. Soc. Sagar. 32 : 24-39.
[15]. Honneshappa. 2008. Study on fish diversity and
ecology of Sogane and Santhekadur tanks of
Shimoga district, Karnataka. M.Phil., Dissertation,
Department of Applied Zoology, Kuvempu
University.
[16]. Ibrahim, A.M., N.F. Abd El-Hakim, Z.A. Nagdy and
N.A. Ali. 2003. Effect of fish pond fertilization
systems on water physico-chemical properties and
phyto and zooplankton communities. (Ain Shams
Univ.) J. Environ. Sci., 7(1): 107-133.
[17]. JanardhanRao. 1982. Ecology of algae in a polluted
channel entering the river Moosi at Hyderbad. Ph.D.
Thesis. Osmania University, Hyderabad.
[18]. Kamran Tassaduque, Muhammad Ali, Abdus Salam,
Muhammad Latif and Tasveer Zahra. 2003. Study on
the seasonal variations in the physico-chemical and
biological aspects of Indus river Pakistan. Pak. J.
Bio. Sciences, 6(21) : 1795-1801.
[19]. Khare, S.K. and K.S. Unni. 1986. Changes in
physico-chemical factors and distribution of
periphyton in Kolarriver. K.S. Unni (Ed), Proc. All
India Seminar on Water Quality around Urban
Ecosystems.
[20]. Kobbia, I.A. 1982. The standing crop and primary
production of phytoplankton in Lake Brollus. Egypt.
J. Botany, 25(1-3) : 109-127.
[21]. Kumar, A. and N.K. Singh. 2000. Phytoplankters of
pond at Doghar, India. Phykos., 39 : 21-33.
[22]. Lowe, R.L. and Gale, W.F. 1980. Monitoring river
periphyton with artificial benthic substrates,
Hydrobiol., 69(3) : 235-244.
[23]. Munawar, M. 1970. Limnological studies on
freshwater polluted and unpolluted environments.
Hydrobiol.,39(1) : 105-128.
[24]. Munwar, M. 1970. Limnological studies on
freshwater ponds of Hyderabad. Hydrobiologia., 31 :
105-128.
[25]. Murulidhar, V.N and V.N.Yogananda Murthy. 2015.
Ecology, distribution and diversity of phytoplankton
in Teetha wetland, Tumakuru district, Karnataka,
India. International Journal of Environment and
Pollution Research Vol.3, No.2, pp.1-12.
[26]. Mitra, A.K. 1982. Chemical characteristics of
surface water at selected gauzing stations in the river
Godavari, Krishna and Tungabhadra. Indian J. Env.
Hlth.,24 : 165-179.
[27]. Nandan, S.N. and R.J. Patel. 1985. Study of
phytoplankton and physico-chemical parameter as
indicators of eutrophication. Res. J. Pt. Environ., 2(1)
: 23-27.
[28]. Nazneen, S. 1980. Influence of hydrological factors
on seasonal abundance of phytoplankton in
Kinjharlake, Pakistan. Int. Revu. Ges. Hydrobio.65
(2): 269-282.
[29]. Needham, J.G. and P.R. Needham. 1978. A Guide to
the Study of Freshwater Biology (Holden Day Inc.
Publ., San Francisco). 5th
edition.
[30]. NirmalaKumari, J. 1984. Studies on certain
biochemical aspects of Hydrobiology. Ph.D.Thesis,
Osmania university, Hyderabad.
[31]. Orborne, A.C., M.P. Brooker and R.W. Edward.
1980. The chemistry of the river Wye. J. Hydrol.,45
: 233-252.
[32]. Paramasivam, M. and Srinivasan, A. 1981.
Changes in algal flora due to pollution in
Cauvery river. Indian Journal of Environmental
Health, 23, 222-238.
[33]. Patil, M.K., UshaNamboodiri and K.S. Unni, 1986.
Changes after sediment removal in a sewage pond,
Physical chemical characteristics. All India Seminar
on Water Quality Around Urban Ecosystem: (ed)
K.S. Unni, p. 222.
[34]. Prasad, B.N. and Mehrotra, R.K. 1977a. Some
Desmids new to Indian flora. J.Indian bot. Soc.,
56:343-350.
[35]. Prasad, B.N. and Mehrotra, R.K. 1977b. Desmid
flora of North India paddy fields. New Botanist
4: 49-74.

International Journal of Scientific Research in Scienceand Technology (www.ijsrst.com)
292
[36]. Rajashekar, M. and K. Vijaykumar. 2008. Nutrients
status in Sharanabasaveshwaralake, Gulbarga
district, Karnataka. Ecoscan., 2(1) : 83-85.
[37]. Rajashekar, N.S., B. Nongri and A.M. Partwardhan.
2003. Physico-chemical and biological investigation
of river Umshyrpi at Shillong, Meghalaya. Indian J.
Environ. Hlth., 45(1) : 83-92.
[38]. Reynolds, C.S. 1984. The ecology of freshwater
phytoplankton. Cambridge University Press,
Cambridge, UK, 384 pp.
[39]. Round, F.E., Crawford, R.M. and Mann, D.G.
1990.The Diatoms - Biology & Morphology of the
genera. Cambridge University Press. Reprinted
2000. pp. 747.
[40]. Sabata, B.C. and Nayar, M.P. 1987. Water Pollution
Studies in river Hooghly in relation to
phytoplankton. Proc. Con. Env. Impact on bio-
system, Jan 16-18. pp. 1-5.
[41]. Sabir, B., Muzaffar and Fakhruddin A. Ahamed.
2007. The effects of the flood cycle on the diversity
and composition of the phytoplankton community
of a seasonally flooded Ramsar wetland in
Bangladesh. Wetlands Ecology and Management,
15(2), 81-93. DOI.10.1007/s11273-006-9014-6.
[42]. Sampth Kumar, P.T. 1977. Further studies on the
ecology of algae in the river Moosi, Hyderabad
(India) with special reference to pollution and
potential fertility of the water. Ph.D., Thesis,
Osmania University, Hyderabad.
[43]. Shardendu and R.S. Ambasht. 1991. Impact of
Urban surroundings on some limnobiological
characteristics of tropical aquatic ecosystem,
ActaHydrochim.
[44]. Sheehan, J.P. 1984. Effects of pollutants on
community and ecosystem structure and dynamics.
In: J.P. Shaheen, D.R. Miller, G.C. Butler and P.
Bourdeau (Eds.), Effects of Pollutants at the
Ecosystem Levels. John Wiley Sons Ltd., New York,
51-99.
[45]. Sinha, S.K. 1995. Potability of some rural ponds
water at Muzzaffarpur (Bihar) - A Note on water
quality index. Poll. Res., 14(1) : 135-140.
[46]. Swarnalatha, N. and NarasingaRao, A. 1993.
Ecological investigation of two lentic environments
with reference to Cyanobacteria and Water
Pollution. International Journal of Microbiology and
Ecology., 3, pp 41-48.
[47]. Tripathi, A.K. and Pandey, S.N. 1995. Water
pollution. Ashish Publishing House, New Delhi,
India.
[48]. Trivedi, R.K. and P.K. Goel. 1986. Chemical and
biological methods for water pollution studies.
Environmental Publications, Aligarh.
[49]. Venkateshwaralu, V. 1969a. An ecological study of
the algae of the river Moosi, Hyderabad (India) with
special reference to water pollution I. Physico-
chemical complexes. Hydrobiol., 33(1) : 117-143.
[50]. Welch, P.S. 1948. A text book of Limnological
methods. McGraw Hill, New York, USA.
[51]. Wetzel, R.G. 2001. Limnology lakes and rivers eco
system. 3rd
ed., Academic, USA Press.
[52]. Zalewski, M., Janauer, G.A. and Jolankai, G. (1997)
Conceptual background. cohydrology. IHP-V,
UNESCO. pp. 7-18.
[53]. Zutshi, D.P. and A.U. Khan. 1988. Eutrophic
gradient in Dal lake, Kashmir. IndianJ. Environ
Hlth., 30(4) : 348-354