international journal of chemical and environmental sciences
TRANSCRIPT

Editorial and Administrative Information
November 2020| VOL.2|ISSUE 1
INTERNATIONAL JOURNAL OF CHEMICAL AND
ENVIRONMENTAL SCIENCES
www.ijcaes.thesmartsociety.org
US ISSN Center at the Library of Congress
ISSN: 2689-6389 (Print)
ISSN: 2687-7939 (Online)
(Online)
A Publication of
Society for Makers, Artists, Researchers and Technologists
6408 Elizabeth Avenue SE, Auburn, Washington 98092, USA
INTERNATIONAL
JOURNAL OF
CHEMICAL AND
ENVIRONMENTAL
SCIENCES
VOLUME 2, ISSUE 1
(NOVEMBER, 2020)
SOCIETY FOR MAKERS, ARTISTS, RESEARCHERS AND TECHNOLOGISTS
6408 ELIZABETH AVENUE SE, AUBURN, WA 98092, USA
SMART
SOCIETY FOR MAKERS, ARTISTS, RESEARCHERS AND TECHNOLOGISTS
SMART is a publishing organization which seeks to bring to light new and innovative research ventures and publish
original works of study. All publications by SMART is undertaken with due authorization of the related author(s).
International Journal of Chemical and Environmental Sciences is a publication by SMART.
First Published in November, 2019
Auburn, USA
ISSN: 2689-6389 (Print)
ISSN 2687-7939 (Online)
Copyright © 2020 SMART
All rights reserved. No part of this publication may be reproduced, distributed, or transmitted in any form or by any
means, including photocopying, recording, or other electronic or mechanical methods, without the prior written
permission of the publisher, except in the case of brief quotations embodied in critical reviews and certain other non-
commercial uses permitted by copyright law. For permission requests, write to the publisher, addressed “Attention:
Permissions Coordinator,” at the address below.
SMART
SOCIETY FOR MAKERS, ARTISTS, RESEARCHERS AND TECHNOLOGISTS
6408 ELIZABETH AVENUE SE, AUBURN, WA 98092, USA
Price: 200 USD

Editorial and Administrative Information
From Managing Editor’s Desk
International Journal of Chemical and Environmental Sciences is an open access, peer reviewed
journal that provides authoritative source of information for professionals in a wide range of
chemical and environmental disciplines. It provides an international forum for the rapid
communication of research that broadly embraces the interface consisting of new research
opportunities and discoveries.
The journal publishes original papers, brief communications, reviews and letters related to every
aspect of theory and practice of chemical, (bio) chemical, nano-sciences, environmental sciences
and chemical engineering disciplines. Actually, interdisciplinary studies require an integration of
many different scientific and professional disciplines. The Journal provides a platform for the
exposure in advancement of interdisciplinary approaches related to every aspects of science.
Manuscripts are initially reviewed by the editors and, if found appropriate are sent to scientists
who assess the quality, originality, significance, and validity of the work before finally approving
for publication. All rights are reserved with the publishers. A Reprint Service is available and
copies might be obtained on prior permission for limited and specified reproduction sought on
payment of prescribed charges.
We are taking this opportunity to announce the publication of the first volume of IJCAES, a
journal published by SMART SOCIETY, USA. The contributions involve multi-disciplinary or
trans-disciplinary aspects of science and identify the ways in which the work will be instrumental
in present day research, education, or related activities. The editors are pinning their hopes that
this present issue will be able to get across students, faculties and researchers. We are confident
that IJCAES will act as a podium for its related scientific community it caters around the world
and a trusted medium to interact and communicate.
Dr.Ruchira Mukherjee
Dr, Pratap Mukherjee

THE EDITORS:
PATRON
Prof. (Dr) Satyajit Chakrabarti Director Institute of Engineering & Management.
Salt Lake Electronics Complex, Kolkata-700091
India.
THE MANAGING EDITORS
Dr. Ruchira Mukherjee Professor
Department of Basic Sciences and
Humanities Institute of Engineering & Management.
Salt Lake Electronics Complex,
Kolkata-700091
India
Dr. Pratap Mukherjee Associate Professor
Department of Basic Sciences and
Humanities Institute of Engineering & Management.
Salt Lake Electronics Complex,
Kolkata-700091
India
1 Navonil Banerjee, Ph.D Department of
Microbiology,Immunology and
Molecular Genetics
University of California, Los
Angeles [email protected]
2. Neeladri Roy, Ph.D Laboratory of Cellular and
Molecular Biology National Cancer Institute
National Institute of Health Bethesda.MA [email protected]
3. Koushik Roy, Ph.D Department of Biophysics
University of California, Los
Angeles [email protected]
4. Subrata Debnath, Ph.D
Department of Biochemistry and
Molecular Biology,
Howard University College of
Medicine, Adams Building,
Room 4105, 520 W Street, NW
Washington, DC 20059. [email protected]
5. Sanchaita Das,Ph.D
Department of Chemistry &
Biochemistry University of California, Los
Angeles [email protected]
6. Sayantan Das, Ph.D
Faculty Member,
College of Science and
Mathematics
Texas A&M University, SA [email protected]

THE ASSOCIATE EDITORS
Dr. Tina De Assistant Professor
Department of Basic Science &
Humanities, Institute of Engineering & Management.
Salt Lake Electronics Complex,
Kolkata-700091 India.
Dr. Kakoli Dutta Associate Professor
Department of Basic Sciences and
Humanities Institute of Engineering & Management.
Salt Lake Electronics Complex,
Kolkata-700091 India
Contact Us:
Society for Makers, Artist, Researchers and Technologists.
6408 Elizabeth Avenue SE, Auburn, WA 98092, USA.
Email: [email protected]
Phone- 1-425-605-0775

CONTENTS
Page No.
Environmental variables regulating organic carbon dynamics of
Sundarban mangrove ecosystem, India
Nilanjan Das1; Ayan Mondal1; Sohini Gangopadhay1; Rituparna Banerjee1;
Sunanda Batabyal1; Phani Bhusan Ghosh1; Sudipto Mandal1*
7
United Nations Environment Programme—Present and Future
Imrana Shahin 18
Assessments of Bioaccumulation Factor (BAF) for heavy metals (Pb and
Hg) in an aquatic insect Laccotrephesruber: A major faunal component for
three contrasting freshwater aquatic ecosystems of West Bengal and
Odisha
Anindita Das1*, Santanu Ghara1 and Susanta Kumar Chakraborty1
32
Temporal stratification of weeds under System of Rice Intensification and
conventional rice cultivation
Rituparna Banerjee; Sunanda Batabyal; Suparna Guha; Ayan Mondal; Sohini
Gangopadhyay; Nilanjan Das; Phanibhusan Ghosh; Sudipto Mandal*
41
Herd Immunity: A Success or a Failure
Sayantan Talapatra1*, Soaham Roy1, Soham Chakraborty1,, Nazeef Ahmed1,
Ayan Basu1 Arindit Guha Sinha1.
52

International Journal of Chemical and Environmental Sciences Vol 2 Issue 1, 2020 ISSN 2689-6389 (Print) ISSN 2687-7939 (Online)
Corresponding author
Email address: Email: [email protected]
7
Environmental variables regulating organic carbon dynamics of Sundarban
mangrove ecosystem, India
Received for publication, October 25, 2020, and accepted, November 5, 2020
Nilanjan Das1; Ayan Mondal1; Sohini Gangopadhay1; Rituparna Banerjee1; Sunanda
Batabyal1; Phani Bhusan Ghosh1; Sudipto Mandal1*
1Ecology and Environmental Modelling Laboratory, Department of Environmental Science,
University of Burdwan, West Bengal, India. 713104
Abstract
Mangrove forests produce significant quantities of organic carbon in tidally inundated, anoxic soils and maintain large
carbon stocks. The influence of the environmental variables on organic carbon is studied and a conceptual model of
the dynamics of organic carbon is framed herein. In the mangrove system, various forms of organic carbon are present
in soil and water such as soil organic carbon (SOC), dissolved organic carbon (DOC), and particulate organic carbon
(POC). Among biotic components, organic carbon present in phytoplankton (OCP), organic carbon in the zooplankton
(OCZ) is important. Essential environmental variables like Litter biomass (LB), dissolved oxygen (DO), Primary
productivity (PP), Atmospheric temperature (AT), Water temperature (WT) and Tidal height (TH) are considered as
factors governing organic carbon dynamics. An univariate statistical correlation was employed to assess the
relationships between carbon forms and physical-chemical factors. This was followed by a multivariate statistical
PCA (principle component analysis). The results reflect a close inter-correlation among the studied environmental
variables and organic carbon.
Keywords: Carbon transformation; Estuary; Mangrove; Organic matter; Phytoplankton;
Zooplankton
Introduction
Coastal wetlands are highly productive ecosystems that play a significant role in the global carbon
dynamics, water and nutrient cycles (Craft and Casey, 2000; Mitsch et al.,, 2013; Johnston et al.,,
2014). Vegetated coastal ecosystems can sequester and store large quantities of organic carbon
including mangroves, seagrass meadows and salt marshes (Fourqurean et al.,, 2012). The pool
with the highest organic carbon content in terrestrial ecosystems is the soil organic matter (SOM),
a keystone among organic carbon pools and an indicator of soil condition and quality. The
worldwide stored soil organic carbon is approximately 1.2–1.5 × 10¹⁵ kg (1220– 1500 Gt) in the
top one meter of soil (Eswaran et al.,, 1993; Batjes, 1996). Mangroves have been identified as
potential carbon sequester and are one of the most significant long-term carbon sink of coastal
ecosystems (Alongi, 2014). Coastal wetlands, however, are often subjected to anthropogenic
IJCAES Vol 2, Issue 1, 2020
ISSN 2689-6389 (Print) ISSN 2687-7939 (Online
8
pressures, including drainage and development (Bao et al.2011; Pearse et al.,, 2018). For the past
few decades, the study of carbon cycles as a whole or in part has been an area of research focus of
man authors (Dafner and Wangersky, 2002; Smith and Hollibaugh, 1993; Mukherjee et al.,,
2012a). Both organic and inorganic sources of carbon exist in estuaries. Sundarban is one of the
world's unique habitats with the luxuriant mangroves occurring in almost every island. The
dominant species among the Sundarban mangrove halophytes is Avicennia marina (grey
mangrove). Avicenna alba, Porteresia coarctata, Excoecaria agallocha, Ceriops decandra,
Acanthus ilicifolius and Derris trifoliate. Tree litter (leaves, propagules and twigs) and sub-surface
root growth of the mangrove species provide essential organic carbon inputs to mangrove
sediments (Alongi, 2007). Average global litterfall rates are usually in the order of 38 mol C m2
year-1 (Jennerjahn and Ittekkot, 2002). Moreover, litterfall would account for around one third of
net primary production (Alongi et al.,, 2005a). Significant organic carbon inputs can also be
generated by a number of other sources, including allochthonous, for example, riverine or marine
material ( e.g. seagrass) and autochthonous, such as benthic or epiphytic micro- or macro-algae
production, and local phytoplankton water column production (Bouillon et al.,, 2007). Substantial
additional POC input could occur through phytoplankton and seagrass detritus imported with tides,
depending on local conditions.
In addition, human activities such as deforestation and land ecosystem conversion have resulted
in soil degradation and massive loss of organic carbon from the soil (Lal, 2003). One of the biggest
exchangeable organic reservoirs is the DOC pool of the oceans. In water bodies, DOC
concentration varies along with the magnitude and proportion of autochthonous and allochtonous
sources, temperature, depth, season (Sugiyama et al.,, 2004; Dafner and Wangersky, 2002; Zweifel
et al.,, 1995). A main link in the global carbon cycle is the transport of organic matter from land
to sea (Smith and Hollibaugh, 1993).
Machiwa and Hallberg (2002) made an empirical model on the fate of organic carbon in mangrove
forest. They showed that certain parameters which are difficult to calculate under field conditions
can be accurately estimated by modelling. Bouillon et al., (2007) and Kristensen et al., (2008)
reviewed the organic carbon dynamics in mangrove ecosystem of Kenya and India respectively.
From the past research studies on organic carbon dynamics of estuaries, the interlink between
organic carbon pools is not clear. The objective of the present research is to identify the main
driving factors behind the organic carbon cycle of estuary and to understand the relationship
among them.
Materials and Methods
Study site
The study is based on Sagar and Patharpratima Island, situated in the western sector of the estuary,
are the largest deltaic island with anthropogenic disturbances. The area is located between
21˚27′06″ N to 21˚50′18″ N latitude and 88˚14′26″ E to 88˚53′05″ E longitude (Fig. 1). The total

IJCAES Vol 2, Issue 1, 2020
ISSN 2689-6389 (Print) ISSN 2687-7939 (Online
9
Fig. 1. Location map of Indian Sundarban estuarine system
area of the Sundarbans in India is 3682.76 km2, including 110 deltaic islands, of which 54 have
been reclaimed by humans in earlier (Chakraborty, 1987 and Giri et al.,, 2010). The natural
mangrove vegetation cover of both the islands has been altered by human activities and changes
in land use by reclamation for cultivation and aquaculture. The seasons in this region are pre-
monsoon (March-June), monsoon (July-October) and post-monsoon (November-February)
(Mandal et al.,, 2009).

IJCAES Vol 2, Issue 1, 2020
ISSN 2689-6389 (Print) ISSN 2687-7939 (Online
10
1.1. Sampling and experiments
Several experimental and survey studies were carried out at the research sites over a span of one
year (March 2019 to February 2020) to collect data on LB, various sources of organic carbon
(SOC, DOC, POC, OCP and OCZ), PP, AT, WT, TH and DO. Soil samples were obtained at
monthly intervals from the field stations at a depth of ~10-15 cm from the mangrove swamps,
where tidal flow was observed. The litter from the mangrove forest bed was collected and
quantified using square meter nylon nets placed underneath the mangrove trees. Soil organic
carbon content were estimated following standard methods. Soil organic carbon was estimated by
Walkley and Black method (Walkley and Black, 1934). For chemical analysis, estuarine water
samples were obtained from the creeks at a depth of 20-25 cm at various field stations. Samples
for DOC and POC were collected in glass bottles in the field and stored on ice container and, in
dark condition The samples were taken to the laboratory. The TOC in these samples was estimated
using the Analyticjena (TOC) analyzer. DOC was calculated via Millipore GF / F filter (0.45 μm
pore size). The water samples were passed through the filter paper and the filtrate was used to
determine POC.
At the high tide, plankton was collected from sub-surface water using a plankton net and preserved
with iodine solution (phytoplankton) or buffered formaldehyde (zooplankton). Wet and dry
weights were determined for quantitative phytoplankton analysis, and phytoplankton carbon
content was estimated according to the literature (Jorgensen et al.,, 2000). The Sedgewick Rafter
counting method for zooplankton carbon was used to obtain the number of species and the
corresponding carbon content was determined according to the literature (Friedler et al., 2003).
The light and dark bottle method described by Strickland and Parsons (1972) calculated gross
primary output and community respiration in situ.
Model description
A five-dimension conceptual model (Fig. 2) is constructed using VENSIM PLE ×64 computer
software (High Performance Systems Inc.). The following explanations describe all physical,
chemical, biological components and processes involved in the organic carbon conceptual model.
Litter from the Sundarban mangrove forest deposit at the land-ocean boundary occurs throughout
the year. Litter carbon (L carbon) of the surrounding mangrove forest and the death of soil
organisms and the death of soil microflora (bacteria and fungi) are the major contributors to soil
SOC. Litter carbon (L carbon) is the carbon fraction (C frac) of the litter biomass (L bmas). Inp
DSO is regulated by the input rate of dead soil organisms (Inp rt DSO) and dead soil microflora
(Inp rt DSM). Some fractions of SOC is lost from the system with some loss rate (Lr SOC). The
SOC under anaerobic conditions contributes to the DOC pool through leaching organic acids such
as humic and fulvic acids (Lch OA). A significant volume of terrestrial runoff loaded with DOC
(Inp rt R), tidal height (TH) and ground water (GD rt) influence the DOC pool. A portion of
phytoplankton's primary productivity (PP), as exudation rate (exdn rt) contributes to the DOC pool.
Phytoplankton, zooplankton and other excretory products from benthic fauna are decomposed and
eventually contribute to the DOC pool (excrtn rt). Certain amounts of POC convert to DOC (bkdn)
in the system. The conversion (mi rt) is regulated by temperature of water
IJCAES Vol 2, Issue 1, 2020
ISSN 2689-6389 (Print) ISSN 2687-7939 (Online
11
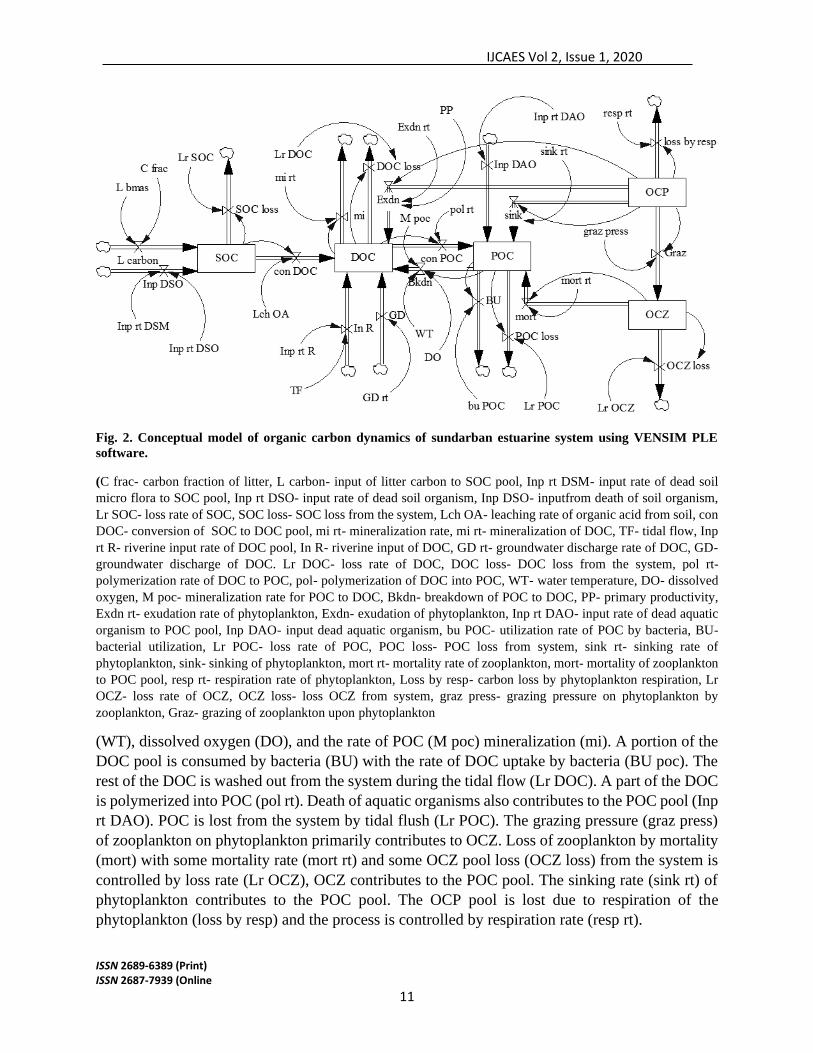
Fig. 2. Conceptual model of organic carbon dynamics of sundarban estuarine system using VENSIM PLE
software.
(C frac- carbon fraction of litter, L carbon- input of litter carbon to SOC pool, Inp rt DSM- input rate of dead soil
micro flora to SOC pool, Inp rt DSO- input rate of dead soil organism, Inp DSO- inputfrom death of soil organism,
Lr SOC- loss rate of SOC, SOC loss- SOC loss from the system, Lch OA- leaching rate of organic acid from soil, con
DOC- conversion of SOC to DOC pool, mi rt- mineralization rate, mi rt- mineralization of DOC, TF- tidal flow, Inp
rt R- riverine input rate of DOC pool, In R- riverine input of DOC, GD rt- groundwater discharge rate of DOC, GD-
groundwater discharge of DOC. Lr DOC- loss rate of DOC, DOC loss- DOC loss from the system, pol rt-
polymerization rate of DOC to POC, pol- polymerization of DOC into POC, WT- water temperature, DO- dissolved
oxygen, M poc- mineralization rate for POC to DOC, Bkdn- breakdown of POC to DOC, PP- primary productivity,
Exdn rt- exudation rate of phytoplankton, Exdn- exudation of phytoplankton, Inp rt DAO- input rate of dead aquatic
organism to POC pool, Inp DAO- input dead aquatic organism, bu POC- utilization rate of POC by bacteria, BU-
bacterial utilization, Lr POC- loss rate of POC, POC loss- POC loss from system, sink rt- sinking rate of
phytoplankton, sink- sinking of phytoplankton, mort rt- mortality rate of zooplankton, mort- mortality of zooplankton
to POC pool, resp rt- respiration rate of phytoplankton, Loss by resp- carbon loss by phytoplankton respiration, Lr
OCZ- loss rate of OCZ, OCZ loss- loss OCZ from system, graz press- grazing pressure on phytoplankton by
zooplankton, Graz- grazing of zooplankton upon phytoplankton
(WT), dissolved oxygen (DO), and the rate of POC (M poc) mineralization (mi). A portion of the
DOC pool is consumed by bacteria (BU) with the rate of DOC uptake by bacteria (BU poc). The
rest of the DOC is washed out from the system during the tidal flow (Lr DOC). A part of the DOC
is polymerized into POC (pol rt). Death of aquatic organisms also contributes to the POC pool (Inp
rt DAO). POC is lost from the system by tidal flush (Lr POC). The grazing pressure (graz press)
of zooplankton on phytoplankton primarily contributes to OCZ. Loss of zooplankton by mortality
(mort) with some mortality rate (mort rt) and some OCZ pool loss (OCZ loss) from the system is
controlled by loss rate (Lr OCZ), OCZ contributes to the POC pool. The sinking rate (sink rt) of
phytoplankton contributes to the POC pool. The OCP pool is lost due to respiration of the
phytoplankton (loss by resp) and the process is controlled by respiration rate (resp rt).

IJCAES Vol 2, Issue 1, 2020
ISSN 2689-6389 (Print) ISSN 2687-7939 (Online
12
The different forms of organic carbon (SOC, DOC, POC, OCP and OCZ) along with various
environmental variables (LB, PP, AT, WT, DO and TH) collected during the field survey are
represented here as a conceptual model of organic carbon dynamic in the Sundarban mangrove
system.
Statistical analysis
In order to explain the relationship between different environmental variables and various sources
of carbon, a univariate Pearson (linear r) correlation analysis was performed. PCA was done using
PAST 4.03 software.
Results
In order to explain the relationship between the various environmental variables and different
sources of organic carbon, correlation analysis was carried out (Table 1). The association between
environmental variables and various sources of soil carbon indicated that the SOC was
Table 1. Correlation of all the variables considered for the study.
SOC DOC POC OCP OCZ LB PP DO AT WT TH
SOC
DOC 0.461
POC -0.559 -0.484
OCP 0.485 -0.050 0.356
OCZ -0.254 0.078 -0.435 -0.876
LB 0.711 0.730 -0.434 -0.105 0.080
PP -0.776 -0.407 0.155 -0.675 0.555 -0.292
DO 0.754 0.825 -0.576 0.185 0.018 0.603 -0.616
AT -0.647 -0.678 0.538 -0.137 0.138 -0.658 0.440 -0.784
WT -0.569 -0.752 0.497 -0.117 0.118 -0.667 0.337 -0.787 0.963
TH -0.631 -0.015 0.401 -0.407 0.123 0.178 0.502 -0.461 0.151 0.101
significantly correlated with LB (0.71) and DO (0.75) and negatively correlated with TH (0.63).
DOC was positively correlated with LB (0.73) and DO (0.82) and negatively correlated with PP
(-0.41) and WT (-0.75). AT (0.53) and TH (0.40) were positively associated with POC and
negatively correlated with DO (-0.57). OCZ showed positive correlation with PP (0.56). There was
a significant negative correlation (–0.867) between OCP and OCZ. The seasonal variation of the

IJCAES Vol 2, Issue 1, 2020
ISSN 2689-6389 (Print) ISSN 2687-7939 (Online
13
environmental variables and the organic carbon pools of the Sundarban mangrove ecosystem is
shown in the Fig. 3a, 3b, 3c, 3d and 3e.
The variance pattern of the studied variables across seasons is examined by a PCA biplot (Fig. 4).
The overall variance described corresponds to 50.67 % for the aforementioned variables. It
revealed that in the months of March, April, June and February, maximum variation was observed.
In relation to environmental factors, the late monsoon and winter months were stable.
Fig. 3. Radar plot shows (a) Fluctuation of SOC, DOC and POC during study period, (b) fluctuation of OCP and
OCZ during study period, (c) fluctuation of LB and PP during study period, (d) fluctuation of AT and WT during
study period, (e) fluctuation of DO and TH during study period.
Discussion
The PCA biplot showed that December to March, that is the postmonsoon and earlier premonsoon
months, experienced maximum variation in SOC, DOC and OCP along with LB and DO. Mitra et
al., (2018) studied on a potential carbon scrubbing system in Indian Sundarban mangrove
ecosystem. They observed that the OC showed a distinct seasonal pattern with highest value in
monsoon followed by postmonsoon and premonsoon.
It was observed that summer experienced increased that microbial activity due to a high
temperature leading to increased rate of mineralization (Sorensen et al.,, 2018; Thomas et al.,,

IJCAES Vol 2, Issue 1, 2020
ISSN 2689-6389 (Print) ISSN 2687-7939 (Online
14
2018; Yam and Tripathi, 2019). The present findings are in agreement with above observations. It
is seen in different regions that nutrient availability in mangrove soils decreases from the landward
zone to the seaward zone along the estuarine gradient of tropical estuary (Asp et al.,, 2018). Tidal
inundation has a large effect on the species habitat zonation in the mangrove areas (Leong et al.,,
Fig. 4. PCA biplot showing the components using pooled data for 12 months
2018). The May and June, the premonsoon months showed OCZ has maximum variation along
with PP and TH. The month of monsoon experienced variation in POC along with AT and WT.
In the monsoon months due to rain and water runoff, water logging condition often prevails in the
adjoining mangrove forest substratum of estuary and prevents the penetration of atmospheric
oxygen, lowering the activity of bacteria and fungi, and other detritivores present in the soil
(Beimans et al.,, 2019). Community respiration also remains high in these months (Sullaway and
Edwards, 2020). In the absence of physiological stress by sulphide and salinity, soil nutrient
availability is considered as the key factor for determining mangrove biomass and productivity
(Chen and Twilley, 1999). Due to inundation in the monsoon months anaerobic conditions in soil
exist (Maji et al., 2020). Pore spaces in the soil are filled with water and rate of oxygen diffusion
is reduced enormously (Masilamani et al., 2020). It is evident from the arlier studies that the
microbes utilize OC as food source. Since the decomposition rates are slow and organic load from
the seven main rivers of the Sundarban mangrove system increases during monsoon, the overall
load of organic carbon of estuary is increased during monsoon.

IJCAES Vol 2, Issue 1, 2020
ISSN 2689-6389 (Print) ISSN 2687-7939 (Online
15
During post monsoon temperature remains low. Mangroves litterfall is increased at that time; also
microbial activity is lowered as a result SOC values remained high during this period. Dissolved
oxygen content is high and temperature remains low in the postmonsoon, diffusion at the air-water
interface occurs at high rate along with community metabolism (Berg et al., 2019). Thus the
organic carbon content is moderate during this period.
Field results showed that in postmonsoon when phytoplankton blooms occur, the zooplankton
population is moderately high. Then grazing pressure upon phytoplankton causes a decline in the
number of phytoplankton. Zooplankton reaches its peak during premonsoon in the Sundarban
mangrove ecosystem (Mandal et al., 2012).
Conclusions
Across the intertidal landscape, mangrove forests clearly contributed the most to POC through LB.
The cycling of organic carbon along with the adjacent mangrove forest in the Sundarban mangrove
ecosystem is an integrated phase of the soil, sediment, water and biota. The LB and AT are very
crucial for the soil system, while WT, TH and dissolved oxygen are the regulating factors for the
water system. In the spatiotemporal modelling aspect, this can be further demonstrated to
understand the dynamics of nutrients with abiotic factors that in turn influence the system's
sustainability. This research can further be extended with the inclusion of long term study based
on simulation modelling. The conceptual model present here represents the interaction among
environmental variables and organic carbon pools of the Sundarban mangrove ecosystem.
Acknowledgements
The authors acknowledge the Science and Engineering Research Board (SERB), New Delhi India
(Project: EEQ/2018/001076) for providing financial support to carrying out this research work.
Thanks are due to Mr. Jalad Gayen for the assistance during field surveys.
References
[1] Alongi DM (2014) Carbon Cycling and Storage in Mangrove Forests. Annual Review of Marine
Science 6: 195-219. https://doi.org/10.1146/annurev-marine-010213-135020
[2] Alongi DM, Clough BF, Robertson AI (2005) Nutrient-use efficiency in arid-zone forests of the
mangroves Rhizophora stylosa and Avicennia marina. Aquatic Botany 82: 121-131.
https://doi.org/10.1016/j.aquabot.2005.04.005
[3] Asp NE, Gomes VJC, Schettini CAF, Souza-Filho PWM, Siegle E, Ogston AS, Nittrouer CA, Silva
JNS, Nascimento WR, Souza SR, Pereira LCC, Queiroz MC (2018) Sediment dynamics of a tropical
tide-dominated estuary: Turbidity maximum, mangroves and the role of the Amazon River sediment
load. Estuarine, Coastal and Shelf Science 214: 10-24. https://doi.org/10.1016/j.ecss.2018.09.004
[4] Bao K, Zhao H, Xing W, Lu X, McLaughlin NB, Wang G (2011) Carbon Accumulation in Temperate
Wetlands of Sanjiang Plain, Northeast China. Soil Science Society of America Journal 75: 2386-2397.
https://doi.org/10.2136/sssaj2011.0157
[5] Batjes NH (1996) Total carbon and nitrogen in the soils of the world. European Journal of Soil Science
47: 151-163. https://doi.org/10.1111/j.1365-2389.1996.tb01386.x
[6] Berg P, Delgard ML, Polsenaere P, McGlathery KJ, Doney SC, Berger AC (2019) Dynamics of
benthic metabolism, O 2 , and pCO 2 in a temperate seagrass meadow. Limnology and Oceanography
64: 2586-2604. https://doi.org/10.1002/lno.11236

IJCAES Vol 2, Issue 1, 2020
ISSN 2689-6389 (Print) ISSN 2687-7939 (Online
16
[7] Biemans H, Siderius C, Lutz AF, Nepal S, Ahmad B, Hassan T, von Bloh W, Wijngaard RR, Wester
P, Shrestha AB, Immerzeel WW (2019) Importance of snow and glacier meltwater for agriculture on
the Indo-Gangetic Plain. Nature Sustainability 2: 594-601. https://doi.org/10.1038/s41893-019-0305-
3
[8] Bouillon S, Dehairs F, Velimirov B, Abril G, Borges AV (2007) Dynamics of organic and inorganic
carbon across contiguous mangrove and seagrass systems (Gazi Bay, Kenya). Journal of Geophysical
Research 112. https://doi.org/10.1029/2006JG000325
[9] Chen R, Twilley RR (1999) A simulation model of organic matter and nutrient accumulation in
mangrove wetland soils. Biogeochemistry 44(1):93-118. https://doi.org/10.1007/BF00993000
[10] Craft CB, Casey WP (2000) Sediment and nutrient accumulation in floodplain and depressional
freshwater wetlands of Georgia, USA. Wetlands 20: 323-332. https://doi.org/10.1672/0277-
5212(2000)020[0323:SANAIF]2.0.CO;2
[11] Dafner EV, Wangersky PJ (2002) A brief overview of modern directions in marine DOC studies Part
I.-Methodological aspects. Journal of Environmental Monitoring 4: 48-54.
https://doi.org/10.1039/b107277n
[12] Eswaran H, Van Den Berg E, Reich P (1993) Organic Carbon in Soils of the World. Soil Science
Society of America Journal 57: 192-194. https://doi.org/10.2136/sssaj1993.03615995005700010034x
[13] Fourqurean JW, Duarte CM, Kennedy H, Marbà N, Holmer M, Mateo MA, Apostolaki ET, Kendrick
GA, Krause-Jensen D, McGlathery KJ, Serrano O (2012) Seagrass ecosystems as a globally
significant carbon stock. Nature Geoscience 5: 505-509. https://doi.org/10.1038/ngeo1477
[14] Friedler E, Juanico M, Shelef G (2003) Simulation model of wastewater stabilization reservoirs.
Ecological Engineering 20: 121-145. https://doi.org/10.1016/S0925-8574(03)00009-0
[15] Fujimoto K, Imaya A, Tabuchi R, Kuramoto S, Utsugi H, Murofushi T (1999) Belowground carbon
storage of Micronesian mangrove forests. Ecological Research 14: 409-413.
https://doi.org/10.1046/j.1440-1703.1999.00313.x
[16] Giri C, Ochieng E, Tieszen LL, Zhu Z, Singh A, Loveland T, Masek J, Duke N (2010) Status and
distribution of mangrove forests of the world using earth observation satellite data. Global Ecology
and Biogeography 20: 154-159. https://doi.org/10.1111/j.1466-8238.2010.00584.x
[17] Jennerjahn TC, Ittekkot V (2002) Relevance of mangroves for the production and deposition of
organic matter along tropical continental margins. Naturwissenschaften 89: 23-30.
https://doi.org/10.1007/s00114-001-0283-x
[18] Johnston SG, Burton ED, Aaso T, Tuckerman G (2014) Sulfur, iron and carbon cycling following
hydrological restoration of acidic freshwater wetlands. Chemical Geology 371: 9-26.
https://doi.org/10.1016/j.chemgeo.2014.02.001
[19] Kristensen E, Bouillon S, Dittmar T, Marchand C (2008) Organic carbon dynamics in mangrove
ecosystems: A review. Aquatic Botany 89: 201-219. https://doi.org/10.1016/j.aquabot.2007.12.005
[20] Lal R (2003) Soil erosion and the global carbon budget. Environment International 29: 437-450.
https://doi.org/10.1016/S0160-4120(02)00192-7
[21] Leong RC, Friess DA, Crase B, Lee WK, Webb EL (2018) High-resolution pattern of mangrove
species distribution is controlled by surface elevation. Estuarine, Coastal and Shelf Science 202: 185-
192. https://doi.org/10.1016/j.ecss.2017.12.015
[22] Machiwa JF, Hallberg RO (2002) An empirical model of the fate of organic carbon in a mangrove
forest partly affected by anthropogenic activity. Ecological Modelling 147(1):69-83.
https://doi.org/10.1016/S0304-3800(01)00407-0
[23] Maji B, Sarangi SK, Mandal UK, Burman D, Balasubramaniam P. Climate change and management
options for sustainable soil health and crop production: eastern coast of India as an example. Adv
Agric Res Technol J. 2020;4(1):28-41.
[24] Mandal S, Burman D, Bandyopadhyay BK, Mandal UK, Sarangi SK, Mahanta KK, Maji B, Sharma
DK, Maitra NJ, Ghoshal TK, Velmurugan A, Ambast SK, Mani PK, Mandal B, Patra P, Patra S, De
S (2015) Crop-Fish Integration through Land Shaping Models for Enhancing Farm Income under
Eastern Coastal Region of India. Agricultural Economics Research Review 28: 47.
https://doi.org/10.5958/0974-0279.2015.00021.X
[25] Mandal S, Debnath M, Ray S, Ghosh PB, Roy M, Ray S (2012) Dynamic modelling of dissolved
oxygen in the creeks of Sagar island, Hooghly–Matla estuarine system, West Bengal, India. Applied
Mathematical Modelling 36(12):5952-63. https://doi.org/10.1016/j.apm.2011.10.013
IJCAES Vol 2, Issue 1, 2020
ISSN 2689-6389 (Print) ISSN 2687-7939 (Online
17
[26] Mandal S, Ray S, Ghosh PB (2009) Modelling of the contribution of dissolved inorganic nitrogen
(DIN) from litterfall of adjacent mangrove forest to Hooghly-Matla estuary, India. Ecological
Modelling 220: 2988-3000. https://doi.org/10.1016/j.ecolmodel.2009.01.028
[27] Masilamani P, Arulmozhiselvan K, Alagesan A (2020) Prospects of biodrainage to mitigate problems
of waterlogging and soil salinity in context of India - A review. Journal of Applied and Natural Science
12: 229-243. https://doi.org/10.31018/jans.vi.2285
[28] Mitra A, Zaman S, Gobato R (2018) Indian Sundarban Mangroves: A potential Carbon Scrubbing
System. Parana J. Sci. Educ 4(4):7-29.
[29] Mitsch WJ, Bernal B, Nahlik AM, Mander Ü, Zhang L, Anderson CJ, Jørgensen SE, Brix H (2012)
Wetlands, carbon, and climate change. Landscape Ecology 28: 583-597.
https://doi.org/10.1007/s10980-012-9758-8
[30] Mukherjee J, Banerjee M, Banerjee A, Roy M, Ghosh PB, Ray S (2014) Impact of Environmental
Factors on the Carbon Dynamics at Hooghly Estuarine Region. Journal of Ecosystems 2014: 1-10.
https://doi.org/10.1155/2014/607528
[31] Pearse AL, Barton JL, Lester RE, Zawadzki A, Macreadie PI (2017) Soil organic carbon variability
in Australian temperate freshwater wetlands. Limnology and Oceanography 63: S254-S266.
https://doi.org/10.1002/lno.10735
[32] Smith SV, Hollibaugh JT (1993) Coastal metabolism and the oceanic organic carbon balance.
Reviews of Geophysics 31: 75-89. https://doi.org/10.1029/92RG02584
[33] Sorensen PO, Finzi AC, Giasson M-A, Reinmann AB, Sanders-DeMott R, Templer PH (2018) Winter
soil freeze-thaw cycles lead to reductions in soil microbial biomass and activity not compensated for
by soil warming. Soil Biology and Biochemistry 116: 39-47.
https://doi.org/10.1016/j.soilbio.2017.09.026
[34] Strickland JDH & Parsons TR (1972) A Practical Handbook of Seawater Analysis (2nd edition).
Bulletin of the Fisheries Research Board of Canada.
[35] Sugiyama Y, Anegawa A, Kumagai T, Harita Y-n, Hori T, Sugiyama M (2004) Distribution of
dissolved organic carbon in lakes of different trophic types. Limnology 5: 165-176.
https://doi.org/10.1007/s10201-004-0128-3
[36] Sullaway GH, Edwards MS (2020) Impacts of the non-native alga Sargassum horneri on benthic
community production in a California kelp forest. Marine Ecology Progress Series 637: 45-57.
https://doi.org/10.3354/meps13231
[37] Thomas L, Malap N, Grabowski WW, Dani K, Prabha TV (2018) Convective environment in pre-
monsoon and monsoon conditions over the Indian subcontinent: the impact of surface forcing.
Atmospheric Chemistry and Physics 18: 7473-7488. https://doi.org/10.5194/acp-18-7473-2018
[38] Twilley RR, Chen RH, Hargis T (1992) Carbon sinks in mangroves and their implications to carbon
budget of tropical coastal ecosystems. Water, Air, & Soil Pollution 64: 265-288.
https://doi.org/10.1007/BF00477106
[39] Walkley A, Black IA (1934) AN EXAMINATION OF THE DEGTJAREFF METHOD FOR
DETERMINING SOIL ORGANIC MATTER, AND A PROPOSED MODIFICATION OF THE
CHROMIC ACID TITRATION METHOD. Soil Science 37: 29-38.
https://doi.org/10.1097/00010694-193401000-00003
[40] Yam G, Tripathi OP, Das DN (2019) Modelling of total soil carbon using readily available soil
variables in temperate forest of Eastern Himalaya, Northeast India. Geology, Ecology, and
Landscapes: 1-8. https://doi.org/10.1080/24749508.2019.1706295
[41] Zweifel UL, Wikner J, Hagström Å, Lundberg E, Norrman B (1995) Dynamics of dissolved organic
carbon in a coastal ecosystem. Limnology and Oceanography 40: 299-305.
https://doi.org/10.4319/lo.1995.40.2.0299
International Journal of Chemical and Environmental Sciences Vol 2 Issue 1, 2020 ISSN 2689-6389 (Print) ISSN 2687-7939 (Online)
Corresponding author
Email address: [email protected]
18
United Nations Environment Programme—Present and Future
Received for publication, September10, 2020, and in revised form, November 20, 2020
Imrana Shahin
Department of Political Science, Vidyagyan Leadership Academy (Shiv Nadar Foundation)
Tehsil-Sikandrabad, District-Bulandshahr, Dulhera, Uttar Pradesh 203203
Abstract
Environmental issues are posing a grave challenge to humanity since few decades now. In this regard,
the role of United Nations Environment Programme (UNEP), the international institution coordinating
these concern has been an important subject of study. A number of studies since the very inception of
UNEP, have tried to examine and reform its functioning to meet global challenges. The purpose of this
paper is to review existing literature on this subject. It summarizes the views of different analysts who
have devoted their study to an understanding of the nature, functions and shortcomings of UNEP. It
further combines the recommendations suggested by them in order to strengthen UNEP or to replace it
with UNEO. On having observed the arguments meticulously the paper synthesizes reform
recommendation. It also tries to address the gap in existing literature that tends to be arbitrarily tilted
towards the study of functions rather that structure of UNEP and makes recommendation for the same
as well.
Keywords: UNEP, UNEO, environment, mandate, assessment, cluster, autonomy
Introduction
The years 2019-20 are marked by unprecedented incidences around the globe, definitely
COVID-19 remains most crucial and has contributed to a paradigmatic shift in every horizon.
Yet, the question of Environment and its concerns remained as crucial as always with the
heartbreaking episodes of Amazon, Australian and Californian forest fires sending chills among
all, the rising level of air pollution, heat waves and consequent protests of such by the youth,
not to mention the name Greta Thunberg here, have all rendered a review of the working of the
“anchor” environment organisation UNEP imperative.
The purpose of this paper is to review the existing literature which largely trend on the
performance of UNEP and focused on dimensions like its functions, relation of style of
leadership within UNEP and resulting efficacy of the organisation, practices of monitoring by
UNEP and how fruitful are its coordination of multilateral agreements. The literatures also
study the shortcomings of UNEP in managing environmental affairs at the global level, and a
number of them vary from each other in the recommendations they make for the same, while
some voice strongly for establishing a world environmental organisation in place of UNEP
others claim for upgrading UNEP into UNEO.

IJCAES Vol 2, Issue 1, 2020
ISSN 2689-6389 (Print) 19 ISSN 2687-7939 (Online)
In this paper, we would like to collate the views of the literatures and try to summarize the best
possible recommendation for making UNEP at par with the global environmental challenges.
The gap that exists in the present literatures will be assessed and explained and how most of
them except a few like that of Bauer (2009), does not throw sufficient light in the institutional
and structural study of UNEP as a limiting factor in its functioning. In conclusion, those gaps
would be addressed to provide a strong foundational recommendation that would prepare us
better to nurture Mother Earth for a golden future of humanity.
Assessing the Performance of UNEP
The UNEP, is the recognised global authority on environmental issues, thus in-charge of
formulating international environmental agendas, establishing comprehensive and practical
execution plans for fulfillment of goals of Sustainable Development within the United Nations
system and serving as a watchdog over environment safety protocols. Established in 1972 and
headquartered in Nairobi, Kenya, its mission is to provide global leadership and encourage
partnership, cooperation and confidence in caring for the environment by inspiring, informing
and enabling nations and peoples to improve their quality of life.
Discharge of Essential Functions
UNEP, in 1972 was established as the “core”, or “anchor institution” [2], at the global
environment level. Its most vital responsibility is the collection, organisation and distribution
of environment related information, coordinate actions and ventures of nations within the UN
arrangement. The extant literature reviewing the performance of UNEP varies widely, wherein
some glorifying it, in terms of its achievements as the most splendid UN organizations [16],
well-regarded institution [16], quite effective [16] and an impressive success provided the
limited mandate, resources and authority it has at its disposal [21]. Whereas, some others label
it as rather outdated, overburdened, geographically distant and lacking in resources, authority
and funds [12], “peanut-sized [18], “weak agency” [21] with misspent limited resources and a
credibility gap (UN 1997). With the increased instances of environmental failures, it will not
be wrong to state that UNEP has not been wholly successful in the discharge of its functions.
Ivanova (2015), assesses UNEP’s performance in three core functions:
Supervising, examining and reporting on the global environment issues and concerns;
Preparing action plans and regulating standards, policies, protocols, agreements and guidelines;
and nurturing the capacity of its own as an institution which could tackle and resolve present
and future environmental problems.
Supervision, Examination and Reporting
Regarding its function of supervision, examination and surveillance UNEP is required to offer
advice and consultation on environmental policies, issue prompt warning and safety protocols
on environmental threats, and to mediate plus encourage cooperation and joint ventures
between nations on environmental issues making efficient use of the most advanced scientific
and technical capabilities available (UNEP 1997b). In this regard it can be said that the UNEP
has been productive

IJCAES Vol 2, Issue 1, 2020
ISSN 2689-6389 (Print) 20 ISSN 2687-7939 (Online)
in monitoring, assessing, launching environmental agreements [13], assessment of global
environmental issues [12] and UNEP’s planning for monitoring and evaluation is said to be
critical on performance of UNEP GEF projects in Kenya [14]. Its publication, Global
Environmental Outlook (GEO) has been appreciated as one of the two most respected
environmental outlook publications available presently [20]. Hence, the existing literature
highlights effective performance of UNEP in this sphere.
Preparing action-plans and regulating policy processes
As an authority institution on environment, it is an essential function of UNEP to set agendas
and manage policy processes. The function is critical to gain agreement on standards, policies
and guidelines [13].
However, it is this field where UNEP has not been able to be sufficiently effective. UNEP has
not been successful in coordinating agreements effectively in its two key areas: coordinating
multilateral environmental activities and those of other international organisations [13], its
efficacy in coordination have been considered low [2]. In this regard, Andresen and Rosendal
(2009), pointed out that the secretaries of smaller multilateral environmental agreements were
more satisfied with the role of UNEP than the bigger ones.
UNEP has made efforts for increased “coherence” and “coordination” of multilateral
environmental agreements but the success is very limited. [1]
Capacity building
UNEP, is helping environmental ministries around the world in building institutional capacities
as a response to the requests by the governments. [13]
So, in the field of capacity development of nations to deal with environmental challenges UNEP
has been quite effective.
Style of Leadership and its Impact on Performance
An evaluation of the style of leadership practised in UNEP and its effect on its performance
indicate that, transformational, charismatic and democratic leadership is practised here and it
does have an impact on the organisations’ performance [11]. Gachingiri (2015) further
establishes that majority of the respondents (82.93%) revealed that management in UNEP does
not exhibit elaborate ways and method to enjoin people work together collectively at a common
endeavour.
Secretariat of UNEP
The General Assembly has provided UNEP with a “small secretariat” of some 400 members
with a Governing Council of 58 members that represent the five United Nations Region. UNEP
Secretariat
handles several issues and is therefore a very efficient international bureaucracy, which yet
remains constrained by a series of factors. The factors are the subordinate position of the
IJCAES Vol 2, Issue 1, 2020
ISSN 2689-6389 (Print) 21 ISSN 2687-7939 (Online)
secretariat providing a moderate degree of organisational independence and authority to it, a
scanty budget further has contributed to make many of its initiatives helpless and lack of
mandate has rendered policy implementation difficult [4]. Even though the Secretariat has been
helpful in shaping the cognitive sphere of international environmental awareness by and large
it remains very short in the fulfilment of its duties.
Reviewing the Shortcomings in the Functions of UNEP
An analysis of the functions of UNEP through different dimensions has quite clearly revealed
the shortcomings in the functions of the UNEP. The existing literature clearly points towards
the inadequacy of UNEP to function as an authority in global environmental global governance.
The paper further tries to explore the shortcomings or limiting factors that inhibit the
organisation to function fruitfully.
Formal status: The first and foremost limitation of UNEP as pointed by many is its status as a
UN programme rather than as a specialised agency of the UN [13]. A similar view is presented
by Nils Meyer-Ohlendorf and Markus Knigge (2007) as he states because of its current
institutional status, UNEP in its current form is not able to fulfil its coordinating mandate. The
lack of authority has curbed the programme’s ability to efficiently meet current and emerging
environmental challenges.
Hence, in view of the observations stated above, it is evident that the formal status of UNEP as
a programme is a strong limiting factor for it to perform its coordinating mandates.
Governance: The governance structure of UNEP includes three bodies-the governing council,
secretariat and the committee of permanent representatives. Most often these representatives
have little environmental knowledge and have other duties to perform. [21]
Further, the unclear relationship between the permanent representatives and the governing
council limits the functioning of UNEP [13]. The current UNEP Governing Council (GC) has
58 members and is not accountable [17]. The governance of UNEP is thus weak and inefficient
in managing the work of UNEP and has thus contributed towards the failure of the organisation.
Financial structure: Weak financial resources available at the disposition of UNEP, and its
complete dependency on voluntary contributions of individual states are strong factors curbing
its powers. One of the root causes of UNEP’s problems may be the organisations financial
structure [13]. UNEP remains ineffective because of its limited finances is pointed by Ohlendorf
and Kingge (2007) as well. The importance of finance as a resource for productive and fruitful
functioning of any organisation can never be undermined and UNEP’s dependency here speaks
volume of the disregard and lack of due attention the body receives in the UN system.
Organisational structure: A number of issues in this regard have been highlighted by Ivanova
(2005) like the functional responsibilities of many major departments are not very clear, the
system lacks
IJCAES Vol 2, Issue 1, 2020
ISSN 2689-6389 (Print) 22 ISSN 2687-7939 (Online)
clear delegation of authority, lack of coherent and comprehensive presentation of the
programme budget, oversight of assessment and assessment of results is fragmented thus
rendering policy making a difficult task to behold. Gachingiri (2015), in her study also stated
that the management of UNEP lacks methods for collective endeavour. Organisation of UNEP
is not well structured and monitored to enable it to function as a global manager of
environmental issues.
Location: Its geographic isolation from other UN operations further inhibits its capability to
effectively coordinate and mediate actions [13]. The location, Nairobi is not a very desirable for
top-notch professionals, the long distance require frequent travel of the leaders thus entails
financial burden and prolonged absence of the leadership. The location, even though having set
up with a pious thought of basing UNEP in an African country has not yielded due results and
has actually backfired as a contributing factor to its limitation.
Thus, UNEP has dearth of autonomy and authority to act as global environment authority owing
to several factors, which are limited and irregular budget; fragile legal status; and the overlap
of its instructions and commands with those of many other international environmental
organisations that have similar responsibilities but are unwilling to defer to UNEP [19,9,3,5,6,2]
Recommendations
In light of the shortcomings observed, a number of recommendations have been forwarded to
overcome this limitations, while some of these contemporary prescriptive reform initiatives are
remedial and seek to make modifications in the existing structures and functions of UNEP, most
of them have recommended for a complete upgradation of the UNEP into UNEO (United
Nations Environmental Organisation) or replacement of UNEP by UNEO. The advocates of
transformation of UNEP into UNEO further vary among themselves as some prepare case for
the creation of a World Environmental Organisation at one go, while others debate for the
conversion of UNEP into UNEO in a phased manner. A look into some of the dominant
literatures that deal with recommendations to heal UNEP would be interesting here.
Modern reform suggestions pertaining to environmental governance can be divided into two
groups: First group takes UNEP as the starting point for system wide reform, for example the
UNEO initiative, and the second group proposes a thorough system overhaul, as the proposed
World Environment Organization, Global Environment Organization and Global
Environmental Mechanism (GEM) [13].
Ivanova (2005), claims that mere upgradation of UNEP into UNEO, is not sufficient. Hence,
she recommends that reforms should be multifarious, varied and stratified, which will focus on
the essential functions of effective global environmental governance and creation of suitable
institutional arrangements. In the same line, she proposes the following reforms:

IJCAES Vol 2, Issue 1, 2020
ISSN 2689-6389 (Print) 23 ISSN 2687-7939 (Online)
Policy options for governments and the International Task Force on Global Public Goods
Establish an extensive assessment plan of global environmental governance which involves
reforming global environmental governance demands a holistic assessment of the present
system’s strengths and weaknesses, challenges, imitations and of UNEP’s effectiveness in
fulfilling its mission as an anchor institution. This evaluation will produce an “analytically
sound” and “politically visionary” set of recommendations on how to strengthen global
environmental governance.Create a global environmental information clearing house i.e. a
central organisation to establish data protocols and as a storehouse to maintain comprehensive
information is necessary.
Create a global environmental capacity clearinghouse. For capacity building, an integrated
point of information for environmental governance must be created, that will plan, execute and
manage technical assistance activities, regulate and coordinate supply and demand of services
and will call attention to best practices on varied projects.
Cluster institutions. In the present scenario, it is imperative that expertise and resources are
pooled together under the lead of certain head institution. This combined effort will produce
better results than fragmented and often competitive efforts of individual organisations [10,21].
Policy options for UNEP
Initiate an independent strategic review of UNEP’s role. An independent strategic review, is
the need of the hour to examine UNEP’s role and performance, history of the organization,
current and future needs and trends and defining plan of action based on its progress, constraints
and opportunities. It would help support transition to more accountable leadership and
improved management practices.
Consolidate financial accounting and reporting. A comprehensive and clear reporting of
finances is crucial to the reformation of UNEP, so as to offer an idea to the donor countries as
well as all stake holders of the use of money provided to it.
Restructure Organisational governance. An inclusive structure, exclusively devoted to the
functions of UNEP and thus less burdened is the need of the organisation. It could be a
governing council or a Global Ministerial Environment Forum, or an executive board of around
20 members to analyse global issues, evaluate global needs, spot gaps, recognise global
priorities and synthesize strategies to address them.
Kihuha (2012), suggests to enhance monitoring and evaluating process, responsible authorities
should consider employing experts or upgrading skills of their technical staff to ensure effective
processes. He also raises point for active role of various stakeholders and management in
monitoring and evaluation of UNEP.
Gachingiri (2015), while studying the impact of leadership on the performance of UNEP
suggested that the management should strive for at using specific ways and methods to guide
the collective working of its staff, they should be more conscious towards the development and
needs of the staff and that the UNEP’s performance is largely affected by “extraneous” factors
so they need to apply different methods and techniques to increase organisational efficiency.

IJCAES Vol 2, Issue 1, 2020
ISSN 2689-6389 (Print) 24 ISSN 2687-7939 (Online)
The above are the reformatory pieces that prescribe initiatives within the UNEP system to make
it more effective, there is another category of literature that strongly argue for an “upgradation”
of the very status of UNEP into UNEO with major structural and functional changes accruing
to the body.
Debate and Case for a World Environmental Organisation:
Biermann (2011), presented a strong debate for a World Environmental Organisation. He
presents his debate by highlighting the pathetic condition of environment today and the
shortcomings of the
present international organisations in dealing with them. He then chronologically traces the
“forty years’ debate” centralised on the need of a World Environmental Organisation. He
prepares three models to support his argument and moves on with numerous arguments to call
for upgradation of UNEP to UNEO [7]. Similar line of argument is presented by Meyer-
Ohlendorf and Knigge (2007) who look into the creation of UNEO as a reformation of UN itself
and sets the debate in a broader political context. They have in length discussed the features of
UNEO, distinguishing it from UNEP and presented case both in favour as well as against
upgrading UNEP into UNEO. The study by Olsen & Elder (2012) presents case for upgrading
UNEP but in a phased manner which according to them will be politically more feasible.
Need for a World Environmental Organisation
Most of the studies in line with demand for World Environmental Organisation put a lot of
emphasis on the alarming situation of environmental degradation and the consequent disaster it
may call for humanity. Human beings influence global biogeochemical forces as powerful
agents of earth system evolution [7]. Biermann (2011) strongly stated that contemporary policy
makers have to deal with one of the largest political problems humankind has ever dealt with:
protection of the entire earth-system including most of its subsystems, building of firm
institutions that could assure a guarded transition, a coevolution and coexistence of natural and
social systems at universal scale. It is looked upon by him as a challenge of earth system
governance, as a new standard to explain this unique challenge of planetary coevolution of
humans and nature. In this scenario, International Organisations become most crucial in
conducting research, synthesizing the data, policy framing, assessments, implementation and
dissemination of information to all the concerned stake holders. UNEP was established as a
basic program of UN, which is devoid of any legal personality or budget and is only a “small
secretariat”
At UNEP’s Governing Council Meeting held in February 2007, regional organisations like
European Union restated the need of an organisation like World Environmental Organisation,
asserting that mere strengthening of UNEP would be insufficient to address future challenges.
It emphasized that an upgrade of UNEP into a UNEO, with strong, ample, regular resources
and with appropriate international position, would qualify the organization to fulfil its mandate

IJCAES Vol 2, Issue 1, 2020
ISSN 2689-6389 (Print) 25 ISSN 2687-7939 (Online)
and meet the expectations of developed and developing countries [15]. The existing
international environmental governance architecture aimed at addressing environmental issues
at the global level is “disjointed, fragmented and lacks authority to effectively combat
environmental degradation” [17].
Thus, a review of the literatures arguing for World Environmental Organisation, together
converge to the fact that the existing International environmental governance is severely lacking
in the discharge of its functions and the catastrophic situation of environment calls for an
immediate remedy of the same. Each of the studies highlight the inadequacies of the functioning
of UNEP on various grounds and thus develop case for an upgradation of it.
Fifty Years Debate on a World Environmental Organisation
Biermann (2011), traces the ongoing debate on World Environmental Organisation and held
that the debate in 2011, the time he prepared his study was 40 (now 50 years) old.
First proposal for such was raised by George F. Kennan in 1970. He insisted for an International
Environmental agency including a small group of advanced modern nations, which resulted in
the establishment of UNEP in 1973, by virtue of a resolution adopted at the 1972 Stockholm
Conference on the Human Environment. UNEP is established not as an international
organisation but a subsidiary body of the United Nations General Assembly reporting through
Economic and Social Council.
The Declaration of the Hague (1989), initiated by the governments of The Netherlands, France
and Norway, revived the demand for a more powerful authoritative institution for international
environmental policy making and effective majority rule.
Again, several countries like Brazil, Singapore, Germany and South Africa, at the 1997 Special
Session of the UN General Assembly on environment and development collectively submitted
a joint proposal demanding an international umbrella organization in charge of environmental
concerns, with United Nations Environment Programme as a major pillar.
The debates broadened and deepened in 1990s, with increasing reports of environmental
failures calling for brain storming on the functions of a world environment organisation. In the
new century, the demand was again stressed by the French government in 2003 to replace
UNEP by a “world environment organisation”. The proposal was reiterated by the 2007 Paris
Call for Action during the Citizens of the Earth Conference for Global Ecological Governance,
and received support by an intergovernmental organisation called Group of Friends of the UN
Environment Organization. Following the Conference Citizens of the Earth, a “Group of
Friends of the UNEO” was created which has – as of February 2007 - gathered over 50
countries. The group will, “take action to strengthen and transform UNEP into a UNEO, in the
context of UN reform.” [15’.
In this debate, the critics are equally sound and loaded with arguments. Calestous Juma, former
head of the secretariat to the Convention on Biological Diversity, argued that those who demand
for a central environmental authority are diverted from immediate environmental problems and

IJCAES Vol 2, Issue 1, 2020
ISSN 2689-6389 (Print) 26 ISSN 2687-7939 (Online)
also do not realise that centralizing institutional structures are an “anachronistic paradigm”, thus
calling our attention to the fact that such an idea of centralised structure is outmoded and hence
does not suits present circumstances and needs. These concerns were supported by Sebastian
Oberthür and Thomas Gehring (2005) based on institutional theory. Konrad von Moltke (2005)
or Adil Najam (2005) have argued against centralised institutional architecture and worked in
favor of decentralized institutional clusters which will adequately deal with diverse range of
environmental issues instead of addressing all problems to one central organization.
Thus, the debate for a World Environmental Organisation is still on with both sides remaining
steadfast with their arguments. The studies do converge on goal that is the need for reformation
of the UNEP [13,7,15,17]. They only differ in the objectives or the path they suggest for the
same while some suggest a centralised institutional authority [7,15] others call for a
decentralised one [21,16] or for movement towards UNEO in a phased manner [17]. Within the
UN system itself the issue is being seriously considered and together with a number of stake
holders like country delegations, scientists, business leaders, non-governmental entities among
others have summarised several proposals for overcoming the shortcomings, amongst them the
most prominent being the establishment of UNEO.
Model for World Environmental Organisation:
Having realised the need for a World Environmental Organisation, the task which the studies
further took was to explore the best possible model for the same. While some explored the
available models and then converged on the need for UNEO with complete arguments [7],
others emphasised on UNEO and focused on understanding its structure and functions that
could provide best responses to the needs of the hour [15], and ones like Olsen & Alder, 2012
reiterated the case of upgradation of UNEP in a phased manner.
Biermann contended that all possible proposals for a world environmental organisation can be
categorised into one of the three different models which differ from each other in the degree of
change they propose.
Least radical proposals advise upgrading UNEP to a specialised UN agency with full-fledged
organisational status like the World Health Organisation or the International Labour
Organisation as suitable models. This new agency would incorporate in itself “norm-building”
and “norm-implementation” processes, differing from UNEP’s ‘catalytic’ mandate that limits
the body’s project implementation authority. The body will have legal and political powers as
a UN special agency and thus could impose certain regulations agreed by majority vote to be
imposed on member countries. These powers exceed over UNEP which is not authorised to use
legal instruments.
To check the substantive and functional overlap between the different international institutions
involved in global environment governance, some observers assert for an elementary reform
and support the creation of a more centralised governance architecture for the integration of
several existing agencies and programs into one all-encompassing world environment
organisation.
IJCAES Vol 2, Issue 1, 2020
ISSN 2689-6389 (Print) 27 ISSN 2687-7939 (Online)
A hierarchical intergovernmental organisation to deal with environmental issues empowered
with majority decision making along with the powers and authority to enforce its commands
vis-à-vis nations those which do not adhere to international agreements on the protection of
global commons. The Hague Declaration of 1989 raised demand in this direction only for an
environmental agency with sanctioning powers.
On observing the different models, Biermann (2011) presented his own case for a World
environmental government. He suggests upgrading UNEP to a specialized UN agency would
follow the policy of functional specialization within the UN system. The establishment of a UN
specialised agency could strengthen global norm-building and institutionalism. An independent
UNEO, by helping to safeguard the special interests and needs of individual programs and
organisations would
contribute in making the Earth system governance much stronger. Governments could equip
the new agency to coordinate and regulate multilateral environmental agreements which would
then form the “global environment law code” under the UNEO. Thus the UNEO assembly,
would be enabled to develop a common reporting system for all multilateral environmental
agreements and a common dispute settlement system on mutually, cooperatively agreed
guidelines and protocols. UNEO could also upgrade the overall execution of earth system
governance for example by a common global reporting system on the condition of the
environment and on the status of implementation in different countries. UNEO could help
smaller developing countries in making their participation in earth system governance strong
and more effective, it would also help them build specialised “embassies” at the seat of the new
agency. Decision-making procedures based on North-South parity— veto rights for both North
& South as a group—could ensure that the UNEO would not evolve into a new form of eco-
colonialism.
Possibility of a “world organisation on sustainable development”, building on a merger of
UNEP and UNDP is likely to harm environmental issues in the long run on account of the
unequal size, resources and functions of both, he fears that the issue of “environment” would
be weakened in comparison to “development”. Therefore, we need a UNEO, with an aim to
preserve environmental resources within the development process. It would thus have to
encompass more than purely environmental rules, but address the development concerns of
South as well.
Nils Meyer-Ohlendorf and Markus Knigge (2007) have provided a detailed analysis of the
structure & function of UNEO.
Core features of UNEO
The study offers an understanding of the core features of the proposed UNEO that has emerged
in discussion in recent years.
IJCAES Vol 2, Issue 1, 2020
ISSN 2689-6389 (Print) 28 ISSN 2687-7939 (Online)
Legal Basis: UNEO is to be established as a Specialized Agency of the UN, according and in
line with Article 57 of the UN Charter that would place it under the command of ECOSOC with
a definite degree of autonomy.
Institutional Architecture: The institutional architecture of the UNEO is to include Plenary,
Executive organ and a Secretariat, with a defined decision making process.
Mandate and Functions: The UNEO would be an umbrella organization and would thus, as a
decentralized institution, respect the independence of MEAs. It would help to collectively pool
the scientific knowledge on environmental issues and take lead in defining global
environmental strategic guidelines to promote cooperation, coordination and synergies between
countries.Funding: UNEO budget would be based on assessed contributions, whereby every
member state would have a legal contribution to pay an agreed contribution thus ensuring the
financial resources and autonomy of the institution.The major advancements which the agency
would have over the programmed is arguably its legal personality based on an international
treaty thus with a more authoritative mandate, structural advancements with a plenary body
comprising full membership of all member states providing a full voting right for all and a
promised budget to provide it with financial autonomy.
Case for UNEO
The study vividly explains the cause of UNEO and the benefits such a body is likely to bring
to the human race:UNEO with its improved agenda setting and coordination capacities would
integrate environmental policies with other policy areas like poverty eradication and economic
development. With its legal authority, the UNEO would be able to generate participation of all
stakeholders in international environmental discussions and ensure reporting by all.
It will have more developed scientific base and multidisciplinary response structure
It will allow more scope for developing countries to have a say in these issues.
Financially sound UNEO will have better focus on tasks at hand and thus ensure better
coordination of tasks.
On similar lines of demand for upgradation of UNEP is the study of Olsen & Elder (2012), the
point of departure they have is the case they present for a phased approach for the same which
according to them is more politically feasible and easier to implement in the short term.
Case for a phased approach
In the first phase, UNEP’s Governing Council would be provided with universal membership,
and to be upgraded into a specialised agency in the second. In their proposal they have
connected both steps and recommend that they should be undertaken in succession. The first
phase is expected to create necessary space and momentum for the subsequent one, as by
increasing the representation of the GC the member states would be sufficiently convinced of
the merits of granting independent decision making authority to GC. Thus, implementing both
phases would create more authority around IEG, and would create a body that could cluster
multilateral environmental agreements (MEAs) and improve the fragmentation, which is now
a defining feature of environmental governance.
IJCAES Vol 2, Issue 1, 2020
ISSN 2689-6389 (Print) 29 ISSN 2687-7939 (Online)
Plan for phased upgradation:
Phase 1—Universal Membership: The first reform phase will equip the UNEP Governing
Council with universal membership, which would increase the legitimacy and credibility of
environmental decision- making. This increase might result in more cumbersome decision-
making, which could be remedied by adoption of a qualified majority voting system. Another
purpose of universal membership is to cluster thematically-related MEAs within its universally
representative forum.
Phase 2--- Specialised Agency: In the second phase, UNEP is to be transformed into a
specialised agency. This could be introduced by a General Assembly resolution, which could
create a UN Environment Organisation (UNEO) furthered by a treaty which would establish a
fully-fledged World Environment Organisation (WEO). UNEP (then UNEO), with a
specialised agency status would be legally autonomous which will enable it to approve its own
decrees and measures, without depending for approval by any another higher level body such
as ECOSOC or the GA.
Conclusion
The paper intended to explore existing literature to study the performance of UNEP, the existing
international organisation to manage environmental issues, an analysis necessitated by alarming
rise of environmental catastrophes in recent times. An observation of a few of these, clearly
establish the fact that UNEP has not been able to perform effectively owing to a number of
shortcomings it is infested with which ranges from its mere status as a program, lack of
mandate, funding, distant location etc. The studies have vividly examined the nature of this
shortcomings and the causes behind them. They further tried to explore the way out of it and
have recommended several proposals for its reform which differ from each other in many
respects, some have exclusively raised the demand for a complete upgradation of UNEP into
UNEO, others have suggested radical reforms within the existing UNEP system.
However, barring a few like the study of Bauer (2009), most of the studies have not paid due
attention to the issues of the structure of UNEP exclusively as a limiting factor in its
effectiveness and have only considered it as one of the components which need reform among
many other shortcomings of UNEP. Most of the studies are focused on the functional aspect of
UNEP—its functional effectiveness and limitation. Such, neglect of structural dimension of
UNEP and exclusive focus on its functions has cost expensive literary deductions that could
have contributed a universe of literature that would exclusively be devoted to the structural
study of UNEP—its structural effectiveness, shortcomings and ways out of such shortcomings.
Thus, more dedicated analysis of the structure of UNEP is the need of the hour which can
sufficiently offer insight into its efficacies, limitations and thus generate conclusions as to best
ways to improve them within the UNEP system itself or in the proposed UNEO. The
recommendations based on the observations may include these strategies.
UNEP needs profound and immediate overhauling of its certain core areas for example in its
official status as a mere program, scarce resources, location, structure to name a few. Such core
areas are to be immediately catered to without any further political delay. Reform of such core

IJCAES Vol 2, Issue 1, 2020
ISSN 2689-6389 (Print) 30 ISSN 2687-7939 (Online)
areas can most positively be achieved with a GA resolution that could make provisions for
increased mandate of UNEP, provision for organising its financial base and reforming its
structure to provide more authority and autonomy to the Secretariat. For issue concerning its
official status, location, membership of the governing council among others, I reinforce the
need of a World Environmental Organisation which should be seriously considered and
discussed by all the stakeholders and concrete efforts should be made for its realisation in the
long run. The move towards World Environmental Organisation or UNEO, may cost time as it
involves affirmation of multiple stake holders and includes political complexities, however a
resolution directed towards strengthening core areas of UNEP itself need not face such issues
and hence can be achieved at the earliest. The reform at this stage is within the UNEP system
itself and hence is less problematic to achieve.
Subsequently, based on the experience gathered from the activities of the reformed UNEP, we
would be better positioned to address the needs of the proposed World Environment
Organisation and thus make arrangements accordingly to meet challenges of the time.
References
[1] Andresen, Steinar. 2001. “Global Environmental Governance: UN Fragmentation and Co-Ordination.” In O.S.
Stokke and O.B. Thommessen, eds., Yearbook of International Co-Operation on Environment and
Development. London: Earthscan
[2] Andresen, S., & Rosendal, K. (2009). The role of the United Nations Environment Programme in the
coordination of multilateral environmental agreements. International organizations in global environmental
governance, 17, 133.
[3] Bauer, S. (2007). The catalyst conscience: UNEP’s secretariat and the quest for effective international
Environmental Governance. Global governance working paper, No 27. Amsterdam et al.: The Global
Governance Project. Retrieved January 18, 2009, from www.glogov.org
[4] Bauer, S. (2009). The secretariat of the United Nations Environment Programme: Tangled up in
blue. Managers of global change: The influence of international environmental bureaucracies, 169-201.
[5] Biermann, F. (2001). The emerging debate on the need for a World Environment Organization: A commentary.
Global Environmental Politics, 1(1), 45–55.
[6] Biermann, F., & Pattberg, P. (2008). Global Environmental Governance: Taking stock, moving forward.
Annual Review of Environment and Resources, 33, 277–294.
[7] Biermann, Frank. 2011. Reforming Global Environmental Governance: The Case for a United Nations
Environment Organisation. Stakeholder Forum.
<http://www.ieg.earthsystemgovernance.org/sites/default/files/files/publications/Biermann_Reforming%20G
EG%20The%20case%20for%20a%20UNEO.pdf > (Accessed on August 22 2011).
[8] Biermann, F. (2016). Reforming global environmental governance: The case for a United Nations Environment
Organisation (UNEO) (2012). The Globalization and Environment Reader, 323.
[9] Desai, Bharat. 2004. Institutionalizing International Environmental Law. Ardsley, N.Y.: Transational.
[10] El-Ashry, Mohamed. 2004. “Mainstreaming the Environment—Coherence among International Governance
Systems.” Paper presented at the International Environmental Governance Conference, 15–16 March, Paris.
[11] Gachingiri, A. (2015). Effect of leadership style on organisational performance: A case study of the United
Nations Environment Programme (UNEP), Kenya. International Academic Journal of Innovation, Leadership
and Entrepreneurship, 1(5), 19-26.https://www.unenvironment.org
[12] Haas, Peter M. 2004. “Addressing the Global Governance Deficit.” Global Environmental Politics 4 (4):1–15.

IJCAES Vol 2, Issue 1, 2020
ISSN 2689-6389 (Print) 31 ISSN 2687-7939 (Online)
[13] Ivanova, M. (2005). Can the anchor hold? Rethinking the United Nations Environment Programme for the 21st
century.
[14] KIHUHA, P. (2018). Monitoring and Evaluation Practices and Performance of Global Environment Facility
Projects in Kenya, a Case of United Nations Environment Programme (Doctoral dissertation, Doctoral
Dissertation, Kenyatta University).
[15] Meyer-Ohlendorf, N., & Knigge, M. (2007). A United Nations Environment Organization. Global
environmental governance: Perspectives on the current debate, 133.
[16] Najam, Adil. 2001. “Vision 2020: Towards Better Global Governance.” In 2020 Global Architecture Visions
Conference. Victoria, B.C.: Centre for Global Studies.2003. “The Case against a New International
Environmental Organization.” Global Governance 9 (3): 367.
[17] Olsen, S. H., & Elder, M. (2012). Upgrading the United Nations Environment Programme: A Phased
Approach. Institute for Global Environmental Strategies.
[18] Speth, James Gustave. 2002. “The Global Environmental Agenda: Origins and Prospects.” In D.C. Esty and
M. Ivanova, eds., Global Environmental Governance: Options & Opportunities.
[19] Tarasofsky, Richard G., and Alison L. Hoare. 2004. Implications of a UNEO for the Global Architecture of
the International Environmental Governance System. Paris: Institute for Sustainable Development and
International Relations.UNEP (United Nations Environment Programme) Governing Council. 1997a.
Governing Council Decision 19/32: Governance of the United Nations Environment Programme. Nairobi.
Available at www.unep.org/Documents.Multilingual/Default.
[20] asp?DocumentID=96&ArticleID=1456&l=en.2005f. “Synthesis of Responses on Strengthening the Scientific
Base of the United Nations Environment Programme.” UNEP/SI/IGC/2. Nairobi.
[21] Von Moltke, Konrad. 1996. “Why UNEP Matters.” In Yearbook of International Co-operation on Environment
and Development, Green Globe Yearbook 1996. Oxford, UK: Oxford University Press.2001a. On Clustering
International Environmental Agreements. Winnipeg: International Institute for Sustainable
Development.2001c. Whither MEAs? The Role of International Environmental Management in the Trade and
Environment Agenda. Winnipeg: International Institute for Sustainable Development

International Journal of Chemical and Environmental Sciences Vol 2 Issue 1, 2020 ISSN 2689-6389 (Print) ISSN 2687-7939 (Online)
Corresponding author
Email address: [email protected]
32
Assessments of Bioaccumulation Factor (BAF) for heavy metals (Pb and Hg)
in an aquatic insect Laccotrephesruber: A major faunal component for three
contrasting freshwater aquatic ecosystems of West Bengal and Odisha
Received for publication, October 30, 2020, and accepted November 15, 2020
Anindita Das1*, Santanu Ghara1 and Susanta Kumar Chakraborty1
Department of Zoology, Vidyasagar University, Midnapore, West Bengal, India
Abstract
Although insects harbor almost all the terrestrial habitats but occur with negligible abundance in the aquatic
environment mainly because of their tracheal mode of respiration. The present paper has attempted to find out the
Bioaccumulation Factor (BAF) of a major aquatic insect species, Laccotrephesruber which inhabits in higher
densities in three distantly located freshwater bodies having contrasting ecological factors overcoming even
different environmental odds, especially the loads of two toxic heavy metals such as lead (Pb) and mercury
(Hg).Collection and preservation of the aquatic insects alongwith estimation of different water quality parameters
were made following standard methodologies (APHA, 2005). The heavy metals of the water, soil, selected aquatic
plants and insect species were determined by Atomic Absorption Spectroscopy (AAS) from three selected study
sites of [(1) a water impoundment – Rissia Dam in Odisha, (2) a large water body at Tamluk, West Bengal, and
(3) a large pond at Haldia, West Bengal].In this study, above three study sites were selected in order to determine
the concentrations and variation of two heavy metals (Pb and Hg) and their trend of accumulation in water, soil,
aquatic plants and one aquatic insect species. After undertaking a yearlong (March’2019 – February’2020) field
survey, Bioaccumulation Factors (BAF) of those heavy metals in an aquatic insect species, Laccotrephesruberand
were deducted along with the recording ofdifferent pronounced ecological parameters (water quality – pH,
temperature, conductivity and Total Dissolved Solids). It was seen that, lead (Pb) was found to be higher than
mercury (Hg) in all the structural components (water, soil, vegetation and insect) of the three aquatic ecosystems
including within the body ofLaccotrephesruber ofall (slight exception for soil of Rissia Dam). Besides, the
concentrations of both the heavy metals were highest in the study site 3 (within industrial belt) followed by study
site 2 (under the human activities) and study site 1 (in the natural undisturbed environment).From the BAFanalysis
of Laccotrephesruber, it is seen that – (i) Hg is very bioaccumulative than Pb in Rissia Dam; (ii) Pb is moderately
bioaccumulative than Hg in Tamluk; and (iii) Pb is very much bioaccumulative thanHg in Haldia.
Keywords: Aquatic insects, Hemiptera, Coleoptera, heavy metals, Bioaccumulation Factor
(BAF).
1. Introduction
Aquatic insects as bioindicatorsare amongst the most frequently used groups in the biological
assessment of water quality worldwide [1]. They offer a spectrum of responses to different
degrees of environmental stress and change over time [2].Some studies have reported that
aquatic insects are very effective at detecting anthropogenic disturbance and habitat quality,
which is mainly due to their sensitivity to various factors responsible for water quality changes
[3].Aquatic insects show sensitivity towards various factors that are responsible for changes to
water quality, and the entire biomonitoring activities have appeared to very much cost-effective
than physicochemical analysis [3][4]. In India, a limited number of studies have been carried
out on the ecological aspects of aquatic entomofauna [5][6]. Being non-biodegradable, heavy
metals undergo a global ecological cycle [7]. The heavy metal lead (Pb) has been established
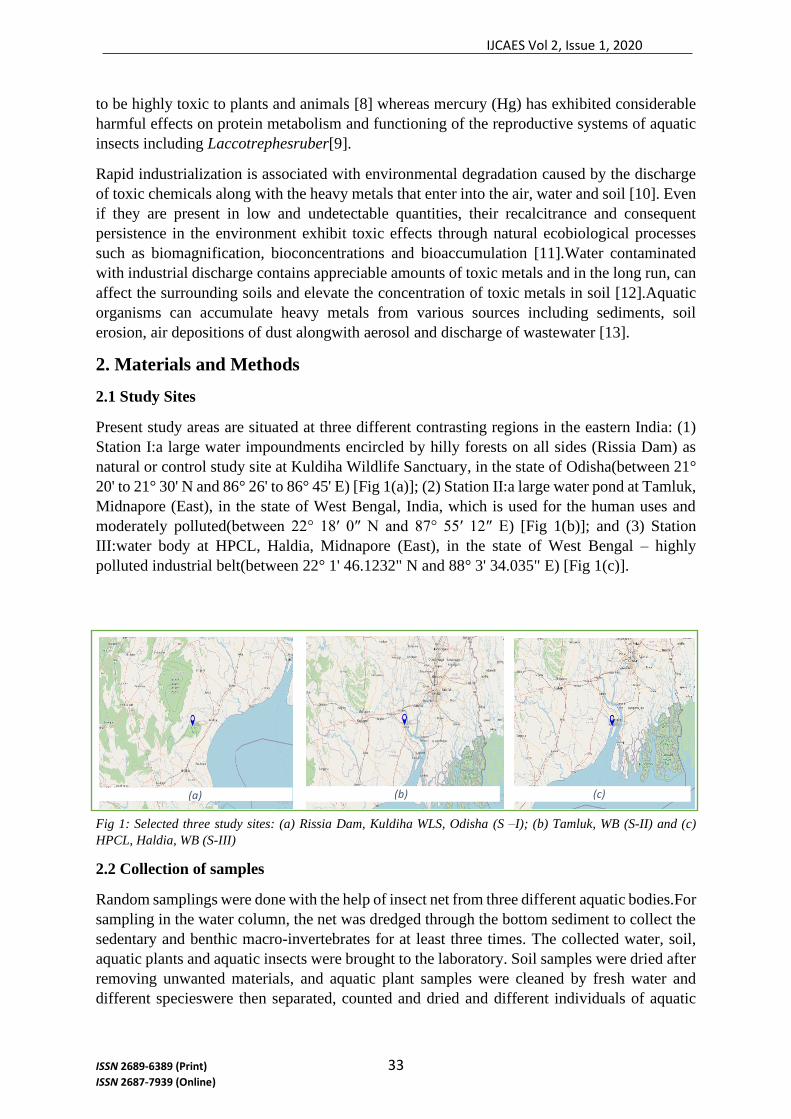
IJCAES Vol 2, Issue 1, 2020
ISSN 2689-6389 (Print) 33 ISSN 2687-7939 (Online)
to be highly toxic to plants and animals [8] whereas mercury (Hg) has exhibited considerable
harmful effects on protein metabolism and functioning of the reproductive systems of aquatic
insects including Laccotrephesruber[9].
Rapid industrialization is associated with environmental degradation caused by the discharge
of toxic chemicals along with the heavy metals that enter into the air, water and soil [10]. Even
if they are present in low and undetectable quantities, their recalcitrance and consequent
persistence in the environment exhibit toxic effects through natural ecobiological processes
such as biomagnification, bioconcentrations and bioaccumulation [11].Water contaminated
with industrial discharge contains appreciable amounts of toxic metals and in the long run, can
affect the surrounding soils and elevate the concentration of toxic metals in soil [12].Aquatic
organisms can accumulate heavy metals from various sources including sediments, soil
erosion, air depositions of dust alongwith aerosol and discharge of wastewater [13].
2. Materials and Methods
2.1 Study Sites
Present study areas are situated at three different contrasting regions in the eastern India: (1)
Station I:a large water impoundments encircled by hilly forests on all sides (Rissia Dam) as
natural or control study site at Kuldiha Wildlife Sanctuary, in the state of Odisha(between 21°
20' to 21° 30' N and 86° 26' to 86° 45' E) [Fig 1(a)]; (2) Station II:a large water pond at Tamluk,
Midnapore (East), in the state of West Bengal, India, which is used for the human uses and
moderately polluted(between 22° 18′ 0″ N and 87° 55′ 12″ E) [Fig 1(b)]; and (3) Station
III:water body at HPCL, Haldia, Midnapore (East), in the state of West Bengal – highly
polluted industrial belt(between 22° 1' 46.1232" N and 88° 3' 34.035" E) [Fig 1(c)].
Fig 1: Selected three study sites: (a) Rissia Dam, Kuldiha WLS, Odisha (S –I); (b) Tamluk, WB (S-II) and (c)
HPCL, Haldia, WB (S-III)
2.2 Collection of samples
Random samplings were done with the help of insect net from three different aquatic bodies.For
sampling in the water column, the net was dredged through the bottom sediment to collect the
sedentary and benthic macro-invertebrates for at least three times. The collected water, soil,
aquatic plants and aquatic insects were brought to the laboratory. Soil samples were dried after
removing unwanted materials, and aquatic plant samples were cleaned by fresh water and
different specieswere then separated, counted and dried and different individuals of aquatic
(a) (b) (c)

IJCAES Vol 2, Issue 1, 2020
ISSN 2689-6389 (Print) 34 ISSN 2687-7939 (Online)
insect Laccotrephesruberwere kept into specimen tubes containing 70% alcohol for the
quantification of density and also for the subsequent analysis for heavy metal.
2.3 Analysis of physicochemical parameters
Physical parameters of water samples (temperature, pH, conductivity and Total Dissolved
Solids - TDSof water) were recorded by PCSTestr 35 Multi-Parameter (Eutech PCSTEST35-
01X441506 / Oakton 35425-10).
In order to analyse heavy metals from selected samples, Atomic Absorption Spectroscopy
(AAS) was used in laboratory.
1) For water samples, test methods followed are: Lead (Pb): IS: 3025 (Part-47): 1994
Reaffirmed 2009;Mercury (Hg): IS: 3025 (Part-48): 1994 Reaffirmed 2009.
2) For soil samples, test methods followed are: Lead: APHA 23rd Edition 3111B; Mercury:
APHA 23rd Edition 3112B.
3) For the aquatic plant and aquatic insect samples, those were digested using microwave
assisted acid digestion according to USEPA 3051a [14].
2.4 Deduction of Bioaccumulation Factor (BAF)
Bioaccumulation is the net result of thechemical uptake process into an organism at the
respiratory surface and from the diet and chemical elimination from the organism, including
respiratory exchange, fecal egestion, and metabolic biotransformation of the parent compound
and growth dilution. The competing uptake and elimination resulting in bioaccumulation can
be represented mathematically by
dCB / dt = (k1CWD + kDCD) – (k2 + kE+ kM +kG)CB
where CB is the chemical concentration in the organism (g.kg-1), t is a unique time (d-1), k1 is
the chemical uptake rate constant from the water at the respiratory surface (L.kg-1.d-1), CWD is
the freely dissolved chemical concentration in the water (g.L-1), kD is the uptake rate constant
for chemical in the diet (kg.kg-1.d-1), CD is the chemical concentration in the diet (g.kg-1), and
k2, kE, kMand kG are rate constants (d-1) representing chemical elimination from the organism
via the respiratory surface, fecal egestion, metabolic biotransformation and growth dilution,
respectively.The factor to which this process occurs, can be expressed as bioaccumulation
factor (BAF), and at steady state (dCB / dt = 0), the BAF can be calculated as
BAF = CB / CWD
The BAF is mainly measured under field conditions including the total chemical concentration
in the water phase, i.e., BAF = CB /CWT, which is the ratio of the chemical concentration in an
organism or biota to the concentration in water:
BAF = 𝐶𝑜𝑛𝑐𝑒𝑛𝑡𝑟𝑎𝑡𝑖𝑜𝑛 𝑖𝑛 𝑜𝑟𝑔𝑎𝑛𝑖𝑠𝑚 (𝑡ℎ𝑟𝑜𝑢𝑔ℎ 𝑑𝑖𝑒𝑡 & 𝑡𝑜𝑡𝑎𝑙 𝑠𝑢𝑟𝑓𝑎𝑐𝑒𝑠)
𝐶𝑜𝑛𝑐𝑒𝑛𝑡𝑟𝑎𝑡𝑖𝑜𝑛 𝑖𝑛 𝑤𝑎𝑡𝑒𝑟
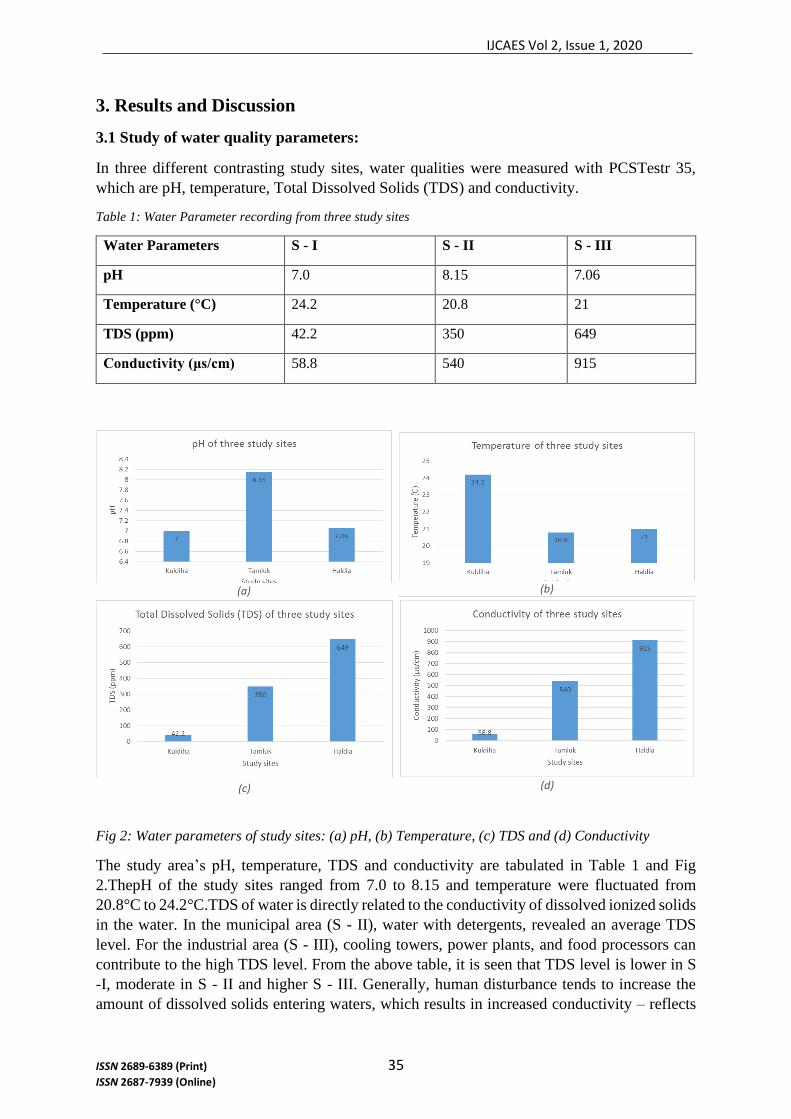
IJCAES Vol 2, Issue 1, 2020
ISSN 2689-6389 (Print) 35 ISSN 2687-7939 (Online)
3. Results and Discussion
3.1 Study of water quality parameters:
In three different contrasting study sites, water qualities were measured with PCSTestr 35,
which are pH, temperature, Total Dissolved Solids (TDS) and conductivity.
Table 1: Water Parameter recording from three study sites
Water Parameters S - I S - II S - III
pH 7.0 8.15 7.06
Temperature (°C) 24.2 20.8 21
TDS (ppm) 42.2 350 649
Conductivity (μs/cm) 58.8 540 915
Fig 2: Water parameters of study sites: (a) pH, (b) Temperature, (c) TDS and (d) Conductivity
The study area’s pH, temperature, TDS and conductivity are tabulated in Table 1 and Fig
2.ThepH of the study sites ranged from 7.0 to 8.15 and temperature were fluctuated from
20.8°C to 24.2°C.TDS of water is directly related to the conductivity of dissolved ionized solids
in the water. In the municipal area (S - II), water with detergents, revealed an average TDS
level. For the industrial area (S - III), cooling towers, power plants, and food processors can
contribute to the high TDS level. From the above table, it is seen that TDS level is lower in S
-I, moderate in S - II and higher S - III. Generally, human disturbance tends to increase the
amount of dissolved solids entering waters, which results in increased conductivity – reflects
(a) (b)
(c) (d)

IJCAES Vol 2, Issue 1, 2020
ISSN 2689-6389 (Print) 36 ISSN 2687-7939 (Online)
in the Table 1 and Fig 2 (higher conductivity at industrial site, moderate at municipal site and
lower in natural site).
3.2 Ecology of selected aquatic insect Laccotrephesruber
Laccotrephesruber commonly known as water scorpion belongs to family Nepidae of suborder
Heteroptera of order Hemiptera is carnivorous, found almost all types of freshwater systems
and is dominant and pollutant tolerant species. Though most of the time they live in water but
sometimes emerge out of water on the ground or under stones in damp beds of recently dried
streams. All legs help in swimming but they are not good swimmers. Fore legs are moved up
and down and middle is used for kicking motion, each pair operates simultaneously as a unit.
When crawling on objects under water, normal alterations of legs occur. Abdominal
appendages thrust up to the surface as the insect crawls or move slowly. They feed on various
types of small aquatic animals after capturing them with front raptorial legs. Water scorpions
inflict painful bite when handled. Though they have well developed wings but they seldom fly.
The body is broad, rather flattened and abdomen above is yellowish red in color; respiratory
siphon at least 2/3 as long as body length, but usually as long as or somewhat longer than body;
adults are generally 11 – 45 mm in total length; antennae 3-segmented, segment 2 with a
fingerlike projection; lateral margins of pronotum slightly concave but not constricted at
transverse groove; prosternum without sulci posterior of fore coxae; hemelytra smooth,
membrane thin with distinct venation.
3.3 Heavy metal concentration study
Heavy metal (Pb and Hg) concentrations in water, soil, aquatic plants (1. Marsilea sp., 2.
Nymphaea sp., 3. Rotalasp, 4. Lemna sp., 5. Pistia sp. and 6. Commelina sp.), and aquatic insect
(Hemiptera: Heteroptera:Laccotrephesruber) were measured by AAS[1, 2, 3 were estimated
for Kuldiha (S-I); 4, 5, 6 for Tamluk (S-II) and 2, 4, 5 for Haldia (S-III)- as werefound at the
time of sampling] and are depicted in Fig 3 (S-I), Fig 4 (S-II) and Fig 5(S-III).
Fig 3: Heavy metal concentrations in water, soil, aquatic plants and Laccothrephesruber in S-I
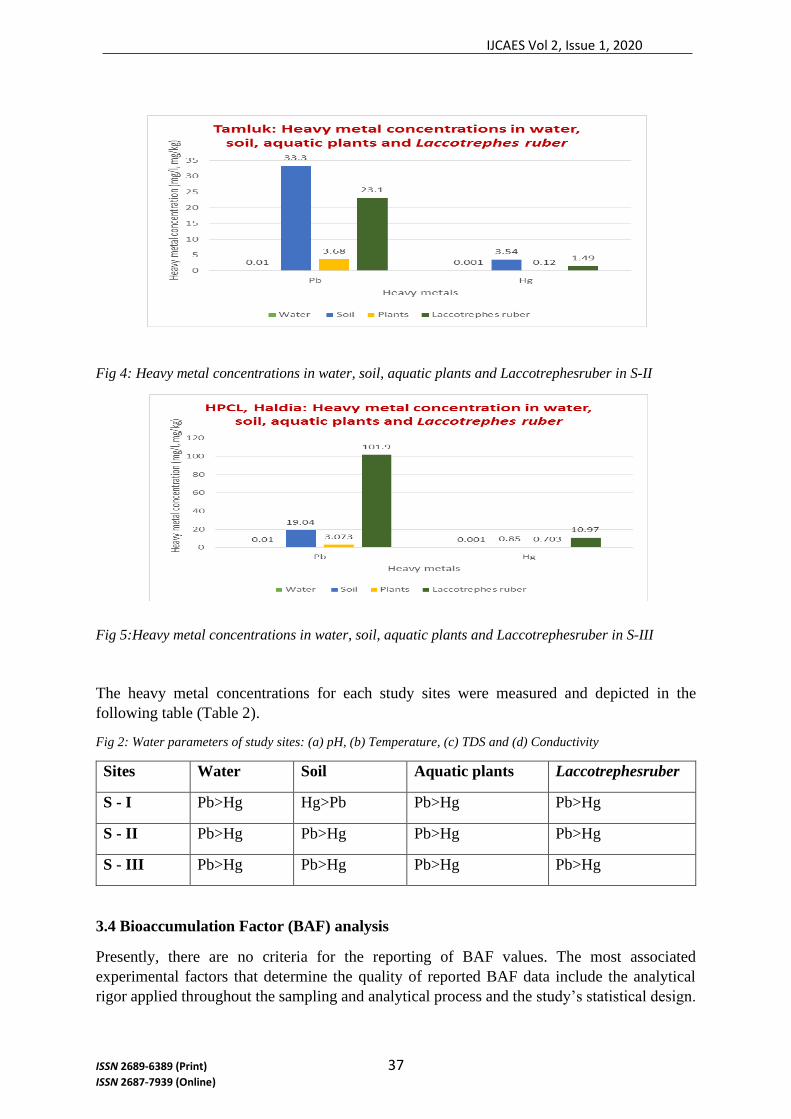
IJCAES Vol 2, Issue 1, 2020
ISSN 2689-6389 (Print) 37 ISSN 2687-7939 (Online)
Fig 4: Heavy metal concentrations in water, soil, aquatic plants and Laccotrephesruber in S-II
Fig 5:Heavy metal concentrations in water, soil, aquatic plants and Laccotrephesruber in S-III
The heavy metal concentrations for each study sites were measured and depicted in the
following table (Table 2).
Fig 2: Water parameters of study sites: (a) pH, (b) Temperature, (c) TDS and (d) Conductivity
Sites Water Soil Aquatic plants Laccotrephesruber
S - I Pb>Hg Hg>Pb Pb>Hg Pb>Hg
S - II Pb>Hg Pb>Hg Pb>Hg Pb>Hg
S - III Pb>Hg Pb>Hg Pb>Hg Pb>Hg
3.4 Bioaccumulation Factor (BAF) analysis
Presently, there are no criteria for the reporting of BAF values. The most associated
experimental factors that determine the quality of reported BAF data include the analytical
rigor applied throughout the sampling and analytical process and the study’s statistical design.

IJCAES Vol 2, Issue 1, 2020
ISSN 2689-6389 (Print) 38 ISSN 2687-7939 (Online)
There is enough information in the literature on environmental analysis criteria, including the
usage of ‘blanks’ and reference materials, quality assurance and quality control (QA / QC)
protocols, and criteria for good laboratory practice [15].
The gender, reproductive status, life-stage or age, size, lipid contents etc. of an organism can
influence the BAF [16][17]. Organisms with higher lipid contents have a greater capacity to
store hydrophobic organic chemicals and therefore, can exhibit a higher BAF. The trophic
position is a crucial factor influencing the BAF observed for legacy pollutants [18]. For
biochemical that magnify in the food web, the highest BAFs are observed in the highest trophic
level species. Food web magnification factor studied in aquatic systems show that for
chemicals that are not metabolized, the average increase in lipid normalized concentrations
ranges between a factor of 2 and 6.5 for each trophic position [19].
It isn’t easy to compare BAFs from one food web to another because each ecosystem has unique
characteristics, i.e., water column depth, dietary preference, primary production and organic
matter, trophic structure, temperature and varying degrees of benthic interaction with the
sediment [20][21]. Illustration and discussion of factors affecting the bioaccumulation and
trophic transfer of persistent organic chemicals in arctic marine and freshwater food webs with
an empirical data analysis was reported [22].
From the analysis of Bioaccumulation FactorofLaccotrephesruber, it is seen that– (i) in S-I,
Hg is very bioaccumulative(77%) and Pb isless bioaccumulative (23%) [Fig 6(a)]; (ii) in S-
II,Pb is moderatelybioaccumulative (61%)than Hg (39%) [Fig 6(b)]; and (iii) in S-III,Pb is very
much bioaccumulative (90%) and Hg islessbioaccumulative (10%) [Fig 6(c)].
Fig 6:Bioaccumulation Factor in (a) S-I (b) S-II (c) S-III
.
Fig 7: BAF values of Pb and Hg in Laccotrephesruber in three study sites
Figure 5a Figure 5b Figure 5c
(a) (b) (c)

IJCAES Vol 2, Issue 1, 2020
ISSN 2689-6389 (Print) 39 ISSN 2687-7939 (Online)
Also it is concluded that – (i) BAF value of Pb is nearly same in S-I and S-II and much higher
in S-III; and (ii) BAF value of Hg is nearly same in the S-II and S-III and much higher in S-I
in the specified species Laccotrephesruber(Fig 7).
Acknowledgements
Authors are thankful to the Forest Division Range, Kuldiha Wildlife Sanctuary, Odisha, India
for providing the necessary facilities to carry out the field survey. The library and laboratory
facilities provided by the Department of Zoology, Vidyasagar University, Midnapore, West
Bengal, India for allowing to use the laboratory facilities are thankfully acknowledged.
References
[1] Chon T S, Qu X, Cho W S, Hwang H J, Tang H, Liu Y and Choi J H, Evaluation of stream ecosystem
health and species association based on multi-taxa (benthic macroinvertebrates, algae, and
microorganism patterning with different levels of pollution. Unravel Complex. Support Sustain. 17: 58-
72 (2013).
[2] Hawkes, H.A. Origin and development of the biological monitoring working party score system. Water
Resource, 32: 964–968 (1997).
[3] Pontash K and Cairns J, Multispecies toxicity tests using indigenous organisms predicting the effect of
complex effluents in streams. Archives of Environmental Contamination and Toxicology, 20:103- 112
(1991).
[4] Pardo I, Gómez-Rodríguez C, Abraín R, García-Roselló E and Reynoldson T B, An invertebrate
predictive model (NORTI) for streams and rivers: sensitivity of the model detecting stress gradients.
Ecological Indices, 45: 51–62 (2014).
[5] Sivaramakrishnan and Venkataraman, Observations on feeding properties, growth rate and fecundity
in mayflies. Proceedings of Indian Academic Science. Animal Science. 96: 305-309 (1987).
[6] Thirumalai G, Aquatic and Semi aquatic Heteroptera of India. Indian Association of Aquatic
Biologists (IAAB), 7: 1 ‒ 74 (1999).
[7] Ahmad A, Maimon A, Othman M S and MohdPauzi A, The Potential of Local Benthic
Macroinvertebrates as a Biological Monitoring Tool for River Water Quality Assessment. Proceedings
of the Regional Symposium on Environment and Natural Resources, 1: 464-471 (2002).
[8] Mohammadnabizadeh S, Pourkhabbaz A, Afshari R and Nowrouzi M, Concentrations of Cd, Ni, Pb,
and Cr in the two edible fish species Liza klunzingeriandSillagosihamacollected from Hara biosphere
in Iran. Toxicological and Environmental Chemistry, 94 (6): 1144-1151 (2012).
[9] Kumar R T, Impact of mercury on protein metabolism in Laccotrephesruber. Biochem. Cell. Arch.,
7(1): 73-77 (2007).
[10] Harguinteguy C A, Cirelli A F and Pignata M L, Heavy metal accumulation in leaves of aquatic plant
Stuckeniafiliformis and its relationship with sediment and water in the Suquia River (Argentina).
Microchemical Journal, 114: 111-118 (2014).
[11] Atkinson B W, Bux F and Kasan HC, Considerations for application of biosorption technology to
remediate metal-contaminated industrial effluents. Water SA 24(2):129–135 (1998).
[12] Ghosh A K, Bhatt. M A and Agrawal H P, Effect of long-term application of treated sewage water on
heavy metal accumulation in vegetables grown in Northern India. Environmental Monitoring and
Assessment, 184: 1025–1036 (2012).
[13] Goodwin T H, Young A R, Holmes M G R, Hewitt N, Packman J C and Smith B P G, The temporal
and spatial variability of sediment transport and yields within the Bradford Beck catchment, West
Yorkshire. Science of the Total Environment, 314-316: 475-494 (2003).
[14] USEPA, Method 3051: Microwave assisted acid digestion of sediments, sludges, soils, and oils. In:
Clean Water Act Analytical Methods, revision 1, February 2007.
[15] OECD, OECD Principles on good laboratory practice. Series on principles of good laboratory practice
and compliance monitoring No. 1. Organization for Economic Co-operation and Development, Paris,
France. pp. 41 (1998).
[16] Nichols J W, Jensen K M, Tietge J E and Johnson R D, Physiologically based toxicokinetic model for
maternal transfer of 2, 3, 7, 8-tetrachloro-p-dioxin in brook trout (Salvelinusfontinalis). Environ.
Toxicol. Chem., 17: 2422-2434 (1998).
[17] Russell R C, Constructed wetlands and mosquitoes: Health hazards and management options- An
Australian perspective. Ecological Engineering, 12: 107 – 124 (1999).

IJCAES Vol 2, Issue 1, 2020
ISSN 2689-6389 (Print) 40 ISSN 2687-7939 (Online)
[18] Connolly J P and Pedersen C G, A thermodynamic-based evaluation of organic chemical accumulation
in aquatic organisms. Environ. Sci. Technol., 22: 99-103 (1988).
[19] Mackintosh C E, Maldonado J, Hongwu J, Hoover N, Chong A, Ikonomou M and Gobas F A P C,
Distribution of phthalate esters in a marine aquatic food web: comparison to polychlorinated biphenyls.
Environ. Sci. Technol., 38: 2011-2020 (2004).
[20] Burkhard L P, Factors influencing the design of bioaccumulation factor and biota-sediment accumulation
factor field studies. Environ. Toxicol. Chem, 22: 351-360 (2003).
[21] Arnot J A and Gobas F A P C, A generic QSAR for assessing the bioaccumulation potential of organic
chemicals in aquatic food webs. QSAR Comb. Sci., 22: 337-345 (2003).
[22] Borga K, Fisk A T, Hoekstra P F and Muir D C G, Biological and chemical factors of importance in
the bioaccumulation and trophic transfer of persistent organochlorine contaminants in arctic marine
food webs. Environ. Toxicol. Chem., 23: 2367-2378 (2004).
International Journal of Chemical and Environmental Sciences Vol 2 Issue 1, 2020 ISSN 2689-6389 (Print) ISSN 2687-7939 (Online)
Corresponding author
Email address: Email: [email protected]
41
Temporal stratification of weeds under System of Rice Intensification and
conventional rice cultivation
Received for publication, October 31, 2020, and accepted, November 12, 2020
Rituparna Banerjee; Sunanda Batabyal; Suparna Guha; Ayan Mondal; Sohini Gangopadhyay;
Nilanjan Das; Phanibhusan Ghosh; Sudipto Mandal*
Ecology and Environmental Modelling Laboratory, Department of Environmental Science, The
University of Burdwan, Burdwan, 713104, India
Abstract
A synecological studyon weeds was conducted to observe their temporal stratification and diversity in rice
fields. The survey was performed across thephenophasesof rice (vegetative phase, reproductive phase, and
mature phase.) to understand the crop-weed interaction. In this study, two cultural practices of rice
cultivation, conventional and System of Rice Intensification (SRI) were considered. The weeds collected from the field were identified, and biomass, relative abundances were calculated. Also, diversity indices
such as Simpson’s Index, Shannon index andevennesswere computed. The ecosystem service generated
from the weeds were documented.The study showed that the conventional plots were more diverse than the SRI plots. However, higher biomass for weed species was observed under SRI when compared to
conventional plots. There were 24 dicotyledonous and 18 monocotyledonous weed species. From the
abundance study,it was found that the SRI plots were more evenover the conventional plots. Thus, nutrient
competition and sharing between the rice plants and weeds differ temporallyin SRI and conventional plots.The study suggests selective removal of weeds from the rice fields that will improve the crop yield as
well as generate various ecosystem services.
Key words: Diversity indices; Phenophase; Rank-abundance; Stratification; Weed distribution
Introduction
Rice (Oryza sativa Linn.) is one of the essential food itemsof more than 50% people of the world
and contributes about one-fifth to the total calorie consumption (Singh et al. 2012). Among several
biotic components that influence the rice plant growth, weeds are the typical example.Weeds share
the collective pool of available resource for their growth (Nyarko and Datta 1993; Pane et al.
2000).Most of the weed species exhibit uncontrolled exponential growth resulting in crop yield
loss. Moreover, they affectgrain quality and quantity. According to Inamura et al. (2003), weed
competes with rice for amount of nitrogen in grain and also affected the panicle number which
results in reduced seed production per square meter.
IJCAES Vol 2, Issue 1, 2020
ISSN 2689-6389 (Print) 42 ISSN 2687-7939 (Online
From the beginning of the crop cultivation, weed infestation has always been a significant problem
for rice cultivation as it emerges when the rice seeds germinate (Kumalasari 2014).It causes nearly
80% crop yield loss if left uncontrolled (Cousens and Mortimer 1995). Globally, about 10% of the
total yield is reduced by weeds (OerkeandDehne 2004), and in India, about 33% of rice yield losses
are caused by weeds (Mukherjee 2004). Reports on secondary effectincludes reduction in harvest,
processing efficiency, infestation of pest and production rate. The hierarchy of the crop-weed
competition is influenced by the components like plantation time, species type and spatial
arrangements (McDonald et al. 2009).In agricultural management, weed control is one of the vital
challenges (Kumalasari 2014). Masum et al. (2019) identified the allelopathic indigenous rice
(Oryza sativa L. ssp. indica) varieties from Bangladesh in the weed-infested rice fields and studied
the extent of allelopathic interference relative to resource competition. They found that one of the
indigenous variety -Boteswar, had weed-suppressing effect. Inamura et al.(2003) observed the
increase of nitrogen content in rice on removal of weeds from the field plots. Besides, weed
removal enhanced rice production by 10% in the rainfed area and around 17-19% in irrigated
condition.
In general, studies have been made on crop-weed interaction (Kushwaha et al. 2018; Akter et al.
2018; Haris et al. 2019)and weed control issues and their adverse effects(Derksen et al. 2002; Wall
2007; Giller et al. 2009; Farooq et al. 2011; Rodenburg et al. 2019) but from the ecological point
of view, there are onlya few papers that address the change in the community structure, diversity
and ecosystem services generated from them. Temporal stratification is the gradual change of
species composition of an area along the time axis. The change is transient and in coherence with
the change in physical, chemical and biological environment. Thus, the study on weed community
and their temporal stratification in rice fields under different cultivation types appears to be an
essential issue of research.Ecosystem services are the paybacks contributed by the ecosystem to
humankind (Costanza 1997). In the agricultural fields, weeds are naturally occurring species,
which normally co-exist with the other target plants such as rice, weed or maize and interrupt in
the growth and production of the target plants. The objective of the present research is to study
theweed abundance, diversity indices and composition under two practices (Conventional and
System of Rice intensification) at various growth stages; and delineate the ecosystem services
generated from weeds.
Materials and methods
The study was conducted in the Crop Research and Seed Multiplication Farm, The University of
Burdwan, West Bengal (23014’26” N and 87052’09” E), India.The experimental plots of rice fields
were framedfor the variety IET-4786. Two methods of cultivation (conventional and SRI) were
implemented for rice cultivation. Sampling of weeds were done following quadrat method. In each
field plot of rice, 10 quadrats of size 1m × 1m were framed under the conventional and SRI
cultivation. In total, 30 quadrats each from conventional and SRI field plots were surveyed. The
weed samples were identified following Caton et al. (2010).The samples were oven-dried at 80oC,
and corresponding dry weight was taken.The biodiversity indices of the weed species were
calculated in the three phenophases of rice plant viz. vegetative phase,reproductive phase and
maturephase.

IJCAES Vol 2, Issue 1, 2020
ISSN 2689-6389 (Print) 43 ISSN 2687-7939 (Online
Braun-Blanquet method was applied for the assessment of weed cover of an area. The method
describes the abundance and species density of a large-scale area (Kamoshita et al. 2014). A scale
of 0-5 was used that denoted the number of species present in the quadrate and covered by any
weed species (0 means taxa is absent in this quadrat and 5 means taxa is present abundantly and
covered 75% area of the quadrat). The dominance value was converted into mean cover classes.
The biodiversity indices like dominance, Simpson, Shanonand evenness indices were studied
following Krebs (2009). The indices were calculated in Past software version 3. Cluster analysis
was performed following UPGMA and Bray-Kurtis similarity for weed community. The
ecosystem services of the weed species found in the rice fields were identified from local survey.
Results and discussion
Results showed that there were 42 species of weed under 22 families and thirty species of weed
under twenty families in SRI and conventional practices,respectively. Among the 42 species, there
were 24 dicotyledonous and 18 monocotyledonous identified from the field. In both the
practices,Poaceaewas the dominant family followed by Cyperaceae. In the SRI, 7weed species of
family Poaceaewere noted, and 6 species of the same family was observed under conventional
practice.
Temporally, there was a little variation in the species number or taxa in the conventional practice.
During the vegetative phase of rice, there were only 30 weed species, and at the maturephase of
rice, the number came down to 28. The two species, Pistia stratiotes and Polygonum sp. were
absent at the maturephase of rice. The relative abundance varied across the growth phases of rice
cultivation (Table 2).
However, there were 36 weed species observed throughout the study in the SRI plots. At the start,
there were 33 weed species at vegetative phase except Oryza rufipogon, Polygonum sp. and
Sphenocleazeylanica. At reproductive phase, the above three species appeared, but the
Hygrophiladifformis disappeared. Therefore, the species richness increased to 35 in the SRI field
plots. At mature phase, the species richness decreased to 33 with the disappearance of
Heliotropium indicum, Mimosa pudica and Numphoides indica. It was noted that the species
Hygrophiladifformis re-appeared in the mature phase of rice. In the SRI practice,Cyperus
difformiswasabundant in the reproductive and mature phase, whereas Cyperus iriawas more in
number during the vegetative growth phase of rice (e.g. Table 1). The evenness index varied
between 0.79 and 85 along thegrowth phases
Moreover, in the conventional practice, Fimbristylismiliacea of Cyperaceae family was abundant
in the vegetative phase and Echinocholacolona of Poaceae was higher in number at reproductive
phase of rice plants. It was found that Monochoria vaginalis of Pontederiaceae family was
relatively abundant at the mature stage of the SRI cultivation. The evenness index varied between
0.80 and 0.82 in the sampling plots of conventional fields. The distribution of weed species is
shown in the Venn diagram (Fig. 1).
The dominance index values at the vegetative, reproductive and mature phases under conventional
and SRI field plots were low and showed no significant difference (p <0.05). In contrast, the
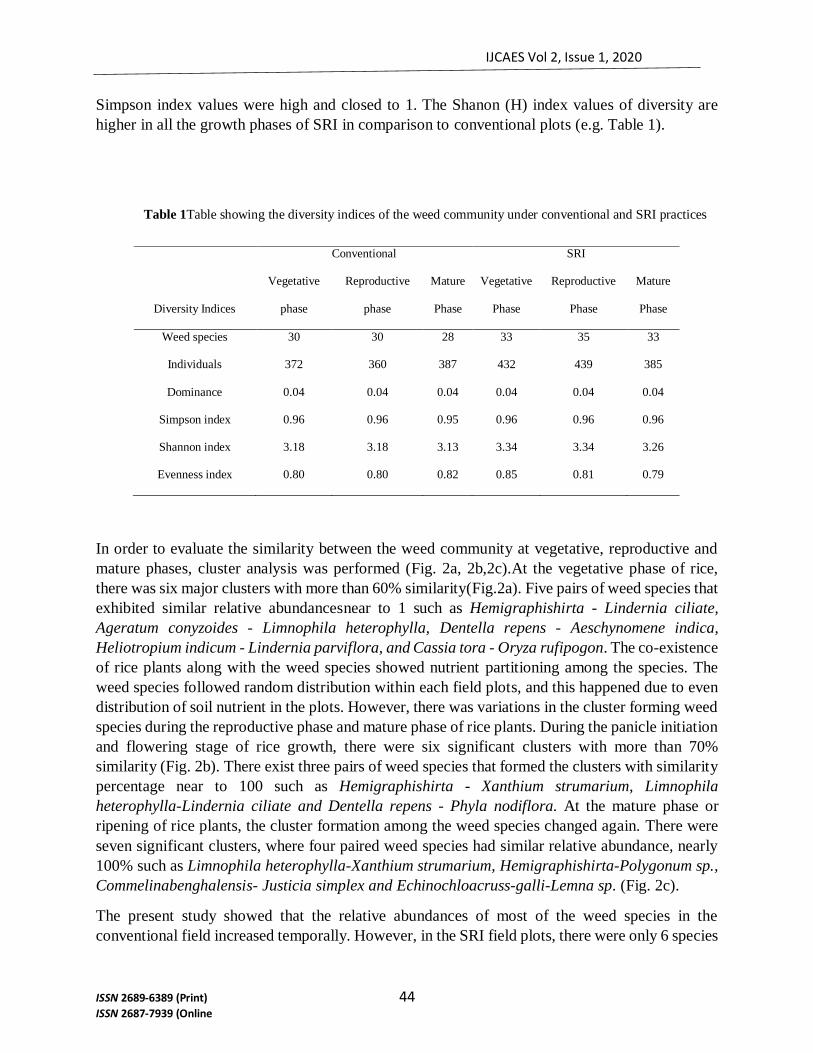
IJCAES Vol 2, Issue 1, 2020
ISSN 2689-6389 (Print) 44 ISSN 2687-7939 (Online
Simpson index values were high and closed to 1. The Shanon (H) index values of diversity are
higher in all the growth phases of SRI in comparison to conventional plots (e.g. Table 1).
Table 1Table showing the diversity indices of the weed community under conventional and SRI practices
In order to evaluate the similarity between the weed community at vegetative, reproductive and
mature phases, cluster analysis was performed (Fig. 2a, 2b,2c).At the vegetative phase of rice,
there was six major clusters with more than 60% similarity(Fig.2a). Five pairs of weed species that
exhibited similar relative abundancesnear to 1 such as Hemigraphishirta - Lindernia ciliate,
Ageratum conyzoides - Limnophila heterophylla, Dentella repens - Aeschynomene indica,
Heliotropium indicum - Lindernia parviflora, and Cassia tora - Oryza rufipogon. The co-existence
of rice plants along with the weed species showed nutrient partitioning among the species. The
weed species followed random distribution within each field plots, and this happened due to even
distribution of soil nutrient in the plots. However, there was variations in the cluster forming weed
species during the reproductive phase and mature phase of rice plants. During the panicle initiation
and flowering stage of rice growth, there were six significant clusters with more than 70%
similarity (Fig. 2b). There exist three pairs of weed species that formed the clusters with similarity
percentage near to 100 such as Hemigraphishirta - Xanthium strumarium, Limnophila
heterophylla-Lindernia ciliate and Dentella repens - Phyla nodiflora. At the mature phase or
ripening of rice plants, the cluster formation among the weed species changed again. There were
seven significant clusters, where four paired weed species had similar relative abundance, nearly
100% such as Limnophila heterophylla-Xanthium strumarium, Hemigraphishirta-Polygonum sp.,
Commelinabenghalensis- Justicia simplex and Echinochloacruss-galli-Lemna sp. (Fig. 2c).
The present study showed that the relative abundances of most of the weed species in the
conventional field increased temporally. However, in the SRI field plots, there were only 6 species
Diversity Indices
Conventional SRI
Vegetative
phase
Reproductive
phase
Mature
Phase
Vegetative
Phase
Reproductive
Phase
Mature
Phase
Weed species 30 30 28 33 35 33
Individuals 372 360 387 432 439 385
Dominance 0.04 0.04 0.04 0.04 0.04 0.04
Simpson index 0.96 0.96 0.95 0.96 0.96 0.96
Shannon index 3.18 3.18 3.13 3.34 3.34 3.26
Evenness index 0.80 0.80 0.82 0.85 0.81 0.79

IJCAES Vol 2, Issue 1, 2020
ISSN 2689-6389 (Print) 45 ISSN 2687-7939 (Online
among the 36 weed species such as Euphorbia hirta, Fimbristylismiliacea, Justicia simplex,
Panicum repens, Polygonum sp. and Solanum nigrum, showed gradual decrease in number
temporally. The weed species diversity was more in the SRI than the conventional, but over time,
the basal area covered by the rice plants in the SRI fields was observed to be more as there were
Fig 1. Venn -diagram showing the distribution of weed species between conventional and SRI practices. The digits
represent the number of taxa or weed species found in conventional and SRI field plots. The intersection represents
the common weed species
more tiller numbers and this prohibited the distribution of weed species in the field plots.In the
conventional field plots, Cyperus iria was the most abundant at vegetative phase of rice, whereas
Cyperus difformis was found to be abundant at reproductive and mature phases. However, the SRI
field plots, weed species such as Fimbristylismiliacea was abundant at vegetative phase of rice
plants. This was followed by Echinochloacolona at reproductive phase and Monochoria vaginalis
at mature phase. The present outcome are in agreement with the research findings by Consenco et
al. (2018).
Jordan (1993) defined crop competitiveness as a complex character that involves the ability of the
rice plants to sustain yields despite the presence of weeds and the ability to suppress weed growth.
In a field of the conventional and SRI, common weeds species appeared coincidently. Similar
environmental resources such as water, light, nutrients and CO2 (at different levels) are required
by rice plants and weed community, thus competition occurs and affects the productivity of rice
crop.In the present study, both the SRI and conventional field plots were greatly affected in terms
of yield.

IJCAES Vol 2, Issue 1, 2020
ISSN 2689-6389 (Print) 46 ISSN 2687-7939 (Online
Fried et al. (2008) found that the most crucial factor determining weed community structures was
the cropping system. The organic and inorganic base of SRI field plots had distinguished effect on
weed community when compared to chemical (NPK) base of conventional practice. Moreover,
water retention in the conventional field plots and intermittent wetting and drying conditions had
crucial role in the growth of weed species. Kabaki and Nakamura (1984) reported that Monochoria
vaginalis tends to be abundant in paddy fields atlow temperatures and low levels of fertilizer
application. In contrast, Echinochloacolona tend to be abundant at high fertilizer levels. The
present study was done at Rabi season with the mean air temperature ranged between 16oC and
30oC. In the SRI field plots, the intermittent wetting and drying conditions and temperature
favoured the growth of Monochoria vaginalis during the mature phase of rice. Fertilizer
application was done before panicle initiation at the SRI as well as conventional field plots that
favoured the growth of Echinochloacolona along the reproductive phase of rice. The presence of
Cyperus iriaand Cyperus difformishad negative effect on rice yield. Hosoya and Sugiyama (2017)
reported that the species of the family Cyperaceae are perennial, which enables their propagation
in the soil, by vegetative organs such as rhizomes and tubers and possess serious threat to rice yield
if not checked through herbicides.
Fig. 2a Vegetative phase

IJCAES Vol 2, Issue 1, 2020
ISSN 2689-6389 (Print) 47 ISSN 2687-7939 (Online
Fig. 2b Reproductive phase
Fig. 2c Mature phase
Besides the negative impacts of weed species, there exists different ecosystem services that can be
considered as by-product in addition to rice yield. Though the weeds grow naturally, if removed
selectively from the rice fields, will benefit mankind in different directions. The ecosystem

IJCAES Vol 2, Issue 1, 2020
ISSN 2689-6389 (Print) 48 ISSN 2687-7939 (Online
services generated from the weed species are summarized in Table 3. The present research strongly
supports the removal of weeds from the rice fields, but not through herbicides or chemical
treatment but by mechanical weeding techniques.
Table 2 Relative abundance (RA) of weed species under different family at vegetative (V), reproductive (R) and
mature phases (M) in the conventional and SRI practices. The weed species have either annual (A) or perineal (P)
life cycle
Species
Family
Life
Cycle
Conventional SRI
Flowering
Class Relative Abundance
Dicot (D)/
Monocot
(M)
(V) (R) (M) (V) (R) (M)
Aeschynomeneindica Fabaceae D A 0.19 0.3 0.66 - - -
Ageratum conyzoides Asteraceae D A - - - 0.28 0.13 0.2 1
Cassia tora Caesalpiniaceae D A 0.14 0.25 0.15 - - -
Commelinabenghalensis Commelinaceae M P 0.17 0.2 0.28 0.25 0.5 0.42
Cynodondactylon Poaceae M P 0.28 0.1 0.09 0.47 0.23 0.15
Cyperusdifformis Cyperaccae M A 0.44 0.7 0.53 0.84 1 1
Cyperusiria Cyperaceae M A 0.5 0.2 0.28 1 0.97 0.76
Dentellarepens Rubiaceae D A 0.19 0.27 0.38 0.625 0.57 0.33
Digitarialongiflora Poaceae M A 0.33 0.5 0.5 0.47 0.6 0.33
Echinochloacolona Poaceae M A 0.86 1 0.72 0.38 0.37 0.36
Echinochloacruss-galli Poaceae M A 0.42 0.6 0.59 - - -
Eclipta prostrate Asteraceae D P 0.47 0.6 0.41 0.5 0.23 0.3
Euphorbia hirta Euphorbiaceae D A 0.22 0.1 0.18 0.34 0.5 0.52
Fimbristylismiliacea Cypcraceae M A 1 0.8 0.93 0.38 0.77 0.89
Fimbristylis ovate Cyperaceae M A - - - 0.56 0.5 0.42
Heliotropiumindicum Boraginaceae D A - - - 0.19 0.07 0
Hemigraphishirta Acanthaceae D A - - - 0.47 0.4 0.27
Hygrophiladifformis Acanthaceae D A - - - 0.16 0 0.06
Ipomoea aquatic Convolvulaceae D P 0.61 0.7 0.845 - - -
Justicia simplex Acanthaceae D A 0.16 0.1 0.28 0.21 0.37 0.39
Lemna sp. Lemnaceae M P 0.31 0.5 0.5625 - - -
Limnophilaheterophylla Scrophulariacea
e
D P - - - 0.28 0.27 0.12
Lindernia ciliate Scrophulariacea
e
D A - - - 0.46 0.26 0.18
Lindernia parviflora Scrophulariacea
e
D A - - - 0.19 0.33 0.15
Ludwigiaadscendens Onagraceae D A 0.14 0.2 0.28 0.28 0.3 0.06
Ludwigia perennis Onagraceae D A 0.19 0.4 0.46 0.66 0.5 0.27
Mimosa pudica Onagraceae D P 0.16 0.13 0.03 0.18 0.06 0
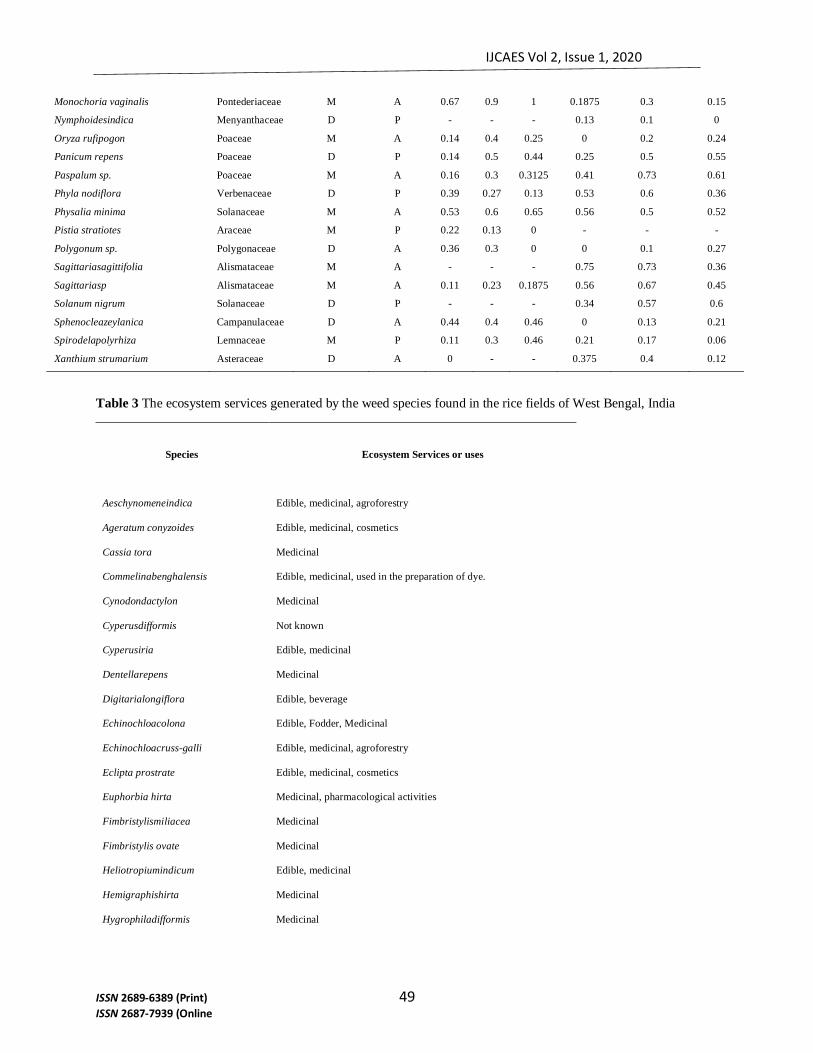
IJCAES Vol 2, Issue 1, 2020
ISSN 2689-6389 (Print) 49 ISSN 2687-7939 (Online
Monochoria vaginalis Pontederiaceae M A 0.67 0.9 1 0.1875 0.3 0.15
Nymphoidesindica Menyanthaceae D P - - - 0.13 0.1 0
Oryza rufipogon Poaceae M A 0.14 0.4 0.25 0 0.2 0.24
Panicum repens Poaceae D P 0.14 0.5 0.44 0.25 0.5 0.55
Paspalum sp. Poaceae M A 0.16 0.3 0.3125 0.41 0.73 0.61
Phyla nodiflora Verbenaceae D P 0.39 0.27 0.13 0.53 0.6 0.36
Physalia minima Solanaceae M A 0.53 0.6 0.65 0.56 0.5 0.52
Pistia stratiotes Araceae M P 0.22 0.13 0 - - -
Polygonum sp. Polygonaceae D A 0.36 0.3 0 0 0.1 0.27
Sagittariasagittifolia Alismataceae M A - - - 0.75 0.73 0.36
Sagittariasp Alismataceae M A 0.11 0.23 0.1875 0.56 0.67 0.45
Solanum nigrum Solanaceae D P - - - 0.34 0.57 0.6
Sphenocleazeylanica Campanulaceae D A 0.44 0.4 0.46 0 0.13 0.21
Spirodelapolyrhiza Lemnaceae M P 0.11 0.3 0.46 0.21 0.17 0.06
Xanthium strumarium Asteraceae D A 0 - - 0.375 0.4 0.12
Table 3 The ecosystem services generated by the weed species found in the rice fields of West Bengal, India
Species
Ecosystem Services or uses
Aeschynomeneindica Edible, medicinal, agroforestry
Ageratum conyzoides Edible, medicinal, cosmetics
Cassia tora Medicinal
Commelinabenghalensis Edible, medicinal, used in the preparation of dye.
Cynodondactylon Medicinal
Cyperusdifformis Not known
Cyperusiria Edible, medicinal
Dentellarepens Medicinal
Digitarialongiflora Edible, beverage
Echinochloacolona Edible, Fodder, Medicinal
Echinochloacruss-galli Edible, medicinal, agroforestry
Eclipta prostrate Edible, medicinal, cosmetics
Euphorbia hirta Medicinal, pharmacological activities
Fimbristylismiliacea Medicinal
Fimbristylis ovate Medicinal
Heliotropiumindicum Edible, medicinal
Hemigraphishirta Medicinal
Hygrophiladifformis Medicinal

IJCAES Vol 2, Issue 1, 2020
ISSN 2689-6389 (Print) 50 ISSN 2687-7939 (Online
Ipomoea aquatic Edible, medicinal
Justicia simplex Medicinal, tradition uses
Lemna sp. Fish feed, fodder
Limnophilaheterophylla Antimicrobial activity
Lindernia ciliate Medicinal
Lindernia parviflora Medicinal
Ludwigiaadscendens Edible, medicinal
Ludwigia perennis Edible
Mimosa pudica Edible, medicinal, agroforestry
Monochoria vaginalis Edible, medicinal
Nymphoidesindica Medicinal
Oryza rufipogon Edible, medicinal
Panicum repens Agroforestry
Paspalum sp. Not known
Phyla nodiflora Edible, medicinal, agroforestry
Physalia minima Fruits edible, medicinal
Pistia stratiotes Fodder, ornamental, medicinal properties
Polygonum sp. Not known
Sagittariasagittifolia Edible, medicinal
Sagittariasp Not known
Solanum nigrum Edible, medicinal
Sphenocleazeylanica Not known
Spirodelapolyrhiza Green manure
Xanthium strumarium Medicinal
Conclusions
The study focuses on the synecological aspect of weeds. The temporal stratification of the weed
species in the rice fields were captured under the SRI and conventional cultivation practices. It
was observed that the occurrence or abundance of weed species vary along the phenophases of
rice and attributed to the factors such as water, light, temperature, CO2 and nutrient conditions.
Similar soil conditionsfavour different species of weeds, and the co-existence of rice plants along
with the weed species showed nutrient partitioning among the species. The weeds have higher
competitive ability than the crop; however, this effect could be caused by the higher weed
densities.
The naturally occurring weed species, after removal can be channelized for many revenue
generation purposes as these species are associated with edible, medicinal and cosmetic uses.
IJCAES Vol 2, Issue 1, 2020
ISSN 2689-6389 (Print) 51 ISSN 2687-7939 (Online
Acknowledgements
The author (Rituparna Banerjee) is thankful to the Department of Environmental Science, The
University of Burdwan for giving all sorts of laboratory facilities to conduct this research. One of
the authors (Sudipto Mandal) greatly acknowledge the support from SERB, DST, Govt. of India,
New Delhi (Project No. EMR/2016/002618) to carry out the research work. Thanks are due to the
agricultural scientist of the Department of Agriculture, Govt. of West Bengal for extending the
help to carry out the research. The corresponding author acknowledges the help of scholars of the
Ecology and Environmental Modelling Laboartory, the Department of Environmental Science,
The University of Burdwan, teaching and non-teaching staffs for extending the help and research
facilities in the Department.
Conflicts of interest
No conflicts of interest have been declared.
References
[1] Akter F, Begum M, Salam A (2018) In situ and ex situ floristic diversity of weed seedbank in rice at farmers’
fields. J Res Weed Sci 1(2. pp. 63-128): 75-89.
[2] Caton BP (2010) A practical field guide to weeds of rice in Asia. International Rice Research Institute.
[3] Concenço G, Andres A, Teló GM, Martins MB, Moisinho IS (2018) Phytosociological characterization of
weeds as a function of residual herbicides applied to rice grown under sprinkler irrigation. Exp Agric 54(2):
303-314.
[4] Costanza R, d'Arge R, De Groot R, Farber S, Grasso M, Hannon B, Limburg K, Naeem S, O'neill RV, Paruelo
J, Raskin RG (1997) The value of the world's ecosystem services and natural capital. Nature 387: 253.
[5] Cousens R, Mortimer M (1995) Dynamics of weed populations. Cambridge University Press. [6] Derksen DA, Anderson RL, Blackshaw RE, Maxwell B (2002) Weed dynamics and management strategies
for cropping systems in the northern Great Plains. Agronomy J 94(2): 174-185.
[7] Farooq M, Bramley H, Palta JA, Siddique KH (2011) Heat stress in wheat during reproductive and grain-
filling phases. Cric Rev Plant Sci 30(6): 491-507.
[8] Fried G, Norton LR, Reboud X (2008). Environmental and management factors determining weed species
composition and diversity in France. Agric Ecosys Environ 128(1-2): 68-76.
[9] Giller KE, Witter E, Corbeels M, Tittonell P (2009) Conservation agriculture and smallholder farming in
Africa: the heretics’ view. Field Crop Res 114(1): 23-34.
[10] Haris A, Utami S (2019) Weeds community structure on the rice field (Oryza sativa L.) in bulusari village,
Sayung district, Demak regency. J Phys 1217 (1): 012177. [11] Hosoya K, Sugiyama SI (2017) Weed communities and their negative impact on rice yield in no-input paddy
fields in the northern part of Japan. Biol Agric Hort 33(4): 215-224.
[12] Inamura T, Miyagawa S, Singvilay O, Sipaseauth N, Kono Y (2003) Competition between weeds and wet
season transplanted paddy rice for nitrogen use, growth and yield in the central and northern regions of
Laos. Weed Biol Manag 3(4): 213-221.
[13] Jordan N (1993) Prospects for weed control through crop interference. Ecol Appl 3(1): 84-91.
[14] Kabaki N, Nakamura H (1984) Differences in nutrient absorption among paddy weeds, 2: Growing process
and response to light and temperature. Weed Res. 147-152.
[15] Kamoshita A, Araki Y, Nguyen YT (2014) Weed biodiversity and rice production during the irrigation
rehabilitation process in Cambodia. Agric Ecosys Environ 194: 1-6.
[16] Krebs, CJ (2009) Ecology: The Experimental Analysis and Distribution andAabundance, 6th Edition.
Pearson, USA. [17] Kumalasari NR, Abdullah L, Bergmeier E (2014) Nutrient assessment of paddy weeds as ruminant feed in
Java. Livestock Res Rural Dev 26: 59.

IJCAES Vol 2, Issue 1, 2020
ISSN 2689-6389 (Print) 52 ISSN 2687-7939 (Online
[18] Kushwaha AK, Tewari LM, Chaudhary LB (2018) Survey on weed diversity in two major crop fields, rice
and wheat in Sonbhadra district, Uttar Pradesh, India. J Crop Weed 14(2): 154-161.
[19] Masum SM, Hossain MA, Akamine H, Sakagami JI, Ishii T, Nakamura I, Asaduzzaman M, Bhowmik PC
(2019) Performance of Bangladesh indigenous rice in a weed infested field and separation of allelopathy
from resource competition. Weed Biol Manag19(2): 39-50. [20] McDonald A, Riha S, DiTommaso A, DeGaetano A (2009) Climate change and the geography of weed
damage: analysis of US maize systems suggests the potential for significant range transformations. Agric
Ecosys Environ 130(3-4): 131-140.
[21] Mukherjee D (2004) Weed management in rice. Agric Today 11: 26-27.
[22] Nyarko, KA, Datta SKD (1993) Effects of light and nitrogen and their interaction on the dynamics of rice-
weed competition. Weed Res 33: 1–8.
[23] Oerke EC,Dehne HW (2004) Safeguarding production—losses in major crops and the role of crop
protection. J Crop Prot 23(4): 275-285.
[24] Pane H, Noor ES, Dizon M, Mortimer AM (2000) Weed communities of gogorancah rice and reflections on
management In: Tuong TP, Characterizing and Understanding Rainfed Environments: 269-287.
[25] Rodenburg J, Johnson JM, Dieng I, Senthilkumar K, Vandamme E, Akakpo C, Allarangaye MD, Baggie I,
Bakare SO, Bam RK, Bassoro I (2019) Status quo of chemical weed control in rice in sub-Saharan Africa. Food Sec 11(1): 69-92.
[26] Singh A, Singh VK, Singh SP, Pandian RTP, Ellur RK, Singh D, Bhowmick, PK, Gopala Krishnan S,
Nagarajan M, Vinod KK, Singh UD (2012) Molecular breeding for the development of multiple disease
resistance in Basmati rice. AoB Plants 2012.
[27] Wall PC (2007) Tailoring conservation agriculture to the needs of small farmers in developing countries: an
analysis of issues. J Crop Improv 19(1-2): 137-155.

International Journal of Chemical and Environmental Sciences Vol 2 Issue 1, 2020 ISSN 2689-6389 (Print) ISSN 2687-7939 (Online)
52 Corresponding author
Email address: [email protected]
Herd Immunity: A Success or a Failure
Received for publication, September15, 2020, and in revised form, November 2, 2020
Sayantan Talapatra1*, Soaham Roy1, Soham Chakraborty1, Nazeef Ahmed1, Ayan Basu1
Arindit Guha Sinha1.
Institute of Engineering and Management, Gurukul, Y-12, Block -EP, Sector-V, Salt Lake
Electronics Complex, Kolkata – 700 091, West Bengal, India.
Abstract
Amidst the COVID-19 pandemic, the most debated scientific topic has been Herd Immunity. It may be
defined as a situation in which a major portion of a population (about 60 - 90%) develops some form
of the disease and, therefore, becomes resistant to it. However, with such large number of cases, the
healthcare facilities are bound to get overloaded. Some patients with severe cases of COVID-19 will be
required to get admitted into the ICU (intensive care units) – which have limited beds. This could lead
to more preventable deaths. Herd immunity has both positive and negative aspects. For instance, if we
fail in the halfway for example in the country Sweden, then it will result in more deaths rather than
decreasing the spread of infection. According to several theoretical modelling that people have
conducted across the world and also in India suggest that there could be few waves of COVID-19 and
people need to be prepared for them. In this review we are trying to assess whether herd immunity is a
success or a failure.
Keywords Vaccine, Covid-19, Herd, Immunity, Population, Infection
Introduction
During this never-ending lockdown and the downfall in economy due to unemployment the
most debatable approach by the scientists has been that we continue to live in lockdown and
that everything will become normal as we approach herd immunity. Herd immunity is basically
a technique to eradicate a disease or infection in which a population is made immune to a
disease or an infection by vaccination or by exposing them to the disease or the infection and
letting their own body develop an immunity against that disease or infection. Now, this strategy
of exposing people to the disease can backfire too because aged people or people with a weak
immune system can lose their lives while their body is still trying to create the necessary
antibodies[1].
On the vaccine development front, according to studies or researches, three ways are being
adopted. The first one is the immune boosting vaccine that improves the host’s immunity. The
second one is the monoclonal antibody for which CSIR has funded a collaborative programme
between NCCS (National Centre for Cell Science) Pune, IIT Indore and Bharat Biotech. Third
one is convalescent plasma therapy which can be life threatening. After all these researches
and trials there still persists a question, “can COVID-19 be contained or stopped by herd
immunity?”
Coronaviruses are a large family of viruses that are actually common throughout the world and
can cause respiratory illness in people. There are several known coronaviruses that caninfect

IJCAES Vol 2, Issue 1, 2020
ISSN 2689-6389 (Print) 53 ISSN 2687-7939 (Online)
people and usually cause mild respiratory diseases, such as the common cold. However, at least
two previously identified coronaviruses have caused severe illness — Severe Acute
Respiratory Syndrome (SARS) coronavirus and Middle East Respiratory Syndrome (MERS)
coronavirus.
The difference between COVID-19 from other viruses
While coronaviruses are common, coronavirus (COVID-19) is a new strain of coronavirus that
had previously not been identified in humans. The key features of COVID-19 are respiratory
symptoms with fever and cough. Like all new infections, understanding COVID-19 is
important and challenging. The CDC is proactively monitoring the virus and taking measures
like providing guidance for health care workers and issuing travel recommendations [2]
Herd immunity:
Acquired immunity is established at the level of the individual, either through natural infection
with a pathogen or through immunization with a vaccine. Herd immunity stems from the
effects of individual immunity scaled to the level of the population. It refers to the indirect
protection from infection conferred to susceptible individuals when a sufficiently large
proportion of immune individuals exist in a population. This population level effect is often
considered in the context of vaccination programs, which aim to establish herd immunity so
that those who cannot be vaccinated, including the very young and immune compromised, are
still protected against disease. Depending on the prevalence of existing immunity to a pathogen
in a population, the introduction of an infected individual will lead to different outcomes (Fig
1). [3,4,5]
In a completely naive population, a pathogen will propagate through susceptible hosts in an
unchecked manner following effective exposure of susceptible hosts to infected individuals.
However, if a fraction of the population has immunity to that same pathogen, the likelihood of
an effective contact between infected and susceptible hosts is reduced, since many hosts are
immune and, therefore, cannot transmit the pathogen. If the fraction of susceptible individuals
in a population is too few, then the pathogen cannot successfully spread, and its prevalence
will decline. The point at which the proportion of susceptible individuals falls below the
threshold needed for transmission is known as the herd immunity threshold (Anderson and
May, 1985). Above this level of immunity, herd immunity begins to take effect, and susceptible
individuals benefit from indirect protection from infection [6,7]
How can we achieve herd immunity for an infectious disease
For infections without a vaccine where many people have developed the immunity against the
disease because of prior infection or good immunization from the disease. The disease can still
circulate among aged people, children below 10 years of age and persons with weak immune
systems. Therefore, it is clear that herd immunity can be achieved by mass vaccination of the
population or by exposing the people to the disease and letting their bodies develop immunity
on their own.

IJCAES Vol 2, Issue 1, 2020
ISSN 2689-6389 (Print) 54 ISSN 2687-7939 (Online)
Positive side of Herd immunity:
If a high enough proportion of individuals in a population are immune, the majority will protect
the few susceptible people because the pathogen is less likely to find a susceptible person. The
important part is that it is cost effective.[8]
Negative side of Herd immunity:
All of this sounds rosy, but the problem with herd immunity is that it really hinges on
vaccination. Without a vaccine, the only way to become immune to a disease is to contract it
and live through it, which makes the strategy a whole lot more fatal. Even then, herd immunity
has not been able to prevent outbreaks of measles or rubella in communities with immunization
levels as high as 85% to 90% [9,10,11]
If we pursue herd immunity, the best-case scenario has between 43,000 and 100,000 people in Australia
dying. To see how much fatal herd immunity can be, let’s look at the numbers. Our initial
estimates put the herd immunity threshold for Covid-19 – the proportion of people who need
to be immune for the disease to stop spreading – at 60-70% of the population. So a minimum
of 60-70% of people need to be infected with Covid-19 for herd immunity to come into play,
although new data from the CDC indicates that the number may be as high as 85%. It is
important to note that one can’t really pick and choose these people, because unless you reach
that threshold in every part of the country, you’ll still see disease outbreaks. The idea that we
can only infect young people is simply outlandish, firstly because that’s not how society
functions, and also because it’ll create groups of people with low immunity where the disease
can still spread. [9]
In Australia, that would mean roughly 15-17 million coronavirus infections. Now, we also
have a very good idea of the death rate from this disease – while the case-fatality rate is quite
high, the true infection-fatality rate given a healthcare system that is not overwhelmed is likely
to be around 0.3-0.6%.
Is Herd Immunity just a myth
The people who have developed immunity to the virus are very unlikely to become ill due to
the same virus again, thus, the virus loses its transmissibility at the point when enough number
of people in a specific area have developed the immunity. The problem lies in the fact that we
are not aware of exactly how many people should get infected by the virus for the society to
develop Herd immunity against COVID – 19. The key feature here is immunity. Production
of Antibodies, which are the shield against a virus, are aided by medicines. Vaccines which
produce army of antibodies are not yet developed against COVID 19. Thus, this two
deficiencies have accelerated the spread of the concept around Herd immunity. There is another
problem with herd immunity: the problem of herd [12] A person's herd changes with
relocation, migration, or even tourist travel, new circle of friends--this is capable of breaching
herd immunity.
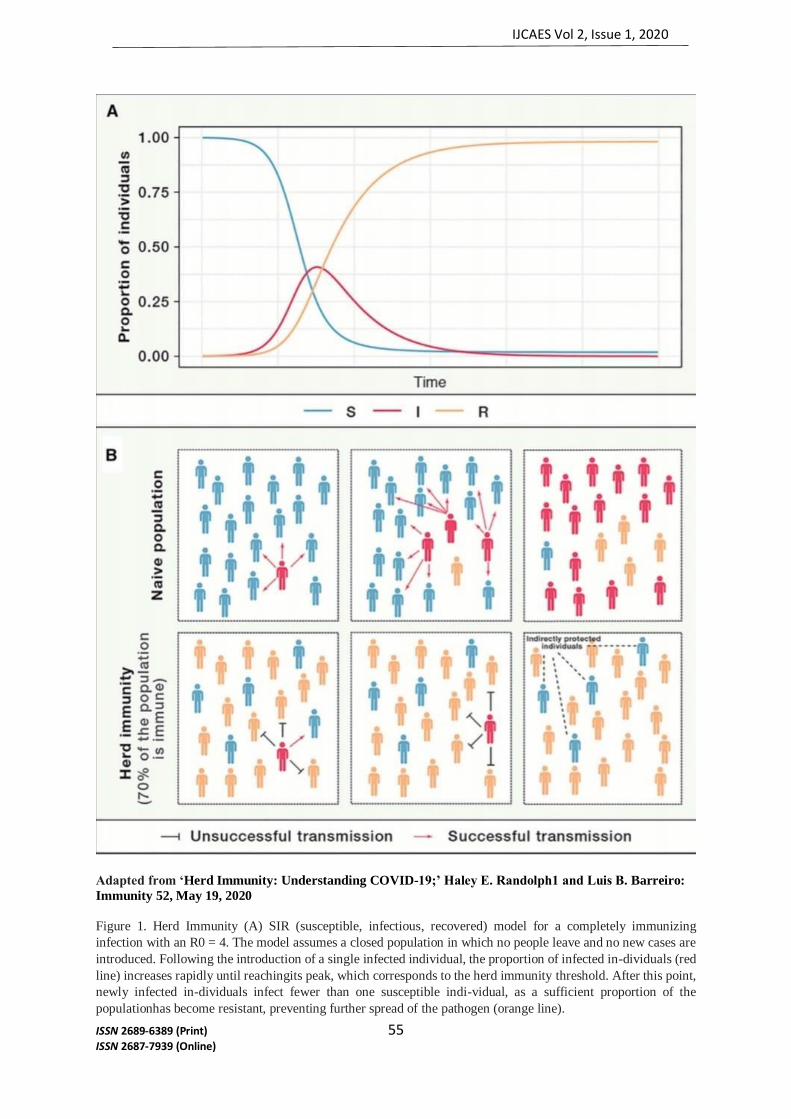
IJCAES Vol 2, Issue 1, 2020
ISSN 2689-6389 (Print) 55 ISSN 2687-7939 (Online)
Adapted from ‘Herd Immunity: Understanding COVID-19;’ Haley E. Randolph1 and Luis B. Barreiro:
Immunity 52, May 19, 2020
Figure 1. Herd Immunity (A) SIR (susceptible, infectious, recovered) model for a completely immunizing
infection with an R0 = 4. The model assumes a closed population in which no people leave and no new cases are
introduced. Following the introduction of a single infected individual, the proportion of infected in-dividuals (red
line) increases rapidly until reachingits peak, which corresponds to the herd immunity threshold. After this point,
newly infected in-dividuals infect fewer than one susceptible indi-vidual, as a sufficient proportion of the
populationhas become resistant, preventing further spread of the pathogen (orange line).

IJCAES Vol 2, Issue 1, 2020
ISSN 2689-6389 (Print) 56 ISSN 2687-7939 (Online)
(B) Schematic depiction of the disease propagation dynamics when one infected individual is introduced into a
completely susceptible population (top panel) versus a situation in which an infected individual is introduced into
a population that has reached the herd immunity threshold (bottom panel). In the naive population, an outbreak
quickly emerges, whereas under the scenario of herd immunity, the virus fails to spread and persist in the
population.
[3]
Adapted from ‘Herd Immunity: Understanding COVID-19;’ Haley E. Randolph1 and Luis B. Barreiro:
Immunity 52, May 19, 2020
Figure 2. The Potential Health Burden of COVID-19 if Herd Immunity Is Achieved in the Absence of Vaccination
(A) Relationship between R0—the basic reproduction number (Box 1)—and the herd immunity
threshold, which corresponds to the proportion of individuals in the population that would need be
become immune for herd immunity to be established (y axis). As R0 increases, the proportion of the
population that must be immune to generate herd immunity increases (1 – 1/R0).
(B) Basic reproduction numbers (R0) and the corresponding herd immunity thresholds for various
infectious diseases. R0 estimates represent the commonly accepted R0 range for each of the pathogens
reported.
(C) Expected number of absolute deaths for the top 20 countries with the highest incidence of COVID-
19 as of April 10, 2020, assuming herd immunity is es-established at a uniform threshold of 67% (R0
= 3) in each country. Overall COVID-19 infection fatality rates (IFR) of 0.2%, 0.6%, and 1.0% are
considered. We notethat these numbers are necessarily underestimates given that, even after the herd
immunity threshold is reached, it will take a long time until there are no morenew cases, and therefore,
no new deaths.
Concept of Herd Immunity
Under the simplest model, the herd immunity threshold depends on a single parameter known
as R0, or the basic reproduction number. R0 refers to the average number of secondary

IJCAES Vol 2, Issue 1, 2020
ISSN 2689-6389 (Print) 57 ISSN 2687-7939 (Online)
infections caused by a single infectious individual introduced into a completely susceptible
population [1,4]. If we consider a hypothetical pathogen with an R0 of 4, this means that, on
average, one infected host will infect four others during the infectious period, assuming no
immunity exists in the population. Mathematically, the herd immunity threshold is defined by
1 – 1/R0 (e.g., if R0 = 4, the corresponding herd immunity threshold is 0.75) (Anderson and
May, 1985). Therefore, the more communicable a pathogen, the greater its associated R0 and
the greater the proportion of the population that must be immune to block sustained
transmission.
A similar parameter important for understanding population-level immunity is the effective
reproduction number (Re or Rt). Re is defined as the average number of secondary cases
generated by a single index case over an infectious period in a partially immune population
(Delamater et al., 2019). Unlike R0, Re does not assume a completely susceptible
populationand, consequently, will vary depending on a population’s current immune state,
which will change dynamically as an outbreak event or vaccination campaign unfolds.
Ultimately, the goal of vaccination programs is to bring the value of Re below 1. This occurs
when the proportion of the population with immunity exceeds the herd immunity threshold. At
this point, pathogen spread cannot be maintained, so there is a decline in the number of infected
individuals within the population.
Cost benefit analysis of HERD immunity:
It accounts for cost benefit analysis of vaccination program. It produces an extra benefit of
disease reduction that could not have occurred if no HERD immunity had been generated in
that specific area. Thus, it results in favourable cost effectiveness and cost benefit ratios.
When serotype replacement is accounted for, it reduces the predicted benefits of
vaccination.[13,15]
So, it can be inferred that the incidence of the disease may decrease to a level beyond what was
predicted from direct protection pointing to the fact that HERD immunity contributed to the
reduction.
CONCLUSION:-
In spite of the knowledge of Herd immunity, efforts to control and eliminate measles were
unsuccessful until mass vaccination using the measles vaccine began in the 1960s. Mass
vaccination, discussions of disease eradication, and cost–benefit analysis of vaccination
subsequently prompted more widespread use of the term herd immunity.
Since the adoption of mass and ring vaccination, complexities and challenges to herd immunity
have arisen. Modelling of the spread of infectious disease originally made a number of
assumptions, namely that entire populations are susceptible and well-mixed, which do not exist
in reality, so more precise equations have been developed. In recent decades, it has been
recognized that the dominant strain of a microorganism in circulation may change due to herd
immunity, either because of herd immunity acting as an evolutionary pressure or because herd

IJCAES Vol 2, Issue 1, 2020
ISSN 2689-6389 (Print) 58 ISSN 2687-7939 (Online)
immunity against one strain allowed another already-existing strain to spread. Emerging or
ongoing fears and controversies about vaccination have reduced or eliminated herd immunity
in certain communities, allowing preventable diseases to persist in or return to these
communities.On a global scale the large number of corona virus cases are essentially a small
percentage of over 750 crore people of the world to think realistically of herd immunity as
protection unless a vaccine is developed, administered and implemented to enough
people.Hence what we find out is that herd immunity is basically a failure, because by the time
it reaches the stage of success a lot of damage is already done.
References
[1] Anderson, R.M., and May, R.M. (1985). Vaccination and herd immunity to infectious diseases.
Nature 318, 323–329.
[2] Bao, L., Deng, W., Gao, H., Xiao, C., Liu, J., Xue, J., Lv, Q., Liu, J., Yu, P., Xu, Y., et al. (2020).
Reinfection could not occur in SARS-CoV-2 infected rhesus macaques. bioRxiv.
https://doi.org/10.1101/2020.03.13.990226.
[3] Callow, K.A., Parry, H.F., Sergeant, M., and Tyrrell, D.A. (1990). The time course of the immune
response to experimental coronavirus infection of man. Epidemiol. Infect. 105, 435–446.
[4] Delamater, P.L., Street, E.J., Leslie, T.F., Yang, Y.T., and Jacobsen, K.H. (2019). Complexity of
the basic reproduction number (R0). Emerg. Infect. Dis. 25, 1–4. The Centre for Evidence-Based
Medicine (2020). Global COVID-19 case fatality rates. https://www.cebm.net/covid-19/global-
covid-19-case-fatality-rates. [5] Huang, C., Wang, Y., Li, X., Ren, L., Zhao, J., Hu, Y., Zhang, L., Fan, G., Xu, J., Gu, X., et al.
(2020). Clinical features of patients infected with 2019 novel coronavirus in Wuhan, China.
Lancet 395, 497–506.
[6] Kissler, S.M., Tedijanto, C., Goldstein, E., Grad, Y.H., and Lipsitch, M. (2020). Projecting the
transmission dynamics of SARS-CoV-2 through the postpandemic period. Science, eabb5793.
[7] Li, Q., Guan, X., Wu, P., Wang, X., Zhou, L., Tong, Y., Ren, R., Leung, K.S.M., Lau, E.H.Y.,
Wong, J.Y., et al. (2020). Early transmission dynamics in Wuhan, China, of novel coronavirus-
infected pneumonia. N. Engl. J. Med. 382, 1199–1207.
[8] Liu, Y., Eggo, R.M., and Kucharski, A.J. (2020). Secondary attack rate and superspreading events
for SARS-CoV-2. Lancet 395, e47.
[9] Lloyd-Smith, J.O., Schreiber, S.J., Kopp, P.E., and Getz, W.M. (2005). Superspreading and the effect of individual variation on disease emergence. Nature 438, 355–359.
[10] Mo, H., Zeng, G., Ren, X., Li, H., Ke, C., Tan, Y., Cai, C., Lai, K., Chen, R., Chan- Yeung, M.,
and Zhong, N. (2006). Longitudinal profile of antibodies against SARS-coronavirus in SARS
patients and their clinical significance. Respirology 11, 49–53.
[11] Nasiri, M.J., Haddadi, S., Tahvildari, A., Farsi, Y., Arbabi, M., Hasanzadeh, S., Jamshidi, P.,
Murthi, M., and Mirsaeidi, M. (2020). COVID-19 clinical characteristics, and sex-specific risk of
mortality: Systematic Review and Meta-analysis. medRxiv.
https://doi.org/10.1101/2020.03.24.20042903.
[12] Sanche, S., Lin, Y.T., Xu, C., Romero-Severson, E., Hengartner, N., and Ke, R. (2020). High
contagiousness and rapid spread of severe acute respiratory syndrome coronavirus 2. Emerg.
Infect. Dis. 26, https://doi.org/10.3201/eid2607. 200282.
[13] Verity, R., Okell, L.C., Dorigatti, I., Winskill, P., Whittaker, C., Imai, N., Cuomo- Dannenburg, G., Thompson, H., Walker, P.G.T., Fu, H., et al. (2020). Estimates of the severity of coronavirus
disease 2019: a model-based analysis. Lancet Infect. Dis. Published online March 30, 2020.
https://doi.org/10.1016/ S1473-3099(20)30243-7.
[14] Wu, J.T., Leung, K., Bushman, M., Kishore, N., Niehus, R., de Salazar, P.M., Cowling, B.J.,
Lipsitch, M., and Leung, G.M. (2020a). Estimating clinical severity of COVID-19 from the
transmission dynamics in Wuhan, China. Nat. Med. 26, 506–510.
[15] Wu, F., Wang, A., Liu, M., Wang, Q., Chen, J., Xia, S., Ling, Y., Zhang, Y., Xun,J., Lu, L., et al.
(2020b). Neutralizing antibody responses to SARS-CoV-2 in a COVID-19 recovered patient
cohort and their implications.