international journal of applied science and …research works (oteri and atolagbe, 2003, talabi et...
TRANSCRIPT

International Journal of Applied Science and Research
1 www.ijasr.org Copyright © 2019 IJASR All rights reserved
Facies classification and Ionic Ratio evaluation of Groundwater around Igbokoda Coastal Area, southwestern Nigeria
Abel Ojo TALABI Department of Geology, Ekiti State University, P. M. B. 5363, Ado-Ekiti, Nigeria.
The 16-digit ORCID of the author: 0000-0002-1733-3368
IJASR 2019 VOLUME 2 ISSUE 3 MAY – JUNE ISSN: 2581-7876
Abstract – Facies classification of groundwater around Igbokoda Coastal Area, Southwestern Nigeria was carried out employing ionic ratio, Piper diagram, Chadha plot and Hydrochemical Facies Evolution Diagram (HFE-D). Ionic ratios of HCO3-/Cl-, Na+/Cl-, Ca2+/Cl-, Ca2+/Na+, Mg2+/Cl-, K+/Cl- and SO42-/Cl- were calculated and plotted against TDS to study the ingress of seawater into coastal aquifers of the area. Chemical analysis of groundwater from the area revealed average concentrations (mg/L) of Ca2+ (25.14), Mg2+ (3.46), Na+ (26.12mg/L), K+ (13.86), HCO3- (1.34), Cl- (7.95 mg/L), SO42- (2.46) and PO42-(3.64). Plots of ionic ratios vs. TDS tend towards that of seawater with increasing TDS signifying seawater intrusion. The Piper diagram revealed dominant Na+- Cl- water (85%) (indication of saltwater intrusion), Mixed Ca2+-Mg2+-Cl- type (10%) and Ca2+-Cl- type (5%) respectively. The Chadha diagram revealed dominant Na+ -Cl- type (90%) and Ca2+ -Mg2+ -Cl- (10%) signifying reverse ion exchange in the zone. The HFE-D indicated that 20% of the groundwater samples fell in the generalized seawater intrusion zone of the aquifer with facies representations of Na-Cl type (5%), Mix Ca-Mix Cl type (10%), MixCa-Cl type (5%) and Ca-Cl type (5%) while 15% of the groundwater samples were in the freshening phase (facies; Ca-HCO3/SO4(5%), MixCa-HCO3/SO4 (5%) and Na-MixCl (5%) respectively. Majority of the groundwater samples (60%) fell into the simple binary mixing zone with little or no intervention of Base Exchange reactions. The HFE-D recognized the sequence of the facies in detail and therefore the succession and interpretation of processes in contrast to Piper and Chadha diagram. Keywords: Hydrochemistry; ionic ratios; seawater; water facies; reverse ion exchange.
1. Introduction Surface water is available in most part of Igbokoda Coastal Area. However, the surface water is colored by natural sea weeds apart from the incessant contaminant dumps arising from human activities. Hence, many of the inhabitants of Igbokoda Township have to depend on groundwater for daily water consumption and agricultural activities. The area is on sedimentary terrain where dissolution of ions in soils, sediments and rocks as water travels along mineral surfaces in the pores and fractures of unsaturated zone and the aquifer result into variation in groundwater chemistry (Shahbazi and Esmaeili-Sari, 2009). The geological formations, water-rock interaction and relative mobility of ions are prime factors influencing the geochemistry of groundwater (Yousef et al., 2009). Under this situation, variability in groundwater chemistry warrants the investigation of hydrochemical facies which is critical for effective management and water use planning. Hydrogeochemical facies, an important diagnostic chemical aspect of groundwater solutions occurring in hydrologic systems, provides information on the distinct zones of cations and anions along different layers of aquifers (Christopher and Robert, 2005). Research works (Oteri and Atolagbe, 2003, Talabi et al., 2012, Adeyemo et al., 2017, Talabi et al., 2018) revealed occurrence of salt water intrusion into the coastal area of Igbokoda. Salt water intrusion occurs in coastal freshwater aquifers when the different densities of both the saltwater and freshwater allow the ocean water to intrude into the freshwater aquifer. Saltwater intrusion into the coastal aquifer has long been recognized as a major threat to groundwater quality around the world. Successful management of coastal groundwater resources depends not only upon planning and regulation, but also on the accurate assessment and prediction of the behavior of the saltwater interface to both natural conditions and man’s activities (Yuhr and Benzon, 1995). Igbokoda Coastal Area has suffered so many episodes of regressive /transgressive activities and with increased variations in world climate, coastal activities have increased leading to different hydrochemical facies. Many researchers have worked on hydrochemical characterization to evaluate groundwater quality employing Piper Trilinear and Chalda graphical plots (Chirstopher and Robert, 2005, Nur et al., 2012, Ravikumar and Somashekar, 2017, Sridharan and Nathan, 2017, Gajul et al., 2017) while some employed ionic ratio (Sanchez-

International Journal of Applied Science and Research
2 www.ijasr.org Copyright © 2019 IJASR All rights reserved
Martos et al., 2002, Kim et al., 2003, Moujabber et al., 2006). However, in coastal environment, hydrochemical facies is a dynamic process which depends on the periodic changes in the recharge-discharge balance of the aquifer. Any influence, direct or indirect on the aquifer’s water balance affects the position and movement of the seawater interface and the chemistry of the groundwater. The relationship between the dynamic and the hydrochemistry suggests that a study of the chemical variations will allow the phase of seawater intrusion of the aquifer to be identified as well as the evolution and dynamics of the saline front (phases of seawater intrusion or freshening) within the aquifer (Giménez-Forcada, 2010). The aims of this reviewed paper are to identify the hydrochemical facies that characterize each stage of intrusion and freshening employing ionic ratio evaluation, Piper Trilinear and Chalda graphical plots in addition to Hydrochemical Facies Evolution Diagram (HFE-D). 1.1 Location and Geology Igbokoda town (headquarter of Ese Odo local government) lies within latitude 6˚ 20′ N to 6˚24′ N and longitude 4˚45′E to 4˚48′E (Fig.1). It serves as the gateway to other towns in the riverine area of Ondo State, Nigeria. The average annual rainfall in the area exceeded 2000 mm while the mean monthly temperature was 27˚C. Igbokoda coastal area is an integral part of the Dahomey Basin. The Dahomey Basin is a combination of inland / coastal / offshore basin that stretches from south-eastern Ghana through Togo and the Republic of Benin to south-western Nigeria. It is separated from the Niger Delta by a subsurface basement high referred to as the Okitipupa Ridge (Obaje, 2009). Dahomey basin contains extensive wedge of Cretaceous to recent sediments, which thicken towards the offshore (Klemme, 1975). Dahomey basin has six lithostratigraphic units. The lithostratigraphic units from the oldest to the youngest include: Abeokuta Group (Cretaceous), Ewekoro Formation (Paleocene), Akinbo Formation (Paleocene-Eocene), Oshosun Formation (Eocene), Ilaro Formation (Eocene) and Benin Formation (Oligocene-recent). The known aquifers in the study area are mostly within the Benin Formation (Whiteman, 1982). The study area is covered by Quaternary alluvium deposits underlain by the Quaternary coastal plain sands with lenses of clayey shale (Okosun, 1998). 2. Materials and Method Data for this study was extracted from the research of (Talabi, 2018) on “Hydrogeochemistry and Quality Assessment of shallow Groundwater in the Coastal Area of Igbokoda, Southwestern Nigeria”. The present research employs Ternary plots of Mg2+-Ca2+-(Na++K+) and Cl--HCO3
--SO42-, calculated ionic ratio, Piper
Trilinear diagram and Chadha’s plot as well as Hydrochemical Facies Evolution Diagram (HFE-D) to discriminate the various hydrochemical facies in the study area and use the facies to assess the dynamic character of sea water intrusion. Ionic ratios of HCO3
-/Cl-, Na+/Cl-, Ca2+/Cl-, Ca2+/Na+, Mg2+/Cl-, K+/Cl- and SO42-/Cl- were
calculated and plotted against TDS to study the ingress of seawater into coastal aquifers of the area (Nwankwoala and Udom, 2011, Batayneh et al., 2014, Sridharan and Nathan, 2017). The Piper Tri-linear diagram is one of the most useful graphical representations in groundwater quality studies to understand the hydrogeochemical facies in terms of analogies, dissimilarities and water types (Piper, 1953). For example, chemically similar water can be classified and the evolution in water chemistry along the flow path be defined employing Piper diagram. To construct the Piper diagram, the relative abundance of cations with the %
meq/L of Na+
+K+
, Ca2+
and Mg2+
is first plotted on the cations triangle. The relative abundance of Cl-, SO4
2-
,
and HCO3
-
+CO3
2-
is then plotted on the anions triangle. The two data points on the cations and anions triangles
are then combined into the quadrilateral field that shows the overall chemical property of the water sample. Chadha’s diagram can be used for various hydrochemical processes including base cation exchange, cement pollution, mixing of natural water, sulphate reduction, saline water and other related hydrochemical problems. Plotting Chadha’s diagram involves obtaining the difference in milliequivalent percentage between alkaline earth (Ca2+ + Mg2+) and alkali metals (Na+ + K+), expressed as percentage reacting values is plotted on X axis while the difference in milliequivalent percentage between weak acid anions (CO3
2- + HCO3-)and strong acid anions (Cl- +
SO42-) is plotted on the Y axis. The plotting results into a square or rectangular field that describes the overall
character of the water (Chadha, 1999). Since this study was carried out in a coastal area not far from the Atlantic Ocean the need to ascertain whether the aquifer was in the phase of seawater intrusion or freshening, indicating the status of the aquifer in terms of the advance or regression of the saline front becomes necessary. Therefore, a new multi-rectangular diagram proposed by (Giménez-Forcada, 2010), that aids interpretation of these important

International Journal of Applied Science and Research
3 www.ijasr.org Copyright © 2019 IJASR All rights reserved
coastal processes through the representation and evolution of hydrochemical facies (Hydrochemical Facies Evolution Diagram, HFE-D) was employed in this research.
Fig. 1. Location and Geology Map of Study area (after Talabi, 2018)
In the diagram the percentages of either Na+ or Ca2+ with higher concentration in meq/L in the water reproducing the Base Exchange reactions is represented on the abscissa. The ordinate represents the percentages

International Journal of Applied Science and Research
4 www.ijasr.org Copyright © 2019 IJASR All rights reserved
of anions in which the %Cl- represents seawater and the %HCO3- or %SO4
2- (depending on the dominant anion is freshwater) characterizes the recharge water. In other words, the %SO4
2- and %HCO3- are not summed, but rather
are represented by choosing the ion present in higher percentage (e.g. the Na-HCO3-/SO4
2- facies can represent both the Na-HCO3 facies and the Na-SO4 facies. If there are waters of both facies then the sample will be represented using the percentage of bicarbonate (if %HCO3
- > %SO42-) or sulphate (if %SO4
2- > %HCO3-), and
this will be indicated in the centre of the diagram using different symbols. The result is a representation of four heterotopic facies out (Na-HCO3, Na-Cl, Ca-HCO3 and Ca-Cl) of a total of sixteen facies (or 6 out of 24 facies if one takes into account that sulphate and bicarbonate waters can coexist (Chadha, 1999). 3. Results Chemical analysis of groundwater samples from the study area revealed average concentrations (mg/L) of Ca2+ (25.14), Mg2+ (3.46), Na+ (26.12mg/L), K+ (13.86), HCO3
- (1.34), Cl- (7.95 mg/L), SO42- (2.46) and PO4
2-(3.64) (Table 1). The result indicated the dominance of alkali metals (Na++K+) over the alkaline earths (Ca2++Mg2+). The concentration values of all measured parameters fell within approved standard of WHO (2011) and the groundwater may not pose problems for irrigation and domestic uses. However, field observations revealed that the groundwater was coloured (greenish) arisen from continuous impacts of sea weeds. Ternary plots of Mg2+-Ca2+-(Na++K+) and Cl--HCO3
--SO42- support dominance of alkali metals (Na+ + K+) indicating that 85% of the
samples were alkali-rich water (Fig. 2a). As regards the anions, chloride was dominant (80%) while sulphate and the non-dominance zone had 7% and 13% representations respectively (Fig. 2b). Deduction from Figs. 2a and 2b clearly revealed that the groundwater in the study area was dominated by Na- Cl –SO4 water type. The average values for the calculated ionic ratios for HCO3
-/Cl-, Na+/Cl-, Ca2+/Cl-, Ca2+/Na+, Mg2+/Cl-, K+/Cl-, SO4
2-/Cl- and Ca2+/Mg2+as presented in Table 2 were 0.14, 5.8, 5.08,1.24, 1.74, 1.87, 1.05 and 0.45 respectively. The ionic ratios plotted against TDS and Cl- vs. TDS were presented in Figs. (3a -3h). The plot of Cl- vs. TDS gave a correlation coefficient of r = 0.79 (Fig.3h) indicating that Cl- contributed substantially to TDS. Piper Tri-linear diagram (Fig. 4) for groundwater samples from the study area revealed three water types; Na+-Cl-
type, Mixed Ca2+-Mg2+-Cl- type and Ca2+- Cl- type. It is evident from the piper plot that the Na+-Cl- type was dominant representing 85% of the water types while Mixed Ca2+-Mg2+-Cl- and Ca2+- Cl- types have 10% and 5% representations respectively. The Chadha diagram (Fig. 5) revealed that 90% of the groundwater samples fell into the domain of alkali metals exceed alkaline earths and strong acidic anions exceed weak acidic anions (Na+-Cl- type) while the remaining 10% fell into the zone of alkaline earths and weak acidic anions exceed both alkali metals and strong acidic anions (Ca2+ -Mg2+ -Cl- type) respectively. The HFE-D usually presents four heterotopic facies (Na-HCO3, Na-Cl, Ca-HCO3 and Ca-Cl). The diagram in the present study (Fig. 6) revealed that five samples representing 25% of the groundwater samples fell in the generalized seawater intrusion zone of the aquifer. The facies representations in the zone include Na-Cl type (5%), Mix Ca-MixCl type (10%), MixCa-Cl type (5%) and Ca-Cl type (5%). Three of the groundwater samples were in the freshening phase facies (5% each); Ca-HCO3/SO4, MixCa-HCO3/SO4 and Na-MixCl) while 60% of the groundwater samples fell along the line of mixing (A) (4-7-10-13) indicating simple binary mixing with little or no intervention of Base Exchange reactions (Fig. 6). 4. Discussion The concentration of dissolved ions in groundwater samples are generally governed by lithology, nature of geochemical reactions and solubility of the aquifers rocks (Nosrat et al, 2010). However, in any coastal area, transgression and regression of seawater to and from the coastal aquifers often result into fluctuation in the groundwater chemistry due to mixing of saline water with fresh groundwater. Ionic ratio has been employed for comprehensive study of saltwater intrusion along the coastal aquifers (Barbecot et al., 2000, Kim et al., 2003, Moujabber et al., 2006, Batayneh et al., 2014). Apart from using chemistry of groundwater to study saltwater intrusion, mineralogy of rocks can also be utilized to some extent (Nwankwoala and Udom, 2011). The graphical plots of the ionic ratios vs. TDS were employed to study the ingress of seawater into coastal aquifers in this research (Nwankwoala and Udom 2011, Batayneh et al., 2014, Sridharan and Nathan, 2017). The ratios of HCO3
-
/Cl- in all the samples were greater than that of the seawater ratio of 0.0069 but as indicated in Fig 3a, the ratios tends towards seawater with increasing TDS signifying seawater intrusion. Na+/Cl- vs. TDS was tending to no

International Journal of Applied Science and Research
5 www.ijasr.org Copyright © 2019 IJASR All rights reserved
correlation (r = 0.04), an indication that both ions were co-existing during intrusive phase of seawater (Batayneh et al., 2014). However, the poor correlation of Na+/Ca2+ vs. TDS (Fig. 3b) is an indication of occurrence of Base ion exchange reactions in the coastal aquifer of the study area. Table 1. Chemical parameters of shallow groundwater of Igbokoda coastal area (after Talabi et al., 2018).
Code
Ca
(mg/L)
Mg
(mg/L)
Na
(mg/L)
K
(mg/L)
HCO3
(mg/L)
Cl
(mg/L)
SO4
(mg/L)
NO3
(mg/L)
PO4
(mg/L)
IGB-1 44.52 4.76 39.75 26.04 1.98 6.88 0.42 0 1.08
IGB-2 57.36 6.68 51.75 34.41 0.43 8.73 26.58 2.37 6.21
IGB-3 0.69 0.72 4.5 1.86 0.36 0.86 0.15 4.11 4.18
IGB-4 18.42 1.9 31.5 12.09 1.95 5.63 0.77 0 3.23
IGB-5 9.51 0.98 3.01 1.86 1.63 1.97 0.99 0 1.67
IGB-6 21.74 2.52 20.25 7.44 0.81 7.43 1.95 0.81 5.62
IGB-7 46.98 5.6 46.5 22.32 1.45 10.76 1.34 0 0.84
IGB-8 21.32 2.31 25.5 9.3 1.74 6.89 0.92 0 1.67
IGB-9 54.23 6.49 54.5 16.74 1.79 19.14 1.61 0 4.06
IGB-10 2.14 0.93 7.5 6.51 nil 1.26 0.73 2.06 3.11
IGB-11 31.62 3.33 6.75 8.37 1.18 11.28 2.03 0 5.85
IGB-12 44.47 4.52 29.25 16.74 1.44 15.11 1.68 0 3.23
IGB-13 2.07 0.86 12.11 8.37 nil 3.97 1.45 1.74 4.78
IGB-14 22.13 1.8 17.25 11.16 1.86 8.02 0.65 0 4.66
IGB-15 0.85 1.27 3.01 1.86 0.29 0.49 0.5 0.94 3.11
IGB-16 2.11 4.99 24.14 16.74 nil 10.14 3.33 3.72 4.9
IGB-17 0.47 0.78 4.5 0.93 nil 0.74 0.69 2.15 2.27
IGB-18 41.52 10.57 75.53 17.67 1.36 16.51 0.77 0 4.78
IGB-19 44.78 5.23 32.85 35.34 1.41 10.92 1.11 0 3.94
IGB-20 35.86 3.05 32.31 21.39 1.82 12.18 1.53 0 3.58
Min 0.47 0.72 3.01 0.93 0.29 0.49 0.15 0.00 0.84
Max 57.36 10.57 75.53 35.34 1.98 19.14 26.58 4.11 6.21
Mean 25.14 3.46 26.12 13.86 1.34 7.95 2.46 0.90 3.64

International Journal of Applied Science and Research
6 www.ijasr.org Copyright © 2019 IJASR All rights reserved
Median 21.94 2.79 24.82 11.63 1.45 7.73 1.05 0.00 3.76
Stdev 20.04 2.61 20.09 10.22 0.57 5.44 5.72 1.33 1.56
In addition, other ionic ratios (Mg2+/Cl-, K+/Cl-, Na+/Cl- and SO42-/Cl-) have negative correlations with TDS
indicating enhancement of Cl- i.e. decrease in ratio with increase in TDS. Ionic ratios evaluation revealed chloride enhanced groundwater in the study area. The Piper Diagram has been widely used to study the similarities and differences in the composition of waters and to classify them into certain chemical types. In this study, the Na+-Cl- type (85% of the groundwater samples) was in the saline enrichment zone an indication of saltwater intrusion into the coastal groundwater of the study area.
Fig. 2. (a) Na+K–Ca–Mg showing dominant cation and (b). HCO3–Cl–SO4 systems displaying dominant anion The Mixed Ca2+-Mg2+-Cl- was in the mixed zone, where types of groundwater cannot be identified as either anion or cation dominant (Todd and Mays, 2005). However, the Ca2+- Cl- (5%) belongs to the permanent hardness category wherein non-carbonate hardness exceeds 50 %, giving an indication of groundwater from active recharge zone with short residence time (Hounslow, 1995). The Piper diagram deciphered seawater intrusion into the coastal aquifer of the study area in addition to groundwater from active recharge zone with the exception of the non-dominant zone. Chadha diagram has all the advantages of the Piper diagram and can be used to study various hydrochemical processes including base cations exchange, cement pollution, mixing of natural waters, sulphate reduction, saline water etc (Chadha, 1999). The plotting of Chadha diagram always results into a square or rectangle depending on the size of scale chosen for X and Y co-ordinates. In order to define the primary character of water, the rectangular field is divided into eight sub-fields, each of which represents a water type as follows: i) Alkaline earths exceed alkali metals. ii) Alkali metals exceed alkaline earths. iii) Weak acid anions exceed strong acid anions iv) Strong acid anions exceed weak acid anions

International Journal of Applied Science and Research
7 www.ijasr.org Copyright © 2019 IJASR All rights reserved
Table 2. Calulated Ionic Ratios of Groundwater from Igbokoda Coastal Area.
Code HCO3-
/Cl-
Na+/Cl- Ca2+/Cl- Ca2+/Na+ Mg2+/Cl- K+/Cl- SO42-
/Cl-
Ca2+/Mg2+ TDS
(mg/L)
IGB-1 0.17 8.79 11.32 1.29 2.02 3.40 0.59 0.11 321.60
IGB-2 0.03 9.02 11.50 1.27 2.23 3.54 0.63 0.12 432.82
IGB-3 0.24 7.96 1.40 0.18 2.44 1.94 1.26 1.04 21.44
IGB-4 0.20 8.51 5.73 0.67 0.98 1.93 0.51 0.10 200.33
IGB-5 0.47 2.33 8.45 3.63 1.45 0.85 1.71 0.10 69.01
IGB-6 0.06 4.15 5.12 1.23 0.99 0.90 1.10 0.12 176.21
IGB-7 0.08 6.58 7.64 1.16 1.52 1.86 0.82 0.12 341.47
IGB-8 0.14 5.63 5.42 0.96 0.98 1.21 0.81 0.11 176.21
IGB-9 0.05 4.33 4.96 1.14 0.99 0.78 1.26 0.12 301.50
IGB-10 9.06 2.97 0.33 2.15 4.64 0.46 0.43 58.96
IGB-11 0.06 0.91 4.91 5.39 0.86 0.67 1.29 0.11 158.79
IGB-12 0.05 2.95 5.15 1.75 0.87 0.99 0.88 0.10 348.40
IGB-13 4.64 0.91 0.20 0.63 1.89 0.33 0.42 96.48
IGB-14 0.13 3.27 4.83 1.48 0.65 1.25 0.52 0.08 157.45
IGB-15 0.34 9.35 3.04 0.32 7.56 3.41 2.22 1.49 24.79
IGB-16 3.62 0.36 0.10 1.44 1.48 0.97 2.36 140.03
IGB-17 9.25 1.11 0.12 3.07 1.13 2.73 1.66 21.44
IGB-18 0.05 6.96 4.40 0.63 1.87 0.96 1.94 0.25 481.73
IGB-19 0.07 4.58 7.18 1.57 1.40 2.90 0.48 0.12 319.59
IGB-20 0.09 4.04 5.15 1.28 0.73 1.58 0.46 0.09 272.02
Min 0.03 0.91 0.36 0.10 0.63 0.67 0.33 0.08 21.44
Max 0.47 9.35 11.50 5.39 7.56 4.64 2.73 2.36 481.73
Mean 0.14 5.80 5.08 1.24 1.74 1.87 1.05 0.45 206.33
Median 0.08 5.14 5.04 1.15 1.42 1.53 0.85 0.12 176.21
Stdev 0.12 2.66 3.09 1.27 1.53 1.12 0.66 0.65 140.07

International Journal of Applied Science and Research
8 www.ijasr.org Copyright © 2019 IJASR All rights reserved
v) Alkaline earths and weak acid anions exceed both alkali metals and strong acidic anions respectively. Such water has temporary hardness. vi) Alkaline earths exceed alkali metals and strong acidic anions exceed weak acidic anions. Such water has permanent hardness and does not deposit sodium carbonate in irrigation. vii) Alkali metals exceed alkaline earths and strong acidic anions exceed weak acidic anions. Such water generally creates salinity problems both in irrigation and drinking uses. viii) Alkali metals exceed alkaline earths and weak acidic anions exceed strong acidic anions. Such waters deposit residual sodium carbonate in irrigation use and cause foaming problems. In the present research, the waters of the study area have been categorized into Na+-Cl- type (90%) and (Ca2+ -Mg2+ -Cl- type) (Fig. 5). The Na+-Cl- water type generally creates salinity problems both in irrigation and drinking uses. Excessive amounts of dissolved salts are detrimental to practically all water uses especially when it is as a result of seawater encroachment into the coastal area. Many strategic scientific approaches may be required to ameliorate salt effects on drinking and irrigation uses.
Fig.3. Plot of ionic ratios vs. TDS

International Journal of Applied Science and Research
9 www.ijasr.org Copyright © 2019 IJASR All rights reserved
As for drinking purpose, water softening and use of treatment plants can be adopted. However, for irrigation purpose, the following six methods have been suggested; keeping basin water level high, creating a fresh water ridge near sea, creating pumping trough or extraction barrier trough, developing artificial subsurface barriers, adopting rainwater harvesting technology and artificial recharging structures and implementing aquifer improvement plans (Maity et al., 2018). In addition to this listed suggestions, a comprehensive salinity management policy is necessary in Nigeria to address salinity issues that adversely impact water within its coastal environment. The remaining 10% fell into the zone of alkaline earths and weak acidic anions exceed both alkali metals and strong acidic anions respectively. The Ca2+ -Mg2+ -Cl- type signifying reverse ion exchange in the samples of the zone. Such water will have a permanent hardness (non-carbonate hardness exceeds 50 %) and does not deposit residual sodium carbonate in irrigation use.
Fig. 4. Piper Trilinear Diagram
In addition, the occurrence of this facies (Ca2+-Cl-) facies confirmed seawater intrusion as the facies is recognized as the clearest feature of the advance inland of the saline wedge, while the Na+-HCO3
- facies characterizes the freshening phase (Giménez-Forcada, 2010). The Chadha diagram without doubt confirmed the Piper diagram but was able to categorize the water into two major water types without the ambiguity of non dominant zone.
Fig. 5. Chadha (1999) Plot for groundwater of the study area
International Journal of Applied Science and Research
10 www.ijasr.org Copyright © 2019 IJASR All rights reserved
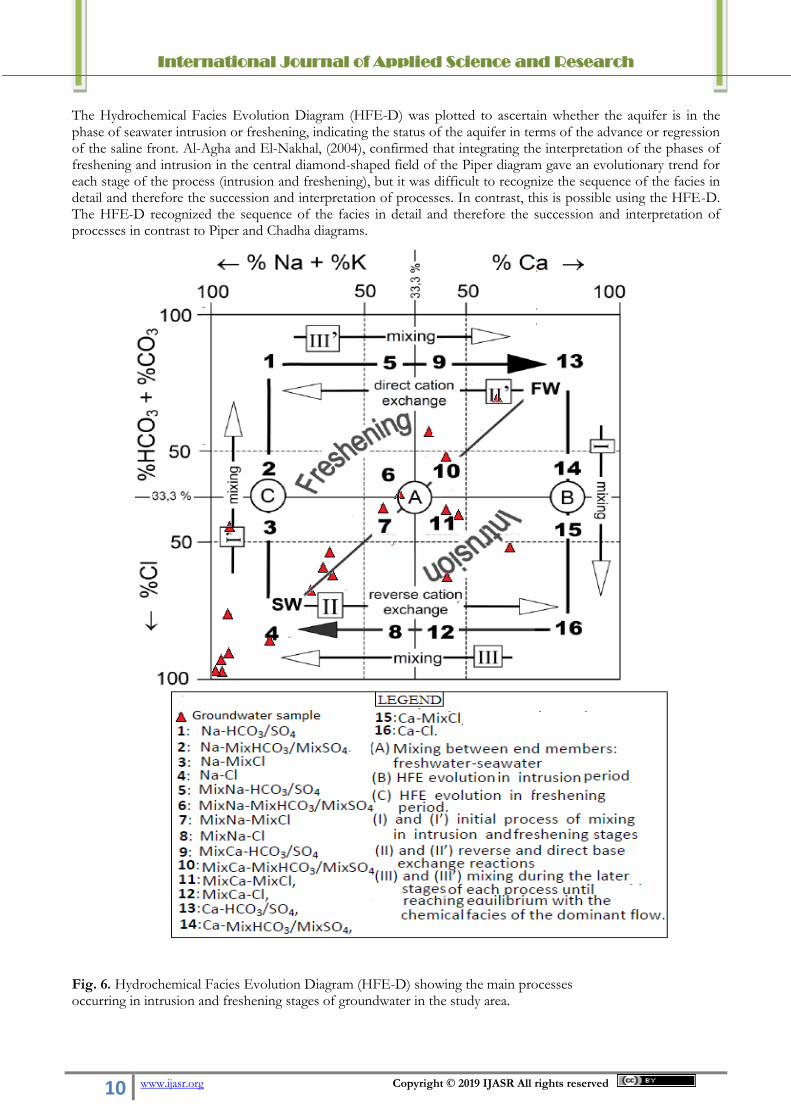
The Hydrochemical Facies Evolution Diagram (HFE-D) was plotted to ascertain whether the aquifer is in the phase of seawater intrusion or freshening, indicating the status of the aquifer in terms of the advance or regression of the saline front. Al-Agha and El-Nakhal, (2004), confirmed that integrating the interpretation of the phases of freshening and intrusion in the central diamond-shaped field of the Piper diagram gave an evolutionary trend for each stage of the process (intrusion and freshening), but it was difficult to recognize the sequence of the facies in detail and therefore the succession and interpretation of processes. In contrast, this is possible using the HFE-D. The HFE-D recognized the sequence of the facies in detail and therefore the succession and interpretation of processes in contrast to Piper and Chadha diagrams.
Fig. 6. Hydrochemical Facies Evolution Diagram (HFE-D) showing the main processes occurring in intrusion and freshening stages of groundwater in the study area.

International Journal of Applied Science and Research
11 www.ijasr.org Copyright © 2019 IJASR All rights reserved
5. Conclusion In the present investigation, hydrochemical techniques (ionic ratios, Piper Trilinear diagram, Chadha plot and HFE-D) have been used to discriminate the various hydrochemical facies in the coastal area of Igbokoda and the dynamic character of sea water intrusion. Ionic ratios of HCO3
-/Cl-, Na+/Cl-, Ca2+/Cl-, Ca2+/Na+, Mg2+/Cl-, K+/Cl- and SO4
2-/Cl- in meq/L were calculated and plotted against TDS showed the signature of seawater influx along the coastal aquifers of the study area. Ternary plot of Na+K–Ca–Mg and HCO3–Cl–SO4 revealed alkali metals as dominant cations while chloride dominated the anions. The Piper diagram revealed three groundwater facies; dominant Na+-Cl- type, Mixed Ca2+-Mg2+-Cl- type and Ca2+-Cl- type. The Chadha diagram revealed two main water facies; Na+ -Cl- type and Ca2+ -Mg2+ -Cl- type. The Chadha diagram confirmed the Piper diagram without the ambiguity of non dominant zone. The HFE-D confirmed seawater intrusion into the coastal area of Igbokoda indicating that majority of the groundwater samples were in the simple binary mixing zone with little or no intervention of Base Exchange reactions. The Piper and Chadha diagrams as well as the HFE-D showed evidence of seawater ingression of the coastal aquifer of the study area. However, the HFE-D recognized the sequence of the facies in detail and therefore the succession and interpretation of processes in contrast to Piper and Chadha diagrams. Acknowledgement I am grateful to Dr. Afolagboye, O.L. for proof reading of this manuscript. References
1. Adeyemo, I.A., Omosuyi, G.O. and Adelusi, A.O. (2017) Geoelectric Soundings for Delineation of Saline Water Intrusion into Aquifers in Part of Eastern Dahomey Basin, Nigeria. Earth & Environmental Sciences. Vol.5 No.3, pages 213-232.
2. Al-Agha, M.R. and El-Nakhal, H.A. (2004) Hydrochemical facies of groundwater in Gaza Strip,Palestine,
Hydrological Sciences -Bulletin - des Sciences Hydrologiques 49, no. 3: 359–371
3. Barbecot, F., Marlin, C., Gibert, E. and Dever, L. (2000) Hydrochemical and isotopic characterisation of the Bathonian and Bajocian coastal aquifer of the Caen area (northern France). Appl Geochem. 15(6):791–805. doi:10.1016/s0883-2927(99)00088-8
4. Batayneh. A., Zaman, H., Zumlot, T., Ghrefat, H., Mogren, S., Nazzal, Y. and Al-Taani, A., et al. (2014)
Hydrochemical facies and ionic ratios of the coastal groundwater aquifer of Saudi Gulf of Aqaba: implication for seawater intrusion. J Coastal Res 293:75–87. doi:10.2112/jcoastres-d-13-00021.1
5. Chadha’s, D.K. (1999) A proposed new diagram for geochemical classification of natural waters and
interpretation of chemical data. Hydrogeology Journal, 7: 431 – 439. DOI:10.1007/s100400050216.
6. Chirstopher, J.D. and Robert, R.R. (2005) Definition of hydrochemical facies in the New Zealand National groundwater monitoring programme, Journal of Hydrology, 44(2), 105-130.
7. Gajul, M.D., Mujawar,.K.C. and Prabhaka., P. (2017) Evaluation of Groundwater Quality in Balatira
Watershed, Atpadi Taluka, Sangli District, Maharashtra. International Journal of Engineering Science Invention(IJESI) Volume 6 Issue 12, PP. 06-13,
8. Giménez-Forcada, E. (2010). Dynamic of Seawater Interface using Hydrochemical Facies Evolution
Diagram (HFE-D). Groundwater 48, 2:212–216. DOI: 10.1111/j.1745-6584.2009.00649.x.
9. Hounslow, A.W. (1995) Water quality data: analysis and interpretation. CRC Lewis Publisher, New York, USA, p 396
10. Kim, J., Kim, R. and Chang, H. (2003) Hydrogeochemical characterization of major factors affecting
the quality of shallow groundwater in the coastal area at Kimje in South Korea. Environ Geol 44(4):478–489

International Journal of Applied Science and Research
12 www.ijasr.org Copyright © 2019 IJASR All rights reserved
11. Klemme, H.D. (1975) Geothermal Gradient Heat Flow and Hydrocarbon Recovery. In: Fischer, A.G.
and Judson, S., Eds., Petroleum and Global Tectonics, Princeton University Press, Princeton, 25-304.
12. Moujabber, M.E., Samra, B.B., Darwish, T. and Atallah. T. (2006) Comparison of different indicators for groundwater contamination by seawater intrusion on the Lebanese Coast. Water Resour Manage 20(2):161–180. doi:10.1007/s11269-006-7376-4
13. Nosrat. A. and Asghar, A.M. (2010) Assessment of Groundwater Quality and its Suitability for Drinking
and Agricultural Uses in the Oshnavieh Area, Northwest of Iran. Journal of Environmental Protection, Vol.1, pp. 30-40
14. Nur, A., Ishaku, J.M. and Yusuf, S.N. (2012) Groundwater Flow Patterns and Hydrochemical Facies
Distribution Using Geographical Information System (GIS) in Damaturu, Northeast Nigeria. International Journal of Geosciences, Vol. 3, 1096-1106 http://dx.doi.org/10.4236/ijg.2012.35111.
15. Nwankwoala, H. and Udom, G. (2011) Hydrochemical facie`s and ionic ratios of groundwater in Port
Harcourt, Southern Nigeria. Res J Chem Sci 1(3):87–101
16. Obaje, N.G. (2009) The Dahomey Basin. Geology and Mineral Resources of Nigeria pp 103-108.
17. Okosun, E.A. (1998) Review of the Early Tertiary Stratigraphy of Southwestern Nigeria. 18. Journal of Mining and Geology, 34, 27-35.
19. Oteri, A.U. and Atolagbe, F.P. (2003) Saltwater Intrusion into Coastal Aquifers in Nigeria. The Second
International Conference on Saltwater Intrusion and Coastal Aquifers — Monitoring, Modeling, and Management. Mérida, Yucatán, México, March 30 - April 2, 2003.
20. Piper. A.M. (1953) A graphic procedure in the chemical interpretation of water analysis. US Geological
Survey Groundwater Note 12.
21. Ravikumar, P. and Somashekar, R.K. (2017) Principal component analysis and hydrochemical facies characterization to evaluate groundwater quality in Varahi river basin, Karnataka state, India. Appl Water Sci 7:745–755 DOI 10.1007/s13201-015-0287-x.
22. Sanchez-Martos, F., Pulido-Bosch, A., Molina-Sanchez, L. and Vallejos, I.A. (2002) Identification of the
origin of salinization in groundwater using minor ions (Lower ANDARAX, Southeast. Spain), Science of the Total Environment, (29), 43-58.
23. Shahbazi, A. and Esmaeili-Sari, A. (2009) “Groundwater Quality Assessment in North of Iran: A case
Study of the Mazan-daran Province,” World Applied Sciences Journal, Vol. 5, 92-97.
24. Sridharan, M. and Nathan, D.S. (2017) Hydrochemical Facies and Ionic Exchange in Coastal Aquifers of Puducherry Region, India: Implications for Seawater Intrusion. Earth Syst Environ, 1:5. DOI 10.1007/s41748-017-0006-x
25. Talabi, A.O., Tijani, M.N. and Aladejana, A.J. (2012) Assessment of impact of climatic change on
groundwater quality around Igbokoda Coastal area, southwestern Nigeria. Journal of Environment and Earth Science. Vol 2, No.11, pages 39 – 49.
26. Talabi, A.O., Ajayi, C.A., Afolagboye, L O., Oyedele, A., Ojo, O. F. and Olofinlade, S.W. (2018)
Evaluation of Salt-water Intrusion in the Coastal Area of Igbokoda, Southwestern Nigeria. International Journal of Scientific Research and Management (IJSRM). Vol. 06901). Pages G-2018-01-08. DOI: 10.18535/ijsrm/v6i1.g01.

International Journal of Applied Science and Research
13 www.ijasr.org Copyright © 2019 IJASR All rights reserved
27. Talabi, A.O. 2018 Hydrochemistry and Water Quality Indices of River Ose Water, Southern Nigeria. Asian Journal of Applied Sciences (ISSN: 2321 – 0893) Volume 06 – Issue 03, page 119 – 130.
28. Todd, D.K. and Mays, L.W. (2005) Groundwater hydrology. Wiley, New York, p 636.
29. Whiteman, A.J. (1982) Nigeria: Its Petroleum Geology, Resources and Potential. Graham and Trottam,
London, 394. https://doi.org/10.1007/978-94-009-7361-9
30. Yousef, A.F., Saleem, A.A., Baraka A.M. and Aglan, O.S.H. (2009) “The Impact of Geological Setting on the Ground-water Occurrences in Some Wadis in Shlatein-Abu Ramad Area, SE Desert, Egypt,” European Water, Vol. 25-26, pp. 53-68.
31. Yuhr, L. and Benson, R.C. (1995) “Saltwater intrusion: concepts for measurements and a regional
characterization for Broward County, Florida” Proc. Symp. On the application of geophysics to engineering and environmental problems, 231 – 242, 1995.