international insurance fact book 2016 - iii · pdf file2016 international insurance fact book...
TRANSCRIPT

International Insurance Fact Book 2016
110 William StreetNew York, NY 10038212.346.5500www.iii.org


2016 International Insurance Fact Book updates at www.iii.org/international/ 1
In response to the globalization of the insurance business and the need for readily available data on world insurance, the Insurance Information Institute produces a Fact Book for international insurance statistics. We could not have undertaken this project without help from many organizations that collect international insurance data. We are especially grateful for the generous assistance of Axco Insurance Information Services (www.axcoinfo.com), a London-based insurance information service, and Swiss Re (www.swissre.com), which publishes the international research journal, sigma. The information included, which covers some 90 countries, comes from a variety of other sources as well. We have attempted to standardize the information as much as possible. We hope you find this Fact Book useful. Robert P. Hartwig, Ph.D., CPCU President Insurance Information Institute 110 William Street New York, NY 10038 212 346-5500 www.iii.org

2016 International Insurance Fact Book updates at www.iii.org/international/ 2
Axco Insurance Information Services is the leading supplier of global insurance and employee benefits market information. With over 40 years’ experience in researching and delivering insurance industry intelligence, Axco provides business-critical compliance and market data on no-life, life and benefits, personal accident, healthcare and employee benefits markets across the globe. Axco’s unique business model and methods of research have developed an extensive suite of products comprising in-depth reports, focused profiles, Q&A databases, intelligent questioning tools, and email services. Axco products are delivered to every corner of the globe and Axco is committed to continually improving its technical capabilities, enhancing existing products in both content and design, and developing new and innovative methods of information delivery. From Argentina to Zambia, Axco secures information on a market by market basis to deliver the most accurate, relevant and up-to-date information available to its client base of the world’s foremost insurers, reinsurers, brokers, risk managers, catastrophe modellers and employee benefits specialists. For further information see www.axcoinfo.com.
Swiss Re is one of the world's leading reinsurers, operating through more than 70 offices in over 30 countries. The company has been in the reinsurance business since its foundation in Zurich, Switzerland, in 1863. Through its three business groups Property & Casualty, Life & Health and Financial Services, Swiss Re offers a wide variety of products to manage capital and risk. Traditional reinsurance products, including a broad range of property and casualty as well as life and health covers and related services, are complemented by insurance-based corporate finance solutions and supplementary services for comprehensive risk management. For further information see www.swissre.com.

2016 International Insurance Fact Book updates at www.iii.org/international/ 3
World Overview WORLD LIFE AND NONLIFE INSURANCE IN 2014
Outside the United States, the insurance industry is divided into life and nonlife, or general insurance, rather than life/health and property/casualty. World insurance premiums rose 3.7 percent in 2014, adjusted for inflation, after stagnating in 2013, according to Swiss Re’s latest study of world insurance. Nonlife premiums rose 2.9 percent in 2014, adjusted for inflation, following 2.7 percent growth in 2013. Life insurance premiums grew by 4.3 percent after inflation in 2014, after having fallen 1.8 percent in 2013, adjusted for inflation.
In 2014 life and nonlife insurance premiums (excluding cross-border business) accounted for 6.2 percent of world gross domestic product (GDP). Premiums accounted for 18.9 percent of GDP in Taiwan, the highest share in the Swiss Re study, followed by 14.2 percent in Hong Kong, 14.0 percent in South Africa, 11.3 percent in South Korea and 11.0 percent in the Netherlands. Premiums represented 7.3 percent of GDP in the United States, the 16th highest share in the study.
WORLD LIFE AND NONLIFE INSURANCE DIRECT PREMIUMS WRITTEN, 2012-2014 (1) (U.S. $ millions)
Year Life Nonlife (2) Total
2012 $2,624,993 $1,976,336 $4,601,329
2013 2,545,045 2,048,587 4,593,632
2014 2,654,549 2,123,699 4,778,248
(1) Before reinsurance transactions. (2) Includes accident and health insurance.
Source: Swiss Re, sigma, No. 4/2015.
TOP 10 COUNTRIES BY LIFE AND NONLIFE DIRECT PREMIUMS WRITTEN, 2014 (1)
(U.S. $ millions)
Total premiums
Rank Country Life
premiums Nonlife
premiums (2) Amount
Percent change from prior year
Percent of total world premiums
1 United States (3), (4) $528,221 $752,222 $1,280,443 2.1% 26.80%
2 Japan (5), (6) 371,588 108,174 479,762 -3.7 10.04
3 United Kingdom (5) 235,321 115,945 351,266 7.9 7.35
4 P.R. China (7) 176,950 151,490 328,439 17.3 6.90
5 France (8) 172,761 97,759 270,520 5.1 5.66
6 Germany (7) 118,475 136,170 254,644 2.8 5.33
7 Italy (9) 145,292 49,443 194,735 15.3 4.08
8 South Korea (6) 101,572 57,943 159,515 9.4 3.34
9 Canada (10), (11) 52,138 73,235 125,373 -2.0 2.62
10 Netherlands (5) 21,855 74,100 95,956 -3.5 2.01
(1) Before reinsurance transactions.
(2) Includes accident and health insurance.
(3) Nonlife premiums include state funds; life premiums include an estimate of group pension business.
(4) Life premiums are estimated.

2016 International Insurance Fact Book updates at www.iii.org/international/ 4
(5) Estimated.
(6) April 1, 2014 to March 31, 2015.
(7) Provisional.
(8) Life premiums are provisional; nonlife premiums are estimated.
(9) Nonlife premiums are estimated.
(10) Life premiums are net premiums.
(11) Life premiums are estimated; nonlife premiums are provisional.
Source: Swiss Re, sigma, No. 4/2015.
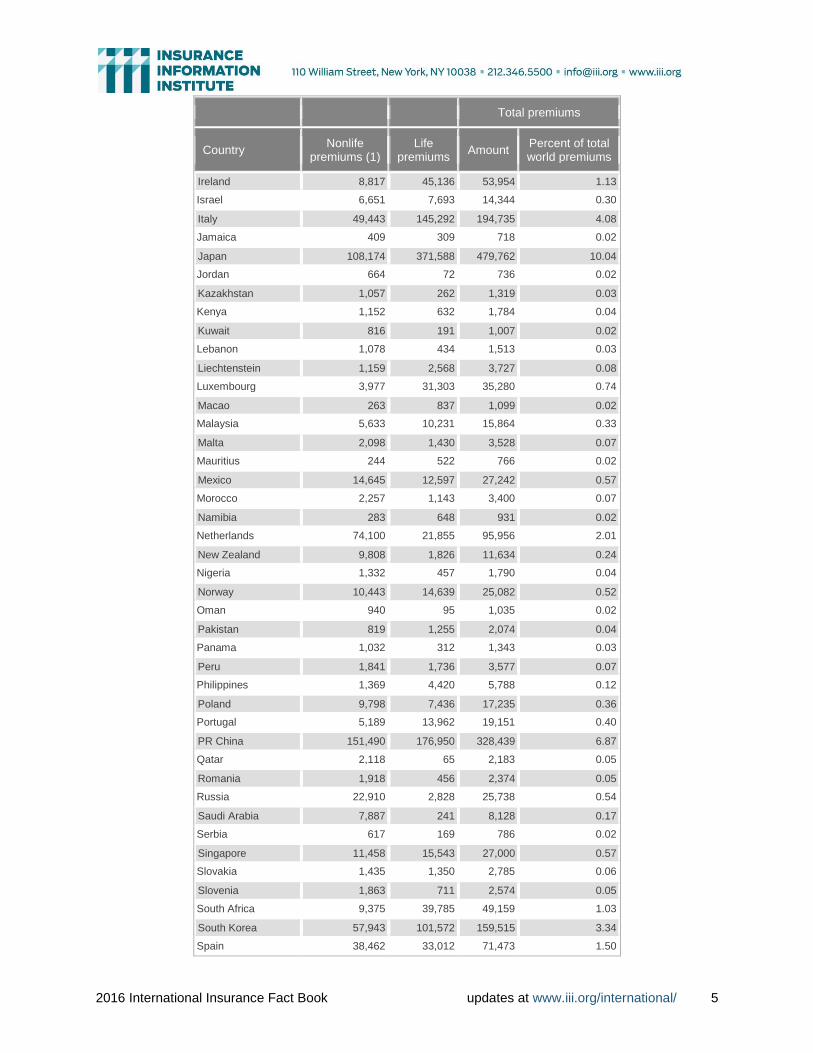
LIFE AND NONLIFE INSURANCE PREMIUMS, 2014
(Direct premiums written, U.S. $ millions)
Total premiums
Country Nonlife
premiums (1) Life
premiums Amount
Percent of total world premiums
Algeria $1,492 $106 $1,597 0.03%
Angola 1,110 31 1,142 0.02
Argentina 12,847 2,998 15,845 0.33
Australia 31,924 56,151 88,075 1.84
Austria 13,820 8,974 22,794 0.48
Bahamas 563 161 724 0.02
Bangladesh 349 966 1,315 0.03
Belgium 16,549 22,839 39,388 0.82
Brazil 40,464 44,980 85,444 1.79
Bulgaria 983 196 1,180 0.02
Canada 73,235 52,138 125,373 2.62
Chile 4,513 6,401 10,915 0.23
Colombia 6,649 2,861 9,510 0.20
Costa Rica 1,014 142 1,156 0.02
Croatia 1,034 460 1,494 0.03
Cyprus 562 419 981 0.02
Czech Republic 4,174 3,429 7,603 0.16
Denmark 11,378 22,931 34,308 0.72
Dominican Republic 576 188 763 0.02
Ecuador 1,427 276 1,703 0.04
Egypt 1,079 888 1,968 0.04
Finland 5,569 24,055 29,625 0.62
France 97,759 172,761 270,520 5.66
Germany 136,170 118,475 254,644 5.33
Greece 2,893 2,376 5,268 0.11
Guatemala 671 165 835 0.02
Hong Kong 4,182 36,856 41,038 0.86
Hungary 1,536 1,953 3,488 0.07
India 14,590 55,299 69,889 1.46
Indonesia 5,148 10,159 15,307 0.32
Iran 6,737 721 7,458 0.16
2016 International Insurance Fact Book updates at www.iii.org/international/ 5
Total premiums
Country Nonlife
premiums (1) Life
premiums Amount
Percent of total world premiums
Ireland 8,817 45,136 53,954 1.13
Israel 6,651 7,693 14,344 0.30
Italy 49,443 145,292 194,735 4.08
Jamaica 409 309 718 0.02
Japan 108,174 371,588 479,762 10.04
Jordan 664 72 736 0.02
Kazakhstan 1,057 262 1,319 0.03
Kenya 1,152 632 1,784 0.04
Kuwait 816 191 1,007 0.02
Lebanon 1,078 434 1,513 0.03
Liechtenstein 1,159 2,568 3,727 0.08
Luxembourg 3,977 31,303 35,280 0.74
Macao 263 837 1,099 0.02
Malaysia 5,633 10,231 15,864 0.33
Malta 2,098 1,430 3,528 0.07
Mauritius 244 522 766 0.02
Mexico 14,645 12,597 27,242 0.57
Morocco 2,257 1,143 3,400 0.07
Namibia 283 648 931 0.02
Netherlands 74,100 21,855 95,956 2.01
New Zealand 9,808 1,826 11,634 0.24
Nigeria 1,332 457 1,790 0.04
Norway 10,443 14,639 25,082 0.52
Oman 940 95 1,035 0.02
Pakistan 819 1,255 2,074 0.04
Panama 1,032 312 1,343 0.03
Peru 1,841 1,736 3,577 0.07
Philippines 1,369 4,420 5,788 0.12
Poland 9,798 7,436 17,235 0.36
Portugal 5,189 13,962 19,151 0.40
PR China 151,490 176,950 328,439 6.87
Qatar 2,118 65 2,183 0.05
Romania 1,918 456 2,374 0.05
Russia 22,910 2,828 25,738 0.54
Saudi Arabia 7,887 241 8,128 0.17
Serbia 617 169 786 0.02
Singapore 11,458 15,543 27,000 0.57
Slovakia 1,435 1,350 2,785 0.06
Slovenia 1,863 711 2,574 0.05
South Africa 9,375 39,785 49,159 1.03
South Korea 57,943 101,572 159,515 3.34
Spain 38,462 33,012 71,473 1.50

2016 International Insurance Fact Book updates at www.iii.org/international/ 6
Total premiums
Country Nonlife
premiums (1) Life
premiums Amount
Percent of total world premiums
Sri Lanka 485 366 850 0.02
Sweden 10,556 28,179 38,735 0.81
Switzerland 29,117 36,094 65,211 1.36
Taiwan 16,466 79,156 95,622 2.00
Thailand 8,400 13,297 21,696 0.45
Trinidad and Tobago 632 455 1,087 0.02
Tunisia 748 141 888 0.02
Turkey 10,119 1,476 11,595 0.24
Ukraine 2,068 181 2,249 0.05
United Arab Emirates 6,905 2,200 9,106 0.19
United Kingdom 115,945 235,321 351,266 7.35
United States 752,222 528,221 1,280,443 26.80
Uruguay 854 343 1,197 0.03
Venezuela 21,937 727 22,665 0.47
Vietnam 1,293 1,290 2,582 0.05
Other 11,992 3,184 15,176 0.32
World $2,123,699 $2,654,549 $4,778,246 100.00%
(1) Includes accident and health insurance. Source: Swiss Re, sigma, No. 4/2015.
POPULATION BY COUNTRY, 2014
Country Population (1) Rank
Afghanistan 31,822,848 40
Algeria 38,813,722 33
Angola 19,088,106 58
Argentina 43,024,374 32
Australia 22,507,617 55
Austria 8,223,062 94
Azerbaijan 9,686,210 91
Bangladesh 166,280,712 8
Belarus 9,608,058 92
Belgium 10,449,361 83
Benin 10,160,556 87
Bolivia 10,631,486 81
Brazil 202,656,788 5
Burkina Faso 18,365,123 59
Burma 55,746,253 24
Burundi 10,395,931 85

2016 International Insurance Fact Book updates at www.iii.org/international/ 7
Country Population (1) Rank
Cambodia 15,458,332 68
Cameroon 23,130,708 53
Canada 34,834,841 37
Chad 11,412,107 76
Chile 17,363,894 64
China 1,355,692,576 1
Colombia 46,245,297 29
Congo, Democratic Republic of the 77,433,744 19
Cote d'Ivoire 22,848,945 54
Cuba 11,047,251 77
Czech Republic 10,627,448 82
Dominican Republic 10,349,741 86
Ecuador 15,654,411 67
Egypt 86,895,099 15
Ethiopia 96,633,458 13
France 66,259,012 21
Germany 80,996,685 17
Ghana 25,758,108 48
Greece 10,775,557 80
Guatemala 14,647,083 69
Guinea 11,474,383 75
Haiti 9,996,731 88
Honduras 8,598,561 93
Hungary 9,919,128 89
India 1,236,344,631 2
Indonesia 253,609,643 4
Iran 80,840,713 18
Iraq 32,585,692 39
Israel 7,821,850 98
Italy 61,680,122 23
Japan 127,103,388 10
Jordan 7,930,491 97
Kazakhstan 17,948,816 61
Kenya 45,010,056 30
Korea, North 24,851,627 49
Korea, South 49,039,986 26
Madagascar 23,201,926 52
Malawi 17,377,468 63
Malaysia 30,073,353 43
Mali 16,455,903 66
Mexico 120,286,655 11

2016 International Insurance Fact Book updates at www.iii.org/international/ 8
Country Population (1) Rank
Morocco 32,987,206 38
Mozambique 24,692,144 50
Nepal 30,986,975 41
Netherlands 16,877,351 65
Niger 17,466,172 62
Nigeria 177,155,754 7
Pakistan 196,174,380 6
Peru 30,147,935 42
Philippines 107,668,231 12
Poland 38,346,279 34
Portugal 10,813,834 79
Romania 21,729,871 57
Russia 142,470,272 9
Rwanda 12,337,138 73
Saudi Arabia 27,345,986 46
Senegal 13,635,927 72
Serbia 7,209,764 100
Somalia 10,428,043 84
South Africa 48,375,645 27
South Sudan 11,562,695 74
Spain 47,737,941 28
Sri Lanka 21,866,445 56
Sudan 35,482,233 36
Sweden 9,723,809 90
Switzerland 8,061,516 95
Syria 17,951,639 60
Taiwan 23,359,928 51
Tajikistan 8,051,512 96
Tanzania 49,639,138 25
Thailand 67,741,401 20
Togo 7,351,374 99
Tunisia 10,937,521 78
Turkey 81,619,392 16
Uganda 35,918,915 35
Ukraine 44,291,413 31
United Kingdom 63,742,977 22
United States 318,892,103 3
Uzbekistan 28,929,716 44
Venezuela 28,868,486 45
Vietnam 93,421,835 14

2016 International Insurance Fact Book updates at www.iii.org/international/ 9
Country Population (1) Rank
Yemen 26,052,966 47
Zambia 14,638,505 70
Zimbabwe 13,771,721 71
(1) Estimate for July 2014. Includes the 100 largest countries. Source: U.S. Central Intelligence Agency.
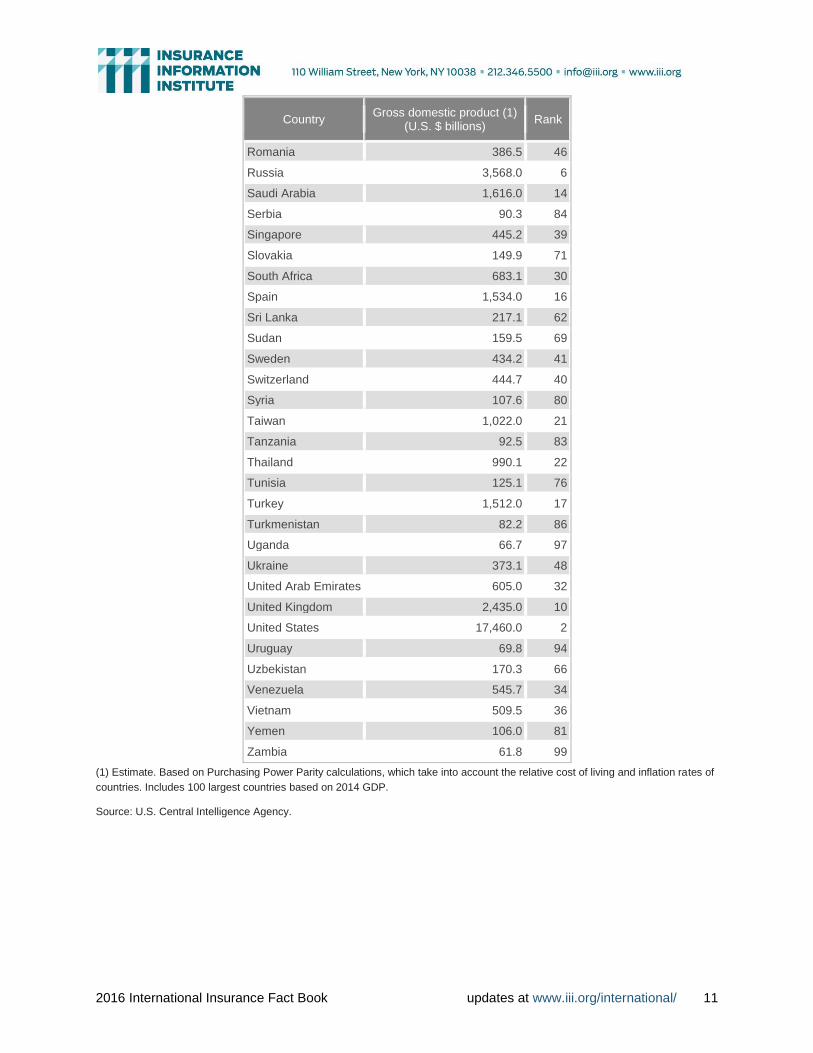
GROSS DOMESTIC PRODUCT BY COUNTRY, 2014
Country Gross domestic product (1)
(U.S. $ billions) Rank
Afghanistan $61.7 100
Algeria 552.6 33
Angola 175.5 64
Argentina 927.4 25
Australia 1,100.0 19
Austria 386.9 45
Azerbaijan 168.4 67
Bangladesh 535.6 35
Belarus 171.2 65
Belgium 467.1 38
Bolivia 70.4 93
Brazil 3,073.0 7
Bulgaria 123.3 77
Burma 244.3 58
Cameroon 67.2 95
Canada 1,579.0 15
Chile 410.3 43
China 17,630.0 1
Colombia 642.7 31
Costa Rica 71.2 92
Cote D'ivoire 72.0 91
Croatia 87.3 85
Cuba 128.5 75
Czech Republic 299.7 51
Denmark 248.7 57
Dominican Republic 135.7 73
Ecuador 182.0 63
Egypt 945.4 23
Ethiopia 139.4 72
Finland 221.5 61
France 2,587.0 8

2016 International Insurance Fact Book updates at www.iii.org/international/ 10
Country Gross domestic product (1)
(U.S. $ billions) Rank
Germany 3,621.0 5
Ghana 109.4 79
Greece 284.3 52
Guatemala 118.7 78
Hong Kong 400.6 44
Hungary 239.9 59
India 7,277.0 3
Indonesia 2,554.0 9
Iran 1,284.0 18
Iraq 505.4 37
Ireland 224.7 60
Israel 268.3 55
Italy 2,066.0 12
Japan 4,807.0 4
Jordan 79.8 88
Kazakhstan 420.6 42
Kenya 134.7 74
Korea, south 1,786.0 13
Kuwait 283.9 53
Lebanon 80.5 87
Libya 103.3 82
Lithuania 79.0 89
Malaysia 746.8 28
Mexico 2,143.0 11
Morocco 254.4 56
Nepal 66.9 96
Netherlands 798.1 27
New Zealand 158.7 70
Nigeria 1,058.0 20
Norway 339.5 49
Oman 163.6 68
Pakistan 884.2 26
Panama 77.0 90
Peru 376.7 47
Philippines 694.6 29
Poland 941.4 24
Portugal 276.0 54
Puerto Rico 64.8 98
Qatar 323.2 50
2016 International Insurance Fact Book updates at www.iii.org/international/ 11
Country Gross domestic product (1)
(U.S. $ billions) Rank
Romania 386.5 46
Russia 3,568.0 6
Saudi Arabia 1,616.0 14
Serbia 90.3 84
Singapore 445.2 39
Slovakia 149.9 71
South Africa 683.1 30
Spain 1,534.0 16
Sri Lanka 217.1 62
Sudan 159.5 69
Sweden 434.2 41
Switzerland 444.7 40
Syria 107.6 80
Taiwan 1,022.0 21
Tanzania 92.5 83
Thailand 990.1 22
Tunisia 125.1 76
Turkey 1,512.0 17
Turkmenistan 82.2 86
Uganda 66.7 97
Ukraine 373.1 48
United Arab Emirates 605.0 32
United Kingdom 2,435.0 10
United States 17,460.0 2
Uruguay 69.8 94
Uzbekistan 170.3 66
Venezuela 545.7 34
Vietnam 509.5 36
Yemen 106.0 81
Zambia 61.8 99
(1) Estimate. Based on Purchasing Power Parity calculations, which take into account the relative cost of living and inflation rates of
countries. Includes 100 largest countries based on 2014 GDP. Source: U.S. Central Intelligence Agency.
2016 International Insurance Fact Book updates at www.iii.org/international/ 12
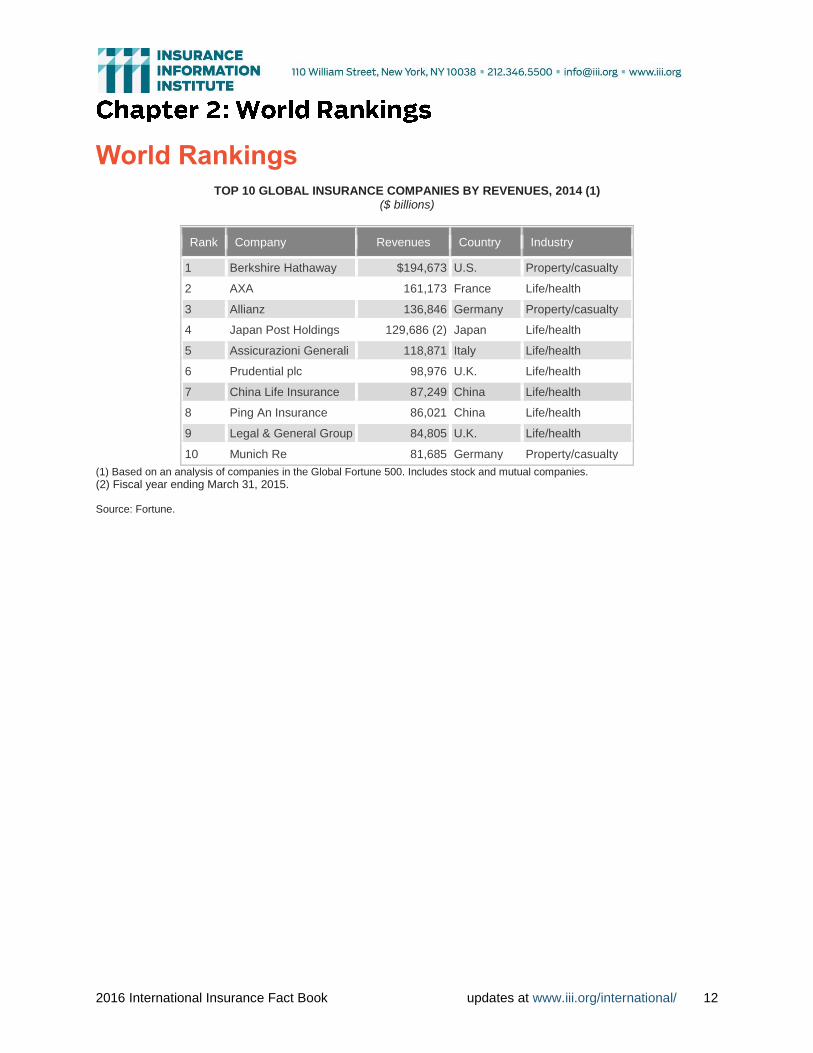
World Rankings
TOP 10 GLOBAL INSURANCE COMPANIES BY REVENUES, 2014 (1) ($ billions)
Rank Company Revenues Country Industry
1 Berkshire Hathaway $194,673 U.S. Property/casualty
2 AXA 161,173 France Life/health
3 Allianz 136,846 Germany Property/casualty
4 Japan Post Holdings 129,686 (2) Japan Life/health
5 Assicurazioni Generali 118,871 Italy Life/health
6 Prudential plc 98,976 U.K. Life/health
7 China Life Insurance 87,249 China Life/health
8 Ping An Insurance 86,021 China Life/health
9 Legal & General Group 84,805 U.K. Life/health
10 Munich Re 81,685 Germany Property/casualty
(1) Based on an analysis of companies in the Global Fortune 500. Includes stock and mutual companies.
(2) Fiscal year ending March 31, 2015. Source: Fortune.

2016 International Insurance Fact Book updates at www.iii.org/international/ 13
THE 20 MOST COSTLY WORLD INSURANCE LOSSES, 2014 (1)
($ millions)
Rank Date Country Event Insured loss in U.S. dollars
1 May 18 U.S. Severe thunderstorms, large hail $2,935
2 Feb. 8 Japan Snow storm 2,502
3 Jun. 8 France, Germany, Belgium
Wind and hailstorm Ela 2,190
4 Sep. 14 Mexico Hurricane Odile 1,700
5 Jan. 5 U.S. Winter storm 1,669
6 Jun. 3 U.S. Severe thunderstorms, large hail, tornadoes
1,269
7 Apr. 27 U.S. Thunderstorms, large hail, 83 tornadoes, severe flash floods
1,220
8 Apr. 2 U.S. Severe storms, large hail, tornadoes 1,084
9 Jun. 15 Russia Major fire and explosion at oil refinery
NA
10 Sep. 27 U.S. Thunderstorms with winds up to 67 miles per hour, hail, flash floods
905
11 Nov. 30 Australia Hailstorm 852
12 Apr. 12 U.S. Thunderstorms, large hail, tornadoes 678
13 Jul. 7 U.S. Fire at petrochemical plant NA
14 May 10 U.S. Thunderstorms, hail, tornadoes, flash floods
635
15 Oct. 12 India Cyclone Hudhud 632
16 Mar. 27 U.S. Thunderstorms, winds up to 80 miles per hour, large hail, tornadoes
592
17 Jun. 14 U.S. Thunderstorms, more than 100 tornadoes, hail
545
18 Aug. 11 U.S. Torrential rains trigger severe floods 539
19 Jul. 13 Libyan Arab Jamahiriya
Fighting at airport destroys aircrafts NA
20 Jan. 1 U.K. Floods 530
(1) Property and business interruption losses, excluding life and liability losses. Includes flood losses in the U.S. insured via the
National Flood Insurance Program. Loss data shown here may differ from figures shown elsewhere for the same event due to
differences in the date of publication, the geographical area covered and other criteria used by organizations collecting the data.
NA=Data not available.
Source: Swiss Re, sigma, No. 2/2015; Property Claim Services (PCS), a Verisk Analytics business, insured losses for natural
catastrophes in the United States.

2016 International Insurance Fact Book updates at www.iii.org/international/ 14
THE 10 MOST COSTLY WORLD INSURANCE LOSSES, 1970-2014 (1)
(2014 $ millions)
Rank Date Country Event Insured loss
1 Aug. 25, 2005 U.S., Gulf of Mexico, Bahamas Hurricane Katrina, storm surge, damage to oil rigs
$78,638
2 Mar. 11, 2011 Japan Earthquake (Mw 9.0) triggers tsunami
36,828
3 Oct. 24, 2012 U.S., Caribbean Hurricane Sandy, massive storm surge
36,079
4 Aug. 23, 1992 U.S., Bahamas Hurricane Andrew, floods 26,990
5 Sep. 11, 2001 U.S. Terror attacks on WTC, Pentagon and other buildings
25,104
6 Jan. 17, 1994 U.S. Northridge earthquake (M 6.6) 22,355
7 Sep. 6, 2008 U.S., Gulf of Mexico, Caribbean, et al. Hurricane Ike 22,258
8 Feb. 22, 2011 New Zealand Earthquake (Mw 6.3), aftershocks 16,836
9 Sep. 2, 2004 U.S., Caribbean; Barbados, et al. Hurricane Ivan, damage to oil rigs 16,157
10 Jul. 27, 2011 Thailand Floods caused by heavy monsoon rains
15,783
(1) Property and business interruption losses, excluding life and liability losses. Includes flood losses in the United States insured via
the National Flood Insurance Program. Adjusted to 2014 dollars by Swiss Re.
Note: Loss data shown here may differ from figures shown elsewhere for the same event due to differences in the date of
publication, the geographical area covered and other criteria used by organizations collecting the data.
Source: Swiss Re, sigma, No. 2/2015.

2016 International Insurance Fact Book updates at www.iii.org/international/ 15
Country Profiles The country profiles that follow provide information on population, gross domestic product, insurance premiums and leading insurers.

2016 International Insurance Fact Book updates at www.iii.org/international/ 16
Algeria
LEADING NONLIFE INSURANCE COMPANIES, 2013
Gross written premiums
Company DZD Mn USD Mn
SAA 25,759.0 324.6
CAAT 18,114.0 228.2
CAAR 15,198.0 191.5
CASH 9,720.0 122.5
CNMA 9,593.0 120.9
CIAR 7,585.0 95.6
Alliance 4,150.0 52.3
2A 4,057.0 51.1
Salama 4,015.0 50.6
GAM 3,303.0 41.6
Source: Axco Insurance Information Services.
LEADING LIFE INSURANCE COMPANIES, 2013
Source: Axco Insurance Information Services.
Gross written premiums
Company DZD Mn USD Mn
CAARAMA 1,929.0 24.3
TALA 1,327.0 16.7
Cardif el Djazair 1,208.0 15.2
SAPS 1,199.0 15.1
Macir Vie 1,131.0 14.3
AXA Algerie Assurances Vie
769 9.7
Le Mutualiste 606 7.6
INSURANCE ASSOCIATION
Le Conseil National des Assurances Web: www.cna.dz
POPULATION, 2011-2014 (1)
Year Population
2011 34,994,937
2012 35,406,303
2013 38,087,812
2014 38,813,722
(1) Estimated. Source: U.S. Central Intelligence Agency.
GROSS DOMESTIC PRODUCT, 2009-2014 (1)
(U.S. $ billions)
Year GDP
2010 $244.3
2011 254.7
2012 264.1
2013 284.7
2014 552.6
(1) Based on Purchasing Power Parity calculations, which take into account the relative cost of living and inflation rates of countries. GDP estimate for July for each year shown. Source: U.S. Central Intelligence Agency.
LIFE AND NONLIFE INSURANCE PREMIUMS, 2014
(U.S. $ millions)
Direct premiums written
Nonlife premiums (1) $1,492
Life premiums 106
Total premiums $1,597
Percent of total world premiums
0.03%
(1) Includes accident and health insurance. Source: Swiss Re, sigma, No. 4/2015.

2016 International Insurance Fact Book updates at www.iii.org/international/ 17
Angola
LEADING NONLIFE AND LIFE INSURANCE
COMPANIES, 2013 (1)
Gross written premiums
Company AOA Mn USD Mn
ENSA 37,567.8 389.2
AAA Seguros 22,830.3 236.5
GA 20,583.6 213.3
Global Seguros 5,682.3 58.9
NOSSA 4,230.1 43.8
A Mundial Seguros 3,882.0 40.2
Garantia 1,460.5 15.1
Tranquilidade 1,165.3 12.1
Triunfal Seguros 166.1 1.7
Confiança 37.8 0.4
(1) Includes life and nonlife. Source: Axco Insurance Information Services.
INSURANCE ASSOCIATION
Institute of Insurance Supervision Web: www.iss.gv.ao/
POPULATION, 2011-2014 (1)
Year Population
2011 13,338,541
2012 18,056,072
2013 18,565,269
2014 19,088,106
(1) Estimated. Source: U.S. Central Intelligence Agency.
GROSS DOMESTIC PRODUCT, 2010-2014 (1) (U.S. $ billions)
Year GDP
2010 NA
2011 NA
2012 $115.9
2013 131.8
2014 175.5
(1) Based on Purchasing Power Parity calculations, which take into account the relative cost of living and inflation rates of countries. GDP estimate for July for each year shown. NA=Data not available. Source: U.S. Central Intelligence Agency.
LIFE AND NONLIFE INSURANCE PREMIUMS, 2014
(U.S. $ millions)
Direct premiums written
Nonlife premiums (1) $1,492
Life premiums 106
Total premiums $1,597
Percent of total world premiums
0.03%
(1) Includes accident and health insurance. Source: Swiss Re, sigma, No. 4/2015.

2016 International Insurance Fact Book updates at www.iii.org/international/ 18
Argentina
LEADING NONLIFE INSURANCE COMPANIES, 2014
Gross written premiums
Company ARS Mn USD Mn
Federacion Patronal 5,992.5 740.7
Prevencion Art 5,521.5 682.5
Caja de Seguros 5,083.6 628.4
Provincia Art 4,036.2 498.9
Galeno Art 3,960.0 489.5
Sancor 3,945.2 487.7
San Cristobal 3,073.6 379.9
QBE La Buenos Aires 2,861.0 353.7
Asociart Art 2,798.0 345.9
Allianz Argentina 2,771.7 342.6
Source: Axco Insurance Information Services.
LEADING LIFE INSURANCE COMPANIES, 2014
Gross written premiums
Company ARS Mn USD Mn
Estrella Retiro 1,149.7 208.7
Metlife Seg de Vida 1,432.0 173.8
Cardif Seguros 1,342.5 162.9
Caja Seguros 1,218.3 147.9
Nacion Seguros 1,044.1 126.7
Galicia Seguros 1,020.8 123.9
Sancor 981.2 119.1
Provincia 778.7 94.5
Zurich Life 741.8 90.0
BBVA Seguros 673.3 81.7
Source: Axco Insurance Information Services.
INSURANCE ASSOCIATION
Asociacion Argentina de Companias de Seguros Web: www.aacs.org.ar
POPULATION, 2011-2014 (1)
Year Population
2011 41,769,726
2012 42,192,494
2013 42,610,981
2014 43,024,374
(1) Estimated. Source: U.S. Central Intelligence Agency.
GROSS DOMESTIC PRODUCT, 2010-2014 (1) (U.S. $ billions)
Year GDP
2010 $558.0
2011 596.0
2012 709.7
2013 771.0
2014 927.4
(1) Based on Purchasing Power Parity calculations, which take into account the relative cost of living and inflation rates of countries. GDP estimate for July for each year shown. Source: U.S. Central Intelligence Agency. LIFE AND NONLIFE INSURANCE PREMIUMS, 2014
(U.S. $ millions)
Direct premiums written
Nonlife premiums (1) $12,847
Life premiums 2,998
Total premiums $15,845
Percent of total world premiums
0.33%
(1) Includes accident and health insurance. Source: Swiss Re, sigma, No. 4/2015.
2016 International Insurance Fact Book updates at www.iii.org/international/ 19
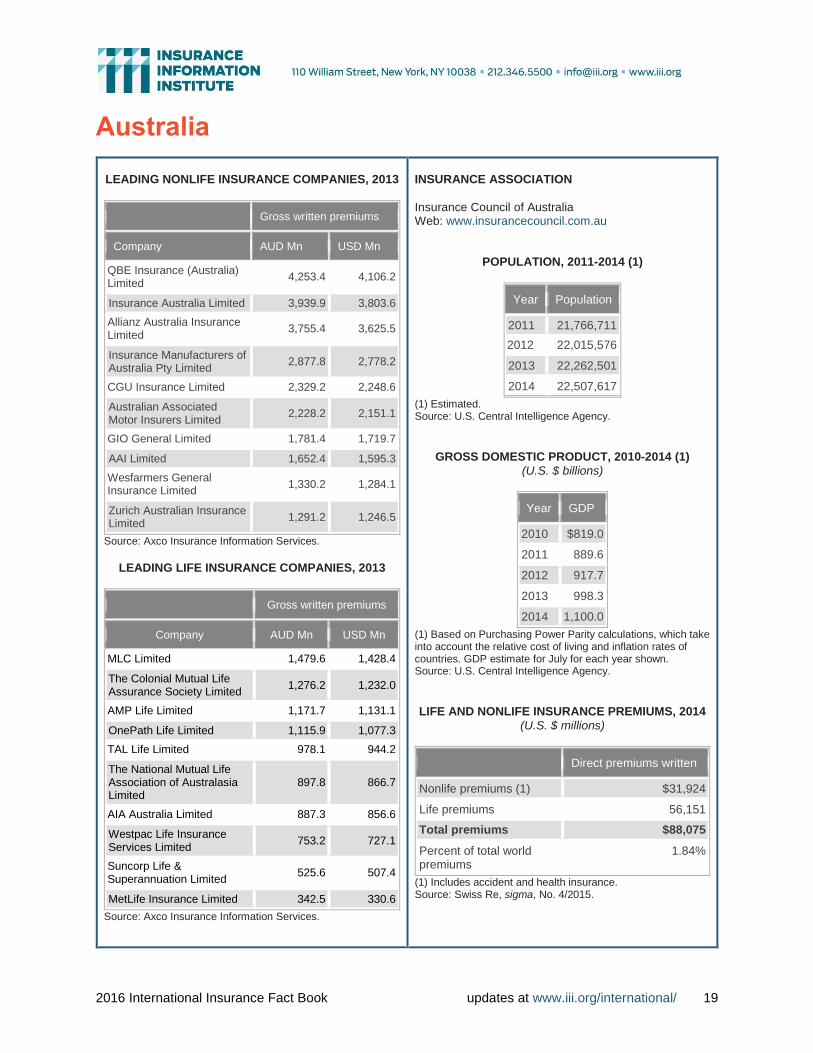
Australia
LEADING NONLIFE INSURANCE COMPANIES, 2013
Gross written premiums
Company AUD Mn USD Mn
QBE Insurance (Australia) Limited
4,253.4 4,106.2
Insurance Australia Limited 3,939.9 3,803.6
Allianz Australia Insurance Limited
3,755.4 3,625.5
Insurance Manufacturers of Australia Pty Limited
2,877.8 2,778.2
CGU Insurance Limited 2,329.2 2,248.6
Australian Associated Motor Insurers Limited
2,228.2 2,151.1
GIO General Limited 1,781.4 1,719.7
AAI Limited 1,652.4 1,595.3
Wesfarmers General Insurance Limited
1,330.2 1,284.1
Zurich Australian Insurance Limited
1,291.2 1,246.5
Source: Axco Insurance Information Services.
LEADING LIFE INSURANCE COMPANIES, 2013
Gross written premiums
Company AUD Mn USD Mn
MLC Limited 1,479.6 1,428.4
The Colonial Mutual Life Assurance Society Limited
1,276.2 1,232.0
AMP Life Limited 1,171.7 1,131.1
OnePath Life Limited 1,115.9 1,077.3
TAL Life Limited 978.1 944.2
The National Mutual Life Association of Australasia Limited
897.8 866.7
AIA Australia Limited 887.3 856.6
Westpac Life Insurance Services Limited
753.2 727.1
Suncorp Life & Superannuation Limited
525.6 507.4
MetLife Insurance Limited 342.5 330.6
Source: Axco Insurance Information Services.
INSURANCE ASSOCIATION
Insurance Council of Australia Web: www.insurancecouncil.com.au
POPULATION, 2011-2014 (1)
Year Population
2011 21,766,711
2012 22,015,576
2013 22,262,501
2014 22,507,617
(1) Estimated. Source: U.S. Central Intelligence Agency.
GROSS DOMESTIC PRODUCT, 2010-2014 (1)
(U.S. $ billions)
Year GDP
2010 $819.0
2011 889.6
2012 917.7
2013 998.3
2014 1,100.0
(1) Based on Purchasing Power Parity calculations, which take into account the relative cost of living and inflation rates of countries. GDP estimate for July for each year shown. Source: U.S. Central Intelligence Agency.
LIFE AND NONLIFE INSURANCE PREMIUMS, 2014
(U.S. $ millions)
Direct premiums written
Nonlife premiums (1) $31,924
Life premiums 56,151
Total premiums $88,075
Percent of total world premiums
1.84%
(1) Includes accident and health insurance. Source: Swiss Re, sigma, No. 4/2015.

2016 International Insurance Fact Book updates at www.iii.org/international/ 20
Austria
LEADING NONLIFE INSURANCE COMPANIES, 2013
Gross written premiums
Company EUR Mn USD Mn
Generali Versicherung AG 1,194.6 1,586.1
Wiener Staedtische Versicherung AG
1,033.5 1,372.2
UNIQA Osterreich Versicherungen AG
1,024.0 1,359.6
Allianz Elementar Versicherungs-AG
823.9 1,093.9
Donau Versicherung AG Vienna Insurance Group
491.4 652.4
Zurich Versicherungs-AG 403.1 535.2
Grazer Wechselseitige Versicherung AG
311.2 413.1
Oberosterreichische Versicherung AG
250.1 332.1
Niederosterreichische Versicherung AG
211.1 280.3
HDI Versicherung AG 154.5 205.1
Source: Axco Insurance Information Services.
LEADING LIFE INSURANCE COMPANIES, 2013
Gross written premiums
Company EUR Mn USD Mn
Sparkassen Versicherung AG 833.3 1,106.4
Wiener Stadtische Versicherung AG
757.3 1,005.4
Generali Versicherung AG 675.4 896.7
ERGO Versicherung AG 553.8 735.3
FINANCE LIFE Lebensversicherung AG
529.8 703.4
Raiffeisen Versicherung 465.4 617.9
Allianz Elementar Lebensversicherungs AG
394.6 523.9
UNIQA Osterreich Versicherungen AG
343.9 456.5
Wustenrot Versicherungs AG 282.8 375.4
Donau Versicherung AG Vienna Insurance Group
252.9 335.7
Source: Axco Insurance Information Services.
INSURANCE ASSOCIATION
Austrian Insurance Association Verband der Versicherungsunternehmen Öesterreichs Web: www.vvo.at
POPULATION, 2011-2014 (1)
Year Population
2011 8,217,280
2012 8,219,743
2013 8,221,646
2014 8,223,062
(1) Estimated. Source: U.S. Central Intelligence Agency.
GROSS DOMESTIC PRODUCT, 2010-2014 (1) (U.S. $ billions)
Year GDP
2010 $323.1
2011 332.6
2012 351.4
2013 361.0
2014 386.9
(1) Based on Purchasing Power Parity calculations, which take into account the relative cost of living and inflation rates of countries. GDP estimate for July for each year shown. Source: U.S. Central Intelligence Agency.
LIFE AND NONLIFE INSURANCE PREMIUMS, 2014
(U.S. $ millions)
Direct premiums written
Nonlife premiums (1) $13,820
Life premiums 8,974
Total premiums $22,794
Percent of total world premiums
0.48%
(1) Includes accident and health insurance. Source: Swiss Re, sigma, No. 4/2015.

2016 International Insurance Fact Book updates at www.iii.org/international/ 21
Bahamas
LEADING NONLIFE INSURANCE COMPANIES, 2012
Source: Axco Insurance Information Services.
LEADING LIFE INSURANCE COMPANIES, 2008
Gross written premiums
Company USD Mn
Colina Imperial 147.4
Family Guardian 73.3
Atlantic Medical 67.5
British American 19.4
Generali Worldwide 17.5
Capital Life 6.6
Metlife 6.5
Laurentide 5.0
Sirius 2.0
Sagicor 0.8
Source: Axco Insurance Information Services.
Gross written premiums
Company USD Mn
Bahamas First General 103.9
RoyalStar Assurance 64.9
Insurance Company of The Bahamas
43.3
Summit 35.6
Security and General 25.4
ICWI Bahamas 3.0
INSURANCE ASSOCIATION
Bahamas General Insurance Association Web: www.bahamasinsurance.org
POPULATION, 2011-2014 (1)
Year Population
2011 313,312
2012 316,182
2013 319,031
2014 321,834
(1) Estimated. Source: U.S. Central Intelligence Agency.
GROSS DOMESTIC PRODUCT, 2010-2014 (1)
(U.S. $ billions)
Year GDP
2010 $9.1
2011 8.9
2012 10.8
2013 11.4
2014 9.0
(1) Based on Purchasing Power Parity calculations, which take into account the relative cost of living and inflation rates of countries. GDP estimate for July for each year shown. Source: U.S. Central Intelligence Agency.
LIFE AND NONLIFE INSURANCE PREMIUMS, 2014
(U.S. $ millions)
Direct premiums written
Nonlife premiums (1) $563
Life premiums 161
Total premiums $724
Percent of total world premiums
0.02%
(1) Includes accident and health insurance. Source: Swiss Re, sigma, No. 4/2015.

2016 International Insurance Fact Book updates at www.iii.org/international/ 22
Bahrain
LEADING NONLIFE INSURANCE COMPANIES,
2013
Gross written premiums
Company BHD Mn USD Mn
Bahrain Kuwait Insurance Co.
23.4 62.3
ACE American Insurance Co.
20.1 53.6
AXA Insurance (Gulf) Co. 18.6 49.3
Takaful International 17.4 46.3
Bahrain National Insurance Co.
16.4 43.7
Gulf Union Ins & Re Co. 15.5 41.1
Solidarity General Takaful 13.1 34.8
Al Ahlia Insurance Co. 11.4 30.4
Saudi National Ins Co. 11.1 29.6
T'azur Company 8.4 22.2
Source: Axco Insurance Information Services.
LEADING LIFE INSURANCE COMPANIES, 2013
Gross written premiums
Company BHD Mn USD Mn
Life Insurance Corporation (International)
22.3 59.4
American Life Insurance Co.
13.5 36.0
Zurich International Life Ltd
13.1 34.8
Medgulf Takaful 4.6 12.3
Legal & General Gulf Takaful
4.5 12.0
Bahrain National Life Assurance Co.
1.9 5.1
Takaful International 1.3 3.4
Legal & General Gulf 0.7 2.0
T'azur Company 0.6 1.6
Arabia Insurance Company
0.1 0.3
Source: Axco Insurance Information Services.
INSURANCE ASSOCIATION
Bahrain Insurance Association Web: www.bia-bh.com
POPULATION, 2011-2014 (1)
Year Population
2011 1,214,705
2012 1,248,348
2013 1,281,332
2014 1,314,089
(1) Estimated. Source: U.S. Central Intelligence Agency.
GROSS DOMESTIC PRODUCT, 2010-2014 (1)
(U.S. $ billions)
Year GDP
2010 $28.0
2011 29.8
2012 30.8
2013 35.0
2014 61.6
(1) Based on Purchasing Power Parity calculations, which take into account the relative cost of living and inflation rates of countries. GDP estimate for July for each year shown. Source: U.S. Central Intelligence Agency.
LIFE AND NONLIFE INSURANCE PREMIUMS, 2013 (U.S. $ millions)
Direct premiums written
Nonlife premiums (1) $515
Life premiums 173
Total premiums $688
Percent of total world premiums
0.01%
(1) Includes accident and health insurance. Source: Swiss Re, sigma, No. 3/2014.

2016 International Insurance Fact Book updates at www.iii.org/international/ 23
Bangladesh
LEADING NONLIFE INSURANCE COMPANIES, 2012
Gross written premiums
Company BDT Mn USD Mn
Green Delta Insurance Co Ltd
2,601.4 31.8
Sadharan Bima Corporation
2,212.0 27.0
Pioneer Insurance Co Ltd 1,701.3 20.8
Reliance Insurance Limited 1,486.3 18.2
Pragati Insurance Ltd 1,151.3 14.1
Rupali Insurance Co Ltd 759.5 9.3
Eastland Insurance Co Ltd 650.1 7.9
Phoenix Insurance Co Ltd 614.6 7.5
Bangladesh Gen Ins Co Ltd 591.5 7.2
Continental Insurance Ltd 451.2 5.5
Source: Axco Insurance Information Services.
LEADING LIFE INSURANCE COMPANIES, 2012
Gross written premiums
Company BDT Mn USD Mn
MetLife Alico 16,687.7 203.9
Fareast Islami Life 7,031.3 85.9
National Life 7,025.1 85.8
Popular Life 6,617.8 80.8
Delta Life 5,085.6 62.1
Meghna Life 4,011.8 49.0
Jiban Bima Corporation 3,199.9 39.1
Sandhani Life 2,249.0 27.5
Prime Islami Life 2,071.3 25.3
Progressive Life 1,714.1 20.9
Source: Axco Insurance Information Services.
INSURANCE ASSOCIATION
Bangladesh Insurance Association Web: www.bia-bd.org
POPULATION, 2011-2014 (1)
Year Population
2011 158,570,535
2012 161,083,804
2013 163,654,860
2014 166,280,712
(1) Estimated. Source: U.S. Central Intelligence Agency.
GROSS DOMESTIC PRODUCT, 2010-2014 (1)
(U.S. $ billions)
Year GDP
2010 $242.2
2011 259.3
2012 282.5
2013 324.6
2014 535.6
(1) Based on Purchasing Power Parity calculations, which take into account the relative cost of living and inflation rates of countries. GDP estimate for July for each year shown. Source: U.S. Central Intelligence Agency.
LIFE AND NONLIFE INSURANCE PREMIUMS, 2014
(U.S. $ millions)
Direct premiums written
Nonlife premiums (1) $349
Life premiums 966
Total premiums $1,315
Percent of total world premiums
0.03%
(1) Includes accident and health insurance. Source: Swiss Re, sigma, No. 4/2015.

2016 International Insurance Fact Book updates at www.iii.org/international/ 24
Belgium
LEADING NONLIFE INSURANCE COMPANIES, 2013
Gross written premiums
Company EUR Mn USD Mn
AXA Belgium 1,940.4 2,576.4
AG Insurance 1,829.2 2,428.7
Ethias 1,116.9 1,482.9
KBC Assurances 935.9 1,242.6
Baloise 708.8 941.0
Allianz Benelux 505.9 671.7
Belfius Assurances 499.0 662.5
DKV 460.9 611.9
Vivium 396.7 526.7
P&V 260.4 345.7
Source: Axco Insurance Information Services.
LEADING LIFE INSURANCE COMPANIES, 2013
Gross written premiums
Company EUR Mn USD Mn
AG Insurance 4,118.8 5,468.7
AXA Belgium 2,004.1 2,660.9
KBC Assurances 1,484.9 1,971.6
Ethias 1,434.2 1,904.3
Belfius Assurances 1,236.9 1,642.3
Allianz Benelux 894.2 1,187.2
Delta Lloyd Life 798.7 1,060.5
Vivium 649.0 861.7
ERGO 506.6 672.6
Aras 489.9 650.5
Source: Axco Insurance Information Services.
INSURANCE ASSOCIATION
Insurance Company Association Assuralia Web: www.assuralia.be
POPULATION, 2011-2014 (1)
Year Population
2011 10,431,477
2012 10,438,353
2013 10,444,268
2014 10,449,361
(1) Estimated. Source: U.S. Central Intelligence Agency.
GROSS DOMESTIC PRODUCT, 2010-2014 (1) (U.S. $ billions)
Year GDP
2010 381.4
2011 396.9
2012 412.0
2013 421.7
2014 467.1
(1) Based on Purchasing Power Parity calculations, which take into account the relative cost of living and inflation rates of countries. GDP estimate for July for each year shown. Source: U.S. Central Intelligence Agency.
LIFE AND NONLIFE INSURANCE PREMIUMS, 2014
(U.S. $ millions)
Direct premiums written
Nonlife premiums (1) $16,549
Life premiums 22,839
Total premiums $39,388
Percent of total world premiums
0.82%
(1) Includes accident and health insurance. Source: Swiss Re, sigma, No. 4/2015.

2016 International Insurance Fact Book updates at www.iii.org/international/ 25
Bermuda
LEADING NONLIFE AND REINSURANCE
COMPANIES, 2012 (1)
Gross written premiums
Company USD Mn
ACE 15,677.0
XL Bermuda 5,766.0
PartnerRe 4,485.9
Everest Reinsurance (Bermuda)
4,164.6
Catlin Group 3,603.5
AXIS Capital Holdings 3,415.5
Arch Capital Group 2,935.1
Aspen Insurance Holdings 2,084.0
Endurance Specialty Holdings
2,013.9
Hiscox 1,899.5
(1) Includes life, nonlife and reinsurance. Source: Axco Insurance Information Services.
INSURANCE ASSOCIATION
Bermuda Insurance Institute Web: www.bii.bm
POPULATION, 2011-2014 (1)
Year Population
2011 68,679
2012 69,080
2013 69,467
2014 69,839
(1) Estimated. Source: U.S. Central Intelligence Agency.
GROSS DOMESTIC PRODUCT, 2010-2014 (1)
(U.S. $ billions)
Year GDP
2010 NA
2011 $5.6
2012 NA
2013 NA
2014 NA
(1) Based on Purchasing Power Parity calculations, which take into account the relative cost of living and inflation rates of countries. GDP estimate for July for each year shown. NA=Data not available. Source: U.S. Central Intelligence Agency.

2016 International Insurance Fact Book updates at www.iii.org/international/ 26
Brazil
LEADING NONLIFE INSURANCE COMPANIES, 2014
Gross written premiums
Company BRL Mn USD Mn
Seguradora Lider dos Consórcios do Seguro Dpvat S.A.
8,461.1 3,594.6
Porto Seguro Companhia de Seguros Gerais
5,519.7 2,345.0
Bradesco Auto/Re Companhia de Seguros
5,303.4 2,253.1
MAPFRE Seguros Gerais S.A.
4,866.0 2,067.3
Itau Seguros S.A. 4,179.8 1,775.8
Sul America Companhia Nacional de Seguros
3,365.8 1,429.9
Tokio Marine Seguradora S.A. 2,790.8 1,185.7
HDI Seguros S.A. 2,620.7 1,113.4
Allianz Seguros S.A. 2,589.9 1,100.3
Itau Seguros de Auto e Residencia S.A.
2,400.6 1,019.9
Source: Axco Insurance Information Services.
LEADING LIFE INSURANCE COMPANIES, 2014
Gross written premiums
Company BRL Mn USD Mn
Companhia de Seguros Alianca do Brasil
4,230.5 1,797.3
Bradesco Vida e Previdencia S.A.
3,077.7 1,307.5
Zurich Santander Brasil Seguros e Previdencia S.A.
1,922.4 816.7
Itau Seguros S.A. 1,759.6 747.5
CAIXA Seguradora S.A. 1,364.6 579.7
Icatu Seguros S.A. 1,071.3 455.1
Cardif do Brasil Vida e Previdencia S.A.
844.4 358.8
MAPFRE Vida S.A. 585.3 248.7
HSBC Seguros (Brasil) S.A. 512.4 217.7
Metropolitan Life Seguros E Previdencia Privada S.A.
504.8 214.4
Source: Axco Insurance Information Services
INSURANCE ASSOCIATION
Federacao Nacional das Empresas de Seguros Privados e de Capitalizacao Web: www.fenaseg.org.br
POPULATION, 2011-2014 (1)
Year Population
2011 203,429,773
2012 205,716,890
2013 201,009,622
2014 202,656,788
(1) Estimated. Source: U.S. Central Intelligence Agency.
GROSS DOMESTIC PRODUCT, 2010-2014 (1) (U.S. $ billions)
Year GDP
2010 $2,024.0
2011 2,194.0
2012 2,284.0
2013 2,422.0
2014 3,073.0
(1) Based on Purchasing Power Parity calculations, which take into account the relative cost of living and inflation rates of countries. GDP estimate for July for each year shown. Source: U.S. Central Intelligence Agency.
LIFE AND NONLIFE INSURANCE PREMIUMS, 2014 (U.S. $ millions)
Direct premiums written
Nonlife premiums (1) $40,464
Life premiums 44,980
Total premiums $85,444
Percent of total world premiums
1.79%
(1) Includes accident and health insurance. Source: Swiss Re, sigma, No. 4/2015.

2016 International Insurance Fact Book updates at www.iii.org/international/ 27
Bulgaria
LEADING NONLIFE INSURANCE COMPANIES, 2014
Gross written premiums
Company BGN Mn USD Mn
Armeec 196.9 133.6
BULSTRAD Vienna Insurance Group
171.1 116.1
LEV INS 170.1 115.4
DZI General insurance 142.9 97.0
Allianz Bulgaria 141.7 96.1
BUL INS 119.7 81.2
EUROINS 82.9 56.2
Victoria 71.5 48.5
OZK Insurance 70.4 47.7
UNIQA Insurance 63.6 43.1
Source: Axco Insurance Information Services.
LEADING LIFE INSURANCE COMPANIES, 2014
Gross written premiums
Company BGN Mn USD Mn
Allianz Bulgaria Life 78.6 53.3
Bulstrad Life VIG 54.4 36.9
UNIQA Life 41.8 28.4
DZI Life 33.3 22.6
UBB-Alico 33.0 22.4
GRAWE Bulgaria Life 21.8 14.8
Alico Bulgaria 20.4 13.8
SyVZK 18.6 12.6
Generali Life 10.5 7.1
Sogelife 9.1 6.2
Source: Axco Insurance Information Services.
INSURANCE ASSOCIATION
Association of Bulgarian Insurers Web: www.abz.bg
POPULATION, 2011-2014 (1)
Year Population
2011 7,093,635
2012 7,037,935
2013 6,981,642
2014 6,924,716
(1) Estimated. Source: U.S. Central Intelligence Agency.
GROSS DOMESTIC PRODUCT, 2010-2014 (1)
(U.S. $ billions)
Year GDP
2010 $90.4
2011 92.2
2012 101.2
2013 104.6
2014 123.3
(1) Based on Purchasing Power Parity calculations, which take into account the relative cost of living and inflation rates of countries. GDP estimate for July for each year shown. Source: U.S. Central Intelligence Agency.
LIFE AND NONLIFE INSURANCE PREMIUMS,
2014
(U.S. $ millions)
Direct premiums written
Nonlife premiums (1) $983
Life premiums 196
Total premiums $1,180
Percent of total world premiums
0.02%
(1) Includes accident and health insurance. Source: Swiss Re, sigma, No. 4/2015.

2016 International Insurance Fact Book updates at www.iii.org/international/ 28
Canada
LEADING NONLIFE INSURANCE COMPANIES, 2014
Gross written premiums
Company CAD Mn USD Mn
Intact Insurance Company 6,201.0 5,606.2
Aviva Insurance Company of Canada
3,226.8 2,917.2
Security National Insurance Company
3,006.3 2,717.9
Lloyd's Underwriters 2,594.2 2,345.4
Wawanesa Mutual Insurance Company (The)
2,573.1 2,326.3
Co-operators General Insurance Company
2,293.4 2,073.4
Economical Mutual Insurance Company
1,963.0 1,774.7
Royal & Sun Alliance Insurance Company of Canada
1,849.4 1,672.0
Personal Insurance Company (The)
1,367.1 1,236.0
Allstate Insurance Company of Canada
1,261.7 1,140.7
Source: Axco Insurance Information Services.
LEADING LIFE INSURANCE COMPANIES, 2014
Gross written premiums
Company CAD Mn USD Mn
Great-West Life Assurance Company (The)
13,609.7 12,304.2
Sun Life Assurance Company of Canada
9,743.8 8,809.1
Manufacturers Life Insurance Company (The)
8,549.0 7,728.9
Canada Life Assurance Company (The)
5,305.7 4,796.8
London Life Insurance Company 3,246.7 2,935.2
Standard Life Assurance Company of Canada (The)
1,351.1 1,221.5
RBC Life Insurance Company 1,264.7 1,143.4
BMO Life Insurance Company 1,023.7 925.5
Empire Life Insurance Company (The)
971.6 878.4
Co-operators Life Insurance Company
968.7 875.8
Source: Axco Insurance Information Services.
INSURANCE ASSOCIATION
Insurance Bureau of Canada Web: www.ibc.ca
POPULATION, 2011-2014 (1)
Year Population
2011 34,030,589
2012 34,300,083
2013 34,568,211
2014 34,834,841
(1) Estimated. Source: U.S. Central Intelligence Agency.
GROSS DOMESTIC PRODUCT, 2010-2014 (1)
(U.S. $ billions)
Year GDP
2010 NA
2011 $1,335.0
2012 1,389.0
2013 1,518.0
2014 1,579.0
(1) Based on Purchasing Power Parity calculations, which take into account the relative cost of living and inflation rates of countries. GDP estimate for July for each year shown. NA=Data not available. Source: U.S. Central Intelligence Agency.
LIFE AND NONLIFE INSURANCE PREMIUMS, 2014
(U.S. $ millions)
Direct premiums
written
Nonlife premiums (1) $73,235
Life premiums 52,138
Total premiums $125,373
Percent of total world premiums
2.62%
(1) Includes accident and health insurance. Source: Swiss Re, sigma, No. 4/2015.

2016 International Insurance Fact Book updates at www.iii.org/international/ 29
Chile
LEADING NONLIFE INSURANCE COMPANIES,
2013
Gross written premiums
Company CLP Mn USD Mn
RSA Seguros 280,390.5 566.1
Penta Security 211,698.7 427.4
BCI Seguros 210,095.0 424.2
MAPFRE 206,830.7 417.6
Liberty Seguros 169,649.4 342.5
Magallanes 153,480.5 309.9
BNP Paribas Cardif 124,282.3 250.9
ACE Seguros 115,033.4 232.3
Chilena Consolidada 102,440.9 206.8
AIG Chile 72,157.4 145.7
Source: Axco Insurance Information Services.
LEADING LIFE INSURANCE COMPANIES, 2013
Gross written premiums
Company CLP Mn USD Mn
MetLife 563,417.5 1,137.6
Chilena Consolidada 453,425.0 915.5
Consorcio Nacional 356,315.9 719.4
Sura 277,249.3 559.8
CorpVida 276,300.6 557.9
BICE Vida 260,489.1 526.0
Penta Vida 221,512.2 447.3
Security Prevision 195,378.9 394.5
Principal 190,902.3 385.5
EuroAmerica 137,092.9 276.8
Source: Axco Insurance Information Services.
INSURANCE ASSOCIATION
The Chilean Insurance Association Asociacion de Aseguradores de Chile Web: http://portal.aach.cl/home.asp
POPULATION, 2011-2014 (1)
Year Population
2011 16,888,760
2012 17,067,369
2013 17,216,945
2014 17,363,894
(1) Estimated. Source: U.S. Central Intelligence Agency.
GROSS DOMESTIC PRODUCT, 2010-2014 (1) (U.S. $ billions)
Year GDP
2010 $244.3
2011 260.0
2012 281.0
2013 335.4
2014 410.3
(1) Based on Purchasing Power Parity calculations, which take into account the relative cost of living and inflation rates of countries. GDP estimate for July for each year shown. Source: U.S. Central Intelligence Agency.
LIFE AND NONLIFE INSURANCE PREMIUMS, 2014
(U.S. $ millions)
Direct premiums written
Nonlife premiums (1) $4,513
Life premiums 6,401
Total premiums $10,915
Percent of total world premiums
0.23%
(1) Includes accident and health insurance. Source: Swiss Re, sigma, No. 4/2015.
2016 International Insurance Fact Book updates at www.iii.org/international/ 30
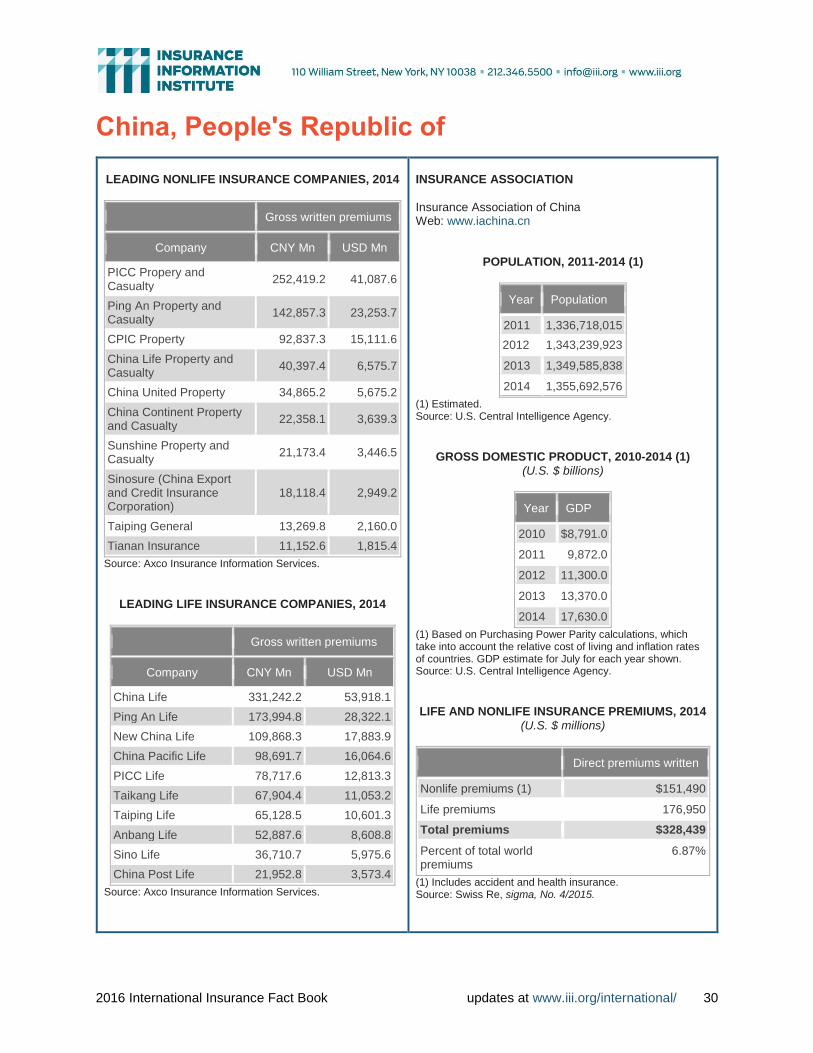
China, People's Republic of
LEADING NONLIFE INSURANCE COMPANIES, 2014
Gross written premiums
Company CNY Mn USD Mn
PICC Propery and Casualty
252,419.2 41,087.6
Ping An Property and Casualty
142,857.3 23,253.7
CPIC Property 92,837.3 15,111.6
China Life Property and Casualty
40,397.4 6,575.7
China United Property 34,865.2 5,675.2
China Continent Property and Casualty
22,358.1 3,639.3
Sunshine Property and Casualty
21,173.4 3,446.5
Sinosure (China Export and Credit Insurance Corporation)
18,118.4 2,949.2
Taiping General 13,269.8 2,160.0
Tianan Insurance 11,152.6 1,815.4
Source: Axco Insurance Information Services.
LEADING LIFE INSURANCE COMPANIES, 2014
Gross written premiums
Company CNY Mn USD Mn
China Life 331,242.2 53,918.1
Ping An Life 173,994.8 28,322.1
New China Life 109,868.3 17,883.9
China Pacific Life 98,691.7 16,064.6
PICC Life 78,717.6 12,813.3
Taikang Life 67,904.4 11,053.2
Taiping Life 65,128.5 10,601.3
Anbang Life 52,887.6 8,608.8
Sino Life 36,710.7 5,975.6
China Post Life 21,952.8 3,573.4
Source: Axco Insurance Information Services.
INSURANCE ASSOCIATION
Insurance Association of China Web: www.iachina.cn
POPULATION, 2011-2014 (1)
Year Population
2011 1,336,718,015
2012 1,343,239,923
2013 1,349,585,838
2014 1,355,692,576
(1) Estimated. Source: U.S. Central Intelligence Agency.
GROSS DOMESTIC PRODUCT, 2010-2014 (1)
(U.S. $ billions)
Year GDP
2010 $8,791.0
2011 9,872.0
2012 11,300.0
2013 13,370.0
2014 17,630.0
(1) Based on Purchasing Power Parity calculations, which take into account the relative cost of living and inflation rates of countries. GDP estimate for July for each year shown. Source: U.S. Central Intelligence Agency.
LIFE AND NONLIFE INSURANCE PREMIUMS, 2014
(U.S. $ millions)
Direct premiums written
Nonlife premiums (1) $151,490
Life premiums 176,950
Total premiums $328,439
Percent of total world premiums
6.87%
(1) Includes accident and health insurance. Source: Swiss Re, sigma, No. 4/2015.

2016 International Insurance Fact Book updates at www.iii.org/international/ 31
Colombia
LEADING NONLIFE INSURANCE COMPANIES,
2014
Gross written premiums
Company COP Mn USD Mn
Suramericana SA 1,489,301.0 744.0
Estado SA 792,209.4 395.8
AXA Colpatria Seguros S.A.
783,839.5 391.6
Allianz Seguros SA 738,390.0 368.9
Liberty Seguros 662,481.4 331.0
MAPFRE 623,718.0 311.6
Previsora 574,540.3 287.0
Bolivar SA 511,353.7 255.5
QBE Seguros 462,270.8 230.9
Cardif Colombia Seguros Generales
462,071.9 230.8
Source: Axco Insurance Information Services.
LEADING LIFE INSURANCE COMPANIES, 2014
Gross written premiums
Company COP Mn USD Mn
Suramericana Vida 2,280,744.3 1,139.4
Vidalfa SA 1,277,166.2 638.0
MAPFRE Colombia Vida Seguros
914,515.0 456.9
Bolivar Vida 799,288.0 399.3
Seguros de Riesgos Profesionales Suramericana
781,855.8 390.6
Positiva Compania de Seguros
737,723.9 368.5
AXA Colpatria Seguros S.A.
482,762.9 241.2
Riesgos Profesionales Colmena SA
416,744.6 208.2
Allianz Seguros de Vida
377,093.8 188.4
BBVA Seguros de Vida Colombia SA
239,992.9 119.9
Source: Axco Insurance Information Services
INSURANCE ASSOCIATION
The Colombian Association of Insurance Agents Asociacion Colombiana de Agentes de Seguros Web: www.acoas.com.co
POPULATION, 2011-2014 (1)
Year Population
2011 44,725,543
2012 45,239,079
2013 45,745,783
2014 46,245,297
(1) Estimated. Source: U.S. Central Intelligence Agency.
GROSS DOMESTIC PRODUCT, 2010-2014 (1) (U.S. $ billions)
Year GDP
2010 $400.3
2011 431.9
2012 467.0
2013 526.5
2014 642.7
(1) Based on Purchasing Power Parity calculations, which take into account the relative cost of living and inflation rates of countries. GDP estimate for July for each year shown. Source: U.S. Central Intelligence Agency.
LIFE AND NONLIFE INSURANCE PREMIUMS, 2014 (U.S. $ millions)
Direct premiums written
Nonlife premiums (1) $6,649
Life premiums 2,861
Total premiums $9,510
Percent of total world premiums
0.20%
(1) Includes accident and health insurance. Source: Swiss Re, sigma, No. 5/2015

2016 International Insurance Fact Book updates at www.iii.org/international/ 32
Costa Rica
LEADING NONLIFE INSURANCE COMPANIES,
2013
Gross written premiums
Company CRC Mn USD Mn
INS 233,040.3 466.3
ASSA Compania de Seguros
17,521.7 35.1
MAPFRE Seguros Costa Rica
5,420.4 10.9
Qualitas Compania de Seguros (Costa Rica)
2,916.2 5.8
Aseguradora del Istmo (ADISA)
607.7 1.2
Aseguradora Sagicor Costa Rica
187.8 0.4
Oceánica de Seguros S.A
69.8 0.1
Source: Axco Insurance Information Services.
LEADING LIFE INSURANCE COMPANIES, 2013
Gross written premiums
Company CRC Mn USD Mn
INS 229,157.1 458.5
PAN AMERICAN Life Insurance
14,341.8 28.7
Aseguradora del Istmo (ADISA)
6,008.4 12.0
MAPFRE Seguros Costa Rica
3,383.0 6.8
Seguros del Magisterio 2,130.6 4.3
ASSA Compania de Seguros
1,243.6 2.5
Atlantic Southern Insurance Company
904.3 1.8
Best Meridian Insurance Company
648.2 1.3
Aseguradora Sagicor Costa Rica
248.5 0.5
Source: Axco Insurance Information Services.
INSURANCE ASSOCIATION
Instituto Nacional de Seguros Web: www.ins-cr.com
POPULATION, 2011-2014 (1)
Year Population
2011 4,576,562
2012 4,636,348
2013 4,695,942
2014 4,755,234
(1) Estimated. Source: U.S. Central Intelligence Agency.
GROSS DOMESTIC PRODUCT, 2010-2014 (1)
(U.S. $ billions)
Year GDP
2010 $48.2
2011 51.6
2012 54.5
2013 61.4
2014 71.2
(1) Based on Purchasing Power Parity calculations, which take into account the relative cost of living and inflation rates of countries. GDP estimate for July for each year shown. Source: U.S. Central Intelligence Agency.
LIFE AND NONLIFE INSURANCE PREMIUMS, 2014
(U.S. $ millions)
Direct premiums written
Nonlife premiums (1) $1,014
Life premiums 142
Total premiums $1,156
Percent of total world premiums
0.02%
(1) Includes accident and health insurance. Source: Swiss Re, sigma, No. 4/2015.
2016 International Insurance Fact Book updates at www.iii.org/international/ 33
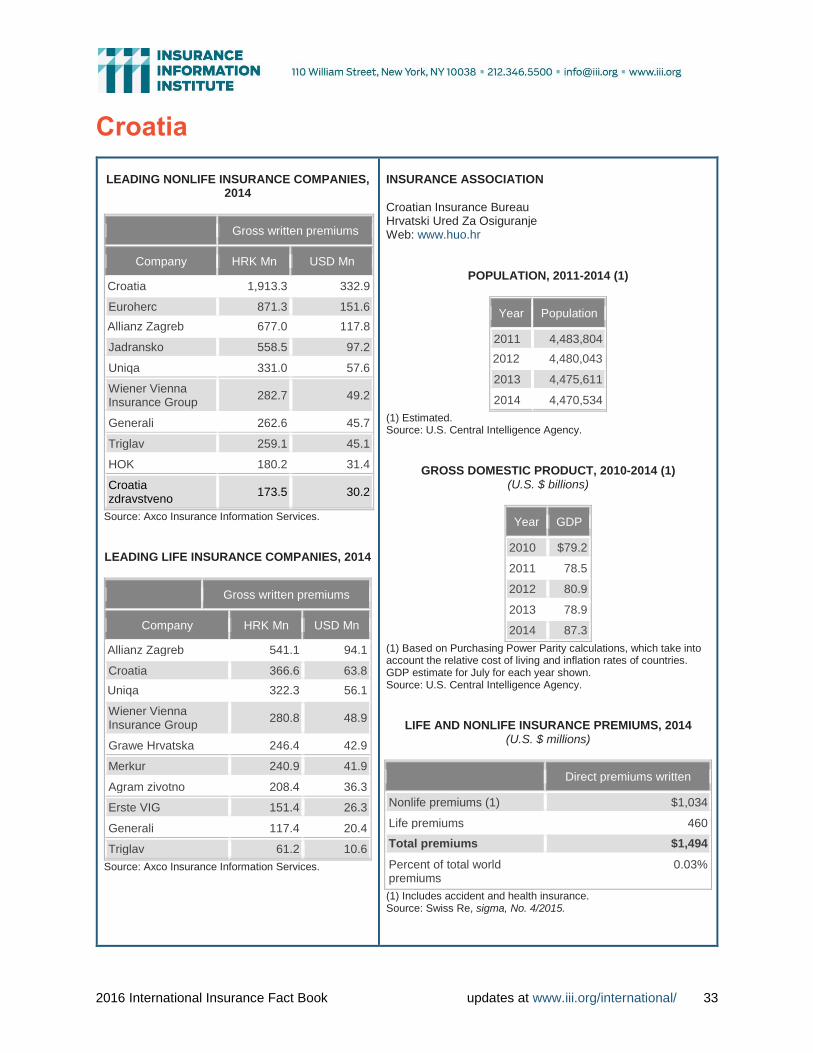
Croatia
LEADING NONLIFE INSURANCE COMPANIES,
2014
Gross written premiums
Company HRK Mn USD Mn
Croatia 1,913.3 332.9
Euroherc 871.3 151.6
Allianz Zagreb 677.0 117.8
Jadransko 558.5 97.2
Uniqa 331.0 57.6
Wiener Vienna Insurance Group
282.7 49.2
Generali 262.6 45.7
Triglav 259.1 45.1
HOK 180.2 31.4
Croatia zdravstveno
173.5 30.2
Source: Axco Insurance Information Services.
LEADING LIFE INSURANCE COMPANIES, 2014
Gross written premiums
Company HRK Mn USD Mn
Allianz Zagreb 541.1 94.1
Croatia 366.6 63.8
Uniqa 322.3 56.1
Wiener Vienna Insurance Group
280.8 48.9
Grawe Hrvatska 246.4 42.9
Merkur 240.9 41.9
Agram zivotno 208.4 36.3
Erste VIG 151.4 26.3
Generali 117.4 20.4
Triglav 61.2 10.6
Source: Axco Insurance Information Services.
INSURANCE ASSOCIATION
Croatian Insurance Bureau Hrvatski Ured Za Osiguranje Web: www.huo.hr
POPULATION, 2011-2014 (1)
Year Population
2011 4,483,804
2012 4,480,043
2013 4,475,611
2014 4,470,534
(1) Estimated. Source: U.S. Central Intelligence Agency.
GROSS DOMESTIC PRODUCT, 2010-2014 (1) (U.S. $ billions)
Year GDP
2010 $79.2
2011 78.5
2012 80.9
2013 78.9
2014 87.3
(1) Based on Purchasing Power Parity calculations, which take into account the relative cost of living and inflation rates of countries. GDP estimate for July for each year shown. Source: U.S. Central Intelligence Agency.
LIFE AND NONLIFE INSURANCE PREMIUMS, 2014 (U.S. $ millions)
Direct premiums written
Nonlife premiums (1) $1,034
Life premiums 460
Total premiums $1,494
Percent of total world premiums
0.03%
(1) Includes accident and health insurance. Source: Swiss Re, sigma, No. 4/2015.

2016 International Insurance Fact Book updates at www.iii.org/international/ 34
Cyprus
LEADING NONLIFE INSURANCE COMPANIES, 2014
Gross written premiums
Company EUR Mn USD Mn
General Insurance of Cyprus
52.9 70.2
CNP Asfalistiki 50.3 66.7
Universal Life 31.5 41.8
Pancyprian 29.0 38.5
Atlantic 22.6 29.9
Trust 21.6 28.7
AIG 21.4 28.4
Cosmos 18.8 25.0
Alpha 14.5 19.2
Prime 14.4 19.1
Source: Axco Insurance Information Services.
LEADING LIFE INSURANCE COMPANIES, 2014
Gross written premiums
Company EUR Mn USD Mn
Eurolife 83.5 110.8
CNP Cyprialife 72.8 96.5
Universal Life 46.3 61.4
Allianz Hellas 22.8 30.3
Prime 22.7 30.1
MetLife Alico 21.9 29.0
Alpha 15.2 20.1
Hellenic Alico 10.7 14.2
Ethhniki Insurance 7.2 9.6
Minerva 1.0 1.4
Source: Axco Insurance Information Services.
INSURANCE ASSOCIATION
Insurance Association of Cyprus Web: www.iac.org.cy
POPULATION, 2011-2014 (1)
Year Population
2011 1,120,489
2012 1,138,071
2013 1,155,403
2014 1,172,458
(1) Estimated. Source: U.S. Central Intelligence Agency.
GROSS DOMESTIC PRODUCT, 2010-2014 (1)
(U.S. $ billions)
Year GDP
2010 $22.9
2011 23.2
2012 23.8
2013 21.6
2014 128.5
(1) Based on Purchasing Power Parity calculations, which take into account the relative cost of living and inflation rates of countries. GDP estimate for July for each year shown. Source: U.S. Central Intelligence Agency.
LIFE AND NONLIFE INSURANCE PREMIUMS, 2014
(U.S. $ millions)
Direct premiums written
Nonlife premiums (1) $562
Life premiums 419
Total premiums $981
Percent of total world premiums
0.02%
(1) Includes accident and health insurance. Source: Swiss Re, sigma, No. 4/2015.

2016 International Insurance Fact Book updates at www.iii.org/international/ 35
Czech Republic
LEADING NONLIFE INSURANCE COMPANIES, 2013
Gross written premiums
Company CZK Mn USD Mn
Ceska pojistovna as 18,430.9 941.8
Kooperativa, pojistovna, as 15,734.2 804.0
Allianz pojistovna, as 7,168.7 366.3
Generali Pojistovna as 5,022.3 256.6
Ceska podnikatelska pojistovna, as
4,693.3 239.8
CSOB Pojistovna, as, clen holdingu CSOB
4,423.7 226.0
UNIQA pojistovna, as 4,311.2 220.3
BNP Paribas Cardif Pojistovna, as
2,025.8 103.5
AXA pojistovna as 757.0 38.7
Triglav pojistovna,as 734.9 37.6
Source: Axco Insurance Information Services.
LEADING LIFE INSURANCE COMPANIES, 2013
Gross written premiums
Company CZK Mn USD Mn
Ceska pojistovna as 10,418.9 532.4
Kooperativa, pojistovna, as 6,643.4 339.5
Pojistovna ceske sporitelny, as 5,988.9 306.0
ING zivotni pojistovna NV, pobocka pro ceskou republiku
4,857.6 248.2
CSOB Pojistovna, as, clen holdingu CSOB
2,982.4 152.4
Allianz pojistovna, as 2,946.2 150.5
Generali Pojistovna as 2,798.8 143.0
MetLife pojistovna as 2,416.8 123.5
Komercni pojistovna, as 1,541.8 78.8
AXA zivotni pojistovna as 1,441.4 73.7
Source: Axco Insurance Information Services.
INSURANCE ASSOCIATION
Czech Insurance Association Ceska Asociace Pojistoven Web: www.cap.cz
POPULATION, 2011-2014 (1)
Year Population
2011 10,190,213
2012 10,177,300
2013 10,162,921
2014 10,627,448
(1) Estimated. Source: U.S. Central Intelligence Agency.
GROSS DOMESTIC PRODUCT, 2010-2014 (1) (U.S. $ billions)
Year GDP
2010 $256.7
2011 262.8
2012 272.2
2013 285.6
2014 299.7
(1) Based on Purchasing Power Parity calculations, which take into account the relative cost of living and inflation rates of countries. GDP estimate for July for each year shown. Source: U.S. Central Intelligence Agency.
LIFE AND NONLIFE INSURANCE PREMIUMS,
2014 (U.S. $ millions)
Direct premiums written
Nonlife premiums (1) $4,174
Life premiums 3,429
Total premiums $7,603
Percent of total world premiums
0.16%
(1) Includes accident and health insurance. Source: Swiss Re, sigma, No. 4/2015.

2016 International Insurance Fact Book updates at www.iii.org/international/ 36
Denmark
LEADING NONLIFE INSURANCE COMPANIES, 2013
Gross written premiums
Company DKK Mn USD Mn
Tryg Skade 19,539.8 3,479.1
Codan Forsikring 7,821.3 1,392.6
Topdanmark 6,567.4 1,169.3
Alm. Brand Forsikring 4,928.6 877.6
Sygeforsikring Danmark 2,745.9 488.9
LB Forsikring 2,334.9 415.7
Alka 1,913.2 340.6
Danske Forsikring 1,899.9 338.3
Alpha Insurance 1,543.0 274.7
GF-Forsikring 1,533.1 273.0
Source: Axco Insurance Information Services.
LEADING LIFE INSURANCE COMPANIES, 2013
Gross written premiums
Company DKK Mn USD Mn
PFA Pension 24,665.8 4,391.8
Danica Pension 16,837.4 2,998.0
Nordea Liv & Pension A/S 12,192.5 2,170.9
PensionDanmark 10,738.1 1,912.0
SAMPENSION KP Livforsikring
8,140.9 1,449.5
AP Pension 6,958.0 1,238.9
Industriens Pensionsforsikring
6,527.9 1,162.3
Pen-Sam Liv 4,999.9 890.3
SEB Pensionsforsikring 4,258.8 758.3
Laerernes Pension 4,089.0 728.1
Source: Axco Insurance Information Services.
INSURANCE ASSOCIATION
Danish Insurance Association Forsikring & Pension Web: www.forsikringogpension.dk
POPULATION, 2011-2014 (1)
Year Population
2011 5,529,888
2012 5,543,453
2013 5,556,452
2014 5,569,077
(1) Estimated. Source: U.S. Central Intelligence Agency.
GROSS DOMESTIC PRODUCT, 2010-2014 (1) (U.S. $ billions)
Year GDP
2010 $197.7
2011 201.4
2012 208.8
2013 211.3
2014 248.7
(1) Based on Purchasing Power Parity calculations, which take into account the relative cost of living and inflation rates of countries. GDP estimate for July for each year shown. Source: U.S. Central Intelligence Agency.
LIFE AND NONLIFE INSURANCE PREMIUMS, 2014
(U.S. $ millions)
Direct premiums written
Nonlife premiums (1) $11,378
Life premiums 22,931
Total premiums $34,308
Percent of total world premiums
0.72%
(1) Includes accident and health insurance. Source: Swiss Re, sigma, No. 4/2015.

2016 International Insurance Fact Book updates at www.iii.org/international/ 37
Dominican Republic
LEADING NONLIFE INSURANCE COMPANIES, 2014
Gross written premiums
Company DOP Mn USD Mn
Universal 6,291.7 144.5
Banreservas 4,555.9 104.6
MAPFRE 3,737.0 85.8
Sura 2,697.2 61.9
Colonial 2,575.7 59.1
Constitucion 1,119.6 25.7
Monumental 748.7 17.2
Pepin 668.5 15.4
General 469.9 10.8
Dominicana 287.2 6.6
Source: Axco Insurance Information Services.
LEADING LIFE INSURANCE COMPANIES, 2014
Gross written premiums
Company DOP Mn USD Mn
Universal 2,285.9 52.5
Banreservas 1,322.9 30.4
MAPFRE 1,159.7 26.6
Monumental 874.6 20.1
Pepin 829.1 19.0
Sura 611.7 14.0
Colonial 365.6 8.4
Angloamericana 249.8 5.7
La Comercial 161.0 3.7
APS (La Imperial) 131.5 3.0
Source: Axco Insurance Information Services.
INSURANCE ASSOCIATION
Dominican Association of Insurers and Reinsurers Camara Dominicana de Aseguradores y Reaseguradores Inc. Web: www.cadoar.org.do
POPULATION, 2011-2014 (1)
Year Population
2011 9,956,648
2012 10,088,598
2013 10,219,630
2014 10,349,741
(1) Estimated. Source: U.S. Central Intelligence Agency.
GROSS DOMESTIC PRODUCT, 2010-2014 (1) (U.S. $ billions)
Year GDP
2010 $78.9
2011 84.9
2012 93.2
2013 101.0
2014 135.7
(1) Based on Purchasing Power Parity calculations, which take into account the relative cost of living and inflation rates of countries. GDP estimate for July for each year shown. Source: U.S. Central Intelligence Agency.
LIFE AND NONLIFE INSURANCE PREMIUMS, 2014
(U.S. $ millions)
Direct premiums written
Nonlife premiums (1) $576
Life premiums 188
Total premiums $763
Percent of total world premiums
0.02%
(1) Includes accident and health insurance. Source: Swiss Re, sigma, No. 4/2015.

2016 International Insurance Fact Book updates at www.iii.org/international/ 38
Ecuador
LEADING NONLIFE INSURANCE COMPANIES,
2014
Gross written premiums
Company USD Mn
Sucre 359.5
Equinoccial 272.3
Colonial 215.0
Ace Seguros 166.0
AIG Metropolitana 89.7
MAPFRE-ATLAS 86.4
Liberty Seguros 76.7
Aseguradora Del Sur 73.0
Seguros Unidos 71.7
Rocafuerte 69.5
Source: Axco Insurance Information Services.
LEADING LIFE INSURANCE COMPANIES, 2014
Gross written premiums
Company USD Mn
Seguros De Pichincha 86.6
Equivida 56.6
Ace Seguros 29.6
Liberty Seguros 21.4
Pan-American Life Insurance
18.4
Colvida 16.8
AIG Metropolitana 14.8
Ecuatoriano Suiza 14.8
Sucre 13.3
Bmi 11.4
Source: Axco Insurance Information Services.
INSURANCE ASSOCIATION
Asociacion de Companias de Seguros del Ecuador Web: www.acose.org
POPULATION, 2011-2014 (1)
Year Population
2011 15,007,343
2012 15,223,680
2013 15,439,429
2014 15,654,411
(1) Estimated. Source: U.S. Central Intelligence Agency.
GROSS DOMESTIC PRODUCT, 2010-2014 (1) (U.S. $ billions)
Year GDP
2010 $107.1
2011 115.3
2012 124.8
2013 157.6
2014 182.0
(1) Based on Purchasing Power Parity calculations, which take into account the relative cost of living and inflation rates of countries. GDP estimate for July for each year shown. Source: U.S. Central Intelligence Agency.
LIFE AND NONLIFE INSURANCE PREMIUMS, 2014 (U.S. $ millions)
Direct premiums written
Nonlife premiums (1) $1,427
Life premiums 276
Total premiums $1,703
Percent of total world premiums
0.04%
(1) Includes accident and health insurance. Source: Swiss Re, sigma, No. 4/2015.

2016 International Insurance Fact Book updates at www.iii.org/international/ 39
Egypt
LEADING NONLIFE INSURANCE COMPANIES, 2014
Gross written premiums
Company EGP Mn USD Mn
Misr 4,018.5 566.8
Bupa Egypt 408.7 57.6
Suez Canal 406.5 57.3
Arab Misr 368.1 51.9
Egyptian Takaful 318.6 44.9
Royal 281.8 39.8
Allianz Egypt 274.9 38.8
AIG Egypt 264.8 37.3
Arab Orient Takaful 245.4 34.6
Delta 209.7 29.6
Source: Axco Insurance Information Services.
LEADING LIFE INSURANCE COMPANIES, 2014
Gross written premiums
Company EGP Mn USD Mn
Misr Life 2,187.4 308.5
CIL 1,223.7 172.6
Allianz Life Insurance Company Egypt
1,123.9 158.5
Suez Canal 322.6 45.5
Pharaonic American Life (MetLife Alico)
292.4 41.2
QNB ALAHLI Life 285.5 40.3
Tokio Marine Egypt Family Takaful
265.4 37.4
Egyptian Life Takaful 223.6 31.5
Delta Insurance 107.1 15.1
ACE Life Insurance 97.1 13.7
Source: Axco Insurance Information Services.
INSURANCE ASSOCIATION
Insurance Federation of Egypt Web: www.ifegypt.org
POPULATION, 2011-2014 (1)
Year Population
2011 82,079,636
2012 83,688,164
2013 85,294,388
2014 86,895,099
(1) Estimated. Source: U.S. Central Intelligence Agency.
GROSS DOMESTIC PRODUCT, 2010-2014 (1)
(U.S. $ billions)
Year GDP
2010 $470.4
2011 500.9
2012 515.4
2013 551.4
2014 945.4
(1) Based on Purchasing Power Parity calculations, which take into account the relative cost of living and inflation rates of countries. GDP estimate for July for each year shown. Source: U.S. Central Intelligence Agency.
LIFE AND NONLIFE INSURANCE PREMIUMS, 2014
(U.S. $ millions)
Direct premiums written
Nonlife premiums (1) $1,079
Life premiums 888
Total premiums $1,968
Percent of total world premiums
0.04%
(1) Includes accident and health insurance. Source: Swiss Re, sigma, No. 4/2015.

2016 International Insurance Fact Book updates at www.iii.org/international/ 40
El Salvador
LEADING INSURANCE COMPANIES, 2013 (1)
Gross written premiums
Company USD Mn
SISA VIDA, Seguros de Personas
85.0
Aseguradora Agricola Comercial SA (ACSA)
77.5
ASESUISA VIDA, Seguros de Personas
66.9
La Centro Americana 60.1
Seguros e Inversiones 39.2
Aseguradora Suiza Salvadorena
37.2
Scotia Seguros 34.2
AIG Vida, S.A., Seguros de Personas
31.2
Pan American Life Insurance 25.4
Davivienda Seguros Comerciales Bolivar 2
20.4
(1) Includes life and nonlife. Source: Axco Insurance Information Services.
INSURANCE ASSOCIATION
Asociacion Salvadorena de Empresas de Seguros Web: www.ases.com.sv
POPULATION, 2011-2014 (1)
Year Population
2011 6,071,774
2012 6,090,646
2013 6,108,590
2014 6,125,512
(1) Estimated. Source: U.S. Central Intelligence Agency.
GROSS DOMESTIC PRODUCT, 2010-2014 (1)
(U.S. $ billions)
Year GDP
2010 $43.2
2011 44.0
2012 44.8
2013 47.5
2014 50.9
(1) Based on Purchasing Power Parity calculations, which take into account the relative cost of living and inflation rates of countries. GDP estimate for July for each year shown. NA=Data not available. Source: U.S. Central Intelligence Agency.
LIFE AND NONLIFE INSURANCE PREMIUMS,
2010 (U.S. $ millions)
Direct premiums written
Nonlife premiums (1) $364
Life premiums 188
Total premiums $552
Percent of total world premiums
0.01%
(1) Includes accident and health insurance. Source: Swiss Re, sigma, No. 2/2011.

2016 International Insurance Fact Book updates at www.iii.org/international/ 41
Finland
LEADING NONLIFE INSURANCE COMPANIES, 2013
Gross written premiums
Company EUR Mn USD Mn
Pohjola 1,096.8 1,409.2
If P&C 1,011.3 1,299.3
LahiTapiola 838.7 1,077.6
Fennia 402.5 517.2
LahiTapiola Regionals 217.2 279.0
A-Vakuutus Oy 106.0 136.2
Pohjantahti 94.1 120.9
Turva 90.4 116.2
Folksam 74.0 95.1
Eurooppalainen 55.4 71.2
Source: Axco Insurance Information Services.
LEADING LIFE INSURANCE COMPANIES, 2013
Gross written premiums
Company EUR Mn USD Mn
Nordea Life 2,184.0 2,899.8
OP Life 1,115.0 1,480.4
Mandatum Life 1,032.0 1,370.2
Tapiola Life 423.0 561.6
Aktia Life 141.0 187.2
Fennia Life 94.0 124.8
Aurum 90.0 119.5
Duo 83.0 110.2
Kaleva Mutual 60.0 79.7
Suomi Mutual 50.0 66.4
Source: Axco Insurance Information Services.
INSURANCE ASSOCIATION
Federation of Finnish Insurance Companies Web: www.vakes.fi
POPULATION, 2011-2014 (1)
Year Population
2011 5,259,250
2012 5,262,930
2013 5,266,114
2014 5,268,799
(1) Estimated. Source: U.S. Central Intelligence Agency.
GROSS DOMESTIC PRODUCT, 2010-2014 (1)
(U.S. $ billions)
Year GDP
2010 $181.4
2011 187.6
2012 195.6
2013 195.5
2014 221.5
(1) Based on Purchasing Power Parity calculations, which take into account the relative cost of living and inflation rates of countries. GDP estimate for July for each year shown. Source: U.S. Central Intelligence Agency.
LIFE AND NONLIFE INSURANCE PREMIUMS, 2014
(U.S. $ millions)
Direct premiums written
Nonlife premiums (1) $5,569
Life premiums 24,055
Total premiums $29,625
Percent of total world premiums
0.62%
(1) Includes accident and health insurance. Source: Swiss Re, sigma, No. 4/2015.
2016 International Insurance Fact Book updates at www.iii.org/international/ 42
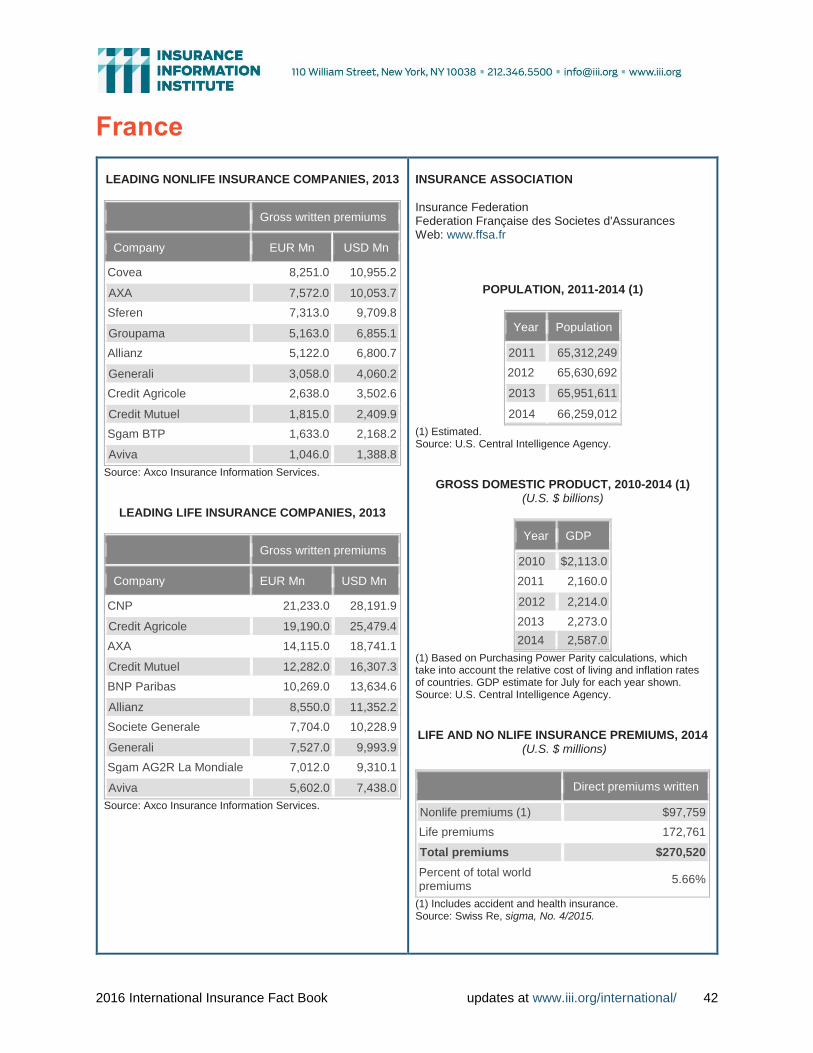
France
LEADING NONLIFE INSURANCE COMPANIES, 2013
Gross written premiums
Company EUR Mn USD Mn
Covea 8,251.0 10,955.2
AXA 7,572.0 10,053.7
Sferen 7,313.0 9,709.8
Groupama 5,163.0 6,855.1
Allianz 5,122.0 6,800.7
Generali 3,058.0 4,060.2
Credit Agricole 2,638.0 3,502.6
Credit Mutuel 1,815.0 2,409.9
Sgam BTP 1,633.0 2,168.2
Aviva 1,046.0 1,388.8
Source: Axco Insurance Information Services.
LEADING LIFE INSURANCE COMPANIES, 2013
Gross written premiums
Company EUR Mn USD Mn
CNP 21,233.0 28,191.9
Credit Agricole 19,190.0 25,479.4
AXA 14,115.0 18,741.1
Credit Mutuel 12,282.0 16,307.3
BNP Paribas 10,269.0 13,634.6
Allianz 8,550.0 11,352.2
Societe Generale 7,704.0 10,228.9
Generali 7,527.0 9,993.9
Sgam AG2R La Mondiale 7,012.0 9,310.1
Aviva 5,602.0 7,438.0
Source: Axco Insurance Information Services.
INSURANCE ASSOCIATION
Insurance Federation Federation Française des Societes d'Assurances Web: www.ffsa.fr
POPULATION, 2011-2014 (1)
Year Population
2011 65,312,249
2012 65,630,692
2013 65,951,611
2014 66,259,012
(1) Estimated. Source: U.S. Central Intelligence Agency.
GROSS DOMESTIC PRODUCT, 2010-2014 (1) (U.S. $ billions)
Year GDP
2010 $2,113.0
2011 2,160.0
2012 2,214.0
2013 2,273.0
2014 2,587.0
(1) Based on Purchasing Power Parity calculations, which take into account the relative cost of living and inflation rates of countries. GDP estimate for July for each year shown. Source: U.S. Central Intelligence Agency.
LIFE AND NO NLIFE INSURANCE PREMIUMS, 2014
(U.S. $ millions)
Direct premiums written
Nonlife premiums (1) $97,759
Life premiums 172,761
Total premiums $270,520
Percent of total world premiums
5.66%
(1) Includes accident and health insurance. Source: Swiss Re, sigma, No. 4/2015.
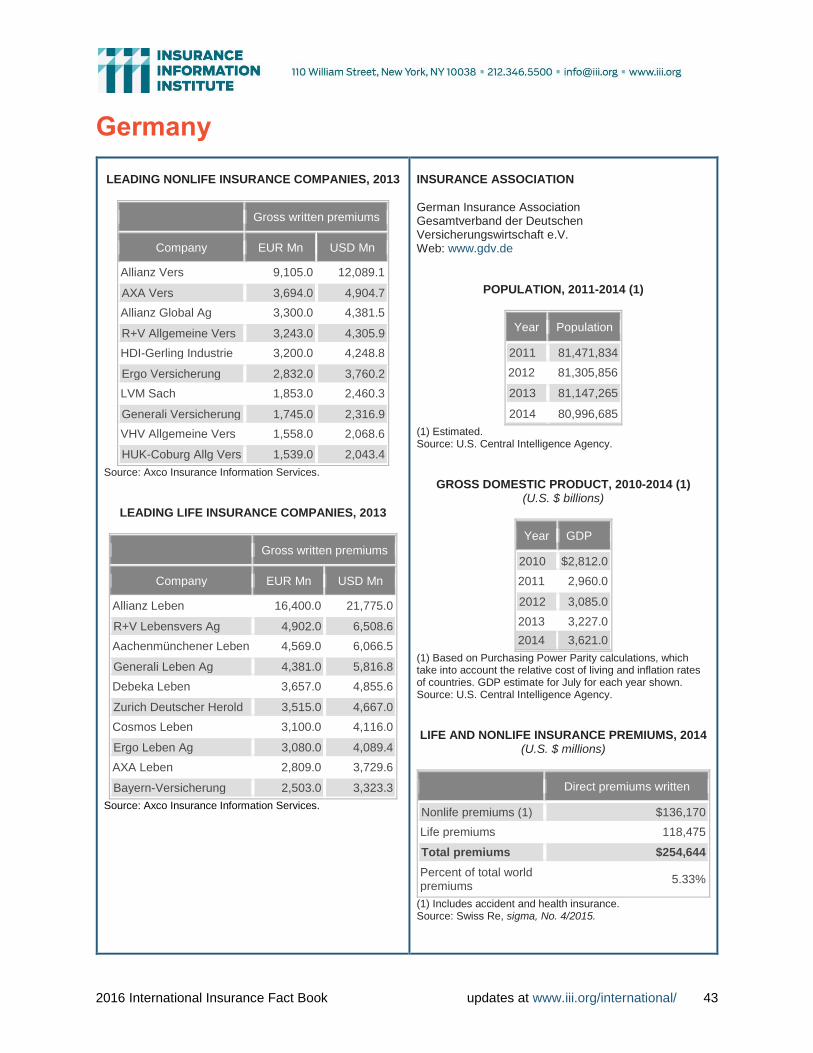
2016 International Insurance Fact Book updates at www.iii.org/international/ 43
Germany
LEADING NONLIFE INSURANCE COMPANIES, 2013
Gross written premiums
Company EUR Mn USD Mn
Allianz Vers 9,105.0 12,089.1
AXA Vers 3,694.0 4,904.7
Allianz Global Ag 3,300.0 4,381.5
R+V Allgemeine Vers 3,243.0 4,305.9
HDI-Gerling Industrie 3,200.0 4,248.8
Ergo Versicherung 2,832.0 3,760.2
LVM Sach 1,853.0 2,460.3
Generali Versicherung 1,745.0 2,316.9
VHV Allgemeine Vers 1,558.0 2,068.6
HUK-Coburg Allg Vers 1,539.0 2,043.4
Source: Axco Insurance Information Services.
LEADING LIFE INSURANCE COMPANIES, 2013
Gross written premiums
Company EUR Mn USD Mn
Allianz Leben 16,400.0 21,775.0
R+V Lebensvers Ag 4,902.0 6,508.6
Aachenmünchener Leben 4,569.0 6,066.5
Generali Leben Ag 4,381.0 5,816.8
Debeka Leben 3,657.0 4,855.6
Zurich Deutscher Herold 3,515.0 4,667.0
Cosmos Leben 3,100.0 4,116.0
Ergo Leben Ag 3,080.0 4,089.4
AXA Leben 2,809.0 3,729.6
Bayern-Versicherung 2,503.0 3,323.3
Source: Axco Insurance Information Services.
INSURANCE ASSOCIATION
German Insurance Association Gesamtverband der Deutschen Versicherungswirtschaft e.V. Web: www.gdv.de
POPULATION, 2011-2014 (1)
Year Population
2011 81,471,834
2012 81,305,856
2013 81,147,265
2014 80,996,685
(1) Estimated. Source: U.S. Central Intelligence Agency.
GROSS DOMESTIC PRODUCT, 2010-2014 (1) (U.S. $ billions)
Year GDP
2010 $2,812.0
2011 2,960.0
2012 3,085.0
2013 3,227.0
2014 3,621.0
(1) Based on Purchasing Power Parity calculations, which take into account the relative cost of living and inflation rates of countries. GDP estimate for July for each year shown. Source: U.S. Central Intelligence Agency.
LIFE AND NONLIFE INSURANCE PREMIUMS, 2014
(U.S. $ millions)
Direct premiums written
Nonlife premiums (1) $136,170
Life premiums 118,475
Total premiums $254,644
Percent of total world premiums
5.33%
(1) Includes accident and health insurance. Source: Swiss Re, sigma, No. 4/2015.

2016 International Insurance Fact Book updates at www.iii.org/international/ 44
Greece
LEADING NONLIFE INSURANCE COMPANIES,
2013
Gross written premiums
Company EUR Mn USD Mn
Ethniki 611.3 811.6
ATE 176.6 234.4
ERGO Damages 138.0 183.3
Allianz Hellas 125.4 166.5
Axa 123.5 163.9
European Reliance 113.3 150.4
Generali Hellas 110.9 147.3
Idrogios General 102.8 136.5
Eurolife ERB General 81.5 108.2
European Union 80.3 106.7
Source: Axco Insurance Information Services.
LEADING LIFE INSURANCE COMPANIES, 2013
Gross written premiums
Company EUR Mn USD Mn
Ethniki 378.7 502.8
Eurolife ERB Life 271.4 360.3
ING Life 239.8 318.4
MetLife ALICO Life 215.5 286.1
Interamerican Life 178.4 236.9
Allianz Hellas 97.8 129.9
Generali Hellas 64.0 85.0
AXA 60.1 79.8
Groupama Phoenix 59.3 78.7
Agrotiki 38.1 50.6
Source: Axco Insurance Information Services.
INSURANCE ASSOCIATION
Association of Insurance Companies of Greece Web: www.eaee.gr/cms/
POPULATION, 2011-2014 (1)
Year Population
2011 10,760,136
2012 10,767,827
2013 10,772,967
2014 10,775,557
(1) Estimated. Source: U.S. Central Intelligence Agency.
GROSS DOMESTIC PRODUCT, 2010-2014 (1)
(U.S. $ billions)
Year GDP
2010 $339.2
2011 321.7
2012 305.6
2013 267.1
2014 284.3
(1) Based on Purchasing Power Parity calculations, which take into account the relative cost of living and inflation rates of countries. GDP estimate for July for each year shown. Source: U.S. Central Intelligence Agency.
LIFE AND NONLIFE INSURANCE PREMIUMS, 2014
(U.S. $ millions)
Direct premiums written
Nonlife premiums (1) $2,893
Life premiums 2,376
Total premiums $5,268
Percent of total world premiums
0.11%
(1) Includes accident and health insurance. Source: Swiss Re, sigma, No. 4/2015.

2016 International Insurance Fact Book updates at www.iii.org/international/ 45
Guatemala
LEADING LIFE AND NONLIFE INSURANCE
COMPANIES, 2014
Gross written premiums
Company GTQ Mn USD Mn
El Roble, S. A. 1,460.1 188.8
G&T, S. A. 1,177.3 152.3
Aseguradora General, S. A.
569.9 73.7
MAPFRE Seguros Guatemala, S. A.
363.6 47.0
Aseguradora Rural, S. A.
351.5 45.5
Seguros Universales, S. A.
335.5 43.4
Pan-American Life Insurance de Guatemala, Compania de Seguros
295.1 38.2
Credito Hipotecario Nacional de Guatemala
291.9 37.8
Seguros Agromercantil, S. A.
231.0 29.9
Occidente, S. A. 176.1 22.8
(1) Includes life and nonlife. Source: Axco Insurance Information Services.
INSURANCE ASSOCIATION
Guatemalan Insurance Association Web: www.agis.com.gt/
POPULATION, 2011-2014 (1)
Year Population
2011 13,824,463
2012 14,099,032
2013 14,373,472
2014 14,647,083
(1) Estimated. Source: U.S. Central Intelligence Agency.
GROSS DOMESTIC PRODUCT, 2012-2014 (1) (U.S. $ billions)
Year GDP
2012 $74.6
2013 81.5
2014 118.7
(1) Based on Purchasing Power Parity calculations, which take into account the relative cost of living and inflation rates of countries. GDP estimate for July for each year shown. Source: U.S. Central Intelligence Agency.
LIFE AND NONLIFE INSURANCE PREMIUMS, 2014 (U.S. $ millions)
Direct premiums written
Nonlife premiums (1) $671
Life premiums 165
Total premiums $835
Percent of total world premiums
0.02%
(1) Includes accident and health insurance. Source: Swiss Re, sigma, No. 4/2015.

2016 International Insurance Fact Book updates at www.iii.org/international/ 46
Hong Kong
LEADING NONLIFE INSURANCE COMPANIES, 2014
Gross written premiums
Company HDK Mn USD Mn
AXA General 3,650.9 470.8
Zurich Insurance 2,657.0 342.7
Bupa 2,351.6 303.3
CTPI (HK) 2,043.6 263.6
BOC Group Insurance 1,842.6 237.6
QBE HKSI 1,763.2 227.4
AIG Insurance HK 1,551.2 200.1
CNOOC Insurance 1,452.4 187.3
Asia Insurance 1,254.7 161.8
AXA China (HK) 1,161.3 149.8
Source: Axco Insurance Information Services.
LEADING LIFE INSURANCE COMPANIES, 2014
Gross written premiums
Company HDK Mn USD Mn
HSBC Life 45,396.1 5,854.5
AIA International 42,572.1 5,490.3
Prudential (HK) Life 34,506.5 4,450.1
China Life 28,520.2 3,678.1
Manulife (Int'l) 21,844.5 2,817.2
BOC Group Life 16,756.8 2,161.0
AXA China (Bermuda) 15,990.3 2,062.2
Hang Seng Insurance 12,241.1 1,578.7
FWD Life 9,017.0 1,162.9
Sun Life Hong Kong 6,209.3 800.8
Source: Axco Insurance Information Services.
INSURANCE ASSOCIATION
Hong Kong Federation of Insurers Web: www.hkfi.org.hk
POPULATION, 2011-2014 (1)
Year Population
2011 7,122,508
2012 7,153,519
2013 7,182,724
2014 7,112,688
(1) Estimated.
Source: U.S. Central Intelligence Agency.
GROSS DOMESTIC PRODUCT, 2010-2014 (1) (U.S. $ billions)
Year GDP
2010 $301.3
2011 327.0
2012 353.7
2013 381.7
2014 400.6
(1) Based on Purchasing Power Parity calculations, which take into account the relative cost of living and inflation rates of countries. GDP estimate for July for each year shown. Source: U.S. Central Intelligence Agency.
LIFE AND NONLIFE INSURANCE PREMIUMS, 2014
(U.S. $ millions)
Direct premiums written
Nonlife premiums (1) $4,182
Life premiums 36,856
Total premiums $41,038
Percent of total world premiums
0.86%
(1) Includes accident and health insurance. Source: Swiss Re, sigma, No. 4/2015.

2016 International Insurance Fact Book updates at www.iii.org/international/ 47
Hungary
LEADING NONLIFE INSURANCE COMPANIES, 2014
Gross written premiums
Company HUF Mn USD Mn
Allianz 81,478.0 350.3
Generali 73,326.9 315.3
Aegon 47,440.3 204.0
Groupama Garancia 45,824.0 197.0
UNIQA 31,935.8 137.3
Union 22,703.2 97.6
K&H 18,081.5 77.7
AIG 9,178.2 39.5
Wáberer Hungária 9,149.7 39.3
MP Hungarian Post 8,447.1 36.3
Source: Axco Insurance Information Services.
LEADING LIFE INSURANCE COMPANIES, 2014
Gross written premiums
Company HUF Mn USD Mn
ING 74,720.6 321.2
MPÉ Hungarian Post Life 63,322.3 272.2
Groupama Garancia 48,767.6 209.7
Allianz 41,758.9 179.5
Generali 41,503.7 178.4
Aegon 38,954.8 167.5
UNIQA 24,366.7 104.8
MetLife 18,904.2 81.3
Signal 16,796.2 72.2
Erste 15,984.3 68.7
Source: Axco Insurance Information Services.
INSURANCE ASSOCIATION
Association of Hungarian Insurance Companies MABISZ Web: www.mabisz.hu
POPULATION, 2011-2014 (1)
Year Population
2011 9,976,062
2012 9,958,453
2013 9,939,470
2014 9,919,128
(1) Estimated. Source: U.S. Central Intelligence Agency.
GROSS DOMESTIC PRODUCT, 2010-2014 (1) (U.S. $ billions)
Year GDP
2010 $186.3
2011 190.0
2012 195.9
2013 196.6
2014 239.9
(1) Based on Purchasing Power Parity calculations, which take into account the relative cost of living and inflation rates of countries. GDP estimate for July for each year shown. Source: U.S. Central Intelligence Agency.
LIFE AND NONLIFE INSURANCE PREMIUMS, 2014
(U.S. $ millions)
Direct premiums written
Nonlife premiums (1) $1,536
Life premiums 1,953
Total premiums $3,488
Percent of total world premiums
0.07%
(1) Includes accident and health insurance. Source: Swiss Re, sigma, No. 4/2015.
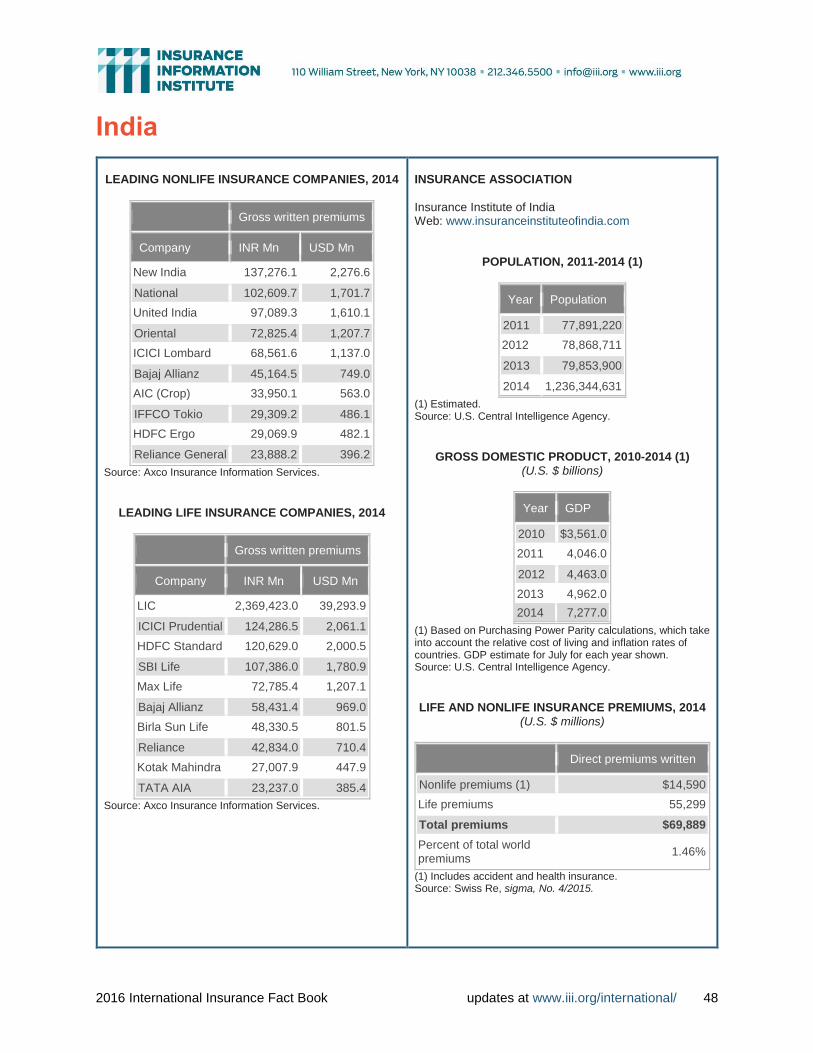
2016 International Insurance Fact Book updates at www.iii.org/international/ 48
India
LEADING NONLIFE INSURANCE COMPANIES, 2014
Gross written premiums
Company INR Mn USD Mn
New India 137,276.1 2,276.6
National 102,609.7 1,701.7
United India 97,089.3 1,610.1
Oriental 72,825.4 1,207.7
ICICI Lombard 68,561.6 1,137.0
Bajaj Allianz 45,164.5 749.0
AIC (Crop) 33,950.1 563.0
IFFCO Tokio 29,309.2 486.1
HDFC Ergo 29,069.9 482.1
Reliance General 23,888.2 396.2
Source: Axco Insurance Information Services.
LEADING LIFE INSURANCE COMPANIES, 2014
Gross written premiums
Company INR Mn USD Mn
LIC 2,369,423.0 39,293.9
ICICI Prudential 124,286.5 2,061.1
HDFC Standard 120,629.0 2,000.5
SBI Life 107,386.0 1,780.9
Max Life 72,785.4 1,207.1
Bajaj Allianz 58,431.4 969.0
Birla Sun Life 48,330.5 801.5
Reliance 42,834.0 710.4
Kotak Mahindra 27,007.9 447.9
TATA AIA 23,237.0 385.4
Source: Axco Insurance Information Services.
INSURANCE ASSOCIATION
Insurance Institute of India Web: www.insuranceinstituteofindia.com
POPULATION, 2011-2014 (1)
Year Population
2011 77,891,220
2012 78,868,711
2013 79,853,900
2014 1,236,344,631
(1) Estimated. Source: U.S. Central Intelligence Agency.
GROSS DOMESTIC PRODUCT, 2010-2014 (1)
(U.S. $ billions)
Year GDP
2010 $3,561.0
2011 4,046.0
2012 4,463.0
2013 4,962.0
2014 7,277.0
(1) Based on Purchasing Power Parity calculations, which take into account the relative cost of living and inflation rates of countries. GDP estimate for July for each year shown. Source: U.S. Central Intelligence Agency.
LIFE AND NONLIFE INSURANCE PREMIUMS, 2014
(U.S. $ millions)
Direct premiums written
Nonlife premiums (1) $14,590
Life premiums 55,299
Total premiums $69,889
Percent of total world premiums
1.46%
(1) Includes accident and health insurance. Source: Swiss Re, sigma, No. 4/2015.
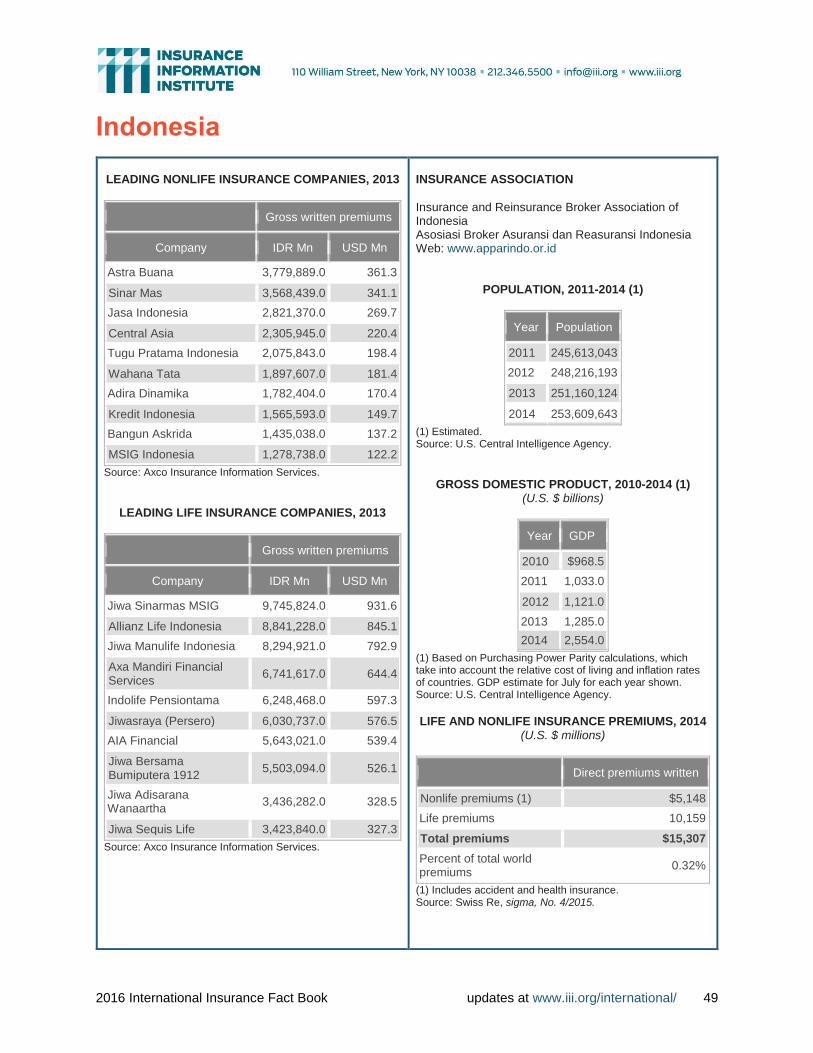
2016 International Insurance Fact Book updates at www.iii.org/international/ 49
Indonesia
LEADING NONLIFE INSURANCE COMPANIES, 2013
Gross written premiums
Company IDR Mn USD Mn
Astra Buana 3,779,889.0 361.3
Sinar Mas 3,568,439.0 341.1
Jasa Indonesia 2,821,370.0 269.7
Central Asia 2,305,945.0 220.4
Tugu Pratama Indonesia 2,075,843.0 198.4
Wahana Tata 1,897,607.0 181.4
Adira Dinamika 1,782,404.0 170.4
Kredit Indonesia 1,565,593.0 149.7
Bangun Askrida 1,435,038.0 137.2
MSIG Indonesia 1,278,738.0 122.2
Source: Axco Insurance Information Services.
LEADING LIFE INSURANCE COMPANIES, 2013
Gross written premiums
Company IDR Mn USD Mn
Jiwa Sinarmas MSIG 9,745,824.0 931.6
Allianz Life Indonesia 8,841,228.0 845.1
Jiwa Manulife Indonesia 8,294,921.0 792.9
Axa Mandiri Financial Services
6,741,617.0 644.4
Indolife Pensiontama 6,248,468.0 597.3
Jiwasraya (Persero) 6,030,737.0 576.5
AIA Financial 5,643,021.0 539.4
Jiwa Bersama Bumiputera 1912
5,503,094.0 526.1
Jiwa Adisarana Wanaartha
3,436,282.0 328.5
Jiwa Sequis Life 3,423,840.0 327.3
Source: Axco Insurance Information Services.
INSURANCE ASSOCIATION
Insurance and Reinsurance Broker Association of Indonesia Asosiasi Broker Asuransi dan Reasuransi Indonesia Web: www.apparindo.or.id
POPULATION, 2011-2014 (1)
Year Population
2011 245,613,043
2012 248,216,193
2013 251,160,124
2014 253,609,643
(1) Estimated. Source: U.S. Central Intelligence Agency.
GROSS DOMESTIC PRODUCT, 2010-2014 (1) (U.S. $ billions)
Year GDP
2010 $968.5
2011 1,033.0
2012 1,121.0
2013 1,285.0
2014 2,554.0
(1) Based on Purchasing Power Parity calculations, which take into account the relative cost of living and inflation rates of countries. GDP estimate for July for each year shown. Source: U.S. Central Intelligence Agency.
LIFE AND NONLIFE INSURANCE PREMIUMS, 2014
(U.S. $ millions)
Direct premiums written
Nonlife premiums (1) $5,148
Life premiums 10,159
Total premiums $15,307
Percent of total world premiums
0.32%
(1) Includes accident and health insurance. Source: Swiss Re, sigma, No. 4/2015.

2016 International Insurance Fact Book updates at www.iii.org/international/ 50
Iran
LEADING NONLIFE INSURANCE COMPANIES,
2013
Gross written premiums
Company IRR Mn USD Mn
Bimeh Iran 72,690,055.0 3,947.5
Bimeh Asia 16,013,873.0 869.6
Bimeh Dana 10,799,107.0 586.5
Bimeh Alborz 8,836,888.0 479.9
Bimeh Parsian 7,985,007.1 433.6
Bimeh Karafarin 5,120,862.0 278.1
Bimeh Sina 5,087,998.0 276.3
Bimeh Pasargad 5,068,092.8 275.2
Bimeh Tose'e 4,868,714.8 264.4
Bimeh Kosar 4,791,673.6 260.2
Source: Axco Insurance Information Services.
INSURANCE ASSOCIATION
Central Insurance of Iran Web: www.centinsur.ir
POPULATION, 2011-2014 (1)
Year Population
2011 77,891,220
2012 78,868,711
2013 79,853,900
2014 80,840,713
(1) Estimated. Source: U.S. Central Intelligence Agency.
GROSS DOMESTIC PRODUCT, 2010-2014 (1)
(U.S. $ billions)
Year GDP
2010 $876.0
2011 863.5
2012 928.9
2013 987.1
2014 1,284.0
(1) Based on Purchasing Power Parity calculations, which take into account the relative cost of living and inflation rates of countries. GDP estimate for July for each year shown. Source: U.S. Central Intelligence Agency.
LIFE AND NONLIFE INSURANCE PREMIUMS, 2014
(U.S. $ millions)
Direct premiums written
Nonlife premiums (1) $6,737
Life premiums 721
Total premiums $7,458
Percent of total world premiums
0.16%
(1) Includes accident and health insurance. Source: Swiss Re, sigma, No. 4/2015.

2016 International Insurance Fact Book updates at www.iii.org/international/ 51
Ireland
LEADING NONLIFE INSURANCE COMPANIES,
2013
Gross written premiums
Company EUR Mn USD Mn
Aviva Insurance Limited 327.9 435.3
RSA Insurance 324.2 430.4
FBD 302.1 401.1
AXA 285.1 378.5
Allianz Plc 281.5 373.8
Liberty Insurance Ltd 166.2 220.7
AIG Europe Limited 135.1 179.4
Zurich Insurance plc 126.2 167.5
Aviva Health 81.8 108.6
Irish Public Bodies 70.1 93.1
Source: Axco Insurance Information Services.
LEADING INSURANCE COMPANIES, 2013
Gross written premiums
Company EUR Mn USD Mn
Irish Life 4,765.7 6,327.6
Zurich Life Assurance 1,500.0 1,991.7
New Ireland 1,486.1 1,973.2
Standard Life 1,141.2 1,515.2
Aviva Life & Pensions 573.7 761.8
Canada Life Ass. (Ireland)
328.8 436.5
Friends First Man. Pen. Funds
253.3 336.3
Ark 114.0 151.4
Friends' First Life Ass. Co.
111.6 148.2
The Royal London Mutual Society
72.0 95.5
Source: Axco Insurance Information Services.
INSURANCE ASSOCIATION
Irish Insurance Federation Web: www.iif.ie
POPULATION, 2011-2014 (1)
Year Population
2011 4,670,976
2012 4,722,028
2013 4,775,982
2014 4,832,765
(1) Estimated. Source: U.S. Central Intelligence Agency.
GROSS DOMESTIC PRODUCT, 2010-2014 (1) (U.S. $ billions)
Year GDP
2010 $177.0
2011 172.3
2012 182.1
2013 190.4
2014 224.7
(1) Based on Purchasing Power Parity calculations, which take into account the relative cost of living and inflation rates of countries. GDP estimate for July for each year shown. Source: U.S. Central Intelligence Agency.
LIFE AND NONLIFE INSURANCE PREMIUMS, 2014 (U.S. $ millions)
Direct premiums written
Nonlife premiums (1) $8,817
Life premiums 45,136
Total premiums $53,954
Percent of total world premiums
1.13%
(1) Includes accident and health insurance. Source: Swiss Re, sigma, No. 4/2015.

2016 International Insurance Fact Book updates at www.iii.org/international/ 52
Israel
LEADING NONLIFE INSURANCE COMPANIES, 2013
Gross written premiums
Company ILS Mn USD Mn
Harel 4,048.1 1,131.4
Clal 2,839.9 793.7
The Phoenix 2,737.1 765.0
Migdal 2,015.5 563.3
Menora Mivtachim 1,941.8 542.7
Ayalon 1,194.0 333.7
IDI 1,172.6 327.7
AIG 775.5 216.7
ILD 749.9 209.6
Shomera 589.8 164.8
Source: Axco Insurance Information Services.
LEADING LIFE INSURANCE COMPANIES, 2013
Gross written premiums
Company ILS Mn USD Mn
Migdal 7,935.8 2,197.7
Clal 5,782.0 1,601.2
Harel 4,307.4 1,192.8
The Phoenix 4,251.1 1,177.3
Menora Mivtachim 2,061.1 570.8
Dykla 927.6 256.9
ILD 554.4 153.5
Ayalon 479.8 132.9
IDI 225.9 62.6
AIG 95.1 26.3
Source: Axco Insurance Information Services.
INSURANCE ASSOCIATION
Israel Insurance Association Web: www.igudbit.org.il
POPULATION, 2011-2014 (1)
Year Population
2011 7,473,052
2012 7,590,758
2013 7,707,042
2014 7,821,850
(1) Estimated. Source: U.S. Central Intelligence Agency.
GROSS DOMESTIC PRODUCT, 2010-2014 (1)
(U.S. $ billions)
Year GDP
2010 $205.2
2011 217.1
2012 235.1
2013 274.5
2014 268.3
(1) Based on Purchasing Power Parity calculations, which take into account the relative cost of living and inflation rates of countries. GDP estimate for July for each year shown. Source: U.S. Central Intelligence Agency.
LIFE AND NONLIFE INSURANCE PREMIUMS, 2014
(U.S. $ millions)
Direct premiums written
Nonlife premiums (1) $6,651
Life premiums 7,693
Total premiums $14,344
Percent of total world premiums
0.30%
(1) Includes accident and health insurance. Source: Swiss Re, sigma, No. 4/2015.

2016 International Insurance Fact Book updates at www.iii.org/international/ 53
Italy
LEADING NONLIFE INSURANCE COMPANIES,
2013
Gross written
premiums
Company EUR Mn USD Mn
UnipolSai Assicurazioni 8,800.1 11,684.3
Generali Italia 5,707.2 7,577.6
Allianz 3,432.2 4,557.0
Societa Cattolica 1,460.2 1,938.8
AXA Assicurazioni 1,428.0 1,896.0
Societa Reale Mutua 1,354.3 1,798.2
Groupama Assicurazioni 1,218.1 1,617.3
Vittoria Assicurazioni 982.7 1,304.7
Sara Assicurazioni 595.2 790.3
Italiana Assicurazioni 550.0 730.3
Source: Axco Insurance Information Services.
LEADING LIFE INSURANCE COMPANIES, 2013
Gross written premiums
Company EUR Mn USD Mn
Poste Vita 13,172.2 17,489.2
Intesa Sanpaolo Vita 11,506.8 15,278.1
Generali Italia 6,999.6 9,293.7
Fideuram Vita 5,635.4 7,482.3
Mediolanum Vita 4,596.7 6,103.3
BNP Paribas Cardif Vita 4,162.8 5,527.1
Alleanza Assicurazioni 3,921.5 5,206.7
UnipolSai Assicurazioni 3,437.6 4,564.2
CreditRas Vita 3,413.9 4,532.8
CNP UniCredit Vita 2,562.8 3,402.7
Source: Axco Insurance Information Services.
INSURANCE ASSOCIATION
Italian Association of Insurance Companies Associazione Nazionale fra le Imprese Assicuratrici Web: www.ania.it
POPULATION, 2011-2014 (1)
Year Population
2011 61,016,804
2012 61,261,254
2013 61,482,297
2014 61,680,122
(1) Estimated. Source: U.S. Central Intelligence Agency.
GROSS DOMESTIC PRODUCT, 2010-2014 (1)
(U.S. $ billions)
Year GDP
2010 $1,756.0
2011 1,782.0
2012 1,826.0
2013 1,805.0
2014 2,066.0
(1) Based on Purchasing Power Parity calculations, which take into account the relative cost of living and inflation rates of countries. GDP estimate for July for each year shown. Source: U.S. Central Intelligence Agency.
LIFE AND NONLIFE INSURANCE PREMIUMS, 2014
(U.S. $ millions)
Direct premiums written
Nonlife premiums (1) $49,443
Life premiums 145,292
Total premiums $194,735
Percent of total world premiums
4.08%
(1) Includes accident and health insurance. Source: Swiss Re, sigma, No. 4/2015.

2016 International Insurance Fact Book updates at www.iii.org/international/ 54
Jamaica
LEADING NONLIFE INSURANCE COMPANIES,
2013
Gross written premiums
Company JMD Mn USD Mn
Advantage General 5,203.0 51.9
General Accident (GA) 4,480.0 44.7
Jamaica International 4,318.0 43.1
British Caribbean (BCIC)
3,785.0 37.8
Insurance Company of the West Indies
3,623.0 36.1
JN General Insurance 3,309.0 33.0
Guardian General 2,807.0 28.0
Chartis 1,837.0 18.3
Key 678.0 6.8
Source: Axco Insurance Information Services.
LEADING LIFE INSURANCE COMPANIES, 2013
Gross written premiums
Company JMD Mn USD Mn
Sagicor Life Jamaica 28,040.0 279.7
Guardian Life 8,870.0 88.5
NCB Insurance 1,970.0 19.7
Scotia Life Jamaica 1,970.0 19.7
CUNA Mutual 1,430.0 14.3
JN Life 50.0 0.5
Source: Axco Insurance Information Services.
INSURANCE ASSOCIATION
The Insurance Association of Jamaica Web: www.iaj-online.com
POPULATION, 2011-2014 (1)
Year Population
2011 2,868,380
2012 2,889,187
2013 2,909,714
2014 2,930,050
(1) Estimated. Source: U.S. Central Intelligence Agency.
GROSS DOMESTIC PRODUCT, 2010-2014 (1) (U.S. $ billions)
Year GDP
2010 $23.4
2011 23.9
2012 24.6
2013 25.1
2014 24.3
(1) Based on Purchasing Power Parity calculations, which take into account the relative cost of living and inflation rates of countries. GDP estimate for July for each year shown. Source: U.S. Central Intelligence Agency.
LIFE AND NONLIFE INSURANCE PREMIUMS, 2014 (U.S. $ millions)
Direct premiums written
Nonlife premiums (1) $409
Life premiums 309
Total premiums $718
Percent of total world premiums
0.02%
(1) Includes accident and health insurance. Source: Swiss Re, sigma, No. 4/2015.

2016 International Insurance Fact Book updates at www.iii.org/international/ 55
Japan
LEADING NONLIFE INSURANCE COMPANIES,
2013
Gross written premiums
Company JYP Mn USD Mn
TMN 2,230,071.7 22,850.0
Sompo Japan 1,609,528.7 16,491.8
Mitsui Sumitomo 1,608,007.6 16,476.2
Aioi ND 1,271,145.2 13,024.6
Nipponkoa 742,706.6 7,610.0
Fuji 303,535.0 3,110.1
AIU 246,367.8 2,524.4
Kyoei 202,968.5 2,079.7
Nisshin 151,917.2 1,556.6
Sony 87,370.9 895.2
Source: Axco Insurance Information Services.
LEADING LIFE INSURANCE COMPANIES, 2013
Gross written premiums
Company JPY Mn USD Mn
Nippon 4,824,180.0 49,430.1
Japan Post 3,755,869.0 38,483.8
Meiji Yasuda 3,605,624.0 36,944.4
Dai-ichi 2,862,818.0 29,333.4
Sumitomo 2,500,078.0 25,616.6
Aflac 1,652,901.0 16,936.2
MetLife Alico 1,390,388.0 14,246.4
Dai-ichi Frontier 1,145,773.0 11,740.0
Sony 959,659.0 9,833.0
Gibraltar 947,713.0 9,710.6
Source: Axco Insurance Information Services.
INSURANCE ASSOCIATION
General Insurance Association of Japan Web: www.sonpo.or.jp/en
POPULATION, 2011-2014 (1)
Year Population
2011 126,475,664
2012 127,368,088
2013 127,253,075
2014 127,103,388
(1) Estimated. Source: U.S. Central Intelligence Agency.
GROSS DOMESTIC PRODUCT, 2010-2014 (1)
(U.S. $ billions)
Year GDP
2010 $4,141.0
2011 4,338.0
2012 4,389.0
2013 4,729.0
2014 4,807.0
(1) Based on Purchasing Power Parity calculations, which take into account the relative cost of living and inflation rates of countries. GDP estimate for July for each year shown. Source: U.S. Central Intelligence Agency.
LIFE AND NONLIFE INSURANCE PREMIUMS, 2014
(U.S. $ millions)
Direct premiums written
Nonlife premiums (1) $108,174
Life premiums 371,588
Total premiums $479,762
Percent of total world premiums
10.04%
(1) Includes accident and health insurance. Source: Swiss Re, sigma, No. 4/2015.
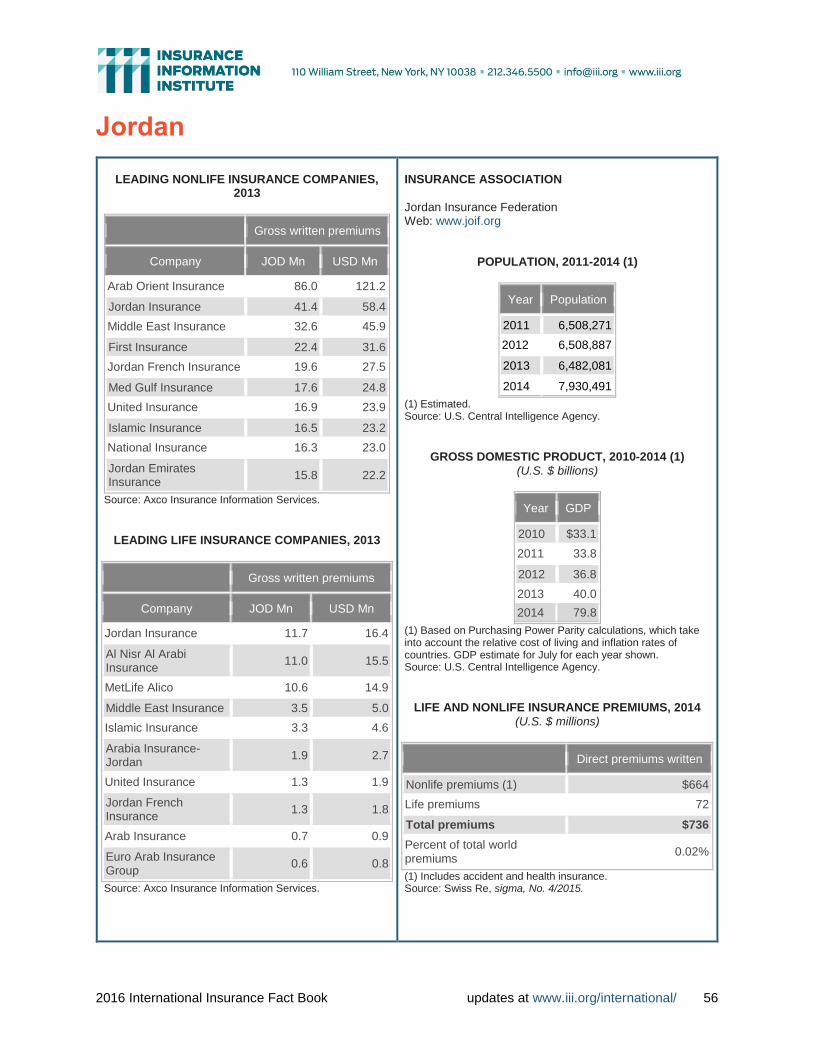
2016 International Insurance Fact Book updates at www.iii.org/international/ 56
Jordan
LEADING NONLIFE INSURANCE COMPANIES,
2013
Gross written premiums
Company JOD Mn USD Mn
Arab Orient Insurance 86.0 121.2
Jordan Insurance 41.4 58.4
Middle East Insurance 32.6 45.9
First Insurance 22.4 31.6
Jordan French Insurance 19.6 27.5
Med Gulf Insurance 17.6 24.8
United Insurance 16.9 23.9
Islamic Insurance 16.5 23.2
National Insurance 16.3 23.0
Jordan Emirates Insurance
15.8 22.2
Source: Axco Insurance Information Services.
LEADING LIFE INSURANCE COMPANIES, 2013
Gross written premiums
Company JOD Mn USD Mn
Jordan Insurance 11.7 16.4
Al Nisr Al Arabi Insurance
11.0 15.5
MetLife Alico 10.6 14.9
Middle East Insurance 3.5 5.0
Islamic Insurance 3.3 4.6
Arabia Insurance-Jordan
1.9 2.7
United Insurance 1.3 1.9
Jordan French Insurance
1.3 1.8
Arab Insurance 0.7 0.9
Euro Arab Insurance Group
0.6 0.8
Source: Axco Insurance Information Services.
INSURANCE ASSOCIATION
Jordan Insurance Federation Web: www.joif.org
POPULATION, 2011-2014 (1)
Year Population
2011 6,508,271
2012 6,508,887
2013 6,482,081
2014 7,930,491
(1) Estimated. Source: U.S. Central Intelligence Agency.
GROSS DOMESTIC PRODUCT, 2010-2014 (1)
(U.S. $ billions)
Year GDP
2010 $33.1
2011 33.8
2012 36.8
2013 40.0
2014 79.8
(1) Based on Purchasing Power Parity calculations, which take into account the relative cost of living and inflation rates of countries. GDP estimate for July for each year shown. Source: U.S. Central Intelligence Agency.
LIFE AND NONLIFE INSURANCE PREMIUMS, 2014
(U.S. $ millions)
Direct premiums written
Nonlife premiums (1) $664
Life premiums 72
Total premiums $736
Percent of total world premiums
0.02%
(1) Includes accident and health insurance. Source: Swiss Re, sigma, No. 4/2015.
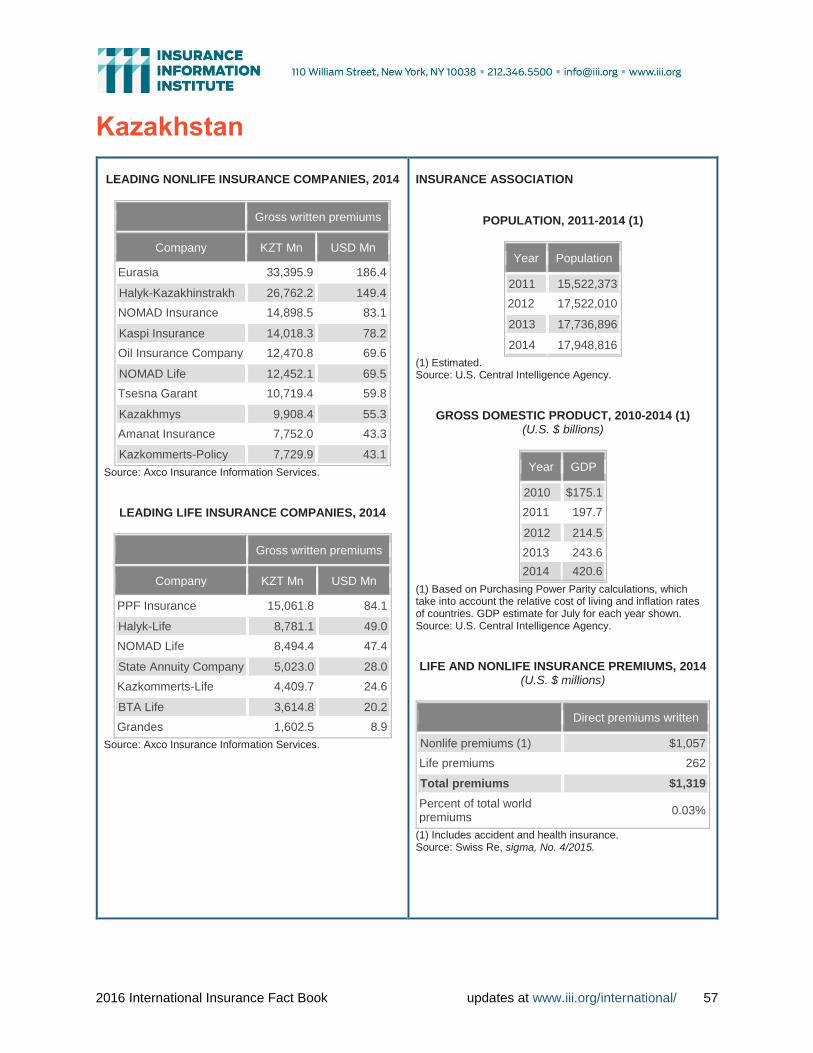
2016 International Insurance Fact Book updates at www.iii.org/international/ 57
Kazakhstan
LEADING NONLIFE INSURANCE COMPANIES, 2014
Gross written premiums
Company KZT Mn USD Mn
Eurasia 33,395.9 186.4
Halyk-Kazakhinstrakh 26,762.2 149.4
NOMAD Insurance 14,898.5 83.1
Kaspi Insurance 14,018.3 78.2
Oil Insurance Company 12,470.8 69.6
NOMAD Life 12,452.1 69.5
Tsesna Garant 10,719.4 59.8
Kazakhmys 9,908.4 55.3
Amanat Insurance 7,752.0 43.3
Kazkommerts-Policy 7,729.9 43.1
Source: Axco Insurance Information Services.
LEADING LIFE INSURANCE COMPANIES, 2014
Gross written premiums
Company KZT Mn USD Mn
PPF Insurance 15,061.8 84.1
Halyk-Life 8,781.1 49.0
NOMAD Life 8,494.4 47.4
State Annuity Company 5,023.0 28.0
Kazkommerts-Life 4,409.7 24.6
BTA Life 3,614.8 20.2
Grandes 1,602.5 8.9
Source: Axco Insurance Information Services.
INSURANCE ASSOCIATION
POPULATION, 2011-2014 (1)
Year Population
2011 15,522,373
2012 17,522,010
2013 17,736,896
2014 17,948,816
(1) Estimated. Source: U.S. Central Intelligence Agency.
GROSS DOMESTIC PRODUCT, 2010-2014 (1) (U.S. $ billions)
Year GDP
2010 $175.1
2011 197.7
2012 214.5
2013 243.6
2014 420.6
(1) Based on Purchasing Power Parity calculations, which take into account the relative cost of living and inflation rates of countries. GDP estimate for July for each year shown. Source: U.S. Central Intelligence Agency.
LIFE AND NONLIFE INSURANCE PREMIUMS, 2014
(U.S. $ millions)
Direct premiums written
Nonlife premiums (1) $1,057
Life premiums 262
Total premiums $1,319
Percent of total world premiums
0.03%
(1) Includes accident and health insurance. Source: Swiss Re, sigma, No. 4/2015.

2016 International Insurance Fact Book updates at www.iii.org/international/ 58
Kenya
LEADING NONLIFE INSURANCE COMPANIES, 2014
Gross written premiums
Company KES Mn USD Mn
Jubilee Insurance Co. 10,120.2 115.1
CIC General Insurance 9,552.6 108.7
APA Insurance Co. 7,804.0 88.8
UAP Insurance Co. 7,533.0 85.7
ICEA LION General Insurance
5,254.1 59.8
Britam 5,001.1 56.9
AIG Kenya Insurance Co. 4,090.6 46.5
Heritage Insurance Co. 4,026.6 45.8
GA Insurance Co. 3,816.8 43.4
AAR Insurance Kenya 3,560.5 40.5
Source: Axco Insurance Information Services.
LEADING LIFE INSURANCE COMPANIES, 2014
Gross written premiums
Company KES Mn USD Mn
Jubilee Insurance Co. 11,064.3 125.8
Britam 10,113.3 115.0
ICEA Lion Life Assurance Ltd.
6,536.1 74.3
Pan Africa Insurance 5,569.8 63.4
Liberty Life Assurance 4,395.6 50.0
CIC Life Assurance 4,286.8 48.8
UAP Life Assurance 2,594.0 29.5
Kenindia Assurance Co. Ltd.
2,531.8 28.8
Pioneer Assurance Co. 2,464.3 28.0
Old Mutual Life Assurance Co.
1,645.5 18.7
Source: Axco Insurance Information Services.
INSURANCE ASSOCIATION
The Association of Kenya Insurers Web: www.akinsure.com
POPULATION, 2011-2014 (1)
Year Population
2011 41,070,934
2012 43,013,341
2013 44,037,656
2014 45,010,056
(1) Estimated. Source: U.S. Central Intelligence Agency.
GROSS DOMESTIC PRODUCT, 2010-2014 (1)
(U.S. $ billions)
Year GDP
2010 $63.5
2011 66.0
2012 71.5
2013 79.9
2014 134.7
(1) Based on Purchasing Power Parity calculations, which take into account the relative cost of living and inflation rates of countries. GDP estimate for July for each year shown. Source: U.S. Central Intelligence Agency.
LIFE AND NONLIFE INSURANCE PREMIUMS, 2014
(U.S. $ millions)
Direct premiums written
Nonlife premiums (1) $1,152
Life premiums 632
Total premiums $1,784
Percent of total world premiums
0.04%
(1) Includes accident and health insurance. Source: Swiss Re, sigma, No. 4/2015.

2016 International Insurance Fact Book updates at www.iii.org/international/ 59
Kuwait
LEADING NONLIFE INSURANCE COMPANIES, 2012
Gross written premiums
Company KWD Mn USD Mn
Kuwait Insurance Company 26.8 95.7
Gulf Insurance Company 23.8 85.1
Warba Insurance Company 20.7 74.0
Al-Ahleia Insurance Company
19.3 68.7
Bahrain Kuwait Insurance Company
7.6 27.3
National Takaful Insurance Company
5.5 19.7
Enaya Insurance Company 5.4 19.3
First Takaful Insurance Company
5.0 17.7
Oriental Insurance Company
4.2 14.9
Al-Muthanna Takaful Insurance
3.9 13.8
Source: Axco Insurance Information Services.
LEADING LIFE INSURANCE COMPANIES, 2012
Gross written premiums
Company KWD Mn USD Mn
Gulf Life Insurance Company
42.0 149.9
MetLife Alico Kuwait 11.8 42.1
Al-Ahleia Insurance Company
7.1 25.5
Kuwait Insurance Company 5.5 19.6
Al-Muthanna Takaful Insurance Company
3.4 12.3
Warba Insurance Company 3.2 11.2
Legal and General Gulf 2.2 7.8
Gulf Takaful Insurance Company
1.8 6.5
Boubyan Takaful Insurance Company
1.6 5.7
Arabia Insurance Company 1.4 4.9
Source: Axco Insurance Information Services.
INSURANCE ASSOCIATION
POPULATION, 2011-2014 (1)
Year Population
2011 2,595,628
2012 2,646,314
2013 2,695,316
2014 2,742,711
(1) Estimated. Source: U.S. Central Intelligence Agency.
GROSS DOMESTIC PRODUCT, 2010-2014 (1) (U.S. $ billions)
Year GDP
2010 $148.7
2011 144.3
2012 149.8
2013 165.8
2014 283.9
(1) Based on Purchasing Power Parity calculations, which take into account the relative cost of living and inflation rates of countries. GDP estimate for July for each year shown. Source: U.S. Central Intelligence Agency.
LIFE AND NONLIFE INSURANCE PREMIUMS, 2014 (U.S. $ millions)
Direct premiums written
Nonlife premiums (1) $816
Life premiums 191
Total premiums $1,007
Percent of total world premiums
0.02%
(1) Includes accident and health insurance. Source: Swiss Re, sigma, No. 4/2015.

2016 International Insurance Fact Book updates at www.iii.org/international/ 60
Lebanon
LEADING NONLIFE INSURANCE COMPANIES,
2013
Gross written premiums
Company LBP Mn USD Mn
Medgulf 185,586.7 123.1
AXA M.E. 140,386.1 93.1
Bankers 128,686.1 85.4
Libano-Suisse 94,669.7 62.8
Fidelity 84,084.6 55.8
Allianz SNA 82,979.7 55.0
Arope 82,209.9 54.5
LIA (Lib-Arabe) 71,517.1 47.4
Al-Mashrek 57,383.7 38.1
Assurex 43,897.8 29.1
Source: Axco Insurance Information Services.
LEADING LIFE INSURANCE COMPANIES, 2013
Gross written premiums
Company LBP Mn USD Mn
ALICO - MetLife 116,020.7 77.0
Allianz SNA 83,896.8 55.7
Bancassurance 81,638.1 54.2
Arope 65,536.4 43.5
LIA (Lib-Arabe) 61,860.2 41.0
Adonis (ADIR) 51,420.1 34.1
Sogecap 19,725.8 13.1
Medgulf 17,960.3 11.9
Credit Libanais 17,571.5 11.7
Bankers 15,952.3 10.6
Source: Axco Insurance Information Services.
INSURANCE ASSOCIATION
Insurance Association Association des Compagnies d'Assurances au Liban Web: www.acal.org.lb
POPULATION, 2011-2014 (1)
Year Population
2011 4,143,101
2012 4,140,289
2013 4,131,583
2014 5,882,562
(1) Estimated. Source: U.S. Central Intelligence Agency.
GROSS DOMESTIC PRODUCT, 2010-2014 (1) (U.S. $ billions)
Year GDP
2010 $47.8
2011 58.7
2012 61.6
2013 64.3
2014 80.5
(1) Based on Purchasing Power Parity calculations, which take into account the relative cost of living and inflation rates of countries. GDP estimate for July for each year shown. Source: U.S. Central Intelligence Agency.
LIFE AND NONLIFE INSURANCE PREMIUMS, 2014 (U.S. $ millions)
Direct premiums written
Nonlife premiums (1) $1,078
Life premiums 434
Total premiums $1,513
Percent of total world premiums
0.03%
(1) Includes accident and health insurance. Source: Swiss Re, sigma, No. 4/2015.

2016 International Insurance Fact Book updates at www.iii.org/international/ 61
Liechtenstein
No data available for leading writers.
INSURANCE ASSOCIATION
Liechtensteinischer Versicherungsverband Web: www.lvv.li
POPULATION, 2011-2014 (1)
Year Population
2011 35,236
2012 36,713
2013 37,009
2014 37,313
(1) Estimated. Source: U.S. Central Intelligence Agency.
GROSS DOMESTIC PRODUCT, 2010-2014 (1)
(U.S. $ billions)
Year GDP
2010 NA
2011 NA
2012 NA
2013 NA
2014 NA
(1) Based on Purchasing Power Parity calculations, which take into account the relative cost of living and inflation rates of countries. GDP estimate for July for each year shown. NA=Data not available. Source: U.S. Central Intelligence Agency.
LIFE AND NONLIFE INSURANCE PREMIUMS, 2014 (U.S. $ millions)
Direct premiums written
Nonlife premiums (1) $1,159
Life premiums 2,568
Total premiums $3,727
Percent of total world premiums
0.08%
(1) Includes accident and health insurance. Source: Swiss Re, sigma, No. 4/2015.

2016 International Insurance Fact Book updates at www.iii.org/international/ 62
Lithuania
LEADING NONLIFE INSURANCE COMPANIES,
2013
Gross written premiums
Company LTL Mn USD Mn
Lietuvos Draudimas 409.9 157.6
BTA 186.8 71.8
PZU Lietuva 179.7 69.1
Ergo Lietuva 154.7 59.5
Gjensidige Baltic 103.1 39.6
If P&C 92.4 35.5
Compensa Vienna 51.6 19.8
Seesam Lietuva 48.1 18.5
Swedbank 14.6 5.6
Vereinigte Hagel 13.9 5.4
Source: Axco Insurance Information Services.
LEADING LIFE INSURANCE COMPANIES, 2013
Gross written premiums
Company LTL Mn USD Mn
Swedbank Elu 136.8 52.6
SEB gyvybes 132.9 51.1
Aviva Lietuva 127.2 48.9
Ergo Lietuva gyvybes 73.9 28.4
Compensa Life Vienna 61.4 23.6
Mandatum Life 58.1 22.3
PZU Lietuvagyvybes 26.1 10.0
Bonum Publicum 18.5 7.1
AMPLICO Life 18.1 7.0
Liteuvos Draudimas 0.1 0.0
Source: Axco Insurance Information Services.
INSURANCE ASSOCIATION
Association of Lithuanian Insurers Web: www.draudikai.lt/lt
POPULATION, 2011-2014 (1)
Year Population
2011 3,535,547
2012 3,525,761
2013 3,515,858
2014 3,505,738
(1) Estimated. Source: U.S. Central Intelligence Agency.
GROSS DOMESTIC PRODUCT, 2010-2014 (1) (U.S. $ billions)
Year GDP
2010 NA
2011 $56.2
2012 61.3
2013 67.4
2014 79.0
(1) Based on Purchasing Power Parity calculations, which take into account the relative cost of living and inflation rates of countries. GDP estimate for July for each year shown. NA=Data not available. Source: U.S. Central Intelligence Agency.
LIFE AND NONLIFE INSURANCE PREMIUMS, 2010 (U.S. $ millions)
Direct premiums written
Nonlife premiums (1) $388
Life premiums 207
Total premiums $595
Percent of total world premiums
0.01%
(1) Includes accident and health insurance. Source: Swiss Re, sigma, No. 2/2011.

2016 International Insurance Fact Book updates at www.iii.org/international/ 63
Luxembourg
LEADING NONLIFE INSURANCE COMPANIES,
2013
Gross written premiums
Company EUR Mn USD Mn
Foyer Assurances 297.5 395.0
La Luxembourgeoise 223.0 296.1
AXA Assurances Luxembourg
101.8 135.1
Baloise Assurances Luxembourg
64.3 85.4
DKV Luxembourg 29.8 39.6
P&V Assurances 27.7 36.8
Allianz Insurance Luxembourg
22.1 29.3
AIG 17.9 23.7
Foyer Sante 13.9 18.4
Foyer Arag 8.8 11.7
Source: Axco Insurance Information Services.
LEADING LIFE INSURANCE COMPANIES, 2013
Gross written premiums
Company EUR Mn USD Mn
Swiss Life (Luxembourg) 238.5 331.6
Cardif Lux Vie 148.6 206.5
Foyer Vie 144.9 201.4
La Luxembourgoise Vie 132.9 184.7
Allianz Life Luxembourg 119.3 165.9
Sogelife 73.3 101.9
CALI Europe 72.9 101.4
AXA Assurances Vie Luxembourg
61.2 85.0
Baloise Vie Luxembourg 55.5 77.1
IWI Wealth Management 46.2 64.3
Source: Axco Insurance Information Services.
INSURANCE ASSOCIATION
Insurance Companies' Association Web: www.aca.lu
POPULATION, 2011-2014 (1)
Year Population
2011 503,302
2012 509,074
2013 514,862
2014 520,672
(1) Estimated. Source: U.S. Central Intelligence Agency.
GROSS DOMESTIC PRODUCT, 2010-2014 (1)
(U.S. $ billions)
Year GDP
2010 $38.1
2011 40.8
2012 43.6
2013 42.7
2014 50.7
(1) Based on Purchasing Power Parity calculations, which take into account the relative cost of living and inflation rates of countries. GDP estimate for July for each year shown. Source: U.S. Central Intelligence Agency.
LIFE AND NONLIFE INSURANCE PREMIUMS, 2014
(U.S. $ millions)
Direct premiums written
Nonlife premiums (1) $3,977
Life premiums 31,303
Total premiums $35,280
Percent of total world premiums
0.74%
(1) Includes accident and health insurance. Source: Swiss Re, sigma, No. 4/2015.

2016 International Insurance Fact Book updates at www.iii.org/international/ 64
Macau
No data available for leading writers.
INSURANCE ASSOCIATION
Macao Insurers’ Association Web: www.mia-macau.com
POPULATION, 2011-2014 (1)
Year Population
2011 573,003
2012 578,025
2013 583,003
2014 587,914
(1) Estimated. Source: U.S. Central Intelligence Agency.
GROSS DOMESTIC PRODUCT, 2010-2014 (1)
(U.S. $ billions)
Year GDP
2010 NA
2011 $18.5
2012 18.5
2013 47.2
2014 51.7
(1) Based on Purchasing Power Parity calculations, which take into account the relative cost of living and inflation rates of countries. GDP estimate for July for each year shown. NA=Data not available. Source: U.S. Central Intelligence Agency.
LIFE AND NONLIFE INSURANCE PREMIUMS, 2014 (U.S. $ millions)
Direct premiums written
Nonlife premiums (1) $263
Life premiums 837
Total premiums $1,099
Percent of total world premiums
0.02%
(1) Includes accident and health insurance. Source: Swiss Re, sigma, No. 4/2015.

2016 International Insurance Fact Book updates at www.iii.org/international/ 65
Malaysia
LEADING NONLIFE INSURANCE COMPANIES, 2013
Gross written premiums
Company MYR Mn USD Mn
Allianz General Insurance Company (Malaysia) Berhad
1,975.4 639.6
AmGeneral Insurance Berhad
1,583.4 512.6
MSIG Insurance (Malaysia) Bhd
1,425.7 461.6
Etiqa Insurance Berhad 1,310.9 424.4
Lonpac Insurance Bhd 1,027.0 332.5
Tokio Marine Insurans (Malaysia) Berhad
1,013.3 328.0
AXA Affin General Insurance Berhad
963.2 311.9
ACE Jerneh Insurance Berhad
778.2 251.9
AIG Malaysia Insurance Berhad
624.4 202.2
Multi-Purpose Insurans Bhd 557.5 180.5
Source: Axco Insurance Information Services.
LEADING LIFE INSURANCE COMPANIES, 2011
Gross written premiums
Company MYR Mn USD Mn
Great Eastern 5,780.0 1,888.9
Prudential 4,359.6 1,424.7
ING 2,486.1 812.5
AIA Bhd 2,411.4 788.0
Hong Leong 1,674.6 547.2
Allianz Life 1,129.4 369.1
Etiqa 608.2 198.8
MCIS Zurich 587.3 191.9
Tokio Marine Life 475.2 155.3
ZURICH 466.7 152.5
Source: Axco Insurance Information Services.
INSURANCE ASSOCIATION
General Insurance Association of Malyasia Web: www.piam.org.my
POPULATION, 2011-2014 (1)
Year Population
2011 28,728,607
2012 29,179,952
2013 29,628,392
2014 30,073,353
(1) Estimated. Source: U.S. Central Intelligence Agency.
GROSS DOMESTIC PRODUCT, 2010-2014 (1)
(U.S. $ billions)
Year GDP
2010 $378.9
2011 416.7
2012 447.0
2013 525.0
2014 746.8
(1) Based on Purchasing Power Parity calculations, which take into account the relative cost of living and inflation rates of countries. GDP estimate for July for each year shown. Source: U.S. Central Intelligence Agency.
LIFE AND NONLIFE INSURANCE PREMIUMS, 2014
(U.S. $ millions)
Direct premiums written
Nonlife premiums (1) $5,633
Life premiums 10,231
Total premiums $15,864
Percent of total world premiums
0.33%
(1) Includes accident and health insurance. Source: Swiss Re, sigma, No. 4/2015.

2016 International Insurance Fact Book updates at www.iii.org/international/ 66
Malta
LEADING NONLIFE INSURANCE COMPANIES,
2005
Gross written premiums
Company MTL Mn USD Mn
Middlesea 12.3 35.6
Gasan Mamo 9.3 26.9
Atlas 7.0 20.2
Elmo 5.3 15.3
Citadel 3.3 9.5
Source: Axco Insurance Information Services.
LEADING LIFE INSURANCE COMPANIES, 2005
Gross written premiums
Company MTL Mn SD Mn
Middlesea Valletta 39.3 113.6
HSBC Life 17.0 49.1
GlobalCapital 3.8 11.0
Middlesea Insurance 0.6 1.7
Citadel 0.3 0.9
Source: Axco Insurance Information Services.
INSURANCE ASSOCIATION
Malta Insurance Association Web: www.maltainsurance.org
POPULATION, 2011-2014 (1)
Year Population
2011 408,333
2012 409,836
2013 411,277
2014 412,655
(1) Estimated. Source: U.S. Central Intelligence Agency.
GROSS DOMESTIC PRODUCT, 2010-2014 (1)
(U.S. $ billions)
Year GDP
2010 $9.7
2011 11.8
2012 10.9
2013 11.5
2014 13.4
(1) Based on Purchasing Power Parity calculations, which take into account the relative cost of living and inflation rates of countries. GDP estimate for July for each year shown. Source: U.S. Central Intelligence Agency.
LIFE AND NONLIFE INSURANCE PREMIUMS, 2014
(U.S. $ millions)
Direct premiums written
Nonlife premiums (1) $2,098
Life premiums 1,430
Total premiums $3,528
Percent of total world premiums
0.07%
(1) Includes accident and health insurance. Source: Swiss Re, sigma, No. 4/2015.

2016 International Insurance Fact Book updates at www.iii.org/international/ 67
Mauritius
LEADING NONLIFE INSURANCE COMPANIES,
2013
Gross written premiums
Company MUR Mn USD Mn
Swan 2,071.6 67.5
MUA 1,630.4 53.1
Mauritian Eagle 865.5 28.2
SICOM 632.4 20.6
Jubilee 391.4 12.8
New India 338.6 11.0
Phoenix 244.4 8.0
BAI 223.4 7.3
Lamco 206.5 6.7
Sun 166.3 5.4
Source: Axco Insurance Information Services.
LEADING LIFE INSURANCE COMPANIES, 2013
Gross written premiums
Company MUR Mn USD Mn
BAI 7,238.7 235.8
SICOM 3,417.7 111.3
Anglo 3,002.0 97.8
LPM 675.7 22.0
LIC 338.5 11.0
Mauritian Eagle 166.5 5.4
Island Life 163.6 5.3
Phoenix 14.4 0.5
Lamco 5.1 0.2
IOGA 5.0 0.2
Source: Axco Insurance Information Services.
INSURANCE ASSOCIATION
Financial Services Commission Web: www.fscmauritius.org/ POPULATION, 2011-2014 (1)
Year Population
2011 1,303,717
2012 1,313,095
2013 1,322,238
2014 1,331,155
(1) Estimated. Source: U.S. Central Intelligence Agency.
GROSS DOMESTIC PRODUCT, 2010-2014 (1) (U.S. $ billions)
Year GDP
2010 $15.9
2011 NA
2012 NA
2013 21.0
2014 23.4
(1) Based on Purchasing Power Parity calculations, which take into account the relative cost of living and inflation rates of countries. GDP estimate for July for each year shown. NA=Data not available. Source: U.S. Central Intelligence Agency.
LIFE AND NONLIFE INSURANCE PREMIUMS, 2014
(U.S. $ millions)
Direct premiums written
Nonlife premiums (1) $244
Life premiums 522
Total premiums $766
Percent of total world premiums
0.02%
(1) Includes accident and health insurance. Source: Swiss Re, sigma, No. 4/2015.

2016 International Insurance Fact Book updates at www.iii.org/international/ 68
Mexico
LEADING NONLIFE INSURANCE COMPANIES, 2013
Gross written premiums
Company MXN Mn USD Mn
Seguros Inbursa 17,667.8 1,383.3
AXA Seguros 16,899.1 1,323.1
Qualitas, Cia de Segs 14,956.9 1,171.1
Grupo Nacional Provincial 10,859.6 850.3
MAPFRE Tepeyac 7,928.8 620.8
Seguros Banorte Generali 6,978.3 546.4
Zurich Cia de Segs 6,307.9 493.9
ABA Seguros 6,033.7 472.4
Seguros BBVA Bancomer 4,941.7 386.9
Agroasemex 4,051.9 317.3
Source: Axco Insurance Information Services.
LEADING LIFE INSURANCE COMPANIES, 2014
Gross written premiums
Company MXN Mn USD Mn
MetLife Mexico 51,053.8 3,840.8
GNP 29,236.9 2,199.5
Banamex 22,251.8 1,674.0
Monterrey New York Life 18,427.0 1,386.3
BBVA Bancomer 15,096.0 1,135.7
AXA Seguros 14,144.5 1,064.1
Pensiones Banorte 8,048.3 605.5
Pensiones BBVA Bancomer
7,735.8 582.0
Banorte Generali 7,162.3 538.8
Inbursa 6,334.2 476.5
Source: Axco Insurance Information Services.
INSURANCE ASSOCIATION
Mexican Association of Insurance Institutions Asociacion Mexicana de Instituciones de Seguros AC Web: www.amis.com.mx
POPULATION, 2011-2014 (1)
Year Population
2011 113,724,226
2012 114,975,406
2013 116,220,947
2014 120,286,655
(1) Estimated. Source: U.S. Central Intelligence Agency.
GROSS DOMESTIC PRODUCT, 2010-2014 (1) (U.S. $ billions)
Year GDP
2010 $1,473.0
2011 1,560.0
2012 1,657.0
2013 1,845.0
2014 2,143.0
(1) Based on Purchasing Power Parity calculations, which take into account the relative cost of living and inflation rates of countries. GDP estimate for July for each year shown. Source: U.S. Central Intelligence Agency.
LIFE AND NONLIFE INSURANCE PREMIUMS, 2014
(U.S. $ millions)
Direct premiums written
Nonlife premiums (1) $14,645
Life premiums 12,597
Total premiums $27,242
Percent of total world premiums
0.57%
(1) Includes accident and health insurance. Source: Swiss Re, sigma, No. 4/2015.

2016 International Insurance Fact Book updates at www.iii.org/international/ 69
Morocco
LEADING NONLIFE INSURANCE COMPANIES,
2013
Gross written premiums
Company MAD Mn USD Mn
CNIA Saada Insurance 3,051.2 363.0
Wafa Assurance 2,919.2 347.3
Axa Assurance Maroc 2,753.9 327.6
RMA Watanya 2,625.0 312.3
Sanad 1,282.7 152.6
Atlanta 1,271.4 151.3
Zurich 1,079.1 128.4
MAMDA 719.1 85.6
CAT 648.7 77.2
MCMA 423.2 50.3
Source: Axco Insurance Information Services.
LEADING LIFE INSURANCE COMPANIES, 2013
Gross written premiums
Company MAD Mn USD Mn
Wafa Assurance 2,818.6 335.3
RMA Watanya 2,201.8 261.9
MCMA 1,010.3 120.2
Marocaine Vie 948.3 112.8
Axa Assurance Maroc 851.7 101.3
CNIA Saada Insurance 387.5 46.1
Sanad 179.1 21.3
Atlanta 167.4 19.9
Zurich 26.0 3.1
Source: Axco Insurance Information Services.
INSURANCE ASSOCIATION
Federation Marocaine des Societes d'Assurances et de Reassurance Web: www.fmsar.org.ma
POPULATION, 2011-2014 (1)
Year Population
2011 31,968,361
2012 32,309,239
2013 32,649,130
2014 32,987,206
(1) Estimated. Source: U.S. Central Intelligence Agency.
GROSS DOMESTIC PRODUCT, 2010-2014 (1) (U.S. $ billions)
Year GDP
2010 $146.7
2011 153.8
2012 163.0
2013 180.0
2014 254.4
(1) Based on Purchasing Power Parity calculations, which take into account the relative cost of living and inflation rates of countries. GDP estimate for July for each year shown. Source: U.S. Central Intelligence Agency.
LIFE AND NONLIFE INSURANCE PREMIUMS, 2014 (U.S. $ millions)
Direct premiums written
Nonlife premiums (1) $2,257
Life premiums 1,143
Total premiums $3,400
Percent of total world premiums
0.07%
(1) Includes accident and health insurance. Source: Swiss Re, sigma, No. 4/2015.

2016 International Insurance Fact Book updates at www.iii.org/international/ 70
Namibia
LEADING NONLIFE INSURANCE COMPANIES,
2009
Gross written premiums
Company ZAR Mn USD Mn
Santam 373.0 44.0
M&F 339.9 40.1
Hollard 242.1 28.6
Corporate Guarantee
127.3 15.0
Western 91.0 10.7
Legal Shield 48.6 5.7
Swabou 46.8 5.5
Prosperity 30.2 3.6
Guardrisk 29.2 3.5
NASRIA 14.0 1.7
Source: Axco Insurance Information Services.
LEADING LIFE INSURANCE COMPANIES, 2009
Gross written premiums
Company NAD Mn USD Mn
OMLAC 1,798.7 212.3
Sanlam Life Namibia 751.0 88.6
Metropolitan 488.7 57.7
Sanlam Namibia 458.1 54.1
Investment Solutions 331.4 39.1
Momentum 183.0 21.6
Prosperity 74.9 8.8
PPS 60.7 7.2
Namlife 60.3 7.1
Trustco Life 44.3 5.2
Source: Axco Insurance Information Services.
INSURANCE ASSOCIATION
Namibia Insurance Association Web: www.mbendi.com
POPULATION, 2011-2014 (1)
Year Population
2011 2,147,585
2012 2,165,828
2013 2,182,852
2014 2,198,406
(1) Estimated. Source: U.S. Central Intelligence Agency.
GROSS DOMESTIC PRODUCT, 2010-2014 (1)
(U.S. $ billions)
Year GDP
2010 NA
2011 $14.6
2012 15.5
2013 17.8
2014 23.6
(1) Based on Purchasing Power Parity calculations, which take into account the relative cost of living and inflation rates of countries. GDP estimate for July for each year shown. NA=Data not available. Source: U.S. Central Intelligence Agency.
LIFE AND NONLIFE INSURANCE PREMIUMS, 2014 (U.S. $ millions)
Direct premiums written
Nonlife premiums (1) $283
Life premiums 648
Total premiums $931
Percent of total world premiums 0.02%
(1) Includes accident and health insurance. Source: Swiss Re, sigma, No. 4/2015.

2016 International Insurance Fact Book updates at www.iii.org/international/ 71
Netherlands
LEADING NONLIFE INSURANCE COMPANIES, 2013
Gross written premiums
Company EUR Mn USD Mn
Centrale Zorgverzekeraars Groep, Zorgverzekeraar ua OWM
5,876.6 7,802.6
Zilveren Kruis Achmea Zorgverzekering en NV
5,793.5 7,692.3
VGZ Zorgverzekeraar NV 5,782.0 7,677.0
Menzis Zorgverzekeraar NV 4,100.1 5,443.9
Achmea Schadeverzekeringen NV
3,123.2 4,146.7
Agis Zorgverzekeringen NV 3,109.6 4,128.7
Univé Zorg NV 1,906.5 2,531.3
IZA Zorgverzekeraar NV 1,568.3 2,082.3
Nationale-Nederlanden Schadeverzekering Maatschappij NV
1,306.5 1,734.6
Delta Lloyd Schadeverzekering NV
1,150.7 1,527.8
Source: Axco Insurance Information Services.
LEADING LIFE INSURANCE COMPANIES, 2013
Gross written premiums
Company EUR Mn USD Mn
AEGON Levensverzekering NV 3,134.7 4,162.1
Nationale-Nederlanden Levensverzekering Maatschappij NV
3,038.8 4,034.7
SRLEV NV 2,382.6 3,163.5
Delta Lloyd Levensverzekering NV
2,149.7 2,854.3
Achmea Pensioen- en Levensverzekeringen NV
2,053.9 2,727.1
ASR Levensverzekering NV 1,667.3 2,213.7
ABN AMRO Levensverzekering NV
361.5 479.9
DELA Natura- en Levensverzekeringen NV
345.3 458.5
Allianz Nederland Levensverzekering NV
277.0 367.8
Legal & General Nederland Levensverzekering Maatschappij NV
236.0 313.3
Source: Axco Insurance Information Services.
INSURANCE ASSOCIATION
Insurance Companies Association Verbond Van Verzekeraars Web: www.verzekeraars.nl/Paginas/Home.aspx
POPULATION, 2011-2014 (1)
Year Population
2011 16,847,007
2012 16,730,632
2013 16,805,037
2014 16,877,351
(1) Estimated. Source: U.S. Central Intelligence Agency.
GROSS DOMESTIC PRODUCT, 2010-2014 (1) (U.S. $ billions)
Year GDP
2010 $652.3
2011 680.4
2012 705.7
2013 696.3
2014 798.1
(1) Based on Purchasing Power Parity calculations, which take into account the relative cost of living and inflation rates of countries. GDP estimate for July for each year shown. Source: U.S. Central Intelligence Agency.
LIFE AND NONLIFE INSURANCE PREMIUMS, 2014
(U.S. $ millions)
Direct premiums written
Nonlife premiums (1) $74,100
Life premiums 21,855
Total premiums $95,956
Percent of total world premiums
2.01%
(1) Includes accident and health insurance. Source: Swiss Re, sigma, No. 4/2015.
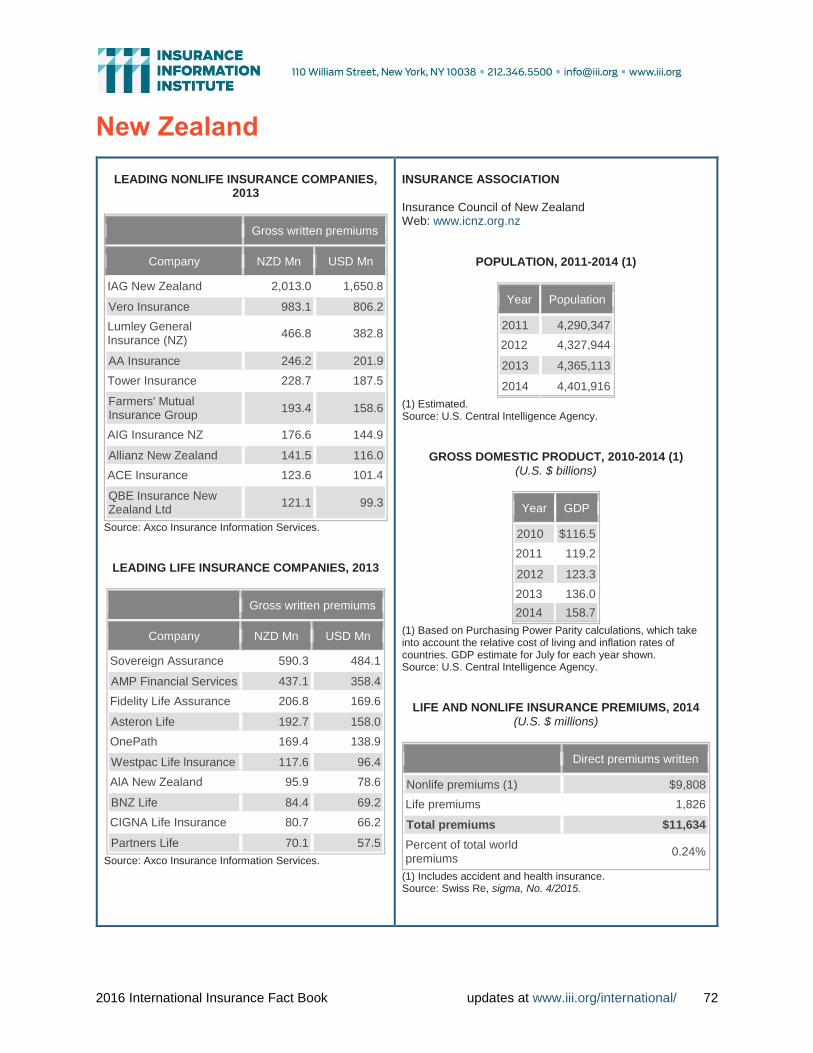
2016 International Insurance Fact Book updates at www.iii.org/international/ 72
New Zealand
LEADING NONLIFE INSURANCE COMPANIES,
2013
Gross written premiums
Company NZD Mn USD Mn
IAG New Zealand 2,013.0 1,650.8
Vero Insurance 983.1 806.2
Lumley General Insurance (NZ)
466.8 382.8
AA Insurance 246.2 201.9
Tower Insurance 228.7 187.5
Farmers' Mutual Insurance Group
193.4 158.6
AIG Insurance NZ 176.6 144.9
Allianz New Zealand 141.5 116.0
ACE Insurance 123.6 101.4
QBE Insurance New Zealand Ltd
121.1 99.3
Source: Axco Insurance Information Services.
LEADING LIFE INSURANCE COMPANIES, 2013
Gross written premiums
Company NZD Mn USD Mn
Sovereign Assurance 590.3 484.1
AMP Financial Services 437.1 358.4
Fidelity Life Assurance 206.8 169.6
Asteron Life 192.7 158.0
OnePath 169.4 138.9
Westpac Life lnsurance 117.6 96.4
AlA New Zealand 95.9 78.6
BNZ Life 84.4 69.2
CIGNA Life Insurance 80.7 66.2
Partners Life 70.1 57.5
Source: Axco Insurance Information Services.
INSURANCE ASSOCIATION
Insurance Council of New Zealand Web: www.icnz.org.nz
POPULATION, 2011-2014 (1)
Year Population
2011 4,290,347
2012 4,327,944
2013 4,365,113
2014 4,401,916
(1) Estimated. Source: U.S. Central Intelligence Agency.
GROSS DOMESTIC PRODUCT, 2010-2014 (1)
(U.S. $ billions)
Year GDP
2010 $116.5
2011 119.2
2012 123.3
2013 136.0
2014 158.7
(1) Based on Purchasing Power Parity calculations, which take into account the relative cost of living and inflation rates of countries. GDP estimate for July for each year shown. Source: U.S. Central Intelligence Agency.
LIFE AND NONLIFE INSURANCE PREMIUMS, 2014
(U.S. $ millions)
Direct premiums written
Nonlife premiums (1) $9,808
Life premiums 1,826
Total premiums $11,634
Percent of total world premiums
0.24%
(1) Includes accident and health insurance. Source: Swiss Re, sigma, No. 4/2015.

2016 International Insurance Fact Book updates at www.iii.org/international/ 73
Nigeria
LEADING NONLIFE INSURANCE COMPANIES, 2013
Gross written premiums
Company NGN Mn USD Mn
Leadway Assurance Co. Ltd.
19,371.1 123.1
Custodian and Allied Insurance Co. Plc.
17,167.1 109.1
Mansard Insurance Plc. 10,604.1 67.4
AIICO Insurance Plc. 9,354.9 59.5
NEM Insurance Co. Plc. 8,933.3 56.8
Sovereign Trust Insurance Plc.
8,673.7 55.1
STACO Insurance Plc. 6,743.0 42.9
Royal Exchange ASS Nigeria Plc.
6,736.8 42.8
Zenith General Insurance Co. Ltd.
6,605.3 42.0
Industrial and General Insurance Plc.
6,527.1 41.5
Source: Axco Insurance Information Services.
LEADING LIFE INSURANCE COMPANIES, 2013
Gross written premiums
Company NGN Mn
USD Mn
Leadway Assurance Co. Ltd. 16,732.2 106.4
AIICO Insurance URANCE Plc. 13,388.5 85.1
Niger Insurance Plc. 7,582.3 48.2
African Alliance Insurance Co. Ltd.
6,569.0 41.8
FBN LIFE 3,899.0 24.8
Capital Express Insurance Co. Ltd.
3,424.0 21.8
Mansard INSURANCE 2,975.6 18.9
Mutual Benefit Life Assurance Co. Ltd.
2,534.1 16.1
Royal Prudential Life Assurance Plc.
2,142.5 13.6
Standard Alliance Life Assurance Co. Ltd.
1,874.3 11.9
Source: Axco Insurance Information Services.
INSURANCE ASSOCIATION
Nigerian Insurers Association Web: www.nigeriainsurers.org
POPULATION, 2011-2014 (1)
Year Population
2011 155,215,573
2012 170,123,740
2013 174,507,539
2014 177,155,754
(1) Estimated. Source: U.S. Central Intelligence Agency.
GROSS DOMESTIC PRODUCT, 2010-2014 (1)
(U.S. $ billions)
Year GDP
2010 $353.2
2011 369.8
2012 414.5
2013 478.5
2014 1,058.0
(1) Based on Purchasing Power Parity calculations, which take into account the relative cost of living and inflation rates of countries. GDP estimate for July for each year shown. Source: U.S. Central Intelligence Agency.
LIFE AND NONLIFE INSURANCE PREMIUMS, 2014
(U.S. $ millions)
Direct premiums written
Nonlife premiums (1) $1,332
Life premiums 457
Total premiums $1,790
Percent of total world premiums
0.04%
(1) Includes accident and health insurance. Source: Swiss Re, sigma, No. 4/2015.

2016 International Insurance Fact Book updates at www.iii.org/international/ 74
Norway
LEADING NONLIFE INSURANCE COMPANIES,
2014
Gross written premiums
Company NOK Mn USD Mn
Gjensidige 13,925.5 2,209.8
If Skadeforsikring 12,600.0 1,999.5
Tryg 7,599.7 1,206.0
SpareBank 1 Forsikring 5,581.6 885.7
DNB Forsikring 2,675.4 424.6
Eika Forsikring 2,260.8 358.8
Codan 1,780.1 282.5
Storebrand 1,434.1 227.6
Protector Forsikring 1,409.8 223.7
Frende Skadeforsikring 1,315.7 208.8
Source: Axco Insurance Information Services.
LEADING LIFE INSURANCE COMPANIES, 2013
Gross written
premiums
Company NOK Mn USD Mn
KLP 24,931.2 4,243.6
DNB Livsforsikring 19,708.7 3,354.7
Storebrand Livsforsikring 15,559.4 2,648.4
Nordea Liv 7,358.1 1,252.4
Oslo Pensjonsforsikring 3,683.5 627.0
SpareBank 1 3,619.0 616.0
Gjensidige Pensjon 1,599.1 272.2
Danica Pensjonsforsikring
1,490.6 253.7
Gjensidige Forsikring 1,419.0 241.5
Tryg Fors 557.9 95.0
Source: Axco Insurance Information Services.
INSURANCE ASSOCIATION
Norweigan Insurance Association Finansnaeringens Hovedorganisasjon Web: www.fnh.no
POPULATION, 2011-2014 (1)
Year Population
2011 4,691,849
2012 4,707,270
2013 4,722,701
2014 5,147,792
(1) Estimated. Source: U.S. Central Intelligence Agency.
GROSS DOMESTIC PRODUCT, 2010-2014 (1) (U.S. $ billions)
Year GDP
2010 $276.5
2011 276.4
2012 264.5
2013 282.2
2014 339.5
(1) Based on Purchasing Power Parity calculations, which take into account the relative cost of living and inflation rates of countries. GDP estimate for July for each year shown. Source: U.S. Central Intelligence Agency.
LIFE AND NONLIFE INSURANCE PREMIUMS, 2014 (U.S. $ millions)
Direct premiums written
Nonlife premiums (1) $10,443
Life premiums 14,639
Total premiums $25,082
Percent of total world premiums
0.52%
(1) Includes accident and health insurance. Source: Swiss Re, sigma, No. 4/2015.

2016 International Insurance Fact Book updates at www.iii.org/international/ 75
Oman
LEADING NONLIFE INSURANCE COMPANIES, 2013
Gross written premiums
Company OMR Mn USD Mn
Dhofar Insurance Company
57.5 149.5
National Life and General 46.3 120.5
Oman United Insurance 37.0 96.3
Al Ahlia Insurance Company
34.2 88.8
New India Assurance 29.6 76.9
AXA Insurance 20.0 52.0
Oman Qatar Insurance 17.6 45.8
Al Madina Insurance 16.8 43.7
Falcon Insurance 11.4 29.7
Vision Insurance 11.3 29.5
Source: Axco Insurance Information Services.
LEADING LIFE INSURANCE COMPANIES, 2013
Gross written premiums
Company OMR Mn USD Mn
National Life and General 9.7 25.1
MetLife Alico Insurance 8.5 22.1
Dhofar Insurance Company 5.0 12.9
Oman United Insurance 3.3 8.7
Oman Insurance 2.4 6.2
Falcon Insurance 1.6 4.2
Life Insurance International Corporation
1.4 3.7
Vision Insurance 1.2 3.2
Oman Qatar Insurance 1.2 3.1
AXA Insurance 0.9 2.4
Source: Axco Insurance Information Services.
INSURANCE ASSOCIATION
Capital Markets Authority Web: omancma.org
POPULATION, 2011-2014 (1)
Year Population
2011 3,027,959
2012 3,090,150
2013 3,154,134
2014 3,219,775
(1) Estimated. Source: U.S. Central Intelligence Agency.
GROSS DOMESTIC PRODUCT, 2010-2014 (1)
(U.S. $ billions)
Year GDP
2010 $69.4
2011 76.5
2012 80.9
2013 94.9
2014 163.6
(1) Based on Purchasing Power Parity calculations, which take into account the relative cost of living and inflation rates of countries. GDP estimate for July for each year shown. Source: U.S. Central Intelligence Agency.
LIFE AND NONLIFE INSURANCE PREMIUMS, 2014
(U.S. $ millions)
Direct premiums written
Nonlife premiums (1) $940
Life premiums 95
Total premiums $1,035
Percent of total world premiums
0.02%
(1) Includes accident and health insurance. Source: Swiss Re, sigma, No. 4/2015.
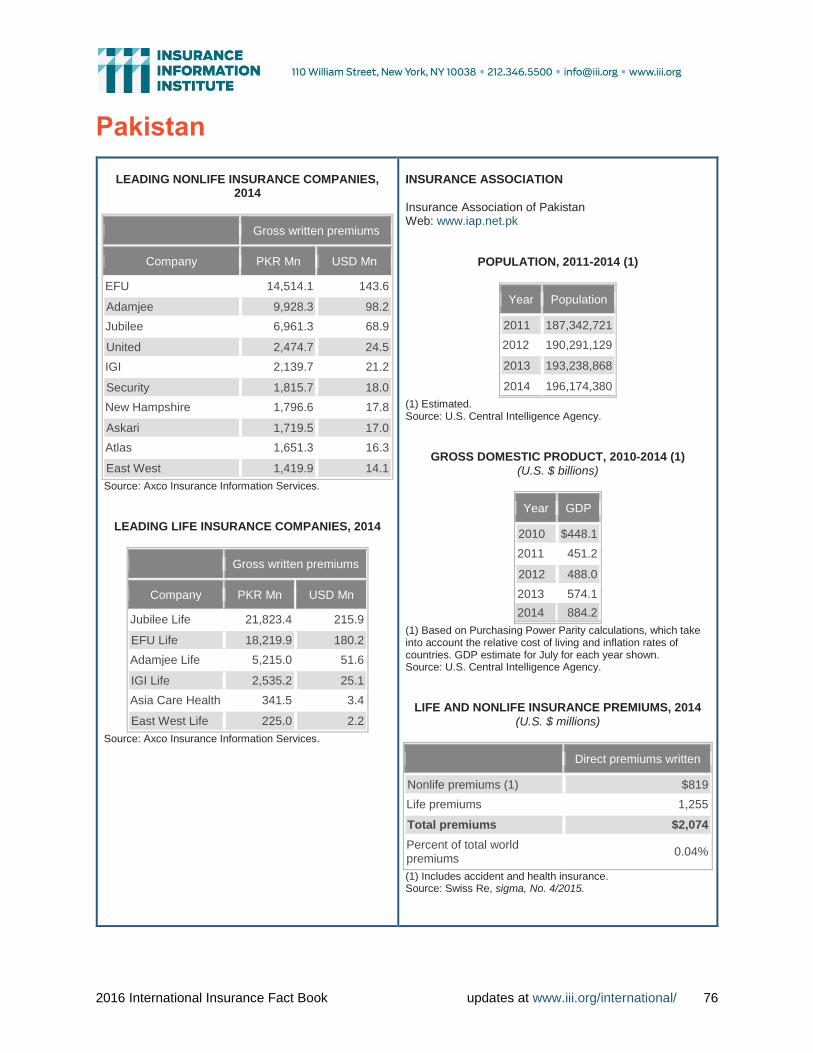
2016 International Insurance Fact Book updates at www.iii.org/international/ 76
Pakistan
LEADING NONLIFE INSURANCE COMPANIES,
2014
Gross written premiums
Company PKR Mn USD Mn
EFU 14,514.1 143.6
Adamjee 9,928.3 98.2
Jubilee 6,961.3 68.9
United 2,474.7 24.5
IGI 2,139.7 21.2
Security 1,815.7 18.0
New Hampshire 1,796.6 17.8
Askari 1,719.5 17.0
Atlas 1,651.3 16.3
East West 1,419.9 14.1
Source: Axco Insurance Information Services.
LEADING LIFE INSURANCE COMPANIES, 2014
Gross written premiums
Company PKR Mn USD Mn
Jubilee Life 21,823.4 215.9
EFU Life 18,219.9 180.2
Adamjee Life 5,215.0 51.6
IGI Life 2,535.2 25.1
Asia Care Health 341.5 3.4
East West Life 225.0 2.2
Source: Axco Insurance Information Services.
INSURANCE ASSOCIATION
Insurance Association of Pakistan Web: www.iap.net.pk
POPULATION, 2011-2014 (1)
Year Population
2011 187,342,721
2012 190,291,129
2013 193,238,868
2014 196,174,380
(1) Estimated. Source: U.S. Central Intelligence Agency.
GROSS DOMESTIC PRODUCT, 2010-2014 (1)
(U.S. $ billions)
Year GDP
2010 $448.1
2011 451.2
2012 488.0
2013 574.1
2014 884.2
(1) Based on Purchasing Power Parity calculations, which take into account the relative cost of living and inflation rates of countries. GDP estimate for July for each year shown. Source: U.S. Central Intelligence Agency.
LIFE AND NONLIFE INSURANCE PREMIUMS, 2014
(U.S. $ millions)
Direct premiums written
Nonlife premiums (1) $819
Life premiums 1,255
Total premiums $2,074
Percent of total world premiums
0.04%
(1) Includes accident and health insurance. Source: Swiss Re, sigma, No. 4/2015.

2016 International Insurance Fact Book updates at www.iii.org/international/ 77
Panama
LEADING NONLIFE INSURANCE COMPANIES,
2014
Gross written premiums
Company USD Mn
Internacional de Seguros 188.3
ASSA 122.5
MAPFRE 95.2
Assicurazioni Generali 63.7
Aseguradora Ancon 54.6
Suramericana 44.2
Nacional de Seguros de Panama y Centroamerica
43.5
Seguros Banistmo 28.3
Banesco Seguros 25.9
Aliado Seguros 23.8
Source: Axco Insurance Information Services.
LEADING LIFE INSURANCE COMPANIES, 2014
Gross written premiums
Company USD Mn
Internacional de Seguros
122.0
Pan American Life Insurance de Panama
95.5
ASSA 84.4
MAPFRE 83.1
World Wide Medical Assurance
42.9
Assicurazioni Generali 42.9
Seguros Banistmo 22.9
Aseguradora Ancon 15.8
Suramericana 15.6
Empresa General de Seguros
14.9
Source: Axco Insurance Information Services.
INSURANCE ASSOCIATION
Panamanian Insurance Association Asociacion Panamena de Aseguradores Web: www.bnamericas.com
POPULATION, 2011-2014 (1)
Year Population
2011 3,460,462
2012 3,510,045
2013 3,559,408
2014 3,608,431
(1) Estimated. Source: U.S. Central Intelligence Agency.
GROSS DOMESTIC PRODUCT, 2010-2014 (1) (U.S. $ billions)
Year GDP
2010 $40.3
2011 44.8
2012 48.8
2013 61.5
2014 77.0
(1) Based on Purchasing Power Parity calculations, which take into account the relative cost of living and inflation rates of countries. GDP estimate for July for each year shown. Source: U.S. Central Intelligence Agency.
LIFE AND NONLIFE INSURANCE PREMIUMS, 2014 (U.S. $ millions)
Direct premiums written
Nonlife premiums (1) $1,032
Life premiums 312
Total premiums $1,343
Percent of total world premiums
0.03%
(1) Includes accident and health insurance. Source: Swiss Re, sigma, No. 4/2015.

2016 International Insurance Fact Book updates at www.iii.org/international/ 78
Peru
LEADING NONLIFE INSURANCE COMPANIES,
2014
Gross written premiums
Company PEN Mn USD Mn
Rimac 2,174.2 765.6
Pacifico Seguros Generales
1,293.3 455.4
MAPFRE Peru 799.8 281.6
La Positiva 719.5 253.4
El Pacifico Vida 128.2 45.2
MAPFRE Peru Vida 112.4 39.6
Ace 106.2 37.4
Interseguro 77.3 27.2
Cardif 74.8 26.4
La Positiva Vida 36.0 12.7
Source: Axco Insurance Information Services.
LEADING LIFE INSURANCE COMPANIES, 2014
Gross written premiums
Company PEN Mn USD Mn
Rimac 1,037.5 365.3
El Pacifico Vida 965.1 339.8
Interseguro 603.2 212.4
Seguros Sura 451.0 158.8
La Positiva Vida 391.5 137.8
MAPFRE Peru Vida 264.8 93.2
Ohio National Vida 221.3 77.9
Vida Camara 219.1 77.1
Protecta 135.9 47.9
Rigel 115.2 40.6
Source: Axco Insurance Information Services.
INSURANCE ASSOCIATION
Asociacion Peruana de Empresas de Seguros Web: www.apeseg.org.pe
POPULATION, 2011-2014 (1)
Year Population
2011 29,248,943
2012 29,549,517
2013 29,849,303
2014 30,147,935
(1) Estimated. Source: U.S. Central Intelligence Agency.
GROSS DOMESTIC PRODUCT, 2009-2013 (1)
(U.S. $ billions)
Year GDP
2010 $253.4
2011 277.2
2012 299.7
2013 344.0
2014 376.7
(1) Based on Purchasing Power Parity calculations, which take into account the relative cost of living and inflation rates of countries. GDP estimate for July for each year shown. Source: U.S. Central Intelligence Agency.
LIFE AND NONLIFE INSURANCE PREMIUMS, 2014
(U.S. $ millions)
Direct premiums written
Nonlife premiums (1) $1,841
Life premiums 1,736
Total premiums $3,577
Percent of total world premiums
0.07%
(1) Includes accident and health insurance. Source: Swiss Re, sigma, No. 4/2015.

2016 International Insurance Fact Book updates at www.iii.org/international/ 79
Philippines
LEADING NONLIFE INSURANCE COMPANIES,
2014
Gross written premiums
Company PHP Mn USD Mn
Malayan Insurance 6,937.0 156.3
Prudential Guarantee 6,161.4 138.8
BPI/MS 5,229.1 117.8
Pioneer Insurance 5,034.7 113.4
Charter Ping AN 4,002.5 90.2
Federal Phoenix 3,516.5 79.2
Standard Insurance 2,687.5 60.5
UCPB General 2,589.2 58.3
Chartis 2,347.9 52.9
PNB General 2,169.6 48.9
Source: Axco Insurance Information Services.
LEADING LIFE INSURANCE COMPANIES, 2013
Gross written premiums
Company PHP Mn USD Mn
Sun Life of Canada (Philippines)
29,698.7 699.7
Philippine American Life and General Ins
19,967.0 470.4
Philippine AXA Life Insurance Corp
18,268.2 430.4
Pru Life Insurance Corp of UK
18,001.3 424.1
Manufacturers Life Ins Co (Phils)
15,004.3 353.5
BPI Philam Life Assurance Corp
14,282.0 336.5
Sun Life Grepa Financial
11,982.1 282.3
lnsular Life Assce Co 11,153.5 262.8
Manulife Chinabank Life Assce Corp
8,204.7 193.3
PNB Life lnsurance 6,365.9 150.0
Source: Axco Insurance Information Services.
INSURANCE ASSOCIATION
Philippine Insurers and Reinsurers Association Web: www.pirainc.org
POPULATION, 2011-2014 (1)
Year Population
2011 101,833,938
2012 103,775,002
2013 105,720,644
2014 107,668,231
(1) Estimated. Source: U.S. Central Intelligence Agency.
GROSS DOMESTIC PRODUCT, 2010-2014 (1)
(U.S. $ billions)
Year GDP
2010 $324.9
2011 353.2
2012 393.4
2013 454.3
2014 694.6
(1) Based on Purchasing Power Parity calculations, which take into account the relative cost of living and inflation rates of countries. GDP estimate for July for each year shown. Source: U.S. Central Intelligence Agency.
LIFE AND NONLIFE INSURANCE PREMIUMS, 2014
(U.S. $ millions)
Direct premiums written
Nonlife premiums (1) $1,369
Life premiums 4,420
Total premiums $5,788
Percent of total world premiums
0.12%
(1) Includes accident and health insurance. Source: Swiss Re, sigma, No. 4/2015.

2016 International Insurance Fact Book updates at www.iii.org/international/ 80
Poland
LEADING NONLIFE INSURANCE COMPANIES, 2014
Gross written premiums
Company PLN Mn USD Mn
PZU 8,261.8 2,619.0
ERGO Hestia 3,443.9 1,091.7
WARTA 3,350.2 1,062.0
Allianz Polska 1,765.9 559.8
Compensa 1,092.4 346.3
UNIQA 1,077.9 341.7
InterRisk 1,009.3 320.0
Europa 904.5 286.7
Generali 874.7 277.3
Gothaer 569.9 180.7
Source: Axco Insurance Information Services.
LEADING LIFE INSURANCE COMPANIES, 2014
Gross written premiums
Company PLN Mn USD Mn
PZU Zycie 8,182.2 2,593.8
Open Life 2,324.8 737.0
MetLife 2,111.8 669.5
Aviva 2,061.5 653.5
Compensa TUnZ Vienna Insurance Group
1,573.7 498.9
ING TUnZ 1,548.9 491.0
TUnZ Warta 1,544.8 489.7
STUnZ Ergo Hestia 1,530.1 485.1
AXA Zycie 1,184.2 375.4
TUnZ EUROPA 1,042.6 330.5
Source: Axco Insurance Information Services.
INSURANCE ASSOCIATION
Polska Izba Ubezpieczen Polish Chamber of Insurance Web: www.piu.org.pl
POPULATION, 2011-2014 (1)
Year Population
2011 38,441,588
2012 38,415,284
2013 38,383,809
2014 38,346,279
(1) Estimated. Source: U.S. Central Intelligence Agency
GROSS DOMESTIC PRODUCT, 2010-2014 (1)
(U.S. $ billions)
Year GDP
2010 $686.2
2011 725.2
2012 765.6
2013 814.0
2014 941.4
(1) Based on Purchasing Power Parity calculations, which take into account the relative cost of living and inflation rates of countries. GDP estimate for July for each year shown. Source: U.S. Central Intelligence Agency.
LIFE AND NONLIFE INSURANCE PREMIUMS, 2014
(U.S. $ millions)
Direct premiums written
Nonlife premiums (1) $9,798
Life premiums 7,436
Total premiums $17,235
Percent of total world premiums
0.36%
(1) Includes accident and health insurance. Source: Swiss Re, sigma, No. 4/2015.

2016 International Insurance Fact Book updates at www.iii.org/international/ 81
Portugal
LEADING NONLIFE INSURANCE COMPANIES,
2013
Gross written premiums
Company EUR Mn USD Mn
Fidelidade 961.2 1,276.2
Tranquilidade 318.8 423.3
Allianz Portugal 311.4 413.4
AXA Portugal Seguros 290.6 385.9
Acoreana 267.0 354.6
Zurich Insurance 245.5 326.0
Liberty Seguros 241.1 320.2
Ocidental 228.7 303.6
Lusitania Seguros 169.1 224.5
Generali Seguros 130.8 173.7
Source: Axco Insurance Information Services.
LEADING LIFE INSURANCE COMPANIES, 2013
Gross written premiums
Company EUR Mn USD Mn
Fidelidade 2,517.4 3,297.8
BES-Vida 1,996.7 2,615.7
Ocidental Vida 1,486.0 1,946.7
BPI Vida 826.3 1,082.5
Santander Totta Seguros
545.1 714.1
CA Vida 384.0 503.0
Allianz Portugal 232.2 304.2
Eurovida 182.2 238.7
CNP Barclays Vida Y Pensiones
155.1 203.2
Acoreana 139.8 183.1
Source: Axco Insurance Information Services.
INSURANCE ASSOCIATION
Portuguese Insurance Companies Association Associacao Portuguesa de Seguradores Web: www.apseguradores.pt
POPULATION, 2011-2014 (1)
Year Population
2011 10,760,305
2012 10,781,459
2013 10,799,270
2014 10,813,834
(1) Estimated. Sourc’e: U.S. Central Intelligence Agency.
GROSS DOMESTIC PRODUCT, 2010-2014 (1)
Year GDP
2010 $232.2
2011 247.0
2012 NA
2013 243.3
2014 276.0
(1) Based on Purchasing Power Parity calculations, which take into account the relative cost of living and inflation rates of countries. GDP estimate for July for each year shown. NA=Data not available. Source: U.S. Central Intelligence Agency.
LIFE AND NONLIFE INSURANCE PREMIUMS, 2014
(U.S. $ millions)
Direct premiums written
Nonlife premiums (1) $5,189
Life premiums 13,962
Total premiums $19,151
Percent of total world premiums
0.40%
(1) Includes accident and health insurance. Source: Swiss Re, sigma, No. 4/2015.

2016 International Insurance Fact Book updates at www.iii.org/international/ 82
Qatar
LEADING NONLIFE INSURANCE COMPANIES, 2013
Gross written premiums
Company QAR Mn USD Mn
Qatar Insurance Company
3,531.7 970.3
Qatar General Insurance and Reinsurance company
560.3 153.9
Doha Insurance company
516.7 141.9
Al Khaleej Takaful 274.6 75.4
Qatar Islamic 162.4 44.6
Arabia Insurance 42.9 11.8
Source: Axco Insurance Information Services.
LEADING LIFE INSURANCE COMPANIES, 2013
Gross written premiums
Company QAR Mn USD Mn
Qatar Islamic 49.9 13.7
Al Khaleej Takaful 15.2 4.2
Source: Axco Insurance Information Services.
INSURANCE ASSOCIATION
POPULATION, 2011-2014 (1)
Year Population
2011 848,016
2012 1,951,591
2013 2,042,444
2014 2,123,160
(1) Estimated. Source: U.S. Central Intelligence Agency.
GROSS DOMESTIC PRODUCT, 2009-2013 (1) (U.S. $ billions)
Year GDP
2010 NA
2011 $122.2
2012 181.7
2013 198.7
2014 323.2
(1) Based on Purchasing Power Parity calculations, which take into account the relative cost of living and inflation rates of countries. GDP estimate for July for each year shown. NA=Data not available. Source: U.S. Central Intelligence Agency.
LIFE AND NONLIFE INSURANCE PREMIUMS, 2014
(U.S. $ millions)
Direct premiums written
Nonlife premiums (1) $2,118
Life premiums 65
Total premiums $2,183
Percent of total world premiums
0.05%
(1) Includes accident and health insurance. Source: Swiss Re, sigma, No. 4/2015.

2016 International Insurance Fact Book updates at www.iii.org/international/ 83
Romania
LEADING NONLIFE INSURANCE COMPANIES, 2013
Gross written premiums
Company RON Mn USD Mn
Astra 907.2 272.6
Omniasig Vienna Insurance Group
881.1 264.8
Allianz-Tiriac Insurance 824.1 247.6
Groupama Insurance 675.5 203.0
UNIQA Insurance 570.2 171.3
Euroins Romania 504.8 151.7
Carpatica ASIG 483.1 145.2
Asirom Vienna Insurance Group
455.1 136.8
Generali Insurance 354.3 106.5
City Insurance 304.7 91.6
Source: Axco Insurance Information Services.
LEADING LIFE INSURANCE COMPANIES, 2013
Gross written premiums
Company RON Mn USD Mn
ING Life Insurance 559.6 168.2
BCR Vienna Life Insurance
213.4 64.1
Metropolitan Life 140.6 42.2
Alico Insurance Romania 121.8 36.6
Allianz-Tiriac Insurance 94.7 28.5
ASIROM Vienna Insurance Group
89.0 26.8
Generali Insurance 84.4 25.4
BRD Life Insurance 69.6 20.9
GRAWE Insurance Romania
49.8 15.0
Eurolife ERB 44.1 13.3
Source: Axco Insurance Information Services.
INSURANCE ASSOCIATION
National Union of Insurance and Reinsurance Companies of Romania - UNSAR Web: unsar.ro
POPULATION, 2011-2014 (1)
Year Population
2011 21,904,551
2012 21,848,504
2013 21,790,479
2014 21,729,871
(1) Estimated. Source: U.S. Central Intelligence Agency.
GROSS DOMESTIC PRODUCT, 2010-2014 (1) (U.S. $ billions)
Year GDP
2010 $256.3
2011 253.3
2012 263.9
2013 280.7
2014 386.5
(1) Based on Purchasing Power Parity calculations, which take into account the relative cost of living and inflation rates of countries. GDP estimate for July for each year shown. Source: U.S. Central Intelligence Agency.
LIFE AND NONLIFE INSURANCE PREMIUMS, 2014
(U.S. $ millions)
Direct premiums written
Nonlife premiums (1) $1,918
Life premiums 456
Total premiums $2,374
Percent of total world premiums
0.05%
(1) Includes accident and health insurance. Source: Swiss Re, sigma, No. 4/2015.

2016 International Insurance Fact Book updates at www.iii.org/international/ 84
Russia
LEADING NONLIFE INSURANCE COMPANIES, 2014
Gross written premiums
Company RUB Mn USD Mn
Rosgosstrakh 129,856.5 3,383.6
Sogaz 105,229.9 2,741.9
Ingosstrakh 65,774.5 1,713.9
Reso Garantiya 65,218.8 1,699.4
AlfaStrakhovanie 47,780.0 1,245.0
VSK 37,680.2 981.8
VTB Insurance 36,631.0 954.5
Soglasie 33,856.5 882.2
Alliance 24,650.1 642.3
Renaissance Insurance Group
19,460.3 507.1
Source: Axco Insurance Information Services.
LEADING LIFE INSURANCE COMPANIES, 2014
Gross written premiums
Company RUB Mn USD Mn
Alyans Layf 36,476.1 950.4
Renessans Zhizn 12,363.7 322.2
Rosgosstrakh-Zhizn 12,042.3 313.8
Alfastrakhovanie- Zhizn 10,027.1 261.3
Alico 6,495.6 169.3
SIV Layf 4,921.6 128.2
Soglasie-Vita 4,405.9 114.8
Raiffeisen Life 3,510.0 91.5
Societe Generale Strakhovanie Zhizni
3,137.4 81.8
Generali PPF Life Insurance
2,588.2 67.4
Source: Axco Insurance Information Services.
INSURANCE ASSOCIATION
All Russia Insurance Association Web: www.ins-union.ru
POPULATION, 2011-2014 (1)
Year Population
2011 138,739,892
2012 138,082,178
2013 142,500,482
2014 142,470,272
(1) Estimated. Source: U.S. Central Intelligence Agency.
GROSS DOMESTIC PRODUCT, 2010-2014 (1)
(U.S. $ billions)
Year GDP
2010 $2,117.0
2011 2,229.0
2012 NA
2013 2,553.0
2014 3,568.0
(1) Based on Purchasing Power Parity calculations, which take into account the relative cost of living and inflation rates of countries. GDP estimate for July for each year shown. NA=Data not available. Source: U.S. Central Intelligence Agency.
LIFE AND NONLIFE INSURANCE PREMIUMS, 2014
(U.S. $ millions)
Direct premiums written
Nonlife premiums (1) $22,910
Life premiums 2,828
Total premiums $25,738
Percent of total world premiums
0.54%
(1) Includes accident and health insurance. Source: Swiss Re, sigma, No. 4/2015.

2016 International Insurance Fact Book updates at www.iii.org/international/ 85
Saudi Arabia
No data available for leading writers.
INSURANCE ASSOCIATION
POPULATION, 2011-2014 (1)
Year Population
2011 26,131,703
2012 26,534,504
2013 26,939,583
2014 27,345,986
(1) Estimated. Source: U.S. Central Intelligence Agency.
GROSS DOMESTIC PRODUCT, 2010-2014 (1) (U.S. $ billions)
Year GDP
2010 $581.3
2011 622.5
2012 676.7
2013 927.8
2014 1,616.0
(1) Based on Purchasing Power Parity calculations, which take into account the relative cost of living and inflation rates of countries. GDP estimate for July for each year shown. Source: U.S. Central Intelligence Agency.
LIFE AND NONLIFE INSURANCE PREMIUMS, 2014
(U.S. $ millions)
Direct premiums written
Nonlife premiums (1) $7,887
Life premiums 241
Total premiums $8,128
Percent of total world premiums
0.17%
(1) Includes accident and health insurance. Source: Swiss Re, sigma, No. 4/2015.

2016 International Insurance Fact Book updates at www.iii.org/international/ 86
Serbia
LEADING NONLIFE INSURANCE COMPANIES, 2014
Gross written premiums
Company RSD Mn USD Mn
Dunav 16,197.3 183.2
Generali Osigura nje 10,268.3 116.2
DDOR 8,831.5 99.9
UNIQA Nezivot 3,975.6 45.0
Wiener 3,736.5 42.3
Triglav 2,601.6 29.4
AMS 2,184.1 24.7
Milenijum 1,986.1 22.5
Sava Nezivot 1,455.2 16.5
AXA Nezivot 754.3 8.5
Source: Axco Insurance Information Services.
LEADING LIFE INSURANCE COMPANIES, 2014
Gross written premiums
Company RSD Mn USD Mn
Generali Osiguranje 4,758.0 53.8
Wiener 3,300.8 37.3
GRAWE 2,861.5 32.4
UNIQA Zivot 1,492.0 16.9
Dunav 1,354.5 15.3
Merkurusig 791.1 9.0
DDOR 675.9 7.7
Societe Generale 350.4 4.0
Sava Zivotno 124.7 1.4
AXA Zivot 115.1 1.3
Source: Axco Insurance Information Services.
INSURANCE ASSOCIATION
Assocation of Serbian Insurers Web: uos.rs/o-nama/
POPULATION, 2011-2014 (1)
Year Population
2011 7,310,555
2012 7,276,604
2013 7,243,007
2014 7,209,764
(1) Estimated. Source: U.S. Central Intelligence Agency.
GROSS DOMESTIC PRODUCT, 2010-2014 (1)
(U.S. $ billions)
Year GDP
2010 $77.0
2011 80.5
2012 79.1
2013 80.5
2014 90.3
(1) Based on Purchasing Power Parity calculations, which take into account the relative cost of living and inflation rates of countries. GDP estimate for July for each year shown. Source: U.S. Central Intelligence Agency.
LIFE AND NONLIFE INSURANCE PREMIUMS, 2013
(U.S. $ millions)
Direct premiums written
Nonlife premiums (1) $617
Life premiums 169
Total premiums $786
Percent of total world premiums
0.02%
(1) Includes accident and health insurance. Source: Swiss Re, sigma, No. 4/2015.
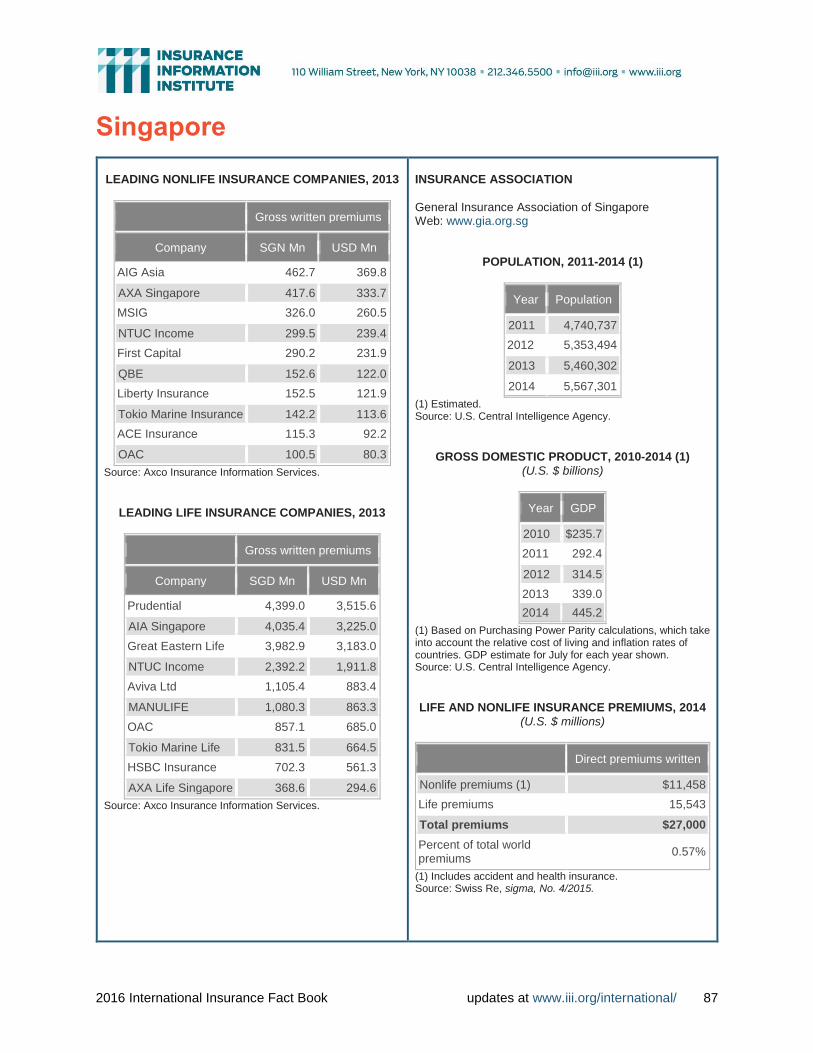
2016 International Insurance Fact Book updates at www.iii.org/international/ 87
Singapore
LEADING NONLIFE INSURANCE COMPANIES, 2013
Gross written premiums
Company SGN Mn USD Mn
AIG Asia 462.7 369.8
AXA Singapore 417.6 333.7
MSIG 326.0 260.5
NTUC Income 299.5 239.4
First Capital 290.2 231.9
QBE 152.6 122.0
Liberty Insurance 152.5 121.9
Tokio Marine Insurance 142.2 113.6
ACE Insurance 115.3 92.2
OAC 100.5 80.3
Source: Axco Insurance Information Services.
LEADING LIFE INSURANCE COMPANIES, 2013
Gross written premiums
Company SGD Mn USD Mn
Prudential 4,399.0 3,515.6
AIA Singapore 4,035.4 3,225.0
Great Eastern Life 3,982.9 3,183.0
NTUC Income 2,392.2 1,911.8
Aviva Ltd 1,105.4 883.4
MANULIFE 1,080.3 863.3
OAC 857.1 685.0
Tokio Marine Life 831.5 664.5
HSBC Insurance 702.3 561.3
AXA Life Singapore 368.6 294.6
Source: Axco Insurance Information Services.
INSURANCE ASSOCIATION
General Insurance Association of Singapore Web: www.gia.org.sg
POPULATION, 2011-2014 (1)
Year Population
2011 4,740,737
2012 5,353,494
2013 5,460,302
2014 5,567,301
(1) Estimated. Source: U.S. Central Intelligence Agency.
GROSS DOMESTIC PRODUCT, 2010-2014 (1)
(U.S. $ billions)
Year GDP
2010 $235.7
2011 292.4
2012 314.5
2013 339.0
2014 445.2
(1) Based on Purchasing Power Parity calculations, which take into account the relative cost of living and inflation rates of countries. GDP estimate for July for each year shown. Source: U.S. Central Intelligence Agency.
LIFE AND NONLIFE INSURANCE PREMIUMS, 2014
(U.S. $ millions)
Direct premiums written
Nonlife premiums (1) $11,458
Life premiums 15,543
Total premiums $27,000
Percent of total world premiums
0.57%
(1) Includes accident and health insurance. Source: Swiss Re, sigma, No. 4/2015.

2016 International Insurance Fact Book updates at www.iii.org/international/ 88
Slovakia
LEADING NONLIFE INSURANCE COMPANIES,
2013
Gross written premiums
Company EUR Mn USD Mn
Allianz Slovenska 326.9 434.1
Kooperativa 250.6 332.7
Generali 94.3 125.2
UNIQA 75.1 99.7
Komunalna 60.5 80.3
Union 31.1 41.3
CSOB 27.1 35.9
Wustenrot 22.0 29.2
Cardif Slovakia 14.0 18.6
Poistovna Postovej banky
1.2 1.5
Source: Axco Insurance Information Services.
LEADING LIFE INSURANCE COMPANIES, 2013
Gross written premiums
Company EUR Mn USD Mn
KOOPERATIVA 258.5 343.2
Allianz Slovenska 245.3 325.7
KOMUNALNA 110.8 147.1
Generali 80.1 106.3
ING 79.1 105.0
Poistovna Slovenskej sporitelne
69.3 92.0
CSOB 54.1 71.9
AEGON 38.2 50.7
Wustenrot 37.8 50.2
UNIQA 33.0 43.9
Source: Axco Insurance Information Services.
INSURANCE ASSOCIATION
Slovak Insurance Association Slovenska asociacia maklerov v poistovnictve Web: www.slaspo.sk
POPULATION, 2011-2014 (1)
Year Population
2011 5,477,038
2012 5,483,088
2013 5,488,339
2014 5,443,583
(1) Estimated. Source: U.S. Central Intelligence Agency.
GROSS DOMESTIC PRODUCT, 2010-2014 (1) (U.S. $ billions)
Year GDP
2010 $115.3
2011 121.3
2012 126.9
2013 133.4
2014 149.9
(1) Based on Purchasing Power Parity calculations, which take into account the relative cost of living and inflation rates of countries. GDP estimate for July for each year shown. Source: U.S. Central Intelligence Agency.
LIFE AND NONLIFE INSURANCE PREMIUMS, 2014 (U.S. $ millions)
Direct premiums written
Nonlife premiums (1) $1,435
Life premiums 1,350
Total premiums $2,785
Percent of total world premiums
0.06%
(1) Includes accident and health insurance. Source: Swiss Re, sigma, No. 4/2015.

2016 International Insurance Fact Book updates at www.iii.org/international/ 89
Slovenia
LEADING NONLIFE INSURANCE COMPANIES, 2013
Gross written premiums
Company EUR Mn USD Mn
Triglav 424.6 563.7
Vzajemna (Health Insurance Mutual)
267.0 354.5
Adriatic Slovenica 249.3 331.0
Maribor 176.5 234.3
Triglav Health 104.1 138.2
Tilia 76.9 102.1
Generali 62.5 82.9
SID-PKZ 19.4 25.8
GRAWE 13.4 17.8
Wiener Staedtische 8.6 11.4
Source: Axco Insurance Information Services.
LEADING LIFE INSURANCE COMPANIES, 2013
Gross written premiums
Company EUR Mn USD Mn
Triglav 179.2 237.9
Modra 82.8 109.9
Maribor 75.5 100.3
Adriatic Slovenica 56.8 75.5
NLB Vita 42.6 56.6
Merkur 39.0 51.7
Generali 22.7 30.2
GRAWE 19.2 25.4
Wiener Stadtische 15.9 21.1
Tilia 9.3 12.3
Source: Axco Insurance Information Services.
INSURANCE ASSOCIATION
Slovenian Insurance Association Slovensko Zavarovalno Zdruzenje Web: www.zav-zdruzenje.si
POPULATION, 2011-2014 (1)
Year Population
2011 2,000,092
2012 1,996,617
2013 1,992,690
2014 1,988,292
(1) Estimated. Source: U.S. Central Intelligence Agency.
GROSS DOMESTIC PRODUCT, 2010-2014 (1) (U.S. $ billions)
Year GDP
2010 $56.5
2011 56.8
2012 58.6
2013 56.5
2014 60.5
(1) Based on Purchasing Power Parity calculations, which take into account the relative cost of living and inflation rates of countries. GDP estimate for July for each year shown. Source: U.S. Central Intelligence Agency.
LIFE AND NONLIFE INSURANCE PREMIUMS, 2014
(U.S. $ millions)
Direct premiums written
Nonlife premiums (1) $1,863
Life premiums 711
Total premiums $2,574
Percent of total world premiums
0.05%
(1) Includes accident and health insurance. Source: Swiss Re, sigma, No. 4/2015.

2016 International Insurance Fact Book updates at www.iii.org/international/ 90
South Africa
LEADING NONLIFE INSURANCE COMPANIES, 2013
Gross written premiums
Company ZAR Mn USD Mn
Santam 17,861.0 1,849.9
Mutual and Federal 8,895.9 921.4
Guardrisk 6,039.1 625.5
Hollard 5,870.3 608.0
OUTsurance 5,660.2 586.3
Zurich 3,805.9 394.2
ABSA 2,922.1 302.7
Centriq 2,322.2 240.5
Auto & General 2,312.5 239.5
Etana 2,268.6 235.0
Source: Axco Insurance Information Services.
LEADING LIFE INSURANCE COMPANIES, 2013
Gross written premiums
Company ZAR Mn USD Mn
Old Mutual Life 60,747.9 6,291.8
MMI Group 53,686.0 5,560.4
Investec Assurance Limited 43,541.1 4,509.7
Liberty 41,444.6 4,292.5
Sanlam Life Insurance Limited
38,598.4 3,997.7
Investment Solutions 28,107.1 2,911.1
Coronation Life 16,126.3 1,670.2
Allan Gray 12,716.4 1,317.1
Discovery Life 10,714.9 1,109.8
Sanlam Developing Markets 6,308.1 653.4
Source: Axco Insurance Information Services.
INSURANCE ASSOCIATION
South African Insurance Association Web: www.sainsurance.co.za
POPULATION, 2011-2014 (1)
Year Population
2011 49,004,031
2012 48,810,427
2013 48,601,098
2014 48,375,645
(1) Estimated. Source: U.S. Central Intelligence Agency.
GROSS DOMESTIC PRODUCT, 2010-2014 (1)
(U.S. $ billions)
Year GDP
2010 $488.6
2011 527.5
2012 554.6
2013 595.7
2014 683.1
(1) Based on Purchasing Power Parity calculations, which take into account the relative cost of living and inflation rates of countries. GDP estimate for July for each year shown. Source: U.S. Central Intelligence Agency.
LIFE AND NONLIFE INSURANCE PREMIUMS, 2014
(U.S. $ millions)
Direct premiums written
Nonlife premiums (1) $9,375
Life premiums 39,785
Total premiums $49,159
Percent of total world premiums
1.03%
(1) Includes accident and health insurance. Source: Swiss Re, sigma, No. 4/2015.

2016 International Insurance Fact Book updates at www.iii.org/international/ 91
South Korea
LEADING NONLIFE INSURANCE COMPANIES, 2012
Gross written premiums
Company KRW Mn USD Mn
Samsung 17,379,320.4 15,428.1
Hyundai 10,621,581.5 9,429.1
Dongbu 9,992,870.4 8,871.0
LIG 9,498,520.6 8,432.1
Meritz 4,965,369.3 4,407.9
Hanwha 3,993,436.2 3,545.1
Heungkuk 2,957,797.0 2,625.7
Lotte 2,314,516.1 2,054.7
Seoul Guarantee 1,346,811.7 1,195.6
Green (now MG) 636,079.9 564.7
Source: Axco Insurance Information Services.
LEADING LIFE INSURANCE COMPANIES, 2012
Gross written premiums
Company KRW Mn USD Mn
Samsung 30,755,474.2 27,302.5
Hanwha 14,509,588.5 12,880.6
Kyobo 12,744,123.2 11,313.3
Nonghyup 10,925,057.2 9,698.5
Shinhan 5,149,141.7 4,571.0
Mirae Asset 5,052,457.9 4,485.2
Tong Yang 4,598,669.8 4,082.4
Heungkuk 4,310,808.5 3,826.8
ING 4,123,679.2 3,660.7
KDB 3,221,236.4 2,859.6
Source: Axco Insurance Information Services.
INSURANCE ASSOCIATION
Korea Non-life Insurance Association Web: www.knia.or.kr
POPULATION, 2011-2014 (1)
Year Population
2011 48,754,657
2012 48,860,500
2013 48,955,203
2014 49,039,986
(1) Estimated. Source: U.S. Central Intelligence Agency.
GROSS DOMESTIC PRODUCT, 2010-2014 (1)
(U.S. $ billions)
Year GDP
2010 $1,343.0
2011 1,467.0
2012 1,554.0
2013 1,666.0
2014 N/A
(1) Based on Purchasing Power Parity calculations, which take into account the relative cost of living and inflation rates of countries. GDP estimate for July for each year shown. NA=Data not available. Source: U.S. Central Intelligence Agency.
LIFE AND NONLIFE INSURANCE PREMIUMS, 2014
(U.S. $ millions)
Direct premiums written
Nonlife premiums (1) $57,943
Life premiums 101,572
Total premiums $159,515
Percent of total world premiums
3.34%
(1) Includes accident and health insurance. Source: Swiss Re, sigma, No. 4/2015.

2016 International Insurance Fact Book updates at www.iii.org/international/ 92
Spain
LEADING NONLIFE INSURANCE COMPANIES,
2014
Gross written premiums
Company EUR Mn USD Mn
MAPFRE Familiar 3,472.2 4,606.6
Segur Caixa 2,820.1 3,741.6
Allianz 1,945.4 2,581.1
AXA Seguros Generales 1,726.6 2,290.8
Generali Seguros 1,211.1 1,606.8
Sanitas 1,160.0 1,539.0
Santalucia 1,059.1 1,405.1
Mutua Madrilena 1,011.3 1,341.8
ASISA 1,006.5 1,335.3
Zurich 968.6 1,285.1
Source: Axco Insurance Information Services.
LEADING LIFE INSURANCE COMPANIES, 2014
Gross written premiums
Company EUR Mn USD Mn
VidaCaixa 5,514.7 7,316.5
Santander Seguros 1,883.7 2,499.1
BBVA Seguros 1,673.2 2,219.9
Bansabadell Vida 1,293.9 1,716.7
MAPFRE Vida 1,115.9 1,480.6
Ibercaja Vida 1,084.7 1,439.1
Generali Seguros 810.7 1,075.6
Allianz 802.4 1,064.6
Unicorp Vida 684.3 907.9
Grupo Caser 620.7 823.5
Source: Axco Insurance Information Services.
INSURANCE ASSOCIATION
Union Espanola de Entidades Aseguradoras y Reaseguradoras Web: www.unespa.es
POPULATION, 2011-2014 (1)
Year Population
2011 46,754,784
2012 47,042,984
2013 47,370,542
2014 47,737,941
(1) Estimated. Source: U.S. Central Intelligence Agency.
GROSS DOMESTIC PRODUCT, 2010-2014 (1) (U.S. $ billions)
Year GDP
2010 $1,368.0
2011 1,376.0
2012 1,411.0
2013 1,389.0
2014 1,534.0
(1) Based on Purchasing Power Parity calculations, which take into account the relative cost of living and inflation rates of countries. GDP estimate for July for each year shown. Source: U.S. Central Intelligence Agency.
LIFE AND NONLIFE INSURANCE PREMIUMS, 2014 (U.S. $ millions)
Direct premiums written
Nonlife premiums (1) $38,462
Life premiums 33,012
Total premiums $71,473
Percent of total world premiums
1.50%
(1) Includes accident and health insurance. Source: Swiss Re, sigma, No. 4/2015.

2016 International Insurance Fact Book updates at www.iii.org/international/ 93
Sri Lanka
LEADING NONLIFE INSURANCE COMPANIES, 2013
Gross written premiums
Company LKR Mn USD Mn
SLIC 12,785.7 99.1
Ceylinco 10,311.5 79.9
Janashakthi 6,342.6 49.1
Union Assurance 5,117.0 39.7
People's Insurance 3,085.0 23.9
AIA 2,428.7 18.8
Allianz Insurance Lanka 1,964.9 15.2
HNBA 1,767.4 13.7
LOLC 1,485.5 11.5
Asian Alliance 1,376.7 10.7
Source: Axco Insurance Information Services.
LEADING LIFE INSURANCE COMPANIES, 2013
Gross written premiums
Company LKR Mn USD Mn
Ceylinco 11,122.9 86.2
SLIC 8,070.0 62.5
AIA 6,863.1 53.2
UAL 5,515.1 42.7
Asian Alliance 2,520.3 19.5
Janashakthi 2,150.5 16.7
HNBA 2,014.6 15.6
Allianz Life 828.8 6.4
Amana Takaful 543.0 4.2
Cooperative 338.0 2.6
Source: Axco Insurance Information Services.
INSURANCE ASSOCIATION
Insurance Association of Sri Lanka Web: www.iasl.lk
POPULATION, 2011-2014 (1)
Year Population
2011 21,283,913
2012 21,481,334
2013 21,675,648
2014 21,866,445
(1) Estimated. Source: U.S. Central Intelligence Agency.
GROSS DOMESTIC PRODUCT, 2010-2014 (1)
(U.S. $ billions)
Year GDP
2010 $96.5
2011 104.7
2012 115.1
2013 134.5
2014 217.1
(1) Based on Purchasing Power Parity calculations, which take into account the relative cost of living and inflation rates of countries. GDP estimate for July for each year shown. Source: U.S. Central Intelligence Agency.
LIFE AND NONLIFE INSURANCE PREMIUMS, 2014
(U.S. $ millions)
Direct premiums written
Nonlife premiums (1) $485
Life premiums 366
Total premiums $850
Percent of total world premiums
0.02%
(1) Includes accident and health insurance. Source: Swiss Re, sigma, No. 4/2015.

2016 International Insurance Fact Book updates at www.iii.org/international/ 94
Sweden
LEADING NONLIFE INSURANCE COMPANIES, 2014
Gross written premiums
Company SEK Mn USD Mn
Lansforsakringar 21,184.0 3,087.7
If Skadeforsakring 12,846.0 1,872.4
Folksam 11,473.0 1,672.3
Trygg-Hansa 10,949.0 1,595.9
Moderna 2,150.0 313.4
Dina federationen 1,834.0 267.3
Gjensidige 1,075.0 156.7
Zurich 1,053.0 153.5
Landstingen 950.0 138.5
Anticimex 724.0 105.5
Source: Axco Insurance Information Services.
LEADING LIFE INSURANCE COMPANIES, 2014
Gross written premiums
Company SEK Mn USD Mn
Alecta 23,692.1 3,453.3
Skandia Liv 18,513.1 2,698.4
AMF Pension 16,964.8 2,472.7
Nordea Livforsakring 13,179.6 1,921.0
Swedbank Forsakring 13,153.4 1,917.2
Folksam Liv 12,197.4 1,777.8
SEB TL Fond 10,780.3 1,571.3
KPA Pensionfors 10,514.2 1,532.5
Avanza 9,189.7 1,339.5
Skandia Fondf. 9,123.3 1,329.8
Source: Axco Insurance Information Services.
INSURANCE ASSOCIATION
Swedish Insurance Federation Web: www.svenskforsakring.se
POPULATION, 2011-2014 (1)
Year Population
2011 9,088,728
2012 9,103,788
2013 9,119,423
2014 9,723,809
(1) Estimated. Source: U.S. Central Intelligence Agency.
GROSS DOMESTIC PRODUCT, 2010-2014 (1)
Year GDP
2010 $333.2
2011 354.0
2012 379.4
2013 393.8
2014 434.2
(1) Based on Purchasing Power Parity calculations, which take into account the relative cost of living and inflation rates of countries. GDP estimate for July for each year shown. Source: U.S. Central Intelligence Agency.
LIFE AND NONLIFE INSURANCE PREMIUMS, 2014
(U.S. $ millions)
Direct premiums written
Nonlife premiums (1) $10,556
Life premiums 28,179
Total premiums $38,735
Percent of total world premiums
0.81%
(1) Includes accident and health insurance. Source: Swiss Re, sigma, No. 4/2015.

2016 International Insurance Fact Book updates at www.iii.org/international/ 95
Switzerland
LEADING NONLIFE INSURANCE COMPANIES, 2013
Gross written premiums
Company EUR Mn USD Mn
AXA Winterthur 3,237.0 3,492.3
Zurich Versicherungs-Gesellschaft
2,593.7 2,798.3
Schweizerische Mobiliar Versicherungsgesellschaft
2,461.7 2,655.8
Allianz Suisse Versicherungs-Gesellschaft AG
1,764.6 1,903.8
Helsana Zusatzversicherungen AG
1,466.8 1,582.4
Basler Versicherung AG 1,316.9 1,420.8
Swica Krankenversicherung 1,200.5 1,295.1
CSS Versicherung AG 1,143.5 1,233.7
Visana Versicherungen AG 1,018.1 1,098.4
Generali Assurances Generales
808.0 871.8
Source: Axco Insurance Information Services.
LEADING LIFE INSURANCE COMPANIES, 2013
Gross written premiums
Company CHF Mn USD Mn
AXA Leben AG 9,838.2 10,614.0
Swiss Life SA 8,599.5 9,277.7
Helvetia Schweizerische Lebensversicherungsgesellschaft
3,574.1 3,855.9
Basler Lebens-Versicherungs-Gesellschaft
3,018.0 3,256.0
Allianz Suisse Lebensversicherungs-Gesellschaft AG
1,970.3 2,125.7
Zurich Lebensversicherungs-Gesellschaft
1,682.5 1,815.2
Generali Personenversicherungen AG
1,172.4 1,264.9
Schweizerische Mobiliar Lebensversicherungs-Gesellschaft
868.3 936.7
Pax, Schweizerische Lebensversicherungs-Gesellschaft
696.8 751.7
Vaudoise Vie, Compagnie d'assurances SA
263.3 284.1
Source: Axco Insurance Information Services.
INSURANCE ASSOCIATION
Swiss Insurance Association Schweizerischer Versicherungsverband Web: www.svv.ch
POPULATION, 2011-2014 (1)
Year Population
2011 7,639,961
2012 7,655,628
2013 7,996,026
2014 8,061,516
(1) Estimated. Source: U.S. Central Intelligence Agency.
GROSS DOMESTIC PRODUCT, 2010-2014 (1) (U.S. $ billions)
Year GDP
2010 $316.1
2011 326.5
2012 340.5
2013 370.3
2014 444.7
(1) Based on Purchasing Power Parity calculations, which take into account the relative cost of living and inflation rates of countries. GDP estimate for July for each year shown. Source: U.S. Central Intelligence Agency.
LIFE AND NONLIFE INSURANCE PREMIUMS, 2014 (U.S. $ millions)
Direct premiums written
Nonlife premiums (1) $29,117
Life premiums 36,094
Total premiums $65,211
Percent of total world premiums
1.36%
(1) Includes accident and health insurance. Source: Swiss Re, sigma, No. 4/2015.
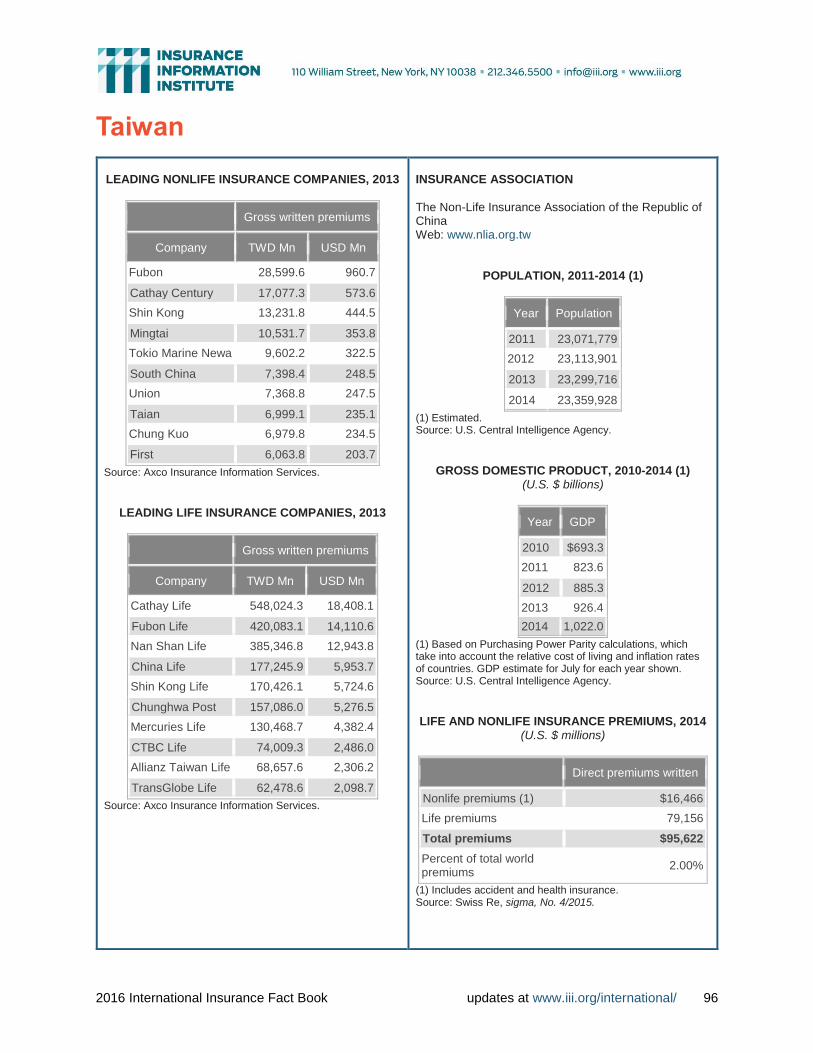
2016 International Insurance Fact Book updates at www.iii.org/international/ 96
Taiwan
LEADING NONLIFE INSURANCE COMPANIES, 2013
Gross written premiums
Company TWD Mn USD Mn
Fubon 28,599.6 960.7
Cathay Century 17,077.3 573.6
Shin Kong 13,231.8 444.5
Mingtai 10,531.7 353.8
Tokio Marine Newa 9,602.2 322.5
South China 7,398.4 248.5
Union 7,368.8 247.5
Taian 6,999.1 235.1
Chung Kuo 6,979.8 234.5
First 6,063.8 203.7
Source: Axco Insurance Information Services.
LEADING LIFE INSURANCE COMPANIES, 2013
Gross written premiums
Company TWD Mn USD Mn
Cathay Life 548,024.3 18,408.1
Fubon Life 420,083.1 14,110.6
Nan Shan Life 385,346.8 12,943.8
China Life 177,245.9 5,953.7
Shin Kong Life 170,426.1 5,724.6
Chunghwa Post 157,086.0 5,276.5
Mercuries Life 130,468.7 4,382.4
CTBC Life 74,009.3 2,486.0
Allianz Taiwan Life 68,657.6 2,306.2
TransGlobe Life 62,478.6 2,098.7
Source: Axco Insurance Information Services.
INSURANCE ASSOCIATION
The Non-Life Insurance Association of the Republic of China Web: www.nlia.org.tw
POPULATION, 2011-2014 (1)
Year Population
2011 23,071,779
2012 23,113,901
2013 23,299,716
2014 23,359,928
(1) Estimated. Source: U.S. Central Intelligence Agency.
GROSS DOMESTIC PRODUCT, 2010-2014 (1) (U.S. $ billions)
Year GDP
2010 $693.3
2011 823.6
2012 885.3
2013 926.4
2014 1,022.0
(1) Based on Purchasing Power Parity calculations, which take into account the relative cost of living and inflation rates of countries. GDP estimate for July for each year shown. Source: U.S. Central Intelligence Agency.
LIFE AND NONLIFE INSURANCE PREMIUMS, 2014
(U.S. $ millions)
Direct premiums written
Nonlife premiums (1) $16,466
Life premiums 79,156
Total premiums $95,622
Percent of total world premiums
2.00%
(1) Includes accident and health insurance. Source: Swiss Re, sigma, No. 4/2015.

2016 International Insurance Fact Book updates at www.iii.org/international/ 97
Thailand
LEADING NONLIFE INSURANCE COMPANIES, 2014
Gross written premiums
Company THB Mn USD Mn
Viriyah Insurance 33,376.2 1,027.6
Dhipaya Insurance 24,092.0 741.8
Bangkok Insurance 15,155.4 466.6
Muang Thai Insurance 10,028.1 308.8
Syn Mun Kong Insurance 9,603.8 295.7
Safety Insurance 8,516.0 262.2
Tokio Marine Insurance 7,411.8 228.2
Thanachart Insurance 5,894.0 181.5
Lmg Insurance 5,825.1 179.4
Mitsui Sumitomo Insurance
5,201.6 160.2
Source: Axco Insurance Information Services.
LEADING LIFE INSURANCE COMPANIES, 2013
Gross written premiums
Company THB Mn USD Mn
AIA 109,372.1 3,518.7
Muang Thai Life 60,249.4 1,938.3
Thai Life Insurance 55,030.9 1,770.5
SCB Life Assurance 45,486.5 1,463.4
Bangkok Life 39,079.2 1,257.3
Krungthai-AXA Life 37,730.0 1,213.8
Allianz Ayudhya Assurance
24,924.1 801.9
Ocean Life 13,333.0 429.0
FWD Life 13,149.7 423.1
Prudential Life 10,333.7 332.5
Source: Axco Insurance Information Services.
INSURANCE ASSOCIATION
General Insurance Association Web: www.thaigia.com
POPULATION, 2011-2014 (1)
Year Population
2011 66,720,153
2012 67,091,089
2013 67,448,120
2014 67,741,401
(1) Estimated. Source: U.S. Central Intelligence Agency.
GROSS DOMESTIC PRODUCT, 2010-2014 (1)
(U.S. $ billions)
Year GDP
2010 $539.7
2011 580.3
2012 609.8
2013 674.3
2014 990.1
(1) Based on Purchasing Power Parity calculations, which take into account the relative cost of living and inflation rates of countries. GDP estimate for July for each year shown. Source: U.S. Central Intelligence Agency.
LIFE AND NONLIFE INSURANCE PREMIUMS, 2014
(U.S. $ millions)
Direct premiums written
Nonlife premiums (1) $8,400
Life premiums 13,297
Total premiums $21,696
Percent of total world premiums
0.45%
(1) Includes accident and health insurance. Source: Swiss Re, sigma, No. 4/2015.
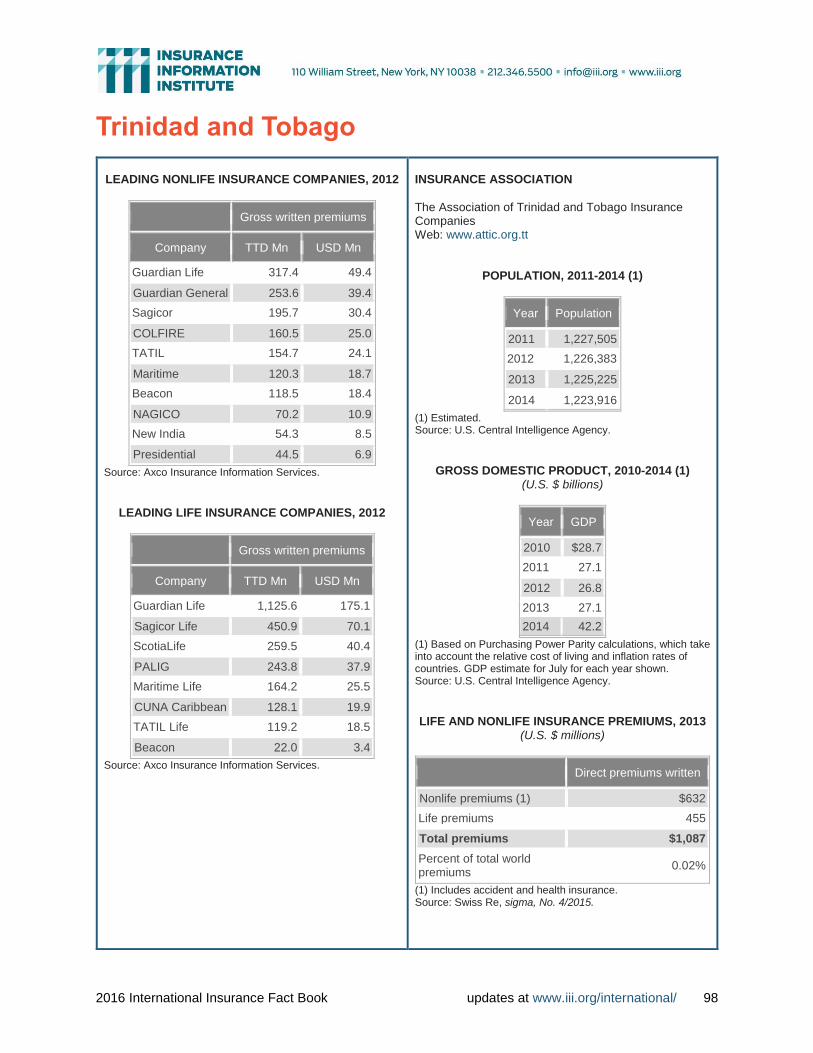
2016 International Insurance Fact Book updates at www.iii.org/international/ 98
Trinidad and Tobago
LEADING NONLIFE INSURANCE COMPANIES, 2012
Gross written premiums
Company TTD Mn USD Mn
Guardian Life 317.4 49.4
Guardian General 253.6 39.4
Sagicor 195.7 30.4
COLFIRE 160.5 25.0
TATIL 154.7 24.1
Maritime 120.3 18.7
Beacon 118.5 18.4
NAGICO 70.2 10.9
New India 54.3 8.5
Presidential 44.5 6.9
Source: Axco Insurance Information Services.
LEADING LIFE INSURANCE COMPANIES, 2012
Gross written premiums
Company TTD Mn USD Mn
Guardian Life 1,125.6 175.1
Sagicor Life 450.9 70.1
ScotiaLife 259.5 40.4
PALIG 243.8 37.9
Maritime Life 164.2 25.5
CUNA Caribbean 128.1 19.9
TATIL Life 119.2 18.5
Beacon 22.0 3.4
Source: Axco Insurance Information Services.
INSURANCE ASSOCIATION
The Association of Trinidad and Tobago Insurance Companies Web: www.attic.org.tt
POPULATION, 2011-2014 (1)
Year Population
2011 1,227,505
2012 1,226,383
2013 1,225,225
2014 1,223,916
(1) Estimated. Source: U.S. Central Intelligence Agency.
GROSS DOMESTIC PRODUCT, 2010-2014 (1) (U.S. $ billions)
Year GDP
2010 $28.7
2011 27.1
2012 26.8
2013 27.1
2014 42.2
(1) Based on Purchasing Power Parity calculations, which take into account the relative cost of living and inflation rates of countries. GDP estimate for July for each year shown. Source: U.S. Central Intelligence Agency.
LIFE AND NONLIFE INSURANCE PREMIUMS, 2013
(U.S. $ millions)
Direct premiums written
Nonlife premiums (1) $632
Life premiums 455
Total premiums $1,087
Percent of total world premiums
0.02%
(1) Includes accident and health insurance. Source: Swiss Re, sigma, No. 4/2015.

2016 International Insurance Fact Book updates at www.iii.org/international/ 99
Tunisia
LEADING NONLIFE INSURANCE COMPANIES, 2013 (1)
Gross written premiums
Company TND Mn USD Mn
STAR 258.3 159.0
Groupe COMAR 163.3 100.5
Groupe MAGHREBIA 148.9 91.7
Groupe GAT 130.5 80.3
Groupe CARTE 112.4 69.2
ASTREE 111.8 68.8
AMI 109.8 67.6
MAE 76.8 47.3
LLOYD 64.9 40.0
ASS.BIAT 64.8 39.9
(1) Includes life and nonlife. Source: Axco Insurance Information Services.
LEADING LIFE INSURANCE COMPANIES, 2012
Gross written premiums
Company TND Mn USD Mn
Maghrebia Vie 34.0 21.8
CARTE Vie 28.0 17.9
Hayett 27.2 17.4
Astree 20.5 13.2
Salim 20.3 13.0
BIAT 19.7 12.6
STAR 9.7 6.2
AMI 7.9 5.1
GAT Vie 5.9 3.8
Comar 5.7 3.7
Source: Axco Insurance Information Services.
INSURANCE ASSOCIATION
Federation Tunisienne des Societes d'Assurance Web: www.ftusanet.org
POPULATION, 2011-2014 (1)
Year Population
2011 10,629,186
2012 10,732,900
2013 10,835,873
2014 10,937,521
(1) Estimated. Source: U.S. Central Intelligence Agency.
GROSS DOMESTIC PRODUCT, 2010-2014 (1)
(U.S. $ billions)
Year GDP
2010 $83.6
2011 100.3
2012 101.7
2013 108.4
2014 125.1
(1) Based on Purchasing Power Parity calculations, which take into account the relative cost of living and inflation rates of countries. GDP estimate for July for each year shown. Source: U.S. Central Intelligence Agency.
LIFE AND NONLIFE INSURANCE PREMIUMS, 2014
(U.S. $ millions)
Direct premiums written
Nonlife premiums (1) $748
Life premiums 141
Total premiums $888
Percent of total world premiums
0.02%
(1) Includes accident and health insurance. Source: Swiss Re, sigma, No. 4/2015.

2016 International Insurance Fact Book updates at www.iii.org/international/ 100
Turkey
LEADING NONLIFE INSURANCE COMPANIES, 2014
Gross written premiums
Company TRY Mn USD Mn
Allianz 3,164.3 1,445.8
AXA 3,036.2 1,387.3
Anadolu 2,838.9 1,297.2
Ak 1,674.3 765.0
MAPFRE Genel 1,452.0 663.5
Gunes 1,185.7 541.8
Groupama 1,003.1 458.3
Eureko 791.6 361.7
Sompo Japan 682.3 311.8
Ziraat 661.8 302.4
Source: Axco Insurance Information Services.
LEADING LIFE INSURANCE COMPANIES, 2014
Gross written premiums
Company TRY Mn USD Mn
Ziraat Hayat ve Emeklilik 606.4 277.1
Acibadem Saglik ve Hayat 375.5 171.6
Anadolu Hayat Emeklilik 341.0 155.8
Allianz Yasam ve Emeklilik 337.1 154.0
Garanti Emeklilik ve Hayat 318.8 145.7
Aviva Emeklilik ve Hayat 258.3 118.0
Metlife Emeklilik ve Hayat 256.5 117.2
Halk Hayat ve Emeklilik 238.4 108.9
Cigna Finans Emeklilik ve Hayat
210.0 95.9
Vakif Emeklilik 185.5 84.8
Source: Axco Insurance Information Services.
INSURANCE ASSOCIATION
Association of Insurance and Reinsurance Companies of Turkey Web: www.tsrsb.org.tr
POPULATION, 2011-2014 (1)
Year Population
2011 78,785,548
2012 79,749,461
2013 80,694,485
2014 81,619,392
(1) Estimated. Source: U.S. Central Intelligence Agency.
GROSS DOMESTIC PRODUCT, 2010-2014 (1) (U.S. $ billions)
Year GDP
2010 $859.8
2011 958.3
2012 1,053.0
2013 1,167.0
2014 1,512.0
(1) Based on Purchasing Power Parity calculations, which take into account the relative cost of living and inflation rates of countries. GDP estimate for July for each year shown. Source: U.S. Central Intelligence Agency.
LIFE AND NONLIFE INSURANCE PREMIUMS, 2014
(U.S. $ millions)
Direct premiums written
Nonlife premiums (1) $10,119
Life premiums 1,476
Total premiums $11,595
Percent of total world premiums
0.24%
(1) Includes accident and health insurance. Source: Swiss Re, sigma, No. 4/2015.

2016 International Insurance Fact Book updates at www.iii.org/international/ 101
Ukraine
LEADING NONLIFE INSURANCE COMPANIES, 2013
Gross written premiums
Company UAH Mn USD Mn
AXA Insurance 782.8 97.9
Arsenal Insurance 636.5 79.6
Ingo Ukraine 630.8 78.9
Aska 614.2 76.8
Uniqa 589.5 73.8
Alfa Insurance 585.6 73.3
Providna 562.2 70.3
Lemma 509.4 63.7
Ukrainian Insurance Group 504.9 63.2
Alliance 417.0 52.2
Source: Axco Insurance Information Services.
LEADING LIFE INSURANCE COMPANIES, 2014
Gross written premiums
Company UAH Mn USD Mn
UNIQA Life 387.8 32.6
MetLife 319.3 26.9
Renaissance Life 260.0 21.9
TAS 209.5 17.6
Aska Life 183.4 15.4
GRAWE Ukraine Life Insurance
172.1 14.5
PZU Ukraine Life Insurance
154.3 13.0
Aegon Life Ukraine 143.9 12.1
Jupiter Life Insurance VIG 48.0 4.0
Illichivske 20.6 1.7
Source: Axco Insurance Information Services.
INSURANCE ASSOCIATION
League of Insurance Organisations of Ukraine Web: uainsur.com
POPULATION, 2011-2014 (1)
Year Population
2011 45,134,707
2012 44,854,065
2013 44,573,205
2014 44,291,413
(1) Estimated. Source: U.S. Central Intelligence Agency.
GROSS DOMESTIC PRODUCT, 2010-2014 (1) (U.S. $ billions)
Year GDP
2010 $294.3
2011 306.3
2012 327.4
2013 337.4
2014 373.1
(1) Based on Purchasing Power Parity calculations, which take into account the relative cost of living and inflation rates of countries. GDP estimate for July for each year shown. Source: U.S. Central Intelligence Agency.
LIFE AND NONLIFE INSURANCE PREMIUMS, 2014
(U.S. $ millions)
Direct premiums written
Nonlife premiums (1) $2,068
Life premiums 181
Total premiums $2,249
Percent of total world premiums
0.05%
(1) Includes accident and health insurance. Source: Swiss Re, sigma, No. 4/2015.

2016 International Insurance Fact Book updates at www.iii.org/international/ 102
United Arab Emirates (UAE)
LEADING NONLIFE INSURANCE COMPANIES,
2013 (1)
Gross written premiums
Company AED Mn USD Mn
Oman Insurance Company PSC
2,920.0 795.1
Abu Dhabi National Insurance Company PSC
2,307.0 628.2
Orient Insurance Company PJSC
1,512.0 411.7
Emirates Insurance Company PSC
695.0 189.2
Al Buhaira National Insurance Company PSC
520.0 141.6
Al Ain Ahlia Insurance Company- Public Shareholding Company
517.0 140.8
National General Insurance Co (PSC)
446.0 121.4
Al Wathba National Insurance Company PJSC
443.0 120.6
Al Sagr National Insurance Company PSC
393.0 107.0
Union Insurance Company PSC
354.0 96.4
(1) Includes life and nonlife. Source: Axco Insurance Information Services.
INSURANCE ASSOCIATION
Emirates Insurance Association Web: www.eia.ae
POPULATION, 2011-2014 (1)
Year Population
2011 5,148,664
2012 5,314,317
2013 5,473,972
2014 5,628,805
(1) Estimated. Source: U.S. Central Intelligence Agency.
GROSS DOMESTIC PRODUCT, 2010-2014 (1)
(U.S. $ billions)
Year GDP
2010 $200.4
2011 199.8
2012 260.8
2013 269.8
2014 605.0
(1) Based on Purchasing Power Parity calculations, which take into account the relative cost of living and inflation rates of countries. GDP estimate for July for each year shown. Source: U.S. Central Intelligence Agency.
LIFE AND NONLIFE INSURANCE PREMIUMS, 2014
(U.S. $ millions)
Direct premiums written
Nonlife premiums (1) $6,905
Life premiums 2,200
Total premiums $9,106
Percent of total world premiums
0.19%
(1) Includes accident and health insurance. Source: Swiss Re, sigma, No. 4/2015.

2016 International Insurance Fact Book updates at www.iii.org/international/ 103
United Kingdom
LEADING NONLIFE INSURANCE COMPANIES,
2013
Gross written premiums
Company GBP Mn USD Mn
Aviva 4,856.6 7,592.5
AXA 3,248.2 5,078.0
Direct Line Group 3,192.6 4,991.1
RSA Group 3,067.6 4,795.6
Zurich Insurance 2,544.9 3,978.6
Allianz 2,102.1 3,286.3
Ageas 2,095.2 3,275.4
BUPA 1,698.6 2,655.5
AIG 1,595.8 2,494.7
Liverpool Victoria 1,445.4 2,259.7
Source: Axco Insurance Information Services.
LEADING LIFE INSURANCE COMPANIES, 2013
Gross written premiums
Company GBP Mn USD Mn
Standard Life 11,703.0 18,295.7
Lloyds Banking Group 8,397.6 13,128.2
Aviva plc 8,273.0 12,933.4
Legal & General 6,939.0 10,847.9
Aegon NV 6,030.4 9,427.4
Prudential 5,368.9 8,393.3
Friends Life 4,570.5 7,145.2
Royal London Mutual 3,765.7 5,887.0
Pension Insurance Corporation (PIC)
3,663.5 5,727.3
FIL Ltd 2,697.8 4,217.6
Source: Axco Insurance Information Services.
INSURANCE ASSOCIATION
Association of British Insurers Web: www.abi.org.uk
POPULATION, 2011-2014 (1)
Year Population
2011 62,698,362
2012 63,047,162
2013 63,395,574
2014 63,742,977
(1) Estimated. Source: U.S. Central Intelligence Agency.
GROSS DOMESTIC PRODUCT, 2010-2014 (1)
(U.S. $ billions)
Year GDP
2010 $2,165.0
2011 2,189.0
2012 2,250.0
2013 2,378.0
2014 2,435.0
(1) Based on Purchasing Power Parity calculations, which take into account the relative cost of living and inflation rates of countries. GDP estimate for July for each year shown. Source: U.S. Central Intelligence Agency.
LIFE AND NONLIFE INSURANCE PREMIUMS, 2014
(U.S. $ millions)
Direct premiums written
Nonlife premiums (1) $115,945
Life premiums 235,321
Total premiums $351,266
Percent of total world premiums
7.35%
(1) Includes accident and health insurance. Source: Swiss Re, sigma, No. 4/2015.

2016 International Insurance Fact Book updates at www.iii.org/international/ 104
United States
LEADING PROPERTY/CASUALTY INSURANCE COMPANIES, 2014
Direct premiums written (1)
Company USD Mn
State Farm Mutual Automobile Insurance
58,508.6
Liberty Mutual 29,364.6
Allstate Corp. 28,892.1
Berkshire Hathaway Inc. 26,555.5
Travelers Companies Inc. 22,790.8
Progressive Corp. 20,056.9
Nationwide Mutual Group 18,935.9
American International Group (AIG) 18,654.0
Farmers Insurance Group of Companies (2)
18,611.7
USAA Insurance Group 15,678.2
(1) Before reinsurance transactions, includes some state funds. (2) Data for Farmers Group and Zurich Financial Group (which owns Farmers’ management company) are reported separately by SNL Financial. Source: SNL Financial LC.
LEADING LIFE INSURANCE COMPANIES, 2014
Direct written premiums (1)
Company USD Mn
MetLife Inc. 95,331.1
Prudential Financial Inc. 44,720.1
New York Life Insurance Group 28,393.8
Jackson National Life Group 26,708.2
AEGON 25,339.2
Lincoln National Corp. 24,329.1
American International Group 23,279.9
Principal Financial Group Inc. 18,894.8
Manulife Financial Corp. 18,513.8
Massachusetts Mutual Life Insurance Co.
16,818.4
(1) Includes life insurance, annuity considerations, deposit-type contract funds and other considerations; excludes accident and health insurance. Before reinsurance transactions. Source: SNL Financial LC.
INSURANCE ASSOCIATION
Insurance Information Institute Web: www.iii.org
POPULATION, 2011-2014 (1)
Year Population
2011 313,232,044
2012 313,847,465
2013 316,668,567
2014 318,892,103
(1) Estimated. Source: U.S. Central Intelligence Agency.
GROSS DOMESTIC PRODUCT, 2010-2014 (1)
(U.S. $ billions)
Year GDP
2010 $14,260.0
2011 14,720.0
2012 15,040.0
2013 16,720.0
2014 17,460.0
(1) Based on Purchasing Power Parity calculations, which take into account the relative cost of living and inflation rates of countries. GDP estimate for July for each year shown. Source: U.S. Central Intelligence Agency.
LIFE AND NONLIFE INSURANCE PREMIUMS, 2014
(U.S. $ millions)
Direct premiums
written
Nonlife premiums (1) $752,222
Life premiums 528,221
Total premiums $1,280,443
Percent of total world premiums
26.80%
(1) Includes accident and health insurance. Source: Swiss Re, sigma, No. 4/2015.

2016 International Insurance Fact Book updates at www.iii.org/international/ 105
Uruguay
LEADING NONLIFE INSURANCE COMPANIES, 2014
Gross written premiums
Company UYU Mn USD Mn
Banco de Seguros del Estado
13,898.7 597.9
Royal & Sun Alliance Seguros (Uruguay) SA
1,810.2 77.9
Porto Seguro - Seguros del Uruguay S.A.
1,520.9 65.4
MAPFRE Uruguay Compania de Seguros SA (Grales)
1,498.0 64.4
Sancor Seguros SA 881.2 37.9
AIG 535.3 23.0
HDI Seguros SA 419.8 18.1
Compania Cooperativa de Seguros Surco
332.6 14.3
Far Compania de Seguros SA
195.4 8.4
Berkley International Seguros SA (Uruguay)
136.4 5.9
Source: Axco Insurance Information Services.
LEADING LIFE INSURANCE COMPANIES, 2014
Gross written premiums
Company UYU Mn USD Mn
Banco de Seguros del Estado
5,738.4 246.9
MetLife Seguros de Vida SA 1,438.7 61.9
MAPFRE Uruguay Compania de Seguros SA (Grales)
1,204.3 51.8
Compania Cooperativa de Seguros Surco
213.9 9.2
Zurich Santander 156.3 6.7
Sancor Seguros SA 85.8 3.7
Porto Seguro - Seguros del Uruguay S.A.
72.4 3.1
Royal & Sun Alliance Seguros (Uruguay) SA
25.6 1.1
HDI Seguros SA 2.1 0.1
Source: Axco Insurance Information Services.
INSURANCE ASSOCIATION
Uruguayan Association of Insurance Companies Asociacion Uruguaya de Empresas Aseguradoras) Web: www.bnamericas.com
POPULATION, 2011-2014 (1)
Year Population
2011 3,308,535
2012 3,316,328
2013 3,324,460
2014 3,332,972
(1) Estimated. Source: U.S. Central Intelligence Agency.
GROSS DOMESTIC PRODUCT, 2010-2014 (1) (U.S. $ billions)
Year GDP
2010 $44.1
2011 48.4
2012 52.0
2013 56.3
2014 69.8
(1) Based on Purchasing Power Parity calculations, which take into account the relative cost of living and inflation rates of countries. GDP estimate for July for each year shown. Source: U.S. Central Intelligence Agency.
LIFE AND NONLIFE INSURANCE PREMIUMS, 2014
(U.S. $ millions)
Direct premiums written
Nonlife premiums (1) $854
Life premiums 343
Total premiums $1,197
Percent of total world premiums
0.03%
(1) Includes accident and health insurance. Source: Swiss Re, sigma, No. 4/2015.

2016 International Insurance Fact Book updates at www.iii.org/international/ 106
Venezuela
LEADING NONLIFE INSURANCE COMPANIES,
2013
Gross written premiums
Company VEF Mn USD Mn
Caracas de Liberty Mutual
12,466.7 2,061.3
Mercantil 10,377.7 1,715.9
Horizonte 7,736.8 1,279.2
Occidental 6,877.9 1,137.2
MAPFRE La Seguridad 6,440.6 1,064.9
Previsora 4,151.9 686.5
Altamira 3,358.4 555.3
Banesco 2,821.8 466.6
Estar 2,775.4 458.9
Multinacional 2,597.2 429.4
Source: Axco Insurance Information Services.
LEADING LIFE INSURANCE COMPANIES, 2013
Gross written premiums
Company VEF Mn USD Mn
Caracas de Liberty Mutual
12,466.7 2,061.3
Mercantil 10,377.7 1,715.9
Horizonte 7,736.8 1,279.2
Occidental 6,877.9 1,137.2
MAPFRE La Seguridad 6,440.6 1,064.9
Previsora 4,151.9 686.5
Altamira 3,358.4 555.3
Banesco 2,821.8 466.6
Estar 2,775.4 458.9
Multinacional 2,597.2 429.4
Source: Axco Insurance Information Services.
INSURANCE ASSOCIATION
Insurance Association Camara de Aseguradores de Venezuela Web: www.camaraseg.org
POPULATION, 2011-2014 (1)
Year Population
2011 27,635,743
2012 28,047,938
2013 28,459,085
2014 28,868,486
(1) Estimated. Source: U.S. Central Intelligence Agency.
GROSS DOMESTIC PRODUCT, 2010-2014 (1) (U.S. $ billions)
Year GDP
2010 $355.2
2011 344.2
2012 368.8
2013 407.4
2014 545.7
(1) Based on Purchasing Power Parity calculations, which take into account the relative cost of living and inflation rates of countries. GDP estimate for July for each year shown. Source: U.S. Central Intelligence Agency.
LIFE AND NONLIFE INSURANCE PREMIUMS, 2014 (U.S. $ millions)
Direct premiums written
Nonlife premiums (1) $21,937
Life premiums 727
Total premiums $22,665
Percent of total world premiums
0.47%
(1) Includes accident and health insurance. Source: Swiss Re, sigma, No. 4/2015.

2016 International Insurance Fact Book updates at www.iii.org/international/ 107
Vietnam
LEADING NONLIFE INSURANCE COMPANIES,
2013
Gross written premiums
Company VND Mn USD Mn
Bao Viet 5,673,151.0 271.0
PVI 5,099,968.0 243.6
Bao Minh 2,306,343.0 110.2
Pjico 1,984,459.0 94.8
PTI 1,478,444.0 70.6
Samsung Vina 919,910.0 43.9
BIC 792,263.0 37.9
MIC 693,070.0 33.1
ABIC 530,849.0 25.4
AAA 528,158.0 25.2
Source: Axco Insurance Information Services.
LEADING LIFE INSURANCE COMPANIES, 2013
Gross written premiums
Company VND Mn USD Mn
Prudential 7,566,441.0 363.3
Bao Viet Life 6,316,194.0 303.3
Manulife 2,634,099.0 126.5
Dai-ichi 1,857,292.0 89.2
AIA 1,757,136.0 84.4
ACE Life 1,147,363.0 55.1
PVI - Sun Life 1,024,885.0 49.2
Prevoir 382,933.0 18.4
Hanwha 277,500.0 13.3
Cathay Life 92,435.0 4.4
Source: Axco Insurance Information Services.
INSURANCE ASSOCIATION
Vietnam Insurance Association Web: www.avi.org.vn
POPULATION, 2011-2014 (1)
Year Population
2011 90,549,390
2012 91,519,289
2013 92,477,857
2014 93,421,835
(1) Estimated. Source: U.S. Central Intelligence Agency.
GROSS DOMESTIC PRODUCT, 2010-2014 (1)
Year GDP
2010 $258.2
2011 278.1
2012 299.2
2013 358.9
2014 509.5
(1) Based on Purchasing Power Parity calculations, which take into account the relative cost of living and inflation rates of countries. GDP estimate for July for each year shown. Source: U.S. Central Intelligence Agency.
LIFE AND NONLIFE INSURANCE PREMIUMS, 2014 (U.S. $ millions)
Direct premiums written
Nonlife premiums (1) $1,293
Life premiums 1,290
Total premiums $2,582
Percent of total world premiums
0.05%
(1) Includes accident and health insurance. Source: Swiss Re, sigma, No. 4/2015.

2016 International Insurance Fact Book updates at www.iii.org/international/ 108
International Insurance Organizations ASSOCIATION OF BERMUDA INSURERS & REINSURERS • 1445 New York Avenue 7th Floor. Washington, DC 20005. Tel. 202-783-2434. Fax. 202-638-0936. www.abir.bm — A group representing Bermuda's "class 4" reinsurance and insurance companies. AXCO INSURANCE INFORMATION SERVICES • 10 Old Broad Street. London, EC2N 1DW United Kingdom. Tel. (44) 20-7374-5252. Fax. (44) 20-7374-5277. www.axcoinfo.com — Research firm providing detailed insurance, healthcare and pensions market information on 165 countries. CAPTIVE INSURANCE COMPANIES ASSOCIATION • 4248 Park Glen Rd. Minneapolis, MN 55416. Tel. 952-928-4655. Fax. 952-929-1318. www.cicaworld.com — Organization that disseminates information useful to firms that utilize the captive insurance company concept to solve corporate insurance problems. THE GENEVA ASSOCIATION • Talstrasse 70, CH-8001 Zurich, Switzerland. Tel. 41-44-200 49-00. Fax. 41-44-200-49-99. www.genevaassociation.org/ — World organization formed by some 80 chief executive officers of leading insurance companies in Europe, North America, South America, Asia, Africa and Australia. Its main goal is to research the growing economic importance of worldwide insurance activities in the major sectors of the economy. Produces The Geneva Papers and other publications. GLOBAL FEDERATION OF INSURANCE ASSOCIATIONS • c/o Insurance Europe, Rue Montoyer 51, B-1000, Brussels, Belgium. Tel. +32 2-894-3081. www.GFIAinsurance.org — Represents 32 global insurance associations to speak on international issues. THE INSTITUTE FOR GLOBAL INSURANCE EDUCATION • c/o The Institutes, 720 Providence Road, Suite 100, Malvern, PA 19355. Tel. 610-644-2100. www.igie.org/ — Association comprised of independent, international insurance institutes, united by a common goal, to deliver professional education to insurance industry professionals. INSURANCE EUROPE • Rue Montoyer 51, Brussels, B-1000 Belgium. Tel. 32-2-894-30-00. Fax. 32-2-894-30-01. www.insuranceeurope.eu — European insurance and reinsurance federation. INTERNATIONAL ASSOCIATION OF INSURANCE SUPERVISORS • c/o Bank For International Settlements, CH-4002, Basel, Switzerland. Tel. 41-61-225-7300. Fax. 41-61-280-9151. www.iaisweb.org — Represents insurance supervisory authorities of some 100 jurisdictions. Promotes cooperation among members and sets international standards for insurance supervision. INTERNATIONAL INSURANCE SOCIETY, INC. • 101 Astor Place, Suite 202, New York, NY 10003. Tel. 212-277-5171. Fax. 212-277-5172. www.iisonline.org — A nonprofit membership organization whose mission is to facilitate international understandings, the transfer of ideas and innovations, and the development of personal networks across insurance markets through a joint effort of leading executives and academics throughout the world.

2016 International Insurance Fact Book updates at www.iii.org/international/ 109
INTERNATIONAL RISK MANAGEMENT INSTITUTE, INC. • 12222 Merit Drive Suite 1450, Dallas, TX 75251. Tel. 972-960-7693. Fax. 972-371-5120. www.irmi.com — Research, education and publishing company providing property/casualty insurance and risk management knowledge and solutions to insurance agents, brokers, underwriters, adjusters, lawyers and risk managers. INTERNATIONAL SOCIAL SECURITY ASSOCIATION • 4 route des Morillons, Case postale 1, CH-1211, Geneva, 22 Switzerland. Tel. 41-22-799-66-17. Fax. 41-22-799-85-09. www.issa.int/ — Nonprofit international organization consisting of institutions and administrative bodies dealing with diverse aspects of social security in countries around the world. INTERNATIONAL TRADE ADMINISTRATION • 1401 Constitution Ave NW, Washington, DC 20230. Tel. 1-800-USA-TRAD. www.trade.gov — Division of the U.S. Department of Commerce that helps U.S. businesses participate in the growing global marketplace. MICROINSURANCE NETWORK • 2, Rue Glesener, Luxembourg, L-1631 Luxembourg. Tel. 352-26-29-78-25/59/84/807. Fax. Fax: 352-26-29-78-69. www.microinsurancenetwork.org — A network of actors involved in microinsurance, including donor organizations, multilateral agencies, insurance and social protection providers, policymakers and academics. OPIC • 1100 New York Avenue, NW, Washington, DC 20527 United States. Tel. 202-336-8400. www.opic.gov — Self-sustaining U.S. government agency providing political risk insurance and finance services for U.S. investment in developing countries. ORGANISATION FOR ECONOMIC CO-OPERATION AND DEVELOPMENT (OECD) • 2, rue André Pascal, 75775 Paris Cedex 16. France. Tel. 33-1-45-24-82-00. Fax. 33-1-45-24-85-00. www.oecd.org — International organization of industrialized, market-economy countries. The OECD publishes numerous reports, including the Insurance Statistics Yearbook. SIGMA • c/o Swiss Re, Mythenquai 50/60, PO Box 8022. Zurich, Switzerland. Tel. 41-43-285-2121. www.swissre.com — The sigma publication series provides comprehensive information on international insurance markets and in-depth analyses of economic trends and strategic issues in insurance, reinsurance and financial services. TOPICS • c/o Munich Re, Königinstr. 107, Munich, 80802 Germany. Tel. 49-89-38-91-0. www.munichre.com — This annual publication presents a detailed account of the natural catastrophes that occurred in the past year and also examines long-term trends. WORLD FACT BOOK • c/o Central Intelligence Agency (CIA), Washington, DC 20505. Tel. 703-482-0623. Fax. 703-482-1739. www.cia.gov/library/publications/the-world-factbook/index.html — Produced by the CIA's Directorate of Intelligence, the fact book is a comprehensive resource of facts and statistics on more than 265 countries and other entities.

2016 International Insurance Fact Book updates at www.iii.org/international/ 110
Insurance Information Institute 110 William Street New York, NY 10038 Tel. 212-346-5500. www.iii.org
President – Robert P. Hartwig, Ph.D., CPCU – [email protected] Executive Vice President – Andréa C. Basora – [email protected] Senior Vice President and Chief Communications Officer – Jeanne Salvatore –
[email protected] Senior Vice President and Chief Economist – Steven N. Weisbart, Ph.D., CLU – [email protected]
RESEARCH AND INFORMATION SERVICES
Chief Actuary and Director of Research and Information Services – James Lynch, FCAS, MAAA – [email protected]
Research Manager – Mary-Anne Firneno – [email protected] Information Specialist – Maria Sassian – [email protected] Special Consultant – Ruth Gastel, CPCU – [email protected]
PUBLICATIONS
Managing Editor – Jennifer Ha – [email protected] Manager – Publications and Web Production, Publications Orders – Katja Charlene
Lewis – [email protected] MARKETING AND CONTENT STRATEGY
Director – Marketing and Content Strategy – James P. Ballot – [email protected] Director – Technology and Web Production – Shorna Lewis – [email protected]
MEDIA RELATIONS
Vice President – Media Relations – Michael Barry – [email protected] Vice President – Communications – Loretta Worters – [email protected] Terms + Conditions blog – Claire Wilkinson – [email protected] Impact Magazine –Diane Portantiere – [email protected] Administrative Assistant – Rita El-Hakim – [email protected] Administrative Assistant – Lilia Giordanao – [email protected]
REPRESENTATIVES
Davis Communications – William J. Davis, Atlanta – [email protected] Tel. 770-321-5150.
Hispanic Press Officer – Elianne González, Miami – [email protected] Tel. 954-389-9517.
Florida Representative – Lynne McChristian, Tampa – [email protected] Tel. 813-480-6446.
California Representative – Janet Ruiz, San Francisco – [email protected] Tel. 707-490-9365.