international financial manangement (combine) · fiis/fdis are playing their important role in...
TRANSCRIPT


O.P. AGARWALM.Com., LL.B. (Hons.), C.A.I.I.B., C.A.I.B. (London)
Diplomas in Cooperation and Ind. Finance,Chief Manager (Retd.),Bank of Maharashtra,
General Manager’s Office, Mumbaiand
Former InchargeBank of Maharashtra Staff Training Centre, New Delhi.
INTERNATIONAL FINANCIALMANAGEMENT
(For Students of Management Studies andCommerce Post Graduates)
ISO 9001:2008 CERTIFIED

© AuthorNo part of this publication may be reproduced, stored in a retrieval system, or transmitted in any form or by anymeans, electronic, mechanical, photocopying, recording and/or otherwise without the prior written permission of theauthor and the publisher.
First Edition : 2009Second Revised Edition : 2011Third Revised Edition : 2014Fourth Revised and Enlarged Edition : 2018
Published by : Mrs. Meena Pandey for Himalaya Publishing House Pvt. Ltd.,“Ramdoot”, Dr. Bhalerao Marg, Girgaon, Mumbai - 400 004.Phone: 022-23860170/23863863, Fax: 022-23877178E-mail: [email protected]; Website: www.himpub.com
Branch Offices :New Delhi : ‘Pooja Apartments’, 4-B, Murari Lal Street, Ansari Road, Darya Ganj,
New Delhi - 110 002. Phones: 011-23270392, 23278631; Fax: 011-23256286
Nagpur : Kundanlal Chandak Industrial Estate, Ghat Road, Nagpur - 440 018.Phones: 0712-2738731, 3296733; Telefax: 0712-2721215
Bengaluru : Plot No. 91-33, 2nd Main Road, Seshadripuram, Behind Nataraja Theatre, Bengaluru - 560 020.Phones: 08041138821, 09379847017, 09379847005
Hyderabad : No. 3-4-184, Lingampally, Besides Raghavendra Swamy Matham, Kachiguda,Hyderabad - 500 027. Phones: 040-27560041, 27550139; Mobile: 09390905282
Chennai : New No. 48/2, Old No. 28/2,Ground Floor, Sarangapani Street, T. Nagar,Chennai - 600 012. Mobile: 09380460419
Pune : First Floor, ‘Laksha’ Apartment, No. 527, Mehunpura, Shaniwarpeth, (Near Prabhat Theatre),Pune - 411 030. Phones: 020-24496323/24496333; Mobile: 09370579333
Lucknow : House No. 731, Shekhupura Colony, Near B.D. Convent School, Vikas Nagar, Aliganj,Lucknow - 226 022. Mobile: 09307501549
Ahmedabad : 114, ‘SHAIL’, 1st Floor, Opp. Madhu Sudan House, C.G. Road, Navrang Pura,Ahmedabad - 380 009. Phone: 079-26560126; Mobile: 09377088847
Ernakulam : 39/176 (New No. 60/251) 1st Floor, Karikkamuri Road, Ernakulam, Kochi - 682 011, Kerala.Phones: 0484-2378012, 2378016; Mobile: 09344199799
Bhubaneswar : Plot No. 214/1342, Budheswari Colony, Behind Durga Mandap, Laxmisagar,Bhubaneswar - 751 006. Phone: 0674-2575129; Mobile: 09338746007
Kolkata : 108/4, Beliaghata Main Road, Near ID Hospital, Opp. SBI Bank, Kolkata - 700 010,Phone: 033-32449649, Mobile: 09883055590, 07439040301
DTP by : Sudhakar ShettyPrinted at : Geetanjali Press Pvt. Ltd., on behalf of HPH.

(iii)
DDEDICATIONThis book is dedicated to
Goddess Saraswati – Goddess of Learning,without WHOSE Blessings, I could not havecompleted this book for the new generation of
Management Students.
O.P. Agarwal(Author)


(v)
PREFACE TO FOURTH EDITION
I have great pleasure in presenting the fourth revised edition in the hands ofesteemed readers/students. FIIs/FDIs are playing their important role in InternationalFinance, particularly in India, i.e., Bharat for its overall growth. Till 2011, therewere only BSE and NSE stock exchanges with international repute to which threemore additions have been made in May 2012 and May 2013, i.e., MultiCommodity Exchange MCX-SX which has also started trading in currencyoptions under European type from 9-2-2012, United Stock Exchange from May,2012 and Universal Commodity Exchange, Mumbai, since 19-4-2013.
The year 2018 is going to witness the total availability of over 50 bookswritten in English and Hindi Languages by me for B.Com./M.Com./MMS/BMS/CAIIB/JAIIB and also for professional bankers. Special attention has been givento provide latest data and details in certain chapters, since it is the need of thehour.
Demonetisation of high denomination currency notes of ` 1,000 and ` 500which was done on 8th Nov. 2016 greatly affected the export market andreduction in GDP estimates. The Long Term Loans at the end of March 2015were $ 391.1 bn and foreign reserves at the end of Sept. 2017 were $ 403 bn.
I am indebted to my wife Smt. Veena Agarwal M.A. (Eco.) without whosesupport and encouragement, presentation of so many books would not have beenpossible.
Suggestions for improving the content of the book are always welcome.
O.P. AGARWAL704/11-D, Springleaf Bldg.,
Lokhandwala Complex,Date: 11.01.2018 Kandivli (E), Mumbai - 400 101.

(vi)
PREFACE TO FIRST EDITION
Reason for Writing: As a guest faculty, I used extensive set of teachingmaterials in the classroom and relied more on teaching materials and notes andless on major textbooks.
After liberalisation and globalisation in 1991, the scope and content ofInternational Finance have been fast evolving due to deregulation of financialmarkets/product innovations and technological advancements. In writing thisedition, my goal has been to provide well organised/comprehensive/up-to-datecoverage of topics and consolidation of materials as per syllabus of Mumbai andDelhi Universities. The contents of text is presented in a USER-FRIENDLYfashion. The book is intended for use at Management Studies (MBA) andM.Com. levels.
Managerial Perspective: The topic’s presentation never loses sight that itis teaching students how to make managerial decisions. This book is founded inthe belief that the fundamental job of the financial executive is to maximiseshareholder’s wealth. This belief permeates the DECISION MAKING PROCESS.
Acknowledgements: I am indebted to my daughter Smt. Shubha S. Govil,M.Sc. who helped in insight throughout the development process. Last but notthe least, I thank my family, Mrs. Veena Agarwal M.A. (Eco.) for her support ather 61 years of age without which this book would not have become a reality.
O.P. AGARWAL704/11-D, Springleaf Bldg.,
Lokhandwala Complex,Date: 7th November, 2008 Kandivli (E), Mumbai - 400 101.

(vii)
CONTENTS
CHAPTER 1
MULTI-NATIONAL CORPORATION (MNC) AND ITS 1-22INTERNATIONAL ENVIRONMENT
1.0 Definition of Multi-national Corporation (MNC)1.1 Reasons for Growth of MNCs1.2 International Environment1.3 Economic Liberalisation1.4 Financial Market Reforms1.5 Balance of Payments (BoP) Scenario and Rupee Exchange Rate1.6 Japan on Brink of Recession1.7 Bank of England Cuts Growth Forecasts, Unemployment Rises1.8 Global Bank Majors Finds India Hot, Vie for Licence1.9 China’s Economic Indicators
CHAPTER 2
MULTI-NATIONAL CORPORATION (MNC) — 23-28ITS RATIONALE, GOALS AND CONSTRAINTS
2.0 What are Multi-national Corporations (MNCs)?2.1 Rationale or Reasons for Growth2.2 Risks and Constraints
CHAPTER 3
INTERNATIONAL FINANCIAL MARKETS 29-73
3.0 Flow of Financial Markets to Cross Border3.1 Why FDIs are Required?3.2 Foreign Direct Investment (FDD) and Foreign Portfolio Investment (FPI)3.3 FDI vs. FPI3.4 Investment Rates of FDI3.5 Factors Responsible for the Growth of FDI3.6 Role of FEDAI in FEX Market3.7 The Foreign Exchange Management Act (FEMA)3.8 Cost Associated with FDIs and its Repurcussions3.9 Other Sources of Financial Inflows
3.9.1 Foreign Currency Non-resident (Bank) Accounts3.9.2 External Commercial Borrowings (ECB)3.9.3 GDRs/ADRs/IDRs
3.10 Debt and Non-debt Flows3.11 Volatile and Stable Flows3.12 Interest Rate Differentials and their Role in Demand for and Supply of Funds across Borders3.13 US Disclosure Norms for Offshore Accounts

(viii)
CHAPTER 4
OFFSHORE BANKING CENTRES AND MANAGEMENT OF RISKS 74-97
4.0 Offshore Banking Operations4.1 Offshore Banking Centres (OBCs)4.2 What are Offshore Markets?4.3 Benefits of Offshore Banking4.4 Role of Offshore Banking
4.4.1 Offshore Market Segments4.5 Global Balance Sheet of Banks’ Assets and Liabilities4.6 Management of Liquidity Risks4.7 Management of Interest Rate Risks4.8 Management of Foreign Exchange Risks4.9 Measures for Foreign Risk Management
4.9.1 Internal Techniques4.9.2 External Techniques
CHAPTER 5
FOREIGN EXCHANGE RISK APPRAISAL 98-125
5.0 Foreign Exchange Risks — Definition5.1 Why Exchange Rates Fluctuate?
5.1.1 Factors Affecting Exchange Rate5.2 Exchange Rate Savings5.3 Failure of Foreign Exchange Risks — Cases5.4 Risks in Foreign Exchange Dealings5.5 Foreign Exchange Risks5.6 Risks to Exporters, Importers, Traders5.7 Country Risks
5.7.1 Measuring Exposure in Foreign Direct Investments5.7.2 Measuring Political (Country) Risks
CHAPTER 6
BALANCE OF PAYMENTS (BoP) 126-134
6.0 Meaning of Balance of Payments (BoP)6.1 Disequilibrium and Targets under 12th Five Year Plan
(April 2012 to March 2017)6.2 Correcting the Deficit
CHAPTER 7
INTERNATIONAL BANKING 135-143
7.0 Why Banks Engage in International Banking?7.1 Correspondent Banking7.2 Branches7.3 International Activities of US Banking Organisations
CHAPTER 8
FOREIGN EXCHANGE MARKET 144-163
8.1 Definition and Role of Foreign Exchange Market (FEX)8.2 Role of Forex Manager in the Indian FX Market

(ix)
8.3 Foreign Exchange Transactions8.4 Sale/Purchase Transactions8.5 Spot/Forward Transactions8.6 Foreign Exchange Market8.7 Rate of Exchange8.8 Exchange Rates and their Application8.9 Systems of Exchange Rates
8.10 Fixed Rate of Exchange8.11 Present System (Under IMF Agreement)8.12 Floating/Flexible Rates of Exchange8.13 Intermediary Arrangements8.14 Other Exchange Rates Systems8.15 Other Exchange Rates8.16 Factors Influencing Exchange Rates8.17 Official Intervention8.18 Purchasing Power Parity (PPP)8.19 Currency Forecasting
CHAPTER 9
DETERMINATION OF EXCHANGE RATE QUOTATIONS 164-172
9.1 Commercial Rates of Exchange9.2 Spot Rates9.3 TT Rates9.4 Currency Rate/Currency Quotation9.5 Dollar Rate/Direct Quotation9.6 Buying and Selling Rates9.7 Buying Rates9.8 Selling Rates9.9 Exchange Rates — Maxims
9.10 Cross Rates9.11 Method of Expressing Rates of Exchange9.12 Composition of Rupee-Dollar Spot Rates9.13 Rupee — Other Currency Rates
CHAPTER 10
OPTION FORWARDS AND SWAPS 173-203
10.1 Outright Forwards10.2 What are Derivatives — History and Development?10.3 Option Forwards10.4 Rules for Quoting Option Forward Rates10.5 Working Out of Option Forward Rates10.6 Illustrations10.7 Swap and Deposit10.8 Swap and Investment10.9 Illustrations
10.10 Hedging Commodity Price Risks

(x)
CHAPTER 11
INTERNATIONAL FINANCIAL INSTITUTIONS 204-218
11.1 Term-lending International Institutions11.2 International Monetary Fund (IMF)11.3 International Bank for Reconstruction and Development (IBRD)11.4 International Finance Corporation (IFC)11.5 International Development Association (IDA)11.6 Asian Development Bank (ADB)11.7 United Nations Conference on Trade and Development (UNCTAD)
CHAPTER 12
MULTI-NATIONAL CAPITAL BUDGETING 219-229
12.0 Principles of Foreign Capital Budgeting12.1 Difficulties in Evaluating Foreign Projects12.2 Total Amount of Taxation12.3 Adjusted Present Value (APV) Technique12.4 Illustrated Case of Centralia Corporation12.5 Risk Adjustment
CHAPTER 13
COST OF CAPITAL AND FINANCIAL STRUCTURE 230-237
13.0 Cost of Capital13.1 Cost of Capital in Segmented vs. Integrated Markets13.2 Do Cost of Capital Differ among Nations?13.3 Cross Border Listing of Stocks13.4 Foreign Equity Ownership Restrictions13.5 Asset Pricing under Foreign Ownership Restrictions
CHAPTER 14
LONG-TERM INVESTMENT DECISIONS 238-254
14.0 Financial Decisions for Overseas Corporate Control14.1 Buying Cross Border Mergers and Acquisitions (M&A)14.2 Global Deals to Drive Asia M&A Charge14.3 Competition Panel Plans Easier M&A Guidelines14.4 What Happens after the Acquisition is Done?14.5 Political Risk and Foreign Investment Decisions14.6 Think Investment, Think Russia
14.6.1 Law Change on Foreign Investment14.6.2 The Hot 42 Strategic Businesses
14.7 Egypt Defies Volatile Markets to Attract Foreign Investment
CHAPTER 15
INTERNATIONAL TRANSFER PRICING 255-259
15.0 Measurement of Transfer Pricing15.1 Considerations in Transfer Pricing15.2 Practical Considerations15.3 Legal Provision in Indian Income Tax15.4 International Transactions

(xi)
CHAPTER 16
INTERNATIONAL MONETARY SYSTEM 260-269
16.0 An Overview16.1 Classical Gold Standard (1875 to 1914)16.2 Inter-war Period (1915 to 1944)16.3 Bretton Woods System (1945 to 1973)16.4 Flexible Exchange Rate Period (1973 to 1985)16.5 Cooperative Intervention (1985 and Beyond)16.6 Latin American Currencies Heat Up16.7 European Common Market and Euro
CHAPTER 17
GLOBALISATION AND FINANCIAL DEREGULATION 270-302
17.1 Global Financial Markets17.2 Deregulation in Financial Services17.3 Trade Liberalisation
17.3.1 Globalisation through Privatisation17.4 Globalisation by Multi-national Corporations (MNCs)
17.4.1 Indian Banking — Towards Global Banking17.4.2 Capital Adequacy17.4.3 Importance of Risk Management17.4.4 Readiness of Indian Banking Sector17.4.5 Basel-II Challenges
17.5 Financial Innovations17.5.1 Futures Contracts17.5.2 Hedging and Speculation with Currency Futures17.5.3 Currency Options17.5.4 Put Options17.5.5 Hedging with Currency Options
17.6 Multi-currency Bonds17.7 International Mutual Funds17.8 Country Funds17.9 Future of Globalisation
17.10 For a New Financial Architecture
CHAPTER 18
MONETARY THEORIES OF EXCHANGE RATE 303-321DETERMINATION AND EXCHANGE RATE RISKS
18.0 Monetary Theory of Exchange Rates18.1 Purchasing Power Parity (PPP) Theory18.2 Interest Rate Parity (IRP)18.3 Essentials of Monetary Theory of Exchange Rates
18.3.1 Portfolio Balance Approach18.3.2 Theory of Overshooting Exchange Rates
18.4 Exchange Rate Risk18.5 Management of Transaction Exposure18.6 Real Operating Exposure

(xii)
CHAPTER 19
INTERNATIONAL FINANCIAL MARKETS 322-325
19.0 Foreign Bonds and Euro Bonds19.1 International Bond Market – Its Types19.2 Euro-Commercial Papers – (ECP)
CHAPTER 20
FOREIGN TRADE 326-368
20.1 Foreign Trade20.2 Its Meaning20.3 Dumping20.4 Balance of Trade20.5 Foreign Contracts20.6 International Trade Agreements/Institutions20.7 Favoured Nation Clause (FNC)20.8 Euro Money20.9 Methods of Foreign Trade
20.10 Banking Facilities20.11 Role of Exim Bank20.12 Free Port/Free Trade Zone/Export Promotion Zones20.13 Offshore Banking Operations Special Economic Zones (SEZs)20.14 LIBOR20.15 European Currency Markets20.16 Forfaiting – A Form of Medium Term Finance
CHAPTER 21
INSTRUMENTS OF FOREIGN TRADE 369-379
21.1 Documents Used in Foreign Trade21.2 Marine Insurance Policy (Art. 28 UCPDC – 600)21.3 Marine Risks21.4 Marine Insurance Losses21.5 Bills of Exchange21.6 Consular Invoice21.7 Packing List
CHAPTER 22
CROSS BORDER FINANCING — EXPORT FINANCE — 380-391PRE-SHIPMENT
22.1 Introduction to Cross Border Banking22.2 Cross Border Trade Finance22.3 Export Finance
22.3.1 Pre-shipment Finance22.3.2 Deferred Payment Exports
22.4 Buyer’s Credit22.5 Exim Bank’s Buyer’s Credit Scheme22.6 Supplier’s Credit22.7 Supplier’s Credit under Contracts Not Involving the Exim Bank Credit22.8 Supplier’s Credit under Other Supply Contracts

(xiii)
22.9 Turnkey Projects22.10 Joint Ventures Abroad22.11 Bank Credit
CHAPTER 23
CROSS BORDER EXPORT FINANCE — POST-SHIPMENT 392-418
23.1 Post-shipment Finance23.2 GR Form (Exchanges Control Declaration)23.3 Permissible Deductions23.4 Irregular Documents23.5 Negotiation under Reserve23.6 Accounting23.7 Normal Transit Period23.8 Direct and Indirect Bills23.9 Grace Period
23.10 Bills Register23.11 Despatching23.12 Endorsement on L/C23.13 Exchange Cover23.14 ECGC Policy/Guarantee23.15 In Case of Advance Payment23.16 On Payment23.17 Bills against Export Order23.18 Permissible Changes23.19 Reduction in Value23.20 Reversal of Entries23.21 Partial Drawings or Shipments23.22 Exports on Consignment23.23 Documentation23.24 Overdue Bills23.25 Writing Off of Overdue Bills23.26 Re-import of Unsold Goods23.27 Lost Shipment23.28 Gift Parcels23.29 External Funds Mobilisation
23.29.1 External Commercial Borrowings (ECBs)23.29.2 Syndication of Loans23.29.3 Floating Rate Notes (FRNs)/Bonds23.29.4 Raising of Equity through ADRs/IDRs/GDRs
CHAPTER 24
INTERNATIONAL ACCOUNTING 419-436
24.0 Accounting Implications24.1 Accounting for Foreign Currency Transaction
24.1.1 Accounting Monetary/Non-monetary Items24.1.2 Accounting Implications24.1.3 Provisions for Accounting for Fixed Assets
24.2 Accounting for Investments in Shares

(xiv)
CHAPTER 25
INTERNATIONAL WORKING CAPITAL MANAGEMENT 437-442
25.0 Objectives25.1 Cash Management25.2 Cash Management System in Practice25.3 International Cash Management
CHAPTER 26
REGIONAL MONETARY BLOCKS 443-451
26.1 Growth… By Leaps and Bounds26.2 Different Monetary Blocks26.3 Implications of Regional Trade Blocks
CHAPTER 27
WORLD STOCK MARKETS 452-472
27.1 Introduction27.2 Stock Exchange27.3 History27.4 The Role of Stock Exchange
CHAPTER 28
CASE STUDIES ON SUBJECT 473-481
28.1 Foreign Exchange Market28.2 Risk Management28.3 Measuring Transaction Exposure28.4 Long Term Investment Decision28.5 Foreign Investment Decisions28.6 Political Risk Management We Believe in Euro Currency28.7 International (Multi-national) Capital Budgeting28.8 International Financial Markets — Detroit Motors Latin American Expansion28.9 Cost of Capital and Financial Structure
28.10 International Banking28.11 Balance of Payments (BoP)28.12 When to Borrow?28.13 Determination of Price under Appreciation of US Dollars
BIBLIOGRAPHY 482

1.0 DEFINITION OF MULTI-NATIONAL CORPORATION (MNC)Multi-national Corporation (MNC) or international Corporation/transnational corporation is
an organisation doing business in more than one nation. MNC produces/markets, invests and operatesacross the globe. MNC engages in various activities like, exporting/importing and manufacturingin different countries. MNCs have worldwide involvement and an international perspective as regardsits management and decision-making. MNCs invest considerably in opportunities of production andtake managerial decisions based on a global perspective, by integrating operations. MNCs are hugeindustrial/business organisations. MNCs (Transnational) mostly uses the inputs of the host countrywhere it operates unlike a multi-national corporation.
The essential nature of the multi-national enterprises lies, in the fact that its managerial headquarters are locatedin one country (referred for convenience as the home country) while the enterprise carries out operations in anumber of other countries as well (host countries). Obviously, what is meant is a CORPORATION that controlsproduction facilities in more than one country, such facilities having been acquired through the process of foreigndirect investment. Firms that participate in international business, however large they maybe, solely by exporting orby hunting technology are not multi-national Enterprises. – International Labour Organisation
Multi-national corporation responds to the specific needs of the various nations, markets regardingproduct/price and promotion. Thus, MNC operates is more than one country, but operates like aDOMESTIC COMPANY of the country concerned. MNCs are incorporated or unincorporatedenterprises comprising parent enterprises and their foreign affiliates.
1.1 REASONS FOR GROWTH OF MNCsMNCs exercise massive control over world economy. Several factors contributed for the growth
of MNCs, such as:(a) Expansion of Market Territory: Increase in percentage income and GDP growth has
brought about a rise in the living standards of the citizens. These factors, in turn, has contributed(1)
MULTI-NATIONALCORPORATION (MNC) AND
ITS INTERNATIONALENVIRONMENT
1

2 International Financial Management
towards the expansion of market territory. Put simply, the large operations of the MNCs build theimage — one which is necessary for the expansion of market territory.
MNCs enjoy the following advantages over domestic companies, namely,(b) Marketing-wise — Availability of more reliable and up to date data and information Enjoy market reputation Lesser difficulties in marketing the products Adopt more effective advertising and sales promotion techniques Availability of quick transportation and warehousing facilities
(c) Finance-wise — Large and substantial resources at its disposal Use funds more effectively and economically, the excess funds of a country are funnelled
to meet the requirements in other countries Easy access to overseas capital markets Mobilise resources of high quality, quite easily Access to foreign banks and international financial institutions
(d) Technology-wise: MNCs are invited since they are rich in advanced technology and developby continuous research. The developing countries regard the transfer of the technology by the MNCsas useful for the following reasons: —
Insufficient resources to develop technology. Paucity of financial resources to exploit natural resources. Non-utilisation of men, material and capital optimally. Import of raw materials need foreign exchange resources — one which is not available in
developing nations. Failure in marketing the products due to severe competition.
(e) Product Innovation: MNCs collect information regarding the tastes and preferences ofconsumers and accordingly, invents new products. The MNCs took birth in the early 1860s. It wasafter the Second World War that multi-nationals have grown rapidly. In the early days, the US wasthe home of most of the MNCs. Now, there are over 50,000 MNCs with a large number of Chinese,Indian, Japanese and European multi-nationals. In the list of first 20 MNCs, Japan has a major share.MNCs have been emerging from the developing countries too. South Korea has, for example, boastsof well-known MNCs like, Samsung, Hyundai, LG, and Daewoo. Japanese companies, have product-lines that are much too broad. Of the top 10 Corporations in the US only one, GEC is a classicconglomerate; whereas in Japan all are conglomerates barring only 2, namely, Toyota Motor andNippon Telegraph and Telephone.

3Multi-national Corporation (MNC) and Its International Environment
ADVANTAGES OF MNCs
Overseas Investments in India
Foreign Direct Investment (FDI) inflows touched the level to $ 11.4 billion in June 2007, as compared toprevious quarter when it has the figure of $ 4.9 billion in March 2007, hence increase by 185%.*
The same in March 2006 was barely $ 1.7 billion. FDI comes from Mauritius/Japan/Cyprus/USA/Singapore. Itcomes in the sectors of service/telecom/electrical equipment/real estate and transportation industries. Receipt ofFDI in the following years was:
2007-08 $ 34.2 billion2008-09 $ 34.9 billion2010-11 $ 25.9 billion2011-12 $ 33.0 billion2014-15 $ 30.93 billion2015-16 $ 40.00 billion
* Times of India /E.T. Newspaper. New FDI Norms for retail trade have been declared by RBI on 20-09-2012.The highest ever FDI in a year after 2000-01 was received in 2014-16.
1.2 INTERNATIONAL ENVIRONMENTPrivate sector development has been encouraged to exploit the resources of the nation to increase
the production capacity of the economy in terms of types of products, industrial as well as consumergoods. Private industries enjoyed the privilege as the monopolistic enterprises and dictated theirterms to both the national and international market. Public sector industries miserably failed in theirobjectives and could not reach the goal of wealth maximisation. As a result, most of the publicsector industries ran into losses. In addition to this, the Government of India could not control the
To Host Country
(i) Investment/employment and income levelsincrease after MNC’s set-up operations.
(ii) Industrial and economic development increasedue to growth in ancillary and service industries.
(iii) Gets latest technologies from overseas.(iv) Gets sophisticated and latest management
techniques.(v) Domestic suppliers of various inputs get
stimulation and increased business.(vi) Creates competition among domestic
companies.(vii) Makes use of Research and Development.
(viii) Advantage of culture brought from overseas.(ix) Increase exports out of goods produced by
MNCs.
To Home Country
(i) Opportunities for marketing the productsare created.
(ii) Creates employment opportunities both athome and abroad.
(iii) Industrial activity gets fully activated.(iv) Contributes to favourable Balance of
Payments in the long run.(v) Gets the benefit of foreign culture brought
in by MNC.
4 International Financial Management
expenditure and thus failed to increase the revenue substantially. This, in turn, forced the CentralGovernment to borrow funds from the International Monetary Fund. (IMF) to maintain the Balanceof Payments. Continuous borrowing from IMF and IBRD increased the financial risks of India andit reached a point where the government had to yield to the pressure of international financial institutions.As a pre-condition to extend further financial facilities, international financial institutions prevailedupon India to junk its mixed economic policy and instead embrace a financial policy — one, whichis in tune with the global economic policy. In other words, IMF and IBRD insisted that India introduceliberalisation/privatisation and globalisation. Liberalisation is a corollary to globalisation. Liberalisationmeans to reduce unnecessary restrictions and controls on business units imposed by the government.It involves simplification, relaxing trade and industry from unnecessary bureaucratic hurdles. Theunreasonable restrictions, controls, licenses and permit, etc., delay the process of sanctions requiredfor start of new ventures and also the operations of existing units. As such, the Indian economicenvironment changed in the year 1991 so much so that it changed the total concept of business inthe country. Liberalised licensing policy encouraged new industries from within and overseas.Competitive environment has been witnessed all over the country for all types of products. Competitivebusiness forced the business houses to treat customers as supreme. To achieve this goal as well aswealth maximisation, new business strategies are being practiced, self-introspection of the corporatesare also being witnessed. These changes are not only experienced in the field of industries but alsoin agriculture and service sector all over the world. The traditional methods adopted for managingthe business enterprise are of no use now. The overall objective of the business concerns is to increasetheir base. Prior to 1991, Indian corporates were concentrating on wealth creation or wealthmaximisation well within the country. Their focus was on fulfilling the desires of Indian investors.However, now the economy has thrown open to global market not only to the products but also toraise funds from different countries. Corporates are expected to create wealth for global investors.The multi-national companies have to increase the wealth of the investors on a global basis. Thisnecessitated the carrying out of business in MORE THAN one country and forced the managementof the business houses to learn the operation of different currencies in the world.
The inexorable tide of globalisation sweeping across the nations in trade and commerce, thefreeing of capital flow transfers and the liberalisation of domestic markets permitting entry of foreigninvestors are also changing the complexities of risk management making it a truly GLOBALphenomenon. The rapid spread of equity culture in the public has thrust more statutory and otherresponsibilities on corporations. It has given the public a voice vis-a-vis how corporations managetheir risk exposures in the interest of all stakeholders and not merely of those shareholders.
Corporate governance norms are significantly changing due to stakeholders’ pressures bringingrisk management of corporations before the public through the print media, television besides theavailability of global information through internet have also made the rest of the global citizenrymore aware of how lapses in risk management are tackled elsewhere. As a result, they are demandinginternational risk standards in risk exposure management in their own countries via., change of locallaws and their enforcement. The outcry in India in the year 2003 in respect of Coca-Cola, Pepsiand manufacturers of bottled mineral water, for lack of adequate safety standards is an offshoot ofwhat is happening elsewhere; namely, public wanting more stringent standards enforced.
Environment constitutes a major variable within which an organisation has to operate, it refersto the totality of all factors which are external to and beyond the control of enterprises. Externalenvironment in reference to international environment means opportunities and threats which can
5Multi-national Corporation (MNC) and Its International Environment
be used to workout appropriate strategies suitable to the scenario. This century perhaps differ fromthe past with regard to the scope of newer fields that have emerged in terms of professional opportunities.As India gets more liberalised, there will be available broad variety of jobs in service sector whichwill turnout to be a key provider of employment.
Financial markets of the world are increasingly integrating. Many countries have been movingtowards deregulation. Financial opportunities have increased manifold across markets — be it thedebt market or equity market. Almost all products and services face global competition (separateprinted sheets).
1.3 ECONOMIC LIBERALISATION
Indian Economic GradualismThe basic hypothesis, on which the economic philosophy of reforms rests is that the unfettered
market mechanism is a better guide or signal for allocation of resources. It brings out greater efficiency,in the process and pattern of allocation, and the use of financial and real resources. Higher efficiencynot only brings gains in productivity but also enables higher rate of growth. The disturbing sideeffect of reform is that the process of transition or change in allocation is painful, and the greaterthe degree of regulation of market forces and faster its reversal, the more dislocating is the changeemerging from altered allocation of resources. Reforms have to cover several sectors of the economy,such as, industry, agriculture, fiscal, banking, financial and capital market, trade and tariff, BoPand exchange rate. They could cover all sectors at one go with speedier implementation. Alternatively,they could be sequenced and implemented gradually in phases. Many economies have gone in fortotal reforms at one go, replacing all major economic regulations by the market mechanism. Othershave taken a more secure route for dismantling controls and regulations in phases. This approachof gradualism has the advantages in mitigating the pains of reforms in the initial phases. The painsof reform are reflected in higher unemployment, increasing inflation and growing inequality, while,the gains of reforms are — higher growth, lower prices, better allocative efficiency, higher productivityand productivity based gains in wages and salaries, and returns on capital. The marketisation ofeconomy may not benefit those in the lower strata of society who are beyond the reach of the marketeconomy. The reforms therefore have to be tailored in such a way as to ensure, higher consumption,especially, among the lower strata of society to elevate their living standards through direct governmentaction. This alone can guarantee the execution of reforms with a human face.
Economic reform process has been pursued, in different emerging markets in varied patternsand pace. Several emerging market economies in Asia and Latin America adopted the former pathof faster reforms. India pursued the path of gradual sequencing of reforms. The central distinguishingfeature of the process of economic reform in India has been gradualism.
In today’s economic world, the economic philosophy of liberalisation cannot be based on thetheoretical model of free market and laissez faire economy. Reform toward market mechanism, whetherin agriculture, industry, commodity and forex markets, banking and financial services, capital market,and foreign trade, need to be qualified with realities of several market imperfections and inefficiencies.
In many cases looking to these market inefficiencies, liberalisation can do exactly opposite ofwhat it was intended to do. The Asian Crisis of 1997, is a classic example of how faster andindiscriminate liberalisation can hamper realisation of its goals and cause traumatic adjustments costs.

6 International Financial Management
Latin American economies also paid the price of full scale liberalisation in the form of periodicexchange crises and economic chaos. It is, therefore, imperative to first reform the market mechanismsimultaneously while liberalisation is in progress. Put simply, market reforms should create stablemarket structure resilient enough to withstand destabilising tendencies and influences.
Market is an institution, and is built-up and improved gradually. The policy changes providestimulus for better, orderly, and broad-based functioning of the market. However, this is requiredto be assisted by simultaneous infrastructural improvements in the mechanism and operation of themarket. The mechanism, therefore, needs judicious tempering and careful and constructive supervision,and regulation by either government or self-regulatory organisations. “The Washington Consensuspolicies were based on a simplistic model of the market economy, the competitive equilibrium model,in which Adam Smith’s invisible hand works, and works perfectly. The market system requirescompetition and perfect information. But competition is limited and perfect information is far fromperfect and well functioning competitive markets can not be established overnight. Ideology ignoresthese matters; it says simply move quickly to a market economy as you can. But economic theoryand history show how disastrous it can be to ignore sequencing.” Gradualism in reforms in Indiahas paid dividends since the improvements in the market mechanism have preceded or coincidedwith the gradual and not abrupt policy changes. The trauma states have been skipped or bypassed.It has worked in generating productivity gains and bringing about greater efficiency in the use andallocation of resources. The policy of gradual changes have enabled supply side also to respond topent up demand in a smoother and more orderly fashion without causing much disruptions and pressureson prices as well as on existing production capacities and resources.
India pursued the path of gradual reform process with industrial reforms of price and outputcontrols in the 1980s. These were followed by BoP and exchange rate and fiscal reforms in 1991.Financial, and foreign trade and tariff reforms were also kicked off in the mid-1990s.
BoP ReformForex crisis of 1990, rang an alarm bell for introducing steps to bring an orderly reform in
financial sector and external account to raise savings in the economy and create stable and sustainableBalance of Payments position. Following the two-step devaluation of the rupee, capital account waspartially opened up in 1994, by allowing Foreign Institutional Investors (FIIs) to invest in new issuesand stock market. More liberal Foreign Direct Investment (FDI) policy was directed to bring in higherinflows of foreign capital. Opening up the capital account did work very quickly in redressing thesavings-investment mismatch, bring downward pressure on interest rates by infusing fresh liquidity,improved forex reserve position, raised export growth, gave adequate protection to import competingindustries, and helped stabilise rupee in the forex market.
Liberalisation of gold import policy also played a critical role in promoting a viable and sustainableBalance of Payments pattern but was not restricting higher imports of gold during 2008 to 2012.As such, the Central Government increased the import duty by 2% (6% on Standard bars and 10%on Tola bars) in budget 2013-14. Smuggling of gold had always created distortions in India’s BoPsituation. It deprived the economy of external resources, which could have been mobilised fordevelopment through official channels. The BoP reform, therefore, in addition to developing sustainableBoP equilibrium also managed to bridge domestic savings gap and eased pressure on domestic liquidity.The portfolio investments as well as the Foreign Direct Investment were primarily guided by the

7Multi-national Corporation (MNC) and Its International Environment
signals from the stock market and capital market, unlike the earlier regime where the investmentsflowed into areas where industrial licenses were cleared.
The first two phases of reform, the opening up of domestic industrial economy and liberalisationof foreign investment, (both direct and portfolio) brought about a tremendous impetus to the growthof the economy. In the economy starved of resources and facing supply scarcities in several industries,rapid growth in industrial investment brought multiplier effect on industrial growth and employment.
Coinciding with these phases, the financial sector also underwent a major reform process. Interestrate deregulation, lowering Statutory Liquidity Ratio (SLR) from 25% to 20.0% and Cash ReserveRatio (CRR) to 4.0% from 2017 for banks, and the entry of private sector banks in 2002 and in2014 and injected greater flexibility, dynamism, and competitive spirit in banking and financial servicesindustries paving the way for faster integration to full convertibility.
India’s policy of gradualism in adoption of economic reforms has catapulted the economyinto 7% growth orbit with healthy BoP status and perspective. Full convertibility after the year2015 will bridge the final capital inadequacy gap, and by raising the investment rate from 4 to 5%shift the economy into 7% growth trajectory.
1.4 FINANCIAL MARKET REFORMSThe road to full convertibility passes through the pathway of domestic financial liberalisation.
Financial regulation before liberalisation learnt heavily on the administered interest rate regime. Inthe capital and credit short economy like, India until the beginning of 1990s, the pressure on theinterest rate was upward, and in order to make credit and capital available for investment at lowercosts, a cap on interest rates was imposed. Inter-bank call money, bank deposit and lending, andlong-term bond interest rates faced ceilings. In order to promote long-term investment in industry,the long-term bond or debenture rates were fixed at a lower level than the bank lending rates. Thedemand for bank credit always remained higher than funds available with banks due to preemptionof a large share of banks’ resources by Reserve Bank of India (RBI) and Government by way ofhigh Cash Reserve Ratio (CRR) and Statutory Liquidity Ratio (SLR) requirements. The profitabilityrates of trade, business and industry were, however, much higher than the bank lending base rates,and this continued to keep pressure on commercial credit availability from banks. The bank lendingrates in 1991, were higher than the debenture interest rate by 4 to 5%. This compartmentalisationof markets for short-term and long-term capital, and the Government preempting large resourcesfor its long-term borrowings from the banks, created a peculiar feature, which is unconventional ineconomic and financial theory. The yield curve, which usually slopes upward, was downward slopingand inverted in the Indian financial market for a very long period.
It was imperative to remove pricing controls and distortion arising therefrom in the financialmarkets before proceeding towards convertibility. The financial markets needed to be more market-driven with greater competition and flexibility. The final test of liberalisation lies in more efficientand transparent functioning of the market. While deregulation of the financial markets involved removalof administered controls on interest rates, it also necessitated other steps. Firstly, the technologicalupgradation of the market to improve market efficiency and transparency was the primary prerequisitefor all further improvements yielding right results. Secondly, freer market presupposes prudential,proactive and effective regulation to avoid irregularities and manipulations as well as crisis situations.In fact, a proactive regulation relies more on an ongoing monitoring to prevent these occurrences.

8 International Financial Management
During 1990s, financial liberalisation in India witnessed deregulation of the market along withits infrastructural improvement, and more prudential and healthy regulation. The ceiling on debentureinterest rates was removed in 1992. This was also followed by the RBI gradually freeing depositinterest rates and lending rates so that by 1996, all interest rates in the banking sector and capitalmarkets were free from any control. The pressure on short-term funds was also gradually reducedby the RBI via., lowering the CRR and SLR.
The behaviour of financial markets under liberalisation can be divided into two phases. Thephase of rising interest rates from 1990 to 1996 and phase of declining interest rates thereafter.Both these phases were in harmony with the liberalisation in other sectors of the economy, responsesof the economy, and changing global economic and financial environment. The success of financialliberalisation in India is again attributable to the ideology of gradualism, the step-by- step approach,avoided abrupt changes in policies and resultant dislocations. As a result, that hardships and traumaacross the financial sector and economy could be averted.
Yield Curve TransformationOne of the most significant achievements of financial reform has been the transformation of
falling yield curve in the Indian market into rising one. The fundamental tenet of finance, the risingyield curve, indicating premium for time in the use of funds or time value of money, was not fulfilledin the capital market of India. Administered interest rate and its regulation, low rates of interest onGovernment securities, high SLR requirements forcing banks to hold Government securities despitelow returns, and basic liquidity gap both in the short-term as well as long-term markets, all workedto give a downward sloping yield curve. The fundamental logic of policy behind this was that sincethe economy was short of resources and needed growth through high investment rate, long-terminterest rates needed to be kept lower to enable the government and corporate sector to borrow atlower rate and achieve higher investment rate. Laudable objective though, the policy does createdistortions in the financial markets, financial flows, investment patterns and also productivity andefficiency of capital. Downward sloping yield curve, which prevailed in the Indian market until 1995,turned positive in 1996 and in 2008.
The positive yield curve also coincided with the declining interest rate phase, which began in1996. Yet another change in the yield curve, especially, for the Government securities, has beenthat the yield curve was getting flatter than earlier, indicating a shorter spread between the securitiesof short and long maturities. The spread between the yield on 1 year and 10-year Government paperwhich was 3% (9.87% and 12.87%) in 1997-98 narrowed down to 1.03% (4.24% and 5.27%) ininterest on Government securities and riskier private security also came down due to better availabilityof finance, which was in dearth earlier. Some top AAA corporates were able to borrow long-termin the market at rates 7-7.5% very close to the rates on Government paper.
The migration from the high interest rate regime to low interest rate one has been very gradualand smooth without causing any disruption in the financial system. This soft landing of the financialsystem has been truly remarkable. Interest rate on 10-year Government securities, which was 14%in 1996, halved to 7% in 2002 and to 5.27% in 2004 but enhanced to 7% again from 2015 onwards.
The overall balance of payments position has also played a crucial role in the transformationin the Indian financial system. 2.7% of GDP in 2010-11 and 4% of GDP in 2011-12. The perpetualliquidity crunch, which the system suffered from so long, became history. Ever since 1996, India’sBalance of Payments has been in a sizable and increasing surplus to $ 403 bn. in July 2017. The

9Multi-national Corporation (MNC) and Its International Environment
accretion in forex reserves every year since 1996-97 has been rising from a low of $ 3.8 bn in 1998-99 and a high of $ 36 bn in 2003-04. Capital account surplus from direct as well as portfolio investmenthas been the contributing factor to this high liquidity flow from abroad. Growing current accountsurplus emanating from buoyant service exports of software and declining trade deficit during 1998-2010, further added to the accretion in forex reserves, which has kept the liquidity situation moreeasy as below: May 2008 – $ 316.2 billion, May 2010 – $ 272.0 billion. The banking sector hasbeen the centre of transformation following the financial reforms. Increasing competition, deregulationof interest rates, lower CRR and SLR and infusion of latest technology had revitalised the bankingsector. Higher efficiency of the sector is visible from declining spreads between lending and depositrates, better, faster and cost-efficient customer-service, higher employee productivity. Higher capitaladequacy 11.5%, higher and increasing NPAs, presently in 2017-18, 9.3% should be reduced to3%, better financial results adequate capital adequacy by ` 2.11 lakh crores in 2017-18 and 2018-19 and profitability of banks have given boost to the valuation of their shares in the stock markets.
India has become a $ 2.067 Trillion economy in 2014 (as per World Bank Report. E.T.4-7-2015). In just 7 years, India has added one trillion to its economy. But India is still in the LowerMiddle Income category. India’s Gross National Income (GNI) per person has risen to $ 1,610which converts to ` 1,01,430 at exchange rate.
Prerequisites of Efficient MarketFinancial liberalisation and openness is supposed to bring large foreign capital inflows into
the economy. Deregulation also involves greater play of market forces. Hence, an important prerequisiteof successful financial liberalisation is ensuring elimination of market imperfections and promotionof healthy and proactive institutional framework of supervision. It also presupposes accounting andaudit standards and practices comparable to international standards, transparency in disclosure ofinformation and financial reporting and healthy corporate governance.
The market imperfections may arise out of the very nature of the markets. It may be narrowwith small and limited number of players and dominated by a few large players. Encouraging themarkets to develop broader base with greater depth where a large number of players operate andno single player or group of players has any dominance, is the primary prerequisite of an efficientmarket. Apart from this technical nature of market structure, the market imperfections may arisedue to the market’s functioning and practices, infrastructure, and regulatory and governance procedures.
The market trading, settlement and payments systems needed to match with the internationalstandards of major markets like, New York, London, Hong Kong, and Tokyo. In many emergingmarkets, this was the most primary requirement of reform based on the market system and mechanismA faulty market mechanism can not only hinder smoother progress of reforms but also causemisallocation of resources out of line with that occurring under perfect market system and mechanism.Adoption of state-of-the-art hardware and software technology for markets have to ensure the efficiencyof market mechanism and functioning. Screen-based-trading, dematerialisation of securities, uniformtrading and settlement cycles and procedures have homogenised the market in all the emergingeconomies. There have also to be improvements in regulatory and governance standards. Theseimprovements cannot be expected over a short period. The weaknesses that generate market crisisare the warning signals for action towards changes involving greater streamlining of control system.Such a control system without being too rigid should not leave any loose ends open for market abuseor excesses.

10 International Financial Management
As has been the experience for centuries in different countries, different systems and differentenvironments, markets move in cycles, and the testing time for the market behaviour is the transitionfrom one cycle to another. The systemic, infrastructural and regulatory weaknesses reveal themselvesduring the critical turns. Crisis or collapse necessitates action with regard to systemic and regulatoryimprovements.
In addition to the exchange rate rigidity of the pegged system, an important aspect, which manyobservers and researchers believe to have contributed to the Asian Crisis, is the financial vulnerabilitycaused by the weak financial and corporate sector institutions. In this regard, it needs to be notedthat, “Growing vulnerability was the result of private sector decisions rather than public sector deficits.These private sector activities took place, however, in the context of government policies that didnot do enough to discourage excessive risk-taking, while providing too little regulatory control andinsufficient transparency to allow markets to recognise and correct these problems. At the root ofthe problem were weak and poorly supervised financial sectors against the backdrop of large capitalinflows. Equally, inadequate corporate governance and lack of transparency masked the poor qualityand riskiness of investment. In addition, although macro-economic policies were generally sound,pegged exchange rates regimes and implicit guarantees tilted incentives towards excessive short-term borrowings.”
The role of information cannot be more emphasised in the functioning, perfection and efficiencyof a market. Market encompasses turnover, players, participants but also information and its quality.In increasingly information-based economies globally, influence of information in the market hasbeen greatly compounded and become critical in price formation and movements.
Capital market plays a critical role in the process of financial reforms and its success. A numberof steps were taken to reform the capital market. At the broad policy level, a number of changeswere made to remove several restrictions in the operation of the capital market. They relate to thepricing of equity and debt issues, and Foreign Institutional Investor (FII) participation in the capitalmarket. They were the epoch making steps in the development of the capital market.
That said, routing investments through capital market presupposes the existence of an efficientfunctioning of the capital market. In the latter half of 1990s, a number of measures have been takento improve the infrastructure and efficiency of the stock market.
FIIs have now been a feature of the Indian capital market with the outstanding investmentcrossing ` 1,39,408 crores in 2012-13. They are going to be not only an integral part of the marketbut also a critical factor in the investment climate and growth in the country. The growing Indianmarkets and vibrant corporate sector growth in India offers a huge opportunity to foreign investorsto capture value in Indian equities in a wide range of industries. The global equity resources haveto flow to the Indian market to find its equilibrium in India’s equity stocks now valued at over` 3,29,815 crore and nearing 90% of its GNP.
Globalisation has enabled India to build a vibrant and efficient financial system. Finance orcapital is no longer in short supply for the purposes of investment and capital formation. Lowerinterest rates and adequate availability of finance even for household sector, which was untilliberalisation, denied finance, manifest the systemic development and change in banking and financialstructure and its approach. Retail finance for housing and education has emerged as a significantand new wealth creator in the economy. Better infrastructure, prudent and proactive regulation, andgreater transparency have helped improve the efficiency of the financial system. Under globalisation,it has worked as an important catalyst for faster development.

11Multi-national Corporation (MNC) and Its International Environment
Financial reforms over the last one-and-a-half decades have transformed the Indian financialsystem and capital market into a globally competitive and state-of-the-art markets. Large discrepanciesin interest rates, its structure and yield curves have been eliminated. Interest differentials betweenthe domestic and global interest rates have also considerably narrowed.
Full convertibility is the last stop in financial reforms. With the current Indian financialenvironment, the financial system was not well poised for capital account convertibility before 2017to improve its efficiency further, bridge the last mile in resource gap or mismatch and step up theinvestment rate beyond 30% to achieve 7% growth.
1.5 BALANCE OF PAYMENTS (BoP) SCENARIO AND RUPEEEXCHANGE RATE
Balance of Payments (BoP)Economic policies of a country, particularly, the trade policy, foreign investment policy, exchange
rate and currency convertibility policies, foreign exchange allocation/availability policy etc., andeven monetary and fiscal policies may be influenced by the Balance of Payments (BoP) and foreignexchange reserves positions of the nation. These policies affect the business and the economy.
In simple terms, the balance of international payments, usually referred to as the Balance ofPayments, is a systematic and summary record of a country’s economic and financial transactionswith the rest of the world, over a period of time.
The IMF Publication ‘Balance of Payments Manual’ describes the concept as follows:“The Balance of Payments is a statistical statement for a given period showing:1. Transactions in goods and services and income between an economy and the rest of the
world;2. Changes of ownership and other changes in that country’s monetary gold, Special Drawing
Rights (SDRs) and claims on and liabilities to the rest of the world; and3. Unrequited transfers and counterpart entries that are needed to balance, in the accounting
sense, any entries for the foregoing transactions and changes which are not mutuallyoffsetting.”
Purchase of foreign services like, transport and insurance, tourist expenditure abroad and incomepaid on loans and investments (by foreigners) in the home country from the important invisible entrieson the debit side.
Capital AccountThe capital account consists of short-term and long-term capital transactions.Capital account represent debit and capital inflow represents credit. For instance, if an American
company invests $ 100 million in India, then this transaction will be represented as a DEBIT in theU.S. Balance of Payments and a CREDIT in the Balance of Payments of India.
The payment of interest on loans and dividend payments are recorded in the current account,since they are really payments for the services of capital. As mentioned above, the interest paid onloans given by foreigners or dividend on foreign investments in the home country are debits for the

12 International Financial Management
home country; while, on the other hand, interest received loans given abroad and dividend oninvestments abroad are credits.
Balance of Payments of India — Major items
(i) Current Account— exports, imports, trade balance invisibles (net) non-factor services/income/transfers, goods and servicesbalance.
(ii) Capital AccountCapital account balance —external assistance (net), external commercial borrowings (net), short-term debts, banking investment (net)of which non-resident deposits (net), foreign investment (net) of which (A) FDI (net) (B) Portfolio (net).
(iii) Errors and Omissions(iv) Overall balance (includes total current a/c balance, capital account balance and errors and omissions)
Unilateral Transfers AccountUnilateral transfers is another term for gifts and includes private remittances, government grants,
repatriations and disaster relief.Unilateral payments received, from abroad are credits and those made abroad are debits.
Official Reserve AccountOfficial reserves represent the holdings by the government or official agencies of the means
of payment that are generally accepted for the settlement of international claims. Presently, this amountis $ 403 bn. in the year 2017 (July end).
Balance of Trade and Balance of PaymentsThe balance of trade takes into account only those transactions arising out of the exports and
imports of the visible items, it does not consider the exchange of invisible items, such as, the servicesrendered by shipping, insurance and banking; payment of interest, and dividend or expenditure bytourists. Likewise, the Balance of Payments takes into account the exchange of both visible andinvisible items (the current account items) and the capital account items (such as, foreign investments,external assistance, external lending and borrowing, debt service, NRI deposits etc.) The balancetrade includes only the visible items (merchandise trade) of the current account; the Balance of Paymentsincludes the balance trade plus the invisible transactions of the current account and the capital accounttransactions. Hence, Balance of Payments represents a better picture of a country’s economic andfinancial transactions with the rest of the world than the balance of trade.
Nature of Balance of Payments AccountingThe transactions that fall under Balance of Payments are recorded in standard double-entry
book-keeping, under which each international transaction undertaken by the country will result in acredit entry and debit entry of equal size. As international transactions are recorded in double-entrybook-keeping, the Balance of Payments must always balance, i.e., the total amount of debits mustequal the total amount of credits. Sometimes, the balancing item errors and omissions must be addedto ‘balance’ the Balance of Payments.

13Multi-national Corporation (MNC) and Its International Environment
Components of Balance of PaymentsThe format of the balance of payments given below shows the important types of transactions
that figure in it. The various debit and credit entries are generally grouped under the following heads:1. Current Account2. Capital Account3. Unilateral Payments Account4. Official Reserves Assets Account.
Current AccountThe current account includes all transactions which give rise to or use up national income.The Current Account consists of two major items, namely, (a) merchandise exports and imports;
and (b) invisible exports and imports.Merchandise exports, i.e., sale of goods abroad, are credit entries because all transactions giving
rise to monetary claims on foreigners represent credits. On the other hand, merchandise imports,i.e., purchase of goods from abroad, are debit entries because all transactions giving rise to foreignmoney claims on the home country represent debits.
Merchandise imports and exports form the most important international transactions of mostof the countries.
Invisible exports, i.e., sale of services, are credit entries and invisible imports, i.e., purchaseof services, are debit entries.
The important invisible exports include sale abroad of services like, transport and insurance,foreign tourist expenditure in the home country and income received on loans and investments abroad(interests or dividends).
INDIA’S BALANCE OF PAYMENTS
Item 2009-10 2009-10 2010-11
10 Q1 Q2 Q3 Q4 Q1 Q2
1 2 3 4 5 6 7 8
1. Exports 182.2 39.2 43.4 47.2 52.5 56.3 54.32. Imports 300.6 65.4 73.0 78.1 84.1 87.8 89.63. Trade Balance (1 – 2) –118.4 –26.3 –29.6 –30.9 –31.6 –31.6 –35.44. Net invisibles 80 22.1 20.4 18.7 18.8 19.4 19.65. Current Account Balance
(3 + 4) –38.4 –4.2 –9.2 –12.2 –12.8 –12.1 –15.86. Gross Capital Inflows 345.7 77.8 96.0 81.6 90.3 95.0 112.87. Gross Capital outflows 292.3 74.2 76.7 66.9 74.5 78.8 92.38. Net Capital Account (6 – 7) 53.4 3.7 19.3 14.6 15.8 16.2 20.59. Overall Balance (5 + 8) 13.4 0.1 9.4 1.8 2.1 3.7 3.3
(Source: Handbook of Statistics on Indian Economy, 2011)

14 International Financial Management
Structural Changes in India’s BoPSince 1990, when India faced one of the worst crises in its balance of payments history with
reserves plummeting to a mere $2 bn giving import cover of less than one months’ imports, economicreforms gradually lifted the Indian economy into higher growth orbit exceeding $3 bn. In 2012 andin 2014, it recovered from the mid-1990s crisis and has grown steadily, building its balance of paymentsstrength. When in 1998, Asian economies were gripped in the vortex of forex crisis and spreadingit to the neighbouring economies, India could not only buck the trend but also piloted rupee in theforex market in a safe and stable zone. Post-Asian crisis, India’s balance of payments turned fromstrength-to-strength and its forex policy had won global commendation. With the opening up of theexternal sector of the economy, the structure of India’s balance of payments has undergone a favourablestructural change. The total balance in BoP is now equal to 9 months’ imports.
Strengthening of Current Account(i) Unlike many countries where capital account transactions have grown substantially compared
to trade transactions after liberalisation, India has shown healthy growth in current accounttransactions. The current account transactions have immediate and direct influence on theGNP, while capital movements bring indirect as well as lagged impact on GNP. The shareof current account transactions in BoP, which accounted to 4.4% of all transactions in 2012-13 reduced to 4.1% in 2013-14.
(ii) The trade transactions showed in its share of entire balance of payments.(iii) The current account deficit of $ 9.7 billion (3.5% of GNP) in 1990-91 declined to $ 5.9
billion (1.9% of GNP) in 1995-96 and turned into shortage of $ 14.3 billion (2.5% of GNP)by 2003-04 and rose to 4.1% in 2013-14. The current account went into deficit of $ 5.9billion in 2006-07 (April to Sept. 2006) and $13.3 bn. in 2013-14.
(iv) Trade deficit of $ 9.5 billion (3.3% of GNP) in 2006-07 rose consistently to a high $ 29.8billion (4.4% of GNP) in 2008-09.
(v) Exports have shown a buoyant growth from $ 126 billion in 2006-07 to $ 185 billion in2008-09 (annual average growth of 24%) and to $ 314 bn. in 2013-14. The share of exportsin GNP also doubled from 6.6% to 13%. The reforms have given a boost to India’smanufactured goods in the world market. It is a clear signal of Indian economy’s greaterparticipation and integration with the global economy, deriving greater national benefitsfrom the gains made in foreign trade.
The substantial scaling down of import duty rate consistently throughout the 1990s and afterwardsalso caused imports to grow faster. Imports were 67% hitherto exports in 2006-07 while reduced to59.5% in 2008-09. However, imports grew at a rate of 16.7% in 2007-08 compared to previous yearbut increased by 22.72% in 2008-09 compared to exports. Hence, in spite of removal of import quotasand steep reduction of tariff, trade deficit as percentage of GNP increased by the end of the decadeof 2008-09.

15Multi-national Corporation (MNC) and Its International Environment
Item Rupees crore US $ million
2006-07 2007-08 2008-09 2006-07 2007-08 2008-09 2012-13
1 2 3 4 5 6 7 8
A. CURRENT ACCOUNT
1. Exports, f.o.b. 5,82,87 16,67,757 7,98,956 1,28,888 1,66,163 1,75,1842. Imports, c.i.f. 8,62,833 10,36,289 13,41,069 1,90,670 2,57,789 2,94,5873. Trade Balance –2,79,962 3,68,532 –8,0,113 –61,782 –91,626 –1,19,4034. Invisibles, Net 2,35,579 2,99,618 4,09,842 52,217 74,592 89,586
(a) ‘Non-facto Services 1,33,064 1,51,059 2,28,778 29,469 37,565 49,818of which:
Software Services 1,41,356 1,62,020 2,15,588 31,300 40,300 47,000(b) Income –33,234 –19,888 -21,116 –7,331 –4,917 –4,511(c) Private Transfers 1,34,608 1,67,495 2,01,050 29,825 41,705 44,047(d) Official Transfers 1,141 952 1,130 254 239 232
5. Current Account Balance –44,383 –68,914 –1,32,271 –9,565 –17,034 –29,817 $19.9 bn
B. CAPITAL ACCOUNT
1. Foreign Investment, Net (a + b) 66,791 1,80,788 11,760 14,753 44,957 3,462
(a) Direct Investmentof which: 34,910 61,793 76,822 7,693 15,401 17,496
(i) In India 1,02,652 1,37,434 1,58,579 22,739 34,236 34,982Equity 73,969 1,07,320 1,25,362 16,394 26,758 27,809Re-invested Earnings 26,371 28,859 29,705 5,828 7,168 6,426Other Capital 2,312 1,255 3,512 517 310 747(ii) Abroad –67,742 –75,641 –81,757 –15,046 –18,835 –17,486Equity –56,711 –87,936 –63,478 –12,604 –14,421 –13,558Re-invested Earnings –4,868 –4,363 –4,985 –1,076 –1,084 –1,084Other Capital –6,163 –13,342 –13,294 –1,366 –3,330 –2,844
(b) Portfolio Investment 31,881 1,18,995 -65,062 7,060 29,556 –14,034In India 31,630 1,18,348 –64,206 7,004 29,394 –13,855Abroad 251 647 –856 56 162 –179
2. External Assistance, Net 7,973 8,465 12,435 1,775 2,114 2,638Disbursements 16,978 17,022 23,535 3,767 4,241 5,042Amortisation –9,005 –8,557 –11,100 –1,992 –2,127 –2,404
3. Commercial Borrowings, Net 72,365 91,180 38,009 16,103 22,633 8,158Disbursements 93,932 1,22,270 71,626 20,883 30,376 15,382
Amortisation –21.567 –31.090 –33.617 –4.780 –7.743 –7.2244. Short-term Credit, Net 30.096 68,878 –31,160 6,612 17,183 –5,7955. Banking Capital
of which: 8,477 47,148 –19,868 1.913 11,757 –3.397NRI Deposits, Net 19,574 706 20,431 4,321 179 4,290
6. Rupee Debt Service –725 –488 –476 –162 –121 –1017. Other Capital, Net @ 18,696 37,802 21,681 4,209 9,470 4.1818. Total Capital Account 2,03,673 4,33,773 32,381 45,203 1,07,993 9,146 $ 203.71 bn
16 International Financial Management
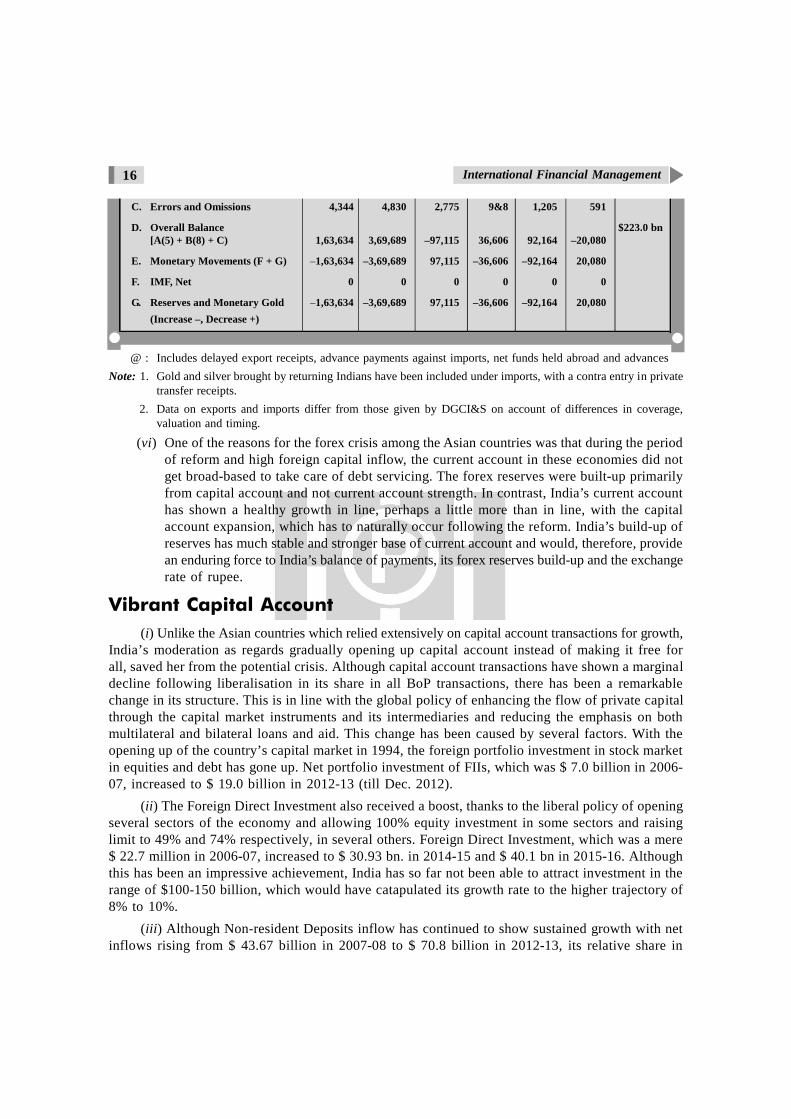
C. Errors and Omissions 4,344 4,830 2,775 9&8 1,205 591
D. Overall Balance $223.0 bn[A(5) + B(8) + C) 1,63,634 3,69,689 –97,115 36,606 92,164 –20,080
E. Monetary Movements (F + G) –1,63,634 –3,69,689 97,115 –36,606 –92,164 20,080
F. IMF, Net 0 0 0 0 0 0
G. Reserves and Monetary Gold –1,63,634 –3,69,689 97,115 –36,606 –92,164 20,080(Increase –, Decrease +)
@ : Includes delayed export receipts, advance payments against imports, net funds held abroad and advancesNote: 1. Gold and silver brought by returning Indians have been included under imports, with a contra entry in private
transfer receipts.2. Data on exports and imports differ from those given by DGCI&S on account of differences in coverage,
valuation and timing.
(vi) One of the reasons for the forex crisis among the Asian countries was that during the periodof reform and high foreign capital inflow, the current account in these economies did notget broad-based to take care of debt servicing. The forex reserves were built-up primarilyfrom capital account and not current account strength. In contrast, India’s current accounthas shown a healthy growth in line, perhaps a little more than in line, with the capitalaccount expansion, which has to naturally occur following the reform. India’s build-up ofreserves has much stable and stronger base of current account and would, therefore, providean enduring force to India’s balance of payments, its forex reserves build-up and the exchangerate of rupee.
Vibrant Capital Account(i) Unlike the Asian countries which relied extensively on capital account transactions for growth,
India’s moderation as regards gradually opening up capital account instead of making it free forall, saved her from the potential crisis. Although capital account transactions have shown a marginaldecline following liberalisation in its share in all BoP transactions, there has been a remarkablechange in its structure. This is in line with the global policy of enhancing the flow of private capitalthrough the capital market instruments and its intermediaries and reducing the emphasis on bothmultilateral and bilateral loans and aid. This change has been caused by several factors. With theopening up of the country’s capital market in 1994, the foreign portfolio investment in stock marketin equities and debt has gone up. Net portfolio investment of FIIs, which was $ 7.0 billion in 2006-07, increased to $ 19.0 billion in 2012-13 (till Dec. 2012).
(ii) The Foreign Direct Investment also received a boost, thanks to the liberal policy of openingseveral sectors of the economy and allowing 100% equity investment in some sectors and raisinglimit to 49% and 74% respectively, in several others. Foreign Direct Investment, which was a mere$ 22.7 million in 2006-07, increased to $ 30.93 bn. in 2014-15 and $ 40.1 bn in 2015-16. Althoughthis has been an impressive achievement, India has so far not been able to attract investment in therange of $100-150 billion, which would have catapulated its growth rate to the higher trajectory of8% to 10%.
(iii) Although Non-resident Deposits inflow has continued to show sustained growth with netinflows rising from $ 43.67 billion in 2007-08 to $ 70.8 billion in 2012-13, its relative share in

17Multi-national Corporation (MNC) and Its International Environment
total capital account transactions has come down. The total NRI deposits stood at $ 38 billion inMarch 2007. It forms an important segment of India’s balance of payments and would continue toshow healthy growth due to the close cultural links of the NRIs with India.
(iv) Foreign investment, both direct and portfolio, which was less than 17% of total capitalaccount transactions in 2006-07, accounted for 14.2% of capital account transactions in 2008-09.Compared to a mere $ 14.7 billion 2006-07 foreign investment (direct and portfolio) it grew steeplyto a high of $ 44.9 billion in 2007-08 (though decreased to $ 3.4 billion in 2008-09) and stood atrecord $ 15 billion in 2004-05. Throughout this 20-year period, foreign investment totalled $ 80billion and played a crucial role in building economic growth, lower inflation, and stronger balanceof payments position. Cumulative FII investment in the Indian equity had gone up from as under:
2004-05 2005-06 2006-07 2007-08 2008-09
$ 35.9 bn $ 43.8 bn $ 51.9 bn $ 68.0 bn $ 59.4 bn
Total investment at the end of 31-3-2013 was ` 1,39,408 crores as against ` 13 crores during1992-93.
(v) The importance of external assistance has fallen from 12% to 7% over the same period. Itmanifests the magnitude of change, which the liberalisation globally has brought on the balance ofpayment front. Capital flows now are also more market determined and governed, which also requiresmore synchronous monetary policy. Interest rate differentials and differentials in returns on equityassets have been the prime movers behind the capital flows between nations and also in India.
INDIA’S BALANCE OF PAYMENTS INDICATORS
Trade Trade Current Foreign Debt Short-term ExternalDeficit Deficit account Exchange Servicing Debt as % of Debtas % as % deficit as % cover in months’ as % of Forex as % ofGNP exports GNP imports GNP Reserves GNP
2003-04 2.5 21 2.5 16 2.8 4.6 21.3
2004-05 5.8 45 –0.9 14 1.9 3.2 19.4
2012-13 4.4
2013-14 4.1
Healthiest External Debt ProfileAn aspect of India’s external economy, which has shown a very positive development and is
imparting strength to its balance of payments, is its external debt profile. India prudently resistedthe temptation of opening up capital account and allowing the flood of short-term debt unlike whatmany Asian countries did. I avoided the debt trap and kept its BoP more stable. India’s externaldebt of $ 115 bn at 17.3% of GNP is the lowest among the emerging markets. Its short-term debtas a percentage of total external debt remained at a low level of 6.1% in 2005. Short-term debt asa percentage of forex reserves has declined from 19.4% to 3.2% during 1998-2005. Debt servicing

18 International Financial Management
ratio is also in a healthy range showing decline from 16.3% in 2003 to 6.2% in 2005. This exemplaryrecord of India’s external debt profile offers a balanced and healthy structure to India’s BoP andrenders it an enduring strength. It is this feature of India’s BoP that enabled it to effectively repulsethe Asian crisis of 1998 and will continue to provide positive support and remarkable resilience toits BoP.
INDIA’S EXTERNAL DEBT PROFILEMarch End ($ Billion)
Long- Short- Total External Short-term Short-term Total Debtterm term External Debt to Debt to Total Debt to External ServingDebt Debt Debt GDP External Forex Debt to Forex to Curr.
(%) Debt Reserves Reserves (%) Receipts
2003 100.3 4.7 105 20.4 4.5 3.7 140 162004 107.3 4.4 111.7 17.8 4 4.6 100 16.32005 115.8 7.5 123.3 17.3 6.1 3.2 87 6.22015 391.1 84.7 475.8 23.8 84
Source: Economic Survey, Government of India.
Factors inimical to growth as on Fiscal 2008 Sharp elevation in global commodity inflation, especially food and oil Tightening in credit and equity markets following sub-prime crisis in the US Global slowdown in growth
Impact of adverse global environment on India Lower growth Widening of current account deficit Pressure on fiscal system through widening subsidy bills
Surge in Inflation Mostly on account of rising global commodity prices Coordinated policy action can bring inflation down to 3% by March 2018 Tight monetary stance necessary
1.6 JAPAN ON BRINK OF RECESSIONOn 13-8-2008, Japan declared its economy contracted in the second quarter as falling exports
and weak consumer spending sent Asia’s largest economy hurtling toward its fast reflected the rapidlydeteriorating global economic climate, with fears of a recession in the eurozone also mounting asthe fallout of the US financial crisis around the world.
Japan’s Gross Domestic Product (GDP) shrank by 0.6% in the three months to June from theprevious quarter, the cabinet office said, marking the first time in a year that the world’s second-biggest economy has contracted. The economy shrank by 2.4% on an annualised basis, matchingmarket expectations.

19Multi-national Corporation (MNC) and Its International Environment
The slump put Japan on the cusp of outright recession, which is usually defined as two ormore straight quarters of economic contraction. The last time it happened in Japan was in 2001,when the recession lasted for three quarters. Tokyo share prices slumped 2.1% as the weak growthfigures added to the jitters about problems in the US banking sector. GDP growth for the first quarterof 2008 was also revised down to 0.8% quarter-on-quarter from 1% previously.
“Economic growth will remain very weak throughout this fiscal year”, said Mamoru Yamazaki,chief economist for Japan at RBS Securities. “The increase in oil and commodity prices is damagingcorporate profits while rising inflation is hurting households”.
After suffering a series of on-off recessions in the 1990s, following the bursting of the economicbubble, Japan had been slowly recovering on the back of brisk exports and business investment.Japan’s government, however, last week effectively declared an end to the country’s longest periodof economic expansion in post-war times. Even so, the economy is considered to be in much bettershape than it was during previous downturns, particularly, the corporate sector which has benefitedfrom several years of bumper earnings.
“The fundamentals of the economy are much better than in the previous post-bubble cycles”,Lehman Brothers’ chief Japan economist Kenichi Kawasaki wrote in a note to clients. “The downsiderisks remain elevated, but we expect that this cyclical downturn will be a relatively mild one.”
Japan is not the only major industrialised nation to have suffered an economic contractionthis year. Canada’s economy shrank in the first quarter and Italy suffered negative growth in thesecond quarter. The US economy also shrank slightly in the fourth quarter last year but has sincebeen bolstered by stimulus measures.
While Japan’s contraction was partly a hangover from the robust first-quarter growth, the slowingglobal economy took a heavy toll on exports, which tumbled 2.3%. Household spending fell 0.5%as soaring commodity and food prices, coupled with sluggish wages, prompted consumers to tightentheir purse strings. Business investment was another weak spot, dropping 0.2% as cautious companiesspent less on new equipment and factories. Reflecting a slowing global economy, Japan’s currentaccount surplus plunged 67.4% in June from a year earlier to 493.9 billion yen (4.5 billion dollars)as exports to the United States and Europe fell. The trade surplus alone tumbled 81.3% to 2,521billion yen.
1.7 BANK OF ENGLAND CUTS GROWTH FORECASTS,UNEMPLOYMENT RISES
The Bank of England cut its forecast for UK economic growth and held out the prospect oflower interest rates as unemployment rose the most in almost 16 years. Governor Mervyn King saidthe inflation rate will fall below the 2% target in two years if policy-makers keep the benchmarkinterest rate at 5%. Claims for jobless benefits climbed 20,100 in July to 8,64,700, the biggest increasesince December 1992, a government report showed.
The pound and government bond yields fell after the reports, which suggested the Central Bankmay have room to lower interest rates as the economy heads towards a recession. Higher unemploymentmay prompt consumers to curtail spending and exacerbate the worst housing market slump sincethe early 1990s.

20 International Financial Management
“It may still be summer, but there is a feeling of chill in the economic air”, King said. Theeconomy faces a “difficult and painful adjustment” that “cannot be avoided, as a result, inflation isrising and growth is slowing”. The pound fell to a 21-month low against the dollar. BNP ParibasSA, Economist Alan Clarke said the Bank of England may reduce its benchmark rate inNovember, 2009 not in the first quarter of 2009, as he previously predicted. Unemployment rosefor a sixth straight month, with the jobless rate climbing to 2.7% from 2.6% in June. Wages grewat the slowest pace in five years. The economy will grow about 0.1% on a 2009, compared with aprevious forecast of 1%, the Bank of England projections show. “Broadly, flat output means thereis a possibility of a quarter or two of negative growth”, Bloomberg.
1.8GLOBAL BANK MAJORS FIND INDIA HOT, VIE FOR LICENCESome of the top global financial services firms and banks have sought a banking licence in
India, a market considered to be perhaps the most attractive only after China.A host of banks, including Credit Suisse, Rabo Group and ANZ, are now looking at having a
branch presence in the country, according to officials in the banking industry. Banking regulator,the Reserve Bank of India (RBI), in recent months, has granted fresh banking licences to UBS –Switzerland’s largest bank, Dresdner Bank and United Overseas Bank.
Rabobank wants to upgrade its Indian Finance Company into a Bank even while continuingits support to YES bank
Rabobank Group, the Dutch Group, is now in the process of submitting an application for abanking licence. The move at a time, when the group already holds a 18.2% stake in another localprivate bank YES bank.
Sources close to the development said that Rabo had appointed lawyers to work on the bankinglicence. Also, some of the senior members of the group have met the RBI in connection with thisproposal.
Rabobank International Holdings has a 18.2% stake in YES Bank. The new private bank waspromoted by Rana Kapoor and Late Ashok Kapur, now controls 33.6% of the equity in the bank.Initially, Rabo had a 20% stake in the bank while both promoters jointly held 49% in the bank.However, Rabo had received RBI approval to increase its shareholding in the bank to 20%, post-IPO.
According to the current RBI regulation, a foreign bank, which does not have an Indian operation,can hold a 10% stake while those with Indian operations have to restrict their equity holding to5%. Banking industry officials said that going by the current regulations, Rabo will have to pruneits stake-holding in the bank.
Rabo said, “As we are evaluating expansion in the growing Indian market, we will continueto develop the most appropriate strategy, involving all members of Rabobank Group. We areinvestigating ways to upgrade our Indian finance company into a bank even while continuing withour support to YES Bank. Our holding in YES bank will also be part of the constantly evolvingplans and impacting regulations as we move in the future.”
ANZ has also started work on obtaining a banking licence in the country. StanChart had takenover the operations of ANZ Grindlays for $ 1.34 billion in 2000.
However, some bankers reckon that the Central Bank my not be very enthused by the ongoingflipflops of the banks, such as, ANZ relating to their Indian strategy. An ANZ spokesperson said,

21Multi-national Corporation (MNC) and Its International Environment
“ANZ would like to develop its presence in India as part of its strategy to develop a super regionalbank. We recognise this will take sometime in India and we are not expecting any major developmentsin the near term.”
Even with a slow-down in the economy, most banks feel that the medium and long-term prospectsof India is quite intact. Also, most banking groups want to increase their presence in India and Chinaas a counter weight to Western markets, where growth in revenues are lower or have dipped due tothe sub-prime crisis. For some of the existing players, such as, StanChart, Citibank and HSBC, Indiais one of their top markets. In order to commence operations in India, the foreign banks are requiredto open subsidiary company.
Indications from Beijing point to a recent major policy shift to protecting growth rather thancurbing inflation. While no government initiative have been announced yet, many economists believeChina’s growth will not be allowed to drift too far. Still, signs point to more slowing in the globaleconomy in store even if it does not become recessionary.
1.9 CHINA’S ECONOMIC INDICATORSMajor economic indicators of China for the year 2011-12 were as under: —GDP : 7.7% (as against India’s 5.3%)
(6.9% in 2016-17 as against India’s 7.1%)Per Capita GDP : $ 9,146Investment Ratio : 48%Foreign Exchange Reserves : $ 2,400 bn. (as on June 2017)
India Losing Out to ChinaIn 2006, when New York Times correspondent first visited India and China, the economic race
was on, with heavy bets being placed on which one would win the developing world sweepstakes.Many Westerners fervently hoped that a democratic country would triumph economically over
an autocratic regime.Now, the contest is emphatically over. China has plunged headlong into the 21st century while
India is still lurching toward it. That is evident not just in columns of dry statistics but in the rhythmand sensibility of each country. While China often seems to eradicate its past as it single-mindedlyconstructs its future, India nibbles more judiciously at its complex history.
Visits to crowded Indian urban centers unleash sensory assaults: colorful dress and lilting chatterprovide a backdrop to every manner of commerce, from small shops to peddlers to beggars. Thatmakes for engaging tourism, but not so for achieving faster economic development. In contrast toChina's full-throated, monochromatic embrace of large-scale manufacturing, India more closelyresembles a nation of shopkeepers.
To be sure, India has achieved enviable success in business services, like the glistening callcentres in Bengaluru and elsewhere. But in the global jousting for manufacturing jobs, India doesnot get its share.
Now, after, years of sky-rocketing growth, China’s gross domestic product per capita of $9,146is more than twice India's. And its economy grew by 6.9 in 2016-17, while India expanded at a7.1%.

22 International Financial Management
After years of sky-rocketing growth, China’s gross domestic product per capita of $9,146 was more thantwice that of India’s.
China’s investment rate of 48% of GDP — a key metric for development — also exceededIndia’s. At 36, India’s number is robust, particularly, in comparison with Western countries. Butthe impact of that spending can be hard to discern; on a recent 12-day visit to India, not many rupeesappeared to have been lavished on Mumbai’s glorious Victoria Terminus, also known as ChhatrapatiShivaji Terminus, since it was constructed in the l880s.
Parts of Mumbai’s built financial district — Bandra Kurla Complex — already looks aged,perhaps because of cheap construction or poor maintenance or both. It is hardly a serious competitorto Shanghai’s shiny Pudong.
China has 16 subway systems to India’s five. As China builds a superhighway to Tibet, Indiandrivers battle potholed roads that they share with every manner of vehicle and live animal. India'selectrical grid is still largely government controlled, which helped contribute to a disastrous blackoutlast summer that affected more than 600 million, people. Yet, Morgan Stanley stands resolutely behindits 2010 prediction that India will be growing faster than China by the middle of this decade.
It isn’t going to happen, India’s better demographics notwithstanding. For one thing, many ofIndia's youths are unskilled and work as peddlers or not at all. For another, despite all the reformsinstituted by India since its move away from socialism In 1991, much more would have to change.Corruption, inefficiency restrictive trade practices and labour laws have to be addressed.
Democratic it may be, but India’s ability to govern is compromised by suffocating bureaucracy,regular arm-wrestling with states over prerogatives like, taxation and deeply embedded property rightsthat make implementing China-scale development projects impossible. Unable to modernise its horriblycongested cities, India’s population has remained more rural than China's, further depressing growth.
‘China’ and ‘corruption’ may be, almost synonymous to many, but India was ranked even worseIn corruption in Transparency International’s Annual Corruption Perceptions Index. At its best, theIndian justice system — a British legacy — grinds exceptionally slowly. To be sure, summary executionsdon’t occur in India and its legal system is more transparent and rule-based than China’s. But arecent visit coincided with the tragic gang rape of a young Indian woman that led to her death; thegovernment's ham-handed initial response was to ban protesters from assembling and impound vanswith tinted windows like the one in which she was abducted.
India’s rigid social structure limits inter-generational economic mobility and fosters acceptanceof vast wealth disparities. In Mumbai, where more than half the population lives in slums oftendevoid of electricity or running water. As against this, Reliance Industries Chairman, Mukesh Ambanispent a reported $1 billion to construct a 27-story home in a residential neighbourhood.
Position of India-China Trade2015-16 Trade deficit $ 118.35 bn.2014-15 $ 71.64 bn. (Imports were $ 58.25 bn. and exports were only $ 13.38 bn.) deficit
of $ 44.87 bn.