international energy security risk index: usa
DESCRIPTION
International Energy Security Risk Index: USATRANSCRIPT
www.energyxxi.org 2012 Edition
Institute for 21st Century Energy International Index of Energy Security Risk
Energy Security Risk Summary: United States
Risk Scores:
2010 Energy Security Risk Score 964
2010 Large Energy User Group Rank 7
Score in Previous Year 909
Rank in Previous Year 6
Score in 1980 988
Best Energy Security Risk Score 746 (1994)
Worst Energy Security Risk Score 988 (1980)
Risk Scores Relative to OECD Average:
Average Annual Difference 1980–2010 +2%
Best Relative Score -2% (2008)
Worst Relative Score +7% (2000)
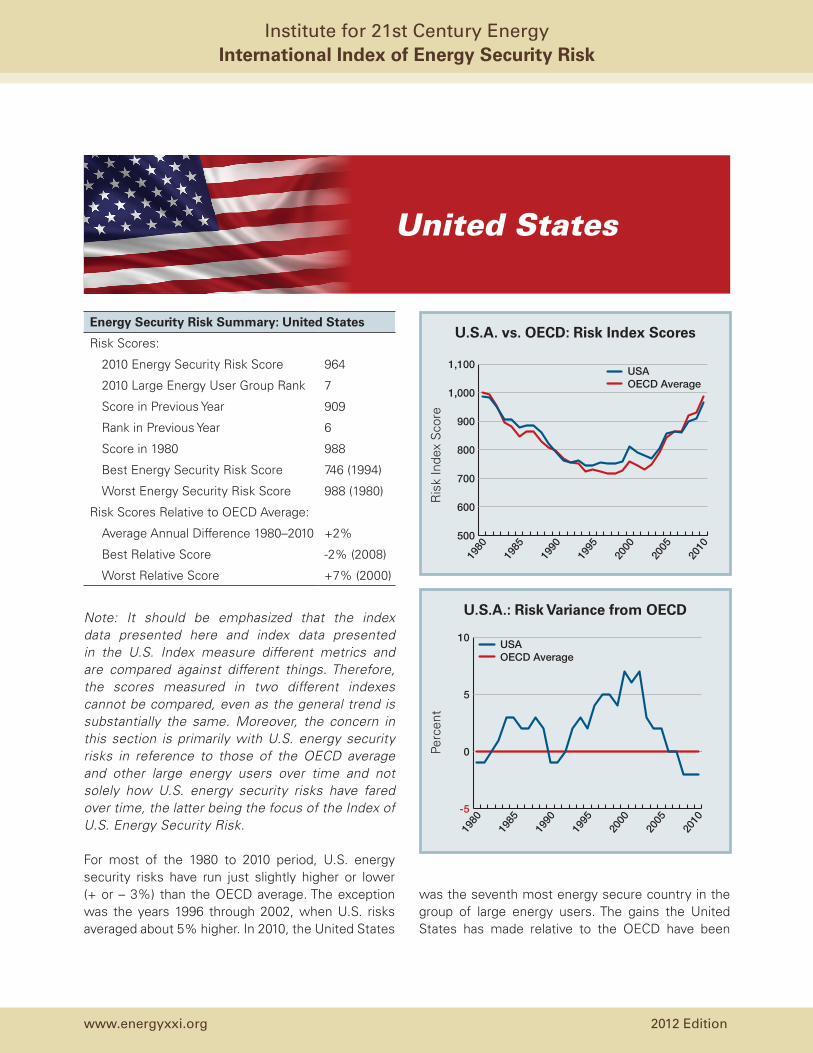
Note: It should be emphasized that the index data presented here and index data presented in the U.S. Index measure different metrics and are compared against different things. Therefore, the scores measured in two different indexes cannot be compared, even as the general trend is substantially the same. Moreover, the concern in this section is primarily with U.S. energy security risks in reference to those of the OECD average and other large energy users over time and not solely how U.S. energy security risks have fared over time, the latter being the focus of the Index of U.S. Energy Security Risk.
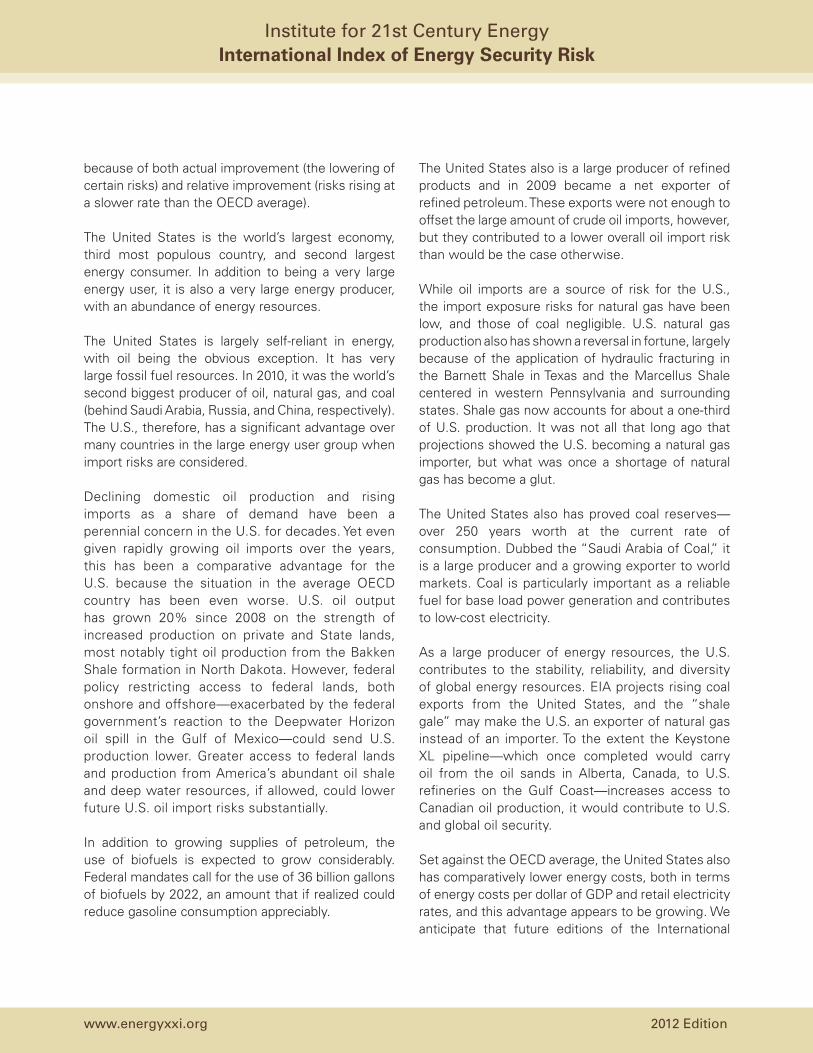
For most of the 1980 to 2010 period, U.S. energy security risks have run just slightly higher or lower (+ or – 3%) than the OECD average. The exception was the years 1996 through 2002, when U.S. risks averaged about 5% higher. In 2010, the United States
was the seventh most energy secure country in the group of large energy users. The gains the United States has made relative to the OECD have been
500
600
700
800
900
1,000
1,100USAOECD Average
1980
1985
1990
1995
2000
2005
2010
Ris
k In
dex
Sco
re
U.S.A. vs. OECD: Risk Index Scores
-5
0
5
10USAOECD Average
1980
1985
1990
1995
2000
2005
2010
Perc
ent
U.S.A.: Risk Variance from OECD
United States
www.energyxxi.org 2012 Edition
Institute for 21st Century Energy International Index of Energy Security Risk
because of both actual improvement (the lowering of certain risks) and relative improvement (risks rising at a slower rate than the OECD average).
The United States is the world’s largest economy, third most populous country, and second largest energy consumer. In addition to being a very large energy user, it is also a very large energy producer, with an abundance of energy resources.
The United States is largely self-reliant in energy, with oil being the obvious exception. It has very large fossil fuel resources. In 2010, it was the world’s second biggest producer of oil, natural gas, and coal (behind Saudi Arabia, Russia, and China, respectively). The U.S., therefore, has a significant advantage over many countries in the large energy user group when import risks are considered.
Declining domestic oil production and rising imports as a share of demand have been a perennial concern in the U.S. for decades. Yet even given rapidly growing oil imports over the years, this has been a comparative advantage for the U.S. because the situation in the average OECD country has been even worse. U.S. oil output has grown 20% since 2008 on the strength of increased production on private and State lands, most notably tight oil production from the Bakken Shale formation in North Dakota. However, federal policy restricting access to federal lands, both onshore and offshore—exacerbated by the federal government’s reaction to the Deepwater Horizon oil spill in the Gulf of Mexico—could send U.S. production lower. Greater access to federal lands and production from America’s abundant oil shale and deep water resources, if allowed, could lower future U.S. oil import risks substantially.
In addition to growing supplies of petroleum, the use of biofuels is expected to grow considerably. Federal mandates call for the use of 36 billion gallons of biofuels by 2022, an amount that if realized could reduce gasoline consumption appreciably.
The United States also is a large producer of refined products and in 2009 became a net exporter of refined petroleum. These exports were not enough to offset the large amount of crude oil imports, however, but they contributed to a lower overall oil import risk than would be the case otherwise.
While oil imports are a source of risk for the U.S., the import exposure risks for natural gas have been low, and those of coal negligible. U.S. natural gas production also has shown a reversal in fortune, largely because of the application of hydraulic fracturing in the Barnett Shale in Texas and the Marcellus Shale centered in western Pennsylvania and surrounding states. Shale gas now accounts for about a one-third of U.S. production. It was not all that long ago that projections showed the U.S. becoming a natural gas importer, but what was once a shortage of natural gas has become a glut.
The United States also has proved coal reserves—over 250 years worth at the current rate of consumption. Dubbed the “Saudi Arabia of Coal,” it is a large producer and a growing exporter to world markets. Coal is particularly important as a reliable fuel for base load power generation and contributes to low-cost electricity.
As a large producer of energy resources, the U.S. contributes to the stability, reliability, and diversity of global energy resources. EIA projects rising coal exports from the United States, and the “shale gale” may make the U.S. an exporter of natural gas instead of an importer. To the extent the Keystone XL pipeline—which once completed would carry oil from the oil sands in Alberta, Canada, to U.S. refineries on the Gulf Coast—increases access to Canadian oil production, it would contribute to U.S. and global oil security.
Set against the OECD average, the United States also has comparatively lower energy costs, both in terms of energy costs per dollar of GDP and retail electricity rates, and this advantage appears to be growing. We anticipate that future editions of the International
www.energyxxi.org 2012 Edition
Institute for 21st Century Energy International Index of Energy Security Risk
Index will show the United States increasing its edge in this regard through the continued use of coal and as the fall in natural gas prices begins to be reflected in data for 2011 and 2012.
The U.S. power sector is fairly diverse. Like almost every other country in the large energy user group, its risk scores are higher than the OECD average, though its scores are better than most other countries in the group. Thermal capacity—mostly fired by coal and natural gas, with very little oil—accounted for about 76% of total capacity in 2010, with nuclear accounting for 10%, hydroelectric close to 8%, and non-hydro renewables about 5%. Its share of non-emitting generation is only slightly above the OECD average. This situation could change appreciably in the coming years. Pending new environmental regulations, however, could shut in a large portion of base load coal-fired capacity, much of which would have to be replaced by natural gas-fired facilities or nuclear. In addition, as a result of renewable portfolio standards in many states, renewable capacity is expected to grow.
The United States uses more energy per person than all but two countries—Canada and Norway—in the large energy user group, and its per capita emissions of carbon dioxide also are considerably higher than
other countries in the group. These three metrics represent the largest source of risk for the U.S. compared to the OECD average. All three of these risks, however, have shown improvement relative to the OECD baseline over the last decade.
The United States also uses generally more energy overall and in the transportation sector to produce a dollar of GDP, than the OECD average, but the differences are not all that large. The same goes for carbon dioxide intensity. Since 2000, each of these metrics has been improving at about the same rate as the OECD average. New efficiency standards for appliances and vehicles may accelerate the improvement seen in these areas, also reducing gasoline demand.
Overall, then, U.S. energy security appears to be improving vis-à-vis the OECD baseline, even as the overall risk score continue to rise—in other words, U.S. energy security risks are increasing at a slower rate than the OECD average. The largest drivers of this relative improvement have been related to increased domestic energy production and lower energy costs. Moreover, in those areas where the United States is performing relatively worse than the OECD average, risks are climbing at about the same or at a slightly slower pace than the OECD average.
www.energyxxi.org 2012 Edition
Institute for 21st Century Energy International Index of Energy Security Risk
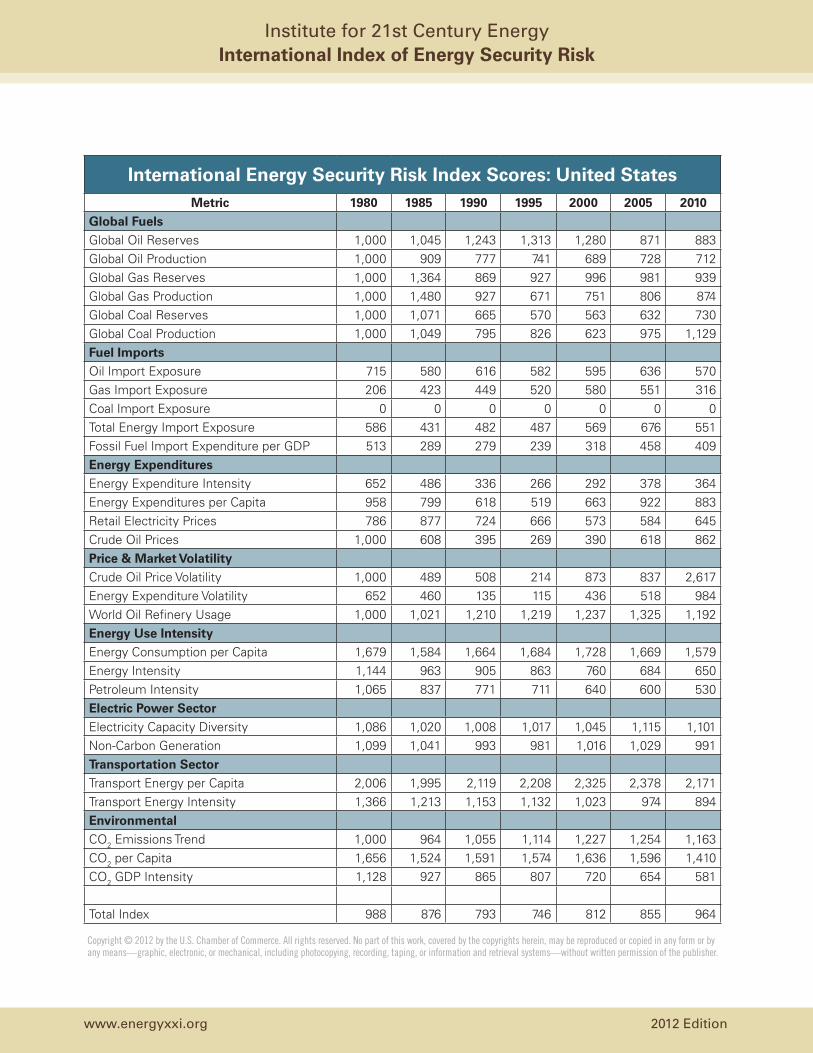
International Energy Security Risk Index Scores: United StatesMetric 1980 1985 1990 1995 2000 2005 2010
Global FuelsGlobal Oil Reserves 1,000 1,045 1,243 1,313 1,280 871 883 Global Oil Production 1,000 909 777 741 689 728 712 Global Gas Reserves 1,000 1,364 869 927 996 981 939 Global Gas Production 1,000 1,480 927 671 751 806 874 Global Coal Reserves 1,000 1,071 665 570 563 632 730 Global Coal Production 1,000 1,049 795 826 623 975 1,129 Fuel ImportsOil Import Exposure 715 580 616 582 595 636 570 Gas Import Exposure 206 423 449 520 580 551 316 Coal Import Exposure 0 0 0 0 0 0 0 Total Energy Import Exposure 586 431 482 487 569 676 551 Fossil Fuel Import Expenditure per GDP 513 289 279 239 318 458 409 Energy ExpendituresEnergy Expenditure Intensity 652 486 336 266 292 378 364 Energy Expenditures per Capita 958 799 618 519 663 922 883 Retail Electricity Prices 786 877 724 666 573 584 645 Crude Oil Prices 1,000 608 395 269 390 618 862 Price & Market VolatilityCrude Oil Price Volatility 1,000 489 508 214 873 837 2,617 Energy Expenditure Volatility 652 460 135 115 436 518 984 World Oil Refinery Usage 1,000 1,021 1,210 1,219 1,237 1,325 1,192 Energy Use IntensityEnergy Consumption per Capita 1,679 1,584 1,664 1,684 1,728 1,669 1,579 Energy Intensity 1,144 963 905 863 760 684 650 Petroleum Intensity 1,065 837 771 711 640 600 530 Electric Power SectorElectricity Capacity Diversity 1,086 1,020 1,008 1,017 1,045 1,115 1,101 Non-Carbon Generation 1,099 1,041 993 981 1,016 1,029 991 Transportation SectorTransport Energy per Capita 2,006 1,995 2,119 2,208 2,325 2,378 2,171 Transport Energy Intensity 1,366 1,213 1,153 1,132 1,023 974 894 EnvironmentalCO2 Emissions Trend 1,000 964 1,055 1,114 1,227 1,254 1,163 CO2 per Capita 1,656 1,524 1,591 1,574 1,636 1,596 1,410 CO2 GDP Intensity 1,128 927 865 807 720 654 581
Total Index 988 876 793 746 812 855 964
Copyright © 2012 by the U.S. Chamber of Commerce. All rights reserved. No part of this work, covered by the copyrights herein, may be reproduced or copied in any form or by any means—graphic, electronic, or mechanical, including photocopying, recording, taping, or information and retrieval systems—without written permission of the publisher.