international beef markets - ahdb beef &...
TRANSCRIPT

U.S. Beef Experience in International MarketsAHDB Conference
December 8, 2016
Paul Clayton
U.S. Meat Export Federation

Value of International Markets
• Beef (2015)– $6.3 billion in
value– 1.07 million metric
tons – 12-14% of total
U.S. beef production exported
– Export value equal to ~$300 per head
0
2,000
4,000
6,000
8,000
10,000
12,000
1950 2013 2025 2050 2100
World United States
000,000
0%10%20%30%40%50%60%70%
10.9 Billion
Global Middle Class in 2030
USDA statistics compiled by USMEF for August 2014(All totals include muscle cuts and variety meat)Source: United Nations, Department of Economic & Social Affairs, Population Division (2013)Source: OECD Development Center, 2010
96% of the World Population Lives out of the USGlobal Middle Class will have 80% of the buying power

U.S. Per Capita Disappearance
0
20
40
60
80
100
120
Poultry Beef Pork
Pounds per capita of meat
2013 2014 2015 2016F 2017F
+1.7 lbs. in 2016
+0.2 lbs.
Source: USDA’s November WASDE
+1.5 lbs.


The U.S. as an Importer of Beef
Source: USDA/FAS and USMEF estimates
0
200,000
400,000
600,000
800,000
1,000,000
1,200,000
2000 2001 2002 2003 2004 2005 2006 2007 2008 2009 2010 2011 2012 2013 2014 2015
U.S. Imports of Chilled/Frozen Beef
Others
Uruguay
Mexico
Canada
New Zealand
Australia
Over 100 million ground beef servings are consumed per day in the US.


Changes in Shipping
North East Passage Panama Canal Silk Road
West Coast Port SlowdownCarrier Alliances


Source: GC Smith, ILC, 2013

Observations of Global Consumers compared to Americans
• Shop every day
• Use the internet more
• Eat smaller portions
• Different eating utensils, preparation differences
• Quality and value perceptions may be different; marbling vs. leanness
VS.

Getting Food to Consumers –Purchasing
• Retail
– Wet markets
– Local Grocery
– Supermarket
– Big Box
– Specialty – Gourmet, Deli
• Food Service
– Restaurants
– Pick-up and Delivery
– QSR (Drive Through)
– Coffee Shops

Alibaba.com• Others Using This Platform
• Unilever• Costco• Neiman Marcus• Saks 5th Ave• Ann Taylor
• 2014 $15 Billion US/China • 2020 $291 Billion US/China

On-line Food Service UBER - Deliveries
Yelp Virtual Storefront for Restaurants

Retail Delivery/Pick-up
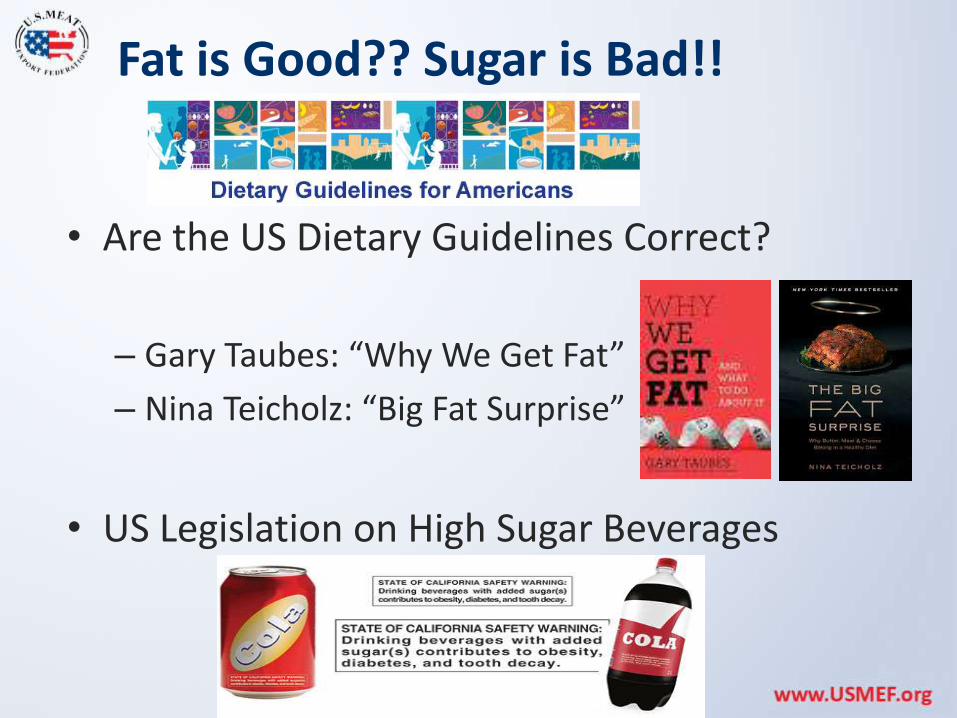
Fat is Good?? Sugar is Bad!!
• Are the US Dietary Guidelines Correct?
– Gary Taubes: “Why We Get Fat”
– Nina Teicholz: “Big Fat Surprise”
• US Legislation on High Sugar Beverages


US Production

Sacred to the US
High Quality U.S. Beef

Probability of a Positive Eating Experience
0%
10%
20%
30%
40%
50%
60%
70%
80%
90%
100%
Prime Ch°/Ch+ Choice- Select Standard
Emerson, Tatum, Belk and Woerner. 2011. Relationship of USDA Camera-Based Quality Grades to
Beef Sensory Attributes. Colorado State University.

Flavor Development
Maillard Reaction- Browning of surface- Reaction of sugars
and proteins with heat
- Creates roasted, browned, grilled flavor
Lipid Breakdown- Produce volatile odor
compounds (both positive and negative)
- Degree of saturation of fatty acid plays role in flavor
- Buttery/Beef Fat Flavor

High Quality Beef Markets
• S. Korea – Honwoo
• China – Snow Dragon Beef
• Argentina
• Russia: Miratorg,
– Angus Registrations
• Great Britain
• Japan - Wagyu
• Australia - Wagyu
• Mexico

“Perhaps more than ever before, consumers want to know about what's in their meat and poultry, how it was raised and where it came from,” “This need to know taps a breadth of concerns related to food healthfulness and sustainable practices." Meat, Poultry and Seafood: Restaurant Trends and Opportunities 2016
Consumers are looking for adjectives: natural, free-range, hormone free, antibiotic free and yes, sustainably produced.Dr. David Hughes, Imperial College, London 2016

Heavier Carcass Weights
321kg 349kg
405kg349kg
329kg 337kg370kg 379kg

Beef Alternative Merchandizing

US Beef Value in Foreign Markets

Market Access Restrictions
Limited/No Access to 4.3 Billion out of the total 4.5 Billion in the most populous countries (excluding the
U.S.)
China – 1.37 B
India – 1.28 B
EU – 503 M
Bangladesh – 161 MPakistan – 189 M
Russia – 144 M
Nigeria – 182 M Indonesia – 258 M
Brazil – 208 M
Egypt – 88 M Saudi Arabia – 32 MMalaysia – 31 M
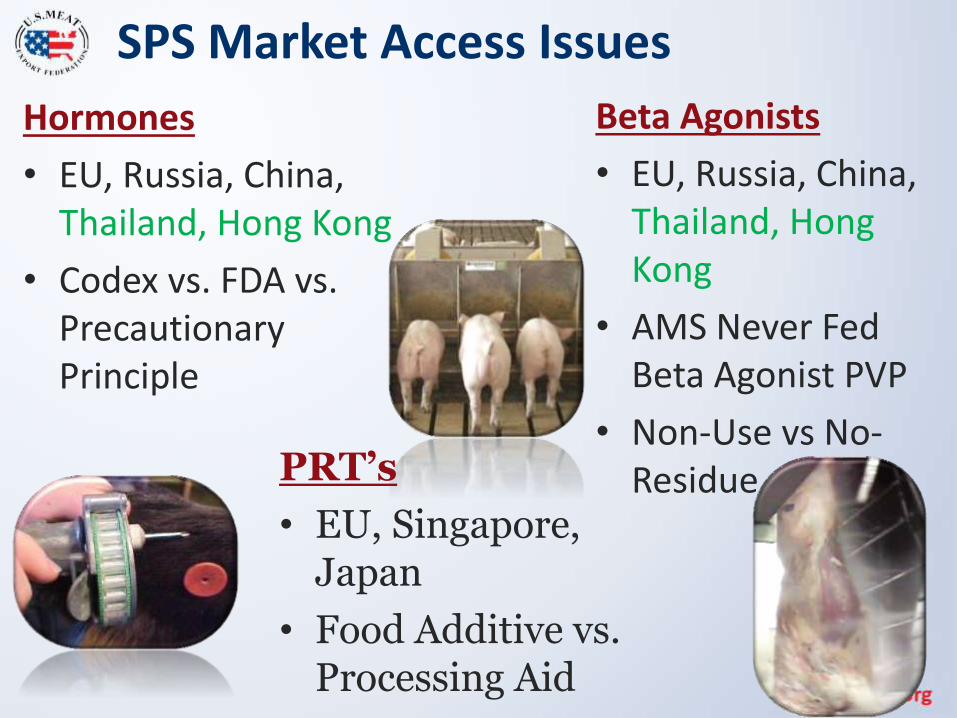
SPS Market Access Issues
Hormones
• EU, Russia, China, Thailand, Hong Kong
• Codex vs. FDA vs. Precautionary Principle
Beta Agonists
• EU, Russia, China, Thailand, Hong Kong
• AMS Never Fed Beta Agonist PVP
• Non-Use vs No-ResiduePRT’s
• EU, Singapore, Japan
• Food Additive vs. Processing Aid

Beef Safety / Antibiotic Resistance
Monitoring Food Borne Illness
FS
IS D
irective
7102.1
~150 Japan
20
Sin
gapore
9E
uro
pean U
nio
n
1
THE FAO ACTION PLAN ON
ANTIMICROBIAL
RESISTANCE2016-2020

U.S. Domestic and Import Testing Import testing standards mirror our risk-based
regulations regarding adulterants Listeria monocytogenes
RTE meats
E. coli O157:H7, O26, O45, O103, O111, O121, O145 (STEC) Raw, non-intact beef and non-intact components, e.g. trim,
ground or mechanically tenderized
New Rule: processors will need to prove use of primals and subprimals. If use is unknown or determined to be ground beef or mechanically tenderized they are subject to testing
USDA FSIS Procedures
Guidelines : BIFSCo Resources https://www.bifsco.org/resources.aspx

International Product Testing Export markets are moving to pathogen specific testing for raw,
intact products
E. coli O157, STECs, Listeria monocytogenes, Staphylococcus aureus, Salmonella
Non risk-based pathogen testing
No differentiation between intact and non-intact (or components)
No differentiation between raw and RTE
No differentiation between species
Retail Market Testing

Animal Welfare
• 5 Freedoms
• OIE Code– ISO Technical Specification
• Most Markets Have No Specific Requirements– Private Standards

Private Standards: GFSI, Animal Welfare, Sustainability
QSRInternational
Units Domestic
Units Total Units
McDonalds 18,710 14,259 32,969
KFC 11,798 4,270 16,068
Subway 10,109 27,103 37,212
Pizza Hut 5,890 7,822 13,712
Starbucks 5,757 7,559 13,316
Burger King 4,998 7,126 12,124
Dominos 4,422 5,200 9,622
Dunkin Donut 3,005 8,431 11,436
Dairy Queen 802 4,511 5,313
Papa Johns 755 3,388 4,143
Source: Forbes 2015
Retailer Headquarters
Number of Countries of Operation Revenue
Walmart USA 27 $469.1BTesco England 12 $101.2BCostco USA 8 $99.1BCarrefour France 30+ $98.7B
Kroger USA 2+ $96.6BLidl Germany 20 $87.2B
Metro Germany 31 $85.8B
ALDI Germany 18 $73.0B
Target USA 2 $71.9BAEON Japan 10 $63.1B
Source: Listovative 2014, 2016

Thank You!