international bank for reconstruction and …
TRANSCRIPT

RESTRICTED
Report No. PS- lOa
This report is for offii use only by the Bank Group and specificaly authorized orpnizationsor persons. It may not be published, quoted or cited without Bank Group authorization. TheBank Group does not accept responsibility for the accuracy or completeness of the report.
INTERNATIONAL BANK FOR RECONSTRUCTION AND DEVELOPMENT
INTERNATIONAL DEVELOPMENT ASSOCIATION
APPRAISAL OF
THE KUALA LUMPUR URBAN TRANSPORT PROJECT
MALAYSIA
May 31, 1972
Special Projects Department
Pub
lic D
iscl
osur
e A
utho
rized
Pub
lic D
iscl
osur
e A
utho
rized
Pub
lic D
iscl
osur
e A
utho
rized
Pub
lic D
iscl
osur
e A
utho
rized
Pub
lic D
iscl
osur
e A
utho
rized
Pub
lic D
iscl
osur
e A
utho
rized
Pub
lic D
iscl
osur
e A
utho
rized
Pub
lic D
iscl
osur
e A
utho
rized

CUrrency Bcuivalent%
Currecy Unit - Malaysian Dollar (X$)1*.00 - U*S$.357*J,0003,000 - US$357,143
US$1.00 - M$2.80US$1JOOOOOO - 12,9800,000
Units of ktights and Measures
British Standard
British Standard: Metric/US Bquivalent
1 Mile (mi) - 1.6093 kilometers (kmu)1 foot (ft) - 0.3048 meters (ma)1 squar mile (Ni2 ) - 2.5898 square kiloeters (ko2)1 cubic Yard (cu yd) - 0.764s6 cubic meters (m3)1 acre (ac) - 0.4047 hectares (ha)1 long ton (lg ton) - 1.0160 metric tons (a ton)1 long ton (lg ton) - 1.1200 short tons (sh ton)
Fiscal Year
January 1 - December 31
c.i.f. - Cost, insurance and freightEPU - Economic Planning UnitG-DP - Gross Domestic ProductaNP - Gross National ProductIhR - Internal Economic Returnm.p.h. - Miles per hourMOC - Ministry of ComnunicationsmOW - Ministry of Works, Power and Telecommunicationsp.c.u. - Passenger car unitp.p.a. - Persons per acrePWD - Public Works DepartmentRTLB - Road Transport Licensing BoardUNDP - United Nations Development Programme

MALAYSIA
APPRAISAL OF THE KUALA LUMPUR URBAN TRANSPORT PROJECT
TABLE OP CONTENTS
Page No.
SUMMARY AND CONCLUSIONS ************--.-************-- i-ii
I. INTRODUCTION ............. *........ *.**..*...*....* .... 1
II. BACKGROUND ............. * 1
LII. TRANSPORT NEEDS IN THE KUALA LUMPUR -PETALING JAYA URBAN CORRIDOR . .... .... S9 ........... ........ 3
A. Access Requirements in the Corridor ....... 3B. Improvement of Road Based Public Transport ................ 5C. Private Vehicle Use Policies .................. ............ 6D. Alternative Transport Capacity Improvements ............... 6E. Improvement of the Federal Highway ....... 8
IV. THE PROJECT ..... 10
A. General Description ................ ... .10B. Improvement of the Federal Highway ........................ 10C. Urban Transport Policy and Planning Studies ............... 11D. Road Maintenance Study and Route 1 Engineering ............ 12E. Design and Consulting Services .... .. .. .. .4 ........... ... . . 12F. Cost Estimates .. 13........................................ 13C. Financling ............................... 15H. Execution .......... ............ 15I. Project Management ...................... - 16J. Disbursements .................................. 17
V. ECONOMIC EVALUATION *........... 18
A. Quantified Returns ........................... t8B. Unquantified Benefits and Costs ......... 20................. 20
VI. AGREEMENTS REACHED AND RECOMMENDATION .......................... 21
This report was prepared by Messrs. S. Hara, R. Woodford, and N. Noon(Economists), A. Bergan (Engineer Consultant) and W. P. McCulloch (UrbanAffairs Officer) on the basis of appraisal missions in November/December1971 and January 1972. Mr. R. Mulligan of the Transportation ProjectsDepartment assisted the mission during the final week of appraisal.


ANNEES
1. Urban Development Administration in the Klang Valley2. Urban Development and Transport in the Klang Valley
Table 1 Major Components of Klang Valley Transport Pattern, 1971Table 2 Road Traffic in Major Corridors into Kuala LumpurTable 3 Motor Vehicle Registrations - West MalaysiaTable 4 Hotor Vehicle Registrations - Selangor StateTable 5 Revenues from Motor Vehicle TaxationTable 6 Klang Valley Road Mileages, 1971Table 7 Klang Valley Road Expenditures, 1966-1970, 1971-1975Table 8 Major Rail Trackage Investments in the Klang Valley, 1966-1970
3. Transport Characteristics in the Corridor
Table 1 Number of Vehicles per 1,000 Persons in Selected CitiesTable 2 Present Modal Split in Selected CitiesTable 3 Projected Modal Split in Selected Cities
4. Alternative Improvement Schemes for the Federal Highway5. Maintenance Study and Route 1 Engineering6. The Highway Sector
Table 1- Malaysian Road System, 1970Table 2 Road Construction and Improvement in West Malaysia, 1966-75
7. Economic Analyses
Table 1 Vehicle Running Costs, Net of TaxTable 2 Vehicle Depreciation and Interest Costs, Net of TaxTable 3 Vehicle Labor CostsTable 4 Personal Travel Time Costs
TABLES
1. Population Distribution in the Klang Valley, 1957, 1970, 1980, 19852. Road Traffic Growth on Major Approaches to Kuala Lumpur3. Estimates of Travel on the Federal Highway4. Detail of Construction Cost Estimates5. Estimated Schedule of Disbursements
CHARTS
1. Public Works Department2. Project Implementation Schedule
MAPS
1. West Malaysia Transport Network2. Klang Valley Region3. Kuala Lumpur Urban Transport Project4. Sections of Route 1 for Detailed Engineering


MALAYSIA
APPRAISAL OF THE KUALA LUMPUR URBAN TRANSPORT PROJECT
SUMMARY AND CONCLUSIONS
i. Growth in the modern sectors of the Malaysian economy has beenconcentrated mainly in Kuala Lumpur and the surrounding Klang Valley regionwith an accompanying population growth rate of 5.5% per annum. The corridorbetween Kuala Lumpur and Port Klang, served by a single through road, theFederal Highway, has been the dominant axis of growth involving the new townsof Petaling Jaya and Shah Alam, the expanded port, the new international air-port, and a substantial proportion of the new industrial plants. Althoughindividual development schemes have been highly successful, the aggregateeffect has been a severe strain on several related urban services and fa-cilities, particularly transport, for which corresponding improvements havenot been made.
ii. The lack of improvement to the urban section of the Federal High-way from the center of Kuala Lumpur through the adjacent new town of Petal-ing Jaya now threatens the successful completion of committed and planneddevelopment schemes as well as the maintenance of internal accessibilityessential to the efficient functioning of the growing metropolitan area.Present and expected urban development problems arise from a lack of con-sistent, complementary planning and timely execution of related urban fa-cilities. To improve this situation a UNDP funded and Bank administeredKlang Valley Regional Planning and Development Study (Klang Valley Study)is currently underway. However, additional transport capacity on the urbansection of the highway will be required even with substantially improvedpolicies and planning.
iii. The project is designed as a phased response to the need forimproving access within the rapidly developing metropolitan corridor, whichextends more than six miles from the center of the capital city of KualaLumpur through Petaling Jaya, and the need to integrate the two halves ofPetaling Jaya on either side of the present road. It would also facilitateaccess between the metropolitan area and major development areas along the25 mile section of the Federal Highway between Kuala Lumpur and Port Klang.The project includes the construction of increased road capacity, along withprovisions for a more efficient use of that capacity. It gives special at-tention to the needs of pedestrians, cyclists and bus passengers in the de-sign of the facility and places emphasis on the improvement and further de-velopment of public transport in the accompanying studies.
iv. The Urban Transport Policy and Planning Studies included in theproject deal with a number of important issues: (a) public transport fa-cilities and policies; (b) private vehicle use; (c) traffic engineering;(d) improved intra-city traffic facilities; and (e) consistency between land

- il -
use and transport policies. Thus the project goes beyond its immediateeffect of dealing with a major transport constraint affecting growth inother sectors; it leads into policy decisions and projects that shouldresult in better planning and distribution of resources regionally withinthe Kuala Lumpur urban corridor as well as nationally. The project shouldhave a major impact on related institutional development.
v. The project includes:
(a) improvement of about 6 miles of urban road from a dual2-lane to a dual 3-lane highway, including a dual 4-lanesegment of approximately 4,000 feet, together with theconstruction of five grade separated intersections;
(b) construction of three pedestrian bridges crossing thehighway and dual 12-foot wide cycle lanes parallel tothe roadway for bicycles, scooters and light motor-cycles;
(c) execution of the projects's detailed engineering;
(d) execution of the following studies: urban transportpolicy, public transport improvement and additionaltransport facilities for Kuala Lumpur; detailed en-gineering for a proposed Route 1 highway project; anda study of the Public Works Department (PWD) mainte-nance organization.
vi. The total cost of the project is M$ 88.5 million (US$31.6 million),including contingencies. Construction costs are estimated at M$ 54.6 million(US$19.5 million) based on detailed engineering. The foreign exchange com-ponent is estimated at H$ 44.5 million (US$16 million), or 50% of total cost,and would be financed by the proposed Bank loan of US$16 million. Changes inthe design of the project introduced by the appraisal mission reduced esti-mated construction costs by about one-third without seriously affecting benefits.A single contract for construction would be awarded on the basis of interna-tional competitive bidding. Tender documents will be completed by October1972.
vii. Road improvement from Kuala Lumpur through Petaling Jaya wouldlessen the travel time and operating costs of vehicles, thereby reducinguser costs and capacity restraints on travel. The resulting quantifiedbenefits compared with the estimated costs of the project provide an in-ternal economic return (IER) of 37%. If personal time savings are excludedthe return would be 22%. If the increase in vehicle traffic is assumed tobe 20% less than forecast, as a sensitivity test, the IER of the projectwould still be high, 29% including personal time savings and 16% excludingthis factor. These high rates of return reflect the rapid increases inroad transport cost and travel restraint occurring if the facilities are-notimproved.

- Lii -
viii. Important non-quantifiable benefits would result from the projectworks including the improvement of vehicular and pedestrian safety and thesupport of urban and industrial-growth in committed development areas alongthe entire 25 mile Federal Highway, particularly in Petaling Jaya. Theproject i8 suitable for a Bank loan of US$16 million for a term of 25 yearsincluding a grace period of five years.


MALAYSIA
APPRAISAL OF THE KUALA LUMPUR URBAN TRANSPORT PROJECT
1. INTRODUCTION
1.01 The Government of Malaysia has requested a Bank loan of US$16 mil-lion to help finance the improvement of about 6 miles of urban highway fromKuala Lumpur through the adjacent new town of Petaling Jaya, and to financestudies of urban transport policy, public transport improvement and addi-tional transport facilities for Kuala Lumpur.
1.02 Increased capacity of the Federal Highway from Kuala Lumpur throughPetaling Jaya was one of several recommendations made in a UNDP financedstudy entitled "Transport Development in Malaysia", completed in 1969 byRobert R. Nathan Associates, Inc. (U.S. consultants) with the Bank as execu-ting agency. The Bank identified the proposed project to improve about 6miles of the Federal Highway during an urban reconnaissance mission in 1970,and assisted in preparing terms of reference for the feasibility study anddetailed engineering. The feasibility study, including preliminary engineer-ing, was completed in September 1971 by U.K. consulting engineers Freeman,Fox & Partners with British financial assistance. The Government has re-quested Bank financing, a portion of which would be retroactive, to coverthe foreign exchange costs of the detailed engineering with tender documentsto be completed by Freeman, Fox & Partners in October 1972.
1.03 The project is the Bank's first urban transport project in Malay-sia and should lead to a series of urban development projects. The Bank iscurrently acting as executing agency for the UNDP funded Klang Valley Studyin the project area (para. 2.07), and would assist Government in preparingterms of reference for feasibility studies of high priority projectsidentified by the Klang Valley Study.
1.04 The report was prepared by Messrs. S. Hara, R. Woodford, and N.Noon (Economists) A. Bergan (Engineering Consultant) and W. P. McCulloch(Urban Affairs Officer) on the basis of appraisal missions in November/December 1971 and January 1972. Mr. R. Mulligan of the TransportationProjects Department assisted the mission during the final week of appraisal.
II. BACKGROUND
2.01 The region including Kuala Lumpur and Port Klang (see Maps 1 and2) has led modern sector development in Malaysia. Exports, which nowcenter on Port Klang following the Government's policy of encouraging thedisplacement of Singapore, accounted for 40 to 45% of GNP in recent years

- 2-
with rubber, tin, tropical woods and palm oil as the leading export prod-ucts. In the Klang Valley transport demand foiZ exports and imports, whichare growing by 5.2% and 4.8% per annum respectively, combine with rapidurban growth to place a heavy strain on the transport sector.
2.02 Nearly 25% of public investment in West Malaysia was devoted tothe transport sector between 1956 and 1965 (M$0.8 billion out of a totalof M$3.2 billion) of which about two-thirds was for roads and bridges.West Malaysia today has a well developed transport infrastructure withrelatively high standard roads serving vehicular traffic which, in relationto population, is second only to Japan among Asian countries. However,during the period 1966-1970 regional road investments were curtailed anddeferred during the study of Transport Development in Malaysia (see Annex 6,para. 3) which examined and reassessed investment priorities in the trans-port sector. Partly as a result of this policy, the Federal Highway (Route2) in the Klang Valley is becoming a constraint on development and on theintegration of the divided halves of key portions of metropolitan KualaLumpur.
2.03 Unemployment, which according to official sources is 7 to 8%nationally and could approach 9% by 1975, presents the Government with aserious challenge. Growth in the labor force is expected to be 3.1% perannum for the next several years compared with 2.6% during the last severalyears. Employment is expected to benefit from land and agricultural devel-opment schemes but the main burden of absorbing the increased labor forcewill fall on the manufacturing and service sectors which are concentratedin urban areas. Major urban centers (Map 1), principally on the west coastof West Malaysia, are growing at an average rate of 4.6% annually, withroughly one-third of this growth due to migration. The population ofmetropolitan Kuala Lumpur (approximately 700,000) has been increasing atabout 5.5% per annum, attesting to the rapid growth of economic activityin the Klang Valley region.
2.04 Recent development in the region based on metropolitan Kuala Lumpurhas been important to the expansion of modern sector activities essential forthe continued growth and diversification of the national economy. Factorydevelopment in and around Kuala Lumpur has helped to make the Klang Valleythe principal industrial growth region of the country. The expansion ofcommerce, services and government administration in Kuala Lumpur has alsomade the region the national growth center for modern tertiary employment.The continued development of these activities in Kuala Lumpur and other urbanareas of the region is supported by an extensive national road and rail trans-port system, and by the expanding transport terminal facilities at Port Klangand Subang International Airport, both located southwest of Kuala Lumpur.Water and power facilities are sufficient to support additional growth andtwo publicly sponsored industrial new towns southwest of Kuala Lumpur providefacilities for future expansion. The Selangor State Development Corporation,which is developing the new towns as well as other smaller development sitesin the region, offers particularly effective assistance to new industries.

-3-
2.05 Despite such examples of the effective implementation of individualdevelopment schemes, many urban facilities, services and institutions in theregion are badly strained under the pressure of rapidly increasing economicactivity and population. The most serious problems are the lack of con-sistent, complementary planning and the way in which related projects andpolicies are executed by the several existing urban development institutions(see Annex 1). These problems have been particularly evident in the growthand expansion of metropolitan Kuala Lumpur.
2.06 Studies undertaken by the Government (para. 1.02) have made clearthe need for immediate transport access improvements to insure the efficientfunctioning and orderly expansion of metropolitan Kuala Lumpur. While thepopulation of this large and rapidly growing urban center has nearly doubledsince 1957 (Table 1), neither improvements in facilities nor transport usepolicies have kept pace with growing transport requirements. The criticaltransport problem centers on the portion of the urban corridor from thecommercial center of Kuala Lumpur through the adjacent new town of PetalingJaya. The rapid growth of population and economic activity within thecorridor and the rapid expansion of cross commuting between the two areashas led to a deterioration of access. It is unlikely that further extensionsof urban development within the corridor already underway or committed canbe successfully integrated into the metropolitan area without major improve-ments in transport facilities and policies.
2.07 A UNDP financed Klang Valley Study, begun in January 1972, by U.K.consultants, Shankland Cox and Associates, seeks to: (a) improve and coor-dinate development planning within the region; (b) increase the Government'seffectiveness in implementing development plans; and (c) identify specifichigh priority development projects for feasibility study and investment.The study, due to be completed in March 1973, should advance the preparationof a series of urban development projects which are expected to form thebasis for continued Bank involvement in the region.
III. TRANSPORT NEEDS IN THE KUALA LUMPUR -PETALING JAYA URBAN CORRIDOR
A. Access Requirements in the Corridor
3.01 Petaling Jaya began development in the early 1950's as a smallresidential resettlement community adjacent to Kuala Lumpur and was laterdeveloped as a sizeable satellite new town. The later phases were builtwith both factories and housing and were intended to give the new town ameasure of self-sufficiency.

-4-
3.02 The present dual 2-lane limited access portion of the FederalHighway linking Petaling Jaya to Kuala Lumpur was constructed in 1957 to by-pass the new town which was then still a predominantly residential area lo-cated on the south side of the Federal Highway, with access onto Jalan Klang(see Map 3). The capacity of the Federal Highway has been consciously uti-lized by development authorities as the means to greatly extend and expandthe residential and industrial development of Petaling Jaya to the north andwest without investment in additional through east-west roads. During thisperiod Petaling Jaya became the most important new industrial and residentialarea in the Klang Valley. The population of Petaling Jaya has increased fromabout 20,000 to 90,000 and its surrounding population has grown from about25,000 to 50,000 (see Table 1). The corridor has the greatest amount of roadtraffic of any approaching Kuala Lumpur (see Table 2). With no major parallelroads through Petaling Jayw and with much of the traffic within the townhaving to cross the Federal Highway, the road has become a constraint tothe completion of committed development projects and a barrier between thetwo halves of Petaling Jaya on either side of the road. The urban develop-ment intended to make effective use of the available capacity of the FederalHighway has now overtaken that capacity. The expanding areas in the corridornow depend heavily upon improved access to Kuala Lumpur and across PetalingJaya if they are to be fully integrated into the rapidly growing metropolitanarea.
3.03 Transport capacity on this urban section of the Federal Highway isalso important for the operation and expansion of most of the important newregional development schemes in the Klang Valley outside the metropolitanarea, such as the second of the region's new towns, Shah Alam, the airport,the expanded Port Klang (formerly Port Swettenham) and related industrialdevelopment sites. All these have been directly linked to the FederalHighway and depend on good road access to Kuala Lumpur (see Annex 2). Since1963 the outer section of the Federal Highway between Petaling Jaya and PortKlang has been a dual 2-lane limited access road like the inner portion butwith bridges and other structures built to accommodate a dual 3 or dual4-lane roadway. The capacity limitations of the urban section of the roadthrough Petaling Jaya to Kuala Lumpur will undoubtedly constrain the greaterutilization of the highway between Petaling Jaya and Port Klang.
3.04 Vehicle travel on the Federal Highway from Kuala Lumpur throughPetaling Jaya has increased at an annual average rate of more than 12Z overthe past 8 years - a rate comparable to that of population growth in PetalingJaya. About 170,000 person and 72,000 vehicle trips per day are made on thissection of road (see Table 3). Much of the transport movement consists ofcross commuting; about half the resident labor force of 50,000 in the PetalingJaya area commutes to jobs in Kuala Lumpur and nearly half of the 45,000 jobsln letaling JayR area are filled by commuters from Kuala Lumpur (see Annex 2).nie inbound movement is largely the result of both an increase in new jobsin government, commerce and finance within the city of Kuala Lumpur which isbeing promoted by the government, and an increase in new middle income housingon the periphery of the metropolitan area where relatively inexpensive resi-dential land can be obtained. The outbound movement has resulted in part

from the inability of the government and local authorities to create suf-ficient new low income housing in the new towns and areas of industrial ex-pansion despite a recognition of the need to balance jobs and resident laborforce. The bulk of the industrial labor force in Petaling Jaya must now bedrawn from areas of modest older housing, much of which is in Kuala Lumpur.A more complete analysis of movement patterns is contained in Annex 2.
3.05 In the short term, the factors contributing to a continued con-centration of commercial development within Kuala Lumpur and to the expan-sion of new middle income residential areas outside the city are not likelyto be altered significantly. Large areas to the northwest and south ofPetaling Jaya are already committed or under construction. Population inthese areas is projected to increase by nearly 100,000 by 1980. The presentpattern of cross commuting will undoubtedly be reinforced by these develop-ments, as well as by the continued increase in population in both KualaLumpur and the established parts of Petaling Jaya. Even on the basis of lowpopulation growth expectations around Petaling Jaya (see Tables 1 and 3),total intra-metropolitan and through movements on the Federal Highway be-tween Petaling Jaya and Kuala Lumpur are expected to total about 310,000person trips per day by 1980 -- nearly double the 1971 total. By 1985 theareas surrounding Petaling Jaya are expected to increase by at least an addi-tional 40,000 persons, and total person movements on the Federal Highway be-tween Petaling Jaya and Kuala Lumpur are expected to total 400,000 trips perday on the basis of low population growth expectations.
3.06 The Government is attempting to improve its approach to the longterm problems of continued urbanization and economic growth in Kuala Lumpurand elsewhere in the Klang Valley region. However, the problems of urbani-zation are not easy to deal with effectively. The need to improve the balancebetween jobs and resident labor force in new towns is particularly importantin order to reduce transport investment requirements but this cannot beachieved without added cost to other urban services. Practical measures tobe taken by the Government to improve work-residence location should be de-fined in the Klang Valley Study but these should not be relied upon in theshort term to reduce radically the growth of transport movements, or theneed for increased transport capacity. Transport measures, such as improvedpublic transport services and revised private vehicle policies, could, how-ever, have a more direct impact on the need for and use of transport facili-ties and are considered to be integral parts of urban transport developmentfor the Klang Valley.
B. Improvement of Road Based Public Transport
3.07 Substantial improvements in services will be required if buses areto provide car owners with an attractive alternative mode of transport andmeet the needs of increasing numbers of persons who must rely on public trans-port. Although bus services and patronage are increasing in the corridor

- 6 -
and the region and the number of buses in the period 1965-1970 increasedfrom about 800 to 1,400, an average increase of about 11% per annum, bustravel is not keeping pace with total person travel growth (see Annex 2).This is despite historically low fares of about US 1.3 cents per mile whichhave declined in relation to the overall cost of living and to the cost ofprivate transport use. Studies need to be made of the fares and servicesnecessary to attract passengers from private transport and to serve personsdependent on public transport. Overall fare and policy guidelines should beprovided by the Klang Valley Study. More detailed investigation of majoroperating problems which can be foreseen in increasing and improving bus serv-ices, such as limited revenue potentials on new or improved services at exist-ing fares, taxation levels and formula and routing limitations and terminaldeficiencies in central Kuala Lumpur, are to be included in the Urban Trans-port Policy and Planning Studies (see paras. 4.05-4.06).
C. Private Vehicle Use Policies
3.08 Improved public transport is a necessary but in itself insufficientmeans of influencing the growth in demand for private car travel. Other meas-ures specifically aimed at reducing private vehicle travel will also be requiredto divert significant numbers of car users from private vehicles. In the Klang
Valley there are good reasons for considering highly selective vehicle userestraints. Broad measures intended to reduce the overall level of privatevehicle ownership or use, such as taxes on vehicles and fuel, do not have wide
public support and would be unworkable unless adopted nationally. In addition,experience in other countries indicates that the restraining effect of suchpolicies is only temporary. Average revenues per vehicle user in the regionalready exceed average road expenditure by a wide margin (see Annex 2) andthe use of most road facilities in the region could be unnecessarily penalized.Selective restraint policies to limit the growth of private vehicle travel to
and within central Kuala Lumpur are the most obviously feasible and beneficial.A policy to control the provision and use of parking is probably the mostpractical method though detailed study will be required to assess the form andoperation of an inner-city restraint policy. Such study is included in theUrban Transport Policy and Planning Studies to be financed by the Project.
D. Alternative Transport Capacity Improvements
3.09 Three basic alternative proposals for improving mainline transportcapacity and pedestrian and vehicular cross traffic movement through Petaling
Jaya were considered:
(a) improvement of rail services;
(b) improvement of the existing Federal Highway; and
(c) improvement of other parallel roads.

-7-
3.10 Despite low fares, less than 500 passengers per day use railservices to Petaling Jaya and many of these are railroad employees whotravel at special reduced rates. There are 16 passenger trains operatingdaily, each consisting of one or two diesel-electric cars with seating for60 persons per car. Passenger trains share the single track Port Klang linewith 18 goods trains and other shunting movements. Present frequencies ofpassenger train movements are already viewed by the Malayan Railways as aserious operating constraint for freight movements, as passenger traffic isgiven priority and takes up much of the line capacity.
3.11 The rail line passes along the periphery of Petaling Jaya, abouttwo miles from the main employment areas. In order for rail services to bean attractive alternative to road traffic, it would be necessary to improveboth the rail line capacity and the passenger collection and distributionservices at each end of the trip. Rail capacity constraints could be re-duced by doubling the tracks, but passenger collection and distributionwould remain a difficult problem because stations are not well located toserve commuters. A detailed study was not made of the costs of station re-location work and improved passenger collection and distribution servicesrequired in Kuala Lumpur. However, in Petaling Jaya in order to have safeand convenient crosstown connecting bus services to complete many passengertrips it would be necessary to construct overpasses at the Federal Highwaywhich alone would amount to about 45% of the cost of upgrading the FederalHighway. Even then it is unlikely, considering the need for passengers tochange travel modes twice and the resulting delays and inconvenience, thatupgraded rail service would divert motorists from their automobiles or evenbe competitive with direct bus service on the Federal Highway. The railproposal was not found to be as suitable as other alternatives for improvingpublic transport services and would still have required major constructionat the Federal Highway.
3.12 Studies have been made of the feasibility of improving Jalan Klangand Jalan Damansara to provide more or less parallel roads which would diverttraffic from the Federal Highway (see Map 3). Both roads have narrow rightsof way and are constricted by existing development; neither is a limitedaccess road. In order to improve Jalan Damansara to a high standard 4-laneroad, it would be necessary to construct a tunnel over 900 feet long througha residential area or acquire all abutting properties and construct the roadin a deep open cut. Both roads connect with the Federal Highway so improve-ments would be needed on the western and eastern sections of that road inconjunction with any upgrading of Jalan Klang and Damansara. As in the caseof the railroad alternative, both bypass roads skirt the edges of PetalingJaya and, in order to improve the cross-traffic movements, it would againbe necessary to construct overpasses at the Federal Highway.
3.13 Expansion of road capacity in the Federal Highway corridor by im-provement of the highway on its existing alignment is consistent with thepresent urban development plans by which many committed urban development

-8-
schemes inside and outside the metropolitan area have been linked to theroad on the assumption of continued good access along the existing route.Upgrading of the Federal Highway also minimizes land acquisition and envi-ronmental impact because rights-of-way exist for ultimate expansion of theroad along the present limited access portions of the road (the five milesection from Intersection No. 2 to the western terminus of the project,see Map 3).
E. Improvement of the Federal Highway
3.14 The appropriate scale of immediate improvements to be made to theFederal Highway has been related to consultants' projections of the likelygrowth of traffic on the road between 1980 and 1985, i.e. 5 to 10 years afterconstruction. Vehicle volumes on the Federal Highway are expected to growat a pace slower than in recent years (about 12% per annum) but still at arapid rate; about 9% per annum through 1980 and 6% per annum from 1980 to1985. By 1980 volumes would be about 2.2 times the present level and by1985 about 2.9 times. With 20% reduced growth in vehicle use, which hasbeen used as a sensitivity test (see Table 3), the corresponding increasesin volumes would be about 6% per annum through 1985 with 1980 volumes 1.7times the present level and by 1985 about 2.4 times.
3.15 Four alternative schemes for increasing the capacity of theFederal Highway were evaluated in a feasibility study by the consultants,Freeman, Fox & Partners. They ranged from simple widening of the presentroadway to a plan put forward by the Government to construct a second levelroadway above the present road, extending the entire distance through Petal-ing Jaya (see Annex 4). These investigations of facilities and expectedvehicle travel in the corridor between 1980 and 1985 indicated that neces-sary improvements to the Federal Highway would include: (1) increased in-tersection capacity for through, crossing and turning traffic (intersectionsbeing the critical capacity limitation on the existing road), (2) increasedroad lane capacity for through movements, (3) provision of separate cyclelanes for the safety and convenience of the high volume of users of hicycles,scooters and light motorcycles, (4) provision of grade separated [)edestriancrossings of the road at the few points of pedestrian concentration v'hiuclexist along the present limited access roadway and (5) provision of con-venient bus stops for the limited number of bus transfers exnected to -,bemade along the roadway (as an existing limited access road, almost all 7,uspassenger loading already takes place on collector roads).
3.16 The proposed improvement is a simplified and more economicaladaptation of the consultants' recommended scheme and incorporates each ofthe necessary improvement elements in a plan for staged construction whichclosely conforms to near term requirements and also permits further capa-city increases as required in the long term (see para. 4.02). The initial

-9-
stage to be carried out under the present project includes (a) constructionof grade-separated interchanges at the five most critical road crossings;(b) construction of dual 12-foot wide cycle lanes on either side of the mainroadway and three pedestrian bridges; and (c) widening of the highway fromtwo to three lanes in each direction with a dual 4-lane segment of approxi-mately 4000 feet.
3.17 The proposed improvement was considered superior to other roadalternatives for a number of reasons:
(i) the improvement permits the full utilization of existingrights-of-way, thereby postponing the time when additionalroads will need to be constructed on costly new rights-of-way in this rapidly developing urban corridor;
(ii) the initial improvement provides a level of traffic capacitywhich is expected to be fully utilized by local traffic inPetaling Jaya after the 1980's even if through traffic iseventually diverted to other new roads (the desirability andneed for these are specifically being examined in the KlangValley Study);
(iii) the provision of a third lane in each direction will facil-itate the operation of the intersections remaining at grade,will provide the option of reserving a lane for expressbuses and will represent the full development of the presentalignment. While deferral of sections of the third lanewould not appreciably reduce costs, such action would elimi-nate the above advantages;
(iv) phased construction substantially reduces costs withoutmaterially affecting benefits and still permits fulldevelopment of the existing rights-of-way at a laterstage (para. 4.02);
(v) the project's quantifiable benefits when compared with aminimum improvement give an extremely high internal economicreturn and a very high return when compared with the nextbest alternative (paras. 5.02-5.03). The returns remain satis-factory when time savings benefits are excluded and trafficforecasts are substantially reduced. The project alsoequals or surpasses others in its non-quantifiable aspects(paras. 5.08-5.10).

- 10 -
IV. TEE PROJECT
A. General Description
4.01 The project consists of:
(a) improvement of about 6 miles of an urban highway fromKuala Lumpur through the adjacent new town of PetalingJaya, including five grade-separated intersections,cycle lanes, three pedestrian bridges and widening ofthe highway from two to three lanes in each directionwith a duet 4-lane-segment of approximately 4000 feet;
(b) relocation of services, including electric and-telephonecables, water pipes and transmission towers;
(c) detailed engineering of the above road improvement;
(d) studies of additional transport problems in metropolitanKuala Lumpur, with particular emphasis on transportpolicies and measures to improve public transport, anda feasibility study and preliminary engineering of com-plementary road improvements;
(e) a study of the road maintenance organization of thePublic Works Department (NWD); and
(f) detailed engineering of about 137 miles of FederalRoute 1 (see Map 4).
B. Improvement of the Federal Highway
4.02 Changes in the design of the project which were introduced by theappraisal mission have reduced estimated construction costs by about one-third without seriously affecting the benefits. Three interchanges origin-ally included in the consultants t recommended scheme (Annex 4) have beendeferred while two others have been simplified. The deferred facilities arenot expected to be required until the early 1980's and the project is de-signed to accommodate this. An expansion of bus service in the corridor andthe initiation of other measures to reduce the growth of vehicle trafficcould delay the need even further.
4.03 The present grade-level intersections create the principal bottle-necks for traffic on the Federal Highway and make cross-town movements inPetaling Jaya difficult and hazardous. The provision of interchanges will

- 11 -
physically separate these conflicting movements and thereby correct boththe traffic capacity and safety problems. In doing so, it will facilitatevehicle and pedestrian movements from one side of Petaling Jaya to the otherand help restore the functional unity of this planned comrunity. The inter-changes will accommodate all major traffic movements and will include busstop facilities designed to permit safe and convenient loading, unloadingand transfer of bus passengers.
4.04 The project works would incorporate continuous dual 12-footcycle lanes with access at each interchange over the portion of the road-way provided with grade-separated intersections. The works would also in-corporate three pedestrian bridges between intersections. Inclusion ofthese improvements would increase the access and safety of motorcylists,bicyclists and pedestrians as well as improve the flow of vehiculartraffic, thereby considerably broadening the user group benefiting fromthe project works. Cycles constitute more than 20% of current trafficon the Federal Highway, and they outnumber automobiles both in the KlangValley region and in Malaysia as a whole. Most are low powered motorcyclesand scooters which serve as primary transport for many persons, includingcommuters to jobs in Petaling Jaya. Bicycles, although a declining pro-portion of cycle traffic, are still used in significant numbers. Pedestrianmovements across the road are important to the connection of residencesand factories in the areas of the crossings and separate crossing bridgeswould facilitate travel by foot as well as increasing its safety. Duringnegotiations, assurances were obtained that Government would ensure theproper use of cycle lanes (para. 6.01).
C. Urban Transport Policy and Planning Studies
4.05 The project would incorporate urban transport studies which woulddeal with a number of important urban transport and development issues: (a)public transport facilities and policies; (b) private vehicle use policies;(c) traffic engineering and regulation; (d) parking facilities and regula-tions; (e) consistency between land use and transport policies; and (f) theprobable need for improved intra-city traffic facilities. These studies, withinputs from the UNDP Klang Valley Study now underway, would seek practicalsolutions to problems which might lead to the identification of projects im-portant for coordinated urban development. During negotiations assuranceswere obtained that Government would initiate a program for periodic trafficcounts and origin/destination surveys on federal roads in urban areas (para.6.01), necessary for ongoing urban transport analysis and planning.
4.06 The project studies would include the examination and recommenda-tion of policies to expand and utilize public transport services, both railand road based. Particular emphasis would be given to short term improvements

- 12 -
to increase the efficiency and attractiveness of bus services and to alle-,viate present problems of bus operation in metropolitan Kuala Lumpur (para.3.07). The studies also include detailed consideration of the problems ofintra-city transport and in particular would include a feasibility study andpreliminary engineering of traffic distribution facilities from the-presentproject into Kuala Lumpur, including links for efficient connection of busesinto the central area. During negotiations assurances were obtained thatGovernment would engage consultants for the studies under terms of referenceacceptable to the Bank (para. 6.01).
4.07 The Klang VaLley Study, due to be completed in March 1973, willidentify specific high priority development projects for feasibility study.During negotiations assurances were obtained that the findings of the KlangValley Study would be rem*wed with the Bank._ Terms of reference for anyagreed feasibility stud±es, -though not financed under the Project, would besubject to Bank approval, (para. 6.01).
D. Road Maintenance Study and Route 1 Engineering
4.08 At the request of .the Government and with concurrence from theTransportation Projects Department, the project would also include (a) astudy of the road maintenance organization of the PWD and (b) detailedengineering for improving about 137 miles of Route 1 (see Map 4). Al-though highway maintenance is on the whole adequately funded, maintenanceoperations could be improved (see Annex 6). It is advantageous to proceedas early as possible with the study, and funding for this purpose has there-fore been included in the project. Detailed engineering of Route 1 startedin February 1972. Retroactive financing of the detailed engineering in asecond highway project would involve an inordinately long finance period,and it is therefore recommended that financing for detailed engineering ofRoute 1 be included in the present project, a portion of which would be forretroactive financing not to exceed US$400,000. During negotiations assur-ances were obtained -that Government would engage consultants for the roadmaintenance study under terms of reference acceptable to the Bank (see para.6.01).
E. Design and Consulting Services
4.09 The Government appointed Freeman, Fox & Partners (U.K.) in October1971 for detailed engineering of the project works on terms approved by theBank. The consultants completed detailed engineering for cost estimates inmid May and will complete tender documents in October, 1972. Design stan-dards used for the project are consistent with the general standards adoptedby the FWD (Annex 6, para. 19). The consultants are also responsible forreviewing specifications and contract documents prepared by the PWD forprocurement and civil works contracts for the relocation of services (para.4.17).

- 13 -
4.10 The Government will retain the services of Freeman, Fox & Partners
for the supervision of the main contract in order to maintain continuity of
work and avoid delays. This is acceptable to the Bank. The new contract
with Freeman, Fox & Partners would be subject to Bank approval. The Govern-
ment would also appoint consultants acceptable to the Bank for the Urban
Transport Policy and Planning Studies, the Klang Valley Project Feasibility
Studies and the Road Maintenance Study. In February 1972, the Government
appointed Vallentine, Laurie and Davies of Australia for detailed engineering
of 82 miles of Route 1 (Contract I) and a 55 mile extension of the same
Route (Contract II) in April 1972 on terms approved by the Bank.
F. Cost Estimates
4.11 The estimated cost of the project including service relocation, 1-an
acquisition, construction, detailed engineering, supervision, projcct fi-
nanced studies, detailed engineering of the Route 1 highway project and all
contingencies, is M$ 88.5 million (US$31.6 million). Total foreign ex-
change requirements of the project are estimated at M$ 44.5 million (US$16
million) or about 50% of the total cost. The estimated construction cost
of the main works, including contingencies, amounts to M$ 54.6 million
(US$19.5 million) with a foreign exchange component of M$ 35.5 million
(US$12.7 million) or about 65% of the construction cost. Details of the
cost estimates are presented below:

-14 -
L4000' (US 000) Foreign
item Local TOta]FoLoral g Total LExchangl
1. Conatruction cost 14,700 27,300 42,000k)- 5,250 9,750 15,000 65
2. Contingencies on 1)
Physical (10%) - 1,).70 2,730 4,200 525 975 1,500Price (20%) 2,940 5,460 8,400 1,050 1,90 3,000
Total construction e t o 2 5 7 M 190500
3. Detailed Egineering ofProject Works 480 2,820 3,300 172 1,007 1,179 85
4. Supervision of ProjectWirks 1,670 1,630 3,300 597 582 1,179 49
5. Contingencies (10%)on 3) and 4) 215 445 660 77 159 -- 236
6.- Service Relocation 8,528 - 8,528 3,046 - 3,046
7. Land Acquisition 10,000 _ 10,000 3,571 3,571
8. ProJect Managemert 300 - 300 107 _ 107
9. xuala Lumpur >rban Trans-port Pollcy and PlanningStudies 353 1,161 1,514 126 414 540 77
10. Study of Road MaintenanceOrganization 110 450 560 39 161 200 50
11. Contlngencies (20%)on 9) and 10! 93 322 415 33 115 11,8
12. Detailed Engineering ofRoute 1
Contrmct I 1,470 1,060 2,530 525 379 904 42Contract TI 1,350 960 2,310 482 343 825 42
13. Contingencies (10%)on 12) 282 202 484 101 72 173
3RA.ND TOTAL 03 ; 7 31.57
1) For details see Table 4

- 15 -
4.12 The cost estimates include a 10% physical contingency to coverpossible variations in quantities during construction and a price contingencyof 20%. The inclusion of a relatively high price contingency is due touncertainties arising from the absence of experience with large road projectsexecuted by foreign contractors in Malaysia (see Annex 6, paras. 22 and 23).
G. Financing
4.13 The proposed loan would cover the total foreign exchange require-ments of the project, amounting to M$ 44.5 million (US$16 million). Thelocal currency cost, amounting to M$ 44.0 million (US$15.7 million equiva-lent), would be financed by the Government from funds specifically budgetedfor the project. Since M$ 4.2 million (US$1.5 million equivalent) of theestimated project costs are directly attributable to Malaysian taxes, theGovernment's net contribution to the project would amount to If$ 39.3 million(about US$14.2 million equivalent). Annual budgets of PWD would include al-locations to cover the full cost of the project.
H. Execution
4.14 The construction program involves three main activities: (a) ac-quisition of land and property within the right-of-way; (b) relocation ofexisting utility services along the highway; and (c) construction of improve-ments to the main highway including new intersections. Land acquisition mustbe substantially completed before the award of the main civil works contract.
4.15 Acquisition of land for the project by the Federal PWD is alreadywell in hand on the basis of preliminary right-of-way plans prepared by theconsultants in January 1972. Land acquisition should not present any majorproblems because land for widening the road has already been reserved andmore than half of the land required belongs to Selangor State. Privateproperty within the right-of-way will be acquired immediately by placing theestimated cost in escrow pending a court decision on the precise amount ofcompensation. The acquisition of land and property does not involve anysignificant problems of resettlement. The PWD has agreed to take the neces-sary steps to complete land acquisition by April 1973 and assurances wereobtained during negotiations that land acquisition will be completed beforethe awarding of contracts (para. 6.01).
4.16 Utility services along the existing highway to be relocated in-clude water supply, sewerage, power and telephone lines. The concernedoperating authorities have agreed that the Federal PWD would be responsiblefor carrying out the relocation. Since the procurement of materials, such aspower and telephone cables and accessories, requires a lead time of about sixmonths, the Government has taken steps to place orders for these materials

- 16 -
in advance, which will be financed out of Government funds. The civil workscontracts for relocation and installation of the services would be awardedto local contractors, except for a small portion more suitable for inclusionin the main civil works contract, on the basis of competitive bidding becausethe works are small and competent local contractors are available to carryout these works. During negotiations assurances were obtained that PWD willcomplete the relocation of services in such a way as not to interfere withthe work of the main contractor (para. 6.01).
4.17 The main civil works contract for improvement of the highway in-cludes widening of the highway from two to three lanes in each direction,construction of five grade-separated interchanges, construction of cyclelanes and other miscellaneous works such as fencing, road markings, trafficsignals, road signs, lighting, etc. The Government has agreed with the con-sultants' recommendation that these works should be combined into a singlecontract because they are concentrated within a relatively short distance ofabout 6 miles and their construction sequences depend on the progress of eachactivity. In addition, a single contractor would be able to utilize his con-struction equipment more effectively on various jobs, and problems of dividedresponsibility with respect to maintenance and safety of traffic during con-struction would be avoided. The contract would be based on unit prices andwould be awarded on the basis of international competitive bidding. Localcontractors are unlikely to satisfy the pre-qualification requirements forthis contract because nearly all highways, except bridges, have been con-structed by the FWD in the past on force account basis. However, local con-tractors are expected to carry out some works as sub-contractors to the maincontractor.
4.18 Implementation of the project would he carried out over a four-vearperiod (see Chart 2). Construction of the main civil works would take abouttthree years to complete with April 1976 as the target completion date. TheUrban Transport Policy Study for Kuala Lumpur would begin in September 1972to be followed by a feasibility study and preliminary engineering of connect-ing facilities to the Federal Highway to he completed in December 1973. De-tailed engineering of Route 1 commenced in February 1972 under contract -ithVallentine, Laurie & Davies of Australia and is expected to he completed byApril 1973. The road 2Iaintenance Study is schedule.l for completion byOctober 1973.
I. Project Management
4.19 Responsibility for highway administration in Malaysia is dividedbetween the Ministry of Communication (MOC) and the Ministry of Works andPower (MOW). The MOC is responsible for licensing, registration and regula-tion and the MOW for construction and maintenance of federal roads includingallocation of maintenance funds for state roads. The Federal PWD is the ex-ecuting department of the MOW for construction and maintenance of federal

- 17 -
roads. It is headed by a Director-General with two Deputy Director-Generalsfor development and engineering services. The Deputy Director-General fordevelopment controls five operating divisions, of which one is the Roads Di-vision which is responsible for the construction of all federal roads. TheRoads Division is administered by a Director who controls five sections:implementation, design, planning, project coordination and federal land de-velopment projects. The implementation section is responsible for road im-provement, construction of minor road projects, maintenance of all federalroads and other works (see Annex 6).
4.20 In view of the size and importance of the project and the fact thatconstruction of a road project through international competitive bidding isbeing carried out for the first time, the FWD will establish a new unit inthe Roads Division with exclusive responsibility for implementation and man-agement of all the works included in the project. The unit will be headedby an experienced Project Manager who will be directly responsible to theDirector of the Roads Division for all aspects of implementation of theproject and would have adequate engineering, administrative and accountingstaff to be able to supervise the work of the consultants for the maincivil works contract and also coordinate and implement the work on land ac-quisition and service relocations.
4.21 The Roads Division of the Federal PWD had until recently an acuteshortage of staff. Of 68 authorized positions for engineers and technicians,44 positions, which had not been filled, have recently been staffed. Assur-ances were obtained during negotiations that adequate staff would be providedfor the Project, in particular for a special liaison office for the Project(see para. 6.01).
J. Disbursements
4.22 Loan funds would be disbursed as follows:
Main civil works contract - 65% of payments to construc-tion contractors.
Consultant services - 60% of total expenditure(representing the estimatedforeign exchange component).
For the foreign exchange component of payments, made after October 15, 1971and before signing of the loan agreement, for detailed engineering of theproposed project an aggregate amount not exceeding US$1,000,000 would befinanced retroactively. The Government has requested the Bank to considerfinancing the foreign exchange costs of detailed engineering for the Route 1highway, including retroactive financing not to exceed US$400,000 for expendi-tures incurred after February 1, 1972. A schedule of estimated cumulativequarterly loan disbursements is presented as Table 5.

- 18 -
V. tCONOMIC EVALUATION
5.01 The proposed improvement of the Federal Highway to a dual 3-laneroadway with continuous cycle lanes and with grade separation of selectedintersections would directly contribute to the efficient functioning andorderly expansion of metropolitan Kuala Lumpur and would greatly reduce theeffect of the existing road in separating the two halves of Petaling Jaya.Comparison of quantified benefits and costs associated with these projectimpacts show the improvemoent to be economically well justified. Assessmentof non-quantified benefits end costs provides additional justification forthe improvement.
-5. Quantified Returns
5.02 The internal economic return (IER) of the Federal Highway improve-ment compared to a "without" alternative 1/ is 37% when benefits from bothvehicle operating cost savings and personal time savings as well as the bene-fits attributable to a reduction in travel restraint are included. The re-turn excluding personal time savings is 22Z. These high rates reflect therapid increases in road transport costs and in travel restraint which wouldoccur if the existing facility were not soon improved. If the increase invehicle traffic is assumed to be 20% less than the consultants' forecasts(see para. 3.14), transport costs and travel restraint would rise less rapidlybut the IER of the project would still be high, 29Z including personal timesavings and 16% excluding this factor.
5.03 In addition to a very high IER as compared to a "without" scheme,the selected project gives sufficiently greater quantified benefits than alesser improvement of road (dual two-lanes with cycle tracks and grade sepa-rated intersections throughout) to justify the additional cost. The IER onthe additional investment cost (about US$4 million) under a number of assump-tions is as follows:
I/ Actually involving an investment of US$0.8 million in 1973/74 andUS$7.5 million in 1979/80 for minimum essential improvements to theroadway.

- 19 -
Internal Economic Returi (IER)of Increased Investment in a
Dual 3-lane Road ove.r aDual 2-Lane Road
(X)
Traffic Growth per Consultants' Forecast:Benefits Including Personal Time Savings 31Benefits Excluding Personal Time Savings 21
Traffic Growth, 20% Less Than Consultants'Forecast:
Benefits Including Personal Time Savings 24Benefits Excluding Personal Time Savings 12
As shown the return is greater than 20% except in the case when for !cast vehi-cle travel is reduced by 20% and personal time savings are excluded Inthat case the additional investment still yields a return of 12% which isadeouate under Malaysian conditions. It was also found that the beiefits of
a greater improvement than the one selected (dual three-lanes with .:ycletracks and grade separation throughout) would not justify the addit..onal in-vestment.
5.04 A calculation was also made to determine the effect on th! proj-ects' economic feasibility if no improvement were made in future road cap-acity in central Kuala Lumpur. Though not consistent with present (overnmentintentions, this revised assumption gives an indication of the effe':t on theproject if related road development were greatly curtailed due to p4llicychanges or budget limitations. The resulting IER is 27% with persouial timesavings and 13% without.
5.05 The improved travel conditions and increased capacity pro-ided bythe alternative road improvement schemes considered produce both "cust-reducing" and "output-increasing" effects and the quantified benefit:s re-
flect both of these. The quantified benefits are attributable to oljeratingcost and time savings resulting from faster and more unifokm flow o... vehiclesbetween intersections and from reduced stopping, starting and idlinir of ve-hicles at intersections with interrupted flow. These savings reduc, theresource and personal travel costs of road users, reduce tWp number of roadusers restrained from traveling because of congestion restraint on c,emandand increase net government tax revenues (see Annex 7, para. 6). TIe degreeof constraint associated with the various alternatives considered ii. theanalysis is summarized in Annex 3. The costs of vehicle operation used incomputing these benefits are based on an adaption to Kua-la Lumpur cctnditionsof unit costs of vehicle operation in urban areas at various average, speedsobserved in the U.K. These costs are shown in Annex 7 and are cons:deredto be low for congested traffic conditions. This introduces a consurvativebias into the return calculation. The value of personal time is based on pro-portions of average wage rates also observed in the U.K. applied to average

- 20 -
wage rates computed for the study area. Personal travel time savings foradults during non working hours are valued at 25% of the wage rate of theprincipal wage earner in the household.
5.06 Because of the uncertainty of long term urban travel forecastsand the importance attached to the short term effects of improvement alterna-tives, benefits for only 15 years of project life are considered though thephysical life of the improvements would be at.least 25 years.
5.07 The quantified costs of construction used in the economic analysesare the estimated costs, excluding taxes, of construction including a IO0contingency for variations in quantities and a 10% contingency to cover un-certainties arising from contractor inexperience in Malaysia, supervision,relocation of public utilities, the economic cost of land taken out of otheractual or potential uses -for the highway and the economic costs of additionalcongestion caused by road works during the construction period. Future main-tenance costs- of each alternative-, including maintenance of new road lanesand structures, are quantified as annual costs.
B-. Unquantified Benefits and Costs
5.08 Some of the benefits attributable to the project cannot be direct-ly quantified and are not measured in full through their effects on trafficflows. Conversely, some identifiable costs (para. 5.10) are unquantifiedin the analysis. These unquantified project impacts are seen, on balance,to weigh much in favor of the project and should be considered an importantadditional confirmation of its merit.
5.09 The traffic projections from which the quantified benefits havebeen determined imply the completion of development schemes for housing andindustry which are already under way or firmly committed. They also assumea pattern of cross traffic between the halves of Petaling Jaya divided by thehighway. If the proposed improvements are not made, both the development ofnew areas and the integration of Petaling Jaya would be very much more diffi-cult. It is doubtful whether the traffic constraint alone would be an ade-quate measure for the difference between the two situations. In this sensethe benefits from the project may not be fully represented in the quantifica-tions based on differences in traffic characteristics. In addition, theprovision of cycle lanes, pedestrian bridges and grade separated intersectionswill reduce conflicting traffic movements and provide safer conditions forcyclists, pedestrians and motorists. The reduction in the accident ratewhich this project is designed to achieve is not quantified. Finally, thestudies associated with the project are expected to contribute to more ra-tional use of transport facilities. No attempt at quantification of thisbenefit is possible but it could be substantial.
- 21 -
5.10 The marginal environmental impacts resulting from the improvementof the existing facility are small. Upgrading of the present Federal High-way results in the improvement being almost entirely contained within theright-of-wvy reserve of the existing limited access portions of the road(5 miles from intersection 2 to the western terminus of the project, Map 3).Additional noise and visual intrusion along the present limited accas8 por-tion of the road would be minimal as allowance for ultimate expansion ofthe present roadway was anticipated in the planned development of adjacentproperties. On a portion of the remaining Jalan Lornie section of sheroad the improvement would deviate from the present alignment. However,most of the properties affected are being acquired for the improvement andsome of those remaining are presently subject to redevelopment of a typewhich should be able to minimize the impact of noise and visual intrusion.Resource and personal costs of relocation resulting from displacemenit ofland use activities along the Jalan Lornie road section not covered by ac-quisition and compensation payments included in project costs, are small.Few property owners and tenants are affected and most are occupants of uppermiddle income residential properties for whom adequate alternative accommo-dation exists in metropolitan Kuala Lumpur.
VI. AGREEKENTS REACHED AND RECOMMENDATION
6.0S During loan negotiations, assurances were obtained that:
(a) Government will ensure the proper use of cycle lanes(para. 4.04);
(b) Government will initiate a program for periodic trafficcounts and origin/destination surveys on federal roads inurban areas (para. 4.05);
(c) Government will engage consultants for the Urban TransportPolicy and Planning Studies (para. 4.06) under terms ofreference acceptable to the Bank;
(d) the specific projects and terms of reference for highpriority project feasibility studies identified by theKlang Valley Study will be subject to Bank approval,though not financed under the present Project (para.4.07);
(e) Government will engage consultants for the study of roadmaintenance operations (para. 4.08) under terms of re-ference acceptable to the Bank;

- 22 -
(f) Government will complete land acquisition for the projectbefore awarding the construction contracts (para. 4.15);
(g) the PWD will undertake the relocation of services in sucha way as not to iaterfere with construction work on theFederal Highway (para. 4.16); and
(h) Government will make available adequate staff for executionof the Project (para. 4.21).
6.02 With the above assurances and agreements, the project constitutesa suitable basis for a Bank loan of US$16 million. The loan should be ex-tended over 25 years, including a five-year grace period.

ANNEX 1pae 1
MALAYSIA
KUALA LUMPUR URBAN 1RASPORT PROJECT
URBAN DElOFf3iT ADMINISTRATI IN THE IANG VALLEr
1. Urban development in the }lang Valley region is the responsibilityof a number of federal, state and local government agencies. The SelangorState government has primary statutory responsibility for urban developmentprograms, but the Municipality of Kuala Lumpur and the Federal Governmentalso have considerable urban development powers of their own. Coordinationamong the various agencies is inadequate, and urban planning efforts tendto be fragmented. The problem of coordination is made more difficult bythe complexity of urban social problems. The fLang Valley Study has beenundertaken at the request of the Government of Malaysia to address severalof these urban planning and implementation problems.
A. Administrative Organizations for Urban Development
Federal Goverrnment
2, The role of the Federal Government in urban planning and programimplementation is primarily advisory. The Federal organizations involvedare the Economic Planning Unit, the Town and Country Planning Departmentand the relatively new Urban Development Authority.
3. The Economic Planning Unit (EPU) which is part of the PrimeMinister's Office is in charge of development planning and investmentprogramming for the country. As such, the EPU is concerned with thecountry's basic policy towards urbanization and with the investmentallocation established under the country's 5 year economic plans,(currently the Second Malaysia Plan).
4. The Second Malaysia Plan (1971-75) is the first of country'seconomic plans to explicitly include urban development aspects. Theplan provides general guidelines including:
(a) promotian of the growth of manufacturing andcomuercial sectors in urban areas;
(b) implementation of urban renewal,housing andother projects for low income groups; and
(c) development of new growth centers in ruralareas.

ANNEX 1Page 2
The Federal Government is thus trying not only to foster orderlydevelopment in the already established urban areas, but also toencourage the formation of some urban development nuclei in areas nowpredominately rural.
5. The Town and Country Planning Department of the Ministry ofResearch, Technologr, and Local Government provides development planningadvisory services to state and local governments. It advises on townplanning, urban renewal, and housing projects (in conjunction with theHousing Trust, a financially autonomous part of the Ministry whichspecializes in implementation of low cost housing projects) and performsbasic research. It recruits urban development personnel for stategovernment planning offices and, as a result, indirectly influencesplanning activities of tb state governments.
6. The Urban Dbeelopment Authority (UDA), was established in 1970and was given a budget allocation under the Second Malaysia Plan ofM$ 100 million (US$ 35.7 million) to implement certain large-scale urbanprojects in Kuala Lumpur and to coordinate the planning efforts of theState and Municipality for the urban development of Kuala Lumpur. Partof UDA's urban development efforts within Kuala Lumpur are to be directedat reducing income disparities that tend to follow ethnic lines. Thedevelopment of business premises for Malays, for example, are intended toenable Malays to become moe active in cownerce and manufacturing.
7. The Federal Government alone is responsible for the provision ofpower, education and health facilities throughout the country.. Low cost publichousing schemes are primarily financed by Federal loans to state and localgovernments. All levels of government are involved in highway construction andmaintenance. The Federal Government can acquire land on a compulsory basis forpublic purposes but requires the consent of the state government concernedexcept within the Municipality of Kuala Lumpur where no consent of SelangorState is necessary).
State Government
8. The Klang Valley region is entirely contained within the Stateof Selangor. Selangor State, like other state goveznments in Malaysia,has the ultimate authority over land ownership and use within its boundaries.It has power of compulsory land acquisition for public purposes. It canalso control the use of land by enforcing land title conditions that specifythe activities permitted on a particular lot of land, and by requiringprior approval of any change in use of land. The Federal government mustcompensate the State for any State lands it acquires for public works.
9. The Selangor State Planning Office is responsible for land useplanning. It provides technical advice to local governments on urban plansand asmists in the budgeting of urban projects. The present urban develop-ment plan of the Selangor State is basically consistent with existing trends

ANNE 1Page 3
of urbanization of the region. The plan is general (without any definiteimplementation period or corresponding urban structure plans), and Wibe revised and refined when the MINOP Rlang Valley Study is completed.The State Planning Office bases its plan for new urban development ofmore than 4,500 acres including large-scale industrial development inShah Alam and Port Klang areas (covering 1,000 acres and 1,700 acresrespectively) on projections that the urban area of the region willincrease from 1.1 million to 2.6 million and that the population of theKuala Lumpur metropolitan area will increaso from 700,000 to 2.1 million,though the period of the expansion is not specified.
10. The State Pablic Works Department is responsible for thedevelopment and maintenance of major drainage works, flood control, andstate roads, and the State Water Supply Authority, a self financingquasi-governmental bodo, is in charge of all water supply works.Finally, the State Development Corporation is responsible for implementinglarge-scale development of residential and industrial estates and newtowns.
11. Selangor State Development Corporation was established in 1958under the name of the Petaling Jaya Developmet Corporation. Thecorporation plans and supervises the development of residential areasand industrial sites, and receives its revenues chiefly from sale ofland After completing the new town development of Petaling Jaya, thecorporation has focused on the residential development at Sungei Way-Sabang (outside of Petaling Jaya) and a second new town at Shah Alam.
12. The Selangor State Water Supply Authority is expanding itsfacilities under a 1969 Bank loan of US$ 3.6 million, which will financethe first phase of the Sumgei Langat Scheme. By the completion of thefour phase scheme, the facilities are expected to be adequate through1985.
Local Goverrments
13. The State administers all local governments within its boundaries,except the Municipality of Kuala Lumpur which is administered by theCommissioner of the Federal Capital. Town councils and town boards arefinancially autonomous, but a majority of their members are appointed bythe State. Zoning and other local regulations require State approval.Local government authority covers the provision of drainage systems, localroads, traffic management, recreational facilities, refuse collection, andthe enforcement of zoning and building regulations. Road maintenance isfacilitated by grants from the Federal Government, while construction ofmajor public works is generally financed by either local revenues or loansfrom the State.

ANNE 1page 4
14. The Municipality of Dala Lumpur, on the other hand, hasthe authority to plan and implesnt urban development, and to establishzoning and land use regulations without State approval. With financingfrom FeWderal Governmnt loans. the Municipality has implemented asubstantially greater nuxber of low cost public housing projects andsewerage projects than other local goverments in the region. Althoughthe Municipality has a capable urban planning department, insufficientcoordination with the State goverment on urban development plans hasoften led to inconsistencies- in planning of the metropolitan area.The [lang Valley Regional Committee formed in the early 1960's tocoordinate the regional planning efforts of the relevant federal, stateand local goverment agecies was disbanded in 1970. In its ten years,however, the Committee drafted a comprehensive development plan for theregion which has becom& the basis for the State's development plan.The Urban Development Authority of the Federal Government is expected toreestablish cooperation amog the government agencies for the KualaLunpur metropolitan area.
B. Probleas in Provision of Public Facilities
15. Low cost public housing is one of the important sectors of urbandevelopment. Although federal, state and municipal governments participatein the public houaing effort, housing programs are too limited to meethousing needs. In the past five years, 6,500 low cost housing units wereccnstructed in Kuala Luqpr., and 2,000 housing units were constructed outsidethe city. Within Kuala Lwumpr a limited number of housing units with reducedrents for the first two years are made available to resettled squattersbut the magnitude of squatter resettlements far exceeds the provisions made:a 1969 sample survey revealed that more than one-third of the populationof Kuala Lumpur or 150,000 persona are squatters.
16. Low cost public housing (2,000 units) is insufficient even in thenew town of Petaling Jaya, developed by the precursor of the Selangor StateDevelopment Corporation. The new town has an active industrial sectorrequiring substantial nmubers of low income laborers, but the residentialareas of the new town are for the most part communities of middle and uppermiddle income groups. This is partly because the Corporation has to developmarketable land to retain financial autonomy. As a result, a large number ofthe factory workers are drawn from Kuala Lwupur. Shah Alan, the second newtown in its first stage of development, may not be much more successful inbalancing residences for workers with factory development despite anincreasing awareness of the need to reduce commuting requirements.
17. The provision of sewerage and drainage has also lagged in urbanareas. Only Kuala Lumpur has a sewerage system, and its system is availableto less than 40% of its urban population. In 1972 the UNDP is funding andthe World Health Organization is administering a feasibility study forimproved sewerage in Kuala Lumpur. Although the need for controlled drainageis acute due to frequent heavy rainfaills, no major drainage system havebeen developed except in Kuala Lumpur. Little has been done by the Stateto provide for flood control.

ANNEX 1Page 5
C. Improvement of Development Administration
18. The rapid pace of urban growth in the region has broughtabout saeleral urban development problema ariaing from the administrativestructure, resources and policies of the various authorities in chargeof developments
(a) Coordination of Urban Development: A number offederal, state and local agencies are concernedwith urban development activities in the region,but each agency acts with almost totalindependence.
(b) Provision of Urban Facilities: Except forfinancially sf supporting projecta, theexpanding need for urban facilities requiredby the rapidly increasing population can onlybe partially met because of limited financialand manpower resources.
(c) Social Problems: The Government is attemptingto improve relationships among urban ethnicgroups historical;y centered on disparities ofincome and economic status by rendering specialassistance to Malaya and other indigenous people.It seems, however, that the Government is havingto proceed cautiously in pursuing these objectives.The existence of these urban social problems addfurther complication to development policyformulation.
19. The UNDP financed Rlang Valley Study addresses, among otherthings, a number of these urban development problems. The studyparticularly puts emphasis on (1) coordination of existing urbandevelopment plans, (2) improvement of urban development administration,and (3) identification of high priority projects. The study is expectedto be completed in March 1973 and to provide the basis for urbandevelopment in the Xlang Valley region.
April 5, 1972


ANNEX 2Page 1
MALAYSIA
1KUALA LIJNPUR URBAN TRANSPORT PROJECT
MRBAN DELOPMENT AND ThANSPORT IN THE ILANG VALLEr
A. TUrban DeveloLment/Transport Interrelationships
1. The present magnitude and pattern of person and goods movementin the Klang Valley are products of the highly interrelated factors ofeconomic and social conditions, locational patterns, transport facilitiesand transport use regulations and costa. The patterns of urban expansionand economic activity which shape the development of regional transportmovements are examined in Section B. The principal components ofregional transport movement and their associated land use patterns aredetailed in Section C. Related transport policies and development inthe region are described in Section D.
B. Urban Development Pattern in the Region
2. Recent location of population and economic activity in theregion has been strongly influenced by locational advantages created bythe complementary development of key transport facilities and major newtown sites strategically placed within the existing regional complex.The expansion of Port Klang and the improvement of transport facilitiesbetween the port and Kuala Lumpur at the focal point of the nationaltransport system have defined an area in between Vith the uniqueadvantages of ready access to West Malaysia's major foreign trade port,its large hinterland and the nation's capital. The potential of thismajor corridor of the Xlang Valley has been exploited and enhanced by thepublic development of two new towns at Petaling Jaya adjacent to KualaLumpur and Shah Alam near Klang. Both are astride the Federal Highwayand adjacent to the rail line connecting Kuala Lumpur and Port Slang.
3. The new town developments have accommodated a large portion ofthe region's industrial growth and a significant portion of its residentialexpansion though much of the new town residential development has beenassociated not with the adjacent industrial activity but with the commercialand governmental activity which has remained in Kuala Lumpur. Otherincrements of residential development associated with these cential placeactivities have occurred within Kuala Lumpur itself but primarily outsidethe city along other major transport corridors. Residential developmentassociated with the port has been relatively aelf-contained in Port Klangand Xlang.

ANNEX 2Page 2
4. In 1970 Kuala Iupur had a population of 450,000 within itsmunicipal boundary, abaat 40% of the region's total. Its contiguousbuilt-up area, including Petaling Jaya, contained another 255,000persons and scattered settlements on its urban fringe containd a further169,000 persns. Altogether nearly 80% Of the region' s populationresides in aWd immedately arowid Kuala Lumpar. The r.ang/Port Klangarea had a 1970 population of 113,000, 10% of the region's total andShah Alan, in the early stages of development, contained less than 2,000persons.
C. Major Regical Lad Use/Transport Components
The important spatial interrelationships in the region thatgive rise to transport venmt are prosently contained within and betweenthe urban growth cnters of metropolitan Kuala Lumpur, Klang/Port Klangand Shah Alan. The significant compnents are those: (a) within Kuala-Lumpur, (b) within Petaing Jaya, (c) between Kuala Luwpur and PetalingJaya and (d) between uala Lumpur and Shah Alam-Elang/Port Elang. Thesecomponents are assessed in the following paragraphs. The data m Whichthe assessment is made is derived primarily from previous consultantstudies. Land use dAta is not syatematically gathered or updated.Traffic information is available from regular Federal FWD and municipalitycounts as well- as consultant surveys. However, the periodic counts madeare not comprehensive.(the PWD does not make counts within the urban areas)and do not include origin-destingation surveys also needed to update urbanroad investment programs.
Kuala Lumpur
6. The present urbanized area of Kuala Lumpur has extended beyondthe municipal boundary in each of the corridors served by a major road(see Map 2). However within the municipal boundary there is sti11considerable developable land and the gross population density is lessthan 25 persons per acre (p.p.a.). Higher densities of about 60 p.p.a.eodst to the north and southeast and localized densities in scatteredpublic housing estates may reach 200 p.p.a. Gradual infillin ofresidential development has and will continue to increase overalldensities but concentrated corridors of high density residential develop-ment have not appeared and are not anticipated.
7. Commercial activity in Kuala Lumpur and the region has itsgreatest concentration in and around the 3/4 square mile central commercialarea, a small, medium density center roughly bounded by the proposed InnerRing Road, Jalan Kuching and Jalan Birch. In 1970 the area had anestimated employment of about 80,000 and somewhat lower density commercialwedges extend outwards to the east and north. A concentration of governmentadministrative activities is located in adjacent areas to the west andsouth of the center. Apart from this inner-city area, there are nosignificant employment concentrations in Kuala Lumpur. Substantiallyincreased private and public office development in and around the center
ANNE 2Page 3
is permitted in the present land use plan and is being promoted bygovernment development incentives. The municipality is about tocarr out a periodic review of its statutory land use plan and the.lang Valley Study will assess these policies. In the meantime
locations well outside of central Kuala Lumpur do not appear to befavored by developers and inner-city commercial development continues.
8. The composition of present estimated internal transportmovement in Kuala Lumpur is summarized in Table 1 and the volume ofmovement entering or leaving is summarized in Table 2. On the orderof 300,000 vehicle and 600,000 person trips per day are estimated tobe made between Kuala Lumpur locations. About 67% of vehicularmovements are estimated to be made by car, 19% by motorcycles, 3% bybus and 11% by truck. Over one-third of passenger movements areestimated to be made by bus. Since 1963 internal vehicle movementsare thought to have been increasing on the order of 5% per anmum,much lower than the rate of traffic entering or leaving the city.External movements have increased to over 230,000 vehicles per day, anaverage increase of about 13% per annum over the period, though thecurrent rate has declined to about 10% per annum. Travel in KualaLumpur is significantly influenced by these large external movementswhich have grown in parallel with the city's development as thecommercial, retail and cultural center of the region and the nationalcapital. Within Kuala Lumpur, movementa are highly oriented towardsthe central commercial area. In 1963, over 45% of internal and 25% ofexternal travel in Kuala Lumpur was to and from or within the area.Subsequent development has probably maintained this pattern.
9.. The transportation pattern in Kuala Lumpur reflects thedominance of private road transport which prevails in the region andthe policies within the city to develop and improve facilities to caterfor increased traffic aasociated with the development of the city andthrough traffic movements. The details of transport policies and develop-ment in the city are examined in paras. 34 to 38.
Petaling Jaya
10. The present urbanized area of Petaling Jaya encompasses the newtown itself (with a population of about 90,000 persona) as well as thedeveloping town of Stmgei Way-Sabang directly adjacent to the northwest(15,000) and a number of urban aettlementa to the south (30,000). PetalingJaya town has approached completion and gross population densities averageabout 20 p.p.a. The developing areas to the northwest and south are ofsomewhat higher densities. The residential areaa in Petaling Jaya containa wide range of houaing types though middle income housing is more heavilyrepresented than in Kuala Lumpur. Future lower and upper middle incomehousing development around Petaling Jaya town is ezpected to continue at arapid pace and by 1985 population may be about 1.7 times that at present.

ANNE 2Page 14
U1. Apart from State and Federal Government office- buildings,comnmercial devlopment in the area appears to be confined to that -required to serv local needs. Industrial development, however, issignificant and more than 300 factories with an estimated employmentof about 12,000 are located in Petaling Jaya town. An additional150 acre industrial site in Sungei Way-Subang is under development.Tbtal employment in the Petaling Jaya area is now about 44.,000.Increased industrial and commercial dvelopment are expected and totalemploymet may be about 1.7 times the present total by 1985.
12. The composition of estimated present internal transportmovement in Petaling Jaya town and its immediately surrounding develop-ment is summarised in Table 1. Approximately 80,000 internal vehicleand 130,000 internal person trips are estimated to be made pe- day.Past rates of growth are not known but the population growth of thearea from about 40,000 to 140,000 from 1957 to 1970 is indicative.Zth the substantial completion of deelopmet within Petaling Jayatown, the urrent growth rate of internal travel is probably about 10%per annum. About half of existing movments cross the Federal Highway,a total of about 50,000 vehicle movements per day.
13. The internal travel pattemn within the Petaling Jaya area isgreatly influenced by the high proportion of external trips to and fromKuala Lumpur (see paras. 16 to 21). Only.about half of the resident -labor force works in the area, the renainder commute primarily to KualaLumpur. Conversely, nearly 40% of the workers employed in the areacommute from Kuala Lumpur. In total there are about 95,000 externalvehicle trips to or from the Petaling Jaya area, more than the number ofintemnal trips.
14. By 1985 the population and employment of the Petaling Jaya areaare expected. to be about 1.7 times the present level, much of the growthoccurring outside Petaling Jaya town itself. Travel movements are stillexpected to be dominated by a high proportion of external movements.Internal and external vhicle movements were forecast by consultants(para. 3.14) to increase by about 2.6 times with substantial growthin private vehicle use. Internal movements across the Federal Highwaywill increase accordingly while those on the Federal Highway will increaseby a much greater amount as development extends along it to the west.
15. The transport pattern within Petaling Jaya reflects the regionaldominance of private vehicle travel in addition to the somewhat greateraffluence of somecof its residents. It also reflects the consciousanticipation of the need for high standard road facilities to cater forhigh volumes of person and goods travel. The details of road developmentand transport in the Petaling Jaya area are examined in paras. 39 and 40.

ANNEX 2Pg 5
Kuala Lumpur - Petaling Jaya
16. Because of their physical prodimity and functional specialization,KRala Lumpur and, Petaling Jaya are highly interdependent in terms ofexchange of persons (mostly workers end ahoppers), goods and services.The continued growth of activities in Kuala Lumpur and Petaling Jayasiilar to those alrady existing indicates that future interdependencewin probably reinforce the present movement pattern between the twourban centers.
17. - The large inbound commuting movemnt into Kuala Lumpur thathas developed in the Federal Highway corridor i8 also common to the othercorridors of urban expansion in the metropolitan area and is reflectedin the rapid traffic growth on all road approaches to Kuala Lumpur, (seeTable 2). It has resulted from the combined growth of new jobs ingovernment, commerce and finance in the inner areas of Khala Lumpur whichis being promoted by government development incentives and the concentrationof new middle income housing in areas outside the Municipality of KualaLumpur where sufficiently plentiful and inexpensive residential land can beassembled. The Municipality is about to carry out a periodic review of itsstatutory land use plan and the Klang VAlley Study will assess thesepolicies. In the short term at least, however, the factors oontributingto a continued concentration of commercial development in and around thecenter of Kuala Lumpur and the expansion of new middle income residentialareas outside the city are not likely to be altered significantly and theexisting inbound movement pattern into and out of the city will !intensifyin all corridors of urban expansion.
18. The outbound portion of the cross-commuting pattern in theFederal Highway corridor has resulted in large part from the generalinability of the government and local authorities to create sufficientnew low income housing in areas of industrial expansion. The bulk ofthe industrial labor force must now be drawn from areas of modest olderhousing, much of which is located in Kuala Lumpur. Petaling Jaya doeshave a considerable amount of low income public housing, 2,000 units, butoccupancy is not dependent on job location in the town. Obviously moreindustrial worker housing could be constructed on the developing outskirtsof the town but with multiple worker households which predominate in theregion this might only aggavate the inbound comuting problem to KualaLumpur. As long as the outbound conmuting volumes are less than that ofthe inbound flow, transport facilities required for the inbound commuterscan be utilized with only a low marginal cost to the community. Acceptanceof such a reverse commuting pattern also allows the Government to economizeon new housing which is very capital intensive.
19. The composition of movements to and from Kuala Lumpur andPetaling Jaya is summarized by Table 1. The predominate flow of personsis of Petaling Jaya residents traveling to and from Kuala Lumpur, consistingof nearly 120,000 person trips per day; the reverse flow of Kuala Lumpur

ANNENT 2Page 6
residents amounting to- about- 72,000 person- trips per day. About 60%of the vehicle movemets are cars, which is equivalent to the currentnorm in urban areas of the region. Motorcycles comprise nearly 25%of vhiclular traffic, we11 above the regional norm. This results frowthe large outbound Kuala Ltuiuur to Petaling Jaya worker movement bymotorcycle, most of which in destined for the industrial: areas ofPetaling Jaya. Ban movements comprise about 2.5% of vehicle- volumes andtrucks about 12%, both near the urban norfs in the region. Despiterelatively low bus volmes, buses carry about 30% of persons travelingbetween Kuala LImr and Petaling Jaya and patronage has been increasingat about 6% per anmum. Rail movements botwen Kuala Lumpur and PetalingJaya are insignificant and. a total of only about 500 passengers per dayare carried to or from Kuala Lwupr on the Port glang line, less- thanhalf of which are boundt fbr Petaling Jaya.
20. The relative iMportance of the Petaling Jaya movement as-compared with other external Kuala Lumpur movements is shown in Table 2.Total movement in the southwest corridor from Kuala Lumpur- (excludingmotorcycles) totaled 90,000 vehicles per day, nearly 40% of all externalmovements fron Kuala Lupr. The Petaling Jaya-Ktiala Lumpur componentof this movemet (excludin motorcycles) totaled 64,000 vehicles per dayor more than 25% of all external Kuala Lumr movements. It remaina thedominant external movment to and from Kmala Lumpur. -
21. The transport pattern between Kuala Lumpur and Petaling Jayareflects the regional dominance of private vehicle travel, particularly-the extensive use of motorcycles by industrial workers conuumting toouter parts of the urban area. The details of related road developmentand policies are examined in paras. 34 to 40.
Xhaala Lumpur - Port Rlang
22. The regional activity patterns giving rise to through movementsbetween Kuala Lumpur and points beyond Petaling Jaya are associated withthe now town development of Shah Alam, Subang International Airport andPort Rlang (see Map 2). Shah Alam is 10 miles southwest of Petaling Jayaand is planned as the new Selangor State capital. It is to includesignificant industrial development and now contains more than 10 largescale factories. Residential development is presently insignificant.Subang International Airport is 5 miles west of Petaling Jaya and is linkedto the Federal Highway. The airport was built in 1964 and traffic hasincreased to about 1,500 passengers per day. Port Nlang is located 25 milessouthwest of Petaling Jaya and is rapidly developing. In 1970 it handledabout 2.7 million tmns of cargo.
23. The composition of through movements in the corridor betweenKuala Lumpur and Petaling Jaya is summarized in Table 1. Approximnately

ANNEX 2Pae 7
12,000 vehicles and 23,000 person trips are made per day. A veryhigh proportion of the vehicle movements, 17% are heavy trucks, about8% are light trucks, 58% cars and 17% motorcycles. The significantnumber and high proportion of heavy trucks is associated with movementsto and from Port Klang and the developing industrial areas of Shah Alam.Total road movement generated at Port Klang is not known but more than5,000 persons are employed at the port and about 500 heavy trucls perday take on or discharge cargo. At presents about 75% of import tonnageand 60% of export tonnage at the port is carried by road and the roadproportions of both are increasing. Forecasts indicate an averageannual increase in Port Xlang throughput of about 10-15% over thenext 5 years. The present development of port facilities to handle anestimated 1,000 containers a week by mid-1973 has raised the possibilityof significant future container movements by road and rail betweenKuala Lwupur and Port Klang.
24. Road traffic generated by activities at Subang InternationalAirport averaged about 4,000 vehicles per day in 1970, almost all ofwhich is destined for Kuala Lumpur and points beyond Petaling Jaya.Provisional forecasts for passenger, air freight and air mail volumesat Subang Airport suggest that each air traffic cooponent may approximatelydouble by 1975 and double again by 1980. Correspcnding increases inroad traffic to the airport can be anticipated. Continued urban expansionin Shah Alan and other smaller developments between Khala Lumpur andKlang will also add to future through xoveuamts of persons and light goodsin the corridor.
25. The transport pattern between Ktiala Lumpur and Port Klangreflects the dominance of road transport which prevails in the regionthough the single track rail line carries about one-third of Port flangtonnage as well as a significant proportion of bulk goods to industrialplants along its right of way. The details of road and rail transportdevelopment between Kuala Lumpur and Port Klang are examined in para. 41.
D. Transport Policies and Development in the Region
Transport in the Region
26. The present magnitude and pattern of person and goods movementin the region reflect economic growth and urban expansion as well as thegeneral absence of significant transport constraints in the form of grosslyinadequate facilities or severe restraints on the use of any availablemode. Under such circumstances transport users have demonstrated a markedpreference for road based passenger and goods transport and road movementspredominate in the region. Road transport in the region is examined inparas. 28 to 41.

ANNE 2Page cJ
27. Rail in significant for Tegional as wn1 as inter-regionalbulk goods flow but its present impact on overall goods and passengermovements in the region is quite limited. The present minor role ofrail in accmodating and influencing regional travel movements willcontinue ulesa deliberate attempts to transfer goods and passengersto rail are made. This is not likely to be the case- until such time aslengthy camxter and other porsan movements eventually develop in theregion. Eve in the long term, road transport will remain the dominantmeans of trasport and the determinate of major travel patterns. Railtransport in the region in eam1ined in paras. 42 to 46.e
Road Transort Developmnt
28. The profera oft transport users for road based travel andthe growth of populationt and economic activity has led to a rapidincrease- in the number of motor vehicles available for person and goodsmovement in West Malaysia and the region (Tables 3 and 4). Taxes andliewse fees on vehicles and tams on motor fuels are levied atconstant high rates throughout West Malaysia. on-rent estimatedcombined yields of thes taxes in West Malaysia and the 1lang Valleyregion are shown in Table 5. The bulk of revenues are derived fromannual,road tax fees (based on the engine size of cars, a flat rate formotorcycles, the gross perizitted, loaded weight of trucks and permitted,passenger capacity of buses) and the recently imposed (1970) domesticduty levied an the ex-factory value of locally assembled vohicles (atthe rate of 25% for cars, 20% for motorcycles and 15% for trucks andbuses). Import duties are ufficiently high to eliminate significantimportation of all bat specialized motor vehicles and revenues arecorrespondingly small. Present car ownership and use taxes are designedto extract high revenue from car owners but are not intendedspecifically to limit either ownership or use. The government issensitive to the immediate needs of maintaining high revenue yields andof gradually expanding the market for local car assembly plants whichhave surplus capacity.
29. Automobile registrations in the region totaled about 70,000 atthe end of 1970 and are increasing at the current rate of about 10% perannum (Table 4). Motorcycle registrations totaled about 70,000 and areincreasing at a rate of about 15% per annum. Although current levels ofcar and motorcycle ownership in the region exceed West Malaysian averages,the rates of increase for both are comparable to those for Wbst Malaysiaand are declining. WLth a population increasing at an expected rate of3.3% per annum, however, the number of cars and motorcycles in the regionare expected to increase to more than 160,000 f .7 % per annum) and190,000 (6.9% per annum) respectively by 1985 unless present ownershippolicies are significantly altered. At present there are about .28 carsand .29 motorcycles per household and probably about 45% of households havesome means of motorized private transport. By 1985 there would be about.48 cars and .57 motorcycles per household and probably about 80% ofhouseholds would have some means of motorized private transport.

AXNNEX 2Page 9
30. Despite the possibly high future level of private motorvehicle ownership there will be an increasing number of householdsdependent on public transport as the sole or primary transport meansavailable to the majority of their members. The number of householdsin the region without a car or motorcycle or owning only a motorcyclevill increase from about 150,000 to about 200,000 by 1990. Bas serricesand patronage are increasing in the region and the number of buses inthe period 1965-1970 increased from about 800 to 1,400, an averageincrease of about 11% per annum. More than 800 of the present fleetare operated by public bus carriers and the increases in this portionof the fleet over the period represents an investment on the order ofM$ 10 million to M$ 15 million. The regional taxi fleet is alsoincreasing at a rate in excess of the Wbst Malaysian norm, about 12%per annum. Steady expansion of bus and taxi fleets at somewhat lowerrates is expected if present transport policies continue, though revisedpublic transport policies could result in more rapid expansion of busservices and fleets (see para. 3.07).
31. Nationally, the lack of enforcement of regulations as to theuse of the only type of readily available road transport permit (thatavailable to vehicle owners for the exclusive haulage of their own goods)is considered to have led to the widespread misuse and disproportionategrowth of that type of permit and of an excessive growth of the truckingfleet as a whole. The validity of this assessment in the region had notbeen examined in detail but it is clear that the need for fast andflexible service over short distances can only be provided by truck. In1970 there were more than 17,000 trucks registered in the region, nearlyone-third of the West Malaysian total. Their numbers are increasing atmore than 7% per annum, a rate higher than for Wbst Malaysia as a whole.With no major changes in the operating environment of commercial roadvehicles the number of trucks could be expected to grow a slightly lowerthan present rates. However, due to a 65% increase in the average sizeof heavy trucks anticipated by the feasibility study consultants(from 6i to 11 tons) this type of vehicle will increase at only about3% per annum in the next 15 years or so. Anticipated changes in roadtransport licensing procedures could also result in greater increases intruck haulage and the vehicle fleet than would a continuation of existingpolicies (see para. 50).
32. There are more than 750 miles of public roads in the Elang Valleyregion (Table 6), about half of which are federal and state roads. Duringthe period 1966-1970, regional road investments were curtailed and deferreddue to the Transport Development in Malaysia atudy then in progress (seeAnnex 6, para. 3). Regional road development expenditures amounted toonly about M$ 30 million (Us$ 14.3 million) and maintenance about M$ 18million (TJS$ 6.4 million) (Table 7). The bulk of road developmentexpenditure was made on federal and state roads, though some of this -espenditure was made within local authority areas. Total local authorityroad development expenditure is not known but the significant expenditureswere made in Kuala Lumpur (M$ 4.2 million (US$ 1.5 million) of which

ANNEX 2
M$ 3.4 million was Federal grant) and Shah Alam (M$ 4.0 million) where25 miles of new road and two major grade separated intersections werebuiUt as a part of the new town development scheme. In the 1971-1975period of the Second Malaysia Plan regional road development expendituresare estimated to be about 1$ 210 million (US$ 75 million) (excludingsmall amounts of local authority and private developer road investments)and maintenance ependitures (excluding small local authority outlays)are estimated to be about M$ 25 million (US$ 8.9 million). The largeincrease in road development expenditure is associated with previouslydeferred and newly planned improvements of federal roads approachingKuala Lusnpur, including the Federal Highway outs 2 from Kuala Lumpurthrough Petaling Jaya,, Route 2 northeast, and Route 1 north and south (see Hap 3).
33. Total motor vehicle tax revenues in the region are estimatedto have totaled about, 3,400 million over the period 1966-1970 (Table 5)more than eight times the accountable road expenditures. Asuming nochanges in motor taxatiom rates, regional revenues might be expected tototal more than M$ 650 million (US$ 232 million) over the 1971-1975 period,more than two and one-half times the projected road expenditure. Despitethe overall road revenue surplus in the region, the structure of existingroad user charges does not have the intent or effect of ratioming scarceroad space or causing shifts in the modal distribution of travel whichmight economize on facility requirements. The need for more flexible andresponsive tranaport tas and other user charges such aa fares and parkingcharges an elements of an overall policy for the region is apparent andwill be one of the major issues to be investigated in the cours of theUrban Transport Policy and Planning Studies which would be included inthe proposed project (seo paras. 3.08, 4.05-4.06).
34. Road development in the region has been loosely related tounofficial outline network development plans. Actual implementationpriorities within the plans depend on the availability of funds,comparative congestion levels and the Jurisdiction of the implementingagency. Within Kuala Lumpur, the Municipality has attempted to developand improve facilities consistent with the network recommended in a1963 KuAla Lumpur Transportation Study but lack of funds have forced itto concentrate on short term improvements to relieve current bottleneckswhich might inhibit the desired pace of investment in office and retailspace in the city. The Federal PWD has had more funds at its disposaland has concentrated on new facilities to facilitate "through" traffic.The actions of both agencies have served to upgrade and rationalize theprimary road pattern in Kuala Lumpur which consists of 8 major roadsradiating from the central commercial area and a partial ring road 2 milesfrom the center (Map 3). Recent road improvements have not done much tosupplement or improve the few through roads that exist in the center andcirculation is achieved via circuitous routing through narrow one waystreets with closely spaced intersections. The poor road system in thecenter particularly affects the operational efficiency and allowable sizes

ANNEX 2
of buses and can be ccnsidered a major obstacle to the improvement ofthe quality and capacity of bus services. The infrequent crossings ofthe flang and Gombak rivers are also severe traffic bottlenecks aboutwhich little has been done.
35. The adequacy of existing road facilities in Kuala LImpur havenot recently been measured in tem of travel speeds or delays but it isapparent that congestion has yet to become a critical travel deterrent,though it is beginning to pose an important operational problem for peakperiod bus services. Wlthin the central commercial area, circuitousrouting and close spacing of intersections impose considerable travel timepenalties on traffic even when volumes are low and at peak periods veryconsiderable delays frequently occur. However, because the center islimited in sie and the radial routes on its periphery are still notgrossly inadequate, orerall travel times to the center even in peak periodsare quite tolerable. The ability of the inner-city road system to albsorbadditional traffic resulting from increased private car use or from moreintensive devlopment is, however, limited. Present transport policiesdo not adequately face this problem and elements of the proposed UrbanTransport Policy and Planring Studies are intended to remedy the situation(see paras. 44o5-4.06).
36. The central conmercial area contains about 6,000 parking spacesincluding 2,000 on public streeta and alleys, 900 in public parking lotsand 2,300 in private parking lots. Almost all on-street spaces in thevery center have been removed as one of the few available means to increasethe capacity of the limited road system. Most private spaces are reservedfor building occupants and are used by commuters, often without directcost to the individual. Public spaces are available on an unlimited timebasis and hourly rates are so low (US 7 to 8 cents) that many spaces areoccupied by long teon parkers including commters and spaces are noteffectively rationed. Despite these parking supply problems in the centerit is probably still true that parking does not yet act as a significantrestraining influence on cpar use and in most cases cars are still able toprovide extremely convenient door-to-door serice. Present developmentregulations require substantial ---site parking provisions in new buildingsand seem to be intended to perpetuate the present convenient automobileaccess to sources, of,trave "Iedand but developers find it difficult tocomply with the required provisions.* There is doubt as to whether thepresent standards are technically, financially and environmentally feasiblefor the likely pattern of new commercial development and whether the amountof parking which could be so created would be in balance with the capacityof the future road system. The unresolved aspects of parking provision anduse in the inner city are proposed as the subject of one phase of theproposed Urban Transport Policy and Planning Studies (para. .05).

ARM 2
37.. Ba services within and to Kuala Lumpur are provided by- -nim private ban companies and other services in the region are providedby an additional five carriers. The Sri Jaya Transport Company wbichoperates nely afll the internal romtes of KDala Tnr and PetalingJaya carried about 70. million paasngers in 1970 While other companiesoperating regeoal. services into Kuala Luiipr carried approximately 85millio pasgers. Bus travel on Sri Jaya services within Ka la Lmpur(about two-thirds of the total) has not increased beynd 1s3 millionpassegrs per annum since first reaching_that level in 1966 but thereare indcations that the volumes of Kuala Lupur passengers carried byother companies are increasing. Baa f-rea are proportional to distanceand have remained contant at their present level of about US 1.3 centsper mile sic World- War II., Despite this low historic fare level allcarriers serving KuwY Lmpur have maintained profitabilitr in face ofrislng equipment, operating and-tax costs. Present termifal facilitiesin Kuala Lumpu are inadequate and routing ant acesso are also in needof considerable imprvnt. These aspects of public transport as wellas the potentiaL role of rail public transport, are includd as one phaseof the proposed Urban. Transport Policy and Planning Studies (paras. 3.07?,4.05-4o.06).
38. The future development of transport in mals Lur has notbee. recently studied and the recaondations of the 1964 Kuala- LwmrTransportatiom Study are. no laner fully releant. The road investmentproposals of that studyt totaled M$ 161 million (US$ 57.5 mllion) tbrough1983. The Municipality anI Federal PWD have completed some sections ofimprovement but implemntatim is well behind the recammded schedule.However, rights-of-way reservations for the Vstem are continuing to beprotected and the pattern of improvemets envisioned by the study willlikely be the basis of future road developmnt. The Municipality does nothave an overall transport development policy related to its own land usepolicies or to regional influences on the city. Neither does it havecomplete control of transport developmet in the city. Considerableemph"a ill be given to the problems of Kuala Lumpur's transportorganization, facilities and user policies during the course of the flangValley Study. In the mantime it is obvious that continued concentrationof comaercial development in and around the center of Kuala Lumpur andthe expansion of new residential and industrial centers outside the citywill intensify the existing road based movement pattern-into and out ofthe city. It is also clear that fuitwer traffic engineering measures and roadinvestments may be required and shos2A be examined along with public trans-port and urban transport policies by detailed studies such as those proposedin the Urban Transport Policy and Planning Studies (paras. 4.05-4.06).
39. The road system in Petaling Jaya town is highly developed withlocal roads connecting with a circular pattern of collector roads bringingtraffic to 5 intersections on the Federal Highway. The present system wasdesigned and implemented in conjunction with the development of the new

ANNEX 2Page 13
town. Roads being developed in the surrounding areas to the northconnect into this system while those to the south connect with JalanXlang. Apart from problems of crossing the Federal Highway, thesystem in adequate for considerable increases in traffic. Similarly,related facilities such as parking are adequate for present require-ments and no controls presently exist. Buses operate on most of thecollector roads and some local roads and the patronage withinPetaling Jaya town is increasing. Since 1963 Sri Jaya Bus Companyhas expanded its routes from 12 to 43 and the size of its bus fleetfrom 86 to 185, mainly to increase its services to newly developingareas in the Petaling Jaya area.
40. Construction of local access and connecting roads in thenew areas outaide Petaling Jaya town will be required to accommodatesome of the future movement but facilities with the town itself areconsidered generally adequate without major improvement. The Sri JayaBus Company has successfully extended its services to newly developingareas around Petaling Jaya when they are still in the early stages ofcompletion and the company has plans to further extend services asdevelopment proceeds. Means are needed to develop and sustain bustransport services to meet the demands of those without private meansof transport and to meet the requirements of an alternative transportmode for persons who may be divertedfrom private vehicles by means ofpolicies and measures to be identified in the Elang Valley Study and theproposed project studies of urban transport. Otherwise the existinginternal road system of Petaling Jaya and the improvement of the FederalHighway should be sufficient to meet future transport requirements withoutextensive transport policy revision.
41. Continued urban expansion between Kuala Lumpur and Port Rlangwill add considerably to through person and goods movements in thecorridor. The present dual 2-lane roadway of the Federal Highway betweenPetaling Jaya and Port Klang will be adequate for most of its length fora considerable time, however, as grade separated intersections to theairport and within Shah Alam already exist. Within Klang and Port Rlangproposed improvements and bypass sections estimated to cost on the orderof M$ 25 million (US$ 8.9 million) have been proposed by the Federal PWD.Aside from bulk goods movements, the parallel rail line will not be afeasible alternative for goods and person movements for a considerableperiod (see paras. 45, 46). The major concerns for transport policy inthe corridor will be development of adequate bus public transport serviceand the location and design of connecting facilities to the FederalHighway. Most of these issues will be addressed in the Klang Valley Studyand the proposed project studies.
Rail Transport Development
42. The rail network in the region consists of the single trackwestern main line of the national system (extending from Singapore in thesouth to Padang Besar in the north where it joins with the State railways

ANNEX 2Page 14
of Thailand, Map 1) with short branch lines from Kuala Luur toPort Klang (28 miles), to Apang (6 miles) (Map 2) and sub-branchesto Market Street Station, Sultan Street Station (Map 3) and toBatic Caves (Map 2). !ich of the goods traffic in the region consistsof medium and long distance through movements to and from the ports ofSingapore and Klang. Most trains except unit trains of petroleum,clinker, iron ore, timber and liquid chemicals are re-assembled as theypass through Kuala Lumpur. Traffic through Kuala Lumpur is nearingthe capacity of the centrally located yard and a new outlying site on thesouthern main line is under active consideration. Workings on thePort Klang branch line are also nearing the capacity of the single trackline and scheduling is very tight. At present there are 16 dailypassenger train moaements (each train consisting of a one or two unitdiesel-electric car with a ma3mum seating of 60 or 120 persons) and12 goods train movements along the length of the line as well as 6 limitedgoods shunting movements.
43. In the period 1966-1970, major investments in trackage of aboutM$ 900,000 were made within the region (Table 8). The doubling of trackbetween the Port Klang and Salak South junctions (M$ 595,000) removedan operational bottleneck for movements to and from Kuala Lumpur on thesouthern mainline. The investment in sidings on the Port Klang branchline (M$ 328,000, of which over two-thirds was at the expense of theSelangor State Development Corporation and individual factory owners)was to improve access to developing industrial areas and to reduceswitching bottlenecks on the line. Operations in the region have alsobenefited from modernization of rolling stock and the addition of largercapacity diesel locomotives.
44. The present rail line between Kuala Lumpur and Port Klangpasses only on the periphery of the new towns of Petaling Jaya andShah Alam and the passenger stations in these urbanizing areas are noteasily accessible to residence or work locations. Only about 500passengers per day utilize the service, many of whom are the railway'sown employees who travel to and from work at special reduced seasonrates. The present frequencies of passenger trains are already viewedas a serious operating constraint for freight movements on the singlel±ne track as they take priority in scheduling and take up much of thepractical capacity of the line. A recent Malayan Railways report hasestablished that the short run marginal costs of the passenger operationon the Port Klang line are about M$ 215,000 per annum, more than fourtimes the annual revenue of M$ 45,000. The management is considering arecommendation to reduce passenger services to four peak period tripsdaily and is making a similar study of the Ampang-Sultan Street passengerservice.

ANN2 2Page 15
45. The volume of regional freight movements by rail has tendedto decline as a reasult of the capacity limits of existing tracks, thelack of existing sidings in industrial areas, the disinterest of newfactories locating near rail lines to camitruct sidings, the one totwo day terminal times for most movements through Kuala Lumpur andfreight rates not significantly less than those by road. Rail authoritiesare concentrating their efforts to develop rail traffic In the regionon better serving the growing bulk goods and medium, to long distancegeneral goods movements for which they can effectively compete with roadtransport. Improvement of these services on the existing line is consideredto be dependent on reduction of the passenger service frequencies. Forthe near future the goods traffic appears to have a reasonable priorityfor use of the Port Klang line.
46. In the period beyond 1980 when it may become desirable todouble track the Port Klang line for goods traffic handling, the greateruse and development of the line for passenger carrying should be re-examined.The shared use by goods and passenger traffic of any improved facilitywill still be difficult but by that time the claims of passenger handlingby rail msy not be so insignificant in relation to those of goods handling.
Transport Administration in the Klang Valley
4&7. rresent transport planning, policy making and administrationfor the Klang Valley region are carried out by a number of agencies atdifferent administrative and government levela. Road transport is thedirect concern of the Economic Planning Unit (Epu), Ministry of Works,Power and Telecommunications (MOW), the Ministry of Communications (MOC)and its related regulatory body, the Road Transport Licensing Board (RTLB).Urban and inter-urban roads and related facilities in the region are alsothe concern of the Ministry of Research, Technology and Local Governmentand the Executive Council of Selangor State.
48. The EPU coordinates transport investment programs (see Annex 6).The MOW fully controls the Roads Division of the Federal PWD which plansand executes federal road projects. The MOC directs the Federal RoadTransport Department (which administers motor vehicle registration andcommercial licensing and provides staff support for the RLTB) and overseesthe relatively independent operations of Malayan Railways, theDepartment of Civil Aviation and the Port Blang Authority. The Ministryof Research, Technology and Local Government has ultimate control overthe administration of the Kuala Lumpur Municipality which haa its owntraffic engineering and land use planning departments. The ExecutiveCouncil of the State of Selangor exercises control over the State PablicWorks Department (which initiates some road projects), the StateDevelopment Corporation (which has complete development and administrativepowers in designated areas), the administration of all towns in the stateand the disposition of state lands throughout the state (see Annex 1).

ANNEX 2
49. Following the recaomendations of the study TransportInvestment in Malaysia; planning units were established in the MOWand MOC in order to assist in the development of a coordinated systemof transport planning end policy making. However, the units have todate only achieved a very modest technical role as the result ofstaffing and other problems and in any case the unita alone were notseen as an effective means for coordinating the actions of the manyagencies involved in urban transport planning and policy making. TheEP iS effective in resolving major policy conflicts and projectpriority differences between agencies at the implementation stagebut conmm guidelines for policy and project initiation are oftenlacking.
50. The Governat and many of its agencies are presentlyconcerned about future urban transport development in the region andare in fall support of the examination of urban transport agencyorganizations and future facilities and user policies to be madeduring the course of the Blang Valley Study. The Government is alsopresently active in the examination of other aspects of the transportpolicy which may influence transport development in the region and inthe urban areas throughout the country. In November 1970, "The CabinetComuittee on Comunications" was established at the highest Cabinetlevel under the Chairmanship of the Deputy Prime Minister to eomine,coordinate and control the implementation of transport and communicationspolicies. The program of action includes (a) :eview of the road licensingpolicy, (b) restructurtng of road user charges, and (c) measures toencourage more participation of Malays in the road transport industry.The Government has started implementing proposals for amending the RoadTraffic Ordinance aimed at reconstituting the Road Transport LicensingBoard, under the chairmanship of the Minister of Transport, from a purelyjudiciary decision-making body to an economic and market oriented one.Other proposed measures are simplification and reform of the route andzonal licensing system and establishment of a national haulage corporationand a national container road haulage company. Also, with the assistanceof two uNMO advisers, data collection systems and transport policy workprograms are being initiated within the planning units of the MDW and MOC.
51. The separate actions of the several Federal and local agenciesinfluencing urban transport do not comprise a comprehensive or entirelyconsistent program. The Government is rightfully concerned about futureurban transport policy in the region and considerable emphasis will begiven to urban transport agency organization as well as future facilitiesand user policies during the course of the flang Valley Study and theproposed project studies.
April 5, 1972

ANNEY 2Page 1 rTABLE I
MALAYSIA
KUALA LUMPUR URBAN TRANPORT PROJECT
1AJOR COMPONENTSOF LANG VALLE;TRANSPORT PATTERN, 1971
KualaKuala Petaling Lumpur
Internal Internal Lunpur - Jaya - throughKuala Petaling Petaeng Kuala Petaling
Jaya Area Jaya= Lumpur/ Jaya
Vehicle Trips
Car/Taxi 212,000 54U,Ooo 17,000 35,000 7,000Mtorcycle 60,000 21,000 9,000 11U,000 2,000
10,000 1,000/ 1,000 1.,000 05
Light Truck ( 3,000 3,000 3,000 1,000Heavy Truck ( 34,000 1000 2,000 29000 2,000
Total 316,000 80,000 32,000 $22000 12,000
Person-Trips - Total
Car/Taxi 350,000 81,000 35,000 70,000 14,000Motorcycle 75,000 27,000 12,000/ 1o00o/ 3,000Bus 220,000 20,ooo4/ 25,000- 35,000- 600
Total 6 4528,000 0 72, _ 021000 00 23,000
Person Trips - Work
Car/Taxi 100.000 26,000 l14,000 26,000 3,000Motorcycle 35,000 10,000i 8,000 6,ooo/ 2,000Bus 70,000 8,Z ao 3,000
Total 205,3000 42,000 30,000 8,000
1/ 1971 Kuala Lumpur traffic data estimated from 1964 transportation study dataupdated by 1971 vehicle ownersbip and bus passenger data and mission estimates;order of magnitude accuracy only.
2/ Hom end of trip Kuala Lumpur.5/ Home end of trip Petaling Jaya.I/ Estimated from 1970 bus schedules and reported passenger volumes, order of
magnitude accuracy only.5/ Less than 500.
Soumce: Federal Highway 2 Feasibility Study (Draft), Freeman Fox & Partners,September 1971; Kuala Lumpur Transportation Study, R. Crooks, Michell& Peacock, Tippetts-Abbett-MCarthey-Stratton, 1964.
April 5, 1972

ANNEX 2Page 16TABLE 2
MALAYSIA
KUALk. LIMUR URBAN TRASPORT PROJECT
ROAD TR&UtI IN MAJOR CORRIDRS INh KUALA LUeUR
Average Daily Traffic (Eccluding Motorcycles)
1971.
Corridor: Road Amunt *
Northwest: Rouatw21
.r. SentiL 47,000 39.8
Northeast. Rou t z 29,000 12.2
East S. J.. axnqr/J. Auang 35,0O0 14.7
Southeast: Route 1 20,000 8.4
South: J_ Sumgoi Beni 17,000 7.1L
Southwest: Federal. Highway/IT Kang/
. ansaa. 90000 37.8
Total 100.0
Source: Mmicipality of Kuala Lumpur, Janmary 1972.
April 5, 1972

ANCNEX 2Page 19TABLE 3
MALAYSIA
KULALA LUNPUR URBAN TRANSPORT PROJECT
MOTOR VEHICLE REGISTRATIONS - WEST' MALAYSIA
Year Mbtorcycles Cars Taxis Trucks Buses Total
1960 49,056 92,217 44,252 28,922 2,722 117,169
1961 68,296 103,P149 4,337 31,083 2,908 209,773
1962 88,207 112,843 4,671 33,645 3,125 242,491
1963 112,086 124,651 5,036 35,637 3,332 280,742
1964 142,746 139,049 5,092 38,449 3,543 328,879
1965 175,842 154.,277 5,240 41,854 3,763 380,976
1966 214.,691 169,008 5,393 44,411 3,967 437,470
1967 251,529 182,447 5,558 46,502 4,234 490,270
1968 278,836 194,712 5,685 48,301 4,636 532,170
1969 312,686 213,247 5,9557 51,375 5,347 588,610
1970 350,049 231,539 6,715 55,823 5,932 650,058
Annual Average Growth Rates, % 2er annum:
1960-65 29.1 10.8 4.3 7.7 6.9 16.5
1965-70 214.8 8.5 5.1 6.0 9.5 11.3
Source: Road Transport Department, December 1971.
April 5, 1972

ANNEX 2Page 20TABLE It
MALAYSIA
KUAL LUMMR URBAN TRNSORT PFDJECT
MDTOR V1L3E REGISTRATIONS - SELAN5OR ST 21/
Year motorcycles Care Taxis Truks Buses Total
1960 13,171 27,785 776 9,119 649 51,500
1961 17,360 32,059 663 9,960 703 60x745
1962 23,033 35,989 774 11,058 755 71,609
1963 29,077 409449 B88 11,655 803 83,272
1964 35.,959 46,'2 920 12,72k 834 96,979
1965 43,305 52,504 997 14p234 890 111,930
1966 52,256 58,190 1,068 15,33k 984 127,832
1967 6i,640 63,796 1s099 16,432 1.,091 14 058
1968 69,340 69,732 1,110 17,368 1,201 158,751
1969 76,78k. .76,56 1,215 18,793 1,436 174,774
1970 86,506 82p,958 1,659 20,489 1,562 193,174
Ann&a1 Average Growth Rates-, % per annum:
1960-65 26.6 13.6 5.2 9.3 6.5 16.8
1965-70 14.8 9.6 10.7 7.6 11.9 11.5
1/ Ilang Valley Region registrations equal approximately 85% of Selangor Stateregistrations by Road Transport Department Survey.
Source: Road Transport Department, December 1971.
April 5, 1972

MALAYSIA
KUAIA LUfPUR URi9AN TRANSPORT PROJECT
REVENUES FROM MOTOR VEHICLE T&IATICt(Ns WHIMogll
1967 1968 1969 1970 1971
West Malaysia
Purchase Tax 24.6 16.9 19.8 40.9 39.3?/
Annual Registration 102.0 111.7 119.7 137.8 147.2
Other Road Fees 11.1 11.9 13.4 21.8 22.9
Subtotal 137.7 1140.5 152.9 200.5 209.4
Gasoline-/ 104.0 109.9 113.7 317.6 142.9/
W.esel Fuel 114.7~, 15. Y 16.52 18.0 20.03/
Total 256.4 265.8 283.1 336.1 372.3
flang Valey Region3/ 75 78 83 98 109
1/ Includes non-road use of gasoline.
2/ Treasurr estimate.
3/ Mission estimate, order of magnitude accuracy only.
Source: Ministry of Counications, January 1972.Treasury, December 1971. \JlH
A-pril 5, 1972

ANNEX 2
TABLE O
NALAXSIA
KUALA LUMPUR URBAN TRANSPORT PRJECT
I1LANOVALLEr 1DAD
Federal and State Roadsl/- 385
Municipal and Town Roads&/
Kuala Lunwpur I4nicipality 180Petaling Jaya. Town 125Shah Alam T25ELang Town 40other urban areas -
Sub-Total 7
Total 5
1/ Includes short sections of federal and state roads within immicipal].and town boaundazis not transferred to the local authority.
2/ EBccludes roads within private residential or industrial developmentsnot transferred to the local authority.
3/ Not availableyestimated to be small in relation to Toad mileagesaccounted for.
Source: Fedeal PWD, January 1972Kuala Lu=pur Mmicipality, Petaling Jaya Town Board,Selangor State Development Corporation, Klang TownBoard; November 1971.
April 5, 1972

AiREX 2Page 23TABLE 7
MALAYSIA
KUALA LIJMPUR UBBAW TRANPORT PsJBCT
KLANG VALLi R)AD CPBENDITURES, 1966-1970, 1971-1975
1966-1970 1971-1975!e'Development Maintenance-/ Development Maintenance-
Federal and State Roads 22.0 9.4 183.0 16.0
-1n cipal and Town Roads:
IKuala LuImur Municipality 4.22/ 4.1 23.33/ 4.3Petaling Jaya Town - 4/ 2.9 I 4/ 2.9Shah Alan Town 4.0 .6 7.0 1.1Klang Town 4/ - 4/ 1.0Other urban areas _4i
Sub-lotal 8.2 30.3 9.3
Total 30.2 17.9 213.3 25.3
_J' Estimated.
2/ Local authority maintenance expenditure estimated to equal federal roadmaintenance grant ~i M$4i,600/mile of road; actual expenditure may notequal the grant amount.
3/ Includes federal grant of MI 3.4 million during 1966-1970, M$ 6.6 million1971-1975.
4/ N4ot available, estimated to be small in relation to total.
Source: Federal PWD, January 1972Kuala Lumpur Municipality, Petaling Jaya Town Board,Selangor State Development Corporation, Klang Town Board;NTovember 1971.
Ppril 5, 1972

ANNIX 2PaVge 24TABLE 6
MALAYSIA
KEALA- LUMUR URBAN TRANSPORT. PPOJCT
Mk.JXR RAIL TRACKs INVSTMES; IN TL MUAN VALIE, 1966-1970
Investment InvestmentWy cy Others,
Malayan Public orType of Tnprovement Railways Private Total
Double trackcing of ia line,Port Klang Junction to SalakSouth Junction, (3 milesapproximately) : 595,0 59s,000
Two Service Sidings, PortKlang Line 92,000 124, 000- 216,000
Three Private Sidings, Portilang Line -- 12,000 112,000
Total 687, 000 923,000
1/ Selangor State Development Corporation.
Source: Malayan R-aPlwass, December 1971.
April 5, 1972

ANNEX 3Page 1
MALAYSIA
KUALA LUMPUR URBAN TRANSPORT PROJECT
1FLANSPORT CEARACTERISTICS IN THE CORRIDOR
1. In this annex, the consultant projections of travel demandin the corridor from Kuala Lumpur through Petaling Jaya are comparedwith figures from other selected cities and their method of relatingthese forecasts to road capacity of alternative improvements of theFederal Highway is explained.
2. The following cities were selected for comparison on thebasis of population, per capita income level and data availability.
Per Capita PopulationData Base Income (In Millions
Year city (In US$) of Persons)
1970 Kuala Lumpur 660 0.71990 Kuala Luwpur 1,1 1.31970 Caracas 1,600 2.11969 Singapore 800 2.1'1970 Bangkok 524 3.51969 Bogota 450 2.51970 Istanbul 429 3.0
a/ Estimated
A. Vehicle Ownership
3. Numbers of vehicles per 1,000 persons are compared in Table 1.Present ownership of private vehicles in Kuala Lumpur is similar to thatin Singapore and Bangkok. In particular, a high popularity of motorcyclesis conspicuous in these cities. Both Bogota and Istanbul automobileownership figures are consistent with their lower economic level while thefuture projection of Kuala Lumpur automobile ownership approachespresent levels in Caracas at slightly lower incomn level. Higher ownershiprates of motorcycles than automobiles is a unique characteristic of KualaLumpur.
B. Modal Split
4. The present modal split in the Kuala Lumpur-Petaling Jaya corridoris compared to other cities in Table 2. The modal split in Kuala Lumpurexhibits a comparatively high proportion of automobiles, a very highpercentage of motorcycle traffic and relatively low reliance on publictranait. It must be taken into account that Kuala Lumpur figure is for acorridor outside the central city, with a low population density (a density

ANNEX
only about one-third the average in Singapore, for example)* Evenwith this reservation, a greater predominance of private vehicle travelis only found in Caracas where the present income level is much higherthan that of Kuala Lumpur.
5. The composition of present traffic on the Federal Highwaybetween Kuala Lumpur and Petaling Jaya has been compared with that onRoute 1, the north-south arterial through Kuala Luwpur and is shownbelow:
Federal Highway - 1970 Route 1 - 197i/Southwestern Boundary Southern Boundary Northern Boundary
of Kuala Lumpur of Kuala Lumpur of Kuala Lumpur
Cars 63.0% 65.0% 6o.0%Motorcycles 23.5 14.5 18.2Buses 2.0 3.5 2.8Trucks 11.2 17.0 19.0
Though the composition is similar on each of the approaches to KualaLAumpur, the Federal Highway has a particularly high proportion ofmotorcycles which appear to serve as a substitute to bus transport for asignificant number of users.
C. Future Travel Forecast
6. In the comparison of the consultants' projection of transportdemand in the Kuala Lumpur-Petaling Jaya corridor with forecasts of othercities, the predominance of private vehicle travel is still notable(Table 3). The proportion of passengers traveling by bus is forecast todecline to about 18%, while that of motorcycles increases to about 20%.This suggests the need for encouragement of public transport in theKuala Lumpur-Petaling Jaya corridor (and other parts of metropolitanKuala Lumpur) to shift more transport demand towards mass transit asintended in proposed project financed studies (paras. 4h05-4.06).
7. The level of traffic forecast by the consultants in 1985 wouldbe 2.2 times the present level in terms of the number of persons traveling.The study on Route 1 (north-south arterial through Kuala Lumpur) shows the10 year growth factor of transport demand between 1970 and 1980 to be 2.8(south of Kuala Lwnmur) and 2.0 (north of KRala Lumpur), and between 1970and 1990, 4.9 and 3.2 respectively. The forecasts of both studies aregenerally consistent given roughly equal relative growth of tributarypopulations to respective roads.
1/ Malaysia Highway Feasibility Study, Route 1, Vallentine, Laurie & Davies,August 1971

ANNEt 3Page 3
8. In order to make comparisons of travel growth in otherselected cities, the absolute growth in teors of number of personstraveled is divided by population growth to obtain growth in travelper person. The growth factors in trips per perom for the 15 yearperiod (1971-85) in these cities is shoui below:
Kuala Lumpur-Petaling Jaya Singapore Caracas Bogota
Total Private Vehicles 1.7 1.5 1.7Cars 1.6 1.6 1.7Motorcycles 2.0 1.7'Ptxblic Trasit 0.7 0.9 1.1 1.3
Total 1.3 1.1 1.1 1.4
9. The comparison indicates a clos- similarity in each componentbetween the Kuala Lumpur-Petaling Jaya and Singapore forecasta. However,the ingapore growth factors are applied to a proset pattern with amuch heavier depedence on public transport (particularly due to areliance on "Jitney" taxis instead of motorcycles, Table 2) and theresulting transport patterns in the two cities are quire different.Caracas' forecast of per capita person travel is much lower, part of thereason being that it has already reached a level today which KualaLumpur will take 15 to 20 years to attain in terme of both per capitaincome and car ownership. The Bogota growth factors for total persontravel and car person travel are similar to those forecast in Kuala Lumpurbut greater use of public transit is reflected in the relative growth oftravel by that mode.
D. Results of Comparisons
10. The comparisons of present and future travel that are possiblebetween cities are necessarily incomplete in breadth and depth of treatment.The conclusions that can be usefully drawn aret
(a) The Kuala Lumpur-Petaling Jaya corridor hasfairly distinctive characteristics of modalaplit, with a high level of private vehicletravel, especially by motorcycles, and,conversely, a relatively modest proportionof public transport travel.

Page 4
(b) Although the ccnaultants' forecast of thetransport demand in this corridor wouldindicate an accentuation of thesecharacteriatics, their forecasts of eachoomponent of transport demand.are notinconsi:stent with those determined instudies of several other roughlycomparable urban are"a.
(c) Taking-these characteristics into account,the following special provisions areconsidered appropriate and 'Justifiablefor Inclusion in the proposed projects
i) :provion of exclusive cycle lanes.pra. 4.04);
ii) J.ncluaion of studies on public-transport end private vehicle uspolicies (paras. h4.05-4.o6);
iii) inclusion of a sensitivity analysisof foecast travel (a 20% reduction-or vehicle traffic) primarily inanticipation of possible improvementsin public transport (paras. 3.14, 5.03).
i. 'Capacity Restraints on Forecast Demand
1. Consultant forecasts of "basic" peak and off-peak traveldemand in 1975 and 1985 in the Duala lwmzur-Petaling Jaya corridor,based on the initial-assumption of travel conditions remaining as atpresent, were assigned to each of the alternative improvement schemesA through D and the "without" acheme (Annex 4). For each alternativethe basic peak and off-peak demand was allowed to vary according toresulting road capacity and congestion conditions in relation to anassumed travel time elasticity. After separate revision of peak andoff-peak travel demand based on travel time elasticity,each wasreassigned,travel times recalculated, demand revised, etc., until abalance between road supply and demand at representative peak andoff-peak travel cost levels were obtained. The resulting travelcharacteristics for each scheme are summarized in Annex 4. The extentof restraint in basic peak and off-peak travel demand is given in thefollowing paragraphs.
ANNM 3Page 5
12. Scheme A (dual 3-lanes with at-grade intersections): About25% of the 1975 basic peak demand and 10% of the off-peak demand wouldbe restricted by capacity limitations. About 55% of 1985 basic peakdemand and 140% of off-peak demand would be sappressed. Significanttravel restraint would occur aoon after 1975 even if the level of basicdemand increases more slowly as in the sensitivity analysis considered(20% reduction in the growth of travel demand up to 1985).
13. Scheme B (dual 2-lanes with all the intersections gradeaeparated): No peak or off-peak reatraint of basic demand would occurin 1975, but in 1985, about 25% of basic peak and 5% of off-peak demandwould be restrained by capacity limits. With the sensitivity analysisassumption of reduced traffic growth, peak hour restraint would be nearlyeliminated.
14. Scheme C (dual 3-lanes plus grade separation): Although nosignificant restraint of basic peak hour demand would occur by 1985,conditions would be just at the point where demand restraint would beginto occur. Reduced growth of basic travel demand would extend thissufficiency condition to beyond 1985, possibly to 1990.
15. Scheme D (dual 4-lanes plus further substantial improvement):No restraint of basic demand would occur even in 1985 and conditionswould not approach the point where restraint would begin. -
16. In Schemes C and D., the roadway sections and intersectionstoward the vest end of the project (opposite to Kuala Lumpur) showed morespare capacity than other sections. Upon further detailed analysis ofScheme C it was found that the improvements of three interaections (6, 7 and 8)to the western end of this project could be deferr6d tor about 5 years afterinitial construction. Therefore, these intersection improvements were excludedfrom the final scheme adopted (see para. 4.09 and Annex 4 paras. 5, 6). Theeffect of these deferrals would be to ahorten the time at which capacityrestraint would occur on the implemented portiona of Scheme C. By the early1980's significant capacity, restraint could occur at the grade level inter-sections 6, 7 and 8 with expected growth in demand, by about 1985 with reducedtraffic growth.
April 5, 1972


MALAYSIA
KUAIA LUMIR lJDflA TRASPORT PRIJECT
NUMBER OF VEHICLES PER 1,OOO PERS(IS IN SELECTED CITIES
CommercialTear Cty Pivate Car Motorcycle Tad Bus Vehicles
1971 KIMala Lumpuri/ 44.0 48.0 1.0 1.0 12.6
1970 Caracas 95.2 7.2 o.6 Y
1969 Singapore 40.5 30.5 2.7 1.0 9.5
1970 Bangkok 143.3 22.3 2.6 1.2 114.2
1969 Bogota 22.0 3.6 1.4 1s
1970 Istanbul 14.5 2.2 5.3 1.0 11.9
1990 Kuala Lumpur 8Projected / 88.0 110.0 2.0
1992 Singapore 126.4 30.5 12.8
I/ Selangor State; separate KXala Lumpur data not available.
2/ Not available.
Sources: a) Bogota - Transport and Urban Development Study, Phase I, Vol. III, Table 9.1b) Bangkok Transportation Study, Office of Metropolitan Traffic Planning, pp. 87.c) Feasibility Study of Istanbul-Ismit Expressway, Sauti Consulting e
Engineers, Tables 4-2-3-8 and 5-2-la.d) Singapore, The UN Urban Renewal and Development Project, Part Two,
Surveys and Analyses, pp. 32; Part Three, Planning and Transport, pp. 36.e) Demand Estimation for the Caracas Metro, Summary Report, March 1970.f) Kuala Lumpur - Federal Highway 2 Feasibility Study (Draft),
- Freeman, Fox & Partners, September 1971.
April 5, 1972

MALAYSIA
KUALA LUMPUR URBAN TRAI&PORT PPsOJEGT
PRESE~ff NDDAL SPLIT IN SELETED CITIES(percent of total passengers)
Bang!rok IstanbulKuala Luupur- gMmorla Nain Approaches -lImit
Transport Yide Pet g jr y CaracJas SinBore Bridge to Ontral Anixa t CorA1970 1966 T - '---.w-- *Xt 1- 1 fi 196F
Private car 46.9 45.6 26.6 22,1 29.0 16.7 -
TaxiV 5.0 18.3 47.o -10 12.6 2
Sub-total 51.9 63.9 48.3 26.1 36.0 29.3 30.8
Hotorcycle 13.1 8.5 5,0 5.0
Bus 34.6 35.5 42.4 68.9 59.0 70.7 63.9
Commercial Vehicles - 0.6 0.8- -
Total 100.0 100.0 100.0 100.0 100.0 100.0 100.0
1/ Includes "jitney" or !pirate" taxis,
2/ Separate car and taxi data unavailable.
Source: See Table 1.
April 5, 1972

ALNEX 3Page dTABLE 3
NALAYSIA
KUAIA LUNPUR URBAN TRANSPORT PRIDJECT
PiD=CT)D YDDAL SPLIT IN 51LECTED CITIES(percent of total passengers)
Kuala Luwpur-Transport Mode Petng Ja Caracas Singpore Bogota
1965 1990- 1992199
Private car 57.h 45-50 33.6 19.2
Taxi' 5.0 -_ 25.1 13.7
Sub-total 62.4 2 58.7 32.9
Motorcycle 20.1 - 5.3 -
Bus 17.5 45-50 36.0 67.1
Comarcial vehicle. - - -
Total 100.0 100 100.0 100.0
l/ Includes "jitney" or "pirate" taxis.
2/ Balances of person travel not by private car carried by public transportconsisting of buses and taxis, separate proportions unavailable.
Source: See Table 1.
April 5, 1972


ANNEX 4Page 1
MAMYSTA
KUA LUMR URBAN TR&NSPORT PROJECT
ALTERNTIVE I POVRMT SCEEMEFOR THE FEDERAL H1iOWAT
A. Feasibility StudZ of Alternatives
1. The present highway subject to improvemnt is a dual 2-Jano,ldted ac ceas road. In the 5.7 mile project section from Jalan Brick-fields to Jalan Klang (South), there are nine edisting intersectionsat grade.
2. The feasibility study of the inprovement of the Federal Highwaywas carried out by Freeman, Fox & Partnorc fron March to September 1971.In the procesa of determining the mont appropriate scheme of improvement,the consultants examined four alternative schenes In detail. The fouralternatives considered were:
Schem A - a dul 3-lane roadway with nine widened intersectionsAt grade, (US$8 million).21
Schem B - a dual 2-lane roadway with each of eight remainingintersections grade separated (two existing inter-sections being cibined into cne new intersection),(US$17 million).
Schme C - a dual 3-lane roadway with dual 12 ft. cycle lanesbetween intersections Noe. 3 and 8 (Map 3) with eachof eight remaining intersection. grade separated,(US$26 million).:
Scheme D - a dual 4-lane roadway with grade separated intersectionsexcept between intersections 3 and 8 (see Map 3) whereit would combine a dual 2-lane through traffic viaductwith a dual 3-lane grade level roadway for local traffic,(US$35 million).
g/ Cost of construction, services relocation, design and supervision in-cluding 10% contingencies plus coats cf land acquisition. Cost con-tingencies incorporated in project coeta (para. hI.13) are 30% forconstruction cost and 10% for other project works conponents.

AINNEX hPage 2
For purposes of benefit co*putati4n, a Owith6utu situation was alsospecified. The "without* dit'i&tiob, defined is not a "do nothing" alter-native, but one which repreaenta inimiJ. necessary imtprovemnt of roadconsditent with restricted travel grdtth. The "without" scheme consistsof the existing road with widening of several at-grade intorsections in1973/74 and widening Of the ro84vsy to dual 3 lanes in 1979/80 (as SchemeA), total cost US$8.3 *illioft.jy
3. Consultant forecasts Of tratel demand for 1975 and 1985 based onthe initial assumption of future travel conditions aS at present were assignedto each of the schemes and were allowed to vary in relation to the resultingroad capacity and congestion conditions (see Annex 3). The eventual equili-brium achieved between de.and and road supply and the resulting travelcharacteristics for each scheme are summarized below:
1975 1985.
"Without" very, Significant capaditS restraint (Ifcproved to Scheme AScheme on forecast peak trtffic, sres standards by 1980)
capacity rest.int oil off-peaktraffic (critical capacity at bothintersectionS and on roadway sec-tions), long delays and lov speedsfor remaining traffic
Scheme A significant cap$city restraint on oxtrke capacity restraintforecast peak traffic (likiting on forecast peak and off-peakcapacity at intersections), long travel (limiting capacitydelays and low speeds for remaining at intersections), extremetraffic delays and low speeds for
remaining traffic
Scheme B adequate capacity for forecast significant capacity restrainttraffic, delays and speeds rela- on forecast peak traffictively unaffected by congestion (limiting capacity on roadway
sections), moderate delaysand reduced speeds for remainingtraffic
Scheme C adequate capacity for forecast minor capacity restraint ontraffic, delays and speeds rela- forecast peak traffic (limitingtively unaffected by congestion capacity on roadway sections),
delays and speeds relativelyunaffected by congestion
Scheme D adequate capacity for forecast adequate capacity for forecasttraffic, delays and speeds rela- traffic, delays and speeds rela-tively unaffected by congestion tively unaffected by congestion
1:/ Cost of construction, services relocation, design and supervision including10% contingencies plus costs of land acquisition. Cost contingencies incor-porated in project costs (para. 4.13 ) are 30* for construction cost and 10%for other project works components.

ANNEX 4Page 3
4. Benefits of increased travel and reduced travel costs werequantified on the basis of detailed analyses of the differences intravel characteristics of each of the schemes as compared against the%i'wthuut" scheme (Annex 7). The differences in the econcmic costs of
investment were then snt against the net benefits of alternative improve-ment schemes in internal economic return (IER) calculations. The IERof Schewe B was marginanly higher than Scheme C, but the additionalbenef6ts attribixtabe to Scheme C brought a mare than adequate returnon the additional I=tve3tlent required and the scheme also provided signi-Clcant non-qnantifiable advsntages. For These reasons, Scheme C, withminor modifications, was recamuended by the consultants at tvhe conclusionn,f their feasibility studies.!/ The alterations to Scheme C in the recom-r.ended scheme were8
(a) incorporation of cycle lanes ever the entire projectlength;
(b) simplification of the design of intersection No. 4.
The cost of the recomend¶d modified Scheme C was the same as the originalSchome C, US$26 million.t/
P. Schece C - Second Revision and Phasing
5. Further rei-vton= were made in mndified Scheme ;0 to adapt it moreclosely to the short term traffic needs while leaving soue flexibility forfutuire expansIn. These modifications consisted of (a) siuDlification ofinterchanges 2 and 5, and (b) postponement of the construction of gradesnppareted iuterchangen 6, 7 and 8.
6. Thoe revised first stage Scheme C waa eatimated to cost US$ 17.0millJon.1/y The addition of he three interchanges at a later date wouldcoct another US$ 2.? mnillion. 21 !' The estimated staging period would befive years and could be longer if new transport policies were particularlyeffective in reducing traffic growth.
1/ rederal High^way 2 Feasibility Study (Draft), Freeman, Fox & Partners,September 1971.
2/ Cost of construct±an, cervices relocation, design and supervisionincluding 10% contingencies plus costs of land acquisition. Cost con-tingencies incorporated ia pro.ject costs (paLr. l .12) are 30% forconstruction co3t .and 10% for other proJect works coiponents.
~/ This cost estiir.-es was based on prelimiinary engineering on a comparablebasis to the alternative schemes discussed here. Flowever, the detailedengineering led to revised cost estimates of US$ 29 million (para. 4.ll)which camnot. be comi.,4ed to the alternative schemea without an adjustmentfactor which would require detailed engineering of the alternatives.
4V Technical redesign of interchanges 6 and 7 has reduced their total costby 'US$ 03.9 mil116o. as compared with the costs based on preliminaryengineering in the ccnsultanto' z'easioility report.

:x as
7. Scheme 1 was also exai*hed ih detail f r poesible t6difidationswhich could adapt it toz*e closely 6' short tttrm needs. The originalSche*e B was altejtd by' the dele6±ot of, itersection No. 8, t4chnicalredesglgn of interchaftges o and 7 and addition of dual 12-foot cycle lanesover its entire 1 ngth. The cost of th6 revised :chs&4 was atprocimatelyUS$134.14 millidn.2/ It was niot donsidered feasible to eliminate inter-changes 6 and 7 as in first stage Sch ibe C because the dap&city of gradelevel intersections coupAtible with the dual 2-lane Schede b roadway wouldbe reached in a very short tiA6 interval.
8. The revisions and Vodifidatioih of Sdheae C and 8 have alteredthe bases of dothpatison between the driginal scheoes d6t out in the con-sultants f6aBibilUty-study including quantified a?d don'.quantified projectreturns. In both respects, the f±lrst stage Scheme C is shown to increaseits relati#6 advantages over other altAthatives. The quantified returnsexpressed in.revisod r-ites of return inheopdrating altered benefits and costsbased on revisiona Of Scheies C and B are6 duarized Tih paeabb. 5.02-5.o3.The non-quantified returns of the fiUst stage Scheme C over other alternativesincluding ihdified Scheme B are summariied in paras. 5.08-5.1O.
C . Dqscription of. $d Penat4ed_I4terOeetiois -
9. the firtt stage Sche C incot4orates a dual 34ian roadway with.'ive grade sparated intersietioms and thfee at-grade intersections. Daal
12-foot cycl lanes-*ould be indibrpoated in the section where the ±oadwayis provided Uith grade separated intersictions. A suplementary lane ineach direction would be provided betweeh intersections 3 and 5 (Map 3).
10, The design of the five grade deparated intersectionis is as follows:
Ihtersection No. 12 Jalan _ickf14ildS
The Ftderal Hinhwat' it- daried over a side road which west ofthe Federal Highway' crosses the Llang Riv-er on a new bridge on thesite of the existing trfiss bridib and e8at of the Federil Highwayconnects with an access r6ad 6b1+in properties bn the sodth sidoe ofthe Federal Highwa?. The Federal Highway ctbs5es abode the side roadbecause the level of the biidgt crobsing the ri*er dSteruines the levelof the side trad. Despite the fact that sdi" property de*olition eastof the Federal Highway is necessazry and that the terrain north of thebridge crossing is undulating, a required access road is incorporated.
1/ Cost of construction, services zSlodatidh, design and supervision including10% contingencies plmxs costS of lihd acquisition. Cost contingencies incor-porated in project costs (pOra. 4.13) are 30% for construction cost and 10%for other project works coniponents.
ANNEX 4Page5
Two curred ramps between the southbound carriageway ofthe Federal Highway and the access road and two straight rampsof diamond form on the west side of the Federal Highway caterfor turning movements between the two roads. Traffic lights areprovided on the access road to control right-turning movements.
Intersection No. 2 - Jalan Klang
The Federal Highway is carried through a wide right anglecurve to connect with Jalan Lornie. The extensions of JalanLornie to Jalan Klang and the Federal Higkway to the CAterSouthern Route are carried on two bridges over the curved sectionFederal Highway to a right angle junction. The Federal Highway -Outer Southern Route extension is bridged over the Jalan Lornie - JalanSlang extension and connecting ramps are situated in a diamondpattern. Traffic lights are provided to control vehicle movementsbetween the access rampe and the side road, Jalan Klang.
Intersection No. 3 - Jalan Pantai Bahru
This interchange is a diamond, the Federal Highway running atlow level beneath the side road. Traffic lights are provided onthe side road to control right-turning movements to and from theaccess ramps.
North of the Federal Highway, Jalan Pantai Bahru turns througha right angle on a new, improved alignment in order to connectfarther east with Jalan Bungsar. The present connection of JalanBungsar and the Federal Highway in between Intersections Nos. 2 and3 will be closed.
South of the Federal Highway, the side road is planned toconnect with a proposed road which will serve new development. Onlya short spur, a few hundred yards long, of the side road south ofthe Federal Highway would be built initially.
Intersection No. 4 - Jalan University/Jalan Gaging
This is a half diamond interchange, ramps being provided onlyon the east side of the crossing to cater for the major movements(to and from Kuala Lumpur). Flows to and from the west are cateredfor at the next interchange to the west. The Federal Highway runsat low level, a single bridge carrying the side road above it. Trafficlights are provided to control the right turns between the side roadand the access ramps.

ANNEX hPage 6
Intersection No. 5 - Jalan Timor/Jalan Utara
This is a diamond interchange catering for all movements.The side road ia carried on a bridge above the Federal Highway.
Traffic lights are provided to control right-turn movementsbetween the ramps and-the side road.
A4ril 5, 1972

ANN_ 5Page 1
MALAYSIA
KUALA LIPR URBAN TRANSPCRT PROJECT
MAINTENANCE STUDY AND ROUTE 1 ENGINE:RING
1. At the request of the Malaysian Gove=wmt, the projectincludes a study of roa4 maintenance operations and detailed engineeringfor Route 1 (aee para. 4.06).
2. The principal objectives of the study of road maintenanceoperations are to:
(i) recommend desirable aystem of route numbering androad mileage marking on which the preparation ofa road inventory would be based;
(ii) prepare a comprehensive inventory of the rosdalisted in the registers of the Federal and StatePublic Works Departments (FWD), and to recommenda desirable road classification system;
(iii) recomuend procedures for the continued updatingof the inventory so prepared;
(iv) study the organizations of the Federal and Stateagencies responsible for road maintenance, and torecommend, within the framework of the Constitution,the desirable structures of such agencies, givingspecial emphasis to coordinating responsibilitiesfor planning and execution of maintenance operationspresently divided between the Federal and 3tat.agencies;
(v) assess the type, condition and age of the roadmaintenance equipment at present in operation, and torecommend a desirable inventory of equipment tomaintain the highway network; to recommend a replace-ment and acquisition program to achieve this desirableinventory;
(vi) recommend how such equipment replacement and acquisitionshould be financed (e.g. hire charges, sinking fund, etc.);
(vii) recommend a simple accounting procedure for the costing ofroad maintenance operations; and
(viii) investigate the need for and to recommend mitabletraining programs for road supervisors, techniciansand equipment operators.

ANNEX page 2
The study's findings as agreed betwee the Government and the Bankwould be implamnted at earliest chances in future.
3. At the Govermentla request this project would providedetailed engineering for now conatruction and improvement of about137 miles of Federal Route 1 for which consultants completedfeasibility studies. Detailed engineering commenced in February 1972,and approximately 25% will be completed by the time of loan signing.Retroactive financing of the detailed engineering in a second highwayproject would involve an inordinately long finance period, and it istherefore recommnded that financing for detailed engineering ofRoute 1 be included in the present project, of which a portion notexceeding US$ 400,000 would be for retroactive financing.
April 5, 1972

ANNEX 6page
MALAYSIA
KUALA LUMPUR URBAN TRANSPORT PROJECT
THS HIGHWAY S2CTOR
A. The Highwa Network
1. Federal and State Public Works Departmens(PWD's) are responsiblefor 10,719 miles of roads in West Malaysia of which a highproportion 83%, are pavedEast Malaysia has a total of 2,238 miles of which only h07 miles arepaved. Roads are classified for administrative purposes as federal, state,and local authority roads. About 3,000 miles are federal and 7,000 state.Federal roads are main trunk roads linking one state to another or linkingports to the federal network, but there is no firm definition. Detailsof tyoes and mileage of Malaysian roads are presented in Table 1.
2. Road development is concentrated on the west coast of WestMalaysia reflecting the area's high proportion, 70%, of nationalpopulation (see Map 1). East Malaysia and the east coast of West M4alaysiahave much less well developed road networks. The road network in WestMalaysia has expanded from 6,500 to 10,719 miles or by 65% in the 16 yearsup to 1970.
3. The road network of the more populous west coast regions ofWest Malaysia is regarded as adequate for present needs although someupgrading and relocation of existing roads are needed to accommodatetraffic growth. The UNDP-funded study "Transport Development in Malaysia"ecmpleted in 1969 by Robert R. Nathan Associates, Inc. (U.S. consultants)came to the same conclusion. During the period of the study the Governmentlimited investments in the sector, but after its completion the level ofcommitments increased substantially. Federal investment in roads andbridges in West Malaysia for the Second Malaysia Flan period (1971-1975)is programmed at a level more than three times that of the previous fiveyears. Details of investment in road construction and improvement appearin Table 2.
It. Apart from one 15 mile section of toll road on the main routenorth of Kuala Lumpur (an alternative route, 12.5 miles longer isavailable), the use of public roads is normally not restricted. Vehicleweights, dimensions, and loads are controlled by the Ministry of Communications(MOC) in accordance with 1958 Traffic Ordinances. The axle load limitis 8 long tons and gross weight is limited to 14 long tons for 2 axles and18 long tons for 3 axles. Trailers and semi-trailers are permitted, andmaximum.. total length is normally 30 feet. Vehicle width is limited to7 feet 6 inches unless a special permit is granted. As container trafficrequiring 8 foot width is imminent, the Government should consider revisingthis requirement.

ANNEX 6Page 2
5. Eaforcement of vehicle loading is also the responsibility ofthe MOC, but the enforcement staff is small (only 20 people). Only5 weigh bridges are available for the entire country, and these arelocated away from the main roads. Overloading is frequent especiallyin timber transport.
B. Highw Administration
6. Re.poftsibilit47 for h±gYa y administration is divided betweenthe Ministry of Communications (MOO) and the Ministry of Wrks andPower (MOW). The MOC is responsible for licensing, registration, andregulation. The MOW is responsible for construction and maintenanceof federal roads and for allocation of maintenance funds for stateroads. The Federal P1D ia reaponsible to the MOW for these activities.Each of the 11 state PWD's in Nbst Malaysia is autonomous but administersall federal road construction and maintenance work outside Kuala Lumpuron an agency basis. Separate PWD'. in Sabah and Sarawak administer roadsin East Malaysia.
7. The Federal PWD is organized under a Director General anrdtwo deputy directors general fot development and engineering services(see Chart l).The Deputy Director General for Development controls fiveoperating divisions (Roads, Armed Forces Works, Building, 'water Supply,and Education Works), and the Deputy Director General for EngineeringServices has four supporting divisions (M4echanical, Quantity Surveying,Electrical, and Stores). A Design and Research Division and an AccountinrgDivision report directly to the Director General.
8. The Roads Diviuion of the Federal PWD is administered bya director and has five sections: Implementation, Design, Planning,ProJect Coordination, and Federal Land Development Projects. TheImplementation Section is responsible for road improvements, minorroad projects, maintenance of all federal roads, road inventory, onequarry and a few other minor roads.
9. The Design Section is responsible for design of roadways butnot structures. Structures are designed by the Design and Research Divisionwhich reports directly to the Director General. The Planning Section(Highway Planning Unit) will be discussed below. The Project Coordinationand Federal Land Development Authorities sections deal with larger projectsto which engineers and other technical staff are seconded.
10. Although, because of individual cooperation, the organizationappears to function satisfactorily, responsibilities are divided. TheDesign Section can engineer roads but not bridges, the materials laboratoryis remote from the Roads Department, potentially.its largest customer andcontrol over road construction and maintenance equipment is maintained bythe Mechanical Department.

ANNEX 6Page 3
11. State Pablic Works Departments are organized in a similarmanner as the Federal PWID but with less specialization. A singleengineer may deal with water supply, electricity, buildings, andmaintenance as well as roada. Technical staff of the State PWD's arepaid by the State but are provided on rotating assignments by theFederal PWD. Directors of the State PWD's hold ambiguous positionsof dual responsibility to the Federal PWD and to their respectiveStates, where the State WIorks Committees and State Legislatures approvetheir budget. The FederalF PWD uses the State PWFD's as executingagents for construction and maintenance of federal roads outside ofKuala Lumpur.
12. the Roads Division of the Federal FWD has had until recentlya shortage of staf Y. Of 68 authorized positiona for engineers andtechnicians, 44 were vacant but have now been fIlled. This probleu arosein part from the difficulty of retaining engineers with governmentsalaries w.iFch were generally lower than thoae of the private sector andin part from alleged preferential treatment given to Malays at the expenseof other ethnic groure. The Governmcnt hired a vmuber of expatriateengineers on three-year contracts, all as technical assistance on abilateral basis. A new law is in preparation requiring local engineersto undertake two-year assignments with the Goverment after graduation.
C. Highway Plarning and Finance
13. Responsibility for highway planning is divided among theMinistry of Communications, the PID, and the Economic Planning Unit.The Transport Planning Unit in the Ministry of Communications isthinly staffed with 6 relatively new people, but they are receivingadvisory support from a Bank staff member on two year secondment tothe unit. The Transoort Planning Uhit has not been a significant forcein highway planning, but sone improvement is possible in the next twoyears.
14. The Highway Planning Unit in the Roads Division of the FederalPID was established in 1966 to provide counterpart staff for theTransport Development in Malaysia study. it continues to function andis assisted by a UJNDP-sponsored advisor, but it is not a fully effectiveinstrument of national highway planning. The Highway Planning Unit willshortly be moved outside of the PUD vrto a higher advisory level withinthe Ministry of Works and Power. With the proper suport, it could bea more sipi±icant force in the future.
15. The Economic Planning Unit of the Prime Minister's Office hasassumed some of the responsibilituy for highway planning, but the demandson limited staff preclude any thorough highway p'lanning effort beyondbroad budgeting considerations.

ANJErX 6Page h1
16. No special institutional arrangements have been made forurban highway planning or for highway planning in metropolitan Ku,l;ILumpur. The Project Coordination Section of the Roads Division(Federal P1D) has implemented a number of road proJects in Ku.alaLumpur, but its focus is short rather than long range.
17. Highways are financed from general revenues, and there areno earmarked taxes for use on highway construction or maintenance.Budgets are prepared arnually within the framework of the SecondMalaysia Plan. The federal highway budget is prepared by theDirector of Roads for the Director General of the PWD. It isreviewed and approved by the Economic Planning Unit on behalf of theNational Development Planning Council. State highway budgets areprepared by the Directors of the State PWD's and they are subject toapproval by the respective State Works Committees and State Legislatures.
18. 'The Second Malaysia Plia (1971-1975) allocates M$ 693.5 million(US$ 248 nillioh) or 9.6% of the nlatiohal budget to highway and,bridge con-struction and improvements and tost Of this amount will be Spent in WestMalaysia. The entire transport sector will receive M$ 1,188 million (US$ 424millior.) or 16.L% of the budget tot the five year period. Domestic andforeign borrowing will auplement general revenues as a source of funds forthis program.
"i9. gghway.,#giA6eering
19. Dbsigh statahidsd for f6detal roads have recently been revisedand brought up to dates and are gtnerally satisfactory. However,
design is baded oh thd legal t&tiuh= loading of 8 long tons on a singleaxle. Because of the overloading of vehicles still prevailing and thetendency to inerease the tr'ack loading capacity, the proposed maintenancestudy should eon*ider the advisability of increasing the axle load one unitfrom 8 to 10 long toi* in its review of vehicle weights and dimensions (seeAnnex 5).
20. Shortages of staff have led recently to the use of localconsulting firms for feasibility studies and design of smaller projects.Foreign consulting engineers have been engaged for larger ,obs and a feware currently operating in the country.
21. The Federal and State PWD's Own and operate 7 large quarries(1 federal, 6 state)from which most of the road network can be servedwithin a maximum haulage distance of 100 miles. In the absehce of naturalgravel, crushed stone is used for base and as chipping for the asphaltcarpet. Because of the high percentage of paved roads, large quantit,iesof chips are needed for the annual resurfacing and resheeting. Eachquarry has a capacity of about 1,000 cubic yards of crushed stone per da,y.They are properly equipped with modern equipment and are well run. Costaccounting methoda are generally adequate, but sometimes does not includedepreciation of plant.

ANNE 6Page 5
E. Highway Construction
22. The Roads Division of the Federal PWD is responsible for theconstruction of all federal roads. It assumes direct responsibilityfor executing federal road projects within Kuala Lumpur and for someother particularly important projects as the department's implementationcapacity permits. Construction of other federal roads is done by theState PD's. About 90% of all roadworks excluding structures are doneby force account using the Federal and State PD's own equipment andpermanent work force. The Federal and State PWD's have about 1,600pieces of heavy construction equipment and a tenured labor force of about40,000 full-time workers; about 1% of the national work force. Withthese resources the total departmental capacity for road construction isabout M$ 100 million a year (US$ 35.7 mdllion). Although the utilizationof the Federal and State ND's permanent labor force, its equipment andexperience are strong reasons for continuation of force-account work, theGovernment recognizes the need to foster a road construction industry tocarry out an increasing volume of new conatruction and to eventually becapable of competing for international contracts.
23. Competent local contractors build about 95% of all concretestructure work, and local earth moving firms are being encouraged toecuip themselves better for compaction operations. The Bank's SecondFighway Project should provide opportunities for this new industry tobe awarded contracts of a size suited to their financing and capabilities.About 40 local contractors are prequalified for highway structures andabout 10 for minor roadworks.
F. Highway Maintenance
2h. Federeal roads are maintained by the State PWD's using fundsprovided by the Federal Government. Actual work is carried out by 49district offices within the State PWD's, and the total road maintenancela-bor force is about 7,500. There is no special maintenance divisionwithin the Federal PTD, and maintenance issues are handled by the Imple-mentation Section along with its many other activities. Similarly theSta.ate P.D's have no special maintenance units, and the work of eachengineer is a mix of different tasks determined largely by current workloadPnd immediate needs.
251. Funds for maintenance of state roads come from the FederalGovernment and are allocated among the States according to an arbitraryand inflexible mileage basis, regardless of actual maintenance costs.According to constitutional provisions, the National Finance Councildeterinines the rate at which such funds are allocated. In 1970 thisr:n.te was raised to M$ hl,600 (US$ 1,640) per mile from M$ &,500 (US$ 1,600)per mile which has been in effect for over 10 years. These funds arechonrv-lled through the Federal PWD, but it has little direct influence on
itetU:Il use of the money. Control of the funds is limited to auditors oftht respective Stctes.

ANtJEX 6Page
26. Funds for maintenance of federal roads are budgeted separatelyand are not subject to control by the National Finance Council. As suchthey can be changed more easily, and the current level of expenditureis M$ 5,f600 (US$ 2,000) per mile of federal road. These funds aretransferred td the State PWD's which perform. road maintenance for theFederal PWD.
27. Costing of road maintenance operations is not recorded. Recordsof total expenditures by State are maintained, but not in detail.Thus, there is no firm basis to substantiate budgetary requests formaintenance allocations.
28. The central repair shop in Kuali Lumpur has am annual turnoverof about M$ 8 million (US$ 9.9 million) and 600 menx on its payroll. Itis capable of complete overhaul of 120 pieces of heavy equipment and200 rehicles a year. Cost accounting of the central shop (and of mostState shops) is based upon direct costs of each job with overhead allocatedamong jobs at 60% of direct labor. No attempt is made to includedepreciation of plant and equipment in maintenance costs.
29. There is no firm programming of road maintenance by the State-P''s. Repairs are done when 7isual inspection shows that it is necessary,and resurfacing is done whemthe cracking begins (every 4 or 5 yearsdepending upon traffic). Maintenance of shoulders and ditches is oftenneglected, and on some stretches there is no drainage provision. Ingeneral, maintenance has kept the road surface in satisfactory condition,but maintenance does not appear commensurate with the level of expenditures.A road inventory which should be the basis for effective road maintenanceplanning was first taken in 1S67 as part of the Transport Development forMalaysia study.
30. In order to identify accurately the deficiencies outlined abovein the ei4sting organization for road aaintenance, and to recommendimprovementa3 the oervices of a maintenance study by consultants isincluded in the prcj.ct. Dfltails of the study objectives are outlined inAnnex ,. he atudy's f.ndings as agreed between the Government and theBank would be implmeented at earliest chances in future.
G. EcuiDment Maintenance
31. Equipment for both ccnstruction and road maintenance is maintainedby the Mechanical Division of the Federal ?4D at the central workshop inKuala Lumpur (complets overhaul), by the repair shops of each of the State.,'Ds (replacement, of major assemblies and some overhaul), and by 40 districtshops (routine maintenance). The repair shops, especially the central shorpin Kuala Lumpur, are well organized, properly laid out, and well stockedwith tools and equipment.
April 5, 1972

ANNEx 6Page 7
MALAYSIA
KUALA LUMPUR URBAN TRANSPORT PROJECT
MALAYSIAN ROAD SYSTEM 1970(length in miales)
Subtotal SubtotalLocal West East
Federal State Authority Malaysia Sabah Sarawak Malaysia Total
Concrete surface 6 - - 6
Bituminous surface 2,636 4,490 622 7,748 - - _ _
Surface dressing 204 1,049 - 1,253 - _ _ _
Total pa.ved 2,846 5,539 622 9,007 131 276 4C7 9,4i
Waterbound macadam(gravel) b 131 - 135 - - - 135
Laterite surface 178 981 - 1,159 536 759 1,295 2,!Z5L
Earth roads 62 356 - 918 !, 12 536 0CJ
Grend Total 3,090 7,007 622 10,719 711 1,527 2,235 12,c57
Source: Federal FWfD, January 1972.
April 5, 1972

ANNEX 6
TABLE 2
MALAYSIA
KUALA LUMPUR URBAN TRANSPORT PROJECT
ROAD CONSTRUCTION AND IMPROVEMENT IN WEST MALAYSIA, 1966-75(M$ 0003,000)
Federal State Municipal Total
First Malaysia Plan(1966-70) 70.0 48.3 5.7 123.0
Second Malaysia Plan(1971-75) 600.o 27.7 11.6 638.3
Source: Federal P'.D, January 1972
Note: First Malaysia Plan figures are actual. Second malaysia Planfigures are those budgeted and planned, but the Govermment mayhave difficulty spending the full Federal allocation during theplan period. State and Municipal figures are for Federal grants.In some cases these grants are supplemented by locsi funds.
April 5, 1972
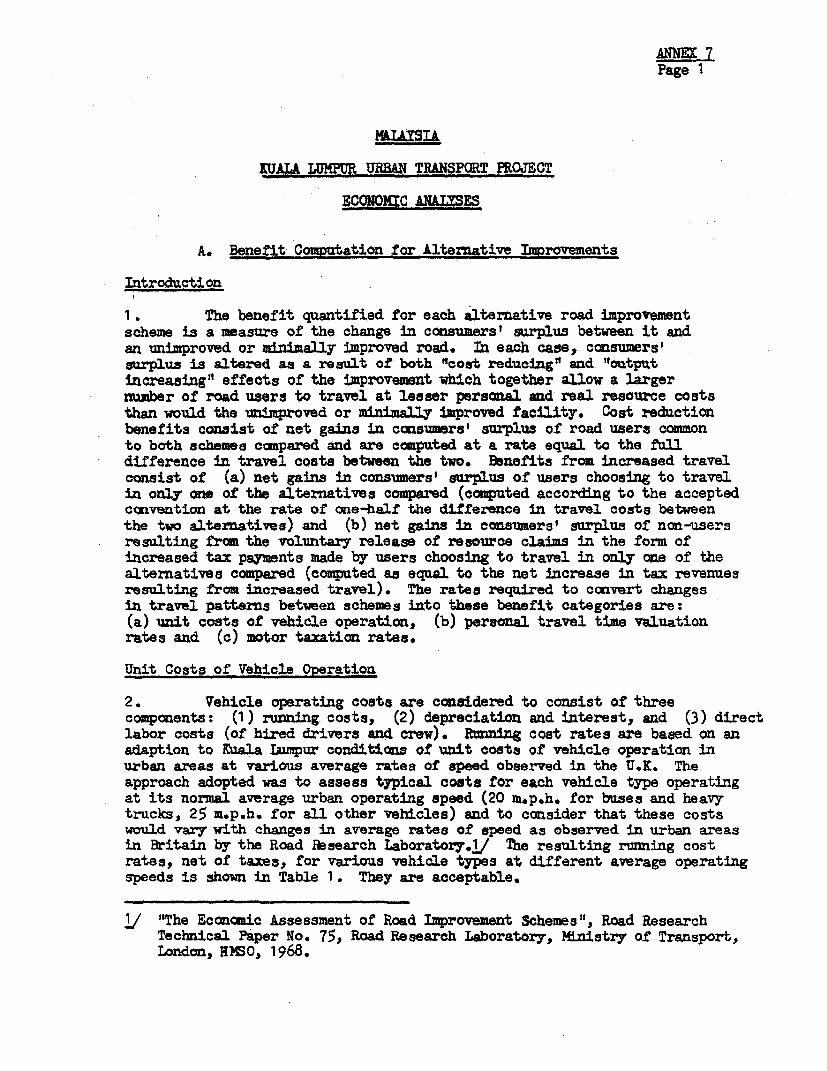
Page 1
MLL&YSIA
KUALA LlPUR BII TRANFSPORT ROJECT
C0NONMC A,M&IS
A. Benefit ComPutation for Alternative Improvements
Initroduction
1. *The benefit quantified for each alternative road improvemntscheme is a measure of the change in consumers' surplus between it andan unimproved or minimally improved road. In each case, consumers'surplus is altered as a reault of both "coat reducing" and 'toutpultincreasing" effects of the imProvement which together allow a largernunber of road users to travel at lesser personal and real reaource coststhan would the unimproved or minimally improved facility. Cost reductionbenefits conist of net gains in casumrs' surplus of road users commonto both schemes compared and are computed at a rate equal to the fulldifference in travel cost8 between the two. Benefits from increased travelconsist of (a) net gains in consumers' gorplus of users choosing to travelin only one of the alternatives compard (computed according to the acceptedconvention at the rate of one-half the difference in travel costs betweenthe two alternatives) and (b) net gains in consumers' surplus of non-usersresulting from the voluntary release of resource claims in the form ofincreased tax payaents made by users choosing to travel in only one of thealternatives compared (computed as equal to the net increase in tax revenuesresulting from increased travel). The rates required to convert changesin travel patterns between schemes into these benefit categories are:(a) unit costs of vehicle operation, (b) personal travel ti-me valuationrates and (c) motor taxation rates.
Unit Costs of Vehicle Operation
2. Vehicle operating costs are considered to consist of threecomponents: (1) running costs, (2) depreciation and interest, and (3) directlabor costs (of hired drivers and crew). Running cost rates are based on anadaption to Kuala Iumur conditions of unit costs of vehicle operation inurban areas at various average rates of speed observed in the U.K. Theapproach adopted was to assess typical costs for each vehicle type operatingat its normal average urban operating speed (20 m.p.h. for buses and heavytrucks, 25 m.p.h. for all other vehicles) and to consider that these costswould vary with changes in average rates of speed as observed in urban areasin Britain by the Road Fesearch Laboratory. j The resulting running costrates, net of taxes, for various vehicle types at different average operatingspeeds is shown in Table 1. They are acceptable.
&./ "The Economic Assessment of Road Improvement Schemes", Road ResearchTechnical Paper No. 75, Road Research Laboratory, Ministry of Transport,London, HMO., 1968.

ANNEX 7Page 2
3. Depreciation and interest costs of comnercial vehicle operationhave been used to estimate the benefits of extended vehicle life and greatervehicle utilization made possible by reduced distance and time of travel.Cnly a small proportion of total depreciation and interest costs of commercialvehicles were estimated to affect such benefits and the resulting distanceand time dependent rates for depreciation and the time dependent rate forinterest are conservative (Table 2).?/
4. Labor costs of drivers and crew of commercial vehicles were derivedfrom official and commercial sources. It is assumed that time savings ofdrivers and crew can be productively utilized and therefore full hourly wagecosts are used (Table 3). Real income levels are assumed to remain constantthrough 1975 and then increase at a rate of 3% per annum. These labor costrates are considered reasonable.
Personal Travel Time
5. The rates of personal travel time val-uation are based on proportionsof average wage rates observed in the U.K. / applied to average wage ratesfor occupanta of rarious types of vehicles in KuaJla Lmpur (drivers and crewof commercial vehicles excluded as these are assessed as operating cost'elements, para. 4). The resulting valuation of personal travel time isconsistent with conservative current practice in other countries. Travel-time savings during non-working time are assumed to be valued at 25% of the--wage rate of the principal wage earner of a household. This value appliesto travel time of all adult members of a household; that of children isvalued at one-third of this rate. Travel time savings during working timeare valued at the full average wage rate of the worker. Different rates foroccupants of cars, taxis, motorcycles and buses are used to reflect thedifferent wage levels of these different user groups (Table 4). Each rateis assumed to remain constant through 1975 and then to increase relative toan increase in real incoe levels of 3% per annum thereafter. These ratesof personal travel time value are considered reasonable.
Motor Taxation Rates
6. Increased tax yields from greater expenditure on fuel, oil, tires,maintenance, etc., have been used to estimate the net gain in non-users consumers'surplus resulting from increased travel. Instead of a simple offsettingtransfer payment, a net gain in consumers' surplus is considered to occurbecause users choosing increased travel over alternative expenditures with
2/ The assumed proportions of depreciation and interest costs whichcontribute to measurable benefits are less than those outlined in"Quantification of Road User Savings", Jan De Weille, World Bank StaffOccasional Papers No. 2, IBRD, 1966.
3/ "The Value of Time Savings9in Transport Investment Appraisal", EDDTechnical Note No. 3 (unpublished), Ministry of Transport, 1970.

AN1NEX 7Page 3
lGsser tax costs are assumed to act rationally and by so doing maintainor increase their own consumers' surplus while releasing resourceclaims in the form of greater tax payments which will increase theconsumers' surplus of non-user beneficiaries qf public disbursementsJVIn analyses where increases in the volume of travel attributable toroad improvements are small and taxes on road users are low, this benefitelement can generally be ignored. In this case, however, the increasesi3 travel volumes and the level of road taxes are relatively high andbenefits of this type, though. small, are hignificapt. The increasedmotor tax yields are compute4 by means of operating cost rates inclusiveof tax derived from the addition of current rates of taxation to thevehicle operating costs exclusive of tax (Table 1). These gross taxyield increases from transport are converted to net increases byallowance for reduced tax yielda from decreased expenditures on othergoods and services which include tax. A factor of 0.8 is applied tomotor tax receipts to estimate net tax receipts. The applied rates ofvaluation are acceptable.
B. Cost Computation for '"Without" Scheme
7. In addition to the economic costs of construction estimated forthe alternative improvement schemes, certain construction costs for the"without" scheme representing the minimal necessary improvement of theFederal Highway were estimated and ±nclwded iz the return computationsas deductions to the cost streams of each alternative. The constructioncosts for the "without" scheme, including a 10% coat contingency allowance(as compared with the 20% contingency allowance contained in the costsof the alternative improvements), were M$ 2.3 milliQn (us$ 0.8 million)in 1973/1974 for widening of several intersections and $ 21.0 million(US$ 7.5 million) in 1979/1980 for widening of the roadway to 2 x 3 lanes.
14/ See: McIntosh and Quarmby, "Generalised Costs,and the Estimation ofMovement Costs and Benefits in Transport Planning", MAU Note 179,Mathematical Advisory Unit, Department of the ELvironment, U.K., 1970,and van der Tak and Ray, "The Economic Benefits of Road TransportProjects," pp. 27-29, World Bank Staff Occasional Papers No. 13, IBRD,
April 5, 1972


ANTNEX 7Page 4LTABLE 1
M_AAYSIA
KUALA LDMPUR UREBAN TrANSPORT PROJECT
tUz BmJi;nG C0C. 1 / NEr OF TLAX-(M cents per mile)
Averge Operating Speed(m.p.h.)
Vehicle 2vpe 10 15 20 25 30 35 40
Motorcycle 2.h5 2.03 1.88 1.70 1.62 1.56 IJhl
Car 10.24 8.h41 7.50 6.95 6.59 6.33 6.13
Taxi (diesei) 6.76 5.55 4.94 4.58 3.93 L.16 h.03
Light Truck 8.49 7.27 6.66 6.29 6.oh 5.87 5.7h
-Hes w -ruck 2l7.88 22.27 20.96 20.18 19.65 - -
Rus -A'16.73 1476 13.77 13.18 12.78 - -
L/ Operating costs exclusive of depreciation, interest and labor costs ofdrJver and crew computed separately, see Tables 4 and 3, Annex 7.
Sonrce: Federal F=iahway 2 Feasibility Study (Draft),Freeman, Fox and Partners, September 1971.
April 5, 1972

AmEX 7page 5-TABLE 2
MALAYSIA
KUAA.ALUNPUR ROAN MASPORT PROJECT
VEHICLE DEB;EAIQf a MITEST CO6TST. NET 0? TAX(M cents)
Depreciation Interest
Vehicle Type per mile . per hour per hour-
Motorcycle
Car -
Taxi (diesel) 2.85 27.60 28.00.
Light Truck 4.41 10.70 13.30
Heavy Truck 4.12 16.30 30.00
Bus 3-07 24.00 41.60
1/ Portion of depreciation and interest costs estimated to reflectreal costs of vehicle life and utilization.
Source: Federal Highway 2 Feasibility Study (Draft),Freeman, Fox and Partners, September 1971.
April 5, 1972

AdNEX 7Page 6
MALAYSIA
KUALA LUMP URBAN TRANSPORT PROJECT
VEICLE LABaR C06TSIv(M cents per hour)
Labor Components
Vshicle Type Driver Crew Total
Motorcycle .e
car
Taxd 100.0 - 100.0
Light Truck 95.0 - 95.0
?Heavy Truck 98.6 37.l-C/ 135.7
Dws ~~~~~~117.9 59.0o1 176.9
,/ Full wage costs of paid drivers and crew
2/ Average of .45 crew members per heavy truck
3/ Average of .50 conductors per bus
Source: Federal Highwpy 2 Feasibility Study (Draft),Freeman, Fox and Partners, September 1971.
April 5, 1972

-AtIEX 7Page 7
TABLE 4
MALAYSIA
,KUALA LMeU 'URBAN TRANSPORT PROJECT
PERSONAL RAVEL TIHE COSTS(M cents per-hour)
Working. Time - Non-Working Time
Adult - - Adult - -
Driver or Driver or ChildVehicle Type Passenger- Passengerz/ PassengerY
Motorcycle 160.0 40.0 13.3
Car 448.5 112.1 37.4
Taxi- 300.0 75.0 25.0
Light Truck-
Heavy Truck4/
BushY 139.0 34.7 11.6
1/ Full wage rate of principal wage earner of household.
2/ Non-worklng time v 1/4 of wage rate of principal wage earner of household.
3/ Non-working time @ 1/12 of wage rate of principal wage earner of household.
I/ Working time costs of driver and crew included in Vehicle Labor costs,Table3, Annex 7.
Source: Federal Highway 2 Feasibility Study (Draft),Freeman, Fox and Partners, September 1971.
April 5, 1972

TABLE .
MALAYSIA
KUALA LUMPUR URBAN TRAAPORT PROJECT
POPULATION DISTRIBUTION IN THE ELANG VALLEYI 1957, 1970, 1980, 1985(00's of persons)
1957 1970 L98OL" 19851/
Kuala Lunmur Metropolitan Area 402/ 707 1 X,150
Municipality of Kuala Luawur 316 452 6002/ 680?/
Petaling Jaya Area 403Y 143 205 245Petaling Jaya Town 17 93 95 95Contiguous Built-up Areas 2 o 50 11 a 1503'
Balance of Metropolitan Area 44 112 195 225
Balance of Klang Valley 227 402 640 760
Total Klang Valley 627 1,109 1,64o 1,910
1/ Consultant estimate.
2/ Mission estimate based on partial census data or consultant forecast.
3/ 40,000 additional persons anticipated on the basis of latest developmentprogram of Selangor State Development Corporation.
Source: 1957 and 1970 - Department of Statistics, 1957 and 1970 Census.- - 19BO and 1990 - Federal Highway 2 Feasibility Study (Draft),
Freeman, Fox & Partners, September 1971.
April 5, 1972

TABLE 2
MALAYSIA
KUALA LUMPUR URBAN TJANSPORT PROJECT
ROAD TRAFFIC GROWTH CH MAJOR APPROACHES TO KUALA- LUMPUR(Average Daily Traffic (Excluding Motorcycles))
1963 1971 Ratio. Qrowth, %Direction: Route, Amount - Amount - ... L 1971/1963 Per Annum
Northwest: Route 1/ ,Ji Ipoh/''J. Sentul 19,000 721.6O O7,00 19.8 2.-5 1.0
Northeast: Route 2 14,000 15tF9 29,000 12.2 .1i
East, J. Gurney/,J. Ampang 6,000 94 35,00Q4 1Ip78 4.4
Southeast: Route l, 7, 000 80 o OOO 8' 2.9 4 q2
South: J. SungeLiBesi6 6,000 6,8 17.'00 2.6 13.9
Southwest: Federal Highway/Jo Klang/ t
J. Damansara 34,000 38,6 90,000 3t.8( 2.6 a2.9
Total 88,000 100.0 238,000 100,0 2.7 23.2
Source: T!unicipility of' Ku41a luipur, January:1972
April 5, 1972

TABLE 3
MALAYSIA
KUALA LUMPUR URBAN TRANSPORT PROJECT
ESTIMATES OF TRAVEL ON FEDERAL HIGHWAY2/I (Average Dally Trips)
1971. 1980 1985Consultant Forecast 1971_ 9__ __ _985
Travel Mode Vehicles P.C.U.'s / Persons Vehicles P.C.U.'s.Y Persons Vehicles P:. U.B s./ Persons
Motorcycle 15,000 7,500 20,000 38,000 19,000 51,000 52,000 26,000 70,000
Car/Taxi 47,ooo 47,000 94,ooo 103,000 103,000 206,000 139,000 139,000 278,000
Bus 1,700 5,100 51,000 2,000 6,000 55,000 2,000 6,000 55OOO
Light Truck 4,300 4,300 - 7,000 7,000 - 8,000 8,000 -
Heavy Truck 4,500 11,500 - 7,000 1,000 - 8,000 22,000 -
Total 72,500 75,400 165,000 157,000 154,000 312,000 209,000 201,000 403,000
Sensitivity Forecast3/
Total 72,500 125,000 170,000
1/ Volumes between intersections No. 3 and 4, see Map 3.
2/ Passenger car units (motorcycles @ 0.50, cars, taxis and light trucks @ 1.00, heavy trucks 0 2.75 and buses 0 3.00).
3/ 1980 and 1985 vehicles 0 80% of consultant forecast.
Source: Consultant Forecast Mission Estimates - Federal Highway 2 Feasibility Study (Draft), Freeman, Fox and Partners, September 1971.

TABLE 4i
MAAYSIA
KUALA LTJMPUR UlRBA TRANSPORT PROJECT
DETAIL OF CCNsTUCTIcf CosT zsTAT
Total in M:
1; Coneral 3,482,8Qo
2. Site Clearance 634,800
3. fencing 1,045,100
4. Esrthyorks 5,65i,3oo
5. Drainage 3,933,700
6. paving 8,017,600
7. Road Markings 195,600
B. Signs 474,300
9. Electrical Installation 2,024,000
10. Signals 314,700
11. Bridges 12,532,400
12. other Structures 2,829,500
13. Services (Contract) 796,500
Total 41,932,300
Source: Freeman, Fox & Partners, May 1972
May 26, 1972

UBLE 5
MALAYSU
KUALA LUMPtR MURBA TENSPORT PfJCT
ESTlT$MAD SCHEDUhZ OF DISBURSE3BTS
IBRD Fiscal Year Cumlmative Disbursementand Quarter at Md of Q er
1972/73
December 31, 1972 1,400March 31, 1973 1,400June 30, 1973 1,800
1973/74
September 30, 1973 2,750December 31, 1973 3,&)OMarch 31, 1974 5,100June 30, 1974 6,400
197V/75
September 30, 1974 7,800December 31, 1974 9,300March 31, 1975 10s700June 30, 1975 12,100
1975/76
September 30, 1975 13,200December 31, 1975 14k300March 31, 1976 14, 800June 30, 1976 15,200
1976/77
September 30, 1976 15,200December 31, 1976 16,000
May 26, 1972

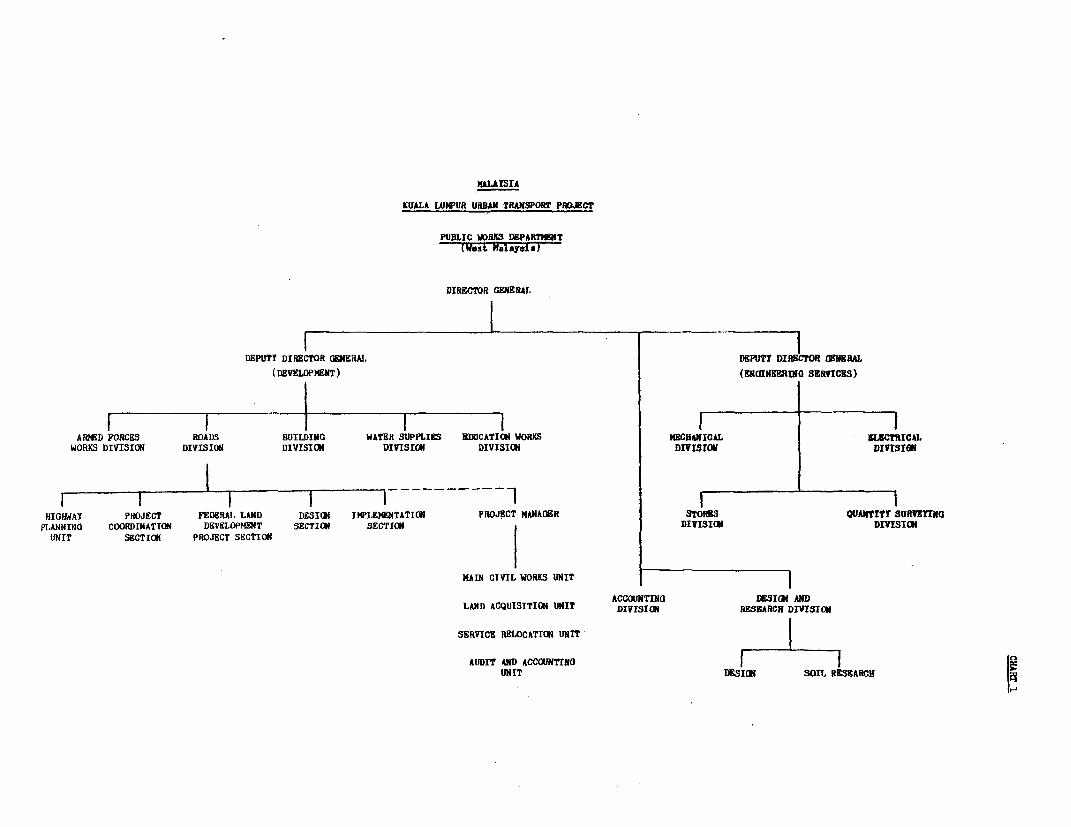
NhASIA
KUALA LUWMUR URBAN TRANSPORT PROJECT
PUBLIC WOBX9 DEPAITIENT(West Malaysia)
DIRECTOR GENERAL
DEPUTY DIRECTOR GENERA1 DEPUTY DIRLTR aNUNRAL(DEVELOPMENT) m(UoINERNG SERVICeS)
ARMED FORCES ROADS BUILDING WATER SUPPLIES EDUCATION WORKS HHCHANICAL ELEcrTRlICALWORKS DIVISION DIVISION DIVISION DIVISION DIVISION DIVrSrON DIVISION
I~ RJC FEEA LAD1 ~1t~- -1 IHIOHWAY PROJECT FEDERAL LAND DESION IMPLENENTATION PROJECT MANAGER STORIS QUANTITY SURVEYrNGPLANNING COORDINATION DEVELOPMENT SECTION SECTION DIVISION DIMVSIONUNIT SECTION PROJECT SECTION
MAIN CIVIL WORKS UNIT
ACCOUNTINa DESIr ANDLAND ACQUISITION UNIT DIVISION RESEARCH DIVISION
SERVICE RELOCATION UNIT
AUDrT AND ACCOUNTNOIUNIT DESION SOIL RSSEARCH

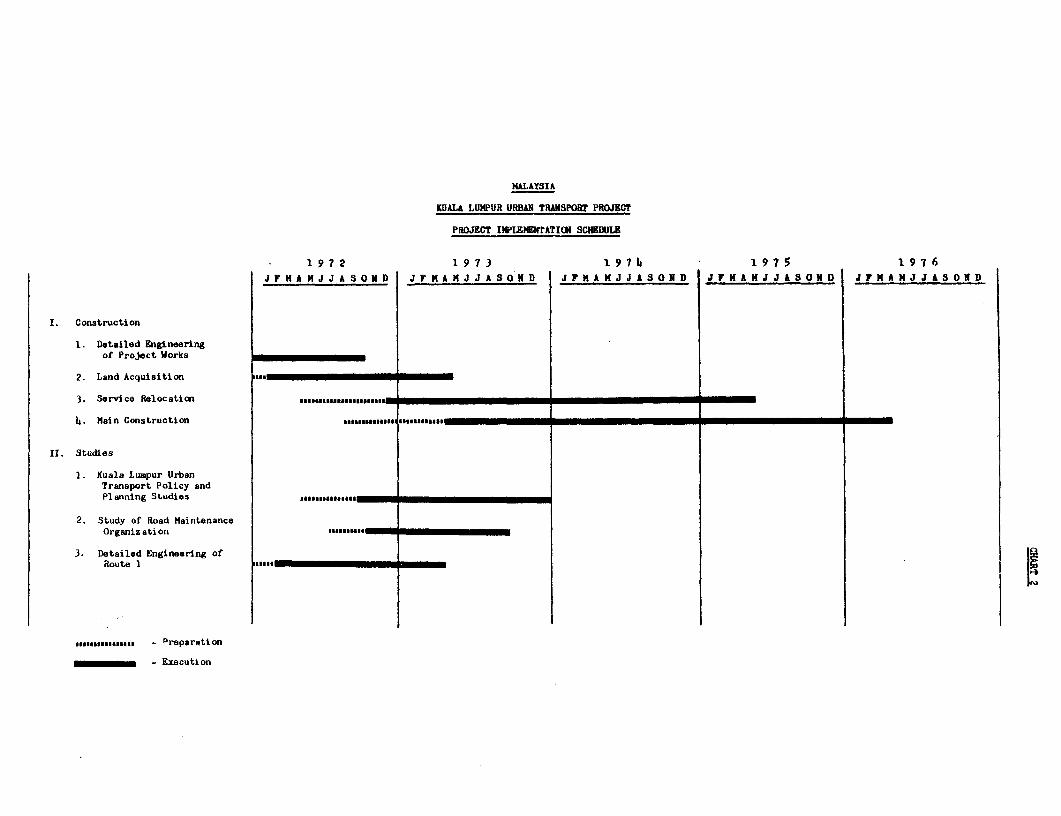
MALAYSIA
KUALA LUMPUR URBAN TRANSPORT PROJECT
PROJECT IHPISMENTATION SCHIDCWLE
1972 1973 197 4 1975 1976
J F H A H J J AS O N D J F M AN J J A S O N D J F M A M J J A S O N D JrNAMJJASOND J F N A M J J A S O N D
I. Construction
1. Detailed Engineeringof Project Works
2. Land Acquisition *
3. Service Relocation gsu.amaaamaug,aa,a,a*
h. Hain Construction asum.aam s,.aaau,
II. Studies
1. Kuala Luspur UrbanTransport Policy andPlanning Studies ,,.aaea uua _
2. Study of Road MaintenanceOrganiz ati on .. a.mmsa. _
3. Detailed Engineering ofRoute 1
,,,,,,,,,,,,,, ,, - preparation
- Execution


a0 ,
L e Q 6 ,. ,. X>
0~~~~~~~-


MAP 2
.~~~~r reoD 4 0 500 , o wo 1oxu, rakX
1'0}o06, 30' 102°00'
3o30-
\ 5XKuala Selangor /
KLANG VALLEY REGIONFBderallighway \S /t
_K Vaffey Fqion- Bunft y........... .S"nai .... iKAALMUNl9
I Inte utmiwnl ArportP-oposed Urbea Federal H4wv U wnff INTERNATIONAL 4 RPORT
- ADiminictmt1ve OiettPioundariing Jay
:~~~~~~~~~~ :L., A N Gy> BufIt-up.Areew
-- IE=E5 C Cu tf -~~~~~~~~~~~~wht41a~~~m K L As\ / MAILES
S TRZA I-T ang 49<3 a,tT2 pr;r
~OF
MALA.CLCA Kaj g
\ - - rrs ..U L U L AlT1., N 6 A 1TS US
Thez Eondrio oNee no *e eo= to ,tnt0
::RRIIORv 1972IBD30


MALAYSIA 101 40'
KUALA LUMPUR URBAN TRANSPORT PROJECTURBAN FEDERAL HIGHWAY IMPROVEMENT
Existing Main RoadsOther Proposed Roads
-3' 1 ' Railways --. River
Proposed Urban Federal Highway Improvement® Intersection Numbers
Municipal or Toen Boundary A
Built-up Areas
o_ .________ KUALA LUMPUR -
I ALA / ______
m@-bt' Ak' ;PET
/- I -ia XvJ!/~~~~~~~~~~~~~~~~~~~~~~~~~~,d IfX.Al -92
IRE3708R


S
0'~~~~~~~~~~~~~~~~~~~~~~~~~~0
.. z~~~~~~~~~~~~~~~~~~~~~~~~'
1" ~ ~ ~ ~ ~ ~ ~ ~ ~ ~ ~ ~ ~ ~ ~ ~
zJ.
Z A 4/V~~~~~~~~~~~~~~~~~~~~~~~~~~~~~~~~~~~
I-
C4,'. z ~~~~~~~~~~~~~~~~~~~~~~~~~~~~~~~~~~Z0