international association of hydrogeologists irish …
TRANSCRIPT

INTERNATIONAL ASSOCIATION OF HYDROGEOLOGISTS
IRISH GROUP
PROCEEDINGS
of
16th ANNUAL GROUNDWATER SEMINAR
on
WATER. WELLS
DR.ILLING, DESIGN, CONSTR.UCTION, OPER...A..TION
..A..NX> l.VIAINTENANCE
VEN UE
KILLESHIN HOTEL, PORTLAOISE
DATE
APRIL23rd-24th, 1996

!AH Portlaoise Seminar 1996
!AH (Irish Group) Seminar Organising Committee:
D. Daly, Seminar Secretary, Geological Survey oflreland T. Hayes, Treasurer, K.T. Cullen & Co. Ltd. E.P.Daly, President, Eugene Daly Associates D.M. Ball, Secretary, Consultant Hydrogeologist C. Shine, Fieldtrip Organiser, Minerex Environmental Ltd.
Copyright © the authors 1996
ISSN 1393-1806
Price £15
Published by: IAH (Irish Group) D. Daly, Seminar Secretary, Geological Survey oflreland, Beggars Bush, Dublin 4.
Cover designed by D.M. Ball
ii

!AH Portfaoise Seminar 1996
CONTENTS
A Review of Groundwater Development in Ireland 1 Kieran O'Dwyer, K.T. Cullen & Co.
Design and Construction of Water Wells in Ireland 9 David Ball, Hydrogeologist
Water Wells - Monitoring, Maintenance and Rehabilitation 19 Peter Howsam, Water Management Department, Silsoe College, Cranfield University
Estimating the Reliable Outputs of Water Wells 35 Bruce Misstear, Trinity College Dublin; Sarah Beeson and Jan van Wonderen, Groundwater Development Consultants Ltd.
Location and Development of Major New Limestone Aquifer in Co. Cork 45 Brian P. Connor, Consultant Hydrogeologist, Brian P. Connor & Associates Ltd.
Assessment of the Potential of Developing a Groundwater Source at Ardmore, Co. Waterford 49
Jer Keohane, Geotechnical and Environmental Services Ltd.
Roscommon Central Regional Water Supply Scheme, Development of the Ballinagard Aquifer 55
Conor McCarthy, Senior Engineer, Jennings O'Donovan and Partners
Casings and Screens 67 Thomas Fogarty, Fogarty Drilling Ltd.
Achieving Groundwater Protection 75 Aidan Briody, Briody's Aquadril Services
Case History: Gravel Aquifer Investigations in the Glen Swift Valley, Letterkenny, Co. Donegal 79 Cecil Shine, Minerex Environmental Ltd.
An Introduction to the Hydrofracturing of Water Wells 81 Des Meehan, Des Meehan & Co. Ltd., Waterwell Drilling and Hydrofracturing Contractors
Protection of Public Groundwater Sources 85 Donal Daly and Jenny Deakin, Geological Survey oflreland
Groundwater Conditions of the Limestones of Eastern Co. Galway 95 David Drew, Geography Department, Trinity College Dublin
Well Performance Tests - Their Use in Borehole Management Shane O'Neill, Trinity College Dublin
Water Wells: Contracts and Specifications Eugene Daly, Eugene Daly Associates
iii

FORWARD
Groundwater has been used as a source of water supply in Ireland since ancient times. Initially spring wells, often given saints names, were used. Then wide diameter wells were hand dug to increasing depths. Narrow diameter water wells drilled by mechanical means have only been available for about a century. In Ireland well drilling as we know it today only became a viable option for individual home owners and farms after the second world war.
Over a hundred thousand bored water wells provide a water supply for a significant portion of the population of this island. They are an efficient and environmentally friendly method of developing a natural resource. In the Republic there is little regulation of groundwater abstraction and there are no water well drilling standards.
In addition to their use as a source of water, water wells are the hydrogeologist' s principal tool in gaining an insight into the two mediums, ie., rock and water, that are his/her stock in trade.
It is against this background that the main topic for this years seminar has been chosen. In the early years of the annual seminar some aspects of this year's theme were considered. However, this is the first year that the main topic has been on water wells exclusively. The material to be covered reflects the significant improvement in the standard of water well drilling and knowledge of groundwater development in Ireland over the last IO years. The papers to be presented will deal with all the main aspects of constructing, testing and protecting water wells. The lecturers who have kindly agreed to present papers have considerable experience of water wells both in Ireland and overseas.
The regional lecture first appeared on the seminar programme last year. This year the regional lecture deals with the limestones of eastern County Galway. We hope to be able to continue with a lecture on the hydrogeology of a different part of the country in the years ahead.
Eugene Daly President, !AH (Irish Group).

/.A.H. Portlaoise Seminar /996
A REVIEW OF GROUNDWATER DEVELOPMENT IN IRELAND.
Kieran O'Dwyer B.E. M.I.C.E.
K.T. Cullen and Co.
ABSTRACT
This paper describes how the current practices of Ire/ands groundwater supply
development have evolved and why a more holistic approach is now required. The
investigation required for a regional water supply development is outlined. Two
examples of innovative water supply are described. i) Well pointing in dune sands and
ii) !nishmore water supply
INTRODUCTION
In the past rural water supply was supplied as individual domestic supplies. These
usually took the form of a dug well which was excavated to the water table and lined
with 1.0 metre concrete rings or brick. These wells proved to be adequate for the
household needs and are still in use in many parts of the country today. They can be
vulnerable to pollution and are usually the first wells to go dry during drought periods.
As rural development became more organised and drilling rigs became available wells
were bored at each house. All county council cottages had their own well bored for
water supply. These were drilled with cable tool rigs and were lined with steel casing.
These wells were drilled into the bedrock. After the air flush rotary rigs came into the
country wells of 60 metres and greater could be drilled quickly and efficiently into the
underlying bedrock.
The advent of the group scheme allowed an individual well to supply several houses
within a community. These wells consequently required greater yields. However there
was an element of choice in the location of the well and this was when geology began
to be employed as an aid in site selection.
The next step was the development of high capacity wells to meet the needs of larger
communities. These usually took the form of individual wells located where there was
known to be highly productive aquifers and the supply was then piped to the area of
demand. Hydrogeology became a factor in locating these wells. The main object of the
1

/.A.H. Portlaoise Seminar /996
studies was to assess whether the well itself was capable of producing the required
quantities on a continuous basis. When the local authorities started to meter water that
was used by large consumers, industries realised that large savings could be made by
drilling their own wells. In the case of a creamery that uses 500,000 gallons of water
per day these savings are significant. The weekly water bill would be of the order of
£5,500. The incentive to have a private water supply is very appealing. The capital
pay back period can be gauged in months.
Today the tendency is to supply regional water schemes from well fields. These large
schemes are taking over from the surface water abstraction schemes which can be
costly in terms of treatment. The quality of the raw water varies seasonally with colour
and suspended solid problems after heavy rainfall events. Most of the suitable surface
abstraction sources have already been commissioned. The vast groundwater resources
of the country are now only beginning to be exploited. I use the word exploitation
reservedly. The exploitation must be managed in order to ensure that the reserves are
sustainable. The approach to the development of these large regional water supply
schemes has been changed due to a number of factors.
i) Environmental awareness and environmental impact legislation.
An EIS is required for any water supply greater than 5,000 3/day which corresponds to
a population of 25,000. A much greater understanding of the potential impacts is
required and this in tum requires that the response of the aquifer to abstraction must be
understood that was previously thought necessary. A holistic approach that
encompasses all the elements of the hydrogeological cycle is now essential. The impact
on base flows in rivers, the seasonal variation in the cone of depression, the recharge
from rainfall and the effect on other water supplies must be understood.
ii) The sustainability of the supply.
As the trend shifts to the development of large scale water supplies the focus of the
studies has moved from the performance of the individual well to the performance of
the aquifer itself. Some of the aquifers now being developed are limited in extent and
consequently the question arises as to whether there is sufficient recharge to sustain the
quantities that are being abstracted continuously. The hydrogeology of the entire region
must be understood in order delineate the aquifer. Extended multiple well pumping tests
and observation well networks can provide this information.
iii) Advances in Computer Technology.
The increase in the power of desktop computers and the development of complex
modelling software packages has assisted greatly in predicting the impacts of a
2

/.A.H. Portlaoise Seminar 1996
proposed water supply scheme. It is no longer possible to conduct a pumping test that
will abstract at a rate greater than the proposed demand. Details of the geology of the
aquifer, existing water tables, rainfall, stream flows and pumping test and observation
data are all input to calibrate the model. Once the calibration is satisfactory then the
model can be run for various scenarios and potential impacts can be evaluated.
HYDROGEOLOGICAL STUDY FOR A REGIONAL WATER SUPPLY
The development of any groundwater supply requires a step by step approach. The
study programme has to be flexible. Each step may be modified depending on the
results of the preceding one. The works and studies associated with the development of
a large scale regional water supply proceed as follows.
PRELIMINARY STUDIES
This entails collating all the available information concerning the area under study.
Information can be gathered from:
i) The Geological Survey of Ireland.
The Survey have been developing a database of wells drilled in the country and
these can give an indication of the likely yields. There are open files on work
carried out by the mineral exploration companies. The 6" manuscript maps will
provide data on the geology. The aquifer map of Ireland will show whether the
underlying rocks are considered to be an aquifer or not.
ii) The Local Drilling Contractors.
A meeting with the local drilling contractor is possibly the most useful exercise
at this stage. He can give details on the location and geology of high yielding
wells he has drilled in a particular area. Not all drillers return the results to the
survey.
iii) Topography and Local Information.
A site visit is essential at this stage. A perusal of the area under study can show
areas where which may have some potential. In talking with locals beware of
reports of springs. Experience has shown that in many instances the springs
are present because rainwater cannot percolate .downwards and that these dry up
3

/.A.H. Portlaoise Seminar 1996
during the dry summer months. In fact an absence of drainage channels can be
indicative of areas with potential.
At this stage of the study the geology and aquifer status of the underlying geology will
be known. If the area is regarded as a poor aquifer there may be locally high
transmissivity zones associated with faulting. If there is very little information available
the aquifer status has been designated purely on the basis of the geology. If it is
obvious that the bedrock potential of an area is poor the existence of sand and gravel
deposits should be investigated.
GEOPHYSICAL SURVEYS
The next step in the process is the selection of trial well sites. Geophysics is a useful
tool to aid in this process. It is not economically feasible to conduct a survey over the
entire area covered that is intended to be served by the scheme. Several areas may be
chosen. The selection can be made on the basis of convenience to the distribution
system, the occurrence of known high yielding wells, geology, known faults and
available land. It is recommended that a survey be centred on a known productive
source. This allows the transmissive zone associated with this to be delineated. The
extent of known gravel deposits can be delineated in the same way.
TRIAL WELL DRILLING AND TESTING
A series of trial well sites is then selected. A greater number of sites than that budgeted
for should be selected. This allows for any difficulties in negotiating with landowners.
Depending on the drilling results the focus of the trial well drilling may shift from one
area to another. If the results are encouraging then 72 hour pumping tests should be
carried out on each of the wells. Values of transmissivity and storage can be determined
along with the well yield. Water samples are collected at the end of each test and
forwarded for bacteriological and chemical analysis.
A monitoring well network can be set up. This will comprise all the wells within the
catchment. Monitoring wells should be drilled if there are gaps in the network. These
wells also provide further data on the extent of the aquifer and the geology. The water
levels should be monitored regularly over as long a period as possible. The extent of
the seasonal fluctuation in the water table can be gauged.
Once an idea of the final well field configuration has been developed an extended
multiple well pumping test should be carried out. This will entail pumping as many of
4
/.A.H. Portlaoise Seminar 1996
the potential production well sites at as high a rate as possible for as long as possible.
The object of this exercise is to stress the aquifer and thereby detect the influence of
geological boundaries. There has to be an element of compromise at this stage. A test
of this type can impact significantly on domestic wells. It is possible to provide
temporary supplies to some households. However one should be prepared to have to
finish the test at an earlier stage than had been envisaged.
COMPUTER MODELLING
The demand of a regional scheme can be very large and close to the available recharge if
the aquifer is limited in extent. If the demand exceeds the available recharge then the
quantity of groundwater available will decrease over a period of time (years). There is
also a seasonal aspect to be considered. The aquifer will a finite amount of storage
available. The water table fluctuates over the course of a year. During the winter
months (October to March) there is a period of recharge. A percentage of the rainfall
percolates downwards and fills the aquifer. A figure of 20% of annual average rainfall
is used a rule of thumb for recharge to the aquifer. Because there is a finite volume of
storage available the aquifer fills up. A point is reached where the aquifer is full and the
excess discharges via springs and through the beds of streams and rivers. During the
summer months the rainfall amounts decrease and the temperature is greater and there is
a greater evapotranspiration. For most summer months evaporation exceeds rainfall
resulting in a deficit. The aquifer will drain through springs and to rivers and streams
during this period. Pumping of water wells will deplete the storage even more. The
question as to whether the water supply can continue to meet demand during these dry
spells must also be answered. In these days of heightened environmental awareness
there is also a requirement to quantify and evaluate any potential impacts that may occur
as a result of the proposed development. The most effective way to answer these
questions is through the construction of a computer model. On a regional scale the
preference is for a water balance model. The data required for the construction
embraces all elements of the hydrological cycle. Rainfall, potential evapotranspiration,
stream flows, water table, transmissivity, storage and details of overburden and
bedrock geology all form part of the model. The recharge, transmissivity, storage,
aquifer extent and the locations of all known rivers, streams and springs are input. The
outputs are the regional water table and stream flow. The model is calibrated by
reproducing the known water table as measured from the monitoring network and the
known stream flows that have been recorded. The model is further calibrated by
running for a year and reproducing the fluctuations in water table and stream flow.
Once the model has been calibrated it can be run for various pumping scenarios and the
impacts evaluated. The main concerns are the cone of depression that is developed and
5

!.A.H. Portlaoise Seminar 1996
the reduction in stream flow (if any) during summer months. When large quantities are
abstracted there is often a significant contribution from rivers during the dry spells.
This reduces the assimilative capacity of the river and can impact on the fish life. The
cone of depression can drain marshes and fens that may be designated areas of
scientific interest. The model is also used to ensure that the resource renews itself on
an annual basis. The model also allows an aquifer management plan to be adopted in
order to minimise the impacts.
INNOVATION IN GROUNDWATER DEVELOPMENT
Over the past ten years or so there have been a number of innovative studies carried out
in order to secure supplies of fresh water. These are cases where the conventional
approach has had to be adapted to suit the conditions of the area being investigated. I
will briefly discuss two examples. The first is the use of well pointing to supply
irrigation water on coastal golf links. The second is the development of a water supply
on an the island oflnishmore.
WELL POINTING IN DUNE SANDS.
This system was first adopted by K.T. Cullen and Co. for the irrigation supply for
Rosslare Golf Course and has subsequently been installed in many of the golf links
along the east coast. Deep wells drilled in the dune sands or underlying bedrock
usually encounter the problem of saline intrusion. Freshwater is lighter than salt water
and in areas of coastal dune sands there is a layer of freshwater floating on top of the
salt water beneath the ground. This upper layer can be successfully developed as a
freshwater supply. There is a considerable reservoir of freshwater stored beneath the
ground. The dune sands are very free draining and almost al the rain that falls
percolates downwards rapidly. 800 - 1000 mm of rain falls each year. An inch of
water over an acre is 100 m3 (22,000 gallons). The freshwater behaves similarly to an
iceberg. Using the Ghyben-Herzberg analysis the depth to the saltwater/freshwater
interface is calculated to be 40 times the distance between the surface of the
groundwater table and mean sea level. A line of well points can be installed and these
are used to suck the freshwater off the top. The water level must never be allowed to
drawdown below sea level or the salt water will rise up and enter the system. The
system consists installed in Portmarnock and Rosslare consists of thirty well points at
1.0 metres centres installed in a line. These are connected to a header pipe laid along the
ground which is in turn connected to a vacuum pump which pumps the water to
storage. These systems supply in excess of 300 m3/day.
6

!.A.H. Port/aoise Seminar 1996
GROUNDWATER DEVELOPMENT ON INISHMORE.
Inishmore is the largest of the three Aran islands and is 13 km long and covers 3000 ha.
Overburden cover is absent over the most of the island. There are no natural water courses and
consequently the drinking water supply is totally dependant on rainfall. The Aran Islands are
formed of Upper Carboniferous limestones. These limestones are interbedded with thin layers of
shales which were laid down when the sea receded. Where these shale layers outcrop minor
scarps and cliffs are formed. The soil cover was removed by glacial activity exposing the bare
limestone. The islands are cut by a regular set of fractures that run in a south westerly direction.
There is a secondary set of fractures that run at right angles to these. The bedrock surface has
been weathered by the elements. This has resulted in the rock surface being fissured where it has
been exposed. These fissures are generally shallow being less than 3 metres in depth. These
fissures have been developed by rainwater. The rain that falls on the island runs down these
fissures until it meets a more impermeable layer which usually takes the form of a thin shale band.
The water then runs laterally along this stratum until it springs out or meets the sea. This can best
be described as shallow subsurface run off. An example of the water issuing again at the surface
can be seen at the present source where it runs out of a cliff face and is the main source of the
islands drinking water. In times of drought the rate of flow from this source dwindles until there
is only trickle to feed the reservoir. In the past few years the water supply becomes critical and
during extended dry spells the water supply has to be rationed. The quantity of groundwater
available is limited by the surface area of the island, the amount of precipitation, the ability to
collect the runoff/ recharge and the amount storage available. The conclusion of the preliminary
study was that optimum location for augmenting the existing gravity supply was a turlough which
had a catchment that naturally funnelled the water towards it. This turlough forms an elongated
depression in the topography and is some 2.5 ha in extent. The turlough floods after heavy
rainfall events and remains flooded as a lake for the winter months. There are a number of
swallow holes around the turlough. There was considerable broken and fractured limestone
recorded (25 m) in the boreholes. These fractures and fissures provide shallow storage.
However the depth to which the aquifer can be developed is limited by sea level and the distance
of the source from the sea as over abstraction from too great a depth may result in saline intrusion
into the fractured limestone. The results can be summarised as follows.
a) Four wells were drilled at Turloughmore. PW No's 1, 2 and 3 were designed as pumping
wells and SW No. l was drilled to act as a monitoring well to detect any possible
contamination from the nearby dump. All wells were drilled to 25 metres below ground
level and were lined with HDPE screen and well casing.
7
/.A.H. Portlaoise Seminar /996
b) The individual test on PW No.2 showed that the aquifer beneath the turlough does not
respond in the manner of a classical karst limestone aquifer. While the limestone is highly
transmissive the aquifer itself is very limited in extent. The aquifer beneath the turlough
can best be considered as an infilled lake whose sides can allow water to seep in when the
water level is lowered by pumping. During this pumping the water level drops at a steady
rate of decline as opposed to the classical situation where the rate of drawdown decreases
with time until steady state conditions have been achieved. The well was pumped
continuously at a rate of 304 m3/day and the drawdown at the end of 72 hours pumping
was just over 1 metre. The water level continued to drop after three days of constant
pumping. The cone of depression was very flat as all the pumping wells had almost the
same drawdown. The most distant of the observation wells (255 metres away) was drawn
down 0.88 metres as compared to 1 metre in PW No.2.
c) PW No's 1, 2 and 3 were then pumped simultaneously. The discharge from the pumping
tests was able to meet the essential needs of the Island for a period of 35 days. A total of
16,450 m3 was abstracted from the turlough between 11th August and 27th September.
The test confirmed a catchment study result that the resource is limited to approximately
8000 m3 and abstraction of additional water above that level is entirely dependant on
rainfall.
d) The transmissivity of the limestone in which the pumping wells are drilled is such that
groundwater can be abstracted at very high rates. It would be possible to pump the three
pumping wells at a combined rate of 3000 m3/day. However, the storage within the
turlough will be depleted in a much shorter time. When the pumps cut out the recharge
from the surrounding rocks will still be much slower than the abstraction rate and in the
absence of any rainfall the recharge of the turlough could take weeks rather than days.
e) The weather during the period of testing was very dry. The total rainfall during the 35
days of the test was 34 mm. The majority of this fell on two specific days. On the 14th
and 24th September there was 4.2 and 16 mm of rainfall. Both these events were
significant enough to cause the water levels in the wells to rise. The 16 mm on the 24th
September was sufficient to recharge the turlough to the level at which it was prior to
pumping (approximately 4 metres below ground level) in 12 hours.
f) The production wells are envisaged to act as an emergency supply and will only
be brought into production during extended dry periods. A submersible pump
capable of delivering 400 m3/day will be installed in each of the wells.
Depending on the requirement the amount pumped to the reservoirs can be
controlled by the number of pumps operating at any one time.
8

/AH Portlaoise Seminar 1996
THE DESIGN AND CONSTRUCTION OF WATER WELLS IN IRELAND
David M. Ball Hydrogeologist
ABSTRACT
The design and construction of successful water wells in Ireland is uneccessarily sometimes seen as complicated. The design and construction of water wells is founded on relatively simple principles that are well known, and a range of technologies, equipment and materials that have been widely tried and tested. The complications often arise in Ireland from a combination of the geology and uncertain hydrogeology and a range of perceptions and practices that limit the ability of hydrogeologists, drillers and clients to achieve what many know to better standards. It is not possible to remove the uncertainty of the hydrogeology particularly in fractured rocks. However it is possible to recognise other constraints, some of our own making, and find a way of making changes that improve the chances of better, sustainable water well sources in the country.
INTRODUCTION
This paper follows my paper presented at the !AH Portlaoise Seminar in 1995 entitled "Sustainable Groundwater Sources - A contribution to an Irish National Borehole Drilling Standard for Water Supplies - Methods of Approach and Practical Considerations". I do not intend to repeat the content of that paper. The title of this paper uses the generic term 'water well'. This term is used to cover all artificial structures created to draw upon a groundwater resource. There are many different terms used for such structures there is often confusion. To be clear; this paper refers to structures designed and constructed in order to provide a water supply. It does not refer to monitoring wells, piezometers, or site investigation boreholes etc. Though the term 'water well' is used in the text it is obvious that in most cases the reference is to narrow diameter wells; boreholes constructed by a drilling machine. The short early section on theoretical concepts applies equally to wide diameter wells, dug by hand or machine.
I have experience designing and constructing wells both overseas and in Ireland. Well design and construction in Ireland is special to Ireland. It reflects the history of groundwater development, the hydrogeology, the wishes of clients, and the drilling capacity in the country. There is no point in describing well design and construction elsewhere and then trying to impose or promote these methods in Ireland out of context. There are special conditions in the country, like their are special conditions in all other countruies. However experience elsewhere and in Ireland does mean that some of the existing practices, constraints and procedures in Ireland can be looked at and queried within a broader perspective.Therefore the aim of the paper is to describe and discus some of the key factors in the design and construction of wells in Ireland and if appropriate put forward recommendations for change.
A water well often appears to be a simple hole in the ground. It is not much to look at from the surface. What happens underground is not obvious and sometimes seen as mysterious and uncertain. These two polarities of perspective are a root cause of some of the difficulties surrounding the design and construction of water wells.
The perspective that a water well is a simple hole, sometimes leads to resistance to spend money and time on the proper design and construction. Money is paid for footage in the belief that a
9

!AH Portlaoise Seminar 1996
deeper hole is better than a shallow hole, yet there is resistance to spending money on good materials or good completion. The opposite perspective, that the workings of a water well and the availability of groundwater is mysterious, leads to a belief that it is too complicated to understand, therefore best left alone, or left to a driller, with few questions asked.
The truth is the opposite of the above two extreme perceptions. The proper design and actual construction of a water well is more complex than is often appreciated, and involves much more than the construction of a simple hole in the ground. Conversely the concepts and principles behind the design and construction of a water well are very straight forward.
THEORETICAL CONCEPTS AND PRINCIPLES
The basic concept behind the structure of a water well is that if a hole is made into the ground to such a depth that it penetrates a saturated rock, and if water is removed by pumping from this hole, then more water will flow into the hole through all the openings in the rock in the sides and bottom of the hole in order to try and replace the water that has been removed. The reason for this flow is that the water level in the hole after water has been removed is lower than the water level in the rock. This basic statement is obvious to most people but it is worth expressing because leading on from it are several other basic concepts in the design and completion of a water well.
The rate at which water will flow into the hole depends upon three characteristics:- the difference in level between the water level in the hole and the water level in the rock, the ease with which the water in the rock can move towards the hole, and the ease with which the water in the rock can move from the rock through the sides of the hole and into the hole. The first two characteristics probably require no further explanation but the third perhaps requires an example to illustrate the point. The drilling of a hole creates coarse and fine cuttings. If some of these are washed into the pores or fractures in the rock on the hole sides then this can restrict the flow from the rock. Similarly if a bacterial slime grows on the hole walls and in the pores and fractures in the rock then this too can restrict flow. If the hole is constructed either with materials that encourage the growth of these bacteria or in such a way that these bacteria cannot be clean out then this problem may persist and reduce the flow from the rock into the hole.
Groundwater flow through a rock tends to be slow and laminar. When water is encouraged to move rapidly towards a pumping hole the laminar flow gives way to turbulent flow and friction occurs. The change from laminar flow to turbulent flow usually occurs close to the sides of the hole or water well. An efficient water well will be one that through design and construction encourages laminar flow.
The minimum diameter of a hole for a water well is dictated by the diameter of the pumping device to be installed in the hole. The pumping device and its diameter is in turn dictated by the yield required or anticipated and the head lift.
Groundwater chemistry and quality is not the same throughout a saturated rock. The water in the upper part of the rock will tend to be younger water which has not neccessarily had time to reach chemical equilibrium with the minerals in the rock. This water will also tend to contain recent contaminants washed down from the surface. Deep in the rock the water will be older. It will be slower moving and chemically different from the younger waters above. To create a sustainable water supply or source it is important to put equal emphasis on obtaining a sustainable yield and a sustainable and predictable quality and chemistry. This is an important concept in the design and construction of a water well which has not been fully realised until recently. There is no point in having lashings of water if the quality and chemistry is unacceptably variable. It is very difficult to treat and make simple management decisions for a water source where the quality can change
10

/AH Portlaoise Seminar 1996
rapidly and without warning. Therefore the design and construction of a hole may be a compromise whereby some waters are excluded or discouraged from entering the hole in favour of others with an acceptable quality and chemistry. For example the upper part of a hole may be lined with solid casing to prevent shallow contaminated water entering the hole. Similarly the depth of the hole may be restricted to prevent say deep, older corrosive water with a low pH entering the water supply system and corroding not just the metal well fixtures but also the distribution pipes and even the household plumbing.
Following on from the above it can be seen that the design of a water well in a particular place should be based on:-
the type or types of rock or aquifer available • the seasonal and annual available groundwater resource • the sustainable discharge rate required from the well or well field • the sustainable quality of water required from the well or well field • the vulnerability of the groundwater system to contamination • the need to monitor well performance and carry out routine well maintenance
GENERAL WATER WELL DESIGN
The general design for a water well drawn upon by a submersible pump is a hole completed in two parts; an upper pump chamber and a lower open hole or producing section. The pump chamber casing is described in the 1995 IAH paper but it is summarised as follows. A pump chamber is an upper section of the water well designed to protect the pump, allow cooling water to flow evenly around the electric motor situated below the pump intake, encourage even flow of water from the producing section, reduce the likelihood of small abrasive particles being drawn into the pump intake and allow the pump to be easily stabilised and withdrawn from the well. The pump chamber is formed by a blank or non perforated section of casing, wholly or partially cement grouted into place. The pump chamber casing can be used to block off or inhibit the inflow of shallow groundwater that is vu lnerable to contamination.
The inner diameter of the pump chamber should be at least 2 inches greater than the pump motor diameter and bigger than the outer diameter of the pump bowls and cable guard. The depth of the pump chamber must be such that the pump intake can be placed at least 2 metres below the lowest anticipated pumping water level. Not only does this requirement mean that the pump 'never runs dry' but also means that the open hole or producing section of the borehole is not exposed to oxygen and periodic wetting and drying. In other words all the rise and fall of water levels in the hole is confined to inside the pump chamber.
The producing section is the lower part of the water well. The producing section may be left as an open hole, ie without a screen or slotted casing, if the aquifer is hard rock and stable. Even if part of the producing section does come loose and falls into the hole it will not usually impair the water well integrity or performance. The pump is above this section and protected in the pump chamber and water can usually make its way up past the piece of rock that has fallen into the hole.
If the rock or aquifer is unstable or an unconsolidated formation then it will be necessary to install a screen to support the hole sides and yet allow the groundwater to flow into the hole. An artificial gravel pack may need to be installed between the screen and the aquifer material. Whole chapters of books have been written on well hydraulics, screen slot configurations, open hole areas, screen materials. This information and the concepts relating to natural and artificial gravel packs and design calculations needed to select slot size are all relevant. However it is possible to make too much of them and over complicate the design and construction. Screens are usually
11

/AH Portlaoise Seminar 1996
available in lengths of 5-6 metres. Smaller lengths of 3 and 2 metres are available. Unconsolidated aquifers are usually not laid down by nature in convenient even thickness layers that correspond to these lengths, therefore it is inevitable that the ideal screen slot diameter will not always be placed next to the appropriate aquifer material. A compromise will always have to be made. The main point about screens is that they have three main functions; to stop the sides falling in, allow water with as little turbulence as possible to move from the aquifer into the borehole, and to allow water, air or chemicals to move out from the well into the aquifer when the well needs to be developed before going into production or worked over at a later stage to improve yield or quality.
SPECIFIC DESIGN AND CONSTRUCTION PRINCIPLES AND PROBLEMS
The design and construction of a water well can be approached from general or text book principles some of which are above. There are also several books and manuals on drilling boreholes, digging wells and hydrogeology which cover the subject. However I have found that reality either here or elsewhere seldom fits with a text book. I have found that I encounter and carry out a text book piece of work from start to finish roughly once ten years. Usually choices are limited, or drilling and groundwater conditions are uncertain. Kieran O'Dwyer has described some of the uncertainties in his earlier paper. The purpose of the main text in this paper is to discus the limitations we face as hydrogeologists, groundwater engineers and drillers in Ireland, and in so far as some of these limitations can be changed, suggest ways of improving the situation for ourselves and our clients.
OBJECTIVES, AIMS AND PRECONCEPTIONS
One of the greatest limitations on good borehole design and construction is the poor definition of objectives by both the client and the driller/hydrogeologist. Most water wells are constructed for individuals, local authorities, group water schemes and industry. In almost all cases the client has no formal training in groundwater. In some cases the client may have had direct or indirect prior experience of drilling for water or using a groundwater supply. This experience may have been confusing or unsatisfactory. The client may therefore have either a naiive or distorted perspective on the aims of the work he wishes to be carried out and he may be distrustful of both hydrogeologists and drillers. Often from the client's perspective the aim is to get as much water as possible for as little outlay as possible. It is also a perspective that, once a water well is constructed, it is unchanging and will require no monitoring or maintenance. For these reasons and others it is often the clients temptation to engage a water diviner who doesn't complicate the issue, merely marks the spot and says 'here you'll find water'. It is important to recognise the limitations imposed by a clients preconceptions.
I suggest that what we can do is first recognise the preconceptions of the client and not blame the client. Second I suggest we don't collude with the client. By this I mean we do not buy into the client's objectives in order to get the work. For example if the client says he wants 10,000 gallons per hour then ask why and check out the figures behind these requirements. It may be that the client only wants I 0,000 gallons per hour because that is the peak demand for perhaps I hour per day, or it may be that he wants I 0,000 gallons per hour because he wants to restrict pumping to cheap night time electricity and yet still meet the daily demand. Either way it is difficult to construct a I 0,000 gallon per hour borehole in Ireland and yet still keep to good sustainable water well design principles. Obtaining I 0,000 gallons per hour is very difficult given Ire lands aquifers. It is likely that to obtain this amount it will be impossible to case off shallow groundwater that is vulnerable to contamination and the pump will have to sit in open hole. The result will be unpredictable water quality, water treatment problems and a pump in an exposed position. The drawdown needed to get a fracture flow aquifer to yield I 0,000 gallons per hour could be very
12

/AH Portlaoise Seminar 1996
high. As a result there is turbulent flow, high friction losses and low well efficiency and hence uneccessarily high pumping heads and pumping costs.
The list of constraints and problems that arise from accepting a client's requirements at face value is endless, therefore the objective must be to listen, understand, question, suggest alternatives and the most difficult of all perhaps turn round and refuse the work. This applies to consultants as well as drillers. It is up to us to inform the client and challenge the client's and our own practices in order to improve water well construction standards. It is not up to the client to do this. For example the answer to the demand for a single I 0,000 gallon per hour well may be a different pumping regime, storage system, water use and perhaps two 2,000 gallons an hour boreholes pumping continuously with low heads and sustainable quality.
AQUIFER AVAILABILITY AND GROUNDWATER EXPLORATION
Ireland has few large isotropic aquifers where the results·from one water well can be extrapolated with confidence to the site of another hole. Similarly there has been no national well inventory of existing boreholes. This uncertainty about the availability of the aquifer and the aquifer properties means that a borehole design cannot be fixed in terms of depth, construction materials or even diameter. It is strongly suggested that all production boreholes should be preceded by the construction of one or more exploration boreholes. Ideally these holes should be pump or yield tested for both quantity and quality and then water levels and quality should be monitored until at least the end of a summer and the first recharge events of autumn.
The production water wells should be designed on the basis of the exploration boreholes and a detailed inventory of existing groundwater sources and information and pollution hazards.
As I say this I can hear in my mind clients, drillers and hydrogeologists all saying the client won't pay for this work, it will take too long, we don't need this. The answer to this is a question 'What will it cost later in terms of failure to meet expectations by not investing in essential work in the beginning?'
SUSTAINABLE SOURCE CONCEPT
The success or failure of a water well has always been measured by the yield of the well. A 20,000 gallon an hour hole has always been seen as far superior to a 2,000 gallon an hour hole. Yields are unpredictable in fracture flow aquifers. Drillers, engineers and hydrogeologists have therefore been loath to case off shallow groundwater inflows for fear that no further water would be found. This yardstick has been a constraint on design and construction of water wells. Pump chamber casings have not been installed. Pump chamber casings have not been grouted into place to seal the annulus from surface contamination and seal off near surface groundwater that is vulmnerable to contamination.
In the paper at this meeting in 1995 I stressed the concept of a sustainable source, meaning sustainable in terms of quality as well as quantity. Ireland is not short of water but it is short of consistent high quality water. To improve the standard of the water wells we should aim to design and construct wells where sustainable quality becomes a higher priority than quantity. This change of emphasis will also encourage the concept of a well field. A well field could be two or more water wells drawing upon the best quality water and giving a yield equivalent in quantity to a single water well drawing upon mixed poor and good quality water. Having more than one water well also allows for wells to be shut down for maintenance. Relying on a single well as the sole source of supply is risky. Hopefully the change of emphasis will aid the clients
13

/AH Portlaoise Seminar 1996
understanding of the nature of groundwater and the investment that is needed to get the supply they need.
Water quality is not only dictated by the quality of the water in the aquifer but also can be easily influenced or undermined by the materials used in the construction of the well. For example the use of mild steel casing and screen and mild steel rising main for the pump in a water well tapping corrosive groundwater will lead to varying levels of dissolved iron in the discharge water. In areas where the groundwater has a field pH of less than 7.00 and an Eh of less than +200mV and is low in dissolved calcium bicarbonate I would suggest the use of inert pump chamber casing and screen.
The pumping rate from the water well may also effect water chemistry and hence water quality. It may be prudent to pump continuously at a rate lower than the maximum discharge rate rather than pump for short periods at a higher rate.
DRILLING RA TES - BASED ON DIAMETER AND DEPTH RATHER THAN COST OF CONSTRUCTION
The perception of the public and clients concerning water wells has influenced the structure of water well construction rates. Water well construction rates have in tum fed back into the perceptions of the public and clients, and reinforced notions of the value of different activities used in the construction of a well. There is circular process that controls or inhibits good water well design and construction. This is open to challenge and hopefully change.
The public, for a variety of reasons, have belief that a deep borehole is somehow better than a shallower hole, even though in many cases most of the yield was gained in the top 10 metres. The public can also see the work that is done to achieve a deep hole. The public and clients are prepared to pay for depth of hole. It is seen as something necessary and it is also measurable. A client can check that a hole has been drilled to the depth claimed. Clients to a certain degree acknowledge that a wider hole takes more work and is also of value. There is a common notion that the volume of water stored in the well is of value. This may be true in the case of an intermittently used domestic supply well drilled into a low permeability formation. However when this translates into a value judgement on a well for a public or industrial supply in almost continuous use it hides the fact that the most valuable attribute of a water well is the ease with which water can move from the aquifer into the well.
Against these attributes that are perceived to have a value, there are many other vital tasks in the proper construction of a sustainable well that are little valued. The value of using casing is not easily appreciated by clients. The value of sealing off unwanted poor quality water with cement grout is also not appreciated. The value of fully developing a well using compressed airlift surging is also not fully appreciated.
Well construction rates reflect the client's values. Drillers base most of their charges on depth and diameter of open hole drilled. To a certain degree the profit made by these rates is used to cover the other tasks involved in the construction and completion of the borehole, some of which are not charged.
Casing is often charged on a footage installed basis. These rates are often just the cost of materials plus IO - 20%. The rates seldom reflect the effort and time involved in, for example, welding together a 3-4 length steel casing string and installing it into an unstable overburden above a weathered karst limestone aquifer. On a footage basis a driller may make £60 -£100 for installing a 60 foot 8" ID pump chamber casing yet it could take 4-5 hours to install the casing
14

JAH Portlaoise Seminar 1996
vertically in difficult conditions. Against this paltry £60-100, the driller could drill for the same length of time at 8" diameter, achieve a depth of 150 feet plus and be paid £1500 or more for his efforts. Well construction rates encourage drilling progress and the excavation of deep holes. The low rates and hence rewards for other activities are a disincentive to drillers to carry out proper or higher standard well construction and completions.
The rates for drilling increase per foot or per metre in almost exponential proportion to diameter. It is true that to drill a 1 O" open hole takes longer than to drill a 6" open hole in a hard rock. It is also true that a 1 O" bit costs more than a 6" bit. If the wear on the bit is the same per metre drilled then the cost of bit wear is higher for IO" holes.
However the much higher rates for the wider hole diameters works against better well design and construction for the hydrogeologist and to a certain degree makes life difficult for the driller. Clients do not want to pay for wide diameter drilling particular when it is for the purpose of installing a conductor casing or pump chamber casing. For example drilling 60' at IO" diameter to install a 6" pump chamber casing for a 4" pump could cost the client over £1100 (not including casing or cement grouting) whereas 60' at 6" diameter could cost £250-£360.
The tendency of the client is to keep costs to a minimum and try and trim off what are seen as non productive luxuries. Even if the client does eventually accept the need for a pump chamber casing the pressure will be there to drill only an 8" open hole for say £720. If the driller accepts this compromise design, the loss of time spent trying to get 60' of 6" casing into an 8" hole is probably far greater than the differential cost of the rig time and bit wear from drilling a 10" hole. Another reason why high rates for wider diameters are not entirely justified is that the wider diameters are usually used for the upper part of the hole only. This is often rapid and easy drilling in say glacial till. For example I recently opened a hole for a 20 foot length of IO" conductor
casing at 121/4". The drilling in sandy boulder clay took 3 minutes and cost over £400. The driller then struggled for 45 minutes to get a single length of casing vertically into the hole during which time he would have earned roughly £25. If! had made life easier for the driller by agreeing to a 15" open hole it could have cost me £700 under present rates for may be 5 minutes work. It is in my interest and the drillers interest to drill a wide diameter hole for casing but not in the client's interest at a rate of£ 140 per minute.
It can be clearly seen that from the above general comments and specific examples there is a need to break out from the constraints of construction rates that favour making holes. There needs to be a thorough revision of the rates so that genuine and valuable work is fairly paid in its own right. I suggest that hydrogeologists and engineers first recognise the work and value of good quality work carried out to install a gravel pack, or fully cement grout an annulus around a casing. Second I suggest that we must enforce that recognition with the clients. Third I suggest we negotiate with the drillers fair rates for all the non drilling work and in return seek a reduction in rates for drilling diameters.
I suggest a basis for doing this would be proper supervision on site so that work could be fairly measured and second a realistic price for work that contains a cost of materials plus an hourly rate that reflects the running and standing costs of a £400,000 drill rig that needs to be replaced every 4-5 years, and a tradesmans man hour rate for the rig crew. The combined rig and manpower rate could be£ 150 - £200 per hour.
I think that there is ample evidence to show that there is a constraint in the current system of valuing and pricing work that holds back necessary improvements in water well design and construction.
15

!AH Portlaoise Seminar 1996
DRILLING CAPABILITY
A final constraint in the construction of water wells are the limits in drilling capability. Down Hole Hammer drilling for water wells is the preferred drilling technique. This is for several reasons, some of which go back to the rates discussed above. DHH drilling is very fast and effective in hard rock particularly limestone, and most of the holes in Ireland are drilled in hard rock. Money can be made drilling quick DHH holes. Changing drilling method during the course of a hole involves changing tools and this takes time which is currently not paid for. Many drillers do not have formal training in different drilling techniques and therefore would be hesitant to use a new technique.
DHH drilling is not suitable for drilling overburden and unconsolidated materials. Airflush with either drag bits or rock roller tricone bits with subs and stabilisers would be more appropriate and in thick sticky clays much faster and cleaner.
Similarly DHH drilling can lead to problems in highly fractured rocks and in particular karst limestones where cuttings are flushed into cavities above the drill bit. The non return or loss of these cuttings means the driller and geologist are drilling blind, and cuttings can return and trap the bit and hammer when the airflush is shut off during pipe changes. Hammer oil can also be flushed into the aquifer cavities to return later when the well is put into production.
Reverse circulation airlift drilling with tricone bits is widely used elsewhere for drilling karst limestones. Cuttings are cleared from the hole up the drill stem. This method also has the advantage for hydrogeologists that water samples coming partly from the drill face can be used to assess water chemistry variations with depth. This information can be used to design the final completion details for the well. Finally well development is easier and faster because coarse and fine cuttings have not been driven into fractures or cavities along the hole length.
A third factor that inhibits the design and construction of water wells is the poor off road capability of the drilling machines. It is often difficult to carry out inexpensive exploratory drilling in winter because most rigs have road tyres and do not have three axle drive with differential locks on the half shafts. The poor off road capability restricts site selection during perhaps half the year. For production wells where the site has been chosen with confidence it is possible to justify building a road way and hard standing, but for the critical exploration phase flexibility in choice of site is very important. At the moment this flexibility is difficult to achieve.
To be free to design and construct better standard water wells it is necessary to expand the range of drilling techniques, drilling equipment and improve the training of drillers.
STANDARDS
The paper last year was presented as a contribution to a National Standard for drilling . I again urge that a document should be produced, but I withdraw the notion of a Standard and instead suggest that the aim of the document should be to produce National Guidelines for Good Drilling Practice. This document could also contain as an appendix a framework for drilling contracts, drilling specifications and bill of quantities. The tone and content of the guidelines could be similar to the pre-committee version of the Irish Bottled Water Standard I drafted for NSAI in 1990. I suggest that to produce and agree such a combination of documents could take three
16

!AH Portlaoise Seminar 1996
years. I suggest the formation of a sub committee of the !AH (Irish Group) combining with at least representatives of the drillers, IE! and the IAEG.
CONCLUSIONS
There is considerable scope for improvements in the design and construction of water wells in the country. The design and construction of a water well is in theory relatively simple and straight forward. The principles and techniques are well known. The difficulties arise in part from the geology and hydrogeology in Ireland. Information on the potential aquifers is patchy and yields and quality are difficult to predict. These are characteristics that we as drillers and hydrogeologists can do little to change or improve. However as I hope I have illustrated there are many characteristics or factors that relate to perceptions, understandings and past methods of working that inhibit better well design and construction. These characteristics can be changed and are being changed. Therefore in summary the process of designing and constructing a water well is at the moment an iterative process. A process that goes backwards and forwards across the same range of factors trying to find the most appropriate compromise. It is a process that starts with listening to the clients perception of his needs and objectives, and then responding with information and ideas that take into account sustainability, ease of management, economics of well design and pumping rates. It is followed by obtaining from drillers rates for drilling and supply and installation of materials. It then proceeds back to the client with alternative designs that relate to both groundwater conditions, the sites and the clients budgets. And so it goes on until eventually a compromise is reached within the reality of the limitations. The water well may be successful but it is a difficult process and the theoretical good well design is often lost.
17

/AH Portlaoise Seminar 1996
18

/AH Portlaoise Seminar 1996
WATER WELLS - MONITORING, MAINTENANCE AND REHABILITATION or
Do my we/lies leak ?
Peter Howsam Water Management Department
Silsoe College, Cranfield University
ABSTRACT
Water wells whether used for abstraction or for monitoring purposes are to a large extent out of site and out of mind. Their siting, design, construction, operation and maintenance are often dealt with by more than one person/organisation and therefore responsibility is shared and diluted Too greater numbers of water wells are not functioning in an optimum manner. Abstraction wells may be unreliable, yield lower than expected quantities (or quality) of water, or higher energy inputs are required for a given supply. For monitoring wells the integrity of the data obtained is brought in to question, resulting in erroneous diagnosis and/or delayed implementation. Today approaches need to, and are, changing. There is improved knowledge and scope for better communication and cooperation between the professionals involved There are economic as well as professional benefits to be gained by doing our jobs better.
No longer should we walk on to sites with leaking we/lies
INTRODUCTION
It is estimated that about 40% of water wells around the world are operating inefficiently or have been abandoned. Current practices in relation to the monitoring, operation and maintenance of wells are highly variable in both policy and action. The reasons are equally variable although a traditionally conservative industry has encouraged the perpetuation of poor as well as good practices, aided by a scattering of misconceptions based on lack of awareness and knowledge. Some water well operators have valuable assets in the form of groundwater abstraction works, of which they really have little idea of condition or operating efficiency. A lot of groundwater resource and quality data are being collected which may be of questionable value because the true condition of the monitoring well is not known.
Whilst many might claim to have an overall strategy for the monitoring and diagnosis, operation and maintenance of their wells, in practice a strategy often means nothing more than reacting to events as and when they occur. In some instances little routine monitoring and maintenance is carried out and even when monitoring does occur the data is sometimes just filed away and forgotten!, thus precluding any chance of predicting problems and allowing avoidance measures to be planned.
Water well performance recovery is often attempted on a 'suck-it-and-see' approach, with typically less than a 50% success rate. Part of the problem has been the seeking and offering of standard solutions without due regard to the circumstances of the well, the nature and extent of the cause processes and the nature and consequence of the cure process(es) applied. Such a situation is not helped by a degree of lack of co-operation between the different professions involved.
19

!AH Portlaoise Seminar 1996
Well operational problems often reflect poor design/construction. Proper attention to these problems should, but do not always, feedback in to the better design, construction, operation of new wells.
UNDERSTANDING
Over time a considerable knowledge about water wells has been acquired. To a significant extent this knowledge is based on experience rather than full scientific understanding. Whilst this experience has stood the industry in good stead, gaps in understanding have often been slow to close.
Performance of a groundwater abstraction system is measured in terms of how much water is produced, either absolutely or per unit input of effort. It should not be forgotten that performance relates to all the components in the system, i.e. the aquifer, the well, the pump and associated pipework. A reduction in performance will occur as a result of a change in condition of one or more of these components. A change in condition will in tum arise as a consequence of one or more processes.
UNDERSTANDING WHY - cause processes
The practical significance of reduced well performance is dependent on the ease with which this can be avoided or rectified. Changes in drilling, design and/or operation practice can obviate many problems, whilst various treatments can be used to rehabilitate the wells. None of these measures can be implemented in a rational and optimised manner without first both identifying and understanding, the processes which give rise to the problem. The primary processes involved may be categorised as: Physical; Chemical; Microbial. Important secondary factors are : Operational; Structural. Rarely do these factors occur in isolation.
Physical processes In general terms these processes can be described as the redistribution of particulate matter which results in the clogging of apertures and reduction in material permeability. Specific processes include:
• Drilling fluid invasion damage at the time of construction; • Inter-mixing of aquifer horizons as a result of wash-out/caving during drilling and development; • Inter-mixing of aquifer and gravel-pack material due to over aggressive development; • Migration of fines from the aquifer towards the well and into the gravel-pack material during
operation;
There are some misconceptions about drilling fluid damage. Bentonite has a bad reputation for causing severe skin damage on the drilled well face, but modern drilling polymers have the capacity to cause internal damage within the formation, which may be equally difficult to remove.
Another variation of the physical processes is abrasion by the impact or passage of relatively high velocity particle laden water. Pump impeller wear is commonly reported but there have been cases of holes being 'sand-blasted' through steel well linings.
Chemical processes In general terms these usually mean chemical precipitation and the formation of encrustations. The most commonly reported encrustations are those dominated by iron oxyhydroxides, iron carbonate and calcium carbonate. The former occurs when ferrous bearing anaerobic groundwater becomes oxygenated causing the ferrous to ferric conversion and the precipitation of insoluble ferric
20

/AH Portlaoise Seminar 1996
oxyhydroxides. In groundwater environments the ferrous/ferric balance is influenced by pH and Eh. Whilst often quoted in texts, calcium carbonate is in practice less commonly observed. Typically the precipitation of calcium carbonate is explained by the pressure drop, carbon dioxide release and the consequent affect on the carbonate/bicarbonate equilibrium, which occurs as groundwater approaches and enters a pumped well. For many circumstances in and around a well however, the pressure/flow/temperature/time conditions as generally perceived, are not adequate to cause the deposits sometimes observed or predicted. This implies that either flow conditions around a well are not properly understood or that other factors play a significant role in the process.
The consequence of encrustation is reduced hydraulic efficiency due to deposition in and therefore clogging of formation and gravel-pack pores, screen-slots, pump inlet and passages, and due to the reduction in effective internal diameter and/or an increase in surface roughness of rising main and other pipework and fittings.
Corrosion can be classed as an electro-chemical process which can be extensive or intensive depending on the combination of materials use, and their condition - such as welds, cut and threaded sections and points where protective coatings have been damaged. Severe corrosion if allowed to continue will affect the integrity of the system components, i.e. loss of mechanical strength especially at joints, leading to screen/casing parting or collapse; rupture of pump line-shaft; perforation of riser; and disintegration of pump components. As well as structural failure other consequences are the production of aesthetically unacceptable discoloured water, and on the hydraulic side reduced supply due to leakage and increased head losses where corrosion-encrustation increases surface roughness and reduces conduit dimensions. All of these result in the need for costly and inconvenient measures to recover supply.
Reference to corrosion can be found in very early groundwater engineering literature. Yet despite this history of knowledge and experience, corrosion problems are still far too prevalent in engineered systems. This applies no less to groundwater engineering.
Microbial processes Part of the problem of not dealing fully with corrosion in water wells is the relative lack of awareness of the significance of microbial processes in groundwater abstraction systems. It is now understood that microbial activity plays a part in many clogging encrustation processes, which typically have been regarded as purely chemical or physical processes. Earlier lack of appreciation of this microbial activity can be explained by the fact that groundwaters and aquifers, which are not obviously polluted, are widely perceived as being bacteriologically 'pure'. Although groundwater does contain far fewer micro-organisms than surface water it is by no means sterile. The soil through which much groundwater passes on its way to the aquifer is absolutely teeming with micro-organisms. Some of these can adapt to conditions in the aquifer and become residents, some can be introduced into the aquifer during drilling (migrants) and some described as ultra-microcells, with extremely slow rates of metabolism and by shedding surplus cellular material, become itinerants able to travel long distances through the aquifer.
Biofouling describes the activity of sessile micro-organisms which attach themselves to, and develop biofilms on, surfaces. The biofilm typically consists of bacterial cells, extracellular slime and inorganic material trapped or precipitated within the biofilm. Colonisation of surfaces in aquatic systems can be ecologically advantageous. As water flows over the biofilm surface, nutrients are extracted more efficiently than would be possible if the micro-organisms were free-floating. It can be assumed that in most groundwater environments that there will be bacteria present and adequate nutrients to permit growth.
21

/AH Portlaoise Seminar 1996
There are many bacteria (e.g. Gallionella) which can initiate/enhance the formation of commonly encountered iron deposits and others which are associated with precipitation of calcium carbonate in natural environments. The consequences of biofouling will in some cases be visually obvious, i.e. a slimy material can be observed clogging the strainer of a retrieved pump or soft filamentous material can be observed with a down-hole CCTV camera, covering the slots of a well screen. In other cases however the appearance of the clogging material, e.g. brittle encrustation, clay-like sludge, will give no clue that microbial activity is, or has been, involved.
Biocorrosion or microbially induced corrosion (MIC) is the result of the colonisation by microorganisms, of metallic surfaces and the subsequent formation of biofilms. The micro-environments so generated can initiate or enhance corrosion. Common processes include the setting up of concentration cells on the surface of the metal where a biofilm develops. Microbial activity within the biofilm will reduce oxygen so that the centre of the biofilm becomes anodic compared to the edge of the biofilm where oxygen is present, which becomes cathodic. This process results in localised pitting. Also redox conditions can be created snitable for·the growth of anaerobic sulphate reducing bacteria, which are able to enhance/induce corrosion processes. The sulphate reducing bacteria cause the removal of cathodic hydrogen that promotes continuation of the corrosion process by depolarizing the cathodic area of the metal surface. The depassivation of the metal surface produced by the microbial reduction of insoluble ferric deposits to soluble ferrous compounds can also occur. Furthermore the formation of corrosive metabolic by-products from the bacterial activity within a biofouling deposit can enhance corrosion rate. Examples include the production of sulphuric acid by sulphur-oxidising bacteria, and the production of organic acids, hydrochloric acid, hydrogen sulphide, and ferrous sulphide, by anaerobic sulphate reducing bacteria.
The consequences of biocorrosion are the same as described for corrosion, except that stainless steels are particularly vulnerable to biocorrosion and on the water quality side, metabolic by-products can produce compounds with unpleasant tastes/odours ( e.g. the bad-egg smell of hydrogen sulphide 1s common) and which impart an oily sheen to water surfaces.
The rate and extent of biocorrosion and biofouling are largely controlled by engineering factors imposed on the natural environment, E.g. the design, construction and operation of a water well, which in turn influence key process factors such as flow rate, flow direction, and the location of the aerobic/anaerobic interface.
Operational factors Inappropriate operating schedules can enhance many of the primary processes discussed above. Examples of this are intermittent pumping that may lead to increased particle redistribution (sand pumping and fines migration) as a result of the higher velocities generated at start up. Intermittent pumping may also increase the oxygenation of groundwaters in and around the well. Pumping wells at too high a rate or pumping a group of wells together with high levels of interference, may cause pumping water levels to fall below the top of the screen. This again enhances oxygenation and therefore the potential for iron fouling. It also necessitates placing the pump within the screen , thereby increasing the potential for sand pumping and fines migration where there is intermittent pumping.
Long term over-abstraction will by lowering regional water levels, reduce aquifer transmissivity and therefore well performance.
Structural factors Poor design and construction will compound problems caused by the above primary processes. Such problems should (we hope) largely relate to old wells that were designed in the absence of current knowledge and experience. Poor construction or more precisely lack of proper supervision of
22

/AH Portlaoise Seminar 1996
construction is probably however still one of the main factors in poor well performance. Examples include:
• Insufficient care taken when installing/joining the casing/screen string which may lead to parting at joints and particle ingress to the well;
• Inappropriate use and improper placement of grouting materials, which may lead to ingress of polluted or oxygenated waters into the well;
• Poor selection and installation of gravel-pack, which may lead to movement of material through the screen causing damage to the screen itself and the pump, or to clogging of the gravel pack by formation material;
• Poor selection and implementation of drilling method, leading to hole instability, caving and collapse of the well.
• Use of inappropriate well casing/screen materials/types, which can influence other processes; E.g. the use of ferrous materials where there is a risk of corrosion.
UNDERSTANDING WHEN/WHERE - monitoring and diagnosis
Proper diagnosis requires a range of hydro geological and operational information, which experience shows is all too often not available because appropriate monitoring has not taken place. On the other hand monitoring and diagnosis should not be undertaken purely out of historical habit. It must be considered as an integral part of any good groundwater supply management strategy. As such it is part of a cycle not an independent exercise with no direction or consequence.
Monitoring Monitoring and inspection techniques that are used to facilitate diagnosis are available at all levels. It can be aimed either at performance, or at the conditions that affect performance, or at the processes that generate the condition. There is however a hierarchy of monitoring. The first and most obvious priority is performance. However having identified a reduction in performance it is then necessary to identify where and what is the problem. Knowing the condition of the components of a system may allow the selection of appropriate curative or preventative action but often this will not be adequate without also identifying and understanding the processes which generated the condition.
Different parameters will be monitored depending on the location (aquifer, well, pump, headworks) and purpose of the monitoring (performance, condition, process).
• Key performance parameters are: rest/pumping water levels, abstraction rate/volumes, operating hours, specific capacity, water quality.
• Key condition parameters are: visual appearance, operating functionality e.g. direct observation ofretrieved and/or dismantled components.
indirect in-situ observation using CCTV and fibre-optic systems. leakage noise/vibration
• Key process parameters are hydraulics, water quality, environmental factors NB: Microbial activity can generate localised conditions in which the hydrochemistry is totally different from the bulk water chemistry, thereby negating the reliability or usefulness of bulk water chemistry data. Indirect diagnosis of a process can be obtained by quantification of substances required for a process and by the detection of substances generated by a process ( e.g. for biocorrosion - organic carbon and other nutrients, and hydrogen sulphide). A. more direct method is the installation, and periodic retrieval, of coupons in an operating well. Such coupons can then be examined for the development of biofouling deposits and biocorrosion. Alternatively as a less direct but less intrusive, more easily observed measure, monitoring devices such as
23

/AH Portlaoise Seminar 1996
moncells or flow-through cells can be installed at the well-head. For distribution from the wellhead in-line monitors such as the Robbins device can be installed along the pipeline.
Monitoring methods can simply be classified as manual or automatic and periodic or continuous.
Diagnosis It is important that once collected, data is analysed and utilised in diagnosis. Diagnosis can be made more or less easy by the way the data is handled and processed. Data handling may range from storing data on data sheets to be kept in hard-copy files to fully comprehensive computerised databases. Most organisations are currently somewhere in between these two conditions. A networked computer system is likely to be more efficient than trying to organise a file copy/transfer system especially where different locations are involved. The easiest form of data processing is a graphical representation of the observation with time that provides a rapid visual indicator of changes in the monitored parameter, which in tum should stimulate the next phase of interpretation and diagnosis.
There are two circumstances for diagnosis:
• Diagnosis during routine monitoring: A proactive process where the story evolves with time and data. Problems are anticipated and curative or preventative action can be taken in a planned manner in order to avert serious consequences to operations and supply. This approach or variations on it are to be encouraged.
• Diagnosis for particular events after they have occurred: A retrospective process where the story is unravelled by piecing together bits of any available historical data, combined with new information gained from post-event investigations. It is unlikely to be successful if baseline data are not available or are not reliable. Currently diagnosis for many water well operators takes the latter form and frequently runs in to difficulties because insufficient information is available. This approach is not recommended.
UNDERSTANDING HOW - cure processes
Whilst successful cures to well performance deterioration are dependent on a correct diagnosis and a full understanding of the cause process(es) involved, it is important that the cure processes applied, are also equally well understood. A lack of success with maintenance or rehabilitation projects often stems from the application of an inappropriate technique or the inappropriate application of a potentially suitable technique. Much of this approach is summarised in the expression 'suck-it-andsee1.
In general 'cures' can be categorised in a similar way to that for 'causes', i.e. primary processes: physical, chemical, hydrodynamical and secondary procedures: operational, structural and mechanical. In practice it is likely that a combination of several processes or procedures will be required in order to achieve optimum results. Again as with 'causes' they may be applicable to various parts of the groundwater abstraction system: i.e. the aquifer, well, pump, distribution
Physical processes Simple physical processes include brushing, scrapping, and the use of explosives. The method adopted should reflect the well design and the nature of the condition to be rectified or the material to be removed.
Sophisticated physical processes include hydrofracturing and pasteurisation, irradiation, and ultrasonics. The latter has not been widely adopted since there are grounds for believing that the
24

!AH Portfaoise Seminar 1996
process can lead to the breaking of the cement/casing bond and possibly other joints/seals, leading to the ingress of non-aquifer waters into the well. Pasteurisation and irradiation are common laboratory/industrial sterilisation techniques. Both processes have been adopted for trials in the treatment of biofouled wells. In the case of irradiation it is understood that the doses required are at a similar level to those used for food irradiation. Whilst the process could be effective, public fear of radioactive processes and the high degree of sophistication, would suggest that this process will not be widely utilised. In the case of pasteurisation, the temperature of the water in the well needs to be raised to 60 Celsius for about 30 minutes to be sure that all bacteria have been killed. Methods of raising the temperature, include the injection of high pressure steam or hot water, and the in situ heating of the water with an electric heating element. As can be imagined large amounts of energy are required to heat up the water column in and around a well screen and this together with the equipment required means that pasteurisation is likely to be limited to where such resources /facilities are readily available.
Chemical processes The tendency to provide recipes for common problems can lead to difficulties if proper thought is not given to the condition to be rectified and the nature of the chemical process applied, The main reason for using chemicals are to disperse, dissolve and disinfect.
Typical dispersants (or surfactants) are polyphosphates (e.g. Calgon) and detergents (or drilling foam). They are applied in order to help break-up and disperse wall cakes, developed during drilling ( e.g. bentonite skin) and deposits of redistributed clays and fines originating from the formation. The chemical process needs to be used in conjunction with physical agitation processes and with simultaneous rather than subsequent pumping, in order to be fully effective. There is little point in chemically breaking down a clogging structure if the material is not removed, but left to be deposited elsewhere.
Acids are the obvious choice for dissolving common encrusting/biofouling deposits. The commonest is hydrochloric acid (food grade only should be used) but other acids such as sulphamic and hydroxyacetic are also used. Inhibitors, dispersants and sequestering agents may be added to inhibit attack on well components and to keep dissolved material in solution/suspension, but this practice has declined where such additives are considered harmful to the groundwater environment. It is important to know what other materials that are acid soluble are in the well and surrounding aquifer and also what will be the by-products of the process. The production of gas and pressure build up can be dangerous and destructive. In the treatment of iron biofouling secondary clogging may occur due to the formation of gels. Cement dissolution in sandstones can result in the release and migration of fines to cause clogging.
Where biofouling or biocorrosion processes are occurring it may be appropriate to treat the system with a disinfectant or biocide. Common biocides are chlorine based compounds and hydrogen peroxide. The latter is particularly attractive because it generates heat which aids the process, and water as the main by-product poses no threat to the environment. On the other-hand, chlorine compounds such as sodium hypochlorite are much more readily available.
Hydrodynamical processes In simple terms this refers to any process in which involves a washing/agitation action with water; E.g.
• Surging by use of a bailer, surge-block or by intermittent pumping, using an airlift system or a mechanical pump. Over-zealous application of the surge-block can lead to secondary clogging or collapse;
25
/AH Portlaoise Seminar 1996
• Jetting which like surging is a common technique that can be effective. Both however are difficult to quantify and therefore open to mis-application. So called high pressure jetting, is in practice applied by anything from a 300 psi drilliug rig mud pump, to a 30,000 psi purpose built pump. In practice jetting is will not be effective unless applied close to the surface and at high pressures exceeding 3000 psi. Screen slot shape and frequency will influence the effectiveness of the jetting process and it is suggested that jetting will be of minimal use for gravel-pack/formation development where torch-cut, louvre, bridge-slotted and geotextile wrapped screens are installed.
Operational procedures Many problems can be reduced by altering operational procedures: e.g. sand pumping and iron fouling can often be reduced by reducing pumping rate and/or by adopting a continuous instead of an intermittent operating schedule. Fouling in pumps may be reduced by selecting pumps with lower inlet and through-flow velocities.
Structural/mechanical procedures In the event of structural failure of part(s) of a well there a three principle options: repair, replace or reline:
• Repair: A casing break for instance may be repaired in situ by backfilling the well with sand to a short distance below the break; inserting a cement plug at the break; forcing some of the cement out in to the annulus; drilling at a reduced diameter through the cement plug and then removing the temporary fill, to leave a cement collar seal.
• Replace: Should the condition of the well be suitable an alternative option is to retrieve the casing/screen string and replace it with a new string of appropriate design and materials.
• Reline: If the above options are not feasible then relining the well or part of it with a new reduced diameter string, may be an appropriate option. This is a relatively straightforward operation and the reduced diameter of the new lining need not restrict pump size and yield if only the screened section is relined. The ability to develop or rehabilitate the old screen/gravel pack should it become clogged in the future, will however be very limited.
Pumps and pipework are relatively easy to retrieve to the surface, to be cleaned and repaired or abandoned and replaced, depending on condition.
ATTITUDES
DIFFERENT PROFESSIONS
The well is traditionally dealt with by a variety of professionals, at different stages of development, usually in an uncoordinated manner. People involved with water wells cover a wide spectrum: drillers, drilling engineers, directors/managers of drilling companies, directors/managers of equipment manufacturing and supply companies, contractors, consultants, manufacturing/design engineers, civil engineers, water supply engineers, groundwater engineers, hydrogeologists, geologists, field technicians, etc. Shared responsibility can be both a benefit or a handicap. With relation to water wells it has largely been a handicap. It is not usually the fault of one particular individual or of one of the professions involved. It is largely due to an inability or sometimes unwillingness for parties to work together. For example the hydrogeologist usually investigates the aquifer, selects the site, often designs, and supervises construction of, the well. Once the well has been completed it is then usually handed over to the user i.e. the water supply or irrigation engineer or monitoring technician. As long as either water is delivered at the well-head or measurements can be made, little attention is given to the below-ground, out-of-sight, out-of-mind system, until a problem occurs. The consequences of such an approach can now be seen in many cases to be
26

!AH Portlaoise Seminar 1996
inefficient, with disbenefits with regard to economics, public health, food production and user confidence. This is particularly important in developing countries where weak economies could well do without the added strain of supporting inefficient systems or where failure can simply lead to going without.
'SUCK IT AND SEE'
In hard commercial world it is perhaps hard for consultants or contractors to admit they do not know and there is therefore a tendency to be bullish and dive in with answers without due consideration. Asking for information or for the money to obtain it, may often seem like getting blood out of a stone. Anyway you are supposed to be an expert and should be able to come up with the answer on the information available?
It is necessary for practitioners to understand all the processes and elements in a groundwater abstraction system. By understanding the well situation and both cause and cure processes the engineer has a better chance of matching the correct solution to the problem. If this is not the case then any of the following permutations could occur for maintenance or rehabilitation:
• the correct application of an appropriate method • the correct application of an inappropriate method • the incorrect application of an appropriate method • the incorrect application of an inappropriate method
With only one out of four of these leading to success it is easy to see how a significant proportion of attempts at rehabilitation in the past has met with only partial success or failure.
The principle elements in well performance maintenance can be summarised as follows:
• Baseline information is required in order to be able to plan monitoring of future condition and performance
• Monitoring of the aquifer, well and its operation are required to acquire data • Data needs to be processed and analysed in order to achieve a diagnosis • A diagnosis is required in order to identify the cause • The cause needs to be identified in order to select a cure or preventative action • A cure may involve maintenance or rehabilitation • The consequences of any cure need to be monitored • Diagnosis of a cause should be used to select alternative operating schedules in order to
prevent/reduce problem recurrence; and should be used to amend the design/construction of new wells in order to avoid/reduce problem recurrence
PREVENTION IS BETTER THAN CURE
The influence of well design and construction on performance is primarily geared towards maximising yield, with relatively little consideration given towards performance maintenance. This is not good practice. The aims of good design and construction practice should be to minimise or avoid problems, to make monitoring easy and effective and to allow scope for maintenance work where it is anticipated and cannot be avoided ..
27

/AH Porllaoise Seminar 1996
Once awareness and understanding of cause processes, diagnosis and cure processes has been gained, it is not sufficient to give oneself a bonus or a congratulatory pat on the back, it is important that the lessons learnt are fed back to others for the future improved design and operation of new wells.
Aquifer performance It is often possible to identify patterns of behaviour for well performance in relation to a particular aquifer. In such situations it should be possible to avoid or reduce problems by alternative designs and operating procedures. However it is also commonly noted that wells in the same aquifer can exhibit a wide range of performance history. This is because performance relates to the interaction between the well and the aquifer. Therefore even if the hydrogeological or hydrochemical characteristics of the aquifer remain relatively constant, performance history can vary depending on how the well was constructed and how it is operated and maintained.
Design and construction The weight of evidence and experience from all sources points towards man-made conditions rather than natural (hydrogeological/hydrochemical) conditions as being the primary cause of reduced well performance. Indeed the installation and operation of a well in an aquifer do itself disturb the natural equilibrium and create the opportunity for processes to occur which can adversely affect well performance. When the installation of a well and its subsequent operation are wrongly executed or are executed without due care then such adverse processes can be greatly enhanced. There are a variety of scenarios relating to the design and construction of a well that are very likely to have, in time, an adverse affect on its performance:
• The formulation of an inappropriate hydraulic design • The selection of inappropriate materials • The selection of inappropriate equipment • The inappropriate execution of an appropriate design • The inappropriate installation of appropriate components
• The use of an inappropriate drilling system • The use of an inappropriate construction technique • The provision of inadequate quality control /supervision
Operation The influence of operating schedule on performance should be well understood but is frequently ignored. Many detrimental processes are caused or enhanced by high velocities (sand pumping) and by the introduction of oxygen to the system (iron fouling). These conditions are significantly affected by the operating schedule; i.e.
• rate of abstraction ( controlled by pump capacity/speed; valves; distribution constraints • sequence of operation ( e.g. continuous; periodic daily cycle; seasonal cycle)
The introduction of oxygen will be enhanced when:
• the pumping water level falls below top of screen - allowing cascading l'Lll)'.? - aquifer over-abstraction in long term; pumping rate too high, well in need of
rehabilitation
• the pumping water level oscillates allowing repeated movement of groundwater through potentially oxygen bearing partially or un-saturated formation within cone of depression
why? - intermittent operation
28

/AH Portlaoise Seminar 1996
Velocities will be higher when:
• the pump starts-up • a new higher capacity pump is installed • flow impeded in other parts of system
INTEGRATED STRATEGIES
The way forward must be with more integrated approaches to water well management that are costeffective, functional and sustainable.
Maintenance is intended to preserve a level of performance by keeping in good repair both the system and its component parts. Whereas rehabilitation is the process of restoring a system to its original level of performance or its component parts to their proper condition. In applying a cure to a particular problem, in many cases the difference between maintenance and rehabilitation is only the degree to which a technique may have to be applied. General experience suggests that maintenance is easy and successful if carried out properly on a regular basis at shorter rather than longer intervals. Wells neglected for long periods of time develop to a condition that cannot be fully rehabilitated. With time, worsening rates of decline in performance can be expected as various conditions and processes interact to compound or introduce new, problems.
Management A major factor in generating renewed interest in well operation and maintenance in the UK has been the requirement for water supply companies to establish Asset Management Plans (AMPs). Indeed the exercise should help to remind all groundwater abstractors and monitors that the groundwater and the well (the means by which it is abstracted or monitored, are their most important assets. In preparing AMPs companies are forced to take due regard of all their facilities and to assess their condition and operating life, together with maintenance and or replacement costs.
The technologies involved are not particularly difficult to adopt and implement. What is equally important but probably more difficult to implement is the setting up of facilities and infrastructure that permits the full interaction between all the professions/departments who should be involved but who traditionally in the past have worked in isolation. In very few countries has a policy of planned and systematic monitoring, operation and maintenance been adopted and successfully implemented.
Economics Increasingly the cost effectiveness of any activity has a high profile. For water wells the primary options are: • a strategy that involves integrated monitoring, diagnosis, maintenance, design and operation. • a strategy that involves no planned monitoring and maintenance, but simply involves dealing with
problems as and when they arise.
The second option requires no further comment except that costing is carried out on a retrospective basis. The first option can of course be further divided into a range of secondary options that will largely reflect the technical circumstances prevailing in any given situation. Any cost benefit evaluation will need to give due regard to the components of the system, agencies involved, consequences, linkages, capital and running costs, hydrogeological and engineering factors, risks involved and alternative strategies. As well as these technical issues there are less tangible issues such as customer satisfaction and confidence that may be weakened by unreliable and poor quality supplies from poorly maintained water wells. ·
29

!AH Portlaoise Seminar 1996
Organisations are now starting to adopt attitudes that are backed by funding and action which might previously have been considered beyond that necessary to provide a least cost technically adequate supply. In doing so management and other water supply company staff gain confidence and professional pride in providing a good service. These are criteria that are not normally costed but indeed do have an indirect cost benefit for any organisation.
Legislation Water well owners and operators are subject to regulatory controls. The principle control is that of licence to abstract. In some areas concern over limited resources may mean refusal to grant an abstraction licence for any new proposed well site. Where this policy exists the option for a water supply company, of new replacement wells is not available. This in turn will force attention on to the rehabilitation option, i.e. the rehabilitation of existing licensed sources, where the granted licensed abstraction may often exceed actual abstraction.
The other regulations influencing water well operators providing potable water, are obligations to provide a regular and reliable supply of wholesome water. Any process or condition that causes a groundwater source to fail in any of these respects is therefore to be avoided.
CONCLUSIONS
A SUMMARY OF DO'S AND DON'TS:
• Do employ good drilling practice and proper supervision during construction • Do assess well design at each site rather than automatically repeating a 'standard' design • Do adopt a flexible, consultative approach to problems that may arise during drilling and
construction. • Do incorporate ease of monitoring and maintenance into well design. • Do take care over choice of construction materials and over screen/gravel pack design • Do adopt a maximum averaged entrance velocity of 0.01 mis in well design. • Do adopt a monitoring and maintenance strategy which is cost-effective
• Don't operate wells at their maximum physical capacity • Don't over-pump relative to well design and aquifer capacity • Don't allow pumping water levels to fall below top of screen • Don't employ intermittent pumping, if possible • Don't apply a suck-it-and-see approach to rehabilitation
CURRENT & FUTURE DEVELOPMENTS
To a large extent the methods and technology discussed in this paper are known and are to varying degrees already being implemented. What is probably most needed is training which will enable fully integrated strategy development within different organisations. Training is also required in the proper application of cost benefit analysis in water well operation and maintenance and specifically with the identification of cost elements and levels of service requirements or aims.
30

!AH Portlaoise Seminar 1996
KEY REFERENCE
Howsam, P., Misstear, B.D. and Jones, C.R. (1995). Monitoring, maintenance and rehabilitation of water supply boreholes. CIRIA Report 137, London.
BIBLIOGRAPHY
Banks, D., Cosgrove, T., Harker, D., Howsam, & P., Thatcher, J., (1993). The use of acidisation in the development and rehabilitation of boreholes. Quarterly J. Eng. Geol. (& Hydrogeology) 26.2, 109-125.
Barnes, I., & Clarke, F.E., (1969). Chemical properties of groundwater and their corrosion and encrustation effects on wells. US Geological Survey Paper 486D, Denver.
Blackwell, I.M., Howsam, P. Walker, M.J. (1995). Borehole performance and particulate damage in alluvial aquifers. Quarterly J. Eng. Geol. (& Hydrogeology) 28, sl51-sl62
Blackwell, l.M., Howsam, P. Walker, M.J. (1995). Permeability impairment around boreholes m micaceous aquifers. Quarterly J. Eng. Geol. (& Hydrogeology) 28, s 163-s 175
Boquet, E., Boronat, A., & Ramos-Cormenzana, A. (1973). Production of calcite crystals by soil bacteria is a general phenomena. Nature 246, 527-529.
Borch, M.A., Smith, S.A. & Noble, L.N. (1993). Evaluation and restoration of water supply boreholes. A WW A Research Foundation, Denver.
Britton, C.F. ( 1990) Corrosion monitoring and inspection. In: Microbiology in Civil Engineering, 370-378. Ed. P.Howsam. E. & F.N. Spon, London.
Britton, R.J. & Rumsey, P.B. (1990). The role of asset management. J. Inst. Water & Env. Management 4, 251-255.
Caldwell, D.E. ( 1986). Microbial colonisation of surfaces. In: Proceedings of the International Symposium on Biofouled Aquifers: Prevention and restoration, 7-10. A WWA, Atlanta.
Characklis, W.G., Cunningham, A.B., Escher, A., & Crawford, D. (1986). Biofilms in porous media. In: Proceedings of the International Symposium on Biofouled Aquifers: Prevention and restoration, 57-78. A WWA, Atlanta.
Characklis, W.G. & Wilderer, P.A. (1989). Structure and function of biofilms. J.Wiley & Sons, London.
Clark, L., (1977). The analysis and planning of step drawdown tests. Quarterly J. Eng. Geol. (& Hydrogeology) 10, 125-143.
Clarke, F .E. ( 1980). Corrosion and encrustation in water wells: a field guide for assessment, prediction and control. FAO Irrigation and Drainage Paper 34. Rome
Cosgrove, T. (1990) The use of borehole CCTV surveys. In: Water Wells: monitoring, maintenance and rehabilitation, 82-86. Ed. P.Howsam. E. & F.N. Spon, London.
31

!AH Portfaoise Seminar 1996
Cullimore D.R. & McCann A.E. (1977). The identification, cultivation and control of iron bacteria in groundwater. In: Aquatic Microbiology, 219-261. Eds. Skinner & Shewan. Academic Press, New York.
Cullimore, D.R. (1990). An evaluation of the risk of microbial clogging and corrosion in boreholes. In: Water Wells: monitoring, maintenance and rehabilitation, 25-34. Ed. P.Howsam. E. & F.N. Spon , London.
Cullimore, D.R. ( 1990). Microbes in civil engineering environments. In: Microbiology in Civil Engineering, 3-12 & 15-23. Ed. P.Howsam. E & F.N. Spon, London.
Cullimore, D.R. ( 1986). Physico-chemical factors in influencing the biofouling of groundwater. In: Proceedings of the International Symposium on Biofouled Aquifers: Prevention and restoration, 23-26. A WW A, Atlanta.
Driscoll, F.G. (1986). Groundwater and wells. Johnson Division, St Paul.
Gilbert, P.D., & Herbert, B.N. (1987). Monitoring microbial fouling in flow systems using coupons. In: Industrial Microbiology Testing, 79-97. Soc.Applied Bact. Technical Series.
Hamilton, W.A. (1985). Sulphate reducing bacteria and anaerobic corrosion. Ann. Rev. Microbiol. 39, 195-217.
Hasselbarth, M., & Ludemann, D. (1972). Biological incrustations of wells due to mass development of iron and manganese bacteria. Water Treatment & Examination 21, 20-29.
Herbert, R. & Barker, J.A. (1990). Predicting and interpreting well behaviour and well efficiency. In: Water Wells: monitoring, maintenance and rehabilitation, 114-119. Ed. P.Howsam. E. & F.N. Spon , London.
Howsam, P. (1988). Biofouling in wells and aquifers. J. Inst. Water & Env. Management 2, 209-215.
Howsam, P. (1989). CCTV surveys in boreholes and tubewells. Irrigation News 14, 35-38.
Howsam, P. (1991). A well-head monitoring cell - a diagnostic tool for boreholes/tubewells with reduced yields and other operational problems. In: Proceedings of the International Conference on Geosciences in Development. Nottingham University, Sept.I 988. Ed. D.A.Stow & D.J.L. Laming, AA Balkema, Rotterdam.
Howsam, P., Brassington, F.C. & Lucey, P.A. (1989). The examination of encrustations in an unlined borehole using the sidewall sampling technique. Quarterly J. Eng. Geo!. (& Hydrogeology) 22.2, 139-144.
Howsam, P. & Hollamby, R.J., (1990). Drilling fluid invasion and permeability impairment in granular formations. Quarterly J. Eng. Geo!. (& Hydrogeology) 23.2, 161-168.
Howsam, P., Tiller, A.K. & Tyrrel, S.F. (1995). Biocorrosion in groundwater abstraction systems. In: Microbial Corrosion, 354-366. Eds A.K. Tiller & C.A.C. Sequeira. EFC Publication 15.
Howsam, P. & Tyrrel, S.F. (1989). Diagnosis and monitoring of biofouling in enclosed flowsystems: experience in groundwater systems. Biofouling 1.4, 343-351.
32
/AH Portlaoise Seminar 1996
Howsam, P. & Tyrrel, S.F., (1990). Iron biofouling in groundwater abstraction systems - Why & How? In Microbiology in Civil Engineering, 192-197. Ed. P.Howsam, E.& F.N.Spon, London.
Jones, G.P. & Brassington, F.R. (1991 ). Data collection, storage, retrieval and interpretation. In: Applied Groundwater Hydrology, 96-113. Eds R.A.Downing & W.B. Wilkinson. Clarendon press, Oxford.
Kelly, G.J. and Kemp, R.G. (1974). The corrosion of groundwater pumping equipment. Australian Water Resources Council Technical Paper 12, Canberra.
Lee, S.H., O'Connor, J.T. and Banerji, S.K. (1979). Biologically mediated corrosion and water quality deterioration. In: Proceedings of Conference on Water Quality Technology (Philadelphia). American Water Works Association, Denver.
McCoy, W.F. & Costerton, J.W. (1982). Fouling biofilm development m tubular flow systems. Developments in Industrial Microbiology 23, 551-557.
McDowell-Boyen, L.M., Hunt, J.R. & Sitar, N. (1986) Particle transport through porous media. Water Resources Research 22.13, 1901-192!.
McLaughlan, R.G. and Knight, M.J. (1989). Corrosion and incrustation in groundwater bores: a critical review. Centre for Groundwater Management and Hydrogeology, Res.Puhl. 1/89, University of NSW, Australia.
Pelzer, R. & Smith, S.A. ( 1990). Eucastream suction control device: an element for optimisation of flow conditions in wells. In: Water Wells: monitoring, maintenance and rehabilitation, 209-216. Ed. P.Howsam. E. & F.N. Spon, London.
Picologlou, B.F, Zelver, N., Characklis, W.G. (1980). Biofilm growth and hydraulic performance. J. Hyd.Div., ASCE 5, 733-746.
Richard, M.R. (1979). The organic drilling fluid controversy. Water Well J., Apr/May, 66-74 & 50-58.
Skinner, A.C., (1988). Practical experience of borehole performance evaluation. J. Inst. Water & Env. Management, 2, 332-340.
Smith, S.A. ( 1989). Manual of hydraulic fracturing for well stimulation and geologic studies. National Water Well Association, Ohio.
Smith, S.A. (1992). Methods for monitoring iron and manganese biofouling in water wells. American. Water Works association, Denver.
Sutherland, D., Howsam, P. and Morris, J. (1993). The cost-effectiveness of monitoring and maintenance strategies associated with groundwater abstraction. ODA Project 5478A Report , London.
Tiller, A.K. (1982) Aspects of microbial corrosion. In: Corrosion Processes, 115-159. Ed. R.N. Parkins. Applied Science, Barking.
33

/AH Portfaoise Seminar 1996
Tiller, A.K. (1988). Some case histories of corros10n failures induced by bacteria. Int. Biodeterioration, 24, 231-237.
Tiller, A.K. (1990). Biocorrosion in civil engineering. In: Microbiology in Civil Engineering, 24-38. Ed. P.Howsam. E. & F.N. Spon, London.
Tyrrel, S.F. & Howsam, P., (1992). Towards better asset management in groundwater engineering. Borehole Water Journal 24, I 0-11.
Tyrrel S.F. & Howsam P. (1994). Field observations of iron biofouling in water supply boreholes. Biofouling 8, 65-69.
US Geological Survey (1969). Evaluation and control of corrosion and encrustation in tubewells of the Indus plains, Pakistan. USGS Water Supply Paper 1608-L, Washington.
Van Beek, C.G.E.M., (1989). Rehabilitation of clogged discharge wells in the Netherlands. Quarterly J. Eng. Geo!. 22.1, 75-80.
Van Beek, C.G.E.M. & Hettinga, F.A.M. (1990) Benefits of proper monitoring and maintenance. In: Water Wells: monitoring, maintenance and rehabilitation, 353-360. Ed. P.Howsam. E. & F.N. Spon , London.
Wissel, D., Leonhardt, J.W. & Beise, E. (1985). The application of gamma radiation to combat ochre deposition in drilled water wells. Radiation Physics and Chemistry 25, 57-61
34

/AH Portlaoise Seminar 1996
ESTIMATING THE RELIABLE OUTPUTS OF WATER WELLS
Bruce Misstear, Trinity College Dublin Sarah Beeson, Groundwater Development Consultants Ltd Jan van Wonderen, Groundwater Development Consultants Ltd
ABSTRACT
The methodology for determining the reliable outputs of water wells described in this paper was developed during a recent research contract in the UK. The methodology includes two main approaches, one based on the use of well and wellfield operational data, and the second based on analysis and extrapolation of pumping test data. The former approach is preferred where there are good operational records of abstractions and pumping water levels; however, the second approach can be very useful for new well sources where operational data are unavailable, or for existing sources with complex operational histories. An example of the application of the methodology to real well data using both approaches is described. The paper ends with a discussion about the applicability of the methodology to water supply wells in Ireland.
INTRODUCTION
Water supply undertakers need to be able to assess the reliable output of their individual supply sources, especially during prolonged dry periods when the balancing of supply capacity against water demand may be critical. For groundwater sources, the reliable output is a function of many different factors relating to both the resource and to the sourceworks. Relevant factors include the properties of the aquifer and the amount of recharge, the construction and physical condition of the well or wells, the capacity of the pumping plant and treatment system, and the existence or otherwise of any regulatory controls on well abstractions, minimum groundwater levels and impacts on river flows.
The methodology described in this paper is based on a recent research contract carried out by the authors for UK Water Industry Research. The aim of the project was to develop a relatively simple, yet auditable, methodology which can be applied to the full range of groundwater source types in the UK, from Chalk wellfields in east Anglia to single alluvial wells in Scotland. Both well and spring sources were covered in the study, but only wells are considered in this paper.
GENERAL CONCEPTS
DEPLOY ABLE OUTPUT AND POTENTIAL YIELD
The concepts of deployable output and potential yield are fundamental to the methodology which follows. The formal definitions of these terms are:
Deployable output (DO)
The output of a commissioned source or group of sources or of bulk supply as constrained by: • licence (if applicable) • water quality • environment
35

/AH Portlaoise Seminar 1996
• treatment • raw water mains and/or aqueducts • pumping plant and/or well/aquifer properties • transfer and/or output main for specified conditions and demands.
Potential yield (PY)
The yield of a commissioned source or group of sources as constrained only by well and/or aquifer properties for specified conditions and demands.
In essence, therefore, the difference between the terms is that the potential yield of a well is a function only of the characteristics of the well and the aquifer, whereas the deployable output takes into account a whole range of other factors which may limit the supply from that well. The specified conditions and demands referred to in the definitions include normal and drought water level conditions and average and peak demands.
DEFINITION OF DROUGHT CONDITIONS
Before describing the methodology itself, it is necessary to say a few words about the drought water resources conditions for which the methodology was mainly developed. In England and Wales it is a requirement for a water undertaker to report the reliable outputs of its water sources to the water supply regulator OFW AT. It is a further requirement that these figures are reported for the drought condition and that the return period for the drought is stated. For surface water sources, the drought return period can be determined from analysis of river flow data. But how should a groundwater drought be defined? Should this be based on an analysis of rainfall, of recharge or of groundwater levels? Even if one of these is selected as the main criterion, it is still very difficult to apply the concept of return periods, since the severity of a groundwater drought at any location will be influenced by the complex interaction of many other variables, including the aquifer properties and the antecedent conditions in both the aquifer and the unsaturated zone.
Therefore the concept of return period has not been adopted in this methodology. Instead, a pragmatic approach has been adopted in which the drought condition is defined by the year when groundwater levels fall to their all-time minimum in the vicinity of the source, as indicated by long term records from nearby observation wells. This means, of course, that the drought condition for groups of sources under study may be defined by water levels in different years. Thus in the UK, for example, the 1988 to 1992 drought produced the lowest groundwater levels in parts of eastern and southern England, whereas in other areas of England the 1976 drought had a greater impact on water levels, and in parts of Scotland the 1984 drought was the worst.
THE METHODOLOGY
Perhaps the main requirement in the development of a methodology for estimating reliable outputs is flexibility: the methodology should be capable of accommodating a wide range of available data, user applications, demand conditions and groundwater source types. For example, the methodology should allow simple estimates of DO where there are few data, yet permit more sophisticated predictions of PY where there are a lot of good data available. Again, the methodology should enable the user to assess the DO or PY of a source for both normal and drought water level conditions, and for average or peak demand. Finally, if the methodology is to be of general use, it must be capable of being applied to a diverse range of source types and aquifers, from a single well ( or spring) in a uniform sand aquifer to a large, complex, well field in a fissured limestone aquifer.
36

!AH Portfaoise Seminar 1996
Because of this need for flexibility, the methodology for well sources includes a number of options which are grouped under two main headings, the operational approach and the analytical approach. The former uses data from normal operational practices whereas the latter requires pumping test data. The approaches and options are summarised in Figure I.
Deployable Output (DO) (for existing operational practices)
•~nd statmi<:s •Qu.1H1y coouuainL< eE,wironmental conslOJnL< •SouicewoW conw;i1n1,
•Licence •Operauo n..aJ oulpUU •Drough1 definition eDcm.ind swisli<:s •Qu•li1y constrainL< eE.nvironroenll.l conwainu eSourcewo.lu consU\\inu ePump1ng wuer levels
DO & Potential Yield (PY) (for existing operational practices)
Operational Approach
Opiion C
eL,uoce •0pen1uor.al OotpuU •Drought deli muon •Oem&ndmti.!uc:, •Qualily constnJnU •Envoroomc<H.al conwainL< •SourcewOfk.lcon.iramu •Pumping watct levels eWcll constNCtion, spacing, OD level, ete] elltoology, logginglCC'fV, ac DAPWL
DAPWL: 11\e <leq>est ad•i~le pump"'""' level
Analytical DO & PY (for continuous pumping)
Analytical Approach
Option D
•OpenliONJ OUlpllU
•Drll'Jght definJLIOn •Denwld staWUCs •Qu.ahly COO.Sll'llnU
eE.nvironrnetltal COl\$lmnts
•Souiccworli consuaiou •Pumping wllet levcb eWe!l cOOSUIIClion, spa,;1.11g, OD le-el. w: J •Ulhology, logg1nglCCTV, et.: DAPWL •Add!liont.! hydrogwl.ogy:
-Yield/dnwdown relaliocuhil" -Aquifer lr:tl!Sl!'UU!"ty -Aquifer siouge ch&neteriwcs
•Non, um ,n "'"" levels
Figure 1 The different approaches and options for estimating deployable output and potential yield
THE OPERATIONAL APPROACH
The operational approach is subdivided into three options (A, B and C). The choice of option depends on the amount and quality of the data that are available, with option A being the simplest and option C the most advanced option.
The methodology is based on the completion of an assessment form (required for options A, B and C) and the preparation of a summary diagram ( options B and C only). The assessment form is shown in Figure 2. Its main purpose is to summarise and compare the relevant output parameters. The assessment form can be completed for periods of drought or normal water level, and for conditions of average or peak demand. The summary diagram shows the relationship between the total output of the source (accumulated volumes per month or week, expressed as MIid) and corresponding water levels in the well or wells at the source. The diagram should include all known depth-dependent features, constraints on output and pumping test results. An example is included in Figure 3.
Option A This option may be used where water level data are unavailable or where the user requires a simple assessment of the DO. Completion of the assessment form for drought conditions and average demand,
37

!AH Portlaoise Seminar 1996
[1J !Licence Rate
[I] !Actual Output
II] [1J minus [I]
~ Constraints on Output
a) Quality Constraints
b) Environmental Constraints
c) Sourceworks Constraints
d) Other Constraints
Source Reference
Condition Demand
Water Level
--~- High Solute Concentrations (ego! Iron, manganase or nill'llt&)
t
Salinity
Turbidity
Sand Ingress
Other
Prescribed River Flow
Prescribed Groundwater Level
Other
Pump Intake
Treatment Works
Transfer/Output Main
Other
0 Minimum Value
10 Minimum of [1J and 0 0 I Potential Yield I {the output corresponding to the deepest acMsable pumping
water level on the summary diagram)
0 I Deployable Output I Minimum of 0 and 0 Comments
Figure 2 The assessment form
38
I .· ·,,,
I I i

JAH Portlaoise Seminar 1996
:;] (!J al
.s ,; > .3
! ;;:
10
12
14
" Drought CuNe
18
20
22
Pump Intake Level 24
" 28
Deepest Advisable Pumpin Water Leve!
,0
32
0 2 3
0 o I
0
0 0
jo 1
i I ®© '
I ®® 5
o Operational data
• Step test data
Operational data are for months when water levels are at or near their annual minimum for the
years of the worst drought to have affected the area of the source.
© ®
6 7 8
Total Output (MVd)
Potential Yield
Constraints on Output '------' Deployable Output
• - - - - • CD Annual Licence
- - - ® Pump Capacity
-··-··-·@ Pump Intake Leve!
© Treatment Works
© Transfer/ou!put main
© Output at which excessive sand ingress occurs
The deployable output for drought condition and average demand
is constrained by the pump intake level
Note: water !evels may be as metres belOw ground !eve! (m BGL), as metres relative to ordnance datum (m AOD) or as metres relative to other stated datums
Figure 3 Example of a summary diagram
39

!AH Portlaoise Seminar 1996
for example, requires information only on licence (if applicable), actual monthly output for the worst drought period on record (as defined by regional water levels) and any data available on limitations to output imposed by water quality, the environment or by the well construction and ancillary plant.
Option B This is a slightly more advanced option than option A. The additional data required are water levels and the outputs at which pump intake levels become a constraint.
Option C This is the most advanced of the options based on operational data and should produce the best estimate of DO. It also allows calculation of the PY. In addition to the data needed for options A and B, option C requires that the deepest advisable pumping water level (DAPWL) be defined for each well at the source. The DAPWL concept is introduced to prevent undesirable effects occurring in a well if the pumping water level were to reduce further. In some cases the DAPWL will be defined by the features of the well construction, such as the base of the solid casing or the top of an adit, or by features of the aquifer, such as the base of a confining layer or the level of an inflow zone corresponding to a particular fracture. Information from geophysical logs, downhole CCTV surveys, drill records etc, can be used to select the DAPWL.
THE ANALYTICAL APPROACH (OPTION D)
The analytical approach ( option D) can be used for new sources where operational records are unavailable, or for existing sources which have complex operational practices. As with option C, both the DO and PY can be calculated. The data required include step drawdown test data and estimates of aquifer properties.
Drawdowns are estimated for a range of total yields for continuous pumping lasting 200 days (for average demand), and converted to pumping water levels. The relationship between total yield and estimated water levels is then indicated by a curve on the summary diagram and the DO and PY are read from the diagram in a similar manner to that for the operational approach.
A relatively simple method may be used to estimate the 200 day drawdowns (although more sophisticated methods based on groundwater models could be adopted if desired). Firstly, step test data are analysed to establish the relationship between well yields and short term drawdowns (which include well losses). Next the drawdowns after 200 days pumping are estimated by adding an additional drawdown to the values derived from the step tests. This additional longer term drawdown is calculated using a formula derived from the Cooper-Jacob equation for non-steady radial flow in a confined aquifer:
Additional drawdown =Dru, where 6s = 2.3Q/4nT
Dis the number of log cycles of time between the end of the step test and 200 days 6s is the drawdown per log cycle oftime Q is well discharge Tis aquifer transmissivity
An estimate of aquifer transmissivity is required to calculate ru. At many sites the aquifer system may be complex - for example transmissivity in a fissured aquifer may reduce significantly as the water level approaches the DAPWL. In such cases, a lower transmissivity value should be used in the calculation.
40

!AH Porllaoise Seminar 1996
Finally, for multiple well sources, one further component of drawdown needs to be added, the interference drawdown between the pumping wells. This can be calculated for a range of yields using the Cooper-Jacob equation for non-steady flow in a confined aquifer (as given in Kruseman and de Ridder, 1990):
another
2.3Q l (2.25Tt) s= -- og 411:T r 2S
where s is the drawdown at one borehole produced by pumping at a discharge Q from
Sis the aquifer storage coefficient r is the distance between the boreholes Tis aquifer transmissivity t is time= 200 days
The interference drawdowns and therefore pumping water levels are normally estimated assuming equal and concurrent pumping from all the wells. The individual curves for each well are plotted on the summary diagram and the DO and PY are estimated using the curve for the worst performing well.
EXAMPLE OF A RELIABLE OUTPUT ESTIMATION
The example which follows is for a well source in a fissured Chalk aquifer. Although the source consists of two wells (containing a total of five pumps), these wells are only 12 m apart and are connected by an adit. Water levels are identical in both wells which therefore act as a single well source. Operation is 'continuous' but with a 12 hour rest period each week. The reliable output for drought conditions and average demand has been estimated using each of the options outlined above.
OPERATIONAL APPROACH
Figures 4 and 5 show the completed assessment form and summary diagram respectively. For option A, only the assessment form is required. This gives a DO equal to the licence rate of 15.87 Ml/d.
Option B takes account of water levels and pump intake levels, but not the DAPWL. This gives a DO of 15 Ml/d, less than the licence rate as the DO is limited by the intake level of two of the pumps.
For option C, the PY is defined by the DAPWL (set to one metre above the top of the adit) on the drought curve, and equals 12.3 MIid. The DO becomes the same value as the PY. Therefore the DO derived by this, the most comprehensive, operational method is lower than the values obtained by options A and B.
ANALYTICAL APPROACH
The results of the water level calculations for a range of yields assuming continuous pumping for 200 days are plotted on Figure 5 (as a drought curve). This curve is less steep than the curve obtained using the operational approach. The main reason for this discrepancy is that the curve for the operational approach is based on total outputs which are smaller than the actual pumping rates (because the source is rested each week). The analytical approach gives a PY and DO of 13.8 Ml/d, the values being defined by the intersection of the (analytical) drought curve with the DAPWL.
41

!AH Port/aoise Seminar 1996
l'l!a(MVd) llJilil I Source Reference Chalk well Nr I
QJ !Licence Rate I' 15.87 Condition
Demand
Water Level
[D minus 0
0 Constraints on Output
a) Quality Constraints --~- High Solute Concentrations
0
0 0
b) Environmental Constraints
c) Sourcewot1<s Constraints
d) Other Constraints
Minimum of 0 and
(&O ot iron, manganese or nitraie)
i---- Salinity
- Turbidity
- Sand Ingress
'-- Other
t Prescnbed River Flow
Prescnbed Groundwater Level
Other
0
L Pump Capacity
Pump Intake
Treatment Wor1<s
Transfer/Output Main
Other
[}] Minimum Value
I Potential Yield I (the output corresponding to the deepest acMsable pumping
water level on the summary diagram}
I Deployable Output I Minimum of 0 and 0 Comments
Note: 15 (B, C) = this value applies to options B and C.
Average
Drought
::1~--~1:·1
?i" . "i} - I I'• :==::::::··.·
Ii :=====;1%1 :===:1t'.
I I
I
I
'I
1:, ~===: :~ I >20
···115(B&CJ[~
. I 1g
.1:==:::;-cl :. .1~_~1.: ' --~ '' .. .,..,.
I >20 (A) I-:· ·J 15 (8. Cl
I 15.87 (A) r. 15 18. Cl
I 12.3 (Conly) k_:: ·-··
J5.87(c\), 15(8) 12.3 (Cl
Note: in this example, the results of the estimates using options A, B and C are all shown on the same form, whereas in practice separate forms would be used for each option.
Figure 4 The completed assessment form for the single Chalk well source example
42

/AH Portlaoise Seminar 1996
15 14 13 12 11 10 9 8 7 6 5 4 3 2 1 0
0 ·1
0 ·2 <( .3
.s -4 ai .5 >
" ·6 ..J
~ .7
"' ·8 ;;:: .9
·10 ·11 ·12 ·13 ·14 -15 ·16 -17 ·18
• 19 ·20 ·21 ·22 ·23 ·24 -25
0
Drought Curve (analy1ical)
/ • Drought Curve (operational) -------,
Deepest Advisable Pumping Level
Deployable Output = Potential Yield (operational) = 12.3 MVd
[option CJ
Intake Level Pumps 4 and 5
Intake Level Pump 1
Intake Level Pump 2
Intake Level Pump 3
Deployable Output = Potential Yield (analy1ical) = 13.8 MVd
[option DJ
"
*
Deployable Output (operational)= 15 Ml/d
[option BJ
Annual Licence = 15.87 MVd
Total Pump Capacity in Excess of 20 MVd
2 3 4 5 6 7 8 9 10 11 12 13 14 15 16 17 18 19 20
Total Output (MVd)
1988/89 1989/90 1990/91 1991/92 1992/93 Step Test
* 0 0 • • ...
Figure 5 Summary diagram for the single Chalk well source example
43

/AH Portlaoise Seminar 1S96
DISCUSSION
1. The methodology described in this paper is intended for use by water undertakers in the UK. As part of the research contract the methodology was applied to ten case studies from across the UK and proved relatively simple to use in these examples, with auditable results. It is hoped that the various options within the methodology will cater for the likely range of user requirements, data availability and source types. Nevertheless, certain refinements may be necessary in the future. For example, the means of estimating the constraints on source outputs imposed by environmental factors may need to be looked at further.
2. Although developed for the UK water industry, the methodology should also be relevant to well operators in Ireland. Importantly, the methodology can be applied to water wells in fissure-flow aquifers of the type found here in Ireland.
3. Where sufficient good quality operational data exist, then option C is generally the preferred option for wells in non-uniform, fissure flow aquifers. Option D (the analytical approach) can provide good results for sources without such operational records. However, the analytical approach has the limitation that it is based on extrapolation of short term test data, and the extrapolation will inevitably involve greater uncertainty when dealing with non-uniform aquifers and complex boundary conditions. Nevertheless, the effects of dewatering of fissures, for example, can be accommodated to some extent by assuming reduced values of aquifer transmissivity when calculating the long term drawdowns.
4. Initial enquiries by a research student at Trinity College Dublin suggest that operational data of the kind required for option C ( or indeed B) are generally not available here in Ireland (Cronin, pers. comm.). If this is indeed the case then a methodology based on the principles in options A and D may be the most appropriate. A methodology for determining the reliable outputs of groundwater sources in Ireland would need to take account of the particular user requirements, the amount of information normally available, the different types of well and spring sources, and the fact that abstractions are not constrained by licence.
ACKNOWLEDGEMENTS
This paper is based mainly on a research contract carried out by Groundwater Development Consultants Limited for UK Water Industry Research Limited. The work was steered by a project team appointed by UKWIR. The authors would like to thank UKWIR and the project team for permission to publish this paper. The opinions expressed in the paper are those of the authors alone.
REFERENCES
Beeson, S, van Wonderen, JJ & Misstear, BDR. 1995. A methodology for the determination of outputs of groundwater sources. UK Water Industry Research Limited, London.
Kruseman, GP & de Ridder, NA. 1990. Analysis and evaluation of pumping test data Second edition. Publication 47 of the International Institute for Land Reclamation and Improvement, Wageningen.
44

/AH Portlaoise Seminar 1996
LOCATION AND DEVELOPMENT OF MAJOR NEW LIMESTONE AQUIFER IN COUNTY CORK.
Brian P.Connor. Consultant Hydrogeologist. Brian P.Connor & Associates Limited
ABSTRACT.
The River Clyda is the source for the public water supply to the town of Mallow (North Cork). The current usage is 500,000 gpd but the capacity of the source and the location of the distribution reservoirs is such that the newly developing parts of the town have no public water supply. There are also occasional pollution problems with the River Clyda. To rectify this problem Cork County Council commissioned an investigation into the aquifers in the Mallow area to identify and develop new sources for Mallow and surrounding areas. The initial desk and field studies of the aquifers identified the Carboniferous Limestone as the main aquifer which contains sufficient water to meet Mallows existing and projected future water supply demands.
A series of exploration wells were drilled, jive wells in the Carboniferous Limestones and two wells in the Devonian Sandstones. The limestone aquifer which is located to the west of Doneraile Village was identified as the aquifer to develop and three production wells were drilled into this aquifer. These productions wells were tested simultaneously and produced some 2,000,000 gallons per day of top quality water.
INTRODUCTION.
The current water supply source for Mallow is a surface water extraction from the River Clyda a tributary of the Blackwater River. The intake is located some 2 miles south west of Mallow and the distribution reserves are located on high ground to the south of the town. 500,000 gallons per day is the current water usage in Mallow. The quality of the raw water is such that it requires extensive treatment and the river occasionally becomes polluted, the pollution mainly being of agricultural origin. This scheme is unable to supply water to the higher parts of the town where most of the new development is and will take place. Surrounding rural areas also require water and these are at too high an elevation to be supplied by the Clyda source. To supply the town of Mallow and the surrounding rural area, Cork County Council decided to look at groundwater in the area for a source for the new scheme.
DESK & FIELD STUDIES.
An area of 5 miles radius around Mallow was selected initially and all the available data on the hydrogeology was evaluated. This facilitated the selection of areas for field studies which were confined to the Carboniferous Limestones as they appeared to be the most productive aquifer. The Devonian Sandstone were a second choice and the Upper Carboniferous Shales were ruled out on account of low yields and major water quality problems; i.e. high Manganese and Iron. There are no gravels in the area that would appear to be saturated. Having selected the limestones as the main potential aquifer field studies were carried out over the limestones. This involved locating all the wells and springs in the areas measuring the water table level and producing a map of the
45

!AH Porlfaoise Seminar 1996
groundwater flows in the aquifer. Three major zones of the possible high permeability were identified, and it was decided to drill three 1 OOM - 1 SOmm diameter exploration wells into these zones. Two area in the Devonian Sandstones aquifer were also selected for testing.
EXPLORATORY DRILLING.
The exploratory drilling was carried out by Dunnes Well Drilling Ltd, Mallow and the work was executed in two phases. The first phase involved the drilling of three 1 OOm deep x 1 SOmm diameter exploratory wells to test areas of high permeability in the Limestone Aquifer. These wells were drilled at Ballybeg, (Near Buttevant), Box Cross, just west of Doneraile and Kilcanway. The Ballybeg and Box Cross Wells had a target depth of JOOM but only reached 32M. The Kilcanway Well was drilJed to lOSM. The drilJing return water flow was very low in the Kilcanway WelJ (c.2-3000gpd) and this welJ was not tested. Both the BalJybeg Well and the Box Cross Wells were tested and produced 10,000gph with l.lOM drawdown in Box Cross Well and 8.87M drawdown in the Ballybeg Well. The Box Cross Well having a much higher Specific Capacity, it was decided to test this part of the aquifer further. Two step out exploration wells were drilled, one to 63M and the other to S2M. Both these wells were tested and yielded 14, 7SOgph with 4M of drawdown and 1 S,000 gph with 4.37M of drawdown. The Sandstone Aquifer south of Mallow were also drilled. One test well was drilled near the existing water intake at the River Clyda and the other well drilled near Rahan. Both these wells had low yields 1000 - 3000gpd.
PRODUCTION WELLS
Three Production wells were drilled in the Box Cross Aquifer just west of Doneraile Village. These wells were drilled by Dunnes Water Service Ltd, Dundalk. The production wells were numbered SA, 6A and 7A.
Well SA was opened up in 4SOmm diameter and 19.2M of 3SOmm diameter steel casing inserted. This was then grouted in and the 3S0mm casing was drilled through in 300mm to the final depth of 33M B.G.L. 30M of 2SOmm U.pvc well screen was inserted and 2-4mm formation stabiliser was inserted in the annulus between the U.pvc liner and the well wall. The annulus between the U.pvc liner and the steel liner was grouted with a cement grout.
Well 6A was opened up in 4SOmm diameter and 22 metres of 400mm diameter steel liner was inserted and grouted in. This was drilled through in 300mm diameter to a final depth of 46.6M 2SOmm diameter U.pvc slotted liner was inserted and the annulus between the U.pvc liner and the welJ walJ was filled with a 2-4mm rounded pea gravel (Formation stabiliser). The annulus between the U.pvc liner and the steel liner was filled with a cement grout to ground level.
WelJ 7 A was also opened at 4S0mm diameter to a depth of 30M and 30M of 400mm steel liner was inserted and grouted in. This liner was drilled through in 300mm diameter to S8M B.G.L. and 2SOmm diameter slotted U.pvc liner inserted. The annulus between the U.pvc liner and the welJ wall was filled with a formation stabiliser. The annulus between the U.pvc liner and the 400mm steel casing was filled with a cement grout.
OBSERVATION WELLS.
To monitor the effect of the test pumping of the production well on the aquifer, three observation wells were drilJed. These welJs were drilled where there were no private wells that could be used as
46

/AH Portfaoise Seminar 1996
observation wells. The observation wells varied in depth from 13.SM to 52M and were drilled in 150mm diameter.
TEST PUMPING - PRODUCTION WELLS.
The three wells were tested at the same time, initially in October/November 1991 and the second phase in September 1992. During the test pumping of the production wells, water table levels were measured in some ten observation wells. During the 1991 test pump, pumps were powered by electric generators, in 1992 mains electricity was available for all the production wells.
In 1991 the initial pumping rates were as follows:
Well SA Well 6A Well 7A
30,120 gph 24,900 gph 23,400 gph
At the completion of the test pumping the three wells had stabilised at the following rates.
Well SA Well 6A Well 7A
29,100 gph 21,300 gph 20,200 gph
Drawdown 5.15M Drawdown 3.16M Drawdown 8.15M
During the second phase of the pump test in 1992 the three wells gave the final figures for yield and drawdown.
Well SA Well 6A Well 7A
36,960 gph 25,212 gph 22,440 gph
Drawdown 7.JOM Drawdown 4M Drawdown 9M
The total gallons per hour is 84,612 gallons - 2,000,000 gallons per day.
The water is a hard water with excellent chemical and bacteriological parameters. This development clearly illustrates the scale of the well fields that can be developed in the Carboniferous Limestone Aquifers in the North Cork area and indeed elsewhere in Munster. A local history of poor well yields should not put one off investigating these Limestone Aquifers as within 500 yards of the Box Cross Aquifer the private wells all had low yields in the region of 1,000 to 5,000gpd.
CONCLUSIONS.
This investigation to date has identified and developed an aquifer that will provide a new source for the Mallow Ballyviniter Regional Water Supply Scheme. The production wells have been constructed and production pumps and power supply installed. The three production wells are capable of providing for the present and future water requirements of the region. A site has been selected for the distribution reservoir. To minimise energy use a small holding reservoir will be constructed at one of the well sites and water from the three wells will be pumped to this reservoir. A separate pumping system will be used to pump from this reservoir to the main high level storage/distribution reservoir. To protect and maintain the water quality in the aquifer, an aquifer vulnerability survey is being carried out.
47

!AH Portlaoise Seminar 1996
48

!AH Portlaoise Seminar 1996
ASSESSMENT OF THE POTENTIAL OF DEVELOPING A GROUNDWATER SOURCE AT ARDMORE CO. WATERFORD
JERKEOHANE GEOTECHNICAL AND ENVIRONMENTAL SERVICES LIMITED
ABSTRACT
Ardmore in County Waterford is an important tourist location. However the influx of tourists during the summer months places a heavy strain on the water supply to the village and at times has necessitated water restrictions. Waterford County Council instigated a study of the problem, which initially set about determining the characteristics of the existing system, the identification of problems with it and possible solutions to the problem. One of the possible solutions identified was the assessment of the potential of developing a groundwater source. The investigation of this potential involved a phased approach comprising a desk study, geophysical survey and drilling. The use of EM surveying was a new departure in the use of geophysics for groundwater exploration in this country and offers significant advantages over the traditional approach. The subsequent drilling of an identified target revealed a very important resource. Waterford County Council intend to augment the Ardmore supply from this source. This paper outlines an approach to groundwater assessment which is not unique, but illustrates how the development of a water supply is multifaceted and requires a logical approach to the study to avoid pitfalls and ensure a cost effective investigation ..
INTRODUCTION
Ardmore is a picturesque coastal village in West Waterford, winner of the Tidy Towns National Award in 1991. The village attracts a large influx of visitors during the summer months. This influx of visitors puts a heavy strain on the water supply system. Waterford County Council as custodians of this water supply, bore the brunt of complaints, when the strain, necessitated, rationing and water shortages.
Waterford County Council were therefore faced with finding a solution to the problem. One solution was to investigate the possibility of developing a groundwater supply for the town and area of Ardmore to supplement or augment the existing system.
Because any source would have to be integrated into the existing network and justified against other options, it was necessary that the study was undertaken in a logical way.
The work was co-ordinated by Waterford County Council under the responsibility of Eamon Mansfield SEE and Pat Corbett EE Sanitary Services. Technical advice was provided by the Regional Water Laboratory in Kilkenny. Jer Keohane assisted with the hydrogeological aspects of the work. The hydrogeological input began in early 1993 when Jer Keohane provided Waterford County Council with an outline methodology for a hydrogeological study of the area.
49

/AH Portfaoise Seminar 1996
The work plan agreed with Waterford County Council involved an integrated approach to the study, which attempted to retain an appreciation of constraints and network requirements in addition to looking at the geological and hydro geological aspects of the study.
This paper is titled the assessment of the potential of developing a groundwater supply, because a groundwater source at all costs was not the objective, moreso an the approach was taken by the County Council, that the potential would be fully assessed before a decision to proceed was made. What this meant was that a genuine commitment was made on the part of the Council to look at the study in an integrated scientific way. The results of the study are a vindication of this commitment.
BACKGROUND
Ardmore has a population of approximately 1200. In the tourist season the population of the area may more than double, which places a large demand on the water supply network.
The first obvious requirement was to establish the characteristics of the existing supply network and pinpoint the actual deficiencies with it. This was done by Pat Corbett on a network analysis basis, but the deficiencies were displayed in a down to earth way by the necessity to enforce restrictions to the supply during times of peak demand. Basically the water was available, but not close enough to Ardmore and the supply system between the source and the demand was not adequate.
The existing supply to Ardmore was from a combination of sources with the main abstraction from a series of springs at Glenwilliam located approximately 6km to the north of Ardmore, supplemented by an abstraction from an intake on the Lickey River a further 2km to the north. The water from both sources is fed to a 272m3 reservoir at Liskeelty approximately 5km from Ardmore. The transmission system to Ardmore comprises a 4 inch cast iron main from Liskeelty Reservoir. It was considered likely that friction losses in some of the pipes are very high and that the effective diameter of this water main is much less than the actual diameter. The water is fed to a 363m3 reservoir on the high ground at Dyser! to the south of Ardmore village from where the water is fed under gravity to the village.
The basic problems identified in the initial analysis were
• That the watermain from Liskeelty Reservoir to Dyser! Reservoir serves both as a trunk and distribution main and thus was not efficient at either task.
• The capacity of the mains was inadequate. • The storage in existing reservoirs was inadequate. • Raw water pumps at the Lickey River were undersized.
Three options were identified in this initial report
1. Replace the existing trunk mains, upgrade rising mains and upgrade the intake at the Lickey River. The estimated cost of this option was £600,000
2. Develop a groundwater source at an estimated cost of £195,000. 3. Clean the existing mains system.
The third option was not recommended due to the fragile condition of the mains and their lack of capacity even if cleaning could be carried out. However some remedial measures were undertaken, including replacement of defective valves, and cleaning of pipes, but failed to solve the problem to any degree.
If groundwater was to be the solution then it would have to satisfy some requirements.
50

/AH Portlaoise Seminar 1996
The requirements were:
upto 243,000gpd required (the actual yield demonstrated would determine whether the source would act as a back-up supply or be used to augment the existing supply).
Be as close as possible to the existing main.
Be as close as possible to the road to allow access for maintenance.
APPROACH
A proposed methodology covering the hydrogeological aspects of the study was provided by Jer Keohane. The principal requirement of this methodology from the Councils point of view was that it would not lose sight of the logistical requirements of the study and this required the establishment of good communication between the Council (The Client) and the technical specialists (Hydrogeologists, Geophysicists, Drillers).
The broad methodology involved the following key components
A desk study and walkover survey A geophysical survey Drilling Test pumping and analysis
Desk study and walkover survey
The desk study phase involved the compilation of topographical, geological and hydrogeological data relevant to the area and the establishment of a very basic conceptual model of geology and topography.
The walk over survey was used to interpret topographical features in the context of the conceptual desk model and to refine the overall interpretation of the area.
The resulting report indicated that there was potential of obtaining a groundwater supply from the limestone, but some technique of identifying potential drill sites would be required. To this end two target areas were identified as warranting further exploration.
Geophysical Survey
Geophysical surveying is a very useful tool in groundwater assessment. However in the wrong hands geophysics can be misleading and produce a low cost to benefit ratio if not carried out by an experienced practitioner at all stages. The actual mechanics of obtaining the data is very straightforward in most instances but the real test comes in the determination of the integrity of this data in the field and in being confident enough to adjust a programme, when the data is not good.
The main benefits of using geophysics are
• It can considerably reduce the amount of field survey work including wildcat drilling where a large target area is proposed.
• It enables us to study the area of interest for important information which would otherwise be beyond our field of view.
51

/AH Portfaoise Seminar 1996
Traditionally the use of geophysics m the groundwater field m Ireland has involved the use of resistivity surveying.
The advantages of using resistivity in the Irish context are that with our mainly fracture flow type aquifers that a resistivity contrast exists between water bearing rock (i.e., fractured rock) and barren non water bearing rock.
The disadvantages are that cables need to be strung out over long distances, which makes the survey labour intensive and slow.
In this study through discussions with the geophysical contractor George Reynolds it was decided to use Electromagnetic (EM) methods. This was a new departure in the use of geophysical methods in Irish Hydrogeology, although they have been widely used in other countries for a number of years.
EM methods are ideal for use in the Irish context for the following reasons:
• Surveying in Ireland is hampered by small field and farm sizes. Because no long trailing cables are required, EM surveying has a distinct time advantage, So in general surveying time is greatly reduced with cost implications.
• The resolution of features of interest is better, particularly with further modelling, as used on this project.
• The techniques are flexible and the various orientations of the transmitter and receiver can be used to customise the method to accentuate features of interest such as fractures, or layering.
• Because in this country we are interested in focusing on sub-vertical fractures we can adapt the technique to suppress horizontal influences and accentuate the vertical features.
VLF-EM, VLF-Resistivity, EM34 and TEM soundings were used.
Four broad areas were identified (called A,B,C,D) to survey. The results for areas A,B and C were negative in that no geological structures were detected, the data indicating the presence of massive highly resistive Limestone formations overlain by a sandy clayey overburden.
The results for area D were more promising.
A strong VLF-EM anomaly was located following the trend of a topographical valley feature. The VLF-Resistivity measurements indicated that this zone straddled a geological contact zone, probably between Limestone and Lower Limestone Shale units.
The VLF-EM response was consistent with an induced current focus indicating a very conductive zone at a depth of about 50m located within a horizontal distance of about 50m also.
The TEM soundings indicated a conductive layer at approximately I !Om below ground level. The geophysicists interpretation was that this represented either the base of the limestone formation overlying a shale series or the saline water interface, since the site is within 2km of the sea.
Recommendations to drill at a particular location were made.
52

!AH Portlaoise Seminar 1996
Drilling
Based on the findings of the Geophysical survey, a specification was prepared for the drilling of a borehole. It was pointed out in this specification that the drilling conditions might be difficult if extensive karstification or fracture zones were encountered. Comprehensive method statements were received from 4 Drilling contractors and Dunnes of Mallow were awarded the contract.
The borehole was drilled in May 1994. The initial indications were that a good supply had been achieved.
The drilling records comprised 14m of Clayey overburden over 6m of weathered limestone with a small volume of water. The Limestone was then massive between 20m and 56m. At 56m a fissure was encountered with large volumes of water, with occasional fissures from 56m to 75m total depth.
A seven day constant rate pumping test was undertaken to determine the hydraulic characteristics of the well. The well was pumped at approximately 770m3 /day (7000 gph) over the seven days and the resulting drawdown was 2.56m at the end of the seven day period. A transmissivity of 140m2/day was calculated with a specific capacity of approximately 300 m3/day/m.
The water quality parameters were found to be satisfactory and so a good supply was confirmed.
Commissioning
It was necessary for the council to purchase the land and to construct a pump house over the well. The legal aspects of this study are not covered in this paper. During 1995 the following works were carried out at the new borehole site:
Installation of pump and frequency inverter. Construction of pump house/ boundary walls and gates. Installation of approximately 1 km of 150mm uPVC Class C water main Installation of chlorination equipment at the pumphouse.
Presently work is in progress, laying the remainder of the 150mm watermain to the reservoir at Dysert.
It is the intention to abandon the Grange supply and to augment from the Ardmore supply.
CONCLUSIONS
The point of this case study is not to celebrate another high yielding borehole, since there are many high yielding boreholes in the country that have been commissioned without such a study. The important messages from this case study are:
Waterford County Council carried out a full analysis of the existing water supply system prior to commissioning a groundwater study. This meant that any groundwater sources located would have to be assessed in the context of the overall supply network.
Waterford County Council did not have an end result in mind prior to investigating the groundwater potential, In other words, a case would have to be made for a groundwater source on its own merits against the alternatives.
53

/AH Portlaoise Seminar 1996
Waterford County Council clearly defined their requirements and the constraints should a potential groundwater source be identified. This helped to focus the hydrogeological study.
Waterford County Council did not restrict the investigation in any way and were committed to a phased scientific approach all through the study.
The use of EM Geophysical Methods provided : • An improved the cost benefit ratio for geophysical surveying compared to traditional methods. • Allowed focusing of the survey to suppress unwanted data, whilst accentuating features of
interest. • Produced resolution of an anomaly which translated into a potential drilling target.
Flagging of potential difficult drilling conditions to the tenderers, addressed a potential problem before it became a problem.
The drilling proved that the chosen site, was highly permeable and productive.
One of the drawbacks of this scientific approach was the legal wrangle that resulted in attempting to obtain land rights to the borehole, once its potential was proven.
Acknowledgements
John O'Flynn, County Engineer, Waterford County Council. Eamon Mansfield, S.E.E. Sanitary Services, Waterford County Council. Pat Corbett, E.E,. Sanitary Services. Waterford County Council Michael Neill, Regional Water Laboratory George Reynolds, GeoRho Dunnes Well Drillers of Mallow.
54

!AH Portlaoise Seminar 1996
ROSCOMMON CENTRAL REGIONAL WATER SUPPLY SCHEME
DEVELOPMENT OF THE BALLINAGARD AQUIFER
Conor McCarthy Senior Engineer
Jennings O'Donovan & Partners
ABSTRACT
Roscommon County Council propose to provide drinking water which will comply with all the parameters as set out in Statutory Instrument No. 81 of 1988, EC (Quality of Water Intended for Human Consumption) to meet the water demands of an enlarged regional area of Central Roscommon through the year 2020. The proposed source for the scheme is a groundwater source from the Ballinagard Aquifer. The Ballinagard Aquifer is considered to be regionally important because of the karstic nature of the Aquifer.
This paper concentrates on the hydro geological investigations which were carried out as part of the Preliminary Report and Environmental Impact Statement process to investigate the feasibility of obtaining the ultimate design water demand from the Ballinagard Aquifer and to assess the hydrogeological impacts of producing that demand.
INTRODUCTION
The existing Roscommon Central Regional Water Supply Scheme provides treated water for the town of Roscommon and an area of approximately 92 square kilometres in its immediate environs. The present sources for the existing scheme are groundwater sources from the Ballinagard Aquifer which is the principal source and a secondary source at Rockfield, both in the immediate environs of Roscommon Town. The present combined output from these sources is 4,140 cubic metres per day, 2,176 cubic metres per day from Ballinagard and 1,964 cubic metres per day from Rockfield.
Roscommon County Council have undertaken an appraisal of the water requirements for a new enlarged Regional Water Supply Scheme in central County Roscommon. Jennings O'Donovan & Partners were commissioned by Roscommon County Council to prepare a Preliminary Report and Environmental Impact Statement for the scheme. The Preliminary Report, (January 1996), details the development strategy under which Roscommon County Council propose to provide drinking water which will comply with all the parameters set out in Statutory Instrument No. 81 of 1988, EC (Quality of Water Intended for Human Consumption), to meet the water demands of an enlarged Regional area of approximately 292 square kilometres through to the year 2020. This includes providing for the following water demands:-
, The 2020 water demands of the existing public Regional Water Supply area in Roscommon Town and its immediate environs.
, The provision of water to over 20 private group schemes in the outlying environs of Roscommon Town which are currently using water which does not comply with the EC Directives.
, The provision of water to assist in supplying the demands of the Castlerea Regional Water Supply Scheme and the Knockcroghery Regional Water Supply Scheme both of which experience difficulty with spring yields during the summer months.
, The snpply of water to the western portion of Athleague West.
55

/AH Portlaoise Seminar 1996
The Preliminary Report estimates the total demand of the new enlarged Roscommon Central Regional Water Supply Scheme through the year 2020 to be 7,785 cubic metres per day and outlines the following proposals to provide quality treated ground water to meet this estimated demand:-
, Development and expansion of the existing ground water source from the Ballinagard Aquifer.
, Modifications to the existing Water Treatment Plant at Ballinagard. , Provision of 14,450 cubic metres of reservoir storage capacity and approximately 126
kilometres of Trunk and Distribution Pipelines.
The Preliminary Report proposes that the work be carried out in two stages. Stage I would implement the proposal for the Development of the Ballinagard Aquifer; the storage, trunk and distribution mains to supply Roscommon Town and its immediate environs; and the regional connection to Knockcroghery. Stage 2 would implement the remaining balance of the development proposals comprising essentially the supply of water to the group schemes in the outlying environs of Roscommon Town; to the western portion of Athleague West; and the regional connection to Castlerea.
In addition to the proposals to meet the 2020 water demands of the new enlarged regional area in central Roscommon, consideration has been given in the Preliminary Report to the supply of 1800 cubic metres per day of water to the Newbridge/Ballygar area in neighbouring County Galway where a serious water supply shortage exists.
As part of the Preliminary Report and Environmental Impact Assessment process, detailed hydrogeological investigations were carried out to investigate the feasibility of obtaining the ultimate design demand from the Ballinagard Aquifer and to assess the hydrogeological impacts of producing that demand. This paper provides a summary of those hydrogeological investigations which were undertaken by K.T. Cullen & Co. Ltd., Consultant Hydrogeologists, on behalf of Jennings O'Donovan & Partners.
ASSESSMENT OF FEASIBILITY OF OBTAINING DESIGN WATER DEMAND FROM THE BALLINA GARD AQUIFER
The proposed groundwater abstraction is centred on Ballinagard spring which is located 2.4 kilometres south west of Roscommon Town. The spring discharges naturally at ground level and overflows into the nearby Hind River. The Hind River rises west of Roscommon Town, flows eastwards to Lough Ree some IO kilometres distant, and has a measured low flow of 0.12 cubic metres per second. The proposed groundwater abstraction lies completely within 84 square kilometre Hind River Catchment.
In order to assess the feasibility of obtaining the design water demand from the Ballinagard Aquifer, the procedure adopted during the hydrogeological investigation consisted of a desk top study to collate existing information on the geology of the area; resistivity surveys to locate potentially high yielding trial well drilling sites; trial well drilling programme; individual pumping test programme and an extended five week multiple pumping test programme including groundwater quality analyses.
Although the hydrogeological investigations centred on the Ballinagard Aquifer, the area in the vicinity of the Rockfield springs was also examined initially. However, after poor trial well results it became apparent that the potential does not exist to expand the existing source at Rockfield beyond its present capacity.
56

/AH Portlaoise Seminar 1996
SOILS AND GEOLOGY
The regional geology of the area around Roscommon Town in dominated by Lower Carboniferous rocks. The area is quite heavily faulted. The larger faults run in a north-east to south-west direction to the west and north east of Roscommon Town. Ballinagard lies to the east of one such major fault, the Strokestown fault. Shallow water limestones of Arundian age and consisting of pale calcarenites interbedded with dark grey micrites underly the area around the Ballinagard Aquifer. The calcarenites and micrites form part of a south dipping succession.
Prior to the drilling programme, it had been thought that the area around the Ballinagard spring was underlain by unaltered pale calcarenites and dark micrites. However, the drilling results at Ballinagard showed the area to be underlain by weathered brown dolomitised limestone. The most high yielding of the trial wells have their major inflows from this weathered zone.
Well records show that the overburden depths range from very shallow to some 13. 7 metres. This variation combined with frequent rock outcrops indicates modulations in the bedrock surface. Hollows in the glacial overburden surface have been infilled with peat. However, much of the peat has been removed and areas which were once raised bogs are now low lying marshes.
RESISITIVITY SURVEY
The aims of the resistivity survey were to provide a general geophysical picture of the subsurface conditions at Ballinagard and to depict areas of high hydraulic conductivity which might correspond to high yielding zones in the bedrock or overburden and be indicative of suitable sites for trial wells. The resistivity survey covered an area of 250 metre radius from the Ballinagard spring. Two resistivity methods were employed, the constant separation traversing method to detect lateral geological variations and the vertical electrical sounding method to estimate depth to the water table and bedrock and formation thickness.
Analysing the results of the resistivity survey, it was concluded that the Ballinagard spring is situated in a wetland area surrounded by sandy glacial till and that there is water at depth in the bedrock which is overlain by this sandy glacial till. Ten trial well drilling and monitoring sites were chosen in the vicinity of Ballinagard and a trial well drilling and pumping test programme was initiated.
TRIAL WELL DRILLING AND PUMPING TEST PROGRAMME
The programme for the Trial Well Drilling and Pumping Tests involved the following three separate phases:-
• Drilling of Trial Wells and Monitoring Wells • Individual 72 hour Pumping Tests • 5 week Extended Multiple Well Pumping Test
Drilling Programme
The trial wells were drilled using a down the hole pneumatic hammer with compressed air as the flushing medium. The ten trial well and monitoring well sites are indicated on Figure No. I. Trial Wells No.s 1,2 and 3 were drilled within 200 metres of the Ballinagard spring to investigate the hydrogeological conditions in the vicinity of the spring. Trial Wells No.s 5 and 6 were drilled to investigate the lateral extent of the Aquifer. Trial Wells No.s 7 to 11 inclusive, were drilled to act as monitoring points and to provide more geological information on the extent of the dolomitisation.
The initial phase of the drilling programme involved drilling Trial Well No.s 1,2 and 3 in the vicinity of the Ballinagard spring to depths of approximately 64 metres. The bedrock was composed of
57

/AH Portlaoise Seminar 1996
weathered unstable dolomitised limestone which had not been indicated by available geological information. Early indications were that large quantities of water could be abstracted from the weathered dolomite.
As it was assumed that the aquifer was bounded to the west by the Strokestown fault it was decided to drill a further two wells, Trial Wells No.s 5 and 6, to investigate the lateral extent of the aquifer to the east. While Trial Well No. 5 had a conservative yield, Trial Well No. 6 appeared very high yielding with a fissure at a depth of 6 to 8 metres being cavernous with very large flows recorded.
Before commencing the extended multiple well pumping test, five additional wells, Trial Wells 7 to 11 inclusive were drilled to act as monitoring wells during the pumping tests and to provide further geological information.
0.5
W[LL FIELD
f O 260""
BALUNAGA!W
400
BAILYMARTJN BEG
(2Km) ~
ii \I
EMLYMARf MORE
Fig No. 1. Trial Well Locations, Well Field, Cone Of Depression after 5 week pumping test
Individual Pumping Tests
72 hour pumping tests and step pumping tests were carried out on the five individual wells around Ballinagard. The procedure involved pumping from positive displacement shaft driven pumps installed in the finished 150mm diameter boreholes. Water supply to Roscommon Town was maintained as normal by pumping from the Ballinagard spring. The spring overflow to the Hind River was monitored throughout the pumping tests. The results of the individual 72 hour pumping tests and step pumping tests indicated that Trial Wells No.s 1,2,3 and 6 were individually capable of being pumped continuously at rates of 1,200 to 2,000 cubic metres per day. The estimated safe yield of Trial Well No. 5 was estimated at 600 cubic metres per day. The spring continued to overflow to the Hind River throughout the tests. The observation well data showed the interference of the
58

/AH Portlaoise Seminar 1996
pumped trial well on the observed trial well to be very small indicating that more than one well could be pumped without significant loss in the cumulative total.
Having obtained positive results from the individual well pumping tests, it was considered appropriate to proceed with the next phase which would pump several wells for an extended period of time.
Extended Multiple Well Pumping Test
As outlined in the introduction, the 2020 design demand for the Roscommon Central Regional Water Supply Scheme is 7,785 cubic metres per day. An additional quantity of 1,800 cubic metres per day could, if available, be used by Galway County Council to solve particular needs in the Newbridge/Ballygar area. In projects where large scale abstractions of this order are being investigated, it is considered essential to conduct a multiple well pumping test for as long a period as is economically practical.
It was intended to pump from Trial Wells No.s 1,2,3 and 6. However, Trial Well No. 6 was excluded from the test because of problems experienced by local residents in relation to noise pollution during the individual pumping test. The monitoring locations during the extended multiple well pumping test were provided by Trial Well No.s 7 to 11 inclusive and by 40 domestic wells surveyed within a radius of 3 kilometres of Ballinagard spring. The extended multiple well pumping test was run for a period of 5 weeks from September 27, 1994 to November I, 1994. The response of the Aquifer to the pumping test was observed in the following manner:-
•
• •
Frequent measurement of the change in water level in the pumping wells and all 43 monitoring wells. Frequent measurement of the discharge from the Ballinagard spring to the Hind River . Frequent water sampling for chemical and bacteriological analysis to determine if the extension of the cone of influence would capture any pollution sources.
The five week extended multiple well pumping test proved very successful. The principal conclusions are summarised as follows:-
Between 12,000 and 14,000 cubic metres per day of groundwater was discharged from the Ballinagard Aquifer for the 5 week duration of the test. This total comprises the discharge from Trial Well No.s 1,2 and 3, the pump from the Ballinagard spring and the overflow from the spring to the Hind River. The total discharging at the end of the test was 12,198 cubic metres per day.
Drawdown in the pumping wells reached a maximum within 2 days after which water levels steadied and rose. Discharge from the spring to the Hind River decreased but a considerable flow of 3,847 cubic metres per day still existed at the end of the test. The cone of depression as shown on Figure No. I did not appear to extend beyond 700 metres at the end of the test. The groundwater is characterised by its hardness level which reflects the carbonate nature of the limestone/dolomite aquifer. In general, the chemical quality of the water is excellent. The bacteriological quality is generally poor with the spring discharge returning positive coliform and E-coli values. 7,000 cubic metres can safely be abstracted from the Ballinagard Aquifer in addition to the existing demand of2,176 cubic metres per day.
59

/AH Portlaoise Seminar 1996
VULNERABILITY OF THE AQUIFER
Roscommon County Council records show that the Ballinagard spring was contaminated for short periods in 1984, 1986, 1987, 1988, 1991 and 1992. The most serious pollution incident occurred on the night of August 21, 1987. The effect of the pollution was still evident in the spring of September 12, 1987. The remarks of the Public Analyst at the time were that the water was potable subject to bacteriological confirmation. It was believed at the time that the incident was due to slurry dumping or excessive application of slurry in a highly vulnerable area of the catchment.
Evidence of previous serious contamination together with the levels of bacteriological contamination both in the historical results and in the test results carried out in conjunction with the hydrogeological investigations are indicative of the vulnerability of the aquifer.
An assessment of the vulnerability of the Ballinagard Aquifer was carried out by Sligo Regional Technical College in conjunction with the Groundwater Section of the Geological Survey of Ireland as part of the EC/DOE Stride Aquifer Protection Project for Counties Roscommon, Galway and Mayo. The findings of this study confirm the vulnerability of the Ballinagard Aquifer. It was found that within the Ballinagard area, 33% of the area has potentially extreme vulnerability and 67% has potentially high vulnerability.
CONCLUSIONS AND RECOMMENDATIONS OF HYDROGEOLOGICAL INVESTIGATION UNDERTAKEN AS PART OF PRELIMINARY REPORT
The hydrogeological investigation undertaken as part of the Preliminary Report was directed at assessing the feasibility of obtaining the design water demand from the Ballinagard Aquifer. The investigation concluded that based on the extended multiple well test, 7,000 cubic metres per day can safely be abstracted from the Ballinagard Aquifer in addition to the existing abstraction of 2,176 cubic metres per day. The Aquifer is therefore capable of supplying the 7,785 cubic metres per day 2020 design demand of the Roscommon Central Regional Water Supply Scheme.
The feasibility of the Aquifer to supply the additional 1,800 cubic metres for the Newbridge/Ballygar area of County Galway is considered more marginal.
Having established the potential of the Aquifer, it was recommended that the hydrogeological impacts associated with the proposed abstraction be quantified and assessed. The primary areas for assessment are the impact on the low flow of the River Hind; the extent of the cone of depression associated with continuous pumping; and the effect of drought events on the sustainability of the Aquifer resource. It was recommended that a computer model be developed to access the different . . pumpmg scenarios.
Because the karstic nature of the geology makes the Aquifer particularly vulnerable as evidenced by bacteriological contamination and the findings of the STRJDE programme, it was recommended that an Aquifer Protection Plan be developed for the Ballinagard Aquifer resource.
These recommendations were implemented in the Environmental Impact Statement for the scheme in which the impacts of producing the design demand from the Aquifer were assessed and recommendations for the development of an Aquifer Protection Plan were made.
60

/AH Portlaoise Seminar 1996
IMPACTS OF PRODUCING DESIGN WATER DEMAND FROM THE BALLINAGARD AQUIFER
BACKGROUND
The need for an Environmental Impact Statement for the proposed development of the Ballinagard Aquifer was determined by the Department of the Environment. This determination is in line with the European Communities (Environmental Impact Assessment) Regulations, 1989, which under Article 24, First Schedule, Part II, Item 2, Section (b) regulates that an Environmental Impact Statement is required for any project "involving drilling for water supplies where the expected supply would exceed 5,000 cubic metres per day." This determination was sought because there is an existing Abstraction Order which provides for a maximum rate of abstraction of 4,450 cubic metres per day from the Ballinagard spring and there was some doubt as to whether the additional proposed abstraction exceeded the threshold outlined in the regulations.
The central objective of the Environmental Impact Statement was to identify any potentially significant adverse impacts prior to the design phase and to propose measures to mitigate or ameliorate any such impacts should they exist. In order to achieve its central objective, the Environmental Impact Statement for the Roscommon Central Regional Water Supply Scheme was systematically structured to provide:-
• a description of the proposed development • a description of the existing environment • the impacts of the proposed development • the measures to mitigate any potential adverse impacts
The existing environment and the impacts of the proposed development are explained by reference to the likely impacts of the development on the topics as stipulated by the Second Schedule of the 1989 Environmental Impact Assessment Regulations. None of these topics were omitted at the risk of invalidating the legality of the Environmental Impact Statement. However, the level of treatment for some of the topics differed depending on the likelihood of impacts. The primary reason underlying the preparation of the Environmental Impact Statement is that the proposed development involves the "drilling for water supplies where the expected supply would exceed 5,000 cubic metres per day". Accordingly, the principal focus of the Environmental Impact Statement centres on the impacts of the proposed ground water development.
The remainder of this paper provides a summary of the findings of the hydrogeological investigations undertaken by K.T. Cullen & Co. Ltd., on behalf of Jennings O'Donovan and Partners into the impacts of producing the design demand from the Ballinagard Aquifer.
HYDROGEOLOGICAL ASSESSMENT
The following procedure was adopted during the preparation of the hydrogeological assessment:-
• Review of the Soils and Geology further to the findings of the Drilling Programme. • Study of Land Use. • Review of Available Meteorological records. • Study of low flows in the Hind River with particular reference to the Councils Proposals for
upgrading the Roscommon Town Wastewater Treatment Works. • Groundwater level monitoring. • Continued sampling of surface water quality from the Hind River and its tributaries. • Continued sampling of groundwater quality from pumping wells and the Ballinagard spring. • Development and calibration of groundwater computer model.
61

!AH Portlaoise Seminar 1996
The extent of the cone of depression after pumping continuously from the well field for a three month period is indicated in Figure No. 2. The cone of depression clearly extends beyond the outfall from the wastewater treatment works. The cone of depression does not extend as far as the turloughs. It is accordingly suggested that the relocation of the sewage outfall beyond the zone of influence of the Aquifer as developed at Stage 2 be considered. In that context, a monitoring programme is proposed for implementation to obtain further data on the spring outfall and at several locations along the Hind River. Records of flow data will be built up in the years before the development of Stage 2 and used in the assessment of the relocation of the sewage outfall.
Abstraction of Additional 1,800 cubic metres per day for Newbridge/Ballygar
Although the demand of 9,500 to 10,000 cubic metres per day would be available from the Ballinagard Aquifer, the computer model predicts an extended cone of depression and a contribution of 0.05 cubic metres per second from the Hind River. Production wells would be required to be used for longer periods and the low flows in the Hind River would probably fall below the design low flow of 0.12 cubic metres per second for extended periods. Although the shortfalls in stream flows could be met by groundwater withdrawals from adjoining catchments, it is not recommended at this time to abstract more than the primary scheme demand of 7,785 cubic metres per day from the Ballinagard Aquifer.
AQUIFER PROTECTION PLAN
Evidence of the vulnerability of the Ballinagard Aquifer has been provided earlier in the paper. Because of this vulnerability an Aquifer Protection Plan is being developed. Roscommon County Council may consider integrating this Aquifer Protection Plan with the County Development Plan. In this manner, the Aquifer Protection Plan could act as a planning tool to help safeguard the sustainability of the Aquifer.
The preparation of the Aquifer Protection Plan follows the guidelines as set out in "Groundwater Protection in Ireland: A Scheme for the Future" as prepared by Donal Daly of the G.S.I. It is proposed that the individual production wells and the Ballingard spring be designated as the Source Protection Sites and that an area extending to the 100 day travel time contour when the Stage 2 demand is being abstracted from the well field be designated as the Inner Protection Area. The extent of the Outer Protection Area is still under discussion but is is envisaged that it will extend to a radial distance of 2 kilometres from the Ballinagard spring and also include all waters that could enter the sprmg source.
64

!AH Portlaoise Seminar 1996
ACKNOWLEDGEMENTS
The content of this paper is influenced by Kevin Cullen and Kieran O'Dwyer of K.T. Cullen & Co. Ltd. John Cunningham, B.E. C.Eng., Senior Executive Engineer, Roscommon County Council, Coordinator of Farm Survey and Drainage Survey, undertaken, directly by Roscommon County Council as part of E.I.S. process, Colleagues at Jennings O'Donovan and Partners, in particular, Frank McAleenan, Tomas McGloin and Mary Boylan.
This paper is published with the kind permission of Mr. V. Brennan B.E. C.Eng., FIE!, County Engineer, Roscommon County Council.
REFERENCES
Cullen K.T. & Co. Ltd., January 1995. Hydrogeological Investigation for the Augmentation of the Roscommon Central Regional Water Supply Scheme.
Cullen K.T. & Co. Ltd., February 1996. Hydrogeological Impacts associated with Development of Ballinagard Aquifer.
Daly, D. 1995. Groundwater Protection in Ireland: A Scheme for the Future.
EC/DOE STRIDE Aquifer Protection Project 1995. Ballinagard - Aquifer/Catchment Characteristics Determined by Field Mapping. (Project Co-Ordinator: Richard Thorn)
Jennings O'Donovan & Partners, January 1996. Roscommon Central Regional Water Supply Scheme Preliminary Report.
Jennings O'Donovan & Partners, February 1996. Draft Environmental Impact Statement Roscommon Central Regional Water Supply Scheme
Oxford Geotechnia International, January 1996. Hydrological Impact of Groundwater Abstraction at Roscommon, Ireland.
65

!AH Portlaoise Seminar 1996
66

/AH Portlaoise Seminar 1996
CASINGS AND SCREENS
Thomas Fogarty, Fogarty Drilling Ltd, Gowran, Co. Kilkenny.
ABSTRACT
The following presentation describes some of the design criteria required for the selection and installation of waler-well casings and screens. The choice of casings and screens may be governed by various international standards and we shall highlight some of these standards. We will examine casing programmes which propose some minimum borehole dimensions required for the packing, ie grouting or formation stabilizers of permanent casings or screens.
Finally we will take a brief look al the efficiency of various well screens as the majority of production boreholes are designed to include a pump chamber, thereby boreholes need to be constructed and not just drilled. Examination of various standards and programmes have implications for the drafting of a national standard for water-well drilling, ie a median between IS432 and current non-standards.
************************************
CASINGS
COMPOSITION AND CHOICES; The types of casing used in water-well construction are steel, stainless steel, fibreglass and thermoplastics, these latter two material choices are increasing in popularity but hindered by the complex grout mixtures required to prevent the grout from "shrinking back" from their surfaces. Steel is the most commonly used material and stainless steel has gained widespread acceptance in the bottle water industry as standard l.S.432, 1992. The selection of casing material is based on water quality, well depth, diameter, cost and specific requirements, the following table outlines the corrosion resistance of various metal casing materials;
!MATERIAL ACTIVE COMPONENT TYPICAL APPLICATIONS
Passive Layer Low Carbon Steel --------- Not corrosion resistant
Fe Iron General Use with Grouting.
405 Stainless Steel > 11 % Chromium Moderate Corrosion Resistance.
304 Stainless Steel > 18% Chromium Excellent Resistance Used in S.S. Screens.
3 l 6L Stainless > 18% Chromium Excellent Resistance. >10% Nickel EspifT.D.S. > l,OOOppm
and pH <7.0.
67

/AH Portlaoise Seminar 1996
Various International standards of pipe/casing diameters and wall thickness are available, the following three specifications are particular to casing used in water-well drilling.
!SPECIFICATIONS DESIGNATION DESCRIPTION
ASTM A- 53 Standard (ANSI SCH.40) "Standard Pipe" A- 120 Extra-Heavy (ANSI SCH.80)
API Grade A Standard (ANSI SCH.40) "Line Pipe" Grade B Extra - Heavy (ANSI SCH.80)
B.S. 879 9.5 - 11mm Standard 12.5 - 15mm Extra - Heavy
The tensile strength or collapse pressure of any casing material is a function of it's wall thickness, thus steel provides the most flexible choice of material for conductor and intermediate casing segments.
Casing Dimensions up to and including 300mm provide a standard diameter for a standard wall thickness, above this, casing is called "Large O.D. Pipe" and designated by it's outside diameter. The following wall thickness provide casing with a sufficient strength for waterwell construction.
!NOMINAL DIAMETER (MM)
150 200 250 300 350 400 450 500 550
MINIMUM WALL THICKNESS (MM)
6.0 7.2 9.3 9.5 9.5
11.0 11.0 12.5 12.5
In every case the wall thickness of steel casing must fulfill the following criteria;
# 1 As grout is tremied into the annual space between casings a hydrostatic pressure, { due to the columns of grout (2,000kg/m3)}, of 2.6 p.s.i. per meter of grout is exerted onto the casing. A safety factor of 2 is also used when designing for this collapse pressure. As the grout is curing a temperature of l 20'F is also produced.
#2 The steel casing must be able to withstand the full hydraulic loading if the casing is pumped dry, especially during vigorous well development and rehabilitation. The collapse strength must exceed l .3psi for every meter of depth beneath the top of the aquifer.
#3 Extra heavy wall casing should be used for difficult drilling when using the cable tool method. Difficult drilling is "characterized" by high density formation materials and deep boreholes of large diameter.
68

/AH Portfaoise Seminar 1996
STAINLESS STEEL CASING The initial cost of stainless steel may prove prohibitive when compared to low carbon steel, but over time the cost of stainless steel is recouped due to cheaper and less frequent well rehabilitation. Even though stainless steel is available in standard nominal dimensions and wall thicknesses, only schedule !Os ie 3.4mm@ 168.3mm O.D. and schedule 40 ie 7. lmm@ 168.3mm O.D. is readily available in Ireland, thus care should be taken when specifying stainless steel casings, especially if stainless steel screens need to be telescoped with or joined to this casing string.
CASING PROGRAMMES In the past, a general rule of thumb to start a borehole at twice the diameter of the pump was used, casing programmes take this general rule one and even two steps further. Casing programmes provide guildelines so that a borehole may be designed from "the bottom up" so that the various casing segments are chosen to accommodate the driving conditions the overlap requirements and the annular space necessary for grouting or filter packing.
The diameter of the pump required for a desired yield is the controlling factor in chosing the size of the borehole or the size of the well screen. Good borehole design sets a pump within an openhole section or pump chamber of two pipe sizes larger than the pump. The following pump capabilities may be used for guidelines, exact rates are dependant on maximum drawndown.
NOMINAL PUMP DIAMETER
95mm 145mm 195mm
PUMP CAPACITY RAJ'IGE BOREHOLE/SCREEN SIZE MIN MAX MIN MAX
m3/Hour 2.5 18
13.5 52 48 170
165 205 280
mm 205 250 380
If turbulent water flow or cascading conditions exist within a borehole then a shroud needs to be placed over the pump manifold, this will increase the pump diameter by a further 75mm to 110mm.
The prospect of a borehole finishing with a diameter of one and even two pipe sizes less than required defies the purpose of ever beginning to drill. Casing programmes allow the permanent casing to be grouted in at least 3 meters and even up to 40 meters into the top of the aquifer or confining layer. The upper section of the aquifer may supply water of a slightly less quality than it's lower layers thus the sustainable quality of the water may change literally like the weather.
The expression that "mother nature does not give up her rights easily" has never been truer when it comes to water well drilling, as boreholes with maximum yield always present maximum casing problems. Ironically, the problem is greatest when the downhole conditions are so bad that casing is the only answer. A single water well may require four types of casing to successfully complete it's casing programme as follows;
69

/AH Portlaoise Seminar 1996
NOMINAL BORE 150mm 200mm 250mm 300mm
1. Pmni;i C!rnml!tr Openhole Finish 150mm 200mm 250mm 300mm
or Well Screen c/w pack 250mm 300mm 375mm 450mm
2. ftnnantnt Casing Openhole 150mm 200mm 250mm 300mm
Screened 250mm 300mm 375mm 450mm
3. Inn:rmt!!iak Casing Openhole 250mm 300mm 375mm 445mm
Screened 375mm 450mm 500mm 550mm
4.
Surfatt Casing/Stan!lpipt Openhole 300mm 375mm 450mm 500mm
Screened 450mm 500mm 550mm 610mm
The dimensions outlines in this casing programme are based on nominal diameter ASTM "standard" pipe sizes. Using the AP.I. scheme intermediate sizes are also available however such sizes would not allow for borehole grouting using tremie pipes etc. To the drilling contractor these borehole dimensions may seem excessive and beyond their current capability, yet the maximum diameter shown of 610mm (24") is the minimum diameter used by pile-driving contractors using percussion or "sykes" equipment.
The use of casing programmes allows for the contractor to purchase a standard "string" of drill tools and particularly stabilizers, thereby minimizing the problems of borehole deviation to the acceptable level of 2/3 borehole diameter per 30 meter section. In fact examination of this programme shows three distinct dimension regimes i.e. SMALL 150mm - 250mm;
MEDIUM 300mm - 450mm; LARGE 500mm - 610mm+.
Each of these categories requires a distinct drill string which becomes more expensive, yet the demand decreases as the investment increases. Some of this investment problem can be overcome by beginning the boreholes using traditional cable-tool methods followed by standard rotary methods and particular low-velocity foam injection drilling. The recovery value of the intermediate segment of casing may be very small, depending on the particular circumstances, from a contractors point of view their re-use is minimal. The standardization of casings and the implementating of casing programmes will allow contractors to improve their techniques in their current dimension range and possibly allow them to expand into a larger and more difficult range.
70

/AH Portlaoise Seminar 1996
SCREENS
COMPOSITION AND CHOICES; The intake portion of a borehole may be fitted with a screen which is designed to support any loose formations in semi/consolidated aquifers and to prevent the ingress of sand from unconsolidated aquifers. Large yielding wells with high flow rates can remove the cement that binds an aquifer's grains together, thus causing a slow collapse of the borehole, esp. in Sandstones and Limestones. Ideally a well screen and filter pack should have an equal or higher hydraulic conductivity than the surrounding formation in order for the well to produce the maximum amount of water, with the minimum amount of drawdown. Well screens are available in mild-steel, stainless steel and thermoplastics.
MILD STEEL SCREENS Production boreholes seldom use mild steel screens, such as torch slotted casings, as the open area cannot exceed 11 % without collapse due to comprehensive forces. Mild steel casings can only be slotted parallel to the pipe ax.is thus giving limited slot spacing and uniformity, resulting in their low percentage of intake open area. Screen made by torch cutting a steel casing cannot control fines from entering the pump chamber and accelerated corrosion will occur at these jagged edges. A variation of mild steel screens are the louvered and the bridge slot screen, with machine punched openings in the steel casing. Mild steel screens must be used in gravel packed wells due to their coarse and irregular slot sizes. Accelerated slot corrosion may induce turbulent flow conditions, resulting in their premature collapse. Mild steel screens are used in private domestic and agricultural wells due to cost and local fabrication factors especially when high hydraulic efficiencies are not required.
STAINLESS STEEL SCREENS Stainless Steel Screens also called Continuous Slot Screens or Johnson Screen are manufactured from type 304 or 316 stainless steel. Continuous Slot Screens provide more intake area per unit area of screen surface than any other type. Water flows more freely throughout a screen with a large intake area, the entrance velocity throughout this large area is low and therefore the head loss or well loss is at a minimum. This in tum minimises drawndown at a given pumping rate and improves well efficiency. If the flow rate is minimised the corrosion and incrustation rate is also minimized. Continuous slot screens are available as telescope size and pipe size screens, these stainless steel screens are also available in various collapse strengths depending on their application: Stainless steel continuous slot screens are designed to the corresponding size of AP.I. line pipe. Continuous slot screens are also available in galvanized form but are not suitable for potable water requirements, these screens are widely used in irrigation and dewatering wells. Slot sizes ranging from 0.15 to 6.4mm are available and the screens efficiency is attributed to it's vshaped openings which are non-clogging and allow maximum well development. Slot openings of stainless steel screens is designated by a number which corresponds to the width of the openings in thousandths ofan inch, therefore 80 slot= 0.080 inch= 2mm slot width. The intake area of continuous slot screens and their maximum transmitting capacity is available in appendix I.
71
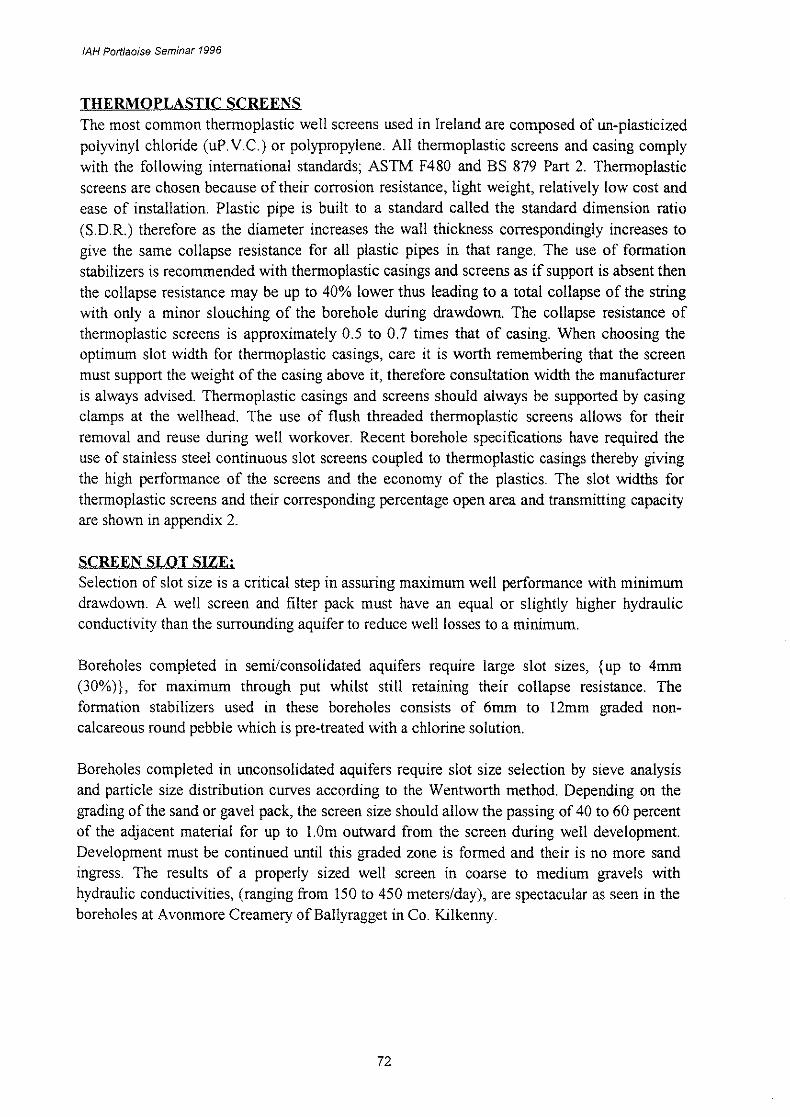
/AH Portlaoise Seminar 1996
THERMOPLASTIC SCREENS The most common thermoplastic well screens used in Ireland are composed of un-plasticized polyvinyl chloride (uP.V.C.) or polypropylene. All thermoplastic screens and casing comply with the following international standards; ASTM F480 and BS 879 Part 2. Thermoplastic screens are chosen because of their corrosion resistance, light weight, relatively low cost and ease of installation. Plastic pipe is built to a standard called the standard dimension ratio (S.D.R.) therefore as the diameter increases the wall thickness correspondingly increases to give the same collapse resistance for all plastic pipes in that range. The use of formation stabilizers is recommended with thermoplastic casings and screens as if support is absent then the collapse resistance may be up to 40% lower thus leading to a total collapse of the string with only a minor slouching of the borehole during drawdown. The collapse resistance of thermoplastic screens is approximately 0.5 to 0.7 times that of casing. When choosing the optimum slot width for thermoplastic casings, care it is worth remembering that the screen must support the weight of the casing above it, therefore consultation width the manufacturer is always advised. Thermoplastic casings and screens should always be supported by casing clamps at the wellhead. The use of flush threaded thermoplastic screens allows for their removal and reuse during well workover. Recent borehole specifications have required the use of stainless steel continuous slot screens coupled to thermoplastic casings thereby giving the high performance of the screens and the economy of the plastics. The slot widths for thermoplastic screens and their corresponding percentage open area and transmitting capacity are shown in appendix 2.
SCREEN SLOT SIZE; Selection of slot size is a critical step in assuring maximum well performance with minimum drawdown. A well screen and filter pack must have an equal or slightly higher hydraulic conductivity than the surrounding aquifer to reduce well losses to a minimum.
Boreholes completed in semi/consolidated aquifers require large slot sizes, { up to 4mm (30%)}, for maximum through put whilst still retaining their collapse resistance. The formation stabilizers used in these boreholes consists of 6mm to 12mm graded noncalcareous round pebble which is pre-treated with a chlorine solution.
Boreholes completed in unconsolidated aquifers require slot size selection by sieve analysis and particle size distribution curves according to the Wentworth method. Depending on the grading of the sand or gavel pack, the screen size should allow the passing of 40 to 60 percent of the adjacent material for up to I.Om outward from the screen during well development. Development must be continued until this graded zone is formed and their is no more sand ingress. The results of a properly sized well screen in coarse to medium gravels with hydraulic conductivities, (ranging from 150 to 450 meters/day), are spectacular as seen in the boreholes at Avonmore Creamery of Ballyragget in Co. Kilkenny.
72

!AH Portlaoise Seminar 1996
APPENDlX I
Intake areas of continuous slot screens
Wire-Wound Telescopic Screens Nominal Square Inches Per Foot of Screen Diameter
(Inches) 10-SLOT 20-SLOT 40-SLOT 60-SLOT 80-SLOT 100-SLOT 150-SLOT 250-SLOT
3 15 26 41 52 59 65 73 82 4 20 35 57 71 81 88 101 115 5 26 45 72 90 102 112 112 132 6 30 53 85 106 100 112 132 156 8 28 51 87 113 133 149 160 194
10 36 65 108 141 166 186 200 243 12 42 77 130 143 171 195 237 265 14 37 68 97 132 161 185 232 292 16 42 60 108 148 180 208 261 327 18 36 69 124 169 206 237 298 375 20 41 77 139 189 229 264 280 366 24 61 113 131 182 226 265 343 449 26 63 118 138 191 237 278 360 471 30 75 138 161 224 278 325 422 552 36 84 157 184 255 317 371 481 629
-~·-Note: The maximum transmitting capacity of the screen can be derived from these figures. To determine GPM per ft. of screen, multiply the intake area in square inches by 0.31. It must be remembered that this is the maximum capacity of the screen under ideal conditions with an entrance velocity of 0.1 ft. per sec. Source: Johnson Division of Signal Environmental Systems, Inc., St. Paul, MN.
APPEND1X2
Intake areas of thermoplastic screens
approximate data regarding the volume of water that can be pumped through a 1 metre : Ieng ht of screen with 1 mm - slots (with a 2 meter drop in the water level), · .. ·
DIAMETER 0 DIAMETRE 0
mJ/h mm inches
mm pouces
60 2" 3
90 3" 4,5 0.30 mm
0.30 mm 4% 0.40 mm
0.40 mm 5%
110 4" 6 0.50 mm 6% - 0.50 mm
0.75 mm 9% 0,75 mm
125 5" 7,5
160 6" 9
200 8" 12
250 1 O" 19,5
315 12" 27
1.00 mm 11% 1,00 mm 1.25 mm 13% -1.50 mm 16% 1.25 mm 2.00 mm 20% 1.50 mm 3.00 mm 25% 4.00 mm 28% - 2,00 mm
- 3.00 mm
4.00 mm -73

!AH Portlaoise Seminar 1996
74

/AH Portlaoise Seminar 1996
ACHIEVING GROUNDWATER PROTECTION
Aidan Briody Briody's Aquadril Services
This Paper is primarily focused at Domestic Water Well Drilling and Construction.
ABSTRACT
Domestic water well drilling in practice generally comprises an opening diameter hole in the overburden greater than the diameter of the mild steel casing subsequently installed. Such drilling method, unless appropriate steps are taken, can sometimes result in surface water and/or shallow groundwater migrating downwards along the annulus of the steel casing to a deeper aquifer or possibly to the producing zone of the well.
Assuming the Drilling Contractor has the drilling machine capabilities and appropriate experience, there are three steps detailed below, that can be taken to improve protection of the producing section of the well from migrating contaminating surface/shallow groundwater;
Utilisation of high specification uPVC or Steel liner; Effective borehole grouting; Ensuring adequate well head completion.
It is important to note that well disinfection, is merely treating a symptom of the problem, i.e. treating contaminated water, but not addressing the problem itself. if the well is poorly constructed in the first instance.
STEP 1 . IMPORTANCE OF USING HIGH SPECIFICATION uPVC AND STEEL LINER IN WELL PROTECTION
It is critical that only certified and approved Grade 1 mild steel casing is used at the well lining stage. Grade 1 casing ideally would comply with the following specifications:
DIN S9411 ST 44.3 BS 6363 GR 34/26 BS 4360 43
Structural Cold Formed Hollow Section Welded Structural Cold Formed Hollow Section Structural Cold Formed Hollow Section
High specification mild steel casing while more expensive than light, thin walled casing, ensures the following:
factory cut ends forming flush joints between casings for ideal welding conditions; welding will not perforate i.e. burn through the casing; high specification casing will withstand hammering into position and thereby not cause narrowing/damage of the casing's internal diameter.
uPVC casing should be manufactured to DIN 4925. Rigid uPVC casing is noncorroding, lightweight and has high chemical
75

!AH Portlaoise Seminar 1996
resistance. Because of variable formation conditions and different techniques for installation, drilling fluids, gravel packing, grouting, developing and pump testing, it is important that professional advise is sought on the correct uPVC specification to fulfil your casing/screen requirements.
STEP 2. IMPORTANCE OF GROUTING IN WELL PROTECTION
There are a variety of grouting techniques adopted at present when attempts to grout a domestic borehole are undertaken. One method for example comprises the following: plugging the butt of the casing prior to installation in the borehole, pouring grout into the open borehole and thereafter installing casing. This approach has limitations including; on retrieval of the drill string prior to grouting, the open borehole is likely to infill as the overburden is likely to be unconsolidated and liable to collapse (as it would be unlikely to use foam/mud stabilisers in domestic water well drilling). Also this grouting method is unlikely to disperse grout evenly around the relatively tight annulus of the casing following the casing installation stage.
I would like to describe a Domestic Borehole Grouting Method, which in my opinion is a realistic attempt to minimise costs while effectively grouting the annulus of the installed casing. This method would need to be varied where certain drilling conditions are encountered.
1. Open borehole at not less than 10" diameter 1 metre into bedrock.
2. Install 8" diameter (Inside Diameter) casing 1 metre into bedrock.
3. Drill 8" diameter from 1 meter into bed rock to say 4 metres into bedrock.
4. Drill@ 6" diameter from estimate 4 meters into bedrock to completed depth securing adequate water supply.
5. Carry out well development and retrieve drill string and drilling hammer.
6. Install whatever required length of 5" casing to extend from the top of the well to the depth where the borehole narrows from 8" to 6" (i.e. at 4 metres into bedrock level). Prior to installation, weld a wedge on outside of base of 5" casing to anchor it on top of 6" diameter borehole wall. Note that the drilling machinery can now be moved to next site.
7. Backfill the annulus of 5" casing with 1 metre of sand at base and thereafter supply and inject ordinary portland cement at a ratio of 1 bag cement estimate to 6 gallons of water to top of borehole.
STEP 3. IMPORTANCE OF WELL HEAD COMPLETION IN WELL PROTECTION.
The immediate area around the casing protruding above ground level is too often left carelessly unfinished in domestic water wells. For example the casing is often cut flush with the ground level and the open casing exposed. Quite obviously the well is
76

/AH Portlaoise Seminar 1996
vulnerable to run-off water navigating towards the well head, also clay and other debris is liable to fall into the well from the surface. It is advisable to adopt the following procedure to ensure a satisfactory well head completion.
7. Dig an area 3 ft square around the casing and 2 ft in depth.
I .! .... 'I ....
!
2. Pour concrete or use 4 11 solid blocks to construct a manhole with a 11U 11 on one side to allow pipe and cable passage to pressure vessel and electrics.
3. Emplace concrete floor inside manhole at a slope with corner piece in lower corner funnelled through with d- 11
drainage pipe feeding into soakage area thereby preventing water lodging in the manhole. Do not cut off casing to at least 4 11 above concrete floor.
77

/AH Portlaoise Seminar 1996
4. Consider placing a secure lock and a concrete/reinforced steel cover over the manhole.
Overall the cost of carrying out the above three steps is by no means prohibitive and it could be that critical extra investment to protect your natural fresh water supply from surface water/shallow groundwater contamination.
78

/AH Portlaoise Seminar 1996
Case History
Gravel aquifer investigations in the Glen Swilly Valley, Letterkenny, Co.Donegal.
Cecil Shine -
Minerex Environmental Limited
ABSTRACT
With the exception of weathered or heavily fractured zones, the Dalradian bedrock of Co. Donegal is understood to be a poor source of groundwater. On the other hand the quaternary sediments can be significant sources of groundwater.
This case history considers the sequence of events which led to the identification of a palaeochannel(s) of the River Swilly in Glen Swilly, Letterkenny, Co. Donegal, with particular emphasis on the techniques used to identify, explore and quantify the groundwater potential.
The palaeochannel, where the greatest thickness of gravels are concentrated, is approximately 50m wide and the channel has been traced for several kilometers. The gravel thickness varies from 2m in upstream section of the system to 8m in the downstream section, where the gravel sequence is open and unexplored.
The case history will deal with production drilling techniques using a shell and auger drilling rig, also well pointing (using jetting) and cobra drilling techniques used for exploration and observation well installation.
Drilling for the installation of production wells involves sediment sampling, grain size distribution analysis and the selection of optimum screen slot size. Well development is carried out using high pressure water jetting. Pumping tests are carried out using both suction pumps and submersible pumps.
Groundwater investigations are continuing, the aquifer model is being continually revised as new drill data becomes available and the objective of extracting > 1 million gallons (-4500m3) per day, for use as a potable water supply for Letterkenny Town, is considered feasible.
79

/AH Portlaoise Seminar 1996
80

/AH Portlaoise Seminar 1996
AN INTRODUCTION TO THE HYDROFRACTURING OF WATER WELLS
Des Meehan Des Meehan & Co. Ltd.
Waterwell Drilling and Hydrofracturing Contractors
ABSTRACT
The development of hydraulic fracturing into a commercially feasible practice for the ground water industry has progressed world-wide in the past ten years because of the ever increasing demand for greater supplies of clean water. This paper is an attempt to introduce hydraulic fracturing to the Irish industry through my experiences of planning, designing, building and the operation of a hydrofracturing unit over the past year.
ROCK FRACTURING METHODS AND THEIR DEVELOPMENTS
"From among rocks there are some from which rivers gush forth; others there are which when split asunder send forth water." (Quote supplied by Jim Waltz)
For centuries, people have worked to extract groundwater from hard consolidated and crystalline rocks. Except where naturally occurring springs occur, extraction of the water depended upon methods to penetrate rock and to cause its water to flow from fractures. Prior to the invention of effective explosives, such rock breaking methods were mostly limited to picking, prying and percussion drilling. Another rock fracturing method, hydraulic fracturing of boreholes, was developed in the 1940s for the oil drilling industry as an efficient and relatively safe and effective method of opening up tight reservoir rocks. Over the years hydraulic fracturing (HF) in the oilfield has become highly developed, typically complex in execution and certainly routine where oil and gas yields have been declining, or where oil and gas are expensive to extract.
HF is not new to the groundwater industry. However acceptance has been slow primarily due to the cost of the oilfield-style HF operations versus the cost of alternatives to fracturing a low production well, such as drilling a new well, deepening an existing well, providing storage or simply putting up with the available production. The cost of oilfield-scale Hydraulic Fracturing (HF) was judged to be too high for most contractors. However oilfield HF theory and methods have been adapted for the ground water industry in particular areas of America, Canada and Australia and HF has begun to be accepted as a particular water well development and restoration method.
In Hydraulic Fracturing (HF) it is important to understand the physical characteristics of the rocks so that:-
I) It is possible to know when to use a fracturing method on a particular job.
2) The effects of the job can be predicted.
3) To choose the correct methods and if necessary build the equipment for the expected work.
81

!AH Portlaoise Seminar 1996
Regardless of the particular application for an HF contract, the purpose is to open fractures in the rock to allow water to move more easily into the well.
Well productivity resulting from an HF contract depends on the fracture area, which includes fracture width as well as fracture penetration. Higher rates of flow are maintained for longer periods when deeper and wider fractures are encountered. Take, for example, a fracture opening that is doubled from 2mm to 4mm: the wider fracture can transmit eight times as much water.
HF has been used primarily in " hard rock "situations principally fractured crystalline bedrock. In the past, there was little experimentation with other aquifers that may respond to HF, such as limestones, sandstones, basalts and shales but the use of HF in these types of geology has proved successful now, under the right conditions. The target formation for HF is normally is an area of known fractures and productive boreholes. If the rock is seamless, virtually flawless solid rock, fracturing with water pressure is unlikely.
Deciding whether a well is suitable for HF should not be achieved by guess work. A careful analysis of the following points will help to improve the chances of the HF being a success.
I. A well driller's log of information such as borehole depth, borehole diameter, depth of casing, existing water entry levels, standing water level and variations in rock structures are essential.
2. For new wells, observation of the rock cuttings will pinpoint zones in which HF be fruitful.
3. Observations of changes in penetration rate and flushing of the well during the drilling operations are essential pieces of information that also help with the planning of a HF contract.
HYDROFRACTRURING EQUIPMENT
Equipment used in HF, as in drilling, varies greatly in size and complexity. On one extreme are oilfield "superfrac" machines that employ massive pumps and a fleet of trucks. On the other side, specially designed HF equipment for water well use is relatively modest, but must be capable of handling pressures in the range of 800 to 4000 psi maximum pressure and volumes of up to 120 gallons per minute.
The equipment for hyrofracturing consists of the following:-
A) A crane or hoist rig capable of handling high-pressure stainless steel pipes and packer assemblies.
B) A pump with sufficient pressure and volume delivery rate.
C) A sufficient source of clean water, usually from a mobile stainless steel tank on a truck or trailer, with a provision for tapping hydrants.
D) Valves, gauges, controls, relief valves, and fittings to monitor and control fluid injection and proppant if necessary.
E) One or two packers of one or more designs to confine the injection liquid and a means of deploying them.
F) killed personnel to operate the equipment.
82

!AH Portlaoise Seminar 1996
WALK-THROUGH
It is useful to take a walk-through of a fairly typical HF contract in order to get a feel for the task.
I) A borehole survey of the area is necessary in order to check the location, depth, and standing water level of any other wells.
2) If there is no detailed borehole log available, it will be necessary to check the depth of steel casing with a magnetic casing detector or if the casing is plastic, it may be necessary to make use of a borehole TV camera.
3) The packer inflation line is attached, then water or oil is pumped into the packer The standing water level is checked before the packer is installed in the borehole. High pressure stainless steel pipes are then attached to the packer and run in to the desired depth.
4) The supply lines are attached to the tank, the booster pumps, the valve tree and the high pressure water pump.
5) As the booster pumps and the high pressure pump are started, the well is filled with water and air is allowed escape completely.
6) Inflation of the packer to full pressure takes place, the main pump is started, pressure builds up to a maximum, then falls off to an injection pressure. The whole sequence may take 10 to 90 seconds.
7) Sufficient water is pumped in to extend the fracture opening. At the end of the cycle, the pumps are shut off and the well pressure relieved out the relief line.
8) Clear HF water flows out until turbid fracture water appears. Based on the results, the equipment is either removed or reset at the next deeper zone.
9) A pumping test may be carried out on the borehole to check the improved output and a check of the standing water level is necessary.
SAFETY, STRUCTURAL HAZARDS AND SANITATION
SAFETY
Employees should be made aware of the potential danger, including injury from water under high pressure and flying debris if pipe lines should break or become separated. All pumps, lines, hoses, valves, etc. should capable of withstanding the expected pressures within a margin of safety.
STRUCTURAL HAZARDS
I. A borehole that has been in the ground for a number of years is not at I 00% structural strength. Corrosion may have weakened the metal casing and also borehole wall collapse is a possibility. Generally it is difficult to access the condition of a well without the use of a borehole camera.
83

!AH Portlaoise Seminar 1996
2. Another hazard is encountering shallow fractures. While they may be the easiest to open and often highly productive, they are most vulnerable to seasonal variation in flow, contamination as well as borehole wall collapse.
3. A further "hazard" is fracturing into a neighbour's well. In this case, such a fracture may help as well as hurt the neighbour's water supply.
4. A chance of a dramatic drop off in pumping level is a possibility. Different fracture zones have dissimilar hydrostatic levels, and connecting into a new zone with a lower head may cause a loss of wellbore storage.
5. After carrying out HF in a soft weathered rock, it is possible for the fracture to squeeze shut again after several weeks of good production.
SANITATION
Avoiding outside contamination into induced fractures can be a major problem. Water for use in the mobile tank should be tested on a regular basis and injection water should be chlorinated.
TYPES OF BOREHOLES THAT CAN BE HYDROFRACTURED
A) Developing and redeveloping water wells B) Developing monitoring wells C) Developing dewatering wells D) Geologic borehole testing E) A HF pump, without the packer, can be used for jetting, especially for screened wells. F) Developing geothermal reservoirs by frac connecting two wells.
FUTURE DEVELOPMENT OF HYDROFRACTURING EQUIPMENT
In order to offer a professional service to the water industry it will be necessary to acquire the following pieces of equipment in the future.
1) Data logging equipment for monitoring the pressures and flow rates during the HF process and pumping tests. 2) CCTV borehole camera, recorder and generator .. 3) A magnetic casing detector. 4) Packers for large diameter boreholes.
Finally with approximately 25% of the earth's available drinking water underground, its recovery and protection becomes more important every year.
84

/AH Portfaoise Seminar 1996
PROTECTION OF PUBLIC GROUNDWATER SOURCES
Donal Daly and Jenny Deakin Geological Survey oflreland
ABSTRACT
Local authority groundwater supply sources are of crucial importance in any region. Consequently, protection of these sources from potentially polluting activities is a necessary objective. This objective can be achieved by a groundwater protection scheme in which source protection is a primary component. A source protection scheme consists of a land surface zoning map, an inventory of potential pollution developments and a management plan for locating and controlling both existing and new potentially polluting activities. This scheme provides a logical framework for decisionmaking by local authorities on land-use planning and enables local authorities to focus on high risk areas and activities.
INTRODUCTION
Groundwater supplies about 25% of drinking water to Ireland's c1t1zens. In several counties, dependency on groundwater supplies is over 50%. Wells are by far the most numerous water supply structures in Ireland. There are over 500 public supply wells and springs, over 300 group scheme wells and springs and tens of thousands of private wells. While groundwater sources are less susceptible to contamination than surface sources, nevertheless most are located in rural areas where there are pollution hazards. The main hazards are farmyards and septic tank systems. Others include landspreading of organic wastes, fertilizers and pesticides; landfills; industries storing and/or disposing of noxious wastes on-site; and petrol stations and diesel storage tanks.
With proper management, groundwater is a renewable resource that can provide a continuous source of high quality water for consumption. Good management involves taking preventative measures to minimise the possibility that land uses will contaminate the groundwater abstracted from wells and springs. The main reasons for taking such measures are firstly, to minimise the potential risks to the health of the community and secondly to avoid the cost of contamination. While the health risk can be reduced by water treatment, the financial costs of contamination can be substantial.
Potential Costs of Contamination + Loss of a developed well/wellfield/spring, at least temporarily. + Transporting water from an alternative source. + Finding a new source. + Drilling, construction and equipment costs of well replacement. + Clean up and treatment of contaminated water. + Increased monitoring requirements.
Experience internationally has shown that it is more cost-effective to implement a pro-active pollution prevention programme to guard against groundwater contamination than to pay for an alternative drinking water supply or initiate groundwater remediation efforts (i.e. "prevention is better than cure"). Also, such a programme is a practical means of complying with the Local Government (Water Pollution) Acts of 1987 and 1990 and with environmental principles such as the principle of sustainable development, the precautionary principle, the principle that environmental protection should be an integral part of the development process and the "polluter pays" principle.
85

/AH Portlaoise Seminar 1996
Until recently, the main emphasis in the usage of groundwater was on the location and development of sources; in the future, greater emphasis will need to be given to the protection of these sources. The Geological Survey of Ireland (GS!) is recommending and is currently using a groundwater protection scheme (Daly, 1991; Daly, 1995(a); Daly, 1995 (b)), which is a pro-active pollution prevention programme. This paper summarises the elements of the groundwater protection scheme that deal with source protection. It also summarises the approaches used by the National Rivers Authority (NRA) in England and the Department of Health in Washington State to enable a comparison with the Irish scheme.
WHAT IS A SOURCE PROTECTION AREA?
A source protection area (SPA) is defined as the surface and subsurface area surrounding a well, wellfield or spring in which contaminants may enter groundwater and move towards and reach such a well, well field or spring. (This is an adaptation of the definition used by the U.S. EPA (1987) for a wellhead protection area.) Delineation of source protection areas and zones is the process of determining what geographic areas should be included in a source protection programme. These zones are then managed by the local authority to minimise the potential for groundwater contamination by human activities that occur on the land surface or in the subsurface.
SOURCE PROTECTION ZONES IN ENGLAND AND WALES
The National Rivers Authority (NRA), who have a statutory responsibility for groundwater protection in England and Wales, have produced and are using a groundwater protection policy (NRA, 1992). The policy deals with both groundwater sources and resources. Three groundwater source protection zones are recognised:
• Zone I (Inner Source Protection) • Zone II (Outer Source Protection) • Zone III (Source Catchment)
Zone I, which is located in the immediate vicinity of the source, is defined to protect against the effects of human activity which might have an immediate effect upon the source. The area is defined by a 50-day travel time from any point below the water table to the source and as a minimum of 50 metres radius from the source. It is based on the time it takes for biological contaminants to decay.
Zone II (Outer Source Protection) is larger than Zone I and is the area defined by a 400 day travel time from any point below the water table to the source. The travel time is based upon that required to provide delay and attenuation of slowly degrading pollutants. In high storage aquifers such as the Sherwood sandstone, the larger of either the area defined by the 400 day travel isochron or the recharge catchment area calculated using 25% of the long term abstraction rate is taken.
Zone III (Source Catchment) covers the complete catchment area of a groundwater source. It is defined as the area needed to support an abstraction from long-term annual groundwater recharge.
The orientation, shape and size of the zones are determined by the hydrogeological characteristics of the strata and the direction of groundwater flow. The NRA has developed a methodology to define source protection zones using steady-state groundwater models, but will consider any technically valid method in any particular case. The boundaries of the zones are not regarded as definitive, as any method of delineation is limited by the sufficiency of the data on any aquifer and the hydraulic characteristics. The NRA is producing vulnerability maps at a scale of 1: I 00,000; however, these would appear to be used for resource protection only.
86

!AH Portlaoise Seminar 1996
In addition to the protection zones, the policy includes objectives and statements with respect to eight different types of threat to groundwater - (i) control of groundwater abstractions, (ii) physical disturbance of aquifers and groundwater flow, (iii) waste disposal to land, (iv) contaminated land, (v) disposal of liquid effluent, sludges and slurries to land, (vi) discharges to underground strata, (vii) diffuse pollution to groundwater, (viii) additional activities or developments which pose a threat to groundwater quality.
The policy statements and related maps and zones do not, by themselves, have a statutory basis. They are a framework for decision making in land-use and development planning.
SOURCE PROTECTION ZONES IN WASHINGTON STATE
In Washington, wellhead protection area boundaries are defined primarily based on the time of travel rates of groundwater (Department of Health, 1993). A typical wellhead protection area (WHP A) consists of five zones:
• The sanitary control area; • Three primary zones, based on 1, 5 and 10 year time of travel rates; • A buffer zone if necessary.
The sanitary control area is the operational courtyard which should be tightly controlled to minimise any direct contamination at the wellhead, in particular from any surface flows reaching the wellhead and travelling down the casing.
Zone 1 - the one year horizontal time of travel boundary - is managed to protect the supply from viral, microbial and direct chemical contamination. Within Zone 1, potential sources of microbial contamination should be strictly managed to eliminate or reduce the possibility that microbial contamination will occur. Also, chemicals capable of contaminating groundwater should not be stored and used in this zone, or should be stored and used with sufficient precautions to protect the groundwater resource.
Zone 2 - the 5 year horizontal time of travel boundary - should be actively managed to control potential chemical contaminants. All potential contaminants sources shall be addressed, with an emphasis on pollution prevention and risk reduction management. Zone 2 is intended to provide information to local planners when siting future "high risk" and "medium risk" potential contaminant sources and to provide more time for responding to contamination.
Zone 3 - the 10 year horizontal time of travel boundary - determines the outer boundary of the wellhead protection area. Within Zone 3, high risk operations should be identified, and steps taken to reduce contaminant loading.
The Buffer Zone is an area up-gradient of Zone 3, potentially extending to include the entire zone of contribution. Alternatively, it may focus on selected areas of concern such as recharge areas or locations where the aquifer may be exposed at the surface. This zone helps to compensate for errors when calculating the wellhead protection area boundaries.
In addition to the zones, the Washington State Protection Programme includes an inventory of potential sources of groundwater contamination and a wellhead protection area management plan.
87

!AH Portlaoise Seminar 1996
A PROPOSED SCHEME FOR IRELAND
In proposing a groundwater protection scheme suitable for use in Ireland, the GS! has reviewed the policies and practices in other countries, in particular England, Switzerland and the U.S. Specific advice was obtained from the British Geological Survey and the Wisconsin Geological and Natural History Survey. Input was requested and given by academic and consulting hydrogeologists in Ireland. The scheme specifically sets out to take account of the hydrogeological situation in Ireland. While the scheme deals with both source and resource protection in an integrated way, this paper deals with source protection only.
There are three main components to the scheme: i) A land surface zoning map (source protection map), which shows zones requiring different
degrees of protection; ii) An inventory of potential pollution sources within the source protection area; ii) Control measures ( code of practice or management plan) for existing and new potentially
polluting activities.
GROUNDWATER SOURCE PROTECTION ZONES
GENERAL STRATEGY
Land surface zoning provides the general framework for the groundwater protection scheme. The outcome is a map, which divides the area in the vicinity of the groundwater source into a number of protection zones according to the degree of protection required.
There are two main elements to source protection land surface zoning: • Areas surrounding individual groundwater sources; these are termed source protection areas
(SP As). • Division of the SPAs on the basis of the vulnerability of the underlying groundwater to
contamination. These elements are integrated to give the source protection zones.
GROUNDWATER SOURCE PROTECTION AREAS
General Three source protection areas are recommended for delineation:
• Source Site (SS); • Inner Protection Area (SI); • Outer Protection Area (SO), encompassing the source catchment area or zone of
contribution (ZOC).
Delineation of Source Protection Areas The orientation, shape and size of the Source Site is based on practical, non-technical considerations.
In delineating the Inner and Outer Protection Areas areas, there are two broad approaches: firstly, using arbitrary fixed radii, which do not incorporate hydrogeological considerations; and secondly, a scientific approach using hydrogeologica] information and analysis, in particular the hydrogeological characteristics of the aquifer, the direction of groundwater flow, the pumping rate and the recharge.
Where the hydrogeological information is poor and/or where time and resources are limited, the simple zonation approach using the arbitrary fixed radius method is a good first step that requires little technical expertise. However, it can both over- and under-protect. It usually over-protects on the downgradient side of the source and may under-protect on the upgradient side, particularly in karst
88

/AH Portlaoise Seminar 1996
areas. It is particularly inappropriate in the case of springs where there is no part of the downgradient side in the zone of contribution. Also, the lack of a scientific basis reduces its defensibility as a method.
There are several hydrogeological methods for delineating SP As. They vary in complexity, cost and the level of data and hydrogeological analysis required. Four methods, in order of increasing technical sophistication, are used by the GS!:
• Calculated Fixed Radius; • Analytical Methods; • Hydrogeological Mapping; • Numerical Modelling, using FLOWPATH.
Each method has limitations. Even with relatively good hydrogeological data, the heterogeneity of Irish aquifers will generally prevent the delineation of definitive SPA boundaries. Consequently, the boundaries must be seen as a guide for decision-making, which can be reappraised in the light of new knowledge or changed circumstances. Further information on these methods can be obtained from the GS!.
Source Site (SS) This is the innermost protection area, which includes the source and usually the operational activities associated with water supply. It should be under the ownership and control of the local authority. The area should be fenced off and the boundaries should be at least I Om from the source. All potentially polluting activities not directly related to the production of drinking water should be prohibited and care should be taken that the operational activities do not cause contamination (e.g. runoff from paved areas, storage of fuel and chemicals).
Inner Protection Area (SI) This zone is designed to protect against the effects of human activities that might have an immediate effect on the source and, in particular, against microbial pollution. The area is defined by a I 00-day time of travel (TOT) from any point below the water table to the source. (The TOT varies significantly between regulatory agencies in different countries. The I 00-day limit is chosen for Ireland as a relatively conservative limit to allow for the heterogeneous nature oflrish aquifers and to reduce the risk of pollution from bacteria and viruses, which in some circumstances can live longer than 50 days in groundwater.) In karst areas where conduit flow is dominant, the TOT approach is not applicable, as there are large variations in permeability, high flow velocities and a low level of predictability.
If it is necessary to use the arbitrary fixed radius method, a distance of 300m is chosen. A semicircular area is used for springs. The distance may be increased for sources in karst (cavernous) aquifers and reduced in granular aquifers and around low yielding sources.
Outer Protection Area (SO) This zone covers the zone of contribution (ZOC) ( or complete catchment area) of the groundwater source. It is defined as the area needed to support an abstraction from long-term groundwater recharge (the proportion of effective rainfall that infiltrates to the water table). The abstraction rate used in delineating the zone will depend on the views of the source owner. The GS! currently increases the maximum daily abstraction rate by 50% to allow for possible future increases in abstraction and for expansion of the ZOC in dry periods. In order to take account of the heterogeneity of many Irish aquifers and possible errors in estimating the groundwater flow direction, a 20° variation in the flow direction is sometimes included as a safety margin in delineating the ZOC. A conceptual model of the ZOC ( or outer protection area) and the 100-day TOT boundary ( or inner protection area) is given in Figure I.
89

/AH Portlaoise Seminar 1996
A
A
----'-ZOI ------- ;,,_..-Groundwater
Land Surface •
-- _w. - _.,.. .. -. --~ ..... !.
•••• j·
! 7iOI ,,
I Divide
Pumping Well
: _____ .... .,..- .... 1-·---.i----..... J;~ ' •
, J' ' I Unsaturated ,, . .., -. . - . -
---
c1oss SECT!°"' I ,
I I
I
I
PLAN VIEW
Flow Direction
I· I
----:L. I :
- I
·~ndwater
: Divide I
not to scale
Figure 1 Conceptual Model of the Zone of Contribution (ZOC) and the Zone of Influence (ZOI) at a Pumping Well (adapted from U.S. EPA, 1987)
90

!AH Portlaoise Seminar 1996
If the arbitrary fixed radius method is used, a distance of !OOOm is chosen with, in some instances, variations in karst aquifers and around springs and low-yielding wells.
The boundaries of the SP As are based on the horizontal flow of water to the source and, in the case particularly of the Inner Protection area (SI), on the time of travel in the aquifer. Consequently, the ve1tical movement of a water particle or contaminant from the land surface to the water table is not taken into account. This vertical movement is a critical factor in contaminant attenuation, contaminant flow velocities and in dictating the likelihood of contamination. It can be taken into account by mapping the groundwater vulnerability to contamination.
GROUNDWATER VULNERABILITY MAPPING
Vulnerability is a term used to represent the intrinsic geological and hydrogeological characteristics that determine the ease with which groundwater may be contaminated by human activities. It provides a measure of the likelihood ofcontamination occurring.
The vulnerability of groundwater depends on the time of travel of infiltrating water (and contaminants) to the water table, on the contaminant attenuation capacity of the geological materials and on the relative quantity of contaminants that can reach the groundwater. These are a function of the following natural geological and hydrogeological attributes of any area: + the subsoils that overlie the groundwater; • the recharge type - whether point or diffuse; • the thickness of the unsaturated zone below the point at which the contaminant is introduced.
The geological and hydrogeological characteristics can be examined and mapped, thereby providing a groundwater vulnerability assessment for any area or site. The map shows the vulnerability of the first groundwater encountered to contaminants released at 1-2 m below the ground surface. In assessing the vulnerability at a particular site, account must be taken of any variations from this; for example, landspreading on the ground surface or a landfill where a significant depth of the subsoil is removed for cover material. Four groundwater vulnerability mapping categories are used by the GS! - extreme, high, moderate and low. Examples of each category are given in Table 1.
Jnliit!itii iitj!l)g f Extreme
High
Moderate Low
Table 1 : Examples of Vulnerability Ratings
Areas of outcropping bedrock or where bedrock is overlain by shallow (<3111) subsoil Bedrock overlain by 3-!0m of intermediate permeability subsoil such as sandy till or 3-5111 of low permeability subsoil such as clayey till, clay or peat Bedrock overlain by> 1 Om of sandy till or 5-1 Om of clayey till, clay or peat Bedrock overlain by> I Om of clayey till, clay or peat
( from Daly and Warren, 1994)
GROUNDWATER SOURCE PROTECTION ZONES
The matrix in Table 2 below gives the result of integrating the two elements of land surface zoning (source protection areas and vulnerability categories)- a possible total of 12 source protection zones .. In practice, the source protection zones are obtained by superimposing the vulnerability map on the source protection area map. Each zone is represented by a code e.g. SO/II, which represents an Outer Source Protection area where the groundwater is highly vulnerable to contamination. All of the hydrogeological settings represented by the zones may not be present around each local authority source. The outcome is a groundwater protection zone map (see example in Figure 2).
91

!AH Porllaoise Seminar 1996
Inner source protection area (SI)
Outer source protection area (SO)
1 km Figure 2A Source Protection Areas (SPAs) -----------------------------------
Extreme (E)
N
t Figure 2B Groundwater Vulnerability Map ----------------------------------
Zone SO/E ZoneSVH
Zone SO/H
Figure 2 C Source Protection Zones ------------------------------------------------------------Figure 2 Delineation of source protection zones around a public supply well from the integration of the source protection area map and the vulnerability map
92

/AH Port/aoise Seminar 1996
Table 2 Matrix of Source Protection Zones
Extreme(E) Hlgh (HJ SI/H Moderate (M) SI/M Low (L) SS/L SI/L SOIL
EXPERIENCE OF GS! IN THE DELINEATION OF SOURCE PROTECTION ZONES
In the last two years, the GS! has delineated source protection zones around 30 public groundwater supplies. Some of our conclusions are as follows: + the paucity of high quality hydrogeological information, particularly on hydraulic gradients,
hydraulic conductivities and recharge has hindered the work; + in the case of spring sources, information on spring outflows and their variability is essential but is
seldom available; + around karst springs, the only realistic approach is to try to define the catchment area (ZOC) using
hydrogeological mapping, tracing, water balance estimates and by identifying sinking stream inputs and other relevant karst features;
+ numerical modelling is of considerable assistance in conceptualising the groundwater flow regime in the vicinity of wells, although we seldom use it to provide the final SPA boundaries;
+ if a detailed subsoils map is not already available, the input of a specialist in Quaternary geology mapping is desirable.
INVENTORY OF POTENTIAL SOURCES OF GROUNDWATER CONTAMINATION
An important element of groundwater source protection is an inventory of all potential hazards in the delineated SPA. This allows an assessment of the contamination risk. For example, a septic tank system in Zone SI/E poses a far greater risk to the well or spring than in Zones SI/L or SO/H. The inventory allows local authority staff to give priority to monitoring developments placing groundwater at most risk and to require improvements, if deemed necessary.
CONTROL OF POLLUTING ACTIVITIES
The control of groundwater contamination sources is by means of a code of practice which lists the degree of acceptability of potentially polluting activities for each zone and describes the recommended controls for both existing and new activities. Decisions on the control measures are based on assessments of the hazard provided by a particular development, the likelihood of contamination as indicated by the vulnerability rating and on the proximity to the groundwater source as shown by the SPA. Details on the approach recommended by the GS! are given in Daly (1995a). The following examples illustrate the approach.
Suggested control measures for the location of septic tank systems in Zones SI/II and SO/E New Systems Not generally acceptable, unless it is shown by investigation and assessment that the depth to bedrock is greater than 3m and consequently the risk to groundwater is reduced or alternatively can be significantly reduced by the use of engineered preventative measures, such as on-site treatment systems.
93

/AH Portlaoise Seminar 1996
Existing Systems Each system is required to comply with S.R.6:1991, particularly with regard to the percolation area. If there is evidence that the system is posing a significant risk to the source, further preventative measures will be required.
Possible control measures for the location of septic tank systems in Zones SI/L, SO/Hand SO/M New Systems Acceptable, subject to: (i) compliance with S.R.6:1991; (ii) provision of evidence on the type and depth of subsoil to ensure that the site is not in a higher risk sub-zone; (iii) taking account of the number of existing houses so that the problem of significant contamination by nitrate does not arise. Existing Systems If there is evidence of significant groundwater contamination or pollution, the system!s will be checked for compliance with SR. 6: 1991.
RECOMMENDATIONS
+ In situations where a developer disagrees with local authority decisions based on a source protection scheme, the local authority can put the onus on the developer to provide new information which might enable the zonation to be altered and improved and, in certain circumstances, the planning decision to be changed.
• Data collection on groundwater supply sources needs to be significantly improved; particularly by means of pumping tests and monitoring of water levels, discharges and quality.
• Local authorities should include the delineation of source protection zones as a requirement for all new public groundwater supplies. The additional cost is small - five to ten days extra work by a hydrogeologist.
+ Local authorities and the EPA should require consultants to follow the GS! guidelines on vulnerability mapping and on the SPAs, so that there is consistency throughout the country. (This does not necessarily mean that the delineation methods used by the GS! should be followed - the choice of technically valid methods is for the consultant to decide.)
• Local authorities should, over the next few years as resources allow, delineate source protection zones using hydrogeological methods and preferably as part of county-wide groundwater protection schemes. In the meantime, it is advisable to delineate SP As using arbitrary fixed radii.
ACKNOWLEDGEMENTS
The influence and input of colleagues in the GS!, in Ireland and abroad in drawing up the groundwater protection scheme has been crucial. This paper is published with the permission of Dr P. McArdle, Director, Geological Survey oflreland.
REFERENCES
Daly D. 1991. Groundwater protection schemes. Proceedings of Annual Spring Show Conference of Local Authority Engineers. Department of the Environment, Dublin.
Daly, D. 1995(a). A Proposed Groundwater Protection Scheme for Ireland: Draft for Consultation. (This can be purchased from the GS!; price £5.)
Daly, D. l 995(b) Groundwater protection in Ireland : a scheme for the future. Proceedings of !AH Portlaoise Seminar "The Role of Groundwater in Sustainable Development".
Department of Health, 1993. Washington State wellhead protection program. 91 pp. NRA, 1992. Policy and practice for the protection of groundwater. National Rivers Authority. 52pp. U.S. EPA, 1987. Guidelines for delineation of wellhead protection areas. Office of Groundwater
Protection, U.S. Environmental Protection Agency.
94

/AH Portlaoise Seminar 1996
GROUNDWATER CONDITIONS IN THE LIMESTONES OF EASTERN COUNTY GALWAY
David Drew Geography Department, Trinity College Dublin
ABSTRACT
The Carboniferous limestone of the lowlands of Counties Galway, Clare, Roscommon and Mayo exhibit varying degrees of karsti.fication. Ancient and more recent phases of karsti.fication have occurred and this together with the great variations in thickness and type of unconsolidated material render the hydrogeology very complex. The hydrogeo/ogy limestone areas of eastern Co. Galway are described as exemplifying conditions prevailing over the wider limestone region of western Ireland
INTRODUCTION
That part of County Galway lying to the east of Lough Corrib and of the Burren plateau is a part of a much more extensive limestone lowland which forms the western extension of the Central Plain of Ireland. Extending from east County Mayo in the north to the Ennis-River Fergus estuary region of Co. Clare in the south and encompassing much of County Roscommon the area is characterised by subdued topography, relief rarely exceeding 120m O.D., and a complex hydrological system which creates problems in terms of water supply and of water quality. Eastern County Galway exemplifies the hydrological characteristics of the wider area.
With the exceptions of the Devonian rocks of Slieve Aughty the whole area is underlain by Carboniferous limestone. To the east of Athenry the impure Calp limestone outcrops but elsewhere the very pure Burren limestone forms the aquifer rock. Pleistocene (glacial) and Holocene (peat and marl) deposits blanket the bedrock throughout the area the thicknesses ranging from tens of metres (drumlinoid features in particular) to rendzina soils 100-ISOmm deep. In general the thickness of the overburden decreases from east to west.
Although the limestones are a highly karstified aquifer (groundwater circulation via solutionally enlarged fissures in the bedrock) the present day hydrological situation is the product of:
I) Extensive karstification to a base level lower than that at present, during the Tertiary. 2) Glacial disruption of the drainage, blocking of underground channels and partial sealing
of the surface of the limestone, thus creating a surface drainage system. 3) Postglacial changes in local base level, infilling of lake basins, formation ofturloughs and
partial re-establishment of the groundwater circulation system.
GROUNDWATER RECHARGE
Precipitation averages I 000mm in the east Galway area of which c. 65% is effective (potential runoff or recharge), equal to a specific discharge of c. 2 cumecs/100km2).
The surface drainage system (Figure I) is of low density and in some areas, notably east of Oranmore and between Gort and Kinvara, wholly absent. Furthermore many of the trunk streams (Clare,
95

/AH Portlaoise Seminar 1996
cu9 0
0
Permanent Lake
Turlough
5 10 kilometres
D 0
[)o
Q
Figure I. The surface drainage pattern in eastern Co. Galway. (After Coxon and Drew 1986)
96

/AH Portfaoise Seminar 1996
Dunkellin, Lavally for example) are in part or whole artificial drainage conduits dating from the midnineteenth century constructed in order to link a series of turloughs with the sea or with Lough Corrib. Thus, although to an extent the western part of the area has been 'dekarstified' by arterial drainage, groundwater is the primary water resource of the region.
GROUNDWATER DISCHARGE
The overall movement of groundwater is from east to west towards outlet springs located along the coast or close to the shore of Lough Corrib. Flow rates range from 5-200m/hour (rates increasing by an order of magnitude under high water conditions) under hydraulic gradients which rarely exceed 1 :75 and may be almost negligible in coastal areas under low water conditions. South of Galway city groundwater discharge is via springs located at or close to the coast - commonly there are a series of springs the lowest within or just below the inter tidal zone, at successively higher elevations and which become operative at successively higher stage levels. These coastal springs are usually associated with the heads of the funnel shaped embayments that occur on the eastern and southern shores of Galway Bay: for example those at Oranmore, Clarinbridge, Kilcolgan and Kinvara.
To the north of Galway city where drainage is to Lough Corrib, there are two groups of springs. The easterly line of springs (eg Leitra near Glenamaddy, Athenry) has no obvious topographic or geological association but may correspond to a lessening in the thickness of the overburden. The outflow of these springs discharges into the surface rivers (Abbert, Grange, Sinking, Black, Clare) which in their turn lose water through their beds in well-defined influent reaches of channel. This recharge, together with that from numerous other small sinks and diffuse recharge, emerges from a more westerly set of springs located l-3km east of the shore of Lough Corrib. These include the springs at Bunatober, and at Corrandulla (used as a group water supply source).
These springs appear to be located at what was formerly the shoreline of Lough Corrib prior to the shrinking of the lake area and growth of peat. All springs in the area exhibit 'flashy' flow regimes, responding rapidly to rainfall and having marked fluctuations in water chemical and physical properties. This is a reflection of the shallow nature of the groundwater systems and the short residence time for water.
GROUNDWATER RESOURCES
Surface water is used as the source for the major regional supply schemes in east County Galway -Loughs Corrib and Rea being the major sources, whilst Gort is supplied from the Gort River. However, areas remote from these surface water bodies must use groundwater, either from high yielding boreholes or springs ( eg Athenry, Kinvara) or from more modest borehole sources which serve small group schemes or individual dwellings. The great majority of boreholes are relatively shallow (20-80m deep) with only c. 8% exceeding 1 OOm in depth. Thus data are largell, absent concerning possible supplies of groundwater at depth. Borehole yields average c.150-250 m /day but with wide variations. Some 35% of boreholes yield less than 50m3/day whilst 6 boreholes produce in excess of I 000m3/day. The most productive sources are grouped around Athenry, Tuam and Williamstown.
THE CHARACTER OF THE LIMESTONE AQUIFER
Carbonate rock aquifers encompass a range of hydrological characteristics ranging from those in which the movement and storage of water is evenly distributed throughout the rock mass and via
97

!AH Portlaoise Seminar 1996
small fissures or interstices, to those in which the great majority of groundwater movement takes place via a highly integrated network of solutionally enlarged conduits - extreme karstification. In County Galway karstification appears to be highly developed with an epikarst, 15m in thickness exhibiting solutional enlargement of joints and bedding partings which therefore creates a shallow zone of high permeability. In addition there is some evidence for a mature (perhaps partly fossil) system of large water bearing conduits which function as linear zones of very high transmissivity. Such cave conduit systems are known to exist in the Gort area and have diameters in excess of I Om whilst a rectilinear system of cave conduits l-2m3 in cross-sectional area has been mapped at Ballyglunin beneath the Abbert River (Figure 2). In the instance of Ballyglunin it appears that a conduit system that was originally oriented north-south is being modified in response to the present day east-west hydraulic gradient in the area.
As was noted previously, many of the fissure and conduit systems have been infilled in whole or part by sediments of Quaternary age. Commonly the effect has been to reduce overall permeability but if the infilling material is of coarse texture the effect may be to lessen permeability but to increase storage and turnover times of groundwater. For example, the extensive deposits of siliceous sands that are known to exist to the south of Knockmaa near Belclare / Tuam infill karstic conduits. the aquifer in the area accordingly has a bimodal permeability with flow rates through the sand-filled caverns being at rates of c.5m/hour compared with rates of>200m//hour in the surrounding fissures.
CONCLUSIONS
Although problems with consistency of groundwater quality and reliability of supply are common throughout the east Galway area, the lack of any alternative source of supply means that groundwater resources will inevitably become of increased significance in the future. A fuller understanding of groundwater characteristics and the compilation of an inventory of resources in the area is therefore of prime importance.
REFERENCES
Drew, D.P. and Daly, D. 1993 Groundwater and karstification in mid-Galway, south Mayo and north Clare. Geological Survey of Ireland Report Series, No. 93/3, Dublin. 86pp
Drew, D.P. 1973 Ballyglunin Cave Co. Galway and the hydrology of the surrounding area. Irish
Geography, 6( 5), 610-617
Coxon, C. and Drew, D.P. 1986 Groundwater flow in the lowland limestone aquifer of eastern Cos.
Galway and Mayo, western Ireland. In Paterson Kand Sweeting M. (editors) New Directions
in Karst Norwich 259-280
98
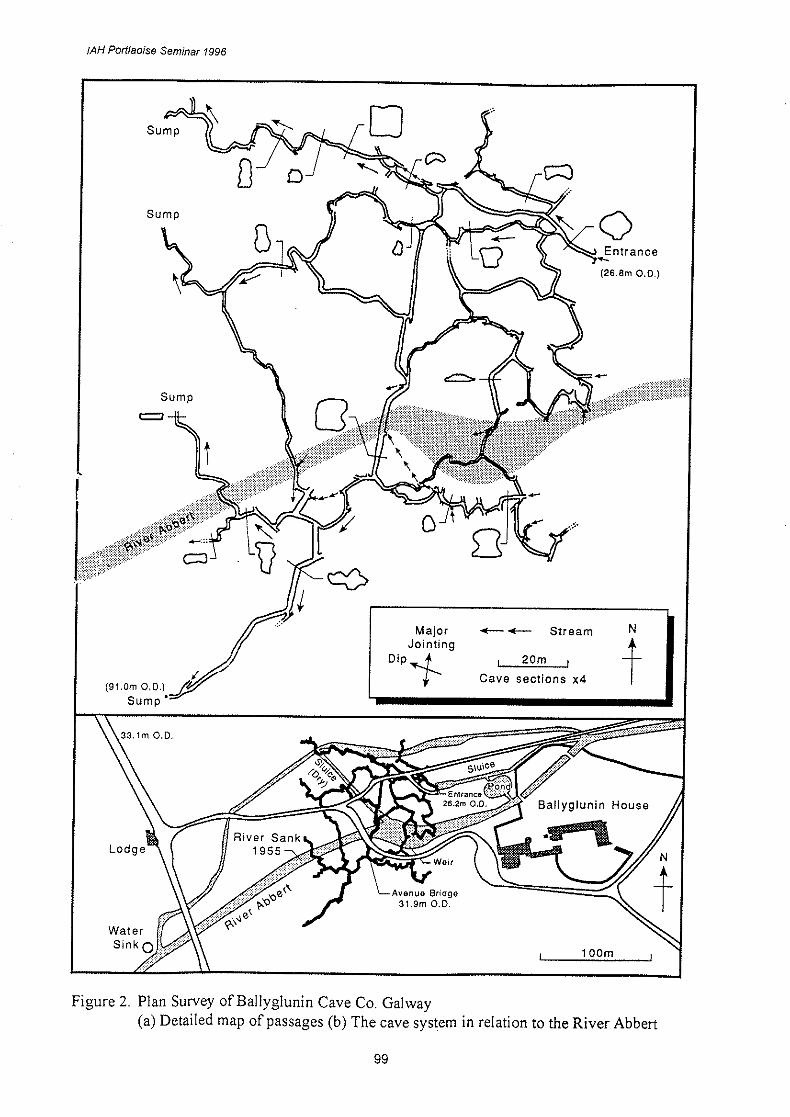
I
!AH Portlaoise Seminar 1996
Sump
Sump
=
Major Jointing Dip-!-
Figure 2. Plan Survey ofBallyglunin Cave Co. Galway
(26.Bm 0.0.)
+-+- Stream N
20m t Cave sections x4
1 OOm
(a) Detailed map of passages (b) The cave system in relation to the River Abbert
99

/AH Portfaoise Seminar 1996
100

a e I
WELL PERFORMANCE TESTS • THEIR USE IN BOREHOLE MANAGEMENT
SHANE O'NEILL, TRINITY COLLEGE DUBLIN
ABSTRACT
Well petlormance tests are used to determine the different components of head losses as ground water moves from the aquifer and into the well. There are two principal types of step test. The multiple rate and the multiple step test. A correctly conducted step test will provide information on borehole yield, efficiency, appropriateness of borehole design for a given aquifer, hydraulic aquifer parameters, and duty setting of the pump. Many analytical techniques are available to analyse step tests depending on the actual aquifer type. Krusseman and de Ridder, 1990 gives perhaps the best overview of the techniques available. The Jacob, 1947 method continues to be the most prevalent model used to determine these head losses. The data from a successfully completed petlormance test will enable the well to be correctly commissioned, the on-going petlormance of the well to be monitored, the instigation of a preventative maintenance programme, the determination of the aquifer hydraulic parameters. The data may also be modelled to gain an insight into the overall hydraulics of the aquifer under pumping conditions.
1.0 WHAT ARE WELL PERFORMANCE TESTS
The resistance to movement by water through an aquifer under pumping conditions is termed aquifer losses. The resistance to movement by water into a pumping well through a well screen, gravel pack, or from a fracture is termed well losses. A well petlormance test is a method of determining these components of aquifer losses as water approaches the well and head losses as the water moves into a
Discharge (0)
Ground Level Well
J: Theoretical Drawdown
~ + C:
~ ' , Aquifer Losses (C)
' ,
j I I
' ~ Dynamic 0 A
'" Water Linear Well Losses (B)
0 Level • >--
... ...
C: ... 0
TI Q) ... (/)
-0 Q) ... Ground Water Flow C: Q)
I!! " ... (/)
... ...
pumping well. The ratio of aquifer losses to well losses can be used as a measure of the efficiency of that well (Biershenck, 1963).
Well Performance Tests

a e 2 Figure No. 1 : The Different Components of Drawdown in a Well (after Krusseman and de
Ridder, 1990)
Jacob (1947) related these two types of losses together in a single equation which Rorabaugh, 1953 presented in the more usual form of:
Sw=BQ+CQP Eqn. 1
where
Sw is drawdown (metres) B is a constant for aquifer losses and is time dependent and has units of days per metre3
C is a constant for well losses and has units of days2 per metre5
Q is the well discharge and has units of metres3 per day p is an index with a value of between 1.5 and 3.5 but more normally taken to be equal to 2 and is
dimensionless;
Equation I has no independent time parameter and so the resultant solution is only valid for that duration of pumping for which the step test was carried out. It is also important to point out that Jacob's (1947) solution is just one conceptual model of a step drawdown test. Helweg, 1994, provides a very detailed examination of the validity of Jacob's 1947 approximation, and provides a general solution to the step drawdown test for any discharge rate and for any duration of pumping. Rushton and Rathod, 1988, examine the effects of seepage faces, layered aquifers, the change from confined to unconfined conditions and the effects of partial penetration on the analyses of step drawdown tests. Similarly Barker and Herbert, 1992(b) and Barker and Herbert, 1992(a) develop a conceptual model to account for the well losses through well screens. Avci, 1992 developed a conceptual and computer model to analyse step tests of unequal duration.
Banks, 1992 presents a model for the use of step drawdown data to estimate the apparent transmissivities of individual fractures in a fractured aquifer while Atkinson et al., 1994 provide a very detailed model for the analyses of step drawdown data in fractured rock.
Good overviews of the theory of step tests are given by Clarke, 1977, Mackie, 1982, Rushton and Rathod, 1988, Herbert, 1990, and, Atkinson et al., 1994.
2.0 THE OBJECTIVE OF CARRYING OUT A WELL PERFORMANCE TEST
The purpose of carrying out well performance tests can be four fold. These are :
1. To determine the yield of the borehole and its ability to sustain the required abstraction rates;
2. To investigate the efficiency of the well and whether an improved yield could be obtained from a more efficient type of borehole design. This can only be acted upon retrospectively but would be important in the context of the development of a wellfield;
3. To investigate the aquifer properties of those units nearest the well;
4. To determine the optimum discharge to pump the well at during the constant discharge pumping test and ultimately when the well is finally commissioned.
Well Performance Tests

a e 3
Once a performance test has been completed and the data appropriately analysed, the following information should be available :
1. The linear aquifer losses, B; 2. The non linear well losses, C; 3. A generalised drawdown equation in the form of Eqn. l; 4. A value for p the index in the non-linear element of the general draw down equation; 5. A measurement of the efficiency of the well; 6. The maximum pump setting required for the maximum duty abstraction rate; 7. The maximum permitted abstraction rate; 3.0 An appropriate method for carrying out performance tests.
There are two methods of carrying out a step test. The first approach is to sequentially increase the abstraction rate over four or five steps. Each step should be of equal duration and should be long enough for the drawdown in the well to have stabilised. This length can be from 60 to 180 minutes depending on the aquifer setting. This type of performance test is called a multiple rate step test.
The second approach is to carry out a series of non sequential steps at different discharge rates and permit the well to fully recover at the end of each step before commencing the next step at a different discharge rate. Each step should be of equal duration and they do not have to be successively increasing in discharge rate. This type of performance test is called a multiple stage step test.
Both tests require the pump and valves to be calibrated prior to the start of the test and the maximum possible discharge should be ascertained prior to the start so that four or five equal steps can be carried out over the full range of possible abstraction rates. As the classic draw down equation (Eqn 1) has no independent time parameter it is best to continue the duration of each step until a semi-equilibrium is reached as this will ensure that the resultant generalised drawdown equation is for the case of time approaching infinity.
The recovery data is as valuable, if not more valuable, than the step test data as it can be used to provide values for the aquifer parameters of transmissivity and storativity. Jacob, 1%3, Eden and Hazel, 1973, Birsoy and Summers, 1980, Herbert, 1990 and Kawecki, 1993 all provide methods for utilising the recovery data from multiple rate step tests. The recovery data from a single step in a multiple stage step test can be analysed using the Theis recovery method as given by Krusseman and de Ridder, 1990.
2.1 Case History I : Multiple Rate Versus Multiple Stage Step Tests
A large diameter well was drilled at an open hole diameter of 600mm (23.6") down to a depth of 12.0m through gravels and cobbles and completed at a diameter of 460mm (18"). It had pump chamber casing down to 3.5m and wire wrapped screen with a 4mm slot down to 8.5m. The remaining 3.5m of the hole was line with casing (Figure No. 2). The well was developed for five days (50 hours) using compressed air and an airlift assembly.
The first step test carried out was a multiple rate test. The first step was carried out for 20 minutes and each of the subsequent four steps thereafter carried out for 60 minutes. The second step test carried out was the multiple stage step tests. Three steps of 60 minutes duration and one of 159 minutes duration were carried out. The drawdown data for each of these tests is plotted in Figure No. 2. The resultant analyses is shown on Figure No. 3 with the respective resultant generalised drawdown equation from each test type.
Well Performance Tests

Figure No. 2 o.m
0.()4
0.08
0.12
wo.16
!0.20 ! 0.24
] 0.28
0.32
0.36
0.40
0.44
0.06
0.08
0.10
""0.12 ~
" .§. 0.14 C
~ 0,16 ~ ~
::j 0.18
0.20
0.22
0.24
0.1
-4-0.1
Comparison Of Multiple Rate and Multiple Stage Well Performance Tests
Q = 456m3/d; AS= 006m I Q = ~99m3/d; AS= 0.0425m
Q = 945m3/<l; AS= 0.055m
Q = 1077m3/d; AS= 0.0725m
Q = 1210m3/d; AS= 0.0225m
Time Since Start18rTcst (minutes)
Figure No. 2(b) : Multiple Rate S<cp Tes< - Alluvial Aquifer
Time Since Start18r Test (minutes)
J(X)
Q = 725m3/d; AS= 0.137m .
· Q = 922m3/d; AS= 0.185m
Q = HJ20m3/d; AS= 0.213m
Q = l 178m3/d; AS= 0.229m
l(X)
Figure No. 2(c): Multiple Stage Step Test - Alluvial Aquifer
1000
HXXJ
3
4
a, 5 in -0 <= e ~6
_Q
2 = ~7
SWL ~:;: Sand Plug
,· . ··,',
:::-M, ::;-c:-: :.:-tt -··u ~=:-<-· :::-M, ::::-<-:
~ iGravels
-.·1· -.· ...
=== : : 460mm \ : : 4mm sl~t Screen
:~ ;,'-:;,'.'-:·>: _:::~
~!!f:= =);~:t s-!!!F = ~!! Gravel Pack
·111 i . 1G-;:;f • ':'"'' 460mm Casing
mr :im iili Ji\LJ)lack Boulder Clay 11-
~*~* =:'"'*}_I-_;_ __ _ .,.:l:.,.::? ·,;7:l:;~
,Jl DI Figure No. 2(a)

Figure No. 3
4(J(lx Hr'
380
360
34()
320
3(XJ
280
260
- 240 N"!?.
'g 220 C ?: .g
200 ?:
ls u 180 "' t lfJ 16()
14()
120
100
80
6()
40
20
0
'1 0
Specific Drawdown Verus Discharge For Multiple Rate And Multiple Stage Pert·ormance Tests
l i Multiple RateStep Test B ca 3.9(l31xlff5
C cc 2. t449xIO'' · : ' :
Generalised . .Drawdown Equation.: Sw!= 3.903 Ix HJ'
5Q + 2.1449xlff
7Q2
100 200
"
.. .. . . . . i . . . ... .. . i -+- Original Data For Multiple Rate Sw/Q versus Q
····· Best Fit Linc For Multiple Rate Sw/Q versus Q -+- Original Data For Multiple Stage Sw/Q versus Q , - - - Best Fi( Linc For Multiple Stage S,JQ versus Q
300 400 500 600 700 Discharge (m31d)
.:;....-·.;.-
800
:.:.:. . ., ;.._ ..
l . . ... ! . . . . . . : .. •,,. ..: .
Multiple Stage Step Test : : 4 .
. B= l.812xlff : : 8 •c = l.76lx!O' ; : :
'ci~neralised :Drawdown E;quation : · : .4 I -8 2 Sw =L812xl0 Q+ l.761x!O Q
900 !()(XI I HXJ 12(XI l}(X)

age 4
Table 1 gives a list of the predicted drawdown values for a given discharge rate using both equations and the actual drawdown recorded for that discharge rate.
Table 1 : Comparison Of Actual Drawdowns To Predicted Drawdowns For Multiple Rate And Multiple Stage Tests
Discharge (m3/d) Actual Drawdown (m) Predicted Drawdown (m)
Multiple Rate Step Test: 3.9e-5Q + 2.le·7Q2 456 0.060 699 0.103 945 0.158 1077 0.230 1210 0.253
Multiple Stage Step Test: 1.8e-4Q + l.8e-8Q2 725 0.137 922 0.185 1020 0.213 1178 0.229
0.0624 0.1321 0.2284 0.2908 0.3613
0.141 0.182 0.203 0.238
Percentage Difference
4% 22% 31% 21% 30%
3% -2% -5% 4%
The equation derived from the multiple rate step tests does not give a good correlation between the predicted drawdown and the actual drawdown. The resultant equation from the multiple stage tests gives a very good correspondence between the predicted drawdown and the actual drawdown values.
Several reasons were given as to a possible explanation :
1. Steady state was not achieved by the end of each step; 2. The aquifer is neither homogenous nor isotropic; 3. The piezometric surface was neither stable nor horizontal at the end of each step. 4. The aquifer at an average thickness of 5.90m was very thin relative to its areal extent and as such
steady state could not be achieved as the aquifer was constantly being dewatered resulting in the transmissivity being constantly changed with time.
The assumptions for the multiple rate step test analyses break down when dealing with an aquifer which is anisotropic, inhomogenous, thin and of finite lateral extent.
It was concluded that the multiple rate step test methodology was not applicable to that situation and that the multiple stage step test methodology was more appropriate (O'Neill, 1986).
4.0 ANALYSES OF PERFORMANCE TESTS
There are many types of analyses available and it is beyond the scope of this paper to go through each of these analyses in detail. Krusseman and de Ridder, 1990 provide four possible methods. In addition there are also methods by described by Clarke, 1977, Mackie, 1982, Rushton and Rathod, 1988, Herbert, 1990, and, Atkinson et al., 1994. All these approaches are essentially different methods for calculating B and C. Ultimately a graph of specific capacity (Sw/Q) versus discharge (Figure No. 3) is plotted from whence a value for Band C can be derived.
The Eden and Hazel (1973) method is different to the others in that a value for transmissivity can be obtained directly from the analyses. The Eden and Hazel (1973) method, like the Rorabaugh (1953) method provides an actual calculated value for p. (The other popular methods assume a value of 2). This can be very useful when deriving a generalise drawdown equation for a well with appreciable non linear well losses (Krusseman and de Ridder, 1990).
Well Perfonnaoce Tests

a e 5
It is possible to use the Logan approximation to calculate a value for transmissivity if the step test has reached steady state. Logan, 1964, established an approximation method based on the assumptions of Theim, 1906 to calculate transmissivity based of the the following equation :
T = 1.22/B Eqn.2
Where B is the aquifer loss constant.
Clarke, 1977 gives a range of values for the Logan approximation of 1.22 to 2.1 for different types of aquifers.
Case History 2 : Multiple Rate, Multiple Stage, Acidisation And Maintenance For A Single Borehole In A Fractured Limestone Aquifer
This example is concerned with a six inch finished well completed in a fractured limestone aquifer. The top 30m of the original ten inch open hole arecemented off. . Table 2 gives the depths of the fractures and the percentage flows from each.
Table 2: Depth Of Fractures And Percentage Contributions For A Borehole In A Limestone Aquifer
Depth of Fracture (m) Flow Contribution(%) 34 39 44 49
.>54
*32% of all the flow comes from below 54m and not at 54m.
26 13 21 3
32*
The well was developed for about 16 hours upon completion using the drilling rig and then subjected to a series of multiple stage step tests. The difficulty with this data is that when Sw/Q is plotted versus Q a non linear plot is obtained (Figure No.4 (a)). This indicates that the indice term, p, in CQP is greater than 2.
Atkinson et al, 1994, describes three possible responses as a consequence of plotting Sw/Q against Q. The first possibility is a linear response where there are only aquifer losses Band no well losses. The second response is laminar flow up to some critical abstraction rate, Qc, after which there is an increasing non linear head loss commensurate with discharge increases.
Finally the third possible response is non laminar flow where is a concave upwards curve. The second type of response is considered to be applicable to the step tests carried out when the well was initially completed (Figure No. 4 (b)). There is laminar flow up to a critical discharge rate, Qc, of 131/s, after which there was a progressively non linear response to pumping. Mackie, 1982 also took this approach to dividing the S w/Q versus Q curve into several components. This changing of the well and aquifer response to different conditions is important when attempting to model a complete multiple rate performance test as described in Section 5.4.
This same well was cleaned out by surging and airlifting with compressed air four years later. Prior to cleaning a multiple rate step test was carried out (Figure No. 5(a)). It was then acidised. A second multiple rate step test was carried out after the acidisation. Hantush (1964) and Bierschenk (1963) analyses were applied to both sets of data (Figure No. 5(b)).
Well Performance Tests

Figure No. 4 Analysis Of Non Linear Step Test In Fracture Aquifer
Step 4
80
Step 1
20
Figure No. 4 (a) : An Example Of A Non Linear Response To A Multiple Stage Pumping Test 0 ,-,-.,--,--,--,-,-.,--,-,-r-r-..--r~.-r'-r'"'T--,~r--r'-r-.--,~r+-"i--,'---;r+-'+-,-,~.-.-+-,-=,~-
0 100
80
Curve 2 : B2 = 0.035
20
0 100
200 ~ Discharge (m· /day)
300 400
Step4
Step3
Step I Step 2
Curve I Curve 2
Generalised Drnwdown Equation : Curve l : s:::: 0.054Q + 2.5x 10⁻⁵Q2
. Curve 2: s::: 0.035Q + l.28xlff4Q2
............................. .QC::: l.31/S
1 : . . ; . ;
Figure No. 4 (b) : An Exampl~ Of Atkinson Method Of Analyses/ Of A Non Linear ~ultiple Stage Step Test ·
200 3 Dis.charge (m /day)
300 400

Figure No. 5
HXlx Hr'
N
..§ ~ >, {to
~ " _c
~ cl(l u
<.::
[ "20
Comparison or Generalised Drawdown Equations For Multiple Rate Step Tests
Generalised Drawdown Equation - Pre Cleaning 8 64
-5 7 s = 0.(l46899Q + . 5xl0 Q-
Figure No. S(a) : Multiple Rate Step Tests or Borehole In Fractured Limestone o -l , . . Prior To Cleaning And Acidisation . •
j I I I I I j I I I I I I I I I I I I I I I I I I I I I i I I I I I
0
100xlff3
l(X)
Generalised Drawdown Equation - Pre Cleaning S = 0.046899Q + 8.645x]ff5Q2
2(Xl , Discharge (m· /day)
Generalised Drawdown Equation · Post Cleaning And Acidisation
°'s -;;; >. _g,o
99 -5 7
s = 0.032 3Q + 5-59lxl0 Q-
~i I
" . QI!) .2 <.-, ~-- • n, [ Post Cleaning Ana Ac101sauon
CJ)
20
I I
3CXl
-~ +
Figure No. S(b) : Comparison or Generalised Drawdown Equations For Pre- Cleaning o -jL ..... L.. and Post Cleaning Multiple Rate Step Tests . ,
I I I I I I I I I I I I I I I I I I I I I I I I I I I I I I I I I I I I I I I
0 JOO 200 3 Discharge (m /day)
3CXJ 4<Xl
4(Xl

Figure No. 6
OOxlO
80
20
0
0
0
5
10
"' 2
" ~
I 15
6 0 20
~ 0 ~
E .o V 25
30
35
0
100
80
20
Summary Of Well and Aquifer Losses And Efficiencies: Borehole In Limestone Aquifer
Generalised Drawdown Equation - Pre Cleaning s o O 046899Q + 8 645x 10
5Q' Generalised Drawdown Equation - Post Cleaning And Acidisation
s = 0.03~993Q + 5.59Ix10·5Q
2
Figure No. 6(a) : Comparison Of Generalised Drawdown Equations For Pre- Cleaning and Post Cleaning Multiple Rate Step Tests
100 ,oo ' Discharge (m" /day)
:x __
3-_._ ----~--...... . ~
- -9 - BQ : Drawdown Due To Formation Losses 8/l l/94(dayim2)
--£-- CQ1: DrawdownDueToWel!Losses81Jli94(day/m2
)
~ Observed Drawdown (m) After 60 Minutes 8/! l/94 --::- Calculated Drawdown (m) After 60 lvtinutcs 8,1 I J.194
--B-- BQ: Drawdown Due To Formation Losses 18/1 Ji94(daylm~)
--x~ CQ2: Drawdown Due To Well Losses 18/11194 (day1m
2)
--+--Observed Drawdown (m) After 60 lvfinutcs !Bil J.194 --- Calculated Drawdown (m) Arter 60 Minutes 1811 I 194
--,; __ -- --& ...
300
Figure No. 6(b): Comparison Of The Various Components Of Aq~ifer And Well Losses
100 200 Discharge (m3/day)
300
-·-l!r·· Efric.iency Pre-cl~aning
400
400
~ Efficiency Post Cleaning and Acidisati~n
O -t;::.:.:;-::.:,.::c.,...c.,..c,=.--F.;:lg':..uc.,re::;· '-Nro_. 6+:c.:cc·)c.,··:c.::.Cro-'m.;:pc.a.,rls:c_y:.c· nro"-r.~'-Wc.,e:::U::;E,::ffi.c.,.cl:::e+n':..· lc.,es;.Fcc···o+·r;;:; .. ~+··~:::···::;"~rI'-'e+an-'IC.,Jl.::g::;A;.n.cd+P-'os+.:.t._C::;· •r'·cc·+"':..".:;g:..·Ac.,nc.d.:.A;.c:::.l+dl::;sac.,tt'-o'-'nr'-'r-'-r::+;;.::;=;
0 100 200 Discharge (m3iday)
300 400

a e 6
The resultant generalised drawdown equations for the original step test and for the two step tests carried out four years later before and after the well was cleaned and acidised are given in Table 3 :
Table 3 : Comparison Of Generalised Drawdown Eauations For Same Borehole
Type Of Test
Multiple Stage Step Test, 1990
Multiple Rate Step Test 1994 Before Cleaning
Generalised Equation
Sw = 3.SxI0-2Q + 1.28xI0-4Q2 Sw = 4.678xo-2 + 8.75xl0-5Q2
Comment
The well was only completed a month
Pre-cleaning test
Multiple Rate Step Test 1994 After Cleaning
Sw = 3.308xl0-2Q 5.56xI0-5Q2
+ Post cleaning and acidisation
These drawdown equations can be used to plot summary diagrams for the well (Figure No.6).
Figure No.6 (a) is a graph of the two resultant generalised drawdown equations calculated from the multiple rate step tests. The multiple stage steps tests carried out in January 1990 (not shown) and the multiple rate step tests carried out in November 1994 before cleaning plot on the same line. Therefore there has been no change in the overall well performance. It also demonstrates that both methodologies are equally applicable. The lower line is for the multiple rate step test carried out after the acidisation. There has been a very marked improvement in the overall well performance.
In Figure No. 6(b) the various components of each generalised draw down equation are separated. The values for BQ and CQ2 are plotted separately. After acidisation the formation losses have reverted to their former levels. The well losses, CQ2, after the well was acidised are the lowest of all and, when combined with the reduced formation losses, result in an overall improved well performance.
The final plot, Figure No. 6( c) is a plot of efficiencies for each step test. The step tests of November 1994 have a range of efficiencies from 82% to 57%. The highest efficiencies are from the post acidised step test with a range of 83% to 60%.
A conclusion from this example, for a borehole completed in a fractured limestone aquifer, is that in terms of overall well performance, well losses, CQ2, are more important to the overall well performance than formation losses and that acidisation is a very effective way to improve the overall well performance.
5.0 UTILISATION OF STEP TEST DATA
5.1 Commissioning a Well
The generalised drawdown equation can be used to calculate the drawdown for the maximum duty discharge required of the well. The pump intake can then be set below this level.
It is good practice not to dewater the well screen as this will encourage encrustation, bacterial growth and excessive well losses as a consequence of turbulent flow (Howsam et al., 1995). Therefore if the pump chamber casing is located below the screened section then it is important to limit the abstraction rate from the hole such that the dynamic water level does not fall below the top of the screen. It is possible to calculate the maximum permissible discharge that will not cause the screen to be dewatered using the generalised drawdown equation. The maximum discharge can then be limited to that rate.
Step tests are carried out over four or five discharge intervals. However the well maybe required to produce at a higher rate than originally tested. The generalised drawdown equation can be used to predict what the drawdown would be for that untested discharge rate and assessment made of the impact of that rate on the well performance.
Well Perfonnance Tests

a e 7 Finally the data can be used to calculate head losses in the well and through the pipework to ensure that a duty pump capable of overcoming these head losses is selected correctly.
There is a programme called OPTEST (Paudyal and Das Gupta, 1986) which uses specific capacity data to calculate values for B, C and p, well performance criteria, and the cost of pumping.
5.2 Monitoring Well Perfonnance
Case history 2 in this paper illustrates how and why step tests can be used to monitor the well performance over time. The data can also be used to compare the performance of various different wells in the same aquifer.
Banks et al., 1993 present a very good case study of a borehole acidisation programme whereby step tests were carried out on the wells both before and after the acidisation to assess the effect that the technique had on the overall performance of the well. Howsam, 1990 provides in a single volume a very good series of papers covering all aspects of well performance and maintenance and how the life of a production well can be prolonged.
5.3 Preventative Maintenance
Step tests when carried out on a periodic basis can be used to assess whether or not a well needs to be shut down for routine maintenance such as air development and airlifting or whether it needs to be acidised, if appropriate, to totally rehabilitate a well. Step tests can be combined with the use of BARTS to assess if there is any bacterial growth or bacterial clogging of the well screen or fractures (Mansuy et al., 1990). A decision can then be made to chlorinate the well or apply some other bactericide or bacteriostatic methods to remove the bacterial growth. Clark et al, 1988 give an excellent discussion on the effects of biofouling and clogging on recharge wells and the methods to both clean the wells and assess the effectiveness of the cleaning process. van Beek, 1989 also provides an example of rehabilitation of clogged wells.
5.4 Aquifer Hydraulics
A final use of step test data can be to calculate aquifer parameters. Multiple stage step tests can be analysed individually to give values for the various appropriate aquifer parameters.
Table 4 is a list of the aquifer parameters calculated from the drawdown data collected as part of the multiple stage ste~ test data collected in January 1990. The values for transmissivity progressively decline from 21m /d down to I3m2/d for the highest discharge rate. Similarly the storage coefficient, S, declines from 6.9xlo-2 down to 3.91xI0-2. Likewise the leakage factor, L, declines from 123m, which is low, down to 82m, which is a high amount of leakage, at the highest rate. Similarly the values for hydraulic resistance, c, declines from 718 days down to 501 days. Again it indicates that as discharge increases the amount of hydraulic resistance to vertical flow decreases.
Table 4: Variation In Aquifer Parameters Calculated From A Series Of Multiple Stage Step Tests
Test No. Q T Kh s L C
(m3/d) (m2/d) (mid) (m) (days)
1. 112.32 21 0.092 6.9xI0-2 123 718 2. 188.35 18 0.08 5.7xI0-2 56 175 3. 335.23 14 0.06 4.3xlo-2 87 532 4. 374.11 13 0.06 3.9x1--2 82 501
Overall the hydraulics of the well indicate that as discharge increases the volume of aquifer required to meet the requirements of the well increases (Figure No. 7). The overall bulk transmissivity of the aquifer declines as a greater and greater volume of aquifer is sampled by the analysis. Consequently as a larger volume of the aquifer is exploited, the amount of leakage increases and the degree of hydraulic resistance declines. The values for transmissivity, storage and hydraulic conductivity tend to a minimum assymptotic value as discharge increases.
Well Performance Tests

0.0601
0.040 j 8 Storativity
::::i 0.060 . I Penneability (mid)
:~1 15
0
JO + Transmissivity (m./d) I I ii I I I I I I I I I I ii I I
a e 8
11 I 11 I I I I 00 120 140 160 180 200 220 240 260 280 300 320 340 360 380 400
Figure No. 7 : Variation Of Aquifer Parameters For Varying Discharges Calculated From A Multiple Stage Step Test
All the multiple rate step test data can be modelled in a computerised pumping test programme to calculate the appropriate aquifer hydraulic parameters (Figure No. 8) that satisfy all steps of the test. The programme uses the principal of superposition as developed by Birsoy-Summers, 1980 with, in this case, Moench, 1985, analytical model for a fractured aquifer, with storage in the aquiclude, borehole storage and well skin effects. This pumping test modelling programme result is not able to allow for the effects of dewatering and the changing from confined to unconfined conditions in the upper part of the aquifer as a consequence of the large amounts of drawdown in the late stages of the performance test.
Well Performance Tests

Figure No. 8 --
0
2
4
6
8
IO
12
co ~ 0 14 E C: ~ 0 j 16 e Cl
18
20
22
24
26
28
30
Birsoy and Summers, 1980 Method Of Analysis of Variable Pumping Rates Using Moench, 1985, Fracture Model
. . . ' ,. : .
'' , ...... : . \ :, '. .
1 : ; . . . . ' ' . : : : :
Model U~ed : Moen~h, 1985 (Leaky Aquifer). ' T = 6.9m-/day
S = 5 c·3
r/B = k 1 (Leakage Factor)
fl= 7e·' (Storage In Aquitard) . -6
Sw = 1 e (Well Skin Effect)
a= k 2 (Storage In Borehole)
_._ Original Field Data Modelled Data
0 IO 20 30 40 50 60 70 80 90 100 110 120 130 140 150 16() 170 180 190 2(Xl 210 220 230 240 250 260 270 280 290 3(Xl
Time __ ~inc~ Sta~ Of Pumpin2 (minutes)

List of References Atkinson, LC., Gale, J.E., Dudgeon, C.R. I 994. New insight into stcp-drawdown test in fractured rock aquifers. Applied H_vdrogeologv. Vol. 2, No. l, pp 9-18.
A1·ci, C. B. 1992. Parameter estimation for step-drawdown tests. Ground Water. Vol. 30, No. 3, pp 338-342.
Banks, D., Cosgrove, T., Harker, D., Howsam. P., Thatcher, J.P. 1993. Acidisation: borehole development and rehabilitation. Quaterlv Journal Of Eilgi11eeri11g Geology. Vol. 26, No.2, pp 109-126.
Banks, D. 1992. Estimation of apparent transmissivity from capacity testing of boreholes in bderock aquifers. Applied Hvdrogeology. Vol. l,No. l,pp5-!9.
Barker, J.A., Herbert, R 1992 (a). Hydraulic tests on well screens. Applied Hvdrogeology . Vol. 0, pp 7-19
Barker, J.A., Herbert, R. l 992(b). A simple thcOI)' for estimating ,veil losses: with application to test wells in Bangladesh. Applied Hvdrogeologv . Vol. 0. pp 20-31.
Bierschenck, W.H. 1 %3. Detennining well efficiency by multiple step-drawdown tests. Jmernarional A~·sociation Science of Hydrology. Publication 64, pp 493-507.
Birsoy, Y.K., Summers, W.K. 1980. Determination of aquifer parameters from step tests and intermittent pumping data. lmernational Association of Science of Hydrolog.v. Pub! No. 64. pp 493-507.
Clark, L. 1978. The analysis and planning of step dra,,.:dmvn tests. Quarterly Journal of Engineering Geology. Vol. x, No. X, ppl25-143.
Clark, L., Radini, M., Bison, P.L. 1988. Borehole restoration methlxis and their evaluation by step-drawdown tests: the case history
of a detailed study in Northern Italy. Quaterly Journal OJ Engineering Geology. Vol. 21, No.4, pp 315-328.
Eden, RN., Hazel, C.P. 1973. Computer and graphical analysis of variable discharge pumping test of wells. Institute of f,)zgineers of Australia. Civil Engineering Transactions. Vol. CE 15, No. 1-2, pp 5-10.
Hantush, M.S. 1964. Hydraulics of wells. In Advances in hydrosciences, ed. Chow, V.T. Academic Press. New York and London. Vol I, pp 281-432.
Helweg, O.J. 1994. A general solution to the step~drawdown test. Ground Water. Vol. 32, No. 3, pp 363-366.

List of References Herbert, R. 19'.:Xl. Technical Note: Interpreting rccm·cry data from pumping tests. Quarerly Journal Of Engineering Geology. Vol. 23, No. 3, pp 267-268.
Howsam, P. Misstcar, B. Jones, C. 1995. Monitoring. maintenance and rehabilitation of water supply boreholes. Construcrion !ndustry Research And Information Association. (C.lRIA) Report No. 137.
Howsam, P. 1990. Water wells: Monitoring, maintenance and rehabilitation. Proceedings of the International Groundwater Engineering Conference Held at Cranfield Institute o/Teclmology. U.K. E&F.N. Span. pp 422.
Jacob, CE. 1947. Drawdown test to determine effective radius of artesian 1,vclL Transactions American Society Of Civil Engineers. Vol. 112, Paper No. 2321, pp ICJ47-l070.
Kawecki, M. W. 1993. Recovery analysis from pumping test-; with stepped discharge. Journal of Hydrology. Vol. 31, No. 4, pp 585-592.
Knopman, D.S. Hollyday, E.F 1993. Variation in specific capacity in fractured rocks, Pennsylvania. Ground Water. Vol. 31, No. l, 135-145.
Kruseman, G.P., de Ridder, NA 1991. Analysis and evaluation of pumping test data. Imernarional Institute for La11d Reclaimation a11d Improvement.
~
Logan, J. 1964. Estimating transmissibi!ity from routine production tests of water wells. Ground Water. Vol. 2, No. L pp 35-37.
Mackie, CD. 1982. Multi-rate testing in fractured formations Papers of the Groundwater in Fractured Rock Conference, Canberra.
Mansuy, N., Nuzman, C, Cullimore, D.R. 1990. Well problem identification and its importance in well rehabilitation. Proceedings of the International Groundwater Engineering Conference Held at Cranfield Institute o/Teclmology, U.K. In ed. Howsam P. E&F.N. Span. pp87-99
Mocnch,AF 1985. Unsteady now to a well in a leaky aqui8for with storative semi confining layers. Water Resources Research. Vol. 21, No. 8, pp 1121-l I3l.
O'Neill, S. 1988. The design, installation and testing of a borehole in a shallow watcrtable aquifer. Unpublished M.Sc Thesis, University College London, University London.
Paudyal, G.N. Das Gupta, A. 1986. A microcomputer package for determining optimal well discharge. Ground lVater. Vol 24, No. 5, pp.668-673.
Rorabaugh, M.J. 1953. Graphical and theoretical analysis of step-drawdown test of artesian well. Procedings of American Society of Civil Engineers. Vol. 79, No. 363, 23pp.

List of References
Rushton, K.R., Rathod, K.S. 1988. Causes of non-linear step pumping test responses. Quarerly Journal qf Engineering Geology. Vol. 21, No. 2, pp 147-158.
Theim, G. 1906. Hydrologische Mcthoden. Gebhard/, Leip;ig. pp 56.
van Beck, C.G.E.M. 1989. Rehabilitation of clogged discharge wells in the Netherlands. Qua/erf.v Journal Of £11gi11eeri11g Geo/ogv. Vol. 22, No. I, pp 75-80.

WATER WELLS: CONTRACTS AND SPECIFICATIONS
Eugene Daly Eugene Daly Associates
ABSTRACT
Water wells are the source of water for a significant part of the population in Ireland. The majority of water wells are drilled without a written contract. In the near fi1tt1re it is likely that regulators, consumers and well drillers will require some form of written contract for all water wells. The principle components of civil engineering contracts can be incorporated into standard or individual contracts that would cover the range of well drilling in Ireland.
INTRODUCTION
In Ireland 3,000 - 4,000 water wells are drilled each year. Over 90% of these wells are low yielding and are drilled for domestic and farm supplies. In the vast majority of these wells the contract is a verbal agreement based on a footage rate and 'no water no fee'.
For most of the remaining wells some form of written contract is used. The degree of detail and specialisation of the contract document(s) are a function of the size and technical and/or legal complexity of the work. There are no type contracts commonly in use in the Republic. Some local authorities, consultants and well drillers have developed their own.
There is very little regulation of groundwater development in the Republic of Ireland. Water abstractions and water well drillers are not licensed and there is no standard for water well drilling. It is therefore not surprising that, although the quality of groundwater is generally thought to be good, many low yielding domestic and farm wells have been found to show some degree of contamination. With the increasing interest in the environment and food quality it is likely that groundwater will be more regulated in the future. As part of this increased level of regulation the consumer may require some form of contract for his/her water well.
This short paper describes the essential components that a contract document(s) should contain irrespective of the extent of the work.
CONTRACTS
Any arrangement by a well contractor to perform work for a well owner in return for some sort of payment constitutes a contract. The form of the agreement may be a verbal contract, a crude notation on the back of a business card or a 50 page document signed by both parties in the presence of witnesses (Driscoll, 1987). Any agreement between the contractor and the owner is a contract in that there has been mutual agreement on all elements of the project.
The well owner, hydrogeologist/engineer and well contractor have well-defined responsibilities in every well construction project. In return for payment, the hydrogeologist/engineer and well contractor must provide a well that gives clear, good quality water, produces the desired yield, has the highest possible specific capacity and provides long service at low operational and maintenance costs.

!AH Port/aoise Seminar !996 Eugene Daly
With over 200,000 wells successfully in use in this country and most drilled on the basis of a handshake, it is a reasonable question to ask if some form of written agreement is necessary. In these litigious days where development is concentrated and large quantities of waste are being produced I fuel there will be an inevitable move towards written contracts. These contracts are necessary to protect both the well owner and well contractor especially where problems arise either during drilling or where disagreement arises over the product.
A well by its nature is below ground and cannot be readily investigated. If a problem arises, finding the cause and apportioning blame may often be difficult if not impossible. In these circumstances drawing up an effective contract is a serious challenge to the ingenuity of contractors, hydrogeologists/engineers and lawyers.
CONTRACT DOCUMENTS
All of the individual documents that are part of an agreement are part of the contract.
In a section below the range of water wells drilled in Ireland have been split into four categories The contract document(s) for the four well categories will be very different in the degree of detail. However, contracts for each category should contain all of the essential components irrespective of the size of the works. At one extreme all of the essential elements will fit on a page and on the other some of the individual components may consist of a small report sized document.
A brief description of the principal components (documents) of a civil engineering contract are given below.
CONDITIONS OF CONTRACT
The conditions of contract refers to documents produced by engineers and contractors' professional associations. There are quite a number of these documents in use, e.g. the I.E.! Conditions of Contract (I.E.!, 1995). These conditions of contract ( contract forms) are designed to distribute fairly the risks inherent in civil engineering projects.
The contract system on which these conditions of contract are based has been in use for over a century. The documents are well known, widely used and are accepted by both employers and contractors. The I.E.!. Conditions of Contract (1995) referred to above contains 70 main clauses under 21 headings on all aspects of construction contracts. They are intended for use in large engineering works and are only really practical in very large water well drilling contracts.
In some well drilling contracts the conditions of contract are referred to by a simple clause in a section entitled general conditions which also include clauses on the following;
• • The scope of the works and location • References to any relevant Irish or British standards • Definitions • Safety on the drilling site • Guarantees of materials and workmanship • Indemnities and insurance • Reporting
2

!AH Portlaoise Seminar 1996 Eugene Da(y
SPECIFICATIONS
The specification is a detailed description setting out the design, dimensions and other details of the proposed works. In water well drilling contracts the specification may be broken up into sections dealing with water well drilling and well testing.
Some of the principal items to be included in a well specification are as follows
• The construction details of the well(s), may include references to drawings • Well casing and screens • The disposal of drilling muds, chippings and water • Geological information • Measures to prevent pollution during drilling • Sampling, site record and well log • Well development • Site restoration • Description of the pumping test • Monitoring
BILL OF QUANTITIES AND SCHEDULE OF RATES
The Bill of Quantities defines the extent of the contractors operation. The contractor makes an estimate of the quantities involved and the likely cost, based on the specification. A schedule of rates is included in many well drilling contracts to cover the lUlcertainty associated with well drilling
FORMS OF TENDER AND AGREEMENT
These are standard forms that summarise the contractors bid and the agreement between well owner and well contractor and contain all of the correct legal wording.
WELL CATEGORIES
For the purposes of this lecture I will subdivide the range of water wells normally drilled in Ireland into four groups in order to discuss the principle contract features required for each group. It is important that the contract documents are consistent with the scale of the work
I DOMESTIC AND FARM WELLS
This group is the major part of the water well drilling market in Ireland. The work usually consists of one borehole with an average depth of 60m providing a supply of less than 50m3 /d. The main contractual problem relates to the definition of water. The contract would seldom exceed a value of £2,500. As has been stated above written contracts are rarely used for wells of this type in Ireland. This is not the norm in many developed countries.
It is likely that some form of simple contract will be developed in the future. When a contract is in writing the courts will presume the written part constitutes the whole contract. Hence, drawing up a standard contract to cover most eventualities encolUltered in this type of water well drilling will not be easy. Nevertheless it
3

L4H Port/aoise Seminar /996 Eugene Daly
should be possible to produce a simple docwnent (ideally one page) that will meet the requirements of both driller and conswner A standard contract for low yielding domestic and farm wells should cover at least the following items (see Brassington, 1983):
• What the contractor will do • Payment to the contractor • Rates for drilling and casing • Measures to protect the supply from pollution • Date and signatures • A well record.
On completion of the well the conswner should be given a short simple docwnent with advice on the maintenance and protection of the supply over time.
II WELLS OF MEDIUM CAPACITY
Wells in this category would typically be used for group schemes, small local authority supplies or commercial users. The work would consist of one or possibly two boreholes with a yield requirement of up to 500m3/d. Wells would typically be 150/200mm in diameter. Domestic or farm wells involving poor ground conditions or requiring screens would be included in this category. The value of work will be less than £10,000 and frequently a good deal less.
Many wells in this category are drilled for organisations that will require some form of contract. As the size of the work in financial terms is similar to buying a small car the paperwork ideally should be kept to 5 pages or less. A standard contract would be useful for this category of wells. Ideally it should contain a few general conditions, a short well specification, schedule of rates and a signed agreement.
ill HIGH CAPACITY WELLS
Wells in this category would normally be sunk with a view to giving yields of 500m3/d to 2,500m3/d The contracts would typically be for one or two large diameter (250-400mm) wells up to 100/150m deep. The value of the work would be less than £75,000.
All wells in this category should have a detailed and specific contract. There should be an hydrogeological input into the contract. Reference should be made to one of the standard conditions of contract.
IV LARGE WELLFIELDS
Since the early 1990's there have been a couple of contracts in Ireland for 4-10 high capacity, large diameter water wells ofup to 150m deep.
Wells in this category require a contract similar to other civil engineering projects. They will generally require hydrogeological, engineering and legal input.
4

!AH Portlaoise Seminar _1996 Eugene Daly
CONCLUSIONS
All well drilling should be covered by some form of written contract. The principal components of civil engineering contracts can be incoIJJorated into standard or individual contracts that would cover the range of well drilling in Ireland.
REFERENCES AND SOURCES OF INFORMATION
Brassington, R., 1983. Finding Water, a guide to the construction and maintenance of private water supplies. Pelham Books, UK
Driscoll, F. G., 1987. Groundwater and wells. 2nd edition Johnson Division, UOP Inc., Minnesota ..
National Standards Authority Of Ireland, 1992. Bottled Water. EOLAS, Dublin.
The Institution Of Engineers Of Ireland, Institution Of Civil Engineers, and the Association Of Consulting Engineers' Service Agreements 1995. I.E.!. Conditions Of Contract For Works Of Civil Engineering Construction, 4th edition. Dublin.
5