international april 2012
TRANSCRIPT

Vol. 156 • No. 4 • April 2012
Waste-to-Energy Options Increase
Fukushima: One Year Post-Disaster
Sustainable Water Resources
Could Boiler MACT Benefit Biomass?
Intelligent Control of FBC Boilers

Unlike a phony cowboy who is all hat with no
cattle, a boiler from RENTECH will pass muster.
Each boiler is designed and built to meet its demanding specifications and operate in its unique
conditions in a variety of industries, including refining, petro-chemical and power generation.
Our quality control system assures you that RENTECH boilers are safe, reliable and efficient.
For a real, genuine, original boiler, you can depend on RENTECH. Honestly.
WWW.RENTECHBOILERS.COM
CIRCLE 1 ON READER SERVICE CARD

April 2012 | POWER www.powermag.com 1
ON THE COVERThe Lee County (Fla.) waste-to-energy plant burns wastes at more than 1,800F, generat-ing up to 53 MW of electricity. It operates as a zero-liquid-discharge facility using recycled wastewater from a municipal wastewater treatment plant. Ash remaining from the com-bustion of trash is transported to a landfill. The facility also recycles about 1 million pounds of electronics each year, among other recyclable waste streams, ranking Lee County as number one for recycling in Florida. Photo courtesy: HDR Inc.
COVER STORY: RENEWABLE ENERGY30 Waste-to-Energy Technology Options Increase but Remain Underutilized
Though the U.S. lags in maximizing the potential of state-of-the-art waste-to-energy (WTE) technologies, those technologies are widely recognized by government agen-cies around the world as effective resource management solutions. Coupled with recycling and other waste-reduction measures, they can decrease the volume of landfilled municipal solid waste by roughly 90% while generating energy that sub-stantially reduces emissions of methane, a potent greenhouse gas. HDR Inc. reviews the potential for WTE as well as its fuels, processes, and technologies.
SPECIAL REPORTS
BIOMASS POWER
40 Has Boiler MACT Improved the Future for Biomass Power?Recent and forthcoming environmental regulations, plus the demand for more re-newable resources, have brightened the economic outlook for new biomass power plants in the U.S.
NUCLEAR POWER
44 Happy Days for Nuclear Power?Our report on a recent nuclear industry conference and the impact of the Fukushima disaster on Japan’s prospects for nuclear generation concludes that nuclear power is still in the race, but it’s not going to be the pace-setter for the foreseeable future.
FEATURES
PLANT CONTROLS
48 Intelligent Control of FBC BoilersThe number and size of fluidized bed combustion (FBC) boilers used for power gen-eration is growing. Two 100-MW FBC boiler plants burning 100% biomass are now under construction in the U.S. Here’s the latest on recommended combustion con-trol approaches.
WATER MANAGEMENT
52 Promoting Sustainable Water Usage in Power GenerationPOWER talked with representatives from an energy research institute, a leading na-tional energy laboratory, a U.S. water and energy technology manufacturer, and a large consulting firm. From regulations to technical innovations, these experts ad-dressed the growing interdependence of water and power.
Established 1882 • Vol. 156 • No. 4 April 2012
30
44
48

www.powermag.com POWER | April 20122
value chain—from repairs, coatings and design engineering, to machining, fi eld services and the world’s most
PLANT COOLING
58 Clever “Helper” Tower Solves Cooling Water DilemmaWater shortages and regulatory requirements are turning up the heat on genera-tors to manage water use more carefully. This article offers suggestions for thinking through your options for addressing those imperatives and includes a case study of a plant that found an effective and creative approach to dealing with them.
INDUSTRY COMMUNICATION
63 POWER Gets Social Social media platforms are no longer just for college kids. If you’re not using at least some of them to enhance your industry knowledge and visibility, you may be miss-ing out. We offer a quick intro to how POWER can help you get connected profes-sionally with the various digital tools.
DEPARTMENTS
SPEAKING OF POWER6 Technology Trumps Policy
GLOBAL MONITOR8 Less-Familiar Generation III+ Reactors Make Inroads
10 An “Exploding Lake” Becomes a Power Source
12 THE BIG PICTURE: Nuclear Aftershocks
14 New South Korean and Russian Reactors Go Online
14 Two New Offshore Farms Turning Despite Stagnant Global Wind Market
18 India’s Chronic Coal Shortages Threaten Coal Power Ambitions
18 POWER Digest
FOCUS ON O&M22 Safe Work Practices in Confined Spaces at Power Plants
24 Preventing Downtime by Picking the Best Switch Technology
LEGAL & REGULATORY28 Suing for (Pipeline) Safety
By Vidhya Prabhakaran, Davis Wright Tremaine LLP
64 NEW PRODUCTS
COMMENTARY68 Natural Gas: Secure Supply for Today and the Future
By Jim Johnson, president of Chesapeake Energy Marketing Inc.
Connect with POWERIf you like POWER magazine, follow us online (POWERmagazine) for timely industry news
and comments.
Become our fan on Facebook Follow us on Twitter
Join the LinkedIn POWER magazine Group
58
63
24

Chromalloy extends engine life like no other company can, by providing the industry’s most complete independent
value chain—from repairs, coatings and design engineering, to machining, fi eld services and the world’s most advanced independent castings facility. These unrivaled in-house capabilities represent over 60 years of
innovation—and they can make an impact today.
Engine life can stretch beyond the horizon.
chromalloy.comLong live your engine.
CIRCLE 2 ON READER SERVICE CARD

www.powermag.com POWER | April 20124
Visit POWER on the web: www.powermag.com
Subscribe online at: www.submag.com/sub/pw
POWER (ISSN 0032-5929) is published monthly by Access
Intelligence, LLC, 4 Choke Cherry Road, Second Floor, Rock-
ville, MD 20850. Periodicals Postage Paid at Rockville, MD
20850-4024 and at additional mailing offices.
POSTMASTER: Send address changes to POWER, P.O. Box
2182, Skokie, IL 60076. Email: [email protected].
Canadian Post 40612608. Return Undeliverable Canadian
Addresses to: PitneyBowes, P.O. BOX 25542, London, ON
N6C 6B2.
Subscriptions: Available at no charge only for qualified ex-
ecutives and engineering and supervisory personnel in elec-
tric utilities, independent generating companies, consulting
engineering firms, process industries, and other manufactur-
ing industries. All others in the U.S. and U.S. possessions:
$87 for one year, $131 for two years. In Canada: US$92 for
one year, US$148 for two years. Outside U.S. and Canada:
US$197 for one year, US$318 for two years (includes air
mail delivery). Payment in full or credit card information is
required to process your order. Subscription request must
include subscriber name, title, and company name. For new
or renewal orders, call 847-763-9509. Single copy price: $25.
The publisher reserves the right to accept or reject any order.
Allow four to twelve weeks for shipment of the first issue on
subscriptions. Missing issues must be claimed within three
months for the U.S. or within six months outside U.S.
For customer service and address changes, call 847-763-
9509 or fax 832-242-1971 or e-mail powermag@halldata
.com or write to POWER, P.O. Box 2182, Skokie, IL 60076.
Please include account number, which appears above name
on magazine mailing label or send entire label.
Photocopy Permission: Where necessary, permission is
granted by the copyright owner for those registered with
the Copyright Clearance Center (CCC), 222 Rosewood Drive,
Danvers, MA 01923, 978-750-8400, www.copyright.com, to
photocopy any article herein, for commercial use for the flat
fee of $2.50 per copy of each article, or for classroom use
for the flat fee of $1.00 per copy of each article. Send pay-
ment to the CCC. Copying for other than personal or internal
reference use without the express permission of TradeFair
Group Publications is prohibited. Requests for special per-
mission or bulk orders should be addressed to the publisher
at 11000 Richmond Avenue, Suite 690, Houston, TX 77042.
ISSN 0032-5929.
Executive Offices of TradeFair Group Publications: 11000
Richmond Avenue, Suite 690, Houston, TX 77042. Copyright
2012 by TradeFair Group Publications. All rights reserved.
EDITORIAL & PRODUCTION Editor-in-Chief: Dr. Robert Peltier, PE
480-820-7855, [email protected]
Managing Editor: Dr. Gail Reitenbach
Senior Editor: Angela Neville, JD
Gas Technology Editor: Thomas Overton, JD
Senior Writer: Sonal Patel
European Reporter: Charles Butcher
Contributing Editors: Mark Axford; David Daniels; Steven F. Greenwald; Jeffrey P. Gray;
Jim Hylko; Kennedy Maize; Dick Storm; Dr. Justin Zachary
Graphic Designer: Joanne Moran
Production Manager: Tony Campana, [email protected]
Marketing Director: Jamie Reesby
Marketing Manager: Jennifer Brady
ADVERTISING SALES Sales Manager: Matthew Grant
Southern & Eastern U.S./Eastern Canada/
Latin America: Matthew Grant, 713-343-1882, [email protected]
Central & Western U.S./Western Canada: Dan Gentile, 512-918-8075, [email protected]
UK/Benelux/Scandinavia/Germany/
Switzerland/Austria/Eastern Europe: Petra Trautes, +49 69 5860 4760, [email protected]
Italy/France/Spain/Portugal: Ferruccio Silvera, +39 (0) 2 284 6716, [email protected]
Japan: Katsuhiro Ishii, +81 3 5691 3335, [email protected]
India: Faredoon B. Kuka, 91 22 5570 3081/82, [email protected]
South Korea: Peter Kwon, +82 2 416 2876, +82 2 2202 9351, [email protected]
Thailand: Nartnittha Jirarayapong, +66 (0) 2 237-9471, +66 (0) 2 237 9478
Malaysia: Tony Tan, +60 3 706 4176, +60 3 706 4177, [email protected]
Classified Advertising
Diane Hammes, 713-343-1885, [email protected]
POWER Buyers’ Guide Sales
Diane Hammes, 713-343-1885, [email protected]
AUDIENCE DEVELOPMENT Audience Development Director: Sarah Garwood
Fulfillment Manager: George Severine
CUSTOMER SERVICE For subscriber service: [email protected], 800-542-2823 or 847-763-9509
Electronic and Paper Reprints: Wright’s Media, [email protected], 877-652-5295
List Sales: Statlistics, Jen Felling, [email protected], 203-778-8700
All Other Customer Service: 713-343-1887
BUSINESS OFFICE TradeFair Group Publications, 11000 Richmond Avenue, Suite 690, Houston, TX 77042
Publisher: Brian K. Nessen, 713-343-1887, [email protected]
President: Sean Guerre
ACCESS INTELLIGENCE, LLC 4 Choke Cherry Road, 2nd Floor, Rockville, MD 20850
301-354-2000 • www.accessintel.com Chief Executive Officer: Donald A. Pazour
Exec. Vice President & Chief Financial Officer: Ed Pinedo
Exec. Vice President, Human Resources & Administration: Macy L. Fecto
Divisional President, Business Information Group: Heather Farley
Senior Vice President, Corporate Audience Development: Sylvia Sierra
Senior Vice President & Chief Information Officer: Robert Paciorek
Vice President, Production & Manufacturing: Michael Kraus
Vice President, Financial Planning & Internal Audit: Steve Barber
Vice President/Corporate Controller: Gerald Stasko
Over 100 years experience,and still looking to the future.
www.tyco.com/valves
Copyright © 2011 Tyco Flow Control. All rights reserved.
When you have been creating the highest quality boiler system products for over a century, you could be forgiven for resting on your laurels - but not Yarway. Far from focusing on past glories, we’re already looking ahead and thinking about how we can continue providing the most efficient solutions. Our Wellbond valve is a perfect example. Designed specifically for use in power systems, this high-pressure globe valve has been developed to ensure it offers maximum service life and minimum maintenance – saving you three times as much over five years compared with a ball valve. Trust Yarway to be even better equipped to help you face the future.

Yarway. Over 100 years experience,and still looking to the future.
www.tyco.com/valves
Copyright © 2011 Tyco Flow Control. All rights reserved.
When you have been creating the highest quality boiler system products for over a century, you could be forgiven for resting on your laurels - but not Yarway. Far from focusing on past glories, we’re already looking ahead and thinking about how we can continue providing the most efficient solutions. Our Wellbond valve is a perfect example. Designed specifically for use in power systems, this high-pressure globe valve has been developed to ensure it offers maximum service life and minimum maintenance – saving you three times as much over five years compared with a ball valve. Trust Yarway to be even better equipped to help you face the future.
CIRCLE 3 ON READER SERVICE CARD

www.powermag.com POWER | April 20126
SPEAKING OF POWER
Technology Trumps Policy
An energy policy should be the result of inclusive debate and a consensus approach to the means to leverage
all of a country’s energy assets, including innovation and technology, to the advan-tage of its citizens. Current U.S. energy policy fails on all counts.
In this column last month, I used gov-ernment source materials to dispel the myth that the U.S. has limited reserves of fossil fuels. I concluded that we are not short of fossil fuels but short on policies that will allow responsible de-velopment of those fossil fuel resources. In particular, natural gas reserve predic-tions, admittedly a moving target, are voluminous. The numbers are so large that the current debate is about how many hundred years’ worth of gas is in the ground rather than when gas sup-plies will be depleted.
New Technology Directions Some readers wrote saying that these enormous natural gas reserve estimates should be sufficient reason to quickly move toward a natural gas–based econ-omy. T. Boone Pickens agrees with that conclusion, and I certainly lean in that direction. However, writing energy policy in the age of rapid technology advances is much like steering an accelerating car while looking only in the rear view mir-ror—you can only see where you’ve been and not where you are going. And therein lies the tension between energy policy and technology: The schedule for future tech-nology breakthroughs, such as the drilling technology advances that are producing a bounty of natural gas unimaginable just a decade ago, is not predictable.
There are thousands of ideas germinat-ing in researchers’ laboratories today, and a few will become the next big thing. Per-haps the next game-changing technology will be in the field of solar photovoltaic (PV) cells. Alta Devices, for example, just announced that its tests of a new gallium arsenide–based solar panel reached 23.5% efficiency, the highest achieved to date by any solar cell. Chris Norris, the CEO of Alta Devices, has said that the company’s goal
is to “compete with fossil fuels without government subsidies” and get to a level-ized cost of energy of $0.06 to $0.07 per kilowatt-hour.
Should Norris reach his cost goal (and when teamed with some form of efficient, small-scale electricity storage technol-ogy), then the impact on the electricity industry could be meaningful. Perhaps load migration from grid sources to be-hind-the-meter PV panels will accelerate, thereby causing all sorts of unanticipated policy problems for utilities and regula-tors. Like the Alta Devices solar cells, the most promising technologies will be funded by private industry because a free market amply rewards the best ideas.
Playing FavoritesThere is little chance of renewed debate on a new national energy policy (ignor-ing President Obama’s recent “all-of-the-above” strategy rhetoric) because the president doesn’t want to negotiate an energy policy with Congress. I’m con-vinced that Obama’s de facto strategy is to fracture and marginalize the legislative branch while he moves in the two policy
directions of his liking: first, dabbling in the market by dangling tax credits, cash incentives, and loan guarantees to spur development of government-favored, yet market-spurned technologies, and second, letting loose the regulators on out-of-fa-vor, yet low-cost fossil fuel technologies. Today, coal-fired generation is suffering death by a thousand cuts at the hands of the Environmental Protection Agency, and there are at last count a dozen govern-ment agencies diligently developing new fracked gas regulations. All the while, Congress remains but a spectator.
The only real energy policy is one in which government policies encourage de-velopment of all forms of domestic energy supplies and avoids becoming the arbiter of which technology is a market winner or loser. The best ideas will always find private investors because the potential rewards in a free market are substantial. Until an unfettered market returns in the future, be thankful that the laws of phys-ics and not politics guide technology and innovation. ■
—Dr. Robert Peltier, PE is POWER’s
editor-in-chief.
Introducing a New Editor and GAS POWER
The best magazine edi-
torial team in the power
generation industry just
got stronger. I’m pleased
to announce that Thomas
W. Overton, JD has joined
the POWER editorial staff
as our gas technology editor. Tom has over
15 years of experience in scientific and
professional publishing and is a licensed
California lawyer specializing in copyright
and intellectual property issues. Before
joining the publishing world, Tom served
in the U.S. Navy as a nuclear-qualified ma-
chinist’s mate, so he also has a hands-on
understanding of power generation tech-
nology. I urge you to contact Tom if you
have gas industry news to share or an
article idea. Tom works from his office in
California and can be reached at tomo@
powermag.com and followed on Twitter
@thomas_overton.
Tom’s primary responsibility is heading
up POWER’s newest electronic publication,
GAS POWER, which focuses on the specific
information needs of the gas-fired power
generation industry. GAS POWER joins COAL
POWER, MANAGING POWER, and POWERnews
in our family of electronic newsletters. The
first issue of GAS POWER Direct was dis-
tributed Feb. 28 and can viewed at www
.powermag.com. A free subscription to the
bimonthly newsletter is available by click-
ing on the “Sign up now” link below the
editorial links or by using the Subscribe
button at the top of our home page.
Bleed: 8.125x11, Trim: 7.875x10.75, Live area: 7x10Power Magazine,
GPiLEARN™ is the industry leader in online power plant training. At GP Strategies Corporation,
we provide you with access to thousands of lessons and exams that will
lower operating costs while providing employee training anytime, anywhere. From apprentice
to seasoned employee, our power plant experts partner with you to create a blended training
program. Put our experience to work for [email protected]
O f f i c e s i n : N o r t h A m e r i c a • L a t i n A m e r i c a • E u r o p e • A s i a
GPE-002012 GPiLearn_PowerMag.indd 1 3/12/12 2:03 PM

Bleed: 8.125x11, Trim: 7.875x10.75, Live area: 7x10Power Magazine,
P E O P L E P R O C E S S E S T E C H N O L O G Y
Power
GPiLEARN™ is the industry leader in online power plant training. At GP Strategies Corporation,
we provide you with access to thousands of lessons and exams that will
lower operating costs while providing employee training anytime, anywhere. From apprentice
to seasoned employee, our power plant experts partner with you to create a blended training
program. Put our experience to work for [email protected]
O f f i c e s i n : N o r t h A m e r i c a • L a t i n A m e r i c a • E u r o p e • A s i a
“After much due diligence, GPiLEARN™ was the clear choice as our preferred LMS vendor and online content provider.”
— Ed Murphy, Senior Training Consultant, Allegheny Energy
GPE-002012 GPiLearn_PowerMag.indd 1 3/12/12 2:03 PM
CIRCLE 4 ON READER SERVICE CARD

www.powermag.com POWER | April 20128
Less-Familiar Generation III+ Reactors
Make Inroads
Following key regulatory approvals in the UK and U.S. of Westing-house’s AP1000 and AREVA’s EPR Generation III+ reactor designs, France’s nuclear safety authority in February determined that the little-known ATMEA 1 reactor design met international safety cri-teria for Generation III+ reactors. The reactor is a 1,100-MW pres-surized water reactor (PWR) developed and marketed by ATMEA, a 2007-created joint venture between France’s AREVA and Japan’s Mitsubishi Heavy Industries (MHI).
France’s Autorité De Sûreté Nucléaire (ASN) noted that the 18-month review of the safety options of what ATMEA calls a “mid-size reactor” was requested by AREVA and MHI. The review was therefore not performed as part of a licensing procedure for the reactor design but “in the same conditions as those appli-cable to the creation of basic nuclear installations in France,” it said, concluding the project would “on the whole satisfy the French requirements.”
The “positive opinion” followed 2011 approvals from France’s advisory committees for nuclear reactors (GPR) and for nuclear pressure equipment (GPESPN) concerning the safety options for this new reactor. The reviews took into account internal and ex-ternal hazards as well as lessons learned from the Fukushima accident.
ATMEA describes the ATMEA1 as a three-loop PWR that uses the same steam generators as AREVA’s 1,630-MWe EPR reactor design. The ATMEA1 with a 60-year design life also has extended fuel cycles, 37% net thermal efficiency, 157 fuel assemblies, and a capacity to use mixed-oxide fuel only (Figure 1). With emphasis on its smaller size, the reactor design has so far been marketed to developing countries with nuclear power ambitions.
Interest is growing, however. French company GDF Suez, owner of seven Belgian nuclear plants, recently expressed interest in de-veloping the first ATMEA1 reactor in France’s Rhone River Valley. AREVA and MHI have also been contending with Russian and Ca-nadian companies to sell a reactor to Jordan for a $4.5 billion contract. Meanwhile, majority French government–owned AREVA in February signed a key agreement with state-owned China Guang-
dong Nuclear Power Group to develop another midsize PWR, pos-sibly based on that company’s Chinese-designed CPR1000. Officials told reporters in February that AREVA will persuade China to base the 1,000-MW nuclear reactor on the ATMEA1 model. “It would be a shame to have two 1,000-megawatt reactors on the mar-ket,” AREVA’s senior vice-president for reactors and services, Claude Jaouen, said.
Interest in midsize Generation III+ reactor designs marks a new era in the evolution of nuclear reactor technology, which has been pronounced over the past five decades. Generation IV designs are still in the conceptual stage and may not be opera-tional before 2020, while the first generation of reactors—those developed in the 1950s and 1960s—are almost obsolete.
Only two first-generation plants (550-MW Magnox reactors, which are pressurized, carbon dioxide–cooled, graphite-moderated reactors using unenriched uranium as fuel and magnox alloy as fuel cladding) are currently operating at the Wylfa nuclear power station, on Anglesey, in the UK. But these are to be shut down later this year, close on the heels of shuttering the UK’s two other Magnox reactors at the Oldbury nuclear power station near Bristol. That 45-year-old station—the world’s oldest nuclear plant—was permanently shut down at the end of February (Figure 2).
Generation II reactors—a class built up to the end of the 1990s that characteristically includes PWRs, Canadian-invented CANDUs, boiling water reactors (BWRs), British advanced gas reactors, and Russian-built VVERs—are widely used all around the world.
Meanwhile, the first set of Generation III and III+ reactors have been put into operation in Japan and several others are under construction in China, Europe, and the U.S. Prominent de-signs include Westinghouse’s AP1000, AREVA’s EPR, GE’s advanced boiling water reactor and ESBWR, and MHI’s APWR.
The focus has been narrowed on these five designs presum-ably because of highly publicized design certification processes in various countries. But several lesser-known Generation III
1. A small fish in a big pond. French regulators in February
deemed safe the ATMEA1, a Generation III+ reactor design developed
and marketed by an AREVA–Mitsubishi Heavy Industries joint venture.
Courtesy: AREVA
2. A generation gap. The last of the 1967-opened Oldbury twin re-
actors near Bristol in the UK was shut down in late February, after generat-
ing 137.5 TWh of power. The plant was one of 11 based on the pioneering
post–World War II Magnox design, the first reactor design in the world to
generate power on a commercial scale. Oldbury was also the first reactor
in the world to have a concrete pressure vessel. Ten Magnox plants are
now in various stages of decommissioning; only Wylfa on Anglesey still
operates. Oldbury and Wylfa are potential sites for new reactors. The Ho-
rizon consortium intends to build at least 6 GW of new nuclear capacity
there. Courtesy: UK Nuclear Decommissioning Authority

Since 1968
One Tool Series...
IN PLANT MAINTENANCE
is ALL you ever need!
Find out why... You’ll be Amazed!CIRCLE 5 ON READER SERVICE CARD
www.powermag.com POWER | April 201210
designs exist, and technologies such as Gidropress’ AES-92 and AREVA’S Kerena have even been certified in accordance with safety criteria set out by the European Utilities Requirements. The AES-92 from Gidropress—a Rosatom enterprise—is already under construction in China and India, and it will be the reactor of choice for Unit 1 of Bulgaria’s Belene Nuclear Power Plant. The reactor with a 60-year-lifetime is described as a late-model VVER-1000 pressurized water reactor with four first-stage coolant circulation loops per reactor. It is rated at 3,000 MWt.
AREVA’s 1,250-MWe (3,370 MWt) Kerena reactor is a BWR whose design is based on the Siemens-built Gundremmingen plant. AREVA, which says the reactor with a 60-year-design life is ready for com-mercial deployment, sought U.S. certification of the reactor in 1999 but then postponed its decision. Kerena joins a list of reactor designs whose preapplication reviews with the U.S. Nuclear Regulatory Com-mission (NRC) seem to be at a halt. (The NRC has said that it is so busy that it won’t work on applications for technologies that lack a firm U.S. customer.) Other designs include Atomic Energy of Canada Ltd.’s ACR-700, a 700-MWe design that is supposedly 40% cheaper than the CANDU-6; Westinghouse’s IRIS reactor; the South African–developed Pebble Bed Modular Reactor; Toshiba’s 4S; and General Atomics’ GT-MHR.
Then there are obscure Asian-certified Generation III designs. Perhaps the most significant is South Korea’s APR-1400 advanced PWR, whose trademark is owned by Korea Hydro & Nuclear Power Co. That reactor design, certified by the Korean Institute of Nu-clear Safety in 2003, is already under construction at Shin-Kori 3 and 4, and could become operational by 2013. The reactor design has also been chosen as the basis of the United Arab Emirates nuclear program. The design’s developers are reportedly discuss-ing applying for U.S. certification later this year, and plans could soon be under way to develop a European version of the reactor.
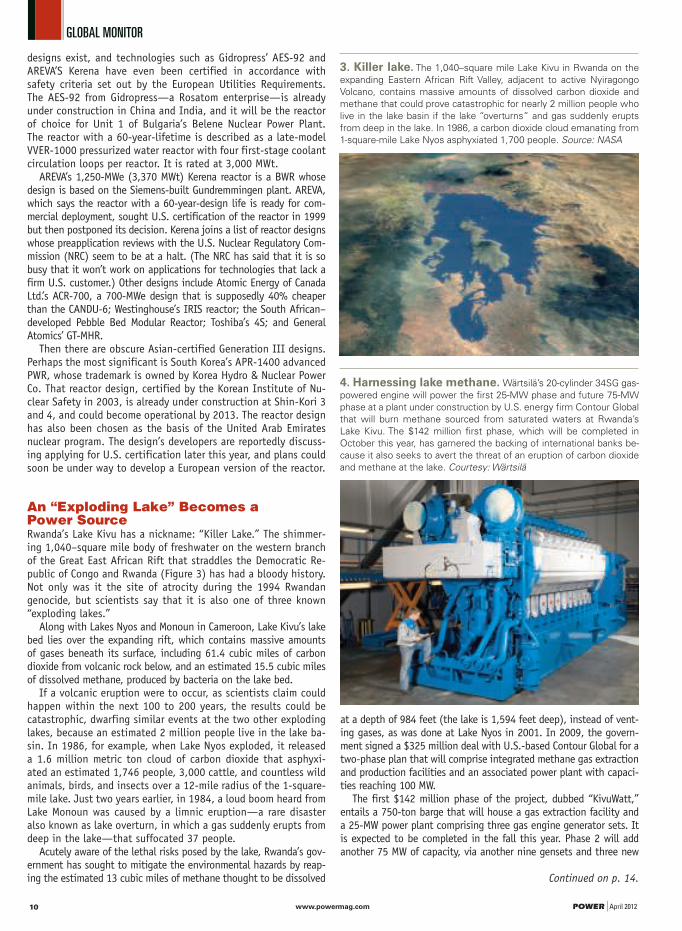
An “Exploding Lake” Becomes a Power SourceRwanda’s Lake Kivu has a nickname: “Killer Lake.” The shimmer-ing 1,040–square mile body of freshwater on the western branch of the Great East African Rift that straddles the Democratic Re-public of Congo and Rwanda (Figure 3) has had a bloody history. Not only was it the site of atrocity during the 1994 Rwandan genocide, but scientists say that it is also one of three known “exploding lakes.”
Along with Lakes Nyos and Monoun in Cameroon, Lake Kivu’s lake bed lies over the expanding rift, which contains massive amounts of gases beneath its surface, including 61.4 cubic miles of carbon dioxide from volcanic rock below, and an estimated 15.5 cubic miles of dissolved methane, produced by bacteria on the lake bed.
If a volcanic eruption were to occur, as scientists claim could happen within the next 100 to 200 years, the results could be catastrophic, dwarfing similar events at the two other exploding lakes, because an estimated 2 million people live in the lake ba-sin. In 1986, for example, when Lake Nyos exploded, it released a 1.6 million metric ton cloud of carbon dioxide that asphyxi-ated an estimated 1,746 people, 3,000 cattle, and countless wild animals, birds, and insects over a 12-mile radius of the 1-square-mile lake. Just two years earlier, in 1984, a loud boom heard from Lake Monoun was caused by a limnic eruption—a rare disaster also known as lake overturn, in which a gas suddenly erupts from deep in the lake—that suffocated 37 people.
Acutely aware of the lethal risks posed by the lake, Rwanda’s gov-ernment has sought to mitigate the environmental hazards by reap-ing the estimated 13 cubic miles of methane thought to be dissolved
at a depth of 984 feet (the lake is 1,594 feet deep), instead of vent-ing gases, as was done at Lake Nyos in 2001. In 2009, the govern-ment signed a $325 million deal with U.S.-based Contour Global for a two-phase plan that will comprise integrated methane gas extraction and production facilities and an associated power plant with capaci-ties reaching 100 MW.
The first $142 million phase of the project, dubbed “KivuWatt,” entails a 750-ton barge that will house a gas extraction facility and a 25-MW power plant comprising three gas engine generator sets. It is expected to be completed in the fall this year. Phase 2 will add another 75 MW of capacity, via another nine gensets and three new
3. Killer lake. The 1,040–square mile Lake Kivu in Rwanda on the
expanding Eastern African Rift Valley, adjacent to active Nyiragongo
Volcano, contains massive amounts of dissolved carbon dioxide and
methane that could prove catastrophic for nearly 2 million people who
live in the lake basin if the lake “overturns” and gas suddenly erupts
from deep in the lake. In 1986, a carbon dioxide cloud emanating from
1-square-mile Lake Nyos asphyxiated 1,700 people. Source: NASA
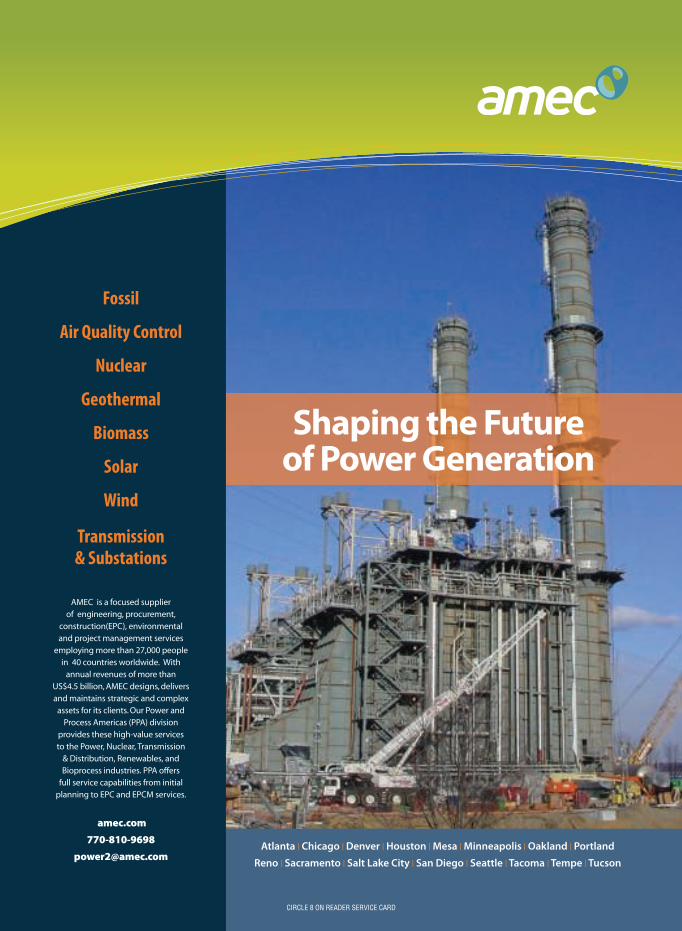
4. Harnessing lake methane. Wärtsilä’s 20-cylinder 34SG gas-
powered engine will power the first 25-MW phase and future 75-MW
phase at a plant under construction by U.S. energy firm Contour Global
that will burn methane sourced from saturated waters at Rwanda’s
Lake Kivu. The $142 million first phase, which will be completed in
October this year, has garnered the backing of international banks be-
cause it also seeks to avert the threat of an eruption of carbon dioxide
and methane at the lake. Courtesy: Wärtsilä
its in more places and comes with more proven safety-accessories than any other brand
takes a turbine apart and puts it back together in half the time no matter which way you are doing itstretches bolts cold to the Desired Load within + 5%, FREE of side load, torsion and measurementassures the highest Safety Standard with hands-free remote bolting, even invertedeliminates crane-time, slugging wrenches, bolt heating, tensioners, backup tools and reaction armssimpliies bolting to assure quality workmanship at all timeshas the highest ROI of any bolting method in the market- Period!
Tool Series as Stretch-to-Load Tool
HYTORC, Division UNEX Corporation333 Route 17, Mahwah, NJ 07430 [email protected] | www.HYTORC.com +1 201 512-9500 or 1 800 FOR-HYTORC
Pictures feature the HYTORC-Nut™ in use
Continued on p. 14.

Since 1968
One Tool Series...
The HYTORC AVANTI Tool Series as Torque Toolits in more places and comes with more proven safety-accessories than any other brand
takes a turbine apart and puts it back together in half the time no matter which way you are doing itstretches bolts cold to the Desired Load within + 5%, FREE of side load, torsion and measurementassures the highest Safety Standard with hands-free remote bolting, even invertedeliminates crane-time, slugging wrenches, bolt heating, tensioners, backup tools and reaction armssimpliies bolting to assure quality workmanship at all timeshas the highest ROI of any bolting method in the market- Period!
The HYTORC AVANTI Tool Series as Stretch-to-Load Tool
Either Way, our Worldwide 24/7 Field Service is at your Command!
Since 1968
Always a Revolution ahead!HYTORC, Division UNEX Corporation333 Route 17, Mahwah, NJ 07430 [email protected] | www.HYTORC.com +1 201 512-9500 or 1 800 FOR-HYTORC
Everytime!
Pictures feature the HYTORC-Nut™ in use
gets you back on Line on Time -
CIRCLE 6 ON READER SERVICE CARD

THE BIG PICTURE: Nuclear AftershocksIn the year following the Fukushima accident in Japan, the nuclear sector has seen several setbacks (text in orange) as well as major
milestones (white). Background image from video of the Daiichi plant in the early morning hours of March 12. Courtesy: TEPCO
—Sonal Patel is POWER’s senior writer.
Feb. 9: NRC issues � rst nuclear combined construction and operation license for new AP1000 reactors to the Vogtle expansion in Georgia.
Feb. 22: Kuwait scraps plans for four new Japanese-built reactors.
Feb. 23: South Korea’s two newest reactors, Shin Kori 2 and Shin Wolsong, are connected to the grid.
March 11, 2011: A magnitude 9.0 temblor and 130-foot-high tsunami waves kill 25,000 people and inundate Tokyo Electric Power’s (TEPCO’s) Fukushima Daiichi plant. Cores of Daiichi 1, 2, and 3 largely melt within the � rst three days of the crisis.
March 18: Israel drops plans for new nuclear plant.
March 28: The Chinese government reduces its nuclear capacity targets by about 10 GW from the 90 GW previously expected by 2020.
April 13: Taiwan halts plans for new reactors.
April 19: NRG Energy pulls � nancial backing for the South Texas Project expansion of two new advanced boiling water reactors.
May 12: Pakistan’s third nuclear plant, Chashma Unit 2, begins commercial operation.
May 25: Switzerland abandons plans to build new reactors, while European Union regulators agree on a framework for stress-testing theirs.
May 30: German Chancellor Angela Merkel endorses blueprint to shut down all 17 German reactors by 2022.
June 11: Italy overwhelmingly votes to abandon nuclear power.
Aug. 3: UK announces closure of its Sella� eld Mixed Oxide Plant.
Aug. 7: China’s Ling Ao Phase II-2 unit officially begins commercial operation.
Aug. 18: Tennessee Valley Authority Board authorizes utility to complete Bellefonte nuclear plant in Alabama.
Aug. 24: 5.8-magnitude Virginia quake rattles eastern U.S., prompting 11 nuclear stations to report unusual events to the Nuclear Regulatory Commission (NRC).
Sept. 22: Siemens announces it will quit the nuclear business.
Sept. 29: Construction completed at Atucha II, Argentina’s third nuclear plant, 30 years after work began.
Nov. 3: Taiwan rejects plans to operate its two existing nuclear plants beyond their planned 40-year lives in effort to make the island “nuclear free.”
Nov. 3: Mexico abandons plans to build as many as 10 new reactors and focuses on new natural gas plants after gas discovery boosts.
Nov. 18: Post-quake restart at North Anna nuclear plant (Va.).
Dec. 5: Indonesia approves construction of its � rst nuclear plant.
Dec. 6: TEPCO technical analysis concludes fuel in Daiichi 1 mostly melted out of reactor pressure vessel (RPV) and into primary containment vessel. Fuel melted in Units 2 and 3 but remained in RPVs.
Dec. 12: Russia begins commercial operation of new Kalinin Nuclear Plant Unit 4 in the Tver region.
Dec. 12: Canada’s Bruce Power abandons plans to build a new nuclear plant in Alberta.
Dec. 14: UK regulators issue interim design approvals for EPR and AP1000, Gen III+ reactors.
Dec. 17: Japan’s government and TEPCO declare Daiichi 1, 2, 3 are in cold shutdown.
Dec. 23: NRC approves Westinghouse’s AP1000 reactor design.
Jan. 6: Spain’s new conservative government asks nuclear safety council to consider operation of 42-year-old Garoña plant until 2019. Spain also chooses small town Villar de Cañas as site of future waste storage facility.
Jan. 18: UK nuclear safety regulators grant interim acceptance to Areva EPR and Westinghouse AP1000.
Jan. 26: U.S. Energy Secretary Steven Chu’s Blue Ribbon Commission releases its � nal report on how to manage and dispose of spent fuel waste.
www.powermag.com POWER | April 201212

I promise
GE Energy
– Vishal Bansal, PhD, Principal Engineer
Air Filtration
With new challenges continually waiting around the corner, it’s good to
know GE Energy’s Air Filtration team has your back. We make it our mission
to provide smart solutions for the filtration problems of the future. So when
the newest regulations and developments come around, we’ll be ready with
convenient, reliable products to meet those industry demands head on.
Forward-thinking solutions that prepare you for today—and the road ahead.
That’s not just a promise. It’s the promise of something better.
See for yourself how our team and advanced solutions can make your life easier.
Visit PeopleBehindThePromise.com/Vishal
I prom seI prom se
CIRCLE 7 ON READER SERVICE CARD

www.powermag.com POWER | April 201214
barges (one for every 25 MW of capacity). Finnish company Wärtsilä will supply the 20-cylinder 34SG gas-powered engines; delivery of the first 25-MW phase is expected this spring (Figure 4).
Wärtsilä, which will also build the plant on a turnkey basis, said it conceived the idea for the plant and proposed it to Con-tour Global after learning about a much smaller Lake Kivu power project run by beer-maker Heineken. That company pipes water and methane up from the lake, separates the gas, and burns it in a combined heat and power plant dedicated to one of its small breweries. KivuWatt is expected to be the first large-scale at-tempt to harness power from the lake’s methane.
And there could be much more to come. According to Wärt-silä’s regional director for Africa, Tony van Velzen, the methane trapped at Lake Kivu is growing at a rate that could fuel about 80 MW per year. “This is why the project has been sized at 100 MW. Actually there is enough gas to run the plant indefinitely,” he said. “A future idea is to raise power generating capacity to 300 MW, which will sustainably reduce the pressure of the lake. If it works it will be incredible.”
The project also includes a floating pipeline to transport the fuel gas ashore from each barge and an onshore gas-receiving facility. Power produced by the project will be sold under a 20-year purchase agreement to Rwanda’s national utility, the Energy, Water, and Sani-tation Authority (EWSA), which says the electricity is badly needed to drive Rwanda’s burgeoning economy. Only 6% of the population had access to power in 2008, by EWSA’s estimates. However, the electricity could also be exported to neighboring power-stricken countries like Uganda in the future, Contour Global says.
New South Korean and Russian Reactors Go OnlineThree nuclear reactors under construction in the Eastern Hemi-sphere reached major milestones over the past few months. South Korea’s Korea Hydro and Nuclear Power Co. connected its 960-MW Shin-Wolsong 1 reactor near Nae-ri to the grid on Jan. 27 and, a day later, its sister plant, the 960-MW Shin Kori 2 (Figure 5) in the southwest city of Gori. Both units are expected to become commercially operational this summer. And last December, Rus-sia began commercial operation of its 950-MW Kalinin 4 plant, a V-320 model VVER 1000.
The Korea Electric Power Co. (KEPCO) subsidiary’s plants are OPR-1000 pressurized water reactors (PWRs), which evolved from the domestically designed Korean Standard Nuclear Power Plant. South Korea has 23 operating reactors, some of the first PWRs of Westinghouse, Framatome (now AREVA), and CANDU designs. Seven OPR-1000 reactors went online between 1998 and 2011. Shin Kori 2, Shin Wolsong 1, and Shin Wolsong 2, also OPR-1000s, are expected to start commercial operation between mid-year 2012 and September 2013.
Three new reactors are under construction, and six are being planned. South Korea hopes to increase its nuclear capacity to 27.3 GW and supply 43.4% of its capacity through nuclear power, up from the current 34.6%. By 2030, the government has fore-cast nuclear power could supply 59% of its power. All planned reactors are third-generation APR-1400s. The first two of that reactor designs are being built at Shin-Kori Units 3 and 4 and should be completed between 2013 and 2014.
The new Russian plant has a longer history. Work on Russia’s Kalinin 4 began in 1986 but stalled in 1991 when the plant was barely 20% complete. The plant is expected to provide power for the Tver region. Russia sources 17% of its power from 33 nuclear plants, but it has 10 projects under construction on Russian soil and at least 21 units under construction in other countries.
In related news, Russia this January completed the first phase of a centralized “dry” interim storage facility at Zheleznogorsk, near Krasnoyarsk, Siberia, where it plans to store 8,129 metric tons of used fuel from its RBMK-1000 Leningrad, Kursk, and Smo-lensk plants and VVER-1000 Balakovo, Kalinin, Novovoronezh, and Rostov plants. The first phase of the facility is expected to be full to capacity within eight to 10 years. The complete interim storage facility will ultimately store 38,000 metric tons of fuel for at least 50 years. Media reports say that Russia, a country that reprocesses about 16% of its used fuel, has plans to reprocess all its used fuel by 2020.
Russia’s nuclear plans also reportedly include privatizing Rosa-tom—the massive state-owned entity that oversees the country’s nuclear power, engineering, and research enterprises—as part of a modernization effort. In particular, the firm’s civil nuclear assets—its nuclear fuel, reactor technology, supply chain, power plant operation, services, and waste management—could become public liability companies with shares that will be sold off. The proposal by Vladimir Putin, who was recently reelected as Rus-sia’s president (after serving the maximum two terms as president from 2000 to 2008), seeks to curb corruption and improve the legal and investment environment.
Two New Offshore Farms Turning Despite Stagnant Global Wind Market The UK opened two massive offshore wind farms this February on the Irish Sea off the UK’s Cumbrian coast. DONG Energy, SSE, OPW, and a consortium of Dutch pension fund service provider PGGM and Ampere Equity Fund began commercially operating the 367-MW Walney wind farm, estimated to cost $1.58 billion, and Danish wind firm Vattenfall inaugurated the Ormonde Offshore Wind Farm.
Walney uses 102 Siemens turbines that were installed in a record five months 15 kilometers (km) off Walney Island. The development included foundations, turbines, export and array cables, offshore substations, and onshore connection to grid.
Vattenfall’s 8.6 square-km wind farm, located about 10 km from the Barrow-in-Furness shore in the Irish Sea, comprises 30 5-MW REpower wind turbines and is expected to generate 500 GWh annually (Figure 6). The two-year-long project is unusual
5. New reactors. In January, Korea Electric Power Co. (KEPCO)
subsidiary Korea Hydro and Nuclear Power Co. grid connected the
960-MW Shin Kori 2 plant shown here and sister plant Shin Wolsong
1 in the southwest city of Gori. Shin-Kori Units 3 and 4, which are also
under construction at the site, are the first of at least nine Generation
III+ South Korean–designed APR-1400 reactors that will be built as
South Korea expands its nuclear capacity. Courtesy: KEPCO
Atlanta | Chicago | Denver | Houston | Mesa | Minneapolis | Oakland | Portland
Reno | Sacramento | Salt Lake City | San Diego | Seattle | Tacoma | Tempe | Tucson
Shaping the Future of Power Generation
Fossil
Air Quality Control
Nuclear
Geothermal
Biomass
Solar
Wind
Transmission & Substations
AMEC is a focused supplier
of engineering, procurement,
construction(EPC), environmental
and project management services
employing more than 27,000 people
in 40 countries worldwide. With
annual revenues of more than
US$4.5 billion, AMEC designs, delivers
and maintains strategic and complex
assets for its clients. Our Power and
Process Americas (PPA) division
provides these high-value services
to the Power, Nuclear, Transmission
& Distribution, Renewables, and
Bioprocess industries. PPA offers
full service capabilities from initial
planning to EPC and EPCM services.
amec.com
770-810-9698
CIRCLE 8 ON READER SERVICE CARD
www.powermag.com POWER | April 201216
because it uses fairly new technology. Only six REpower 5-M turbines have been so far installed in the German test field alpha ventus, partly owned by Vattenfall, and two others in the Beatrice demonstra-tion test field in the UK. The turbines, with a rotor diameter of 126 meters and three rotor blades—cover the area of two soccer fields. Each nacelle is the size of two houses.
The wind farms are part of the UK’s ef-forts to boost its power capacity to 18 GW
by 2020 to meet increasing demand for energy and to meet European Union (EU) renewables targets and cut emissions 34% from 1990 levels. The UK already has more than 1,500 MW of nameplate offshore wind capacity, and it plans to spend bil-lions of dollars more to increase offshore generation more than 10-fold by 2020, Bloomberg reported in February.
According to European renewables think tank EurObserv’ER, however, key wind energy markets like the UK “may be
showing fault lines.” Asia was the world’s biggest wind market in 2011, taking a 52% share, ahead of Europe (24.5%) and North America (19.7%), it says in a newly released study. Though Europe had the largest wind power capacity in the world with 40.6% of the world’s total in 2011, it “attracts less than a quarter of the newly installed capacity and could be overtaken by Asia in 2012.”
The EU market is “wavering between the flagging onshore market and the lo-gistics, technology and industrial prepara-tions for the huge, offshore wind energy market with its rich pickings,” the study says. The EU market could further decline on the back of delayed loans stemming from the recession. Moreover, many gov-ernments have reduced domestic mar-ket growth both with slowed permitting and increased administrative procedures (Spain’s preallocation plan, for example).
Even China, the world’s biggest wind power market, saw installations level off for the first time in 2011, EurObserv’ER says. This was due to a slew of new regula-tions imposed by Chinese authorities in a bid to improve control over growth of the country’s domestic renewable energy mar-ket. Some regulations, for example, divest China’s provinces of their independence to decide on the siting of wind farms of less than 50 MW. Projects now require gov-
CIRCLE 9 ON READER SERVICE CARD
6. The wind’s changing course. Vattenfall in late February completed com-
missioning work on its 30th turbine of the
Ormonde Offshore Wind Farm off the UK’s
Cumbria coast. The facility is expected to gen-
erate 500 GWh annually. Courtesy: Vattenfall

BECHTEL
BECAUSE EXPERIENCE MATTERS
Since Bechtel’s founding in 1898 we’ve measured success against our ability to
repeatedly exceed customers’ expectations and deliver innovative solutions for
unique challenges. With over 65 years of experience in the power industry, we are
continuing to help customers provide power for the 21st century.
We have an unrivaled standard for performance in the industry, having developed a
diversi� ed portfolio across six continents. When it comes to power projects, no one
offers greater teamwork, experience, service, or dependability than Bechtel.
BECHTELFrederick, Maryland USA
bechtel.com
San Francisco Houston London Brisbane

www.powermag.com POWER | April 201218
ernment approval in consultation with the grid operator. New technical standards have also been imposed to facilitate grid integration of wind turbines.
The U.S. wind sector’s long-term development, meanwhile, hangs in the balance for lack of agreement on continuation of the current incentive system, which consists of a production tax credit of 2.2¢ per kWh for wind generation, the study notes.
Globally during 2011, offshore wind power fared the worst, EurObserv’ER says. Only 788.1 MW were installed, compared to 1,139 MW in 2010. “The decline recorded in 2011 however, will not drive the off-shore sector’s future development off course,” it forecasts, saying 18 projects under construction should be completed over the next three years and raise the EU’s offshore capacity to more than 9 GW. “The sector’s growth is set to ac-celerate from then on,” it concludes, citing claims that 40 GW of offshore capacity should be installed by 2020, which will cover 4% of the EU’s electricity demand.
India’s Chronic Coal Shortages Threaten Coal Power Ambitions India has been besieged by a coal shortage of unprecedented sever-ity that has forced privately owned and money-strapped state-owned coal-fired power plants alike to rely on expensive imports from Indo-nesia and South Africa to replenish woefully inadequate stocks.
The situation, which intensified last October, was said to stem from heavy rainfall in August and September in key mining areas that affected six of seven subsidiaries belonging to Coal India, the central government–controlled mining company, and caused a shortfall of 17 million metric tons of coal. The scarcity—already severe for the nation, which sources 55% of its power from coal generation—was further exacerbated by strikes by Coal India em-ployees, a derailment of a big consignment of coal, and floods in eastern states.
The fuel shortages have frozen plans for $36 billion of new power plants and stunted India’s $1.7 trillion economy. In late February, India’s Power Ministry told the Planning Commission that the nation’s coal availability during the 12th Plan period (2012–2017) was suggestive of a “very bleak” scenario and that the shortages raised questions about achieving the targeted 9% economic growth for the period.
Coal India production over the period was projected at 615 million metric tons—way below the 12th plan requirement of 842 million metric tons, the ministry said. That much coal would only support about 19,000 MW of Coal India–linked new capacity during the five-year period, half as much as the 38,000 MW required to sustain economic growth. For those reasons, the ministry urged the commission to pare down its total generation capacity targets for the period from 76,000 MW to 57,000 MW. India’s total capacity addition ambitions of 76,000 MW during the 12th Plan consisted of 62,695-MW coal capacity, 2,800 MW of nuclear power, 9,200 MW of hydro-power, and 1,086 of gas-fired power.
And it’s just the beginning of a downward spiral, some experts suggest, saying that the deficit between the demand and supply of domestic coal in India may rise as high as 150 million metric tons by 2014 if the country fails to increase local supplies by at least 6% this year.
State-run power generation companies from Maharashtra, Karnataka, Andhra Pradesh, and Tamil Nadu—entities that rely on Coal India for adequate supply—have already begun depending on expensive imports, while private generators such as Tata Power (Figure 7) and Adani Power have sub-stantially increased coal imports, reported India’s Financial Chronicle in late February.
But some analysts assert that India’s plan was doomed from the start. Even with the shortages from last summer, Coal In-dia reported only a 2.7% drop in production to 291.2 million metric tons in the nine months leading up to Dec. 31, ac-cording to a Feb. 13 statement. Meanwhile, a recent report by Standard Chartered Bank suggests that even if India received 60% of the coal it needs from its own mines, it would still need 106 million metric tons of coal capacity within the next five years—double Australia’s planned expansion and two-thirds of Indonesia’s. That is one reason Indian companies are scrambling to secure coal resources, buying coal projects in Indonesia, Australia, and Mozambique, it said. Moreover, if a 10% growth in generation capacity were assumed, imports would have to grow by a stunning 125% to 164 million metric tons by 2015—a development that could ultimately cause coal prices to surge beyond $200/metric ton.
Meanwhile, India must compete with coal-hungry devel-oping nations like China for fuel. India is already poised to surpass China as the world’s biggest thermal coal importer, according to The Financial Express, which reported that In-dia’s imports could exceed 118 million metric tons this year—substantially more than last year’s 81.1 million metric ton imports of steam coal, and much higher than China’s im-ports of 102 million metric tons this year. One reason for this, experts note, is that China is developing twice as much coal-production capacity this year as in 2011. At the same time, India’s government may force Coal India to begin imports en masse by imposing penalties on power producers should de-liveries fall to less than 80% of the contracted quantity.
POWER DigestCSP Giants Form Alliance. Concentrating solar power com-panies Abengoa, BrightSource Energy, and Torresol Energy in early March formed the Concentrating Solar Power Alli-ance, an organization dedicated to educating U.S. regulators, utilities, and grid operators about the unique benefits of concentrating solar power (CSP) and of thermal energy stor-age. The U.S. has more than 500 MW of operating CSP plants
7. Dealing with the dearth. India has been stricken by a severe
coal shortage that has forced state-run generators and private compa-
nies to import coal—circumstances that could compel the country to
scale down its new coal capacity targets. Despite being built to over-
come chronic power shortages that are stunting economic growth,
newly opened plants like Tata’s 1,050-MW Maithon Right Bank Ther-
mal Power Plant in Jharkhand aren’t receiving enough coal to reach full
capacity. Courtesy: Tata Power

April 2012 | POWER www.powermag.com 19
and more than 1,300 MW of CSP plants under construction. The International Energy Agency estimates that CSP projects in development or under construction in more than a dozen countries (including China, India, Morocco, Spain, and the U.S.) total 15 GW.
JSC Institute Hydroproject to Refurbish Russian Hydro Plant. RusHydro subsidiary JSC Institute Hydroproject in March began an all-inclusive project to modernize the Kams-kaya hydropower plant, which is part of the Volga-Kama cas-cade in Russia. About 17 of 23 new vertical hydraulic units have been already upgraded. JSC Institute Hydroproject will develop the all-inclusive modernization project taking into consideration the previous projects for reconstruction of hy-droturbines, hydro and auxiliary equipment, hydro units, and dams. Design works will be finished in 2014.
APS Launches Pilot Battery Project. Arizona Public Service Co. on Feb 23 began testing a new 1.5-MWh ship-ping container–size energy storage system. The goal of the company’s two-year pilot project in Flagstaff, Ariz., will be to determine the benefits of storing electricity and putting it onto the grid during times of peak demand. In 2012, the system developed by lithium-ion battery maker Electrovaya Inc. will reside in an electrical distribution substation. At a later date, the system will be trucked a few miles up the road to support a 500-kW solar power plant, the Doney Park Renewable Energy Site.
Fortis to Acquire CH Energy Group in $1.5B Deal. Canada’s largest investor-owned distribution utility, Fortis, announced in mid-February that it entered into an agree-
ment to acquire CH Energy Group for about $1.15 billion. CH Energy Group is an energy delivery company headquartered in Poughkeepsie, N.Y. Its electric assets (which constitute approximately 77% of its total assets) include approximately 9,600 miles of distribution lines and more than 600 miles of transmission lines.
AEP Starts Up Ohio Gas Plant. American Electric Power (AEP) on Feb. 1 began commercial operation of the Dresden natural gas–fired power plant, a nominal 580-MW combined cycle generating unit. located near Dresden, Ohio. Including startup of the Dresden plant, AEP has added more than 4,800 MW of natural gas–fired capacity to its generating fleet in the past decade. Natural gas accounts for 24% of AEP’s total generating capacity. AEP purchased the partially constructed Dresden plant in 2007 for approximately $85 million from Dresden Energy LLC, a subsidiary of Dominion. AEP acceler-ated construction of Dresden in January 2011. Total costs for the plant were approximately $366 million.
Key EPC Contracts Signed for Texas Clean Coal Proj-ect. Summit Power Group’s Texas Clean Energy Project on Feb. 14 signed engineering, procurement, and construction (EPC) contracts and a 15-year operations and maintenance contract for its 400-MW power/poly-gen gasification proj-ect with 90% carbon capture near Odessa, Texas. The deal takes the project another step closer to financial closing and groundbreaking. The two, firm-price, turnkey EPC contracts that guarantee price, schedule, and performance for the inte-grated coal gasification combined cycle project were finalized in December by the project’s three EPC contractors: Siemens
800.290.5460 I [email protected]
The YGS Group is the authorized provider of custom reprint products from POWER.
integrated publishing solutions
Develop greater corporate awareness and showcase yourfeatured editorial from this industry respected publication.
Presentations
Event Collateral
Media Kits
Direct Mail
Online Marketing
Recruiting Packages
Place your positive press directly in the hands of your customers andassociates with custom reprints from POWER.
BUSINESS AND TECHNOLOGY FOR THE GLOBAL GENERATION INDUSTRY
Vol. 151 • No. 10 • October 2007www.powermag.com
Top Plants: Four model coal-fired plants
Shock therapy KOs boiler fouling
Stop your boiler from sucking air
SS tube specs begin at the mill
WHAT IF CO2
WAS AN ASSET?· A single, comprehensive 240-page report…
· Profiles 136 different companies,
universities and labs…
· Who are producing fuel, building
materials, chemicals and other valuable
products from CO2.
The Carbon Capture and Recycling Industry Overview
Available for purchase at www.prizecapital.net
Bonus 131-page companion piece now available!
Emerging Carbon Capture
Technologies Overview
FREE with purchase!
CIRCLE 10 ON READER SERVICE CARD

www.powermag.com POWER | April 201220
Energy Inc.; Selas Fluid Processing Corp., a subsidiary of The Linde Group; and SK Engineering & Construction, a major Korean contractor. The total value of the EPC contracts is approximately $2 billion.
Alstom Wins Contract for Malaysian Supercritical Coal Plant. Alstom on Feb. 27 secured a €830 million ($1.1 bil-lion) contract as part of a consortium that includes Malaysian companies Mudajaya and Shin Eversendai that will build a coal-fired power plant in Tanjung Bin, Malaysia. Alstom will construct and commission the 1,000-MW supercritical steam turbine and generator and install a supercritical boiler, power plant auxiliaries such as mills and air preheaters, as well as proprietary environmental control systems. The power plant is scheduled to be commissioned in 2016. The Tanjung Bin power plant is the French energy company’s second contract for a supercritical coal-fired unit in Malaysia, following the order to build the Manjung power plant in March 2011, which is scheduled to come online in 2015.
DONG Energy to Sell 50% Stake in German Offshore Farm. Danish power company DONG Energy on Feb. 24 agreed to sell its 50% stake in the German offshore wind project, Borkum Riffgrund 1, in an agreement worth DKK4.7 billion ($841 million) to Kirkbi (for a 32% stake) and the Oticon Foundation (18% stake). Upon completion, the proj-ect will consist of 77 3.6-MW turbines supplied by Siemens Wind Power.
Dominion Mulls New $1B Gas Plant. Dominion Virginia Power on Feb. 29 said it would build a $1 billion combined cycle, natural gas–fired power station in Brunswick County,
Va. The company will seek approval from the Virginia State Corporation Commission later this year to build the 1,300-MW plant on a 205-acre site. When complete in 2016, the plant will replace power generated by coal units at two eastern Virginia stations that are slated for retirement.
Siemens to Supply Components for 4-GW Saudi Gas Plant. Siemens Energy on Feb. 21 said it received an order from the Hajr Project Co. worth more than $1 billion to sup-ply components for the 4-GW IPP Qurayyah combined cycle power plant in Saudi Arabia. The order was placed by Sam-sung C&T, which will act as engineering, procurement, and construction contractor for the project. Siemens will provide 12 SGT6-5000F gas turbines, 18 generators of the SGEN6-1000A series, and six SST6-4000 steam turbines together with the associated electrical systems. Commissioning of the six blocks is scheduled for 2014.
Toshiba, JSW Joint Venture to Supply Equipment for Indian Supercritical Plant. On Feb. 21, Toshiba JSW Tur-bine and Generator—a 75:25 joint venture between Japan-based Toshiba Corp. and India-based conglomerate JSW Group—received a contract from Indian state-owned energy service provider NTPC to supply equipment for the Kudgi Su-per thermal power project, Stage-I, in Karnataka, India. The value of the contract is estimated at Rs23bn ($468.6 mil-lion). Under the terms of the agreement, the firm will sup-ply three 800-MW supercritical steam turbine and generator island packages for the project. Delivery of the equipment is expected to start in 2013. ■
—Sonal Patel is POWER’s senior writer.
Potential is limitless.
An idea has no momentum until talented people start chasing it. It’s then that
one begins to glimpse what’s possible, and the future begins to take shape.
Today, we are thousands of people sharing ideas, dedicated to finding new
ways to meet the needs of an ever-demanding Power sector. Which is why,
when it comes to nuclear, natural gas, coal, renewables, hydroelectric and
electric delivery systems, more people are turning to us to get it done.
We are URS.
For more information, please contact 609.720.2000.
POWER
INFRASTRUCTURE
FEDERAL
INDUSTRIAL & COMMERCIAL
URS.COM
CIRCLE 11 ON READER SERVICE CARD

CIRCLE 12 ON READER SERVICE CARD

www.powermag.com POWER | April 201222
Safe Work Practices in Confined Spaces at Power Plants
Confined space work is often considered to be one of the most dangerous types of work performed in power generation settings. Confined spaces may contain hazardous atmospheres, they can trap entrants, and they generally can increase the hazards associated with otherwise common tasks. When the risks are not recognized, workers all too often regard incidents as surprises, but the hazards of working in confined space can be predicted, monitored, and mitigated. These “accidents” are caused by unsafe conditions, unsafe acts, or both; all accidents are preventable.
Several common dangers found in confined spaces include the hazards of
working with electrical equipment, en-gulfment, and releases from pipes con-taining fluids or gases.
Electrical. Electrical energy poses sev-eral threats to the health and safety of entrants going into confined spaces. For spaces with a potential for flammable at-mospheres, both the equipment already in the space and the equipment used in the work performed may become ignition sources.
Arc flash, thermal burns, and other electrical hazards are particularly dan-gerous in a confined space because it may be difficult for the worker to avoid accidental contact or proximity. In most settings, policy dictates that such equipment simply be de-energized and lockout/tagout procedures put into effect. (For more information on the hazards of arc flash, see “Arc Flash Protection Should Be Job No. 1” in the February 2007 issue, or in POWER’s on-line archives at www.powermag.com.) However, this is not always possible in a power generation environment. In-stead, complex operational controls and tagging systems must be used to ensure proper safety (Figures 1 and 2).
Engulfment. Many materials have the potential to engulf an entrant. When small solids are in motion, they begin to act like a liquid. Coal, sand, dirt, and other ma-terials flow, following the shape of their container. The presence of materials with a combination of fluid and semi-rigid properties makes storage areas potentially hazardous. This is an especially important concern for coal-fired plants, where em-ployees must walk across loose coal. A parallel hazard is bridging. When an auger operates, material flows out of the bottom of the storage area. Material at the top may not flow down evenly, forming a tem-porary bridge out of the material. Walking over the surface of bridged material can lead to immediate engulfment.
Pipes Containing Fluids or Gases. Pipes that carry liquids or gases also pres-ent several potential hazards. The condi-tion of a pipe may be hazardous, as a leak could quickly create a dangerous situa-tion. Valves, piping, and infrastructure in confined spaces may be hard to access and are inspected infrequently, so it is im-portant to consider that the risk posed by leaks may be unknown.
Materials being transported in lines and piping, such as steam or coolant,
may be at extreme temperatures. Even without a release, such pipes are poten-tially hazardous if entrants must work in close proximity, as this scenario increases the likelihood of unintentional contact. Gases being vented or brought to a pro-cess can quickly create a hazardous at-mosphere. Even without obvious damage to lines, leakage usually occurs in most piping systems.
Otherwise nonhazardous fluids, such as water, may not be immediately threatening, but the introduction of any fluid to a confined space creates poten-tial hazards. Fluid may conceal trip/fall hazards, come into contact with ener-gized equipment, or may fill the space. Entrance into lines themselves is always potentially dangerous, and dead or de-caying matter in those lines can cause a buildup of hazardous gasses in short amounts of time. Lines used to transport saltwater are particularly vulnerable to such organic matter, even if filters and other measures are taken to clean the incoming supply. Valves normally under pressure from liquids in a line may not seal as well as expected when the lines are drained, so air quality testing is in-credibly important in these areas.
Spaces such as large tanks present the possibility of a stratified gaseous atmosphere. Gases have different den-sities and can rise or sink relative to each other. Gases like carbon dioxide tend to pool, while gases like meth-ane and acetylene rise. Depending on the temperature and source of the gas, or whether the atmosphere inside the space is disturbed, these hazards may be found anywhere in a confined space. When left for some time, the atmo-sphere in confined spaces will tend to separate out. The air must be tested at small intervals in a potentially strati-fied atmosphere. Any suspected areas of reduced ventilation, such as behind a baffle or an internal barrier, should be tested as well. Always use a remote probe or sampling tube, and allow work-ers to advance into the space only as far as the atmosphere has been tested.
Successfully Evaluate Potential RisksThe situations mentioned above are just a few of the potentially hazardous con-ditions that warrant a stringent evalu-ation procedure when an employee will
1. Restricted access. When dealing with
confined spaces in power generation settings,
operational controls and tagging systems
must be used to protect the safety of work-
ers. Courtesy: New Standard Institute Inc.
2. On alert. Confined space work at power
plants requires the identification and removal
of unsafe conditions, if possible; controlling ac-
cess where conditions are inherently danger-
ous; and training entrants to prevent unsafe
acts. Courtesy: New Standard Institute Inc.

CIRCLE 13 ON READER SERVICE CARD
www.powermag.com POWER | April 201224
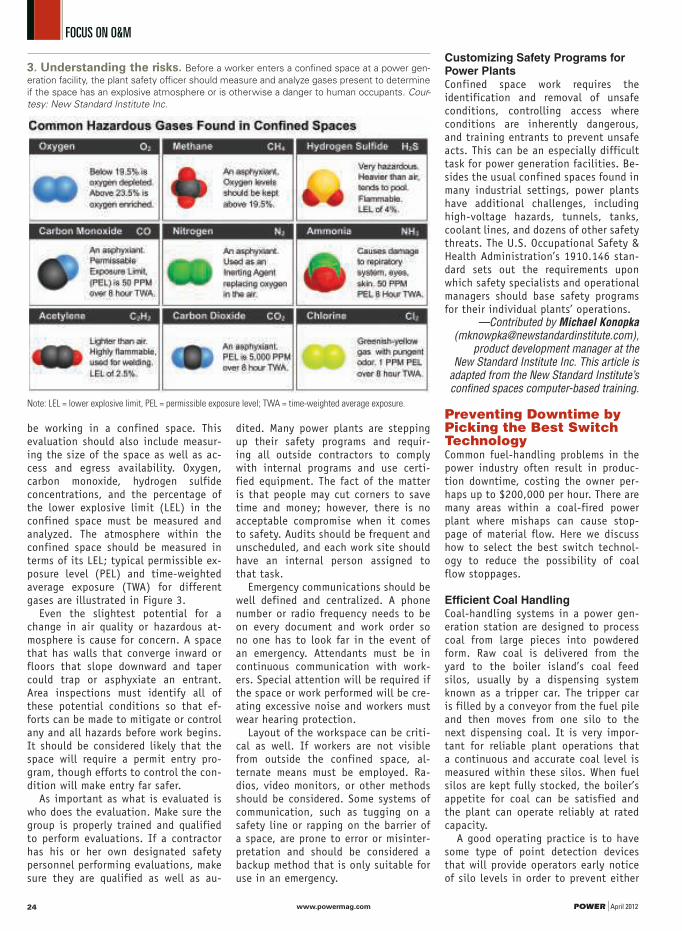
be working in a confined space. This evaluation should also include measur-ing the size of the space as well as ac-cess and egress availability. Oxygen, carbon monoxide, hydrogen sulfide concentrations, and the percentage of the lower explosive limit (LEL) in the confined space must be measured and analyzed. The atmosphere within the confined space should be measured in terms of its LEL; typical permissible ex-posure level (PEL) and time-weighted average exposure (TWA) for different gases are illustrated in Figure 3.
Even the slightest potential for a change in air quality or hazardous at-mosphere is cause for concern. A space that has walls that converge inward or floors that slope downward and taper could trap or asphyxiate an entrant. Area inspections must identify all of these potential conditions so that ef-forts can be made to mitigate or control any and all hazards before work begins. It should be considered likely that the space will require a permit entry pro-gram, though efforts to control the con-dition will make entry far safer.
As important as what is evaluated is who does the evaluation. Make sure the group is properly trained and qualified to perform evaluations. If a contractor has his or her own designated safety personnel performing evaluations, make sure they are qualified as well as au-
dited. Many power plants are stepping up their safety programs and requir-ing all outside contractors to comply with internal programs and use certi-fied equipment. The fact of the matter is that people may cut corners to save time and money; however, there is no acceptable compromise when it comes to safety. Audits should be frequent and unscheduled, and each work site should have an internal person assigned to that task.
Emergency communications should be well defined and centralized. A phone number or radio frequency needs to be on every document and work order so no one has to look far in the event of an emergency. Attendants must be in continuous communication with work-ers. Special attention will be required if the space or work performed will be cre-ating excessive noise and workers must wear hearing protection.
Layout of the workspace can be criti-cal as well. If workers are not visible from outside the confined space, al-ternate means must be employed. Ra-dios, video monitors, or other methods should be considered. Some systems of communication, such as tugging on a safety line or rapping on the barrier of a space, are prone to error or misinter-pretation and should be considered a backup method that is only suitable for use in an emergency.
Customizing Safety Programs for Power PlantsConfined space work requires the identification and removal of unsafe conditions, controlling access where conditions are inherently dangerous, and training entrants to prevent unsafe acts. This can be an especially difficult task for power generation facilities. Be-sides the usual confined spaces found in many industrial settings, power plants have additional challenges, including high-voltage hazards, tunnels, tanks, coolant lines, and dozens of other safety threats. The U.S. Occupational Safety & Health Administration’s 1910.146 stan-dard sets out the requirements upon which safety specialists and operational managers should base safety programs for their individual plants’ operations.
—Contributed by Michael Konopka ([email protected]),
product development manager at the New Standard Institute Inc. This article is
adapted from the New Standard Institute’s confined spaces computer-based training.
Preventing Downtime by Picking the Best Switch TechnologyCommon fuel-handling problems in the power industry often result in produc-tion downtime, costing the owner per-haps up to $200,000 per hour. There are many areas within a coal-fired power plant where mishaps can cause stop-page of material flow. Here we discuss how to select the best switch technol-ogy to reduce the possibility of coal flow stoppages.
Efficient Coal HandlingCoal-handling systems in a power gen-eration station are designed to process coal from large pieces into powdered form. Raw coal is delivered from the yard to the boiler island’s coal feed silos, usually by a dispensing system known as a tripper car. The tripper car is filled by a conveyor from the fuel pile and then moves from one silo to the next dispensing coal. It is very impor-tant for reliable plant operations that a continuous and accurate coal level is measured within these silos. When fuel silos are kept fully stocked, the boiler’s appetite for coal can be satisfied and the plant can operate reliably at rated capacity.
A good operating practice is to have some type of point detection devices that will provide operators early notice of silo levels in order to prevent either
Note: LEL = lower explosive limit, PEL = permissible exposure level; TWA = time-weighted average exposure.
3. Understanding the risks. Before a worker enters a confined space at a power gen-
eration facility, the plant safety officer should measure and analyze gases present to determine
if the space has an explosive atmosphere or is otherwise a danger to human occupants. Cour-
tesy: New Standard Institute Inc.

April 2012 | POWER www.powermag.com 25
an overfill of material or indicate that material is no longer flowing out of the silo, signaling a stoppage. If the level of coal in the silos gets low before the blockage can be repaired, then the plant must either reduce load or shut down to clear the blockage.
Another problem when handling dusty and dirty coal is its affinity for absorb-ing moisture. Once coal becomes wet or moist, a coating and buildup of a film of coal on the surface of the chutes will eventually block the flow through the silo transport chutes. When chute block-age occurs, it can create an overflow of coal from the conveyor belts. Not only does the blocked chute stop production, but it also can cause severe injury to plant personnel and result in fines by state regulatory agencies. We have also seen damage caused by plugged chutes and the resulting overflow of coal from conveyors to other process equipment.
Pick the Best TechnologyWith the potential for lost genera-tion and equipment damage caused by blockages in fuel-handling systems, it’s surprising that more plants don’t have the instrumentation to sense impend-ing blockages. Many different types of point level devices on the market today are used for blockage detection and pre-vention on coal transfer chutes, includ-ing a variety of switch, microwave, and acoustic wave technologies.
Switch Technology. Favorites are the few switches that are sufficiently robust to operate in these solids-handling ap-plications that operate 24/7. Whether the technology is capacitance, vibra-
4. Undercover switch. A mill cyclone
feed level switch covered with a coal ash coat-
ing often causes a false trip. Courtesy: Hawk
Measurement Systems
Biomass Handling Equipment
Complete Engineered Systems
Pulverized Coal Boiler Conversions
CFB Boiler Feed Systems
CANADA: Vancouver, BC
Je�rey Rader CanadaUnit 2, 62 Fawcett RoadCoquitlam, BC V3K 6V5 CanadaPhone: 604.299.0241Fax: 604.299.1491
SWEDEN: Stockholm
Je�rey Rader ABDomnarvsgatan 11, 163 53 SPÅNGAStockholm, SwedenPhone: +46 8 56 47 57 47Fax: +46 8 56 47 57 48
For information on how Je�rey Rader Corporation can solve your Biomass Handling needs, visit us at www.je�reyrader.com/pow
Silos
Wood Hogs
Disc Screens
Open Storage
Closed Storage
Truck Dumpers
Material Handling for
Biomass Power Generation
UNITED STATES CANADA SWEDENUNITED STATES CANADA SWEDEN
USA: CORPORATE HEADQUARTERS
Je�rey Rader Corporation398 Willis RoadWoodru�, SC, USA 29388Phone: 864.476.7523Fax: 864.476.7510
CANADA: Montreal, Quebec
Je�rey Rader Canada2350 Place Trans-CanadienneDorval, Quebec H9P 2X5 CanadaPhone: 514.822.2660Fax: 514.822.2699
Chain Conveyors
Bucket Elevators
Screw Conveyors
Screw Reclaimers
Pneumatic Conveying
CIRCLE 14 ON READER SERVICE CARD
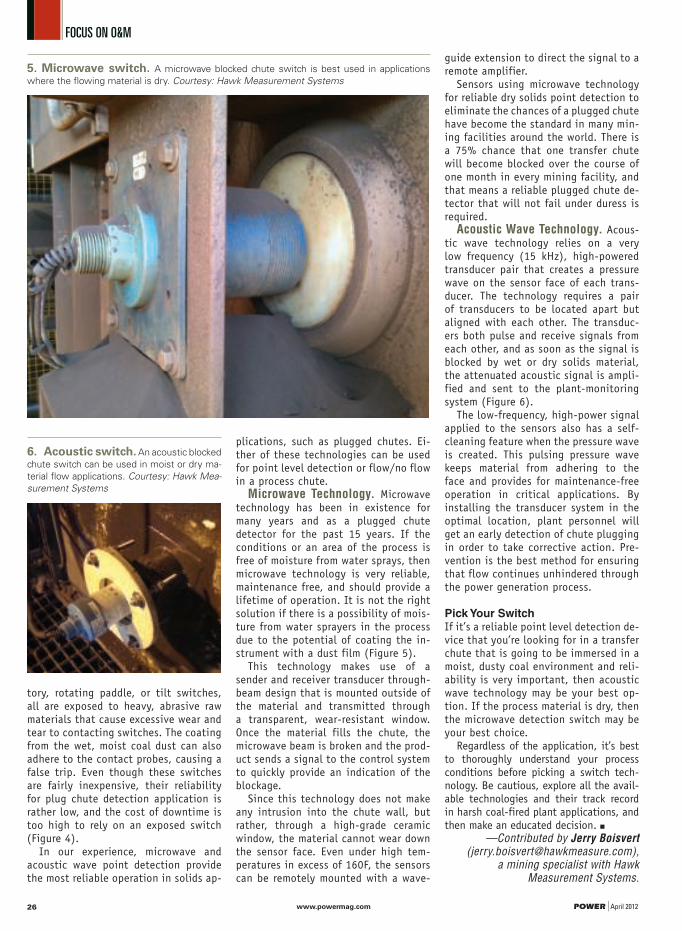
www.powermag.com POWER | April 201226
tory, rotating paddle, or tilt switches, all are exposed to heavy, abrasive raw materials that cause excessive wear and tear to contacting switches. The coating from the wet, moist coal dust can also adhere to the contact probes, causing a false trip. Even though these switches are fairly inexpensive, their reliability for plug chute detection application is rather low, and the cost of downtime is too high to rely on an exposed switch (Figure 4).
In our experience, microwave and acoustic wave point detection provide the most reliable operation in solids ap-
plications, such as plugged chutes. Ei-ther of these technologies can be used for point level detection or flow/no flow in a process chute.
Microwave Technology. Microwave technology has been in existence for many years and as a plugged chute detector for the past 15 years. If the conditions or an area of the process is free of moisture from water sprays, then microwave technology is very reliable, maintenance free, and should provide a lifetime of operation. It is not the right solution if there is a possibility of mois-ture from water sprayers in the process due to the potential of coating the in-strument with a dust film (Figure 5).
This technology makes use of a sender and receiver transducer through-beam design that is mounted outside of the material and transmitted through a transparent, wear-resistant window. Once the material fills the chute, the microwave beam is broken and the prod-uct sends a signal to the control system to quickly provide an indication of the blockage.
Since this technology does not make any intrusion into the chute wall, but rather, through a high-grade ceramic window, the material cannot wear down the sensor face. Even under high tem-peratures in excess of 160F, the sensors can be remotely mounted with a wave-
guide extension to direct the signal to a remote amplifier.
Sensors using microwave technology for reliable dry solids point detection to eliminate the chances of a plugged chute have become the standard in many min-ing facilities around the world. There is a 75% chance that one transfer chute will become blocked over the course of one month in every mining facility, and that means a reliable plugged chute de-tector that will not fail under duress is required.
Acoustic Wave Technology. Acous-tic wave technology relies on a very low frequency (15 kHz), high-powered transducer pair that creates a pressure wave on the sensor face of each trans-ducer. The technology requires a pair of transducers to be located apart but aligned with each other. The transduc-ers both pulse and receive signals from each other, and as soon as the signal is blocked by wet or dry solids material, the attenuated acoustic signal is ampli-fied and sent to the plant-monitoring system (Figure 6).
The low-frequency, high-power signal applied to the sensors also has a self-cleaning feature when the pressure wave is created. This pulsing pressure wave keeps material from adhering to the face and provides for maintenance-free operation in critical applications. By installing the transducer system in the optimal location, plant personnel will get an early detection of chute plugging in order to take corrective action. Pre-vention is the best method for ensuring that flow continues unhindered through the power generation process.
Pick Your Switch
If it’s a reliable point level detection de-vice that you’re looking for in a transfer chute that is going to be immersed in a moist, dusty coal environment and reli-ability is very important, then acoustic wave technology may be your best op-tion. If the process material is dry, then the microwave detection switch may be your best choice.
Regardless of the application, it’s best to thoroughly understand your process conditions before picking a switch tech-nology. Be cautious, explore all the avail-able technologies and their track record in harsh coal-fired plant applications, and then make an educated decision. ■
—Contributed by Jerry Boisvert ([email protected]),
a mining specialist with Hawk Measurement Systems.
5. Microwave switch. A microwave blocked chute switch is best used in applications
where the flowing material is dry. Courtesy: Hawk Measurement Systems
6. Acoustic switch. An acoustic blocked
chute switch can be used in moist or dry ma-
terial flow applications. Courtesy: Hawk Mea-
surement Systems

BETTER TOGETHER.
ENTERPRISE ASSET MANAGEMENT AND AGILE ERP.
Only IFS Applications offers class-leading enterprise asset management (EAM) as part of a
fully integrated enterprise resources planning (ERP) suite. So you can implement EAM with
components of ERP, an entire ERP package or even integrate EAM seamlessly with your legacy
ERP system. So your energy assets can be as agile as your thinking.
www.youragileenergy.com
IFS—FOR AGILE BUSINESS
CIRCLE 15 ON READER SERVICE CARD

www.powermag.com POWER | April 201228
Suing for (Pipeline) Safety
As a Valentine’s Day present to federal regulators, San Francisco City Attorney Dennis Herrera took the unusual step of suing the U.S. Pipeline and Hazardous Mate-
rials Safety Administration (PHMSA). The complaint alleges that the PHMSA has “abjectly failed to oversee the [California Public Utilities Commission’s (CPUC’s)] pipeline safety pro-gram or to ensure that federal pipeline safety standards are enforced.” The complaint chastises the PHMSA for “shirking that duty for over a decade, if not longer.”
The complaint links these failures by the PHMSA to the natural gas pipeline disasters recently experienced in the Bay Area. These incidents, most infamously, the horrible tragedy in 2010 in San Bruno that killed eight people and injured more than 50 others and destroyed or damaged more than 100 homes, involve pipelines owned and operated by Pacific Gas and Electric Co. (PG&E). The complaint asserts a direct causal nexus: “[b]y abdicating its duties as a regulator and by improperly delegating those duties to gas pipeline opera-tors like PG&E, PHMSA has placed the lives and property of millions of men, women and children—including hundreds of thousands of men, women, and children in San Francisco—at substantial and unnecessary risk.”
The complaint also criticizes what it asserts to be ineffec-tiveness by the CPUC in regulating PG&E and other operators of natural gas pipelines. Interestingly, it does not name the CPUC as a defendant and actually compliments the CPUC’s “actions to restructure and increase its pipeline safety en-forcement resources” as “ostensibly designed to address the concerns raised” by the City of San Francisco.
The complaint expresses the city attorney’s hope that the CPUC “will conduct a thorough and independent examination of its own failures and adopt meaningful reforms to its own practices,” but it also expresses the concern that the CPUC “will revert to its past practice of failing to fulfill its duty to enforce federal pipeline safety standards in compliance with its certification [at the PHMSA].” However, the complaint contrasts the CPUC’s limited actions thus far with what it deems to be the total lack of any response by the PHMSA to similarly correct any of its own failings.
The lawsuit seeks injunctive relief directing the PHMSA to comply with its “duty to oversee certified state authorities and to ensure that federal pipeline safety standards are enforced as required by the [Pipeline Safety] Act.” It further requests that the court enjoin the PHMSA “from improperly delegating their authority to do so to gas pipeline operators like PG&E.” In other words, the San Francisco city attorney is requesting that a federal judge in San Francisco direct PHMSA to “do its job.”
Ensuring Pipeline Safety Is Complicated To grant the relief the complaint demands, the court must find that the PHMSA has failed to fully discharge its statutory
responsibilities. Any such determination is inextricably inter-twined with a policy debate encompassing the proper level of safety oversight Congress intended the PHMSA to provide and the appropriate safety standards the PHMSA should enforce to fulfill its mandate to promote pipeline safety.
Resolving these issues is well beyond the proper ambit for a judicial body. Society’s desire for perfection with respect to pipeline safety demands that robust debates assessing such critical safety issues as hydrostatic testing, proper pipe engineering and installation, and future infrastructure investment should be conducted. However, allowing these debates to be conducted by legal adversaries, decided by a single judge, and based on legal precedents will not yield optimal results. Rather, the debates should be conducted by legislators and regulatory agencies that are sensitive to the necessary tradeoffs between ensuring reliable natural gas supply at the lowest possible cost while best ensuring public safety.
Litigation Produces Illusory Bene� tsWe assume that the San Francisco city attorney sincerely be-lieves that prevailing in the litigation will increase pipeline safety and thus directly benefit his constituents and at least indirectly benefit the greater populace. However, the sup-posed linkage between a judicial declaration directing the PHMSA to act in accordance with its statutory responsibilities and advancing the objective of increased safety is at best an abstract theory predicated on the dubious assumptions that perfection in promulgating and enforcing regulations can be achieved and that achieving such perfection will guarantee absolute safety.
In any event, while the possible benefits of prevailing in the litigation are amorphous at best, the costs are real and detri-mental. The PHMSA’s defense of the City of San Francisco lawsuit will require it to divert already constrained financial and human resources from enforcing safety regulations to producing docu-ments and being deposed.
Instead, lobbying Congress to provide the PHMSA with suf-ficient funding to accomplish its statutory responsibilities would provide the City of San Francisco with a more positive approach to reach the results that it seeks through this law-suit. After all, an agency can only take steps to ensure safety if it is correspondingly provided a sufficient budget.
Just as the San Bruno tragedy served to jumpstart the na-tional debate on pipeline safety, the City of San Francisco’s lawsuit may at least serve to ensure that the focus of national lawmakers is not diverted from this very important issue with the passage of time. However, actual tangible benefits de-rived directly from the lawsuit seem unlikely. ■
—Vidhya Prabhakaran ([email protected]) is an as-sociate in Davis Wright Tremaine’s Energy Practice Group.

VISUALIZE SUSTAINABLE POWER
Sometimes the solution you are looking for is right in front of you. As the need to meet more demanding renewable energy standards increases, photovoltaic plants have emerged as a reliable, bankable investment. With the industry’s best solar inverter technology and the experience to support utilities and EPCs alike, SMA helps visionary power professionals conquer the challenges of utility-scale PV. When it’s time for your next project, choose an SMA inverter and envision the possibilities.
SMA Power Plant Solutions
Call 888 476 2872
Energy That Changes
www.SMA-America.com
CIRCLE 16 ON READER SERVICE CARD
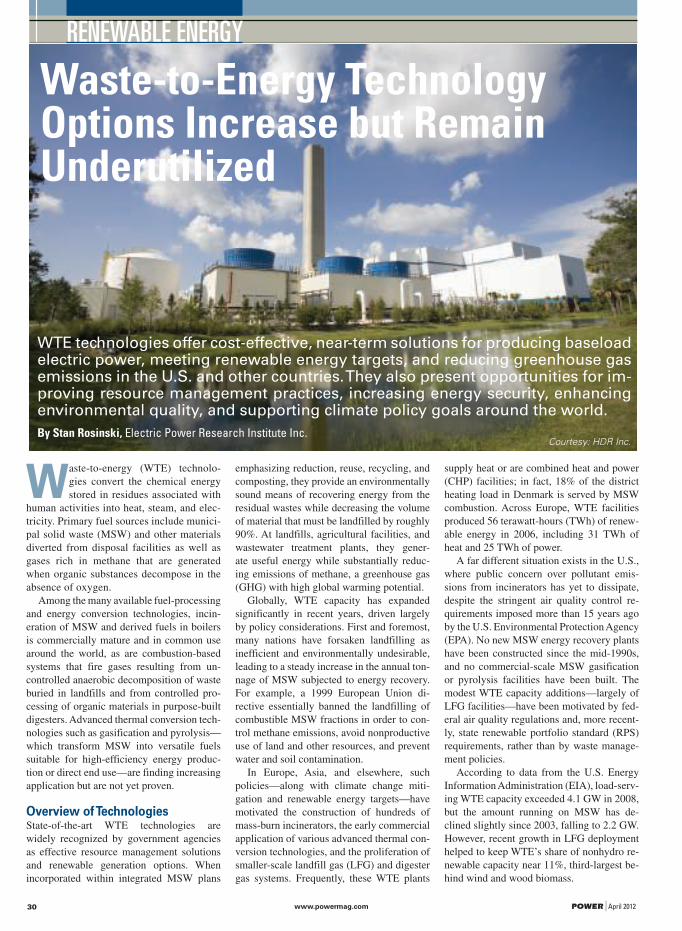
www.powermag.com POWER | April 201230
RENEWABLE ENERGY
Waste-to-Energy Technology Options Increase but Remain Underutilized
Waste-to-energy (WTE) technolo-
gies convert the chemical energy
stored in residues associated with
human activities into heat, steam, and elec-
tricity. Primary fuel sources include munici-
pal solid waste (MSW) and other materials
diverted from disposal facilities as well as
gases rich in methane that are generated
when organic substances decompose in the
absence of oxygen.
Among the many available fuel-processing
and energy conversion technologies, incin-
eration of MSW and derived fuels in boilers
is commercially mature and in common use
around the world, as are combustion-based
systems that fire gases resulting from un-
controlled anaerobic decomposition of waste
buried in landfills and from controlled pro-
cessing of organic materials in purpose-built
digesters. Advanced thermal conversion tech-
nologies such as gasification and pyrolysis—
which transform MSW into versatile fuels
suitable for high-efficiency energy produc-
tion or direct end use—are finding increasing
application but are not yet proven.
Overview of TechnologiesState-of-the-art WTE technologies are
widely recognized by government agencies
as effective resource management solutions
and renewable generation options. When
incorporated within integrated MSW plans
emphasizing reduction, reuse, recycling, and
composting, they provide an environmentally
sound means of recovering energy from the
residual wastes while decreasing the volume
of material that must be landfilled by roughly
90%. At landfills, agricultural facilities, and
wastewater treatment plants, they gener-
ate useful energy while substantially reduc-
ing emissions of methane, a greenhouse gas
(GHG) with high global warming potential.
Globally, WTE capacity has expanded
significantly in recent years, driven largely
by policy considerations. First and foremost,
many nations have forsaken landfilling as
inefficient and environmentally undesirable,
leading to a steady increase in the annual ton-
nage of MSW subjected to energy recovery.
For example, a 1999 European Union di-
rective essentially banned the landfilling of
combustible MSW fractions in order to con-
trol methane emissions, avoid nonproductive
use of land and other resources, and prevent
water and soil contamination.
In Europe, Asia, and elsewhere, such
policies—along with climate change miti-
gation and renewable energy targets—have
motivated the construction of hundreds of
mass-burn incinerators, the early commercial
application of various advanced thermal con-
version technologies, and the proliferation of
smaller-scale landfill gas (LFG) and digester
gas systems. Frequently, these WTE plants
supply heat or are combined heat and power
(CHP) facilities; in fact, 18% of the district
heating load in Denmark is served by MSW
combustion. Across Europe, WTE facilities
produced 56 terawatt-hours (TWh) of renew-
able energy in 2006, including 31 TWh of
heat and 25 TWh of power.
A far different situation exists in the U.S.,
where public concern over pollutant emis-
sions from incinerators has yet to dissipate,
despite the stringent air quality control re-
quirements imposed more than 15 years ago
by the U.S. Environmental Protection Agency
(EPA). No new MSW energy recovery plants
have been constructed since the mid-1990s,
and no commercial-scale MSW gasification
or pyrolysis facilities have been built. The
modest WTE capacity additions—largely of
LFG facilities—have been motivated by fed-
eral air quality regulations and, more recent-
ly, state renewable portfolio standard (RPS)
requirements, rather than by waste manage-
ment policies.
According to data from the U.S. Energy
Information Administration (EIA), load-serv-
ing WTE capacity exceeded 4.1 GW in 2008,
but the amount running on MSW has de-
clined slightly since 2003, falling to 2.2 GW.
However, recent growth in LFG deployment
helped to keep WTE’s share of nonhydro re-
newable capacity near 11%, third-largest be-
hind wind and wood biomass.
Courtesy: HDR Inc.
WTE technologies offer cost-effective, near-term solutions for producing baseload electric power, meeting renewable energy targets, and reducing greenhouse gas emissions in the U.S. and other countries. They also present opportunities for im-proving resource management practices, increasing energy security, enhancing environmental quality, and supporting climate policy goals around the world.
By Stan Rosinski, Electric Power Research Institute Inc.
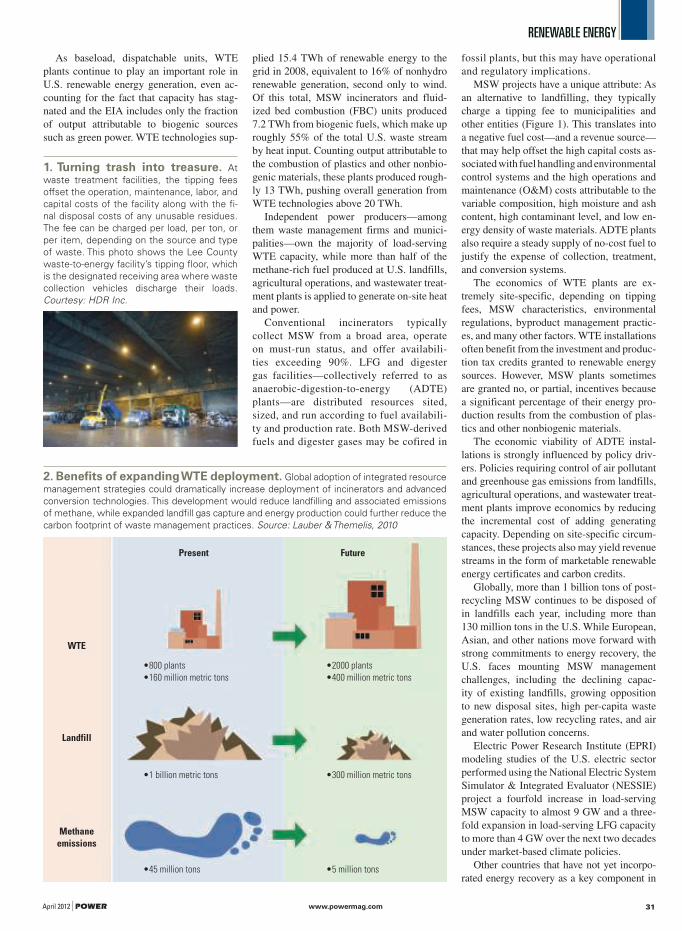
RENEWABLE ENERGY
April 2012 | POWER www.powermag.com 31
As baseload, dispatchable units, WTE
plants continue to play an important role in
U.S. renewable energy generation, even ac-
counting for the fact that capacity has stag-
nated and the EIA includes only the fraction
of output attributable to biogenic sources
such as green power. WTE technologies sup-
plied 15.4 TWh of renewable energy to the
grid in 2008, equivalent to 16% of nonhydro
renewable generation, second only to wind.
Of this total, MSW incinerators and fluid-
ized bed combustion (FBC) units produced
7.2 TWh from biogenic fuels, which make up
roughly 55% of the total U.S. waste stream
by heat input. Counting output attributable to
the combustion of plastics and other nonbio-
genic materials, these plants produced rough-
ly 13 TWh, pushing overall generation from
WTE technologies above 20 TWh.
Independent power producers—among
them waste management firms and munici-
palities—own the majority of load-serving
WTE capacity, while more than half of the
methane-rich fuel produced at U.S. landfills,
agricultural operations, and wastewater treat-
ment plants is applied to generate on-site heat
and power.
Conventional incinerators typically
collect MSW from a broad area, operate
on must-run status, and offer availabili-
ties exceeding 90%. LFG and digester
gas facilities—collectively referred to as
anaerobic-digestion-to-energy (ADTE)
plants—are distributed resources sited,
sized, and run according to fuel availabili-
ty and production rate. Both MSW-derived
fuels and digester gases may be cofired in
fossil plants, but this may have operational
and regulatory implications.
MSW projects have a unique attribute: As
an alternative to landfilling, they typically
charge a tipping fee to municipalities and
other entities (Figure 1). This translates into
a negative fuel cost—and a revenue source—
that may help offset the high capital costs as-
sociated with fuel handling and environmental
control systems and the high operations and
maintenance (O&M) costs attributable to the
variable composition, high moisture and ash
content, high contaminant level, and low en-
ergy density of waste materials. ADTE plants
also require a steady supply of no-cost fuel to
justify the expense of collection, treatment,
and conversion systems.
The economics of WTE plants are ex-
tremely site-specific, depending on tipping
fees, MSW characteristics, environmental
regulations, byproduct management practic-
es, and many other factors. WTE installations
often benefit from the investment and produc-
tion tax credits granted to renewable energy
sources. However, MSW plants sometimes
are granted no, or partial, incentives because
a significant percentage of their energy pro-
duction results from the combustion of plas-
tics and other nonbiogenic materials.
The economic viability of ADTE instal-
lations is strongly influenced by policy driv-
ers. Policies requiring control of air pollutant
and greenhouse gas emissions from landfills,
agricultural operations, and wastewater treat-
ment plants improve economics by reducing
the incremental cost of adding generating
capacity. Depending on site-specific circum-
stances, these projects also may yield revenue
streams in the form of marketable renewable
energy certificates and carbon credits.
Globally, more than 1 billion tons of post-
recycling MSW continues to be disposed of
in landfills each year, including more than
130 million tons in the U.S. While European,
Asian, and other nations move forward with
strong commitments to energy recovery, the
U.S. faces mounting MSW management
challenges, including the declining capac-
ity of existing landfills, growing opposition
to new disposal sites, high per-capita waste
generation rates, low recycling rates, and air
and water pollution concerns.
Electric Power Research Institute (EPRI)
modeling studies of the U.S. electric sector
performed using the National Electric System
Simulator & Integrated Evaluator (NESSIE)
project a fourfold increase in load-serving
MSW capacity to almost 9 GW and a three-
fold expansion in load-serving LFG capacity
to more than 4 GW over the next two decades
under market-based climate policies.
Other countries that have not yet incorpo-
rated energy recovery as a key component in
1. Turning trash into treasure. At
waste treatment facilities, the tipping fees
offset the operation, maintenance, labor, and
capital costs of the facility along with the fi-
nal disposal costs of any unusable residues.
The fee can be charged per load, per ton, or
per item, depending on the source and type
of waste. This photo shows the Lee County
waste-to-energy facility’s tipping floor, which
is the designated receiving area where waste
collection vehicles discharge their loads.
Courtesy: HDR Inc.
2. Benefits of expanding WTE deployment. Global adoption of integrated resource
management strategies could dramatically increase deployment of incinerators and advanced
conversion technologies. This development would reduce landfilling and associated emissions
of methane, while expanded landfill gas capture and energy production could further reduce the
carbon footprint of waste management practices. Source: Lauber & Themelis, 2010
Present Future
WTE
Landfill
Methane
emissions
•800 plants•160 million metric tons
•1 billion metric tons
•45 million tons
•2000 plants•400 million metric tons
•300 million metric tons
•5 million tons
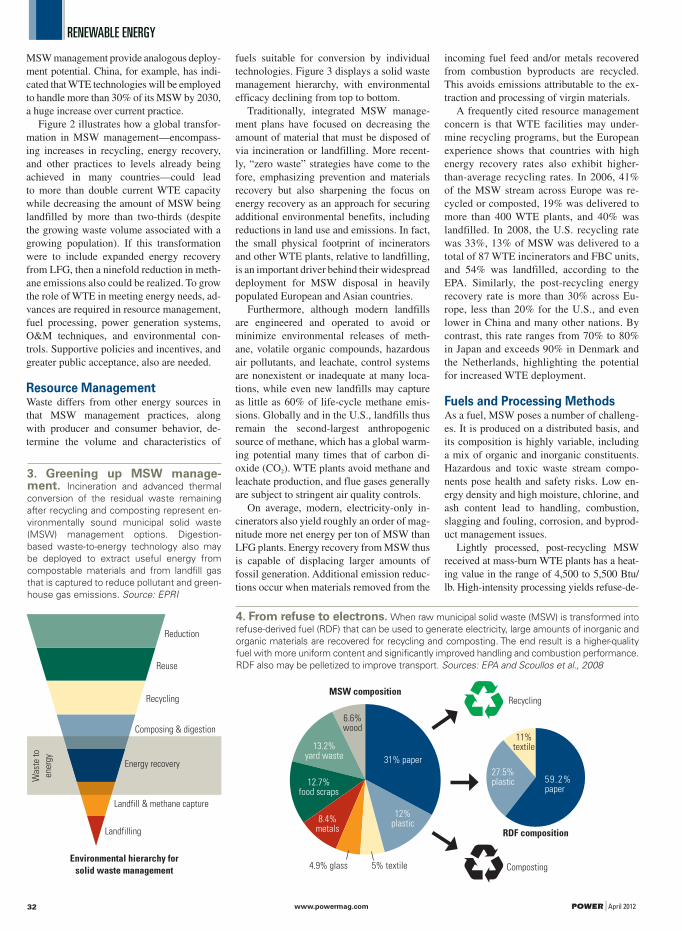
RENEWABLE ENERGY
www.powermag.com POWER | April 201232
MSW management provide analogous deploy-
ment potential. China, for example, has indi-
cated that WTE technologies will be employed
to handle more than 30% of its MSW by 2030,
a huge increase over current practice.
Figure 2 illustrates how a global transfor-
mation in MSW management—encompass-
ing increases in recycling, energy recovery,
and other practices to levels already being
achieved in many countries—could lead
to more than double current WTE capacity
while decreasing the amount of MSW being
landfilled by more than two-thirds (despite
the growing waste volume associated with a
growing population). If this transformation
were to include expanded energy recovery
from LFG, then a ninefold reduction in meth-
ane emissions also could be realized. To grow
the role of WTE in meeting energy needs, ad-
vances are required in resource management,
fuel processing, power generation systems,
O&M techniques, and environmental con-
trols. Supportive policies and incentives, and
greater public acceptance, also are needed.
Resource ManagementWaste differs from other energy sources in
that MSW management practices, along
with producer and consumer behavior, de-
termine the volume and characteristics of
fuels suitable for conversion by individual
technologies. Figure 3 displays a solid waste
management hierarchy, with environmental
efficacy declining from top to bottom.
Traditionally, integrated MSW manage-
ment plans have focused on decreasing the
amount of material that must be disposed of
via incineration or landfilling. More recent-
ly, “zero waste” strategies have come to the
fore, emphasizing prevention and materials
recovery but also sharpening the focus on
energy recovery as an approach for securing
additional environmental benefits, including
reductions in land use and emissions. In fact,
the small physical footprint of incinerators
and other WTE plants, relative to landfilling,
is an important driver behind their widespread
deployment for MSW disposal in heavily
populated European and Asian countries.
Furthermore, although modern landfills
are engineered and operated to avoid or
minimize environmental releases of meth-
ane, volatile organic compounds, hazardous
air pollutants, and leachate, control systems
are nonexistent or inadequate at many loca-
tions, while even new landfills may capture
as little as 60% of life-cycle methane emis-
sions. Globally and in the U.S., landfills thus
remain the second-largest anthropogenic
source of methane, which has a global warm-
ing potential many times that of carbon di-
oxide (CO2). WTE plants avoid methane and
leachate production, and flue gases generally
are subject to stringent air quality controls.
On average, modern, electricity-only in-
cinerators also yield roughly an order of mag-
nitude more net energy per ton of MSW than
LFG plants. Energy recovery from MSW thus
is capable of displacing larger amounts of
fossil generation. Additional emission reduc-
tions occur when materials removed from the
incoming fuel feed and/or metals recovered
from combustion byproducts are recycled.
This avoids emissions attributable to the ex-
traction and processing of virgin materials.
A frequently cited resource management
concern is that WTE facilities may under-
mine recycling programs, but the European
experience shows that countries with high
energy recovery rates also exhibit higher-
than-average recycling rates. In 2006, 41%
of the MSW stream across Europe was re-
cycled or composted, 19% was delivered to
more than 400 WTE plants, and 40% was
landfilled. In 2008, the U.S. recycling rate
was 33%, 13% of MSW was delivered to a
total of 87 WTE incinerators and FBC units,
and 54% was landfilled, according to the
EPA. Similarly, the post-recycling energy
recovery rate is more than 30% across Eu-
rope, less than 20% for the U.S., and even
lower in China and many other nations. By
contrast, this rate ranges from 70% to 80%
in Japan and exceeds 90% in Denmark and
the Netherlands, highlighting the potential
for increased WTE deployment.
Fuels and Processing MethodsAs a fuel, MSW poses a number of challeng-
es. It is produced on a distributed basis, and
its composition is highly variable, including
a mix of organic and inorganic constituents.
Hazardous and toxic waste stream compo-
nents pose health and safety risks. Low en-
ergy density and high moisture, chlorine, and
ash content lead to handling, combustion,
slagging and fouling, corrosion, and byprod-
uct management issues.
Lightly processed, post-recycling MSW
received at mass-burn WTE plants has a heat-
ing value in the range of 4,500 to 5,500 Btu/
lb. High-intensity processing yields refuse-de-
Reduction
Reuse
Recycling
Composing & digestion
Energy recovery
Landfill & methane capture
Landfilling
Was
te t
o
ener
gy
Environmental hierarchy for
solid waste management
3. Greening up MSW manage-ment. Incineration and advanced thermal
conversion of the residual waste remaining
after recycling and composting represent en-
vironmentally sound municipal solid waste
(MSW) management options. Digestion-
based waste-to-energy technology also may
be deployed to extract useful energy from
compostable materials and from landfill gas
that is captured to reduce pollutant and green-
house gas emissions. Source: EPRI
4. From refuse to electrons. When raw municipal solid waste (MSW) is transformed into
refuse-derived fuel (RDF) that can be used to generate electricity, large amounts of inorganic and
organic materials are recovered for recycling and composting. The end result is a higher-quality
fuel with more uniform content and significantly improved handling and combustion performance.
RDF also may be pelletized to improve transport. Sources: EPA and Scoullos et al., 2008
31% paper
59.2% paper
12% plastic
27.5% plastic
5% textile4.9% glass
11% textile
8.4% metals
12.7% food scraps
13.2% yard waste
6.6% wood
Recycling
RDF composition
Composting
MSW composition

RENEWABLE ENERGY
April 2012 | POWER www.powermag.com 33
rived fuel (RDF)—also known as solid recov-
ered fuel—which is more amenable to firing
in FBC units and advanced thermal conver-
sion systems and offers the potential for high-
rate cofiring in pulverized coal plants.
Mechanical, magnetic, thermal, biologi-
cal, and other techniques may be applied to
isolate and process combustible fractions.
Residual waste—mainly a mixture of pa-
per and plastics—is pulverized and dried to
form a fluffy material of relatively uniform
consistency with a heating value of roughly
5,500 to 6,500 Btu/lb (Figure 4). RDF may
be packed as cubes or pellets for easy storage
and transportation.
Processed engineered fuel (PEF) refers to
higher-grade RDF produced from sorted and
mechanically processed wastes, such as pack-
aging materials and tires, and from custom
blends of paper, plastic, and other materials.
The higher energy density, improved han-
dling characteristics, and reduced moisture
and ash content of derived fuels translate into
lower heat rates and O&M costs. Of course,
realizing these benefits has impacts, in that in-
stalling and operating fuel-processing systems
at the plant site imposes energy and cost pen-
alties. Centralized manufacturing of higher-
grade fuels offers potential economies of scale,
while source-based production creates oppor-
tunities to reduce hauling costs and facilitate
long-distance trade. RPS eligibility remains an
issue for individual fuel formulations.
For ADTE technologies, the digestion pro-
cess relies on anaerobic bacteria that break
down organic materials into sugars, acids,
and then gases, leaving behind liquid and sol-
id residues. Decomposition occurs over years
to decades in landfills and days to weeks in
purpose-built digesters.
Produced at atmospheric pressure and
saturated with water, digester gas typically
must be compressed, dehydrated, and treated.
Depending on the fuel and power generation
option, extensive pretreatment may be re-
quired to remove siloxane, hydrogen sulfide,
and other constituents with potential to cause
corrosion, erosion, environmental control,
and odor problems. Further cleaning and pu-
rification are necessary to achieve the quality
required for injection of pipeline-quality re-
newable fuel in natural gas delivery systems.
Generation TechnologiesWTE technologies come in different forms,
offer a variety of outputs, and are in various
stages of development, but they have two
common objectives: to both manage waste
and generate energy. Conventional combus-
tion-based processes transform solid wastes
into heat for direct use or further conversion
into steam and electricity, while advanced
conversion processes convert solids into gas-
eous or liquid fuels offering broader utility.
Figure 5 displays the status of a broad range
of WTE technologies, showing the extent to
which public-private investment is required
to yield commercially mature systems.
Comparing the economic, energy, and en-
vironmental performance of individual WTE
technologies on a consistent basis is extreme-
ly difficult. Traditionally, incineration and
other options have been evaluated on the ba-
sis of $/ton of MSW disposed in comparison
to the cost of landfilling or on their ability
to meet the objectives of integrated resource
management plans, rather than on the $/kW
and $/MWh metrics commonly used in the
power industry.
From an energy recovery perspective,
producing hot water for direct use in district
heating is the simplest and highest-efficiency
approach for MSW, with a net level exceed-
ing 60%. Generating steam for district or in-
dustrial process heating or CHP applications
is somewhat less efficient, while cofiring
RDF and PEF in coal plants further reduces
conversion efficiency to around 30%. Steam-
electric power generation in a dedicated
incinerator or FBC plant offers low efficien-
cy—around 20% or less—due primarily to
fuel properties, boiler design and size, and
heat losses, as well as reduced net power
export due to parasitic energy consumption
required by environmental control systems.
MSW conversion processes yielding gas-
eous fuels suitable for firing in combustion
turbines and combined-cycle plants offer
potential for substantial gains in electricity
production efficiency.
Conventional Thermal ConversionMass-burn incineration, the simplest and
lowest-cost option for electricity production,
also accounts for the overwhelming majority
of installed WTE capacity.
FBC technology offers higher conversion
efficiency and lower pollutant emissions, but
its application has been constrained by the
limited availability and higher cost of RDF.
Higher-quality fuel is required to maintain
stable combustion conditions in these sys-
tems because they have a much shorter resi-
dence time.
For both types of plants, steam serves a tur-
bine-generator train, and power flows through
a transmission-class substation onto the grid,
as shown in Figure 6. Net electrical output is
roughly 550 to 600 kWh/ton of MSW. Turbine
exhaust is directed to a condenser for cooling,
but in cogeneration applications heat may be
extracted and water or steam fed to a distri-
bution system for district or process heating.
Conventional wet cooling systems may re-
quire significant amounts of water. Air-cooled
condensers can reduce water consumption by
up to 90% while imposing parasitic loads that
increase generation costs.
Advanced Thermal ConversionFor advanced thermal conversion technolo-
gies, design goals are to increase materi-
als recovery and recycling rates, improve
the quality of recyclables, simplify flue gas
cleanup, and reduce the quantity and improve
the quality of solid byproducts that must be
disposed of via landfill. There are three ad-
vanced thermal conversion processes of im-
portance:
■ Pyrolysis involves energy-assisted heating
of MSW in the absence of oxygen within a
range of about 400C to 800C. Byproducts
include volatile liquids and syngas—with
relative proportions determined by process
temperature—plus a blend consisting pri-
marily of metals that may be recycled and
char that may be used for energy recovery
or beneficial applications.
MSW pretreatment
An
tic
ipa
ted
co
st o
f fu
ll-s
ca
le a
pp
lic
ati
on
Carbon capture
MSW natural gas hybrid cycles
Renewable gas for transportation
MSW plasma arc gasification
MSW pyrolysis
MSW gasification
Advanced emission controls
ADTE-LFG & digester gasRDF/PEF cofiring
High-efficiency energy-materials
recovery
MSW mass burn
Research Development Demonstration Deployment Mature technology
Time
Notes: ADTE= anaerobic digestion to energy, LFG= landfill gas, MSW= municipal solid waste,
RDF= refuse-derived fuel, PEF= process-engineered fuel.
5. Maturing at different rates. WTE technologies are at varying stages of development
and commercial maturity, as shown by this Grubb curve. Source: EPRI
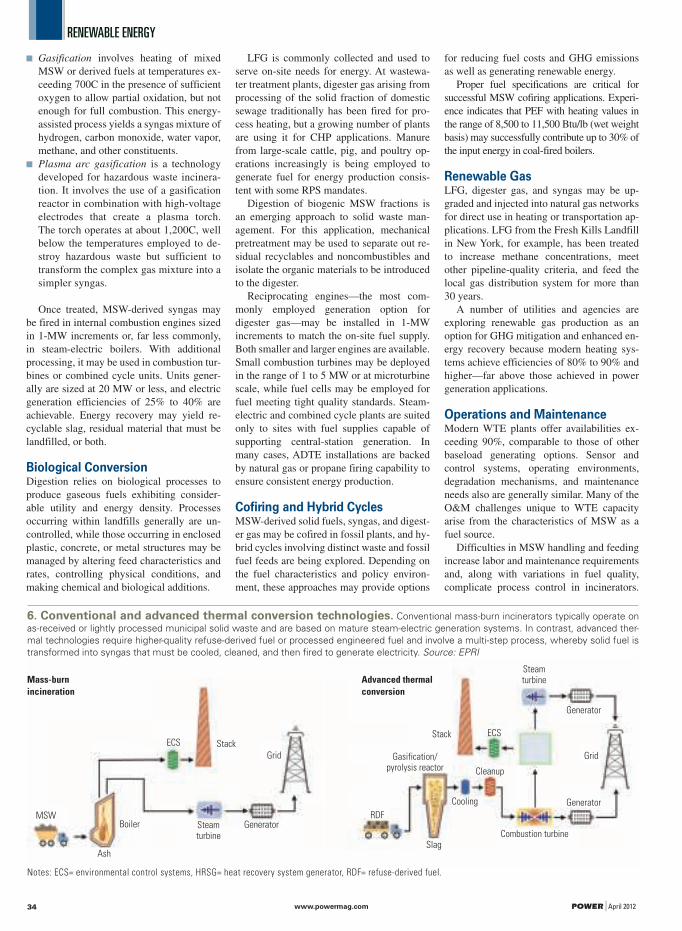
RENEWABLE ENERGY
www.powermag.com POWER | April 201234
■ Gasification involves heating of mixed
MSW or derived fuels at temperatures ex-
ceeding 700C in the presence of sufficient
oxygen to allow partial oxidation, but not
enough for full combustion. This energy-
assisted process yields a syngas mixture of
hydrogen, carbon monoxide, water vapor,
methane, and other constituents.
■ Plasma arc gasification is a technology
developed for hazardous waste incinera-
tion. It involves the use of a gasification
reactor in combination with high-voltage
electrodes that create a plasma torch.
The torch operates at about 1,200C, well
below the temperatures employed to de-
stroy hazardous waste but sufficient to
transform the complex gas mixture into a
simpler syngas.
Once treated, MSW-derived syngas may
be fired in internal combustion engines sized
in 1-MW increments or, far less commonly,
in steam-electric boilers. With additional
processing, it may be used in combustion tur-
bines or combined cycle units. Units gener-
ally are sized at 20 MW or less, and electric
generation efficiencies of 25% to 40% are
achievable. Energy recovery may yield re-
cyclable slag, residual material that must be
landfilled, or both.
Biological ConversionDigestion relies on biological processes to
produce gaseous fuels exhibiting consider-
able utility and energy density. Processes
occurring within landfills generally are un-
controlled, while those occurring in enclosed
plastic, concrete, or metal structures may be
managed by altering feed characteristics and
rates, controlling physical conditions, and
making chemical and biological additions.
LFG is commonly collected and used to
serve on-site needs for energy. At wastewa-
ter treatment plants, digester gas arising from
processing of the solid fraction of domestic
sewage traditionally has been fired for pro-
cess heating, but a growing number of plants
are using it for CHP applications. Manure
from large-scale cattle, pig, and poultry op-
erations increasingly is being employed to
generate fuel for energy production consis-
tent with some RPS mandates.
Digestion of biogenic MSW fractions is
an emerging approach to solid waste man-
agement. For this application, mechanical
pretreatment may be used to separate out re-
sidual recyclables and noncombustibles and
isolate the organic materials to be introduced
to the digester.
Reciprocating engines—the most com-
monly employed generation option for
digester gas—may be installed in 1-MW
increments to match the on-site fuel supply.
Both smaller and larger engines are available.
Small combustion turbines may be deployed
in the range of 1 to 5 MW or at microturbine
scale, while fuel cells may be employed for
fuel meeting tight quality standards. Steam-
electric and combined cycle plants are suited
only to sites with fuel supplies capable of
supporting central-station generation. In
many cases, ADTE installations are backed
by natural gas or propane firing capability to
ensure consistent energy production.
Cofiring and Hybrid CyclesMSW-derived solid fuels, syngas, and digest-
er gas may be cofired in fossil plants, and hy-
brid cycles involving distinct waste and fossil
fuel feeds are being explored. Depending on
the fuel characteristics and policy environ-
ment, these approaches may provide options
for reducing fuel costs and GHG emissions
as well as generating renewable energy.
Proper fuel specifications are critical for
successful MSW cofiring applications. Experi-
ence indicates that PEF with heating values in
the range of 8,500 to 11,500 Btu/lb (wet weight
basis) may successfully contribute up to 30% of
the input energy in coal-fired boilers.
Renewable GasLFG, digester gas, and syngas may be up-
graded and injected into natural gas networks
for direct use in heating or transportation ap-
plications. LFG from the Fresh Kills Landfill
in New York, for example, has been treated
to increase methane concentrations, meet
other pipeline-quality criteria, and feed the
local gas distribution system for more than
30 years.
A number of utilities and agencies are
exploring renewable gas production as an
option for GHG mitigation and enhanced en-
ergy recovery because modern heating sys-
tems achieve efficiencies of 80% to 90% and
higher—far above those achieved in power
generation applications.
Operations and MaintenanceModern WTE plants offer availabilities ex-
ceeding 90%, comparable to those of other
baseload generating options. Sensor and
control systems, operating environments,
degradation mechanisms, and maintenance
needs also are generally similar. Many of the
O&M challenges unique to WTE capacity
arise from the characteristics of MSW as a
fuel source.
Difficulties in MSW handling and feeding
increase labor and maintenance requirements
and, along with variations in fuel quality,
complicate process control in incinerators.
Mass-burn
incineration
Advanced thermal
conversion
ECS Stack
Grid
GeneratorSteam turbine
Boiler
Ash
MSW
ECSStack
Grid
Generator
Steam turbine
Generator
Cleanup
Cooling
Slag
Gasification/ pyrolysis reactor
Combustion turbine
RDF
6. Conventional and advanced thermal conversion technologies. Conventional mass-burn incinerators typically operate on
as-received or lightly processed municipal solid waste and are based on mature steam-electric generation systems. In contrast, advanced ther-
mal technologies require higher-quality refuse-derived fuel or processed engineered fuel and involve a multi-step process, whereby solid fuel is
transformed into syngas that must be cooled, cleaned, and then fired to generate electricity. Source: EPRI
Notes: ECS= environmental control systems, HRSG= heat recovery system generator, RDF= refuse-derived fuel.
513_R&S_Worth_Doing_Ad_PM_PE.indd 1 1/18/11 10:40 PM

If a job’s worth doing, it’s worth doing with Roberts & Schaefer.
222 South Riverside PlazaChicago, IL 60606312.236.7292 www.r-s.com
Offices also in Salt Lake City, Pittsburgh, Australia, Indonesia, Poland, India, Chile and Africa
W I T H M I L L I O N S O F D O L L A R S O N T H E L I N E , W H Y
T R U S T Y O U R P R O J E C T T O A N Y O N E B U T R & S ?
Since 1903, Roberts & Schaefer has been a world leader in the
design, engineering, procurement and construction of bulk material
handling, coal preparation, and fuel blending systems. We provide
total solutions for fuel handling, as well as limestone handling
and grinding for CFB boilers, limestone and gypsum handling
for FGD scrubbers, and ash handling systems. We’ve successfully
completed projects in 40 countries, on six continents, and we’re
just getting warmed up.
Whether it’s complete system development, upgrades,
or modifications, it’s worth making a call to R&S.
513_R&S_Worth_Doing_Ad_PM_PE.indd 1 1/18/11 10:40 PM
CIRCLE 17 ON READER SERVICE CARD
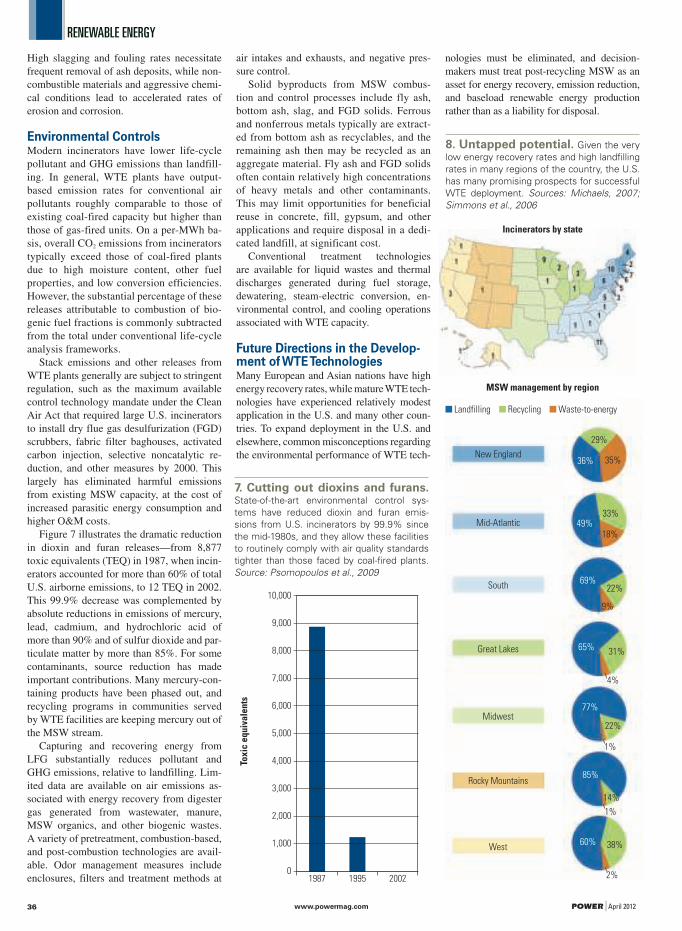
RENEWABLE ENERGY
www.powermag.com POWER | April 201236
High slagging and fouling rates necessitate
frequent removal of ash deposits, while non-
combustible materials and aggressive chemi-
cal conditions lead to accelerated rates of
erosion and corrosion.
Environmental ControlsModern incinerators have lower life-cycle
pollutant and GHG emissions than landfill-
ing. In general, WTE plants have output-
based emission rates for conventional air
pollutants roughly comparable to those of
existing coal-fired capacity but higher than
those of gas-fired units. On a per-MWh ba-
sis, overall CO2 emissions from incinerators
typically exceed those of coal-fired plants
due to high moisture content, other fuel
properties, and low conversion efficiencies.
However, the substantial percentage of these
releases attributable to combustion of bio-
genic fuel fractions is commonly subtracted
from the total under conventional life-cycle
analysis frameworks.
Stack emissions and other releases from
WTE plants generally are subject to stringent
regulation, such as the maximum available
control technology mandate under the Clean
Air Act that required large U.S. incinerators
to install dry flue gas desulfurization (FGD)
scrubbers, fabric filter baghouses, activated
carbon injection, selective noncatalytic re-
duction, and other measures by 2000. This
largely has eliminated harmful emissions
from existing MSW capacity, at the cost of
increased parasitic energy consumption and
higher O&M costs.
Figure 7 illustrates the dramatic reduction
in dioxin and furan releases—from 8,877
toxic equivalents (TEQ) in 1987, when incin-
erators accounted for more than 60% of total
U.S. airborne emissions, to 12 TEQ in 2002.
This 99.9% decrease was complemented by
absolute reductions in emissions of mercury,
lead, cadmium, and hydrochloric acid of
more than 90% and of sulfur dioxide and par-
ticulate matter by more than 85%. For some
contaminants, source reduction has made
important contributions. Many mercury-con-
taining products have been phased out, and
recycling programs in communities served
by WTE facilities are keeping mercury out of
the MSW stream.
Capturing and recovering energy from
LFG substantially reduces pollutant and
GHG emissions, relative to landfilling. Lim-
ited data are available on air emissions as-
sociated with energy recovery from digester
gas generated from wastewater, manure,
MSW organics, and other biogenic wastes.
A variety of pretreatment, combustion-based,
and post-combustion technologies are avail-
able. Odor management measures include
enclosures, filters and treatment methods at
air intakes and exhausts, and negative pres-
sure control.
Solid byproducts from MSW combus-
tion and control processes include fly ash,
bottom ash, slag, and FGD solids. Ferrous
and nonferrous metals typically are extract-
ed from bottom ash as recyclables, and the
remaining ash then may be recycled as an
aggregate material. Fly ash and FGD solids
often contain relatively high concentrations
of heavy metals and other contaminants.
This may limit opportunities for beneficial
reuse in concrete, fill, gypsum, and other
applications and require disposal in a dedi-
cated landfill, at significant cost.
Conventional treatment technologies
are available for liquid wastes and thermal
discharges generated during fuel storage,
dewatering, steam-electric conversion, en-
vironmental control, and cooling operations
associated with WTE capacity.
Future Directions in the Develop-ment of WTE TechnologiesMany European and Asian nations have high
energy recovery rates, while mature WTE tech-
nologies have experienced relatively modest
application in the U.S. and many other coun-
tries. To expand deployment in the U.S. and
elsewhere, common misconceptions regarding
the environmental performance of WTE tech-
nologies must be eliminated, and decision-
makers must treat post-recycling MSW as an
asset for energy recovery, emission reduction,
and baseload renewable energy production
rather than as a liability for disposal.
7. Cutting out dioxins and furans. State-of-the-art environmental control sys-
tems have reduced dioxin and furan emis-
sions from U.S. incinerators by 99.9% since
the mid-1980s, and they allow these facilities
to routinely comply with air quality standards
tighter than those faced by coal-fired plants.
Source: Psomopoulos et al., 2009
10,000
9,000
8,000
7,000
6,000
5,000
4,000
3,000
2,000
1,000
01987 1995 2002
Tox
ic e
qu
iva
len
ts
8. Untapped potential. Given the very
low energy recovery rates and high landfilling
rates in many regions of the country, the U.S.
has many promising prospects for successful
WTE deployment. Sources: Michaels, 2007;
Simmons et al., 2006
New England
Mid-Atlantic
South
Great Lakes
Midwest
West
29%
36% 35%
33%49%
18%
22%69%
9%
31%65%
4%
22%
77%
1%
14%
85%
1%
38%60%
2%
Rocky Mountains
Incinerators by state
MSW management by region
Landfilling Recycling Waste-to-energy

IS YOUR PLANT OR
SMART GRID PROJECT
A WINNER?
2011 MARMADUKE AWARD:
CFE’s CTG Universidad Unit 2
2011 PLANT OF THE YEAR:
Kansas City Power & Light’s Iatan 2
Nominate it for a Award today!
The Plant of the Year award will be presented to a plant that leads our industry in the successful deployment of advanced
technology—maximizing effi ciency while minimizing environmental impact. In short, the Power Plant of the Year, featured in the August issue of POWER, is the best of class over the past year.
If you know of a power plant or upstream smart grid
project that’s worth bragging about, nominate it for
one of POWER magazine’s annual awards. Projects
anywhere in the world are eligible.
For award criteria details, see the online nomination forms. Award fi nalists and winners will be selected by the editors of POWER
based on nominations submitted by you and your industry peers—suppliers, designers, constructors, and operators of power
plants and smart grid projects.
The Marmaduke Award, named after the legendary plant troubleshooter whose exploits have been chronicled in POWER since 1948, recognizes operations and maintenance excellence
at existing power plants. The Marmaduke Award winner will also be profi led in the August issue.
Top Plants Awards recognize the best in class over the past year in each of four generation categories: gas (September), coal-fi red
(October), nuclear (November), and renewable (December).
The Smart Grid Award will go to the project that best demonstrates the benefi ts of smart grid technology implementation upstream from the end user. The winning project will be profi led in the August issue.
NOMINATIONS ARE DUE MAY 21, 2012.
Read about all the 2011 winners and
download entry forms from www.powermag.com
(under “Also from POWER Magazine”).

RENEWABLE ENERGY
www.powermag.com POWER | April 201238
In addition, the costs and risks of existing
and emerging WTE options must be reduced
through investments in research, develop-
ment, and demonstration (RD&D) to improve
cost-performance characteristics and through
consistent policy and market frameworks that
account for their attributes as renewable en-
ergy and climate mitigation options.
As shown in Figure 8, most U.S. re-
gions continue to landfill much more than
50% of their solid waste. Almost half of
the existing MSW-firing plants are sited in
densely populated northeast states, where
landfill space is at a premium. Since 1996,
no new incinerators have been deployed in
the U.S., leading to an increase in intra-
state MSW transport from sending areas
lacking landfill capacity to more rural re-
ceiving areas. Despite the fact that long-
distance hauling and landfilling result in
higher levels of pollutant and GHG emis-
sions than would energy recovery from a
nearby WTE facility, this trend may con-
tinue as existing disposal sites are closed
and challenges associated with permitting
new landfills in developed areas grow.
Countering this trend is the recent ex-
pansion of a WTE plant in Lee County,
Fla. (Figures 9 and 10), where generating
capacity was augmented from 40 MW to
60 MW to handle the increasing MSW vol-
ume from Ft. Myers and nearby commu-
nities. Efforts to expand existing facilities
are under way elsewhere, and new plants
are being considered across the country.
However, a number of U.S. states main-
tain bans on new MSW incinerators and
are considering extending these bans to
include advanced WTE technologies such
as gasification and pyrolysis.
Relative to landfilling, energy recovery
offers much lower GHG emissions, requires
much less land, and boosts recycling rates.
Stringent regulations, advanced control tech-
nologies, and other measures hold pollutant
emissions from modern incinerators below
the permit limits established to protect envi-
ronmental and human health. Handling prac-
tices—such as using rail rather than truck
transport, employing covered containers, and
unloading MSW inside buildings with nega-
tive pressure control—help address noise,
litter, and odor concerns. WTE technologies
deployed at landfills, treatment plants, and
farms offer an advantage in that they may be
seen as part of an ongoing municipal or agri-
cultural operation.
Comprehensive life-cycle analyses evalu-
ating energy recovery within waste manage-
ment, energy supply, and climate mitigation
contexts are needed to document the benefits
of WTE technologies, while proactive com-
munication with decision-makers, stake-
holder groups, and the public is required to
address concerns and increase acceptance
for individual projects as elements within
integrated resource management strategies.
Science-based information and educational
outreach also are necessary to help ensure
that WTE options are eligible for the invest-
ment and production incentives granted to
renewable energy sources and are designated
as qualifying technologies under RPS man-
dates and other directives.
Cost reduction and further improvement
in environmental performance represent ad-
ditional RD&D priorities. At present, MSW
incinerators are much more costly to build
and operate than coal-fired steam electric
capacity and other baseload generation, and
most WTE plants are economically viable
only because their fuel provides a source of
revenue in the form of tipping fees.
New source separation and MSW pro-
cessing technologies are needed to remove
potentially harmful constituents and to
produce derived and engineered fuels of-
fering improved handling characteristics,
increased energy density, and decreased
moisture and ash content, and reduced
emissions of pollutants and GHGs. These
advances would reduce the capital invest-
ment required for fuel feed and environ-
mental control systems, as well as lower
heat rates and O&M costs for incinerators.
In addition, they would facilitate long-dis-
tance fuel transport, potentially leading to
the siting and construction of larger, more
cost-efficient WTE facilities in rural areas.
Improved fuels also would enable high-
rate MSW cofiring in coal-fired plants, a
potentially low-cost approach for reducing
carbon emissions from existing capacity
while generating renewable energy.
To support deployment of advanced con-
version processes and hybrid plant concepts,
successful commercial-scale demonstrations
are needed to confirm the ability of individ-
ual technologies to handle large amounts of
waste on a reliable basis, in an environmen-
tally sound manner, over an extended period.
Current EPRI projects address several
key areas for growing the role of WTE tech-
nologies in meeting U.S. needs for clean, af-
fordable, reliable, and sustainably produced
electricity. EPRI plans to continue collabora-
tive work with utilities, agencies, and other
stakeholders to identify and pursue near-,
mid-, and long-term RD&D needs and op-
portunities. ■
—Stan Rosinski ([email protected]) is program manager of Renewable Gen-
eration at the Electric Power Research Institute Inc. (EPRI). To access EPRI’s full
“Waste-to-Energy Technology” white paper, go to http://tinyurl.com/7jc4sxs.
9. Leading the way. The Lee County
waste-to-energy (WTE) and recovered materi-
al processing plant, one of the most advanced
solid waste management systems in the U.S.,
burns waste at more than 1,800F. The plant is
equipped with extensive air-pollution control
systems, such as the scrubber shown in the
photo. The Lee County WTE plant is the first
U.S. plant built with a permanent activated
carbon injection system for controlling mer-
cury emissions. Courtesy: HDR Inc.
10. Once is not enough. Adding an ad-
ditional layer of sustainability, the Lee County
WTE plant operates as a zero-discharge facility.
The clarifier at the plant is used to treat recycled
wastewater from a nearby municipal wastewa-
ter treatment plant. Courtesy: HDR Inc.
Energy Products of Idahois now Outotec
www.outotec.com/energyproducts
Outotec innovates, develops and delivers sustainable technology and service solutions to minerals, metals, chemical and energy
industries. Outotec collaborates lifelong with its customers in order to optimize the utilization of raw materials and
energy efficiency as well as to minimize the environmental impact and operating costs.
Outotec Oyj is listed on the NASDAQ OMX Helsinki.
We know you have come to trust EPI for high quality and reliable fuel thermal oxidation and gasification technologies to recover energy from biomass and wastes, and we are committed to making sure that trust only grows stronger.
Under the Outotec umbrella, we increase our global presence and expand our capabilities allowing us to even better meet customer needs worldwide. Now operating as Outotec Energy Products, we can also grow our service offerings for our large existing base of installed technology only further improving the overall quality of service and support you have come to expect.
Contact us: Tel. +1 208 765 1611email: [email protected]
CIRCLE 18 ON READER SERVICE CARD
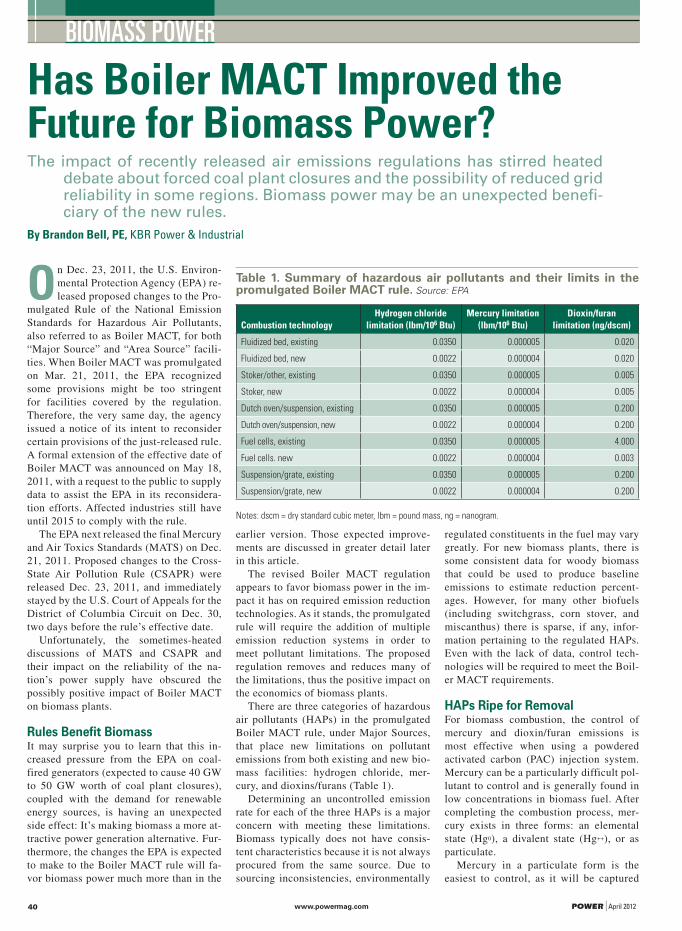
www.powermag.com POWER | April 201240
BIOMASS POWER
Has Boiler MACT Improved the Future for Biomass Power?The impact of recently released air emissions regulations has stirred heated
debate about forced coal plant closures and the possibility of reduced grid reliability in some regions. Biomass power may be an unexpected benefi-ciary of the new rules.
By Brandon Bell, PE, KBR Power & Industrial
On Dec. 23, 2011, the U.S. Environ-
mental Protection Agency (EPA) re-
leased proposed changes to the Pro-
mulgated Rule of the National Emission
Standards for Hazardous Air Pollutants,
also referred to as Boiler MACT, for both
“Major Source” and “Area Source” facili-
ties. When Boiler MACT was promulgated
on Mar. 21, 2011, the EPA recognized
some provisions might be too stringent
for facilities covered by the regulation.
Therefore, the very same day, the agency
issued a notice of its intent to reconsider
certain provisions of the just-released rule.
A formal extension of the effective date of
Boiler MACT was announced on May 18,
2011, with a request to the public to supply
data to assist the EPA in its reconsidera-
tion efforts. Affected industries still have
until 2015 to comply with the rule.
The EPA next released the final Mercury
and Air Toxics Standards (MATS) on Dec.
21, 2011. Proposed changes to the Cross-
State Air Pollution Rule (CSAPR) were
released Dec. 23, 2011, and immediately
stayed by the U.S. Court of Appeals for the
District of Columbia Circuit on Dec. 30,
two days before the rule’s effective date.
Unfortunately, the sometimes-heated
discussions of MATS and CSAPR and
their impact on the reliability of the na-
tion’s power supply have obscured the
possibly positive impact of Boiler MACT
on biomass plants.
Rules Benefit BiomassIt may surprise you to learn that this in-
creased pressure from the EPA on coal-
fired generators (expected to cause 40 GW
to 50 GW worth of coal plant closures),
coupled with the demand for renewable
energy sources, is having an unexpected
side effect: It’s making biomass a more at-
tractive power generation alternative. Fur-
thermore, the changes the EPA is expected
to make to the Boiler MACT rule will fa-
vor biomass power much more than in the
earlier version. Those expected improve-
ments are discussed in greater detail later
in this article.
The revised Boiler MACT regulation
appears to favor biomass power in the im-
pact it has on required emission reduction
technologies. As it stands, the promulgated
rule will require the addition of multiple
emission reduction systems in order to
meet pollutant limitations. The proposed
regulation removes and reduces many of
the limitations, thus the positive impact on
the economics of biomass plants.
There are three categories of hazardous
air pollutants (HAPs) in the promulgated
Boiler MACT rule, under Major Sources,
that place new limitations on pollutant
emissions from both existing and new bio-
mass facilities: hydrogen chloride, mer-
cury, and dioxins/furans (Table 1).
Determining an uncontrolled emission
rate for each of the three HAPs is a major
concern with meeting these limitations.
Biomass typically does not have consis-
tent characteristics because it is not always
procured from the same source. Due to
sourcing inconsistencies, environmentally
regulated constituents in the fuel may vary
greatly. For new biomass plants, there is
some consistent data for woody biomass
that could be used to produce baseline
emissions to estimate reduction percent-
ages. However, for many other biofuels
(including switchgrass, corn stover, and
miscanthus) there is sparse, if any, infor-
mation pertaining to the regulated HAPs.
Even with the lack of data, control tech-
nologies will be required to meet the Boil-
er MACT requirements.
HAPs Ripe for RemovalFor biomass combustion, the control of
mercury and dioxin/furan emissions is
most effective when using a powdered
activated carbon (PAC) injection system.
Mercury can be a particularly difficult pol-
lutant to control and is generally found in
low concentrations in biomass fuel. After
completing the combustion process, mer-
cury exists in three forms: an elemental
state (Hg0), a divalent state (Hg++), or as
particulate.
Mercury in a particulate form is the
easiest to control, as it will be captured
Table 1. Summary of hazardous air pollutants and their limits in the promulgated Boiler MACT rule. Source: EPA
Combustion technology
Hydrogen chloride
limitation (lbm/106 Btu)
Mercury limitation
(lbm/106 Btu)
Dioxin/furan
limitation (ng/dscm)
Fluidized bed, existing 0.0350 0.000005 0.020
Fluidized bed, new 0.0022 0.000004 0.020
Stoker/other, existing 0.0350 0.000005 0.005
Stoker, new 0.0022 0.000004 0.005
Dutch oven/suspension, existing 0.0350 0.000005 0.200
Dutch oven/suspension, new 0.0022 0.000004 0.200
Fuel cells, existing 0.0350 0.000005 4.000
Fuel cells. new 0.0022 0.000004 0.003
Suspension/grate, existing 0.0350 0.000005 0.200
Suspension/grate, new 0.0022 0.000004 0.200
Notes: dscm = dry standard cubic meter, lbm = pound mass, ng = nanogram.

April 2012 | POWER www.powermag.com 41
BIOMASS POWER
in particulate control devices. Oxidized
mercury is water-soluble and will readily
be adsorbed using activated carbon tech-
nologies. Elemental mercury is a very
stable molecule and difficult to remove
from flue gas. Typically, elemental mer-
cury must be forcibly oxidized in order
to promote its capture; otherwise, it most
likely will pass through the boiler and air
quality control systems and be released
into the environment.
Sparse testing for dioxin/furan emis-
sions of biomass sources has been con-
ducted; however, the results of available
data show that emissions for all species of
dioxins and furans are generally insignifi-
cant. Because of the low emission rates,
it is impractical to destroy dioxin/furan
emissions by means of thermal oxidation.
The more realistic removal technique is
sorbent capture and removal by a particu-
late control device. This is another reason
why dioxin/furan emissions for biomass
facilities are best controlled by using PAC
systems. A PAC system will absorb the di-
oxins and furans, which will then be col-
lected in the particulate control device.
The capital cost of a PAC system is es-
timated to be in the $21 to $42/kW range.
Additionally, the average cost for activated
carbon is in the range of $1,000 to $1,500/
ton of sorbent. For industrial-size plants,
this adds a significant capital cost plus a
high operational cost.
Hydrogen chloride (HCl) emissions will
vary greatly, depending on the source of
the biomass fuel. Recent data suggests that
clean woody biomass can achieve uncon-
trolled HCl emissions in the 0.004 to 0.006
lbm/million Btu range. Although these
emissions rates are low, the promulgated
regulation requires additional reduction to
maintain compliance. If a facility requires
control of sulfur dioxide (SO2) emissions,
then control of HCl should not be an issue.
This is because sorbents used to control
SO2 have a greater affinity to react with
HCl over SO2. Therefore, reduced HCl
emissions will be a byproduct of SO2 con-
trol. Biomass fuels, however, are naturally
low in sulfur and do not always require
control of SO2 emissions.
In the absence of SO2 controls, a dry
sorbent injection (DSI) system using lime-
stone, hydrated lime, or sodium-based sor-
bents is most economical and can achieve
the required HCl control. Limestone (cal-
cium carbonate) requires a substantial
amount of heat to reduce hydrogen chlo-
ride into calcium chloride. For this reason,
milled limestone is typically injected into
the furnace for maximum removal effi-
ciency. Hydrated lime (calcium hydrox-
ide) requires less heat for the removal of
HCl and is typically injected into the flue
gas downstream of the furnace. Figure 1
shows the complete reaction for hydrogen
chloride mitigation using limestone and
hydrated lime.
Sodium sorbent injection (trona and
sodium bicarbonate) has also proven ef-
fective for reducing hydrogen chloride
emissions. This class of sorbents requires
a moderate amount of heat (650F to 900F
at the injection point) to effectively re-
move hydrogen chloride. Injection points
will vary from upstream of the economizer
to downstream of the air heater. Figure 2
shows the full reaction, including the cal-
cination of the sodium sorbents.
Unfortunately, some wood fuels and
other biomass fuels contain levels of chlo-
rine that can be an order of magnitude
higher than in clean, woody biomass. In
these cases, sodium-based sorbents may be
the only solution for controlling HCl emis-
sions to regulatory limits. A DSI system
for control of HCl will add an additional
$28 to $63/kW of capital cost to a proj-
ect. Sorbent prices will also vary greatly,
depending on sorbent type and location of
the facility, but will contribute to a signifi-
cant increase in operating cost.
Fortunately, with release of the new
proposed Boiler MACT for Major Sourc-
es, all of these limitations have been re-
moved. If the new proposed regulation is
1. Reducing HCl with lime. Limestone or hydrated lime can be injected into the furnace
to reduce HCl emissions from the burning of biomass. Source: KBR Power & Industrial
Calcium hydroxide (Hydrated lime)
Ca(OH)2
Hydrogen chloride2HCI
Calcium chlorideCaCI2
Carbon DioxideCO2
Water2H2O
+ +
+
HCI removal with limestone
Calcium carbonate (limestone)
CaCO3
Hydrogen chloride2HCI
+Calcium chloride
CaCI2
WaterH2O
+
HCI removal with hydrated lime
Hydrogen chloride2HCI
Carbon DioxideCO2
+
+
CalcinationTrona2• (NaHCO3 • Na2CO3 • 2H2O)
Water5H2O
+
Sodium bicarbonate2NaHCO3
Calcination
Sodium sorbents
Sodium carbonate3Na2CO3
Sodium carbonateNa2CO3
Carbon DioxideCO2
WaterH2O
+
+
HCI acid mitigation
Sodium carbonateNa2CO3
Carbon DioxideCO2
Sodium chloride2NaCI
+
2. Reducing HCl with sodium sorbents. HCl can also be removed from stack
emissions of a biomass-fired furnace by injecting the sorbents trona and sodium bicarbonate.
Source: KBR Power & Industrial
The control of mercury and dioxin/furan emissions is most effective when using a powdered activated carbon injection system.
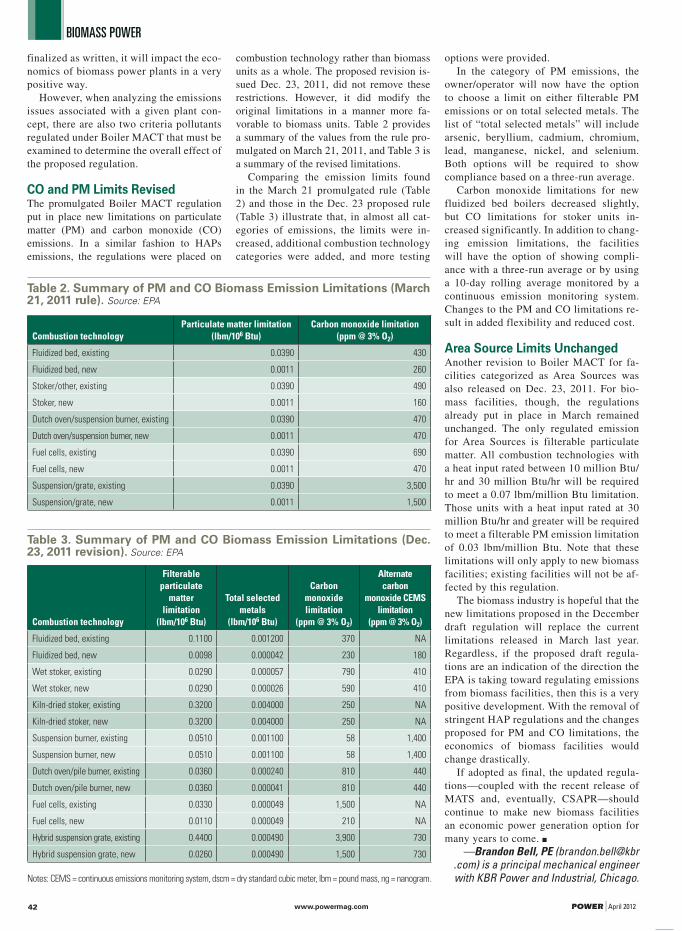
www.powermag.com POWER | April 201242
BIOMASS POWER
finalized as written, it will impact the eco-
nomics of biomass power plants in a very
positive way.
However, when analyzing the emissions
issues associated with a given plant con-
cept, there are also two criteria pollutants
regulated under Boiler MACT that must be
examined to determine the overall effect of
the proposed regulation.
CO and PM Limits RevisedThe promulgated Boiler MACT regulation
put in place new limitations on particulate
matter (PM) and carbon monoxide (CO)
emissions. In a similar fashion to HAPs
emissions, the regulations were placed on
combustion technology rather than biomass
units as a whole. The proposed revision is-
sued Dec. 23, 2011, did not remove these
restrictions. However, it did modify the
original limitations in a manner more fa-
vorable to biomass units. Table 2 provides
a summary of the values from the rule pro-
mulgated on March 21, 2011, and Table 3 is
a summary of the revised limitations.
Comparing the emission limits found
in the March 21 promulgated rule (Table
2) and those in the Dec. 23 proposed rule
(Table 3) illustrate that, in almost all cat-
egories of emissions, the limits were in-
creased, additional combustion technology
categories were added, and more testing
options were provided.
In the category of PM emissions, the
owner/operator will now have the option
to choose a limit on either filterable PM
emissions or on total selected metals. The
list of “total selected metals” will include
arsenic, beryllium, cadmium, chromium,
lead, manganese, nickel, and selenium.
Both options will be required to show
compliance based on a three-run average.
Carbon monoxide limitations for new
fluidized bed boilers decreased slightly,
but CO limitations for stoker units in-
creased significantly. In addition to chang-
ing emission limitations, the facilities
will have the option of showing compli-
ance with a three-run average or by using
a 10-day rolling average monitored by a
continuous emission monitoring system.
Changes to the PM and CO limitations re-
sult in added flexibility and reduced cost.
Area Source Limits UnchangedAnother revision to Boiler MACT for fa-
cilities categorized as Area Sources was
also released on Dec. 23, 2011. For bio-
mass facilities, though, the regulations
already put in place in March remained
unchanged. The only regulated emission
for Area Sources is filterable particulate
matter. All combustion technologies with
a heat input rated between 10 million Btu/
hr and 30 million Btu/hr will be required
to meet a 0.07 lbm/million Btu limitation.
Those units with a heat input rated at 30
million Btu/hr and greater will be required
to meet a filterable PM emission limitation
of 0.03 lbm/million Btu. Note that these
limitations will only apply to new biomass
facilities; existing facilities will not be af-
fected by this regulation.
The biomass industry is hopeful that the
new limitations proposed in the December
draft regulation will replace the current
limitations released in March last year.
Regardless, if the proposed draft regula-
tions are an indication of the direction the
EPA is taking toward regulating emissions
from biomass facilities, then this is a very
positive development. With the removal of
stringent HAP regulations and the changes
proposed for PM and CO limitations, the
economics of biomass facilities would
change drastically.
If adopted as final, the updated regula-
tions—coupled with the recent release of
MATS and, eventually, CSAPR—should
continue to make new biomass facilities
an economic power generation option for
many years to come. ■
—Brandon Bell, PE ([email protected]) is a principal mechanical engineer with KBR Power and Industrial, Chicago.
Combustion technology
Particulate matter limitation
(lbm/106 Btu)
Carbon monoxide limitation
(ppm @ 3% O2)
Fluidized bed, existing 0.0390 430
Fluidized bed, new 0.0011 260
Stoker/other, existing 0.0390 490
Stoker, new 0.0011 160
Dutch oven/suspension burner, existing 0.0390 470
Dutch oven/suspension burner, new 0.0011 470
Fuel cells, existing 0.0390 690
Fuel cells, new 0.0011 470
Suspension/grate, existing 0.0390 3,500
Suspension/grate, new 0.0011 1,500
Table 2. Summary of PM and CO Biomass Emission Limitations (March 21, 2011 rule). Source: EPA
Combustion technology
Filterable
particulate
matter
limitation
(lbm/106 Btu)
Total selected
metals
(lbm/106 Btu)
Carbon
monoxide
limitation
(ppm @ 3% O2)
Alternate
carbon
monoxide CEMS
limitation
(ppm @ 3% O2)
Fluidized bed, existing 0.1100 0.001200 370 NA
Fluidized bed, new 0.0098 0.000042 230 180
Wet stoker, existing 0.0290 0.000057 790 410
Wet stoker, new 0.0290 0.000026 590 410
Kiln-dried stoker, existing 0.3200 0.004000 250 NA
Kiln-dried stoker, new 0.3200 0.004000 250 NA
Suspension burner, existing 0.0510 0.001100 58 1,400
Suspension burner, new 0.0510 0.001100 58 1,400
Dutch oven/pile burner, existing 0.0360 0.000240 810 440
Dutch oven/pile burner, new 0.0360 0.000041 810 440
Fuel cells, existing 0.0330 0.000049 1,500 NA
Fuel cells, new 0.0110 0.000049 210 NA
Hybrid suspension grate, existing 0.4400 0.000490 3,900 730
Hybrid suspension grate, new 0.0260 0.000490 1,500 730
Notes: CEMS = continuous emissions monitoring system, dscm = dry standard cubic meter, lbm = pound mass, ng = nanogram.
Table 3. Summary of PM and CO Biomass Emission Limitations (Dec. 23, 2011 revision). Source: EPA

WE
ST
IN
GH
OU
SE
E
LE
CT
RI
C C
OM
PA
NY
L
LC
w e s t i n g h o u s e A P 1 0 0 0 r e c e i v e s
Final Design certiication.
First and still irst.sixty years ago, westinghouse electric company
established its reputation for nuclear energy technology
leadership with the development of the world’s irst
pressurized water reactor. today, that ongoing tradition
of investment and innovation is again reafirmed.
he us nuclear regulatory commission has granted
Final Design certiication to the westinghouse AP1000
design, the safest and most advanced nuclear energy
plant available in the global marketplace.
hrough the use of advanced-passive safety systems,
the AP1000 reactor is deemed to be 200 times safer than
regulations require. Modular design and standardization
result in stable and predictable construction, fuel and
operating and maintenance costs.
Plus, deployment of the AP1000 reactor will create tens
of thousands of good jobs, including 700 well-paying
permanent jobs to operate each plant. he westinghouse
AP1000 plant is ready to provide future generations with
safe, clean and reliable electricity.
check us out at www.westinghousenuclear.com
CIRCLE 19 ON READER SERVICE CARD
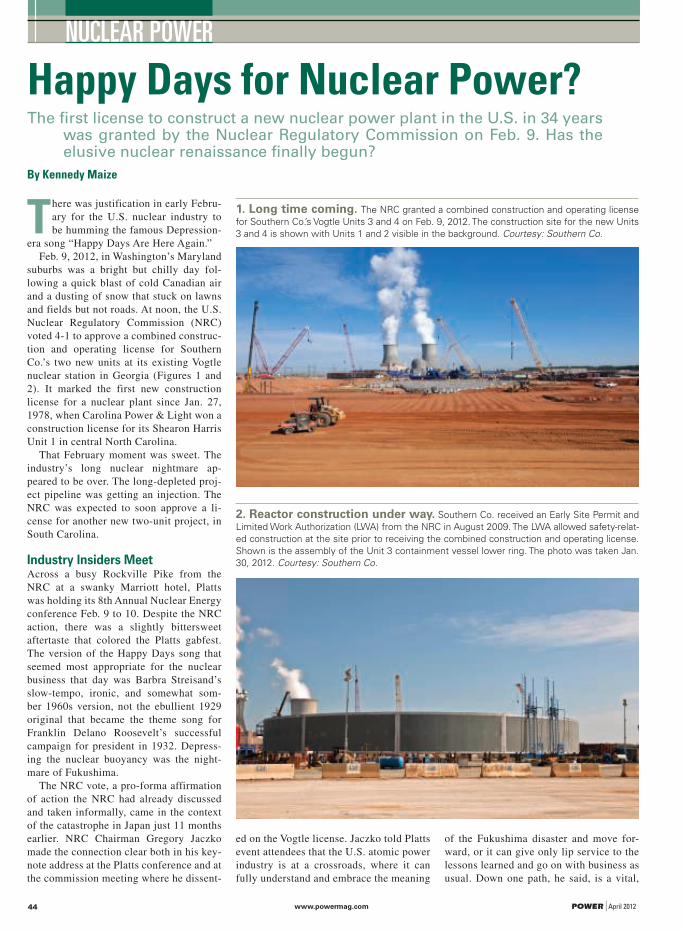
www.powermag.com POWER | April 201244
NUCLEAR POWER
Happy Days for Nuclear Power?The first license to construct a new nuclear power plant in the U.S. in 34 years
was granted by the Nuclear Regulatory Commission on Feb. 9. Has the elusive nuclear renaissance finally begun?
By Kennedy Maize
There was justification in early Febru-
ary for the U.S. nuclear industry to
be humming the famous Depression-
era song “Happy Days Are Here Again.”
Feb. 9, 2012, in Washington’s Maryland
suburbs was a bright but chilly day fol-
lowing a quick blast of cold Canadian air
and a dusting of snow that stuck on lawns
and fields but not roads. At noon, the U.S.
Nuclear Regulatory Commission (NRC)
voted 4-1 to approve a combined construc-
tion and operating license for Southern
Co.’s two new units at its existing Vogtle
nuclear station in Georgia (Figures 1 and
2). It marked the first new construction
license for a nuclear plant since Jan. 27,
1978, when Carolina Power & Light won a
construction license for its Shearon Harris
Unit 1 in central North Carolina.
That February moment was sweet. The
industry’s long nuclear nightmare ap-
peared to be over. The long-depleted proj-
ect pipeline was getting an injection. The
NRC was expected to soon approve a li-
cense for another new two-unit project, in
South Carolina.
Industry Insiders MeetAcross a busy Rockville Pike from the
NRC at a swanky Marriott hotel, Platts
was holding its 8th Annual Nuclear Energy
conference Feb. 9 to 10. Despite the NRC
action, there was a slightly bittersweet
aftertaste that colored the Platts gabfest.
The version of the Happy Days song that
seemed most appropriate for the nuclear
business that day was Barbra Streisand’s
slow-tempo, ironic, and somewhat som-
ber 1960s version, not the ebullient 1929
original that became the theme song for
Franklin Delano Roosevelt’s successful
campaign for president in 1932. Depress-
ing the nuclear buoyancy was the night-
mare of Fukushima.
The NRC vote, a pro-forma affirmation
of action the NRC had already discussed
and taken informally, came in the context
of the catastrophe in Japan just 11 months
earlier. NRC Chairman Gregory Jaczko
made the connection clear both in his key-
note address at the Platts conference and at
the commission meeting where he dissent-
ed on the Vogtle license. Jaczko told Platts
event attendees that the U.S. atomic power
industry is at a crossroads, where it can
fully understand and embrace the meaning
of the Fukushima disaster and move for-
ward, or it can give only lip service to the
lessons learned and go on with business as
usual. Down one path, he said, is a vital,
1. Long time coming. The NRC granted a combined construction and operating license
for Southern Co.’s Vogtle Units 3 and 4 on Feb. 9, 2012. The construction site for the new Units
3 and 4 is shown with Units 1 and 2 visible in the background. Courtesy: Southern Co.
2. Reactor construction under way. Southern Co. received an Early Site Permit and
Limited Work Authorization (LWA) from the NRC in August 2009. The LWA allowed safety-relat-
ed construction at the site prior to receiving the combined construction and operating license.
Shown is the assembly of the Unit 3 containment vessel lower ring. The photo was taken Jan.
30, 2012. Courtesy: Southern Co.

April 2012 | POWER www.powermag.com 45
NUCLEAR POWER
Hi, my name is Bob, Senior Marketing Support Specialist at Atlas Copco Compressors. Talkabout sustainability... for the last 38 years, I've been part of the team taking care of our valuedcustomers in the United States.
At Atlas Copco, our culture is built around the customer’s needs and minimizing our impacton the environment. Sound too good to be true? Let us prove it. We’ve been named one ofthe top 100 most sustainable companies in the world for the past five consecutive yearswhile continuing to invest in growing our local support and service for the U.S. market.For instance, just this past year, we’ve built a new131,000 sq. ft. distribution center in Charlotte, NCincreasing our spare parts stock by 80%, all tobetter serve our customers.
Oh, and did I forget to mention ourproducts? Whether you need aircompressors, low pressureblowers, dryers and filters,compressed air piping, or nitrogengenerators, we have the perfectproduct for you. Just log on towww.atlascopco.us/bobusa or call866-688-9611 to learn more about us, ourproducts, and how we have earned andwill continue to earn our reputation.
Imagine howyourproductivity could soar
© Copyright 2011 Atlas Copco Compressors LLC. All rights reserved.
Atlas Sustainability Ad 4.5625 x 10:Layout 1 2/16/11 12:01 AM Page 1
CIRCLE 20 ON READER SERVICE CARD
growing industry that enjoys public sup-
port; down the other is stagnation.
Three hours later, in his dissent, Jaczko
detailed his position: “I cannot support
issuing this license as if Fukushima had
never happened,” he said with no show of
emotion. In written comments attached to
the NRC order, he elaborated, “I simply
cannot authorize issuance of these licenses
without any binding obligation that these
plants will have implemented the lessons
learned from the Fukushima accident be-
fore they operate.” (The sidebar offers a
time line of events that led up to the Fuku-
shima accident and looks at the disaster’s
ongoing impact.)
The other four commissioners respect-
fully disagreed, arguing that the lessons
from Fukushima that the NRC staff has
identified will be incorporated into op-
erating procedures at Vogtle and across
the industry, without the need to put the
Southern Co. application on hold. Com-
missioner Kristine Svinicki said, “There
is no amnesia, individually or collectively,
regarding the events of March 11 and the
ensuing accident at Fukushima.”
Given the turmoil that has characterized
the NRC in recent months, including pub-
lic complaints by the other commission-
ers about Jaczko’s allegedly authoritarian
and temperamental management style, the
meeting was calm, not confrontational.
Svinicki, frequently Jaczko’s chief adver-
sary, congratulated him on the “orderly
manner” he displayed leading the years-
long Vogtle proceeding.
Fukushima Not ForgottenAll five of the NRC members appear to un-
derstand the significance of the challenge
brought by the March 11, 2011, destruction
of the Fukushima Daiichi nuclear power
station in Japan. It was a $40 billion act of
a capricious nature, reminding everyone in
the power industry that “low probability”
decidedly does not mean “no probability.”
The specter of Fukushima was clearly part
of the backdrop, from Jaczko’s opening ad-
dress at the Platts meeting to the vote at the
commission to the final Platts session the
following morning.
But it is not just a terrible accident in
Japan that has tempered optimism in the
nuclear business, despite the positive
boost from the landmark Vogtle vote. The
context for the nuclear industry today in-
cludes low growth in electricity demand,
record and sustained low natural gas pric-
es, uncertainty about nuclear waste, public
policy preferences for renewable electric-
ity generation, and an economy that may
or may not be recovering from the worst

www.powermag.com POWER | April 201246
NUCLEAR POWER
Fukushima: The Death of Nuclear Power in Japan?On March 11, 2011, a massive earthquake and
an enormous 45-foot-high battering ram of
water utterly destroyed three of the six General
Electric boiling water reactors (BWRs) sharing
a site in Japan’s Fukushima prefecture on the
island nation’s west coast. The horrific, totally
unexpected events produced vivid images of
the plants literally blowing apart in conse-
quence of the temblor and tsunami. They may
also have spelled the end of atomic energy in
Japan (Figure 3).
Unlike the 1986 Chernobyl explosion, the
world learned of Fukushima as it was occur-
ring, with blogs and tweets following the in-
timate details and stunning videos instantly
showing up on YouTube (for example, see
http://tinyurl.com/7ddka2r). The Japanese
government, despite its insular nature, is
still far more open than was the former So-
viet Union. And if Japan had been inclined to
cover up the events—and no doubt there were
those in industry and government who were so
inclined—modern technology rendered those
instincts anachronistic and futile.
Accident SummaryThe quake, the worst in Japan’s earthquake-
filled history, was far beyond the design ba-
sis of the six elderly GE boilers with (except
for Unit 6) outmoded lightbulb-and-donut
pressure suppression containments. The
accompanying liquid assault from the sea
produced one of the accident scenarios that
keep nuclear safety experts pacing the floor
at night. It’s known as “station blackout,”
the complete loss of on-site and off-site
electric power necessary to keep cooling
pumps and safety systems working during a
loss-of-coolant accident.
The Fukushima plants didn’t lack backup
power. As with all modern nuclear plants, banks
of large diesel generators—13 in all—were
available to kick in automatically should the
plant lose electricity from the grid. Backstop-
ping those were ranks of batteries designed to
provide enough standalone electricity to keep
the plants safe until engineers could link up
another source of power.
Hindsight, of course, often improves one’s
vision. Looking back on the accident from
a year‘s distance reveals that the backup
diesels were vulnerable to the tsunami’s ef-
fects, the batteries were inadequate for the
unimagined task they faced, and plant de-
signers did not adequately address the risks
of earthquake followed by a total inunda-
tion of immense force.
Unit 1 was the oldest of the Fukushima re-
actors, a 439-MW machine that went into com-
mercial service in 1971. Next door, Units 2 and
3 were both 760-MW reactors; Unit 2 began
generating electricity for the grid in 1974 and
Unit 3 in 1976. Units 4 and 5 were also 760-
MW BWRs; both began operating in 1978. The
1,067-MW Unit 6 went into service in 1979,
the year of the Three Mile Island accident in
the U.S. All were owned and operated by Tokyo
Electric Power Co., one of the largest, most so-
phisticated utilities in the world, colloquially
known as Tepco.
When the 9.0 magnitude earthquake hit at
14:46 Japan Standard Time (JST) on March 11,
2011, Units 1, 2, and 3 were operating nor-
mally. Unit 4 was shut down and held no fuel,
while 5 and 6 were out of service for mainte-
nance but were fully loaded with nuclear fuel.
As reconstructed by Tepco and Japan’s nuclear
regulators, the Nuclear and Industrial Safety
Agency (NISA), the three reactors scrammed,
or automatically shut down, as they should
have, when the earthquake hit. The plants lost
their normal sources of power as the earth-
quake damaged the regional electric grid. Each
unit had two back-up diesel generators, which
kicked on, as designed.
About 50 minutes later, the stupendous wall
of water hit the site, overwhelming the 19-foot
seawall the company had put in place when
the plant was designed and built to ward off a
projected 18-foot wave. Water swept over the
site, flooding the battery banks and emergency
diesel generators. It all went bad, very bad,
from that point on. The following chronology
follows a detailed timeline published in No-
vember by the U.S.-based Institute for Nuclear
Power Operations (Figure 4).
Accident TimelineTo condense the events considerably: All three
units lost core cooling. The residual heat in
the fuel resulted in a complete meltdown, lib-
erating explosive hydrogen in the process. The
hydrogen collected in the top of the reactor
buildings. The hydrogen mixed with oxygen
soon ignited and the units exploded, one af-
ter the other. Unit 1 was the first, at 15:36
JST March 12, as the sidewalls of the building
blew apart, leaving an eerie, skeletal steel hulk
standing. Some 4.5 hours later, the govern-
ment ordered the utility to use fire trucks to
pump seawater into the Unit 1 core in order to
cool the glowing mass of fuel.
Events at Unit 3 followed a similar pat-
tern. Loss of coolant exposed the core, which
melted. A steam-zirconium reaction liberated
hydrogen, which accumulated in the top of the
reactor building. At 11:01 JST on March 14,
Unit 3 exploded, a blast larger than that from
Unit 1 and one felt some 40 miles away. The
explosion injured six workers.
Around 6:00 JST March 15, workers heard a
“loud noise” from Unit 2, shortly after a hy-
drogen explosion in Unit 4. Workers thought
the noise from Unit 2 was also an explosion,
although later, experts decided it was not. But
the explosion in Unit 4 and the unknown event
in Unit 2 led to even greater radiation levels on
3. Earthquake and tsunami damage. This satellite image shows damage to the
Fukushima Daiichi Power Plant caused by an earthquake and tsunami. It was taken at 11:04
a.m. local time, March 13, 2011, 3 minutes after an explosion. Courtesy: DigitalGlobe

April 2012 | POWER www.powermag.com 47
NUCLEAR POWER
contraction since “Happy Days Are Here
Again” made its debut in 1929.
Chip Pardee of Exelon Generation told
the Platts meeting that he recalled being
at similar events in 2007 when his job
was “to get up before a group of people
and talk about the advantages of nuclear
power.” That was an easy task at the time.
Today, five years later, he said, “It’s not
impossible, but it is more difficult.” Five
years ago, he noted, the talk was about the
security of nuclear plants in the face of ter-
rorist threats; today, it’s about nuclear ac-
cidents. Five years ago, the environmental
concern was greenhouse gases; today, it is
nuclear waste.
Westinghouse’s Jim Ferland comment-
ed that Fukushima “has pushed out ‘new
build’” as a current topic and moved it into
the future, although the NRC vote gave his
company a major victory.
The heart of the Vogtle project is the
Westinghouse AP1000 advanced reactor,
which won NRC approval Dec. 30, after
years of review and multiple redesigns.
Four projects using the AP1000 reactor—
the two approved in February and the two
planned for Scana Corp.’s application,
which will likely face the NRC next—are
on the stage in the U.S.; four are under
construction in China. “It would help a lot
if we can bring those in on schedule and
under budget,” Ferland said with ironic un-
derstatement.
Five years ago, the phrase “nuclear re-
naissance” was on the lips of many in the
industry, as the NRC geared up to license
as many as two dozen new units. Art Lem-
bo of URS recalled that one of the press-
ing questions then, “when we were on the
doorstep of renaissance,” was whether the
industry could find the skilled people it
needed to support that endeavor. Today,
those plant numbers have been dramatical-
ly reduced; meeting the demand for human
resources is no longer daunting.
Marvin Fertel, a realist who heads the
Nuclear Energy Institute, the industry’s
Washington lobby, told the Wall Street
Journal after the NRC Vogtle vote that
the Southern Co. plants in Georgia and
Scana’s planned South Carolina units are
probably the only new nuclear plants that
will get built in the U.S. before 2020. Ul-
timately, Fertel said he believes that the
prospects for nuclear power will rebound.
“The long-term fundamentals haven’t
changed,” he told the newspaper. One can
almost hear the words in his head: “Let us
sing a song of cheer again.” ■
—Kennedy Maize is a POWER contribut-ing editor and executive editor of
MANAGING POWER.
site. Most workers on the site were evacuated,
leaving only 70 to deal with events at the reac-
tors. By this point it was abundantly clear that
radiation was not confined to the reactor site.
The Fukushima prefecture government on
March 11 ordered an evacuation of people
within 2 kilometers (km) of the plant, some
1,800 individuals. Within hours, the central
government expanded the evacuation zone to
3 km. By the next day the evacuation zone ex-
tended 20 km, then 30 km. By March 13, some
179,000 to 200,000 people had been ordered
to evacuate. Many may never be able to return
to their homes.
A cascade of failures characterized the ac-
cident, and Tepco spent much of the rest of
the year working to stabilize the site. Condi-
tions of intense radioactivity limited the time
workers could spend on and around the site.
Extensive damage made recovery and cleanup
difficult. It was months before the government
and Tepco acknowledged that the fuel had ac-
tually melted down.
This was similar to what occurred at Three
Mile Island, where the utility consistently
underestimated the damage to the reactor
fuel. Indeed, The Economist observed that
Fukushima was “a bit like three Three Mile
Islands in a row, with added damage in the
spent-fuel stores.”
Accident UpdateLast December, Japan declared that the Fuku-
shima nuclear reactor site was finally stable,
which could lead to the return of some 80,000
evacuees and allow the utility to begin dis-
mantling and decommissioning the wrecked
plant. But that claim may have been prema-
ture. Reuters reported in February that Tepco
had uncovered a leak of slightly radioactive
water inside the containment of Unit 4, which
was largely undamaged during the March ac-
cident. The 8 metric tons (8.5 cubic meters)
of leaked water did not get outside the reac-
tor and will be drained into storage, the wire
service reported.
Not long after that, Tepco reported that
temperatures in the crippled Unit 2 have been
rising, although they are still below the 93C
that defines “cold shutdown.” The rising tem-
peratures suggest the possibility of re-critical-
ity. Bloomberg quoted Tetsue Ito, head of the
Atomic Energy Research Institute at Kinki Uni-
versity, as saying, “It was too early to say the
plant is safe in December. They declared cold
shutdown even though nobody is sure about
the location of melted fuel.”
At its peak, Japan had 54 operating nuclear
units, supplying some 30% of the country’s
electricity. Japan had a reputation as one of
the safest, most careful nuclear power regimes
in the world.
At this writing, only three units are operat-
ing in Japan; those are scheduled to come out
of service soon. As you read this, Japan may
not be getting any power at all from its once-
proud, now-humbled nuclear enterprise. That
enterprise now faces intense opposition in a
country that justifiably has mixed emotions
about the power of the atom. Many observers
predict that none of Japan’s nuclear units will
ever operate again.
4. Complete devastation. An unmanned drone took this aerial photo of the Fukushima
Daiichi nuclear power plant on March 20, 2011. Unit 1 is at the top of the photo, Unit 4 is at the
bottom. Courtesy: Air Photo Service Co. Ltd., Japan
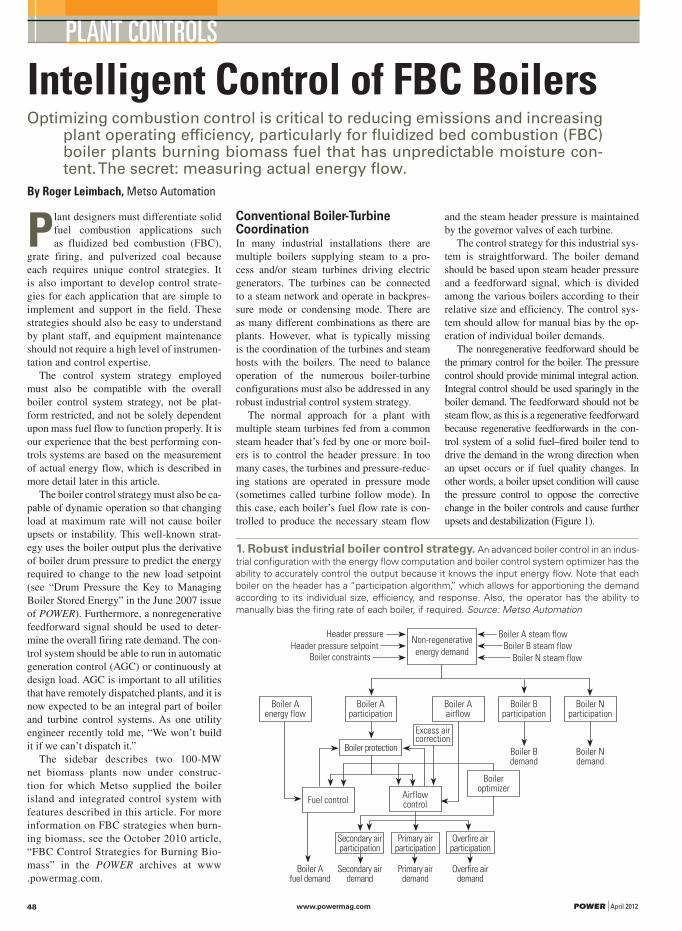
www.powermag.com POWER | April 201248
PLANT CONTROLS
Intelligent Control of FBC BoilersOptimizing combustion control is critical to reducing emissions and increasing
plant operating efficiency, particularly for fluidized bed combustion (FBC) boiler plants burning biomass fuel that has unpredictable moisture con-tent. The secret: measuring actual energy flow.
By Roger Leimbach, Metso Automation
Plant designers must differentiate solid
fuel combustion applications such
as fluidized bed combustion (FBC),
grate firing, and pulverized coal because
each requires unique control strategies. It
is also important to develop control strate-
gies for each application that are simple to
implement and support in the field. These
strategies should also be easy to understand
by plant staff, and equipment maintenance
should not require a high level of instrumen-
tation and control expertise.
The control system strategy employed
must also be compatible with the overall
boiler control system strategy, not be plat-
form restricted, and not be solely dependent
upon mass fuel flow to function properly. It is
our experience that the best performing con-
trols systems are based on the measurement
of actual energy flow, which is described in
more detail later in this article.
The boiler control strategy must also be ca-
pable of dynamic operation so that changing
load at maximum rate will not cause boiler
upsets or instability. This well-known strat-
egy uses the boiler output plus the derivative
of boiler drum pressure to predict the energy
required to change to the new load setpoint
(see “Drum Pressure the Key to Managing
Boiler Stored Energy” in the June 2007 issue
of POWER). Furthermore, a nonregenerative
feedforward signal should be used to deter-
mine the overall firing rate demand. The con-
trol system should be able to run in automatic
generation control (AGC) or continuously at
design load. AGC is important to all utilities
that have remotely dispatched plants, and it is
now expected to be an integral part of boiler
and turbine control systems. As one utility
engineer recently told me, “We won’t build
it if we can’t dispatch it.”
The sidebar describes two 100-MW
net biomass plants now under construc-
tion for which Metso supplied the boiler
island and integrated control system with
features described in this article. For more
information on FBC strategies when burn-
ing biomass, see the October 2010 article,
“FBC Control Strategies for Burning Bio-
mass” in the POWER archives at www
.powermag.com.
Conventional Boiler-Turbine CoordinationIn many industrial installations there are
multiple boilers supplying steam to a pro-
cess and/or steam turbines driving electric
generators. The turbines can be connected
to a steam network and operate in backpres-
sure mode or condensing mode. There are
as many different combinations as there are
plants. However, what is typically missing
is the coordination of the turbines and steam
hosts with the boilers. The need to balance
operation of the numerous boiler-turbine
configurations must also be addressed in any
robust industrial control system strategy.
The normal approach for a plant with
multiple steam turbines fed from a common
steam header that’s fed by one or more boil-
ers is to control the header pressure. In too
many cases, the turbines and pressure-reduc-
ing stations are operated in pressure mode
(sometimes called turbine follow mode). In
this case, each boiler’s fuel flow rate is con-
trolled to produce the necessary steam flow
and the steam header pressure is maintained
by the governor valves of each turbine.
The control strategy for this industrial sys-
tem is straightforward. The boiler demand
should be based upon steam header pressure
and a feedforward signal, which is divided
among the various boilers according to their
relative size and efficiency. The control sys-
tem should allow for manual bias by the op-
eration of individual boiler demands.
The nonregenerative feedforward should be
the primary control for the boiler. The pressure
control should provide minimal integral action.
Integral control should be used sparingly in the
boiler demand. The feedforward should not be
steam flow, as this is a regenerative feedforward
because regenerative feedforwards in the con-
trol system of a solid fuel–fired boiler tend to
drive the demand in the wrong direction when
an upset occurs or if fuel quality changes. In
other words, a boiler upset condition will cause
the pressure control to oppose the corrective
change in the boiler controls and cause further
upsets and destabilization (Figure 1).
Header pressure
Header pressure setpoint
Boiler constraints
Boiler A steam flow
Boiler B steam flow
Boiler N steam flow
Non-regenerative
energy demand
Boiler A energy flow
Boiler A participation
Boiler A airflow
Boiler B participation
Boiler N participation
Excess air correction
Boiler protection
Fuel controlAirflow control
Boiler optimizer
Boiler B demand
Boiler N demand
Secondary air participation
Primary air participation
Overfire air participation
Secondary air demand
Primary air demand
Overfire air demand
Boiler A fuel demand
1. Robust industrial boiler control strategy. An advanced boiler control in an indus-
trial configuration with the energy flow computation and boiler control system optimizer has the
ability to accurately control the output because it knows the input energy flow. Note that each
boiler on the header has a “participation algorithm,” which allows for apportioning the demand
according to its individual size, efficiency, and response. Also, the operator has the ability to
manually bias the firing rate of each boiler, if required. Source: Metso Automation

April 2012 | POWER www.powermag.com 49
PLANT CONTROLS
FBC Boilers Are UniqueFBC boilers are used for a wide variety of
mostly industrial applications, with several
boilers working together on sophisticated steam
networks that have rapidly changing demand.
The boilers acting in parallel can also be un-
controlled, where the boiler steam production
is completely dependent upon the rate of waste
fuel supply, which may not be measurable.
FBC boilers also are likely to use relatively
hard-to-burn fuels such as combinations of
biofuels and waste coal, all of which will have
a wide range of possible fuel constituents and
moisture content. Biofuels are not necessarily
homogeneous; often they are a mixture of dif-
ferent fuels such as bark, forest cuttings, agri-
waste, and waste building materials. A typical
FBC will fire a wide range of solid fuels to
minimize overall plant fuel cost.
FBC boilers burning these fuels require a
much different approach to boiler control de-
sign. For example, the fluidized bed of sand
and ash within the furnace has a very large in-
ertia, limiting the dynamics of the boiler. On
the other hand, the large fluidized bed of sand
and ash enables the FBC boiler to burn up to
60% high-moisture-content fuels. While the
fuel properties may change quickly, the fuel
also burns relatively fast, even though there is
still a wide range in the fuels’ combustibility
(the time to evaporate the water, pyrolyze the
solid fuel, and complete combustion).
How quickly the combination of fuels is fed
into the FBC is the responsibility of the fuel
feed system controls, a critical function of the
overall combustion control system. The fuel
feed system must be capable of handling mul-
Heat balance
circulation
Fuel-handling
valve
Oxygen consumption calculation
Metered fuelFuel power
(Btu/hr)Fuel control
Steam temperature
control
Airflow control
+
+
x
+/–
2. Best of both worlds. Some combustion control designs use airflow (as a proxy for
oxygen flow) and an air/fuel ratio to estimate the energy entering a boiler—a process that is fast
but error-prone. Others measure the actual fuel consumed—a slow but accurate approach. In
combination, a much more accurate estimate of the energy entering the FBC boiler is possible.
The Fuel Power Compensator computes the energy input by measuring oxygen consumption
and mass balance. The result is used by the fuel control, airflow control, and steam temperature
control loops. Source: Metso Automation
FESSENHEIM - Feedwater Heater for CNPE - France
TAVAZZANO - HRSG for Power Plant - Italy
Porto CORsini - hrsg for Power Plant - Italy
SIDI KRIR - Steam Surface Condenser - Egypt
Heat Recovery Steam GeneratorsIndustrial BoilersHeat Transfer Products for Nuclear PlantsFeedwater HeatersSteam Surface CondensersPower Plant Service
Utility BoilersUSC BoilersBiomass Fired BoilersLow-NOx BurnersRegenerative Air Preheaters and Gas-Gas HeatersPower Plant Service:• inspections•recommendations•engineering solutions
STF S.p.A. Via Robecco, 20 20013 Magenta (MI) Italia Tel: +39 02 972091 Fax: +39 02 9794977 www.stf.it e-mail: [email protected]
BWE
Burmeister & Wain Energy A/S Lundtoftegårdsvej 93A DK-2800 Kgs. Lyngby - Denmark Tel: +45 39 45 20 00 Fax: +45 39 45 20 05 www.bwe.dk e-mail: [email protected]
BWE Energy India Pvt. Ltd No. 43, KB Dasan Road Teynampet Chennai - 600 018 TamilNadu, India Tel: +91 44 24 32 8101/2 Fax: +91 44 24 32 8103 e-mail: [email protected]
CIRCLE 21 ON READER SERVICE CARD

www.powermag.com POWER | April 201250
PLANT CONTROLS
tifuel combustion because the heating value and
bulk density of the individual fuels will vary
greatly. Even so, the total energy flow must be
maintained at a consistent rate to make sure
header steam pressure is maintained at setpoint
and energy flow out of the boiler is at required
demand. Changes in energy flow to the boiler
can cause fluctuations in combustion and steam
production. If not precisely controlled, these
fluctuations will reduce power generation and
can risk plant availability.
FBC boilers do not produce high levels of
emissions, such as SOx and NOx. However,
those that fire coal require limestone as an ad-
ditive to capture SOx. Limestone is expensive
to use and is an expense to overall operations
that can reach several million dollars each
year, depending upon the size of the boiler.
Because FBC boilers operate at lower temper-
atures, NOx production from an FBC boiler is
minimal, but if the bed temperature rises above
the NOx threshold, more ammonia is required
as a mediating additive. These emissions are
Two Fluidized Bed Boilers Under Construction in the U.S.Metso has sold a complete 100-MW net
biomass boiler island and plant automation
system to two wood biomass plants in the
U.S. Both projects are under construction
and will soon share the title of largest bio-
mass plants in the U.S.
Texas Wood Fires Future Record-HolderThe Nacogdoches Generating Facility is
owned and operated by Southern Power, a
subsidiary of Southern Co. Southern Pow-
er is among the largest wholesale energy
providers in the Southeast, meeting the
electricity needs of municipalities, electric
cooperatives, and investor-owned utilities.
Power from this new plant, located near
Sacul in Nacogdoches County, Texas, will be
sold to Austin Energy, the municipal utility
owned by the City of Austin, under a 20-
year contract (Figure 4).
The bubbling bed boiler is designed to burn
about one million tons of combustible forest
residue from the wooded areas of East Texas,
wood processing residues, and clean munici-
pal wood waste annually. The biomass fuel
will be sourced within a 75-mile radius of the
plant and will normally be delivered by truck.
The fuel-handling system consists of three
truck tippers, two sets of screens and hogs,
an automatic stacker/reclaimer system, and a
manual stacker/reclaimer system to maintain
two 15-day fuel storage piles.
Bubbling fluidized bed boilers are well-suit-
ed to burn high-moisture-content fuels such
as biomass and are generally simpler to op-
erate than a conventional solid fuel–burning
boiler, as the temperature of the 6-foot-deep
sand bed can be controlled through combus-
tion air staging. The boiler produces super-
heated steam that is used in a single steam
turbine with four stages of feedwater heating.
The steam turbine exhausts axially into the
condenser. A wet evaporative cooling tower
provides condenser cooling. The boiler gas
side is equipped with a baghouse for particu-
late matter control plus an aqueous ammonia
injection selective noncatalytic reduction sys-
tem for NOx control.
American Renewables handled develop-
ment and initial planning for the Nacogdo-
ches project and sold it to Southern Power
in 2009. Construction of the plant began in
2009; commercial service is scheduled to
begin later this summer.
Waste Wood Not Wasted by Florida PlantThe Gainesville Renewable Energy Center
(GREC) will supply electricity to Gainesville
(Fla.) Regional Utilities (the city-owned
utility) under a 30-year power purchase
agreement. As with the Nacogdoches Gen-
erating Facility, the boiler will use bubbling
fluidized bed technology and annually burn
about a million tons of waste wood from log-
ging and mills as well as urban wood waste
from clearing, tree trimming, and pallets—
all sourced from a 75-mile plant radius.
Gainesville Renewable Energy Center LLC
was developed by American Renewables.
Zachry Engineering Corp. is providing de-
sign engineering and procurement services
as part of the engineering, procurement,
and construction team. Fagen Inc. is the
construction contractor for both projects.
Commercial operation of this $500 million
Florida plant is scheduled for late 2013.
4. New title holder. When startup is
completed later this year, the 100-MW Na-
cogdoches Generating Facility will become
the largest biomass-fired power plant in the
U.S. Courtesy: Southern Power
3. Well-controlled Nordic biomass plant. The 240-MW Alholmens Kraft Power Sta-
tion is the largest biomass power plant in the world and burns a combination of coal and waste
biomass fuels. The plant uses the Fuel Power Compensator (FPC) to optimize FBC boiler per-
formance. In this recording, the operator is manually adding coal in 10% to 15% steps while
the fuel control is responding to the FPC and driving the biomass flow downward to maintain
constant energy output. Note how the steam flow remains unchanged during the fuel split
change. Source: Metso Automation
Steam flow
O2
Coal
BiomassCoal flow (0%–100%)
Steam flow (635,00 – 1.6 Mlb/hr)
O2 (1%–4%)
Biomass flow (50%–250%)
16-30-00 17-00-00 17-30-00 18-00-00
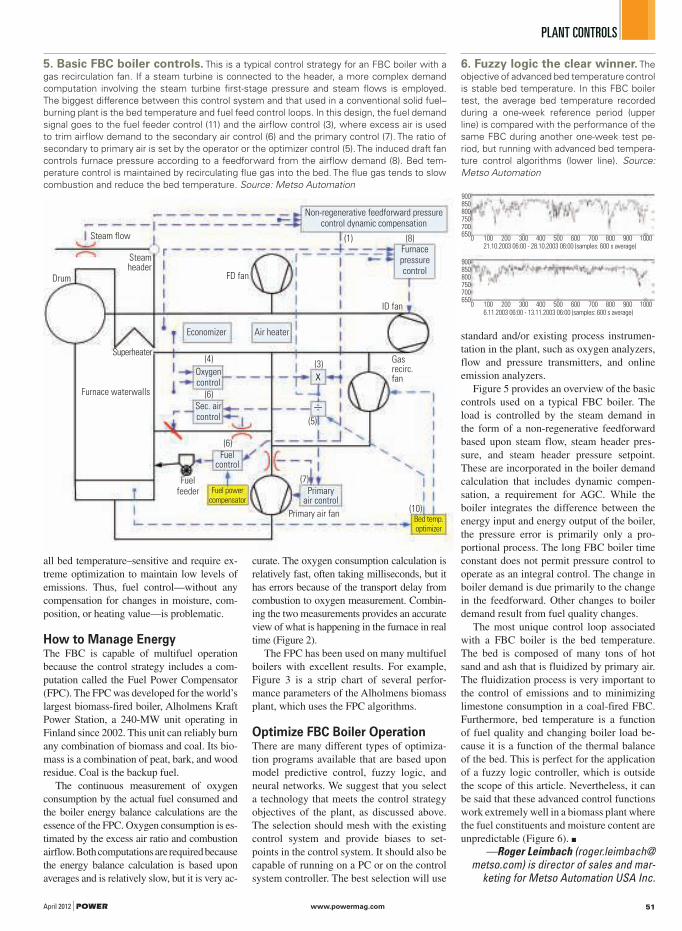
April 2012 | POWER www.powermag.com 51
PLANT CONTROLS
all bed temperature–sensitive and require ex-
treme optimization to maintain low levels of
emissions. Thus, fuel control—without any
compensation for changes in moisture, com-
position, or heating value—is problematic.
How to Manage EnergyThe FBC is capable of multifuel operation
because the control strategy includes a com-
putation called the Fuel Power Compensator
(FPC). The FPC was developed for the world’s
largest biomass-fired boiler, Alholmens Kraft
Power Station, a 240-MW unit operating in
Finland since 2002. This unit can reliably burn
any combination of biomass and coal. Its bio-
mass is a combination of peat, bark, and wood
residue. Coal is the backup fuel.
The continuous measurement of oxygen
consumption by the actual fuel consumed and
the boiler energy balance calculations are the
essence of the FPC. Oxygen consumption is es-
timated by the excess air ratio and combustion
airflow. Both computations are required because
the energy balance calculation is based upon
averages and is relatively slow, but it is very ac-
curate. The oxygen consumption calculation is
relatively fast, often taking milliseconds, but it
has errors because of the transport delay from
combustion to oxygen measurement. Combin-
ing the two measurements provides an accurate
view of what is happening in the furnace in real
time (Figure 2).
The FPC has been used on many multifuel
boilers with excellent results. For example,
Figure 3 is a strip chart of several perfor-
mance parameters of the Alholmens biomass
plant, which uses the FPC algorithms.
Optimize FBC Boiler OperationThere are many different types of optimiza-
tion programs available that are based upon
model predictive control, fuzzy logic, and
neural networks. We suggest that you select
a technology that meets the control strategy
objectives of the plant, as discussed above.
The selection should mesh with the existing
control system and provide biases to set-
points in the control system. It should also be
capable of running on a PC or on the control
system controller. The best selection will use
standard and/or existing process instrumen-
tation in the plant, such as oxygen analyzers,
flow and pressure transmitters, and online
emission analyzers.
Figure 5 provides an overview of the basic
controls used on a typical FBC boiler. The
load is controlled by the steam demand in
the form of a non-regenerative feedforward
based upon steam flow, steam header pres-
sure, and steam header pressure setpoint.
These are incorporated in the boiler demand
calculation that includes dynamic compen-
sation, a requirement for AGC. While the
boiler integrates the difference between the
energy input and energy output of the boiler,
the pressure error is primarily only a pro-
portional process. The long FBC boiler time
constant does not permit pressure control to
operate as an integral control. The change in
boiler demand is due primarily to the change
in the feedforward. Other changes to boiler
demand result from fuel quality changes.
The most unique control loop associated
with a FBC boiler is the bed temperature.
The bed is composed of many tons of hot
sand and ash that is fluidized by primary air.
The fluidization process is very important to
the control of emissions and to minimizing
limestone consumption in a coal-fired FBC.
Furthermore, bed temperature is a function
of fuel quality and changing boiler load be-
cause it is a function of the thermal balance
of the bed. This is perfect for the application
of a fuzzy logic controller, which is outside
the scope of this article. Nevertheless, it can
be said that these advanced control functions
work extremely well in a biomass plant where
the fuel constituents and moisture content are
unpredictable (Figure 6). ■
—Roger Leimbach ([email protected]) is director of sales and mar-
keting for Metso Automation USA Inc.
5. Basic FBC boiler controls. This is a typical control strategy for an FBC boiler with a
gas recirculation fan. If a steam turbine is connected to the header, a more complex demand
computation involving the steam turbine first-stage pressure and steam flows is employed.
The biggest difference between this control system and that used in a conventional solid fuel–
burning plant is the bed temperature and fuel feed control loops. In this design, the fuel demand
signal goes to the fuel feeder control (11) and the airflow control (3), where excess air is used
to trim airflow demand to the secondary air control (6) and the primary control (7). The ratio of
secondary to primary air is set by the operator or the optimizer control (5). The induced draft fan
controls furnace pressure according to a feedforward from the airflow demand (8). Bed tem-
perature control is maintained by recirculating flue gas into the bed. The flue gas tends to slow
combustion and reduce the bed temperature. Source: Metso Automation
Non-regenerative feedforward pressure control dynamic compensation
x
÷
(1) (8)Furnace pressure control
Steam flow
Steam header
Drum
Superheater
Furnace waterwalls
FD fan
ID fan
Air heaterEconomizer
(3)Gas recirc. fan
(4)
Oxygen control
(6)
Sec. air control
(6)
Fuel control
(7)Fuel feeder
(10)
Primary air control
Primary air fan
Fuel power compensator
Bed temp. optimizer
(5)
6. Fuzzy logic the clear winner. The
objective of advanced bed temperature control
is stable bed temperature. In this FBC boiler
test, the average bed temperature recorded
during a one-week reference period (upper
line) is compared with the performance of the
same FBC during another one-week test pe-
riod, but running with advanced bed tempera-
ture control algorithms (lower line). Source:
Metso Automation
900850800750700650
900850800750700650
0 100 200 300 400 500 600 700 800 900 1000
0 100 200 300 400 500 600 700 800 900 1000
21.10.2003 06:00 - 28.10.2003 06:00 (samples: 600 s average)
6.11.2003 06:00 - 13.11.2003 06:00 (samples: 600 s average)

www.powermag.com POWER | April 201252
WATER MANAGEMENT
Promoting Sustainable Water Usage in Power GenerationGrowing concern about water usage by U.S. electric power generation is being
prompted by a number of factors, including projected increases in power demand due to population growth, competing uses for water, and recent drought conditions in various parts of the country. Our overview presents di-verse perspectives from industry experts about current and future challenges of balancing power generation needs with declining water availability.
By Angela Neville, JD
In our modern world, water and energy
production are inextricably connected.
The treatment and delivery of water
for human consumption and industrial pur-
poses require large amounts of electricity.
Conversely, many of the power generation
facilities that produce electricity—such as
coal-fired, solar thermal, and nuclear power
plants—use large amounts of water.
In most power plants, water is taken from
nearby water bodies—including oceans, riv-
ers, and lakes—and then returned to the wa-
ter source via a once-through (open loop)
cooling water system. The use of water in-
take cooling systems promotes maximum
capacity and efficiency for a given thermal or
nuclear power plant technology. The cooler
intake water enables power plants to operate
with lower vacuum pressures in the steam
turbine condensers, which, in turn, maximiz-
es the power extracted by the low-pressure
section of the steam turbines and provides
the highest possible fuel efficiency.
POWER has written extensively on the
need to develop more efficient cooling water
technologies. Examples (all available at www
.powermag.com) include “Appraising Our Fu-
ture Cooling Water Options” (June 2010), “De-
termining Carbon Capture and Sequestration’s
Water Demands” (March 2010), “Conserve
Water by Improving Cooling Tower Efficiency”
(January 2009), “New Coal Plant Technolo-
gies Will Demand More Water” (April 2008),
and “Costlier, Scarcer Supplies Dictate Making
Thermal Plants Less Thirsty” (January 2008).
In order to tackle this complicated topic
from a variety of viewpoints, in February,
POWER interviewed industry leaders from
an energy research institute, a leading na-
tional energy laboratory, a U.S. water and
energy technology manufacturer, and a large
consulting firm. From regulations to techni-
cal innovations, our experts offer insights
into trends concerning the interdependence
of water and power.
Water Availability Issues in Power Production“Water availability already is an issue across
the U.S., affecting nearly every region,” said
Kent Zammit, senior program manager of the
Environment–Water and Ecosystems Divi-
sion at the Electric Power Research Institute
(EPRI). “In addition to over-allocation, cli-
mate variability (including droughts) is caus-
ing regional shortages, as we have seen in
Texas, across the Southeast, and other areas.”
As existing power plants using a once-
through cooling process are retired, they
will likely be replaced by plants using closed
cycle cooling because of new fish protection
regulations, he explained. For wet cooling
systems (cooling towers), it is preferable to
use freshwater, but some installations are
now using degraded water sources. Others are
adopting dry cooling or hybrid cooling sys-
tems, but each of these has drawbacks, such
as higher capital costs, lower unit efficiency,
higher parasitic load (due to fan horsepower),
and additional maintenance.
Barbara Carney is the chemical engineer/
project manager of the Existing Plants Divi-
sion, Strategic Center for Coal at the U.S.
Department of Energy’s National Energy Tech-
nology Center, also known as the National
Energy Technology Laboratory (NETL). She
pointed out that increased concern for water
usage comes from, among other things, the ad-
dition of carbon capture technology on power
plants that requires increased water usage and
additional power generation capacity due to the
power loss associated with carbon capture. She
also noted that requirements of the Clean Wa-
ter Act 316(b) tend to result in decreased water
withdrawals (from, for example, once-through
cooling) but increased consumption (for exam-
ple, for evaporation from cooling towers). Her
center has initiated research in three main areas:
advanced cooling technologies, water reuse and
recovery, and use of nontraditional sources of
process and cooling water.
According to Heiner Markhoff, president
and CEO of water and process technolo-
gies for GE Power & Water, the current and
near-term challenges related to cooling re-
quirements of thermal power generation are
the amount of freshwater that is taken into a
cooling system and the volume and salinity
of water that is eventually discharged back
into the original waterway.
The problem related to salinity was also
mentioned by William Heins, general man-
ager of thermal evaporative technology in the
water and process technologies division of
GE Power & Water. “In a power plant, as you
cycle up the cooling water, it gets increas-
ingly concentrated with salt. If the cooling
tower blowdown is discharged back into the
river, then you are increasing the salinity, or
the salt content, of the river. Therefore, if you
can reduce or eliminate the water that you are
discharging back to the river, you have suc-
ceeded in lowering the amount of salt that re-
enters the river, thereby improving the water
quality,” he said.
Bill Kemp, vice president of Black & Ve-
atch’s management consulting division, fo-
cused on the impact of water scarcity on the
power generation sector. Increasing shortfalls
in water supplies could result in numerous
new restrictions or limitations on both ther-
mal and hydroelectric capacity. “We could
see new or additional restrictions on the sit-
ing of thermal plants, reduced hydroelectric
generation, and limited withdrawals from
rivers during the summer,” Kemp said. “In
periods of more serious drought, the physical
ability of major coal or nuclear power plants
to obtain sufficient cooling water could be
threatened. Generation operators are realiz-
ing this situation is not so far-fetched.”
Water Supply CompetitorsAgriculture is by far the largest consumer of
water, if one takes into account that a large
portion of the water used by power plants is
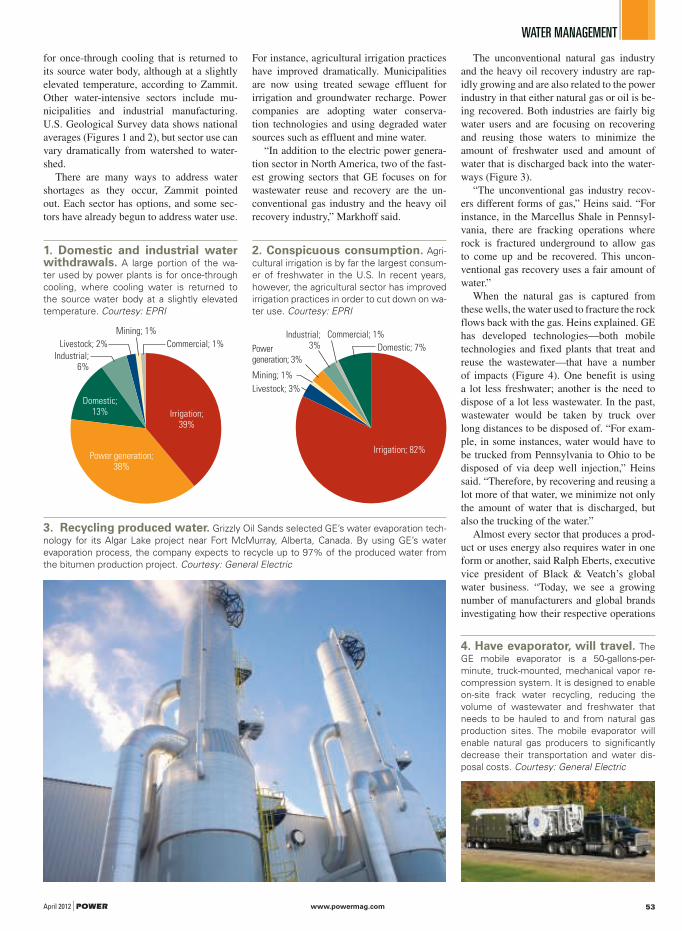
April 2012 | POWER www.powermag.com 53
WATER MANAGEMENT
for once-through cooling that is returned to
its source water body, although at a slightly
elevated temperature, according to Zammit.
Other water-intensive sectors include mu-
nicipalities and industrial manufacturing.
U.S. Geological Survey data shows national
averages (Figures 1 and 2), but sector use can
vary dramatically from watershed to water-
shed.
There are many ways to address water
shortages as they occur, Zammit pointed
out. Each sector has options, and some sec-
tors have already begun to address water use.
For instance, agricultural irrigation practices
have improved dramatically. Municipalities
are now using treated sewage effluent for
irrigation and groundwater recharge. Power
companies are adopting water conserva-
tion technologies and using degraded water
sources such as effluent and mine water.
“In addition to the electric power genera-
tion sector in North America, two of the fast-
est growing sectors that GE focuses on for
wastewater reuse and recovery are the un-
conventional gas industry and the heavy oil
recovery industry,” Markhoff said.
The unconventional natural gas industry
and the heavy oil recovery industry are rap-
idly growing and are also related to the power
industry in that either natural gas or oil is be-
ing recovered. Both industries are fairly big
water users and are focusing on recovering
and reusing those waters to minimize the
amount of freshwater used and amount of
water that is discharged back into the water-
ways (Figure 3).
“The unconventional gas industry recov-
ers different forms of gas,” Heins said. “For
instance, in the Marcellus Shale in Pennsyl-
vania, there are fracking operations where
rock is fractured underground to allow gas
to come up and be recovered. This uncon-
ventional gas recovery uses a fair amount of
water.”
When the natural gas is captured from
these wells, the water used to fracture the rock
flows back with the gas. Heins explained. GE
has developed technologies—both mobile
technologies and fixed plants that treat and
reuse the wastewater—that have a number
of impacts (Figure 4). One benefit is using
a lot less freshwater; another is the need to
dispose of a lot less wastewater. In the past,
wastewater would be taken by truck over
long distances to be disposed of. “For exam-
ple, in some instances, water would have to
be trucked from Pennsylvania to Ohio to be
disposed of via deep well injection,” Heins
said. “Therefore, by recovering and reusing a
lot more of that water, we minimize not only
the amount of water that is discharged, but
also the trucking of the water.”
Almost every sector that produces a prod-
uct or uses energy also requires water in one
form or another, said Ralph Eberts, executive
vice president of Black & Veatch’s global
water business. “Today, we see a growing
number of manufacturers and global brands
investigating how their respective operations
1. Domestic and industrial water withdrawals. A large portion of the wa-
ter used by power plants is for once-through
cooling, where cooling water is returned to
the source water body at a slightly elevated
temperature. Courtesy: EPRI
Irrigation; 39%
Power generation; 38%
Domestic; 13%
Industrial; 6%
Livestock; 2%
Mining; 1%
Commercial; 1%
2. Conspicuous consumption. Agri-
cultural irrigation is by far the largest consum-
er of freshwater in the U.S. In recent years,
however, the agricultural sector has improved
irrigation practices in order to cut down on wa-
ter use. Courtesy: EPRI
Irrigation; 82%
Domestic; 7%
Livestock; 3%
Mining; 1%
Power generation; 3%
Commercial; 1%Industrial; 3%
3. Recycling produced water. Grizzly Oil Sands selected GE’s water evaporation tech-
nology for its Algar Lake project near Fort McMurray, Alberta, Canada. By using GE’s water
evaporation process, the company expects to recycle up to 97% of the produced water from
the bitumen production project. Courtesy: General Electric
4. Have evaporator, will travel. The
GE mobile evaporator is a 50-gallons-per-
minute, truck-mounted, mechanical vapor re-
compression system. It is designed to enable
on-site frack water recycling, reducing the
volume of wastewater and freshwater that
needs to be hauled to and from natural gas
production sites. The mobile evaporator will
enable natural gas producers to significantly
decrease their transportation and water dis-
posal costs. Courtesy: General Electric

www.powermag.com POWER | April 201254
WATER MANAGEMENT
can become water-neutral. The recent winner
of the Stockholm Water Prize for Industry
was Nestle. This is a company that has real-
ized that water represents a significant cost
and a significant limitation to its operations
and as a company has become more consci-
entious in its use of water,” Eberts said.
Discharge Constraints Due to New Regulations The U.S. Environmental Protection Agency
(EPA) is in the process of revising effluent
guidelines for steam electric plants under the
Clean Water Act, Zammit explained. The fo-
cus to date has been on flue gas desulfuriza-
tion system wastewater.
“In addition, stricter water quality criteria
and new Total Maximum Daily Load stan-
dards are providing new challenges for the
removal of trace metals and other constitu-
ents from wastewater,” Zammit said.
Some regulators are also writing in strict-
er limits for National Pollution Discharge
Elimination System permits around thermal
discharge for once-through cooling. Zammit
emphasized that “all of these rules are creat-
ing more constraints on the operation of ex-
isting and new power plants and also creating
difficulties with the retrofit of required air
quality control equipment in cases where it
impacts wastewater quality.”
“Many power plants, especially in the
southwestern United States, have turned to
zero–liquid discharge technology, which
means you are recovering and reusing 100%
of the wastewater and discharging nothing,”
Heins said. “With the zero–liquid discharge
process, the wastewater is recovered and re-
used, usually with an evaporation or a distil-
lation process.”
Regulations that limit or eliminate the use
of water intake cooling systems are likely
to require power plant owners to install
less-effective cooling systems or shut down
their plants, Heins said. Assuming the power
plant’s remaining usable life and other eco-
nomic and physical space factors support the
investment in a new cooling system, the total
power plant capacity and efficiency will be
reduced. Heins asserted that “this reduced
capacity and efficiency would require more
fuel to be consumed to generate an equiva-
lent amount of electricity, resulting in in-
creased generation costs, and in the case of
fossil generation, increased emissions of
greenhouse gases and other pollutants.”
Markhoff added that with a broad program
of eliminating water intake cooling systems,
the resulting reduction of total plant capaci-
ties would require a corresponding invest-
ment in new plant capacity.
“Making predictions regarding the type
and magnitude of this ‘replacement’ plant ca-
pacity would not be prudent,” Markhoff said.
“However, most plants that use water intake
cooling systems operate at high capacity fac-
tors, implying that intermittent sources such
as renewables may not meet grid operation
requirements, and higher–capacity factor
generation may be more suitable.”
Andy Byers, associate vice president of
Black & Veatch’s global energy business,
pointed out that individual states are setting
more and more stringent water quality stan-
dards for streams and lakes, which often cre-
ate challenges for thermal power plants that
discharge effluents to these water bodies.
Because many plant processes may result in
not only adding, but also concentrating, pol-
lutants already present in the water supply
before returning them to the regulated wa-
ter body, power plant effluents often cannot
meet the new water quality limits without
further treatment.
“In some cases, the additional treatment
to meet these in-stream standards may be so
challenging or costly that plants may chose
Meet the EditorThomas Overton, JD
Gas Technology Editor
Meet the founding editor of
GAS POWER. Tom has over 15
years of experience in scientiic
and professional publishing,
and is a licensed California lawyer specializing in
copyright and intellectual property issues. As gas
technology editor, he will provide GAS POWER
Direct readers the latest technical data through blogs,
commentary, webinars and more.
Visit www.powermag.com/gaspower/
and sign up for the GAS POWER
Direct e-newsletter to get
the latest gas-ired generation
technology news.
As gas market opportunities continue to lourish, trust the newest POWER brand, GAS POWER, to deliver the latest global gas-ired generation industry news.
We’ll have exclusive gas-fired generation industry coverage of ELECTRIC POWER 2012 & the Combined Cycle Users’ Group Annual Meeting!
» ELECTRIC POWER Track 2:
Gas Turbine/Combined-Cycle Power Plants
» he Combined Cycle Users’ Group Annual Meeting
www.powermag.com/gaspower

April 2012 | POWER www.powermag.com 55
WATER MANAGEMENT
to install a zero–liquid discharge system
where most all of the wastewater is reused,
consumed, and/or evaporated on-site,” By-
ers said. “While this serves to maintain the
stream’s water quality, it also reduces its
flow, and therefore may be counterproductive
to addressing other water scarcity issues.”
The EPA is expected to finalize its pro-
posed new cooling water intake rulemaking
for existing facilities by July 2012, Byers
explained. Because the cooling water intake
flow applicability threshold was dropped to 2
million gallons per day, this rule as proposed
will regulate not only power plants with once-
through cooling but also some with closed
cycle cooling tower systems. Depending upon
the final requirements, many power plants
may be able to achieve compliance by upgrad-
ing their intake design and operations to mini-
mize impacts to fish and aquatic species.
“The final regulations, however, may
force some plants to convert from once-
through cooling to closed cycle cooling tow-
ers, which, in addition to being costly, will
also result in a reduction of plant efficiency
and power output,” Byers said.
Before the EPA released its proposed rule
in March 2011, many analysts who had as-
sumed the rule would require all power plants
with once-through cooling systems to convert
to closed loop cooling towers forecasted that
the associated costs would force a significant
number of plants to shut down entirely. Byers
pointed out that “while the rule as currently
proposed may still (alone or in conjunction
with other EPA regulatory drivers) induce
some plants to retire, the proposed rule’s re-
quirements provide more options for contin-
ued operation, and in any event, the five-year
phase-in period for compliance, would not
force those decisions until closer to the end
of the current decade.”
Trends in the Power Sector’s Water UsageZammit explained that water resources vary
“dramatically from watershed to watershed,
depending on current uses, allocation (over-
allocation), changes in land use and runoff,
overdraw of groundwater aquifers, and the
aforementioned climate changes.”
Although EPRI has water management
risk analysis tools that can be used to exam-
ine sector water requirements, sustainability
goals, and conservation options for a given
watershed, it is difficult to predict what im-
pacts will be related to each sector. For in-
stance, much of the new power generation
in the arid Southwest has been natural gas
combined cycle units with air cooling, which
reduces utility water use per net megawatt-
hour. Zammit added that “this trend is ex-
pected to continue with lower natural gas
prices. Also, wind and solar photovoltaic are
playing roles in reducing power sector water
use. Municipal demands are growing, but so
is effluent reuse” (Figures 5 and 6).
Developing Generation Technologies That Conserve WaterNETL’s advanced cooling technology projects
are attempting to increase the efficiency of
cooling processes, including using less water
and making dry cooling less power intensive.
Carney pointed out that “water recovery from
power plants has been most successful in con-
densing the water from the flue gas and not
only capturing this water but also capturing
some of the energy lost with the water and
putting it back into the power cycle.”
Traditionally, power plants are located
next to large rivers, and water is withdrawn
as needed for cooling, Carney said. Newer
sources of water are reclaimed wastewater,
underground mine pool water, produced wa-
ter from oil and natural gas production, and
other sources that may need treatment prior
70,000
60,000
50,000
40,000
30,000
20,000
10,000
01950 1960 1970 1980 1990 2000
Wa
ter
use
(g
all
on
s/M
Wh
)
5. Cutting water use in power generation. New technological developments in
power generation are helping to reduce water use. For example, much of the new power gen-
eration in the arid Southwest has been from natural gas combined cycle units with air cooling,
which reduces utility water use per net MWh. Courtesy: EPRI
Boiler makeup Scrubbing Ash handling Inlet air cooling
CT injection Fuel processing Cooling
900
800
700
600
500
400
300
200
100
0Nuclear Coal Oil Gas Simple
CTCombined
cycleIGCC Solar
thermalSolar PV Wind Biofuel
Wa
ter
use
(g
all
on
s/M
Wh
)
6. A range of water footprints. Water use varies widely among the different power
plant types. For example, nuclear power generation is the most water-intensive, while solar
photovoltaic and wind energy use no water to generate electricity. Analysis assumes closed
cycle wet cooling towers are used. Courtesy: EPRI
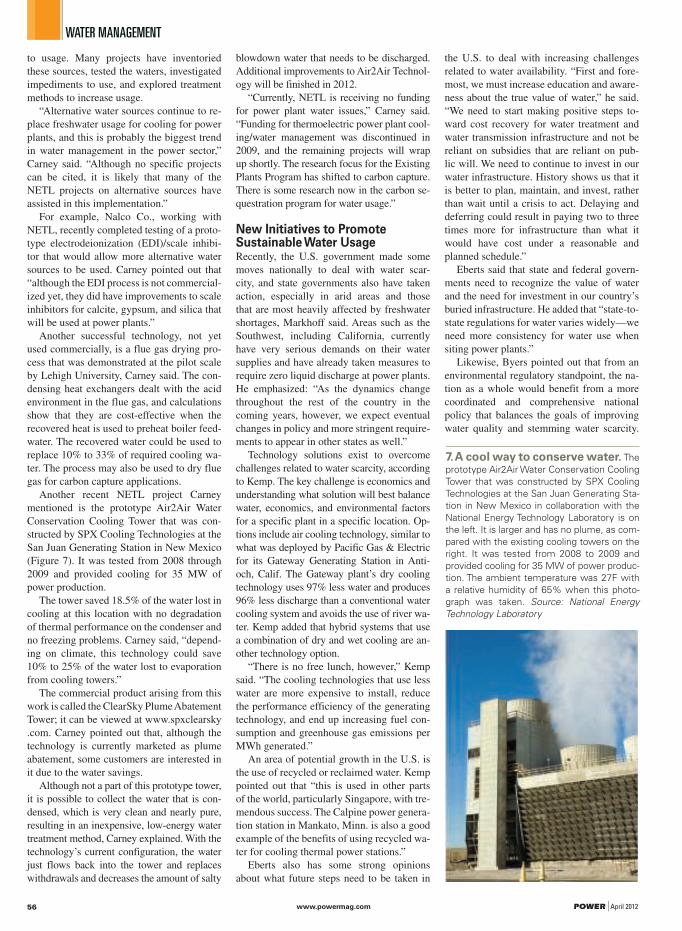
www.powermag.com POWER | April 201256
WATER MANAGEMENT
to usage. Many projects have inventoried
these sources, tested the waters, investigated
impediments to use, and explored treatment
methods to increase usage.
“Alternative water sources continue to re-
place freshwater usage for cooling for power
plants, and this is probably the biggest trend
in water management in the power sector,”
Carney said. “Although no specific projects
can be cited, it is likely that many of the
NETL projects on alternative sources have
assisted in this implementation.”
For example, Nalco Co., working with
NETL, recently completed testing of a proto-
type electrodeionization (EDI)/scale inhibi-
tor that would allow more alternative water
sources to be used. Carney pointed out that
“although the EDI process is not commercial-
ized yet, they did have improvements to scale
inhibitors for calcite, gypsum, and silica that
will be used at power plants.”
Another successful technology, not yet
used commercially, is a flue gas drying pro-
cess that was demonstrated at the pilot scale
by Lehigh University, Carney said. The con-
densing heat exchangers dealt with the acid
environment in the flue gas, and calculations
show that they are cost-effective when the
recovered heat is used to preheat boiler feed-
water. The recovered water could be used to
replace 10% to 33% of required cooling wa-
ter. The process may also be used to dry flue
gas for carbon capture applications.
Another recent NETL project Carney
mentioned is the prototype Air2Air Water
Conservation Cooling Tower that was con-
structed by SPX Cooling Technologies at the
San Juan Generating Station in New Mexico
(Figure 7). It was tested from 2008 through
2009 and provided cooling for 35 MW of
power production.
The tower saved 18.5% of the water lost in
cooling at this location with no degradation
of thermal performance on the condenser and
no freezing problems. Carney said, “depend-
ing on climate, this technology could save
10% to 25% of the water lost to evaporation
from cooling towers.”
The commercial product arising from this
work is called the ClearSky Plume Abatement
Tower; it can be viewed at www.spxclearsky
.com. Carney pointed out that, although the
technology is currently marketed as plume
abatement, some customers are interested in
it due to the water savings.
Although not a part of this prototype tower,
it is possible to collect the water that is con-
densed, which is very clean and nearly pure,
resulting in an inexpensive, low-energy water
treatment method, Carney explained. With the
technology’s current configuration, the water
just flows back into the tower and replaces
withdrawals and decreases the amount of salty
blowdown water that needs to be discharged.
Additional improvements to Air2Air Technol-
ogy will be finished in 2012.
“Currently, NETL is receiving no funding
for power plant water issues,” Carney said.
“Funding for thermoelectric power plant cool-
ing/water management was discontinued in
2009, and the remaining projects will wrap
up shortly. The research focus for the Existing
Plants Program has shifted to carbon capture.
There is some research now in the carbon se-
questration program for water usage.”
New Initiatives to Promote Sustainable Water UsageRecently, the U.S. government made some
moves nationally to deal with water scar-
city, and state governments also have taken
action, especially in arid areas and those
that are most heavily affected by freshwater
shortages, Markhoff said. Areas such as the
Southwest, including California, currently
have very serious demands on their water
supplies and have already taken measures to
require zero liquid discharge at power plants.
He emphasized: “As the dynamics change
throughout the rest of the country in the
coming years, however, we expect eventual
changes in policy and more stringent require-
ments to appear in other states as well.”
Technology solutions exist to overcome
challenges related to water scarcity, according
to Kemp. The key challenge is economics and
understanding what solution will best balance
water, economics, and environmental factors
for a specific plant in a specific location. Op-
tions include air cooling technology, similar to
what was deployed by Pacific Gas & Electric
for its Gateway Generating Station in Anti-
och, Calif. The Gateway plant’s dry cooling
technology uses 97% less water and produces
96% less discharge than a conventional water
cooling system and avoids the use of river wa-
ter. Kemp added that hybrid systems that use
a combination of dry and wet cooling are an-
other technology option.
“There is no free lunch, however,” Kemp
said. “The cooling technologies that use less
water are more expensive to install, reduce
the performance efficiency of the generating
technology, and end up increasing fuel con-
sumption and greenhouse gas emissions per
MWh generated.”
An area of potential growth in the U.S. is
the use of recycled or reclaimed water. Kemp
pointed out that “this is used in other parts
of the world, particularly Singapore, with tre-
mendous success. The Calpine power genera-
tion station in Mankato, Minn. is also a good
example of the benefits of using recycled wa-
ter for cooling thermal power stations.”
Eberts also has some strong opinions
about what future steps need to be taken in
the U.S. to deal with increasing challenges
related to water availability. “First and fore-
most, we must increase education and aware-
ness about the true value of water,” he said.
“We need to start making positive steps to-
ward cost recovery for water treatment and
water transmission infrastructure and not be
reliant on subsidies that are reliant on pub-
lic will. We need to continue to invest in our
water infrastructure. History shows us that it
is better to plan, maintain, and invest, rather
than wait until a crisis to act. Delaying and
deferring could result in paying two to three
times more for infrastructure than what it
would have cost under a reasonable and
planned schedule.”
Eberts said that state and federal govern-
ments need to recognize the value of water
and the need for investment in our country’s
buried infrastructure. He added that “state-to-
state regulations for water varies widely—we
need more consistency for water use when
siting power plants.”
Likewise, Byers pointed out that from an
environmental regulatory standpoint, the na-
tion as a whole would benefit from a more
coordinated and comprehensive national
policy that balances the goals of improving
water quality and stemming water scarcity.
7. A cool way to conserve water. The
prototype Air2Air Water Conservation Cooling
Tower that was constructed by SPX Cooling
Technologies at the San Juan Generating Sta-
tion in New Mexico in collaboration with the
National Energy Technology Laboratory is on
the left. It is larger and has no plume, as com-
pared with the existing cooling towers on the
right. It was tested from 2008 to 2009 and
provided cooling for 35 MW of power produc-
tion. The ambient temperature was 27F with
a relative humidity of 65% when this photo-
graph was taken. Source: National Energy
Technology Laboratory
April 2012 | POWER www.powermag.com 57
WATER MANAGEMENT
Where technology may advance one goal,
economics may drive us in another direction.
The demand for energy and water will only
continue to grow with increasing population,
and the interdependency of energy and water
must be recognized in managing the future
of the U.S.
“The extent to which we can ensure suf-
ficient water remains available for appropri-
ate use in efficient energy production will
be essential to securing reliable delivery of
electricity, which in turn is critical to our
continued global economic prospects and in-
dividual well-being,” Byers said.
Long-Term Water Management ChallengesGiven the complexity of the water/energy in-
terdependence issue, it’s not surprising that
our experts had a variety of views about how
water scarcity problems will be addressed
over the next 25 years.
For example, Kemp pointed out that util-
ity leaders from across the country rated
water supply as the top environmental con-
cern in Black & Veatch’s “2011 Electric
Utility Industry Survey” (www.bv.com/
electricutilitytrends). Water effluent was also
among the top five environmental concerns.
Kemp emphasized that survey respondents
viewed water management as having the
greatest potential to significantly impact the
electric power industry in the near term. The
industry’s concerns about water supplies
have risen considerably over the past five
years during which the annual survey has
been administered.
“Water supply, water effluent, and water
management will all be primary areas of con-
cern and risk mitigation for the foreseeable
future for power and natural gas producers,”
Kemp said.
In contrast, other experts we spoke with
were optimistic that over the next 25 years,
through innovative technologies and sensible
governmental policies, the power industry
will be more successful in protecting our na-
tion’s water resources.
For example, Markhoff commented that
in the long term, the importance of mini-
mizing freshwater make-up and the impor-
tance of eliminating salty water or saline
water discharge back to those waterways
will become significantly more important,
even in areas that do not have significant
regulation today.
“In the next 25 years, you will see an
increase in those trends and regulations to
minimize the amount of discharge and mini-
mize the amount of freshwater make-up,”
Markhoff said. “In the short term, it will be a
slow progression. However, the areas that are
the most affected, like the southwest United
States, already have a lot of those regulations
in place, and in the near term you will see
those trends continue.”
In a similar vein, Zammit emphasized that
“we are seeing this as a serious short-term
problem in some watersheds and isolated
regions of the country. But, as mentioned
before, as power generation is retired and
replaced with less-water-intensive genera-
tion technologies, we should see the electric
power industry decrease its water intensity
over the long term.”
In order to meet our future electricity
and water needs here in the U.S., we have
to begin planning now and determine what
investments we need to make in upgrading
our nation’s generation technologies and wa-
ter treatment infrastructure. Our public and
private entities must work together to suc-
cessfully create reliable, cost-effective, and
sustainable sources of energy and water that
help promote growth in the U.S economy. ■
—Angela Neville, JD, is POWER’s
senior editor.
Find cogen power plants in South India, list new coal-fired projects in Germany, track hydroelectric projects in Brazil, and more ...
The Platts UDI World Electric Power Plants
Database (WEPP) is an inventory of generating
units covering plants of all sizes and
technologies operated by regulated utilities,
private power companies, and industrial
autoproducers (captive power).
This unique database is the largest global
power plant information resource available.
To purchase the UDI World Electric Power Plants Database, visit www.udidata.com or call your nearest Platts office.
North America Europe/Middle East/Africa Latin America Asia-Pacific
1-800-PLATTS8 (toll-free) +44-20-7176-6111 +54-11-4804-1890 +65-6530-6430
+1-212-904-3070 (direct)
For more information about Platts UDI databases and directories, visit www.udidata.com.
UDI World Electric Power Plants Database – The Original Global Reference

www.powermag.com POWER | April 201258
PLANT COOLING
Clever “Helper” Tower Solves Cooling Water DilemmaGone are the days when ocean or river water for once-through cooling of
a new power plant was assumed to be available. Today, more than 500 fossil-fueled and 38 nuclear plants use once-through cooling. However, regulators in several states are aggressively pushing what is essentially a ban on the use of once-through water cooling, forcing a conversion to closed-cycle cooling.
By Jeffrey S. Mallory PE, Sargent & Lundy
The availability of open-cycle cooling
water was usually the determining
factor when siting a new power plant
in years past. Along the coasts, seawater
was available; river water was favored else-
where. If a suitable river wasn’t available,
then a cooling lake was created. Technical
advances in cooling technology, often driv-
en by emerging regulatory requirements,
soon made historic cooling water sources
more problematic.
By the 1970s, new plants used large-scale
cooling towers for cooling a plant’s con-
denser. Today, plants that still rely on open-
cycle cooling are exploring how to make the
transition to closed cooling systems because
of tightening regulatory requirements with
respect to protecting aquatic life, reducing
the thermal discharge into the water, and con-
cerns about protecting water supplies.
This article focuses on evaluating power
plant thermal discharges. A previous article
presented many of the aquatic protection tech-
nologies available to plant owners to comply
with National Pollutant Discharge Elimina-
tion System (NPDES) permit requirements
(see “CWA 316(b) Update: Fish Guidance
and Protection” in the October 2011 issue or
in the archives at www.powermag.com).
Cooling Water TrendsThe responsibility for meeting Clean Water
Act (CWA) section 316(b) requirements to
protect aquatic life and manage thermal dis-
charges through technology-based solutions
is delegated to the states. The states manage
individual water discharges through the issu-
ance of NPDES permits.
The current trend concerning revisions in
NPDES permits requires reducing the amount
of thermal energy rejected or reducing the
cooling water outlet temperature, or both.
Short of reducing plant load, reducing the
thermal energy discharge is a euphemism for
converting all or part of the cooling water heat
rejection process from once-through cooling
to one of the many closed-cooling options.
The only other option is plant closure.
The challenge for designers asked to make
an assessment of the feasibility and eco-
nomics of a conversion from open to closed
cooling is that there is no one-size-fits-all so-
lution. Each plant presents a unique design
challenge. In fact, many plant owners have
received poor advice about cooling system
conversions, resulting in inaccurate cost esti-
mates, overly aggressive construction sched-
ules, and unrealistic operational expectations.
Additionally, plant owners often fail to con-
sider their plant’s unique design and opera-
tions features and are unaware of the many
new technology solutions now available.
Why Are Cooling Towers Added or Replaced?New cooling towers are added and existing
ones are replaced if the current cooling sys-
tem heat rejection capability is inadequate or
emerging regulatory requirements make the
conversion a requirement.
In California, for example, the State Water
Resources Control Board (SWRCB) adopted
“Water Quality Control Policy on the Use
of Coastal and Estuarine Waters for Power
Plant Cooling,” which became effective Oct.
1, 2010. The policy effectively requires all
19 of the state’s coastal plants (including two
nuclear plants) to transition to closed cool-
ing to meet the state’s best technology avail-
able requirement under CWA section 316(b).
Implementation plans prepared by fossil
plant owners were submitted to the SWRCB
on April 1, 2011, and implementation dates
are under negotiation. A “Scope of Work Re-
port” outlining consultant qualifications and
study requirements for the two nuclear plants
was completed on Nov. 7, 2011. Selection of
the consulting engineering companies to per-
form the studies is pending (Figure 1).
1. Cooling system conversions. California’s San Onofre (pictured) and Diablo Canyon
nuclear power plants have been tasked with evaluating technologies and strategies to comply
with Clean Water Act section 316(b) best technology available requirements, including the op-
tion of switching from an open cooling system to a closed or dry cooling system, among many
other requirements. Source: Southern California Edison/Nuclear Regulatory Commission
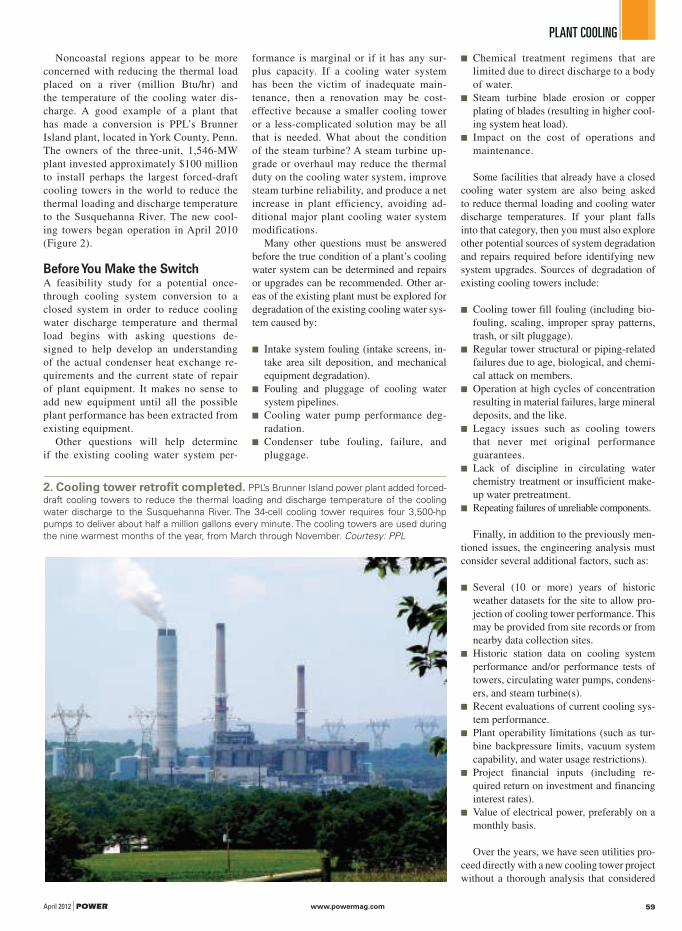
April 2012 | POWER www.powermag.com 59
PLANT COOLING
Noncoastal regions appear to be more
concerned with reducing the thermal load
placed on a river (million Btu/hr) and
the temperature of the cooling water dis-
charge. A good example of a plant that
has made a conversion is PPL’s Brunner
Island plant, located in York County, Penn.
The owners of the three-unit, 1,546-MW
plant invested approximately $100 million
to install perhaps the largest forced-draft
cooling towers in the world to reduce the
thermal loading and discharge temperature
to the Susquehanna River. The new cool-
ing towers began operation in April 2010
(Figure 2).
Before You Make the SwitchA feasibility study for a potential once-
through cooling system conversion to a
closed system in order to reduce cooling
water discharge temperature and thermal
load begins with asking questions de-
signed to help develop an understanding
of the actual condenser heat exchange re-
quirements and the current state of repair
of plant equipment. It makes no sense to
add new equipment until all the possible
plant performance has been extracted from
existing equipment.
Other questions will help determine
if the existing cooling water system per-
formance is marginal or if it has any sur-
plus capacity. If a cooling water system
has been the victim of inadequate main-
tenance, then a renovation may be cost-
effective because a smaller cooling tower
or a less-complicated solution may be all
that is needed. What about the condition
of the steam turbine? A steam turbine up-
grade or overhaul may reduce the thermal
duty on the cooling water system, improve
steam turbine reliability, and produce a net
increase in plant efficiency, avoiding ad-
ditional major plant cooling water system
modifications.
Many other questions must be answered
before the true condition of a plant’s cooling
water system can be determined and repairs
or upgrades can be recommended. Other ar-
eas of the existing plant must be explored for
degradation of the existing cooling water sys-
tem caused by:
■ Intake system fouling (intake screens, in-
take area silt deposition, and mechanical
equipment degradation).
■ Fouling and pluggage of cooling water
system pipelines.
■ Cooling water pump performance deg-
radation.
■ Condenser tube fouling, failure, and
pluggage.
■ Chemical treatment regimens that are
limited due to direct discharge to a body
of water.
■ Steam turbine blade erosion or copper
plating of blades (resulting in higher cool-
ing system heat load).
■ Impact on the cost of operations and
maintenance.
Some facilities that already have a closed
cooling water system are also being asked
to reduce thermal loading and cooling water
discharge temperatures. If your plant falls
into that category, then you must also explore
other potential sources of system degradation
and repairs required before identifying new
system upgrades. Sources of degradation of
existing cooling towers include:
■ Cooling tower fill fouling (including bio-
fouling, scaling, improper spray patterns,
trash, or silt pluggage).
■ Regular tower structural or piping-related
failures due to age, biological, and chemi-
cal attack on members.
■ Operation at high cycles of concentration
resulting in material failures, large mineral
deposits, and the like.
■ Legacy issues such as cooling towers
that never met original performance
guarantees.
■ Lack of discipline in circulating water
chemistry treatment or insufficient make-
up water pretreatment.
■ Repeating failures of unreliable components.
Finally, in addition to the previously men-
tioned issues, the engineering analysis must
consider several additional factors, such as:
■ Several (10 or more) years of historic
weather datasets for the site to allow pro-
jection of cooling tower performance. This
may be provided from site records or from
nearby data collection sites.
■ Historic station data on cooling system
performance and/or performance tests of
towers, circulating water pumps, condens-
ers, and steam turbine(s).
■ Recent evaluations of current cooling sys-
tem performance.
■ Plant operability limitations (such as tur-
bine backpressure limits, vacuum system
capability, and water usage restrictions).
■ Project financial inputs (including re-
quired return on investment and financing
interest rates).
■ Value of electrical power, preferably on a
monthly basis.
Over the years, we have seen utilities pro-
ceed directly with a new cooling tower project
without a thorough analysis that considered
2. Cooling tower retrofit completed. PPL’s Brunner Island power plant added forced-
draft cooling towers to reduce the thermal loading and discharge temperature of the cooling
water discharge to the Susquehanna River. The 34-cell cooling tower requires four 3,500-hp
pumps to deliver about half a million gallons every minute. The cooling towers are used during
the nine warmest months of the year, from March through November. Courtesy: PPL

www.powermag.com POWER | April 201260
PLANT COOLING
all these factors. The resulting projects were
initiated without understanding their true cost
and scope. By not first repairing or upgrad-
ing existing infrastructure, these plants didn’t
operate optimally after the modification. The
inevitable result of adding much new equip-
ment was an overly expensive closed cooling
water system that was suboptimized for its
intended purpose.
A proper evaluation will present several
feasible approaches from which the owner
may select one that will optimize perfor-
mance of the overall plant. Plant-specific
factors must also be addressed in the anal-
ysis, such as specific limitations imposed
by regulators, constructability issues re-
lated to plant site constraints, different
contracting options, and economic factors
peculiar to the project.
Project Case StudyA series of engineering studies was recently
completed for a four-unit coal-fired station
with once-through cooling provided by an
adjacent river. This plant exemplifies the
complicated nature of once-through cooling
system conversions. The units are small, each
less than 200 MW, and total plant capacity
is just over 600 MW. (We are intentionally
40,000
35,000
30,000
25,000
20,000
15,000
10,000
5,000
0
100
90
80
70
60
50
40
30
20
10
0
1 2 3 4 5 6 7 8 9 10 11 12Month
Th
erm
al
dis
ch
arg
e (
MB
tu/d
ay)
Tem
pe
ratu
re (
F)
Thermal discharge limit Units 1&2 thermal load River temp. limit
3. Heat-limited plant. Owners of a four-unit, approximately 600-MW plant using once-through
cooling were evaluating the potential requirement to reduce both the plant’s cooling water discharge
temperature and thermal discharge limit to a river, in million Btu/day. Shown in orange is the proposed
maximum allowable thermal load to be applied to all four units. Shown in dark blue is the typical
thermal load from only Units 1 and 2 at full power. Note how the thermal load from only two units ex-
ceeds the proposed limit during the entire year, except for part of May. Also included is the anticipated
downstream river temperature limitation for the station. Plant operation has resulted in downstream
river temperatures up to 120F in the past. Source: Sargent & Lundy
The cost is $170 per player.
THIS FEE INCLUDES: To make reservation, call Melissa Helms at 832-242-1969 or email [email protected]
Golf TournamentMonday, May 14, 2012
DIAMOND RIDGE GOLF CLUB2309 Ridge Road
Windsor Mill, MD 21244
410-887-1349
Join us for the 7th Annual
&
• Transportation to & from the course
• Breakfast and Lunch
• Snacks and drinks
• Open bar during lunch
• Golf and Cart
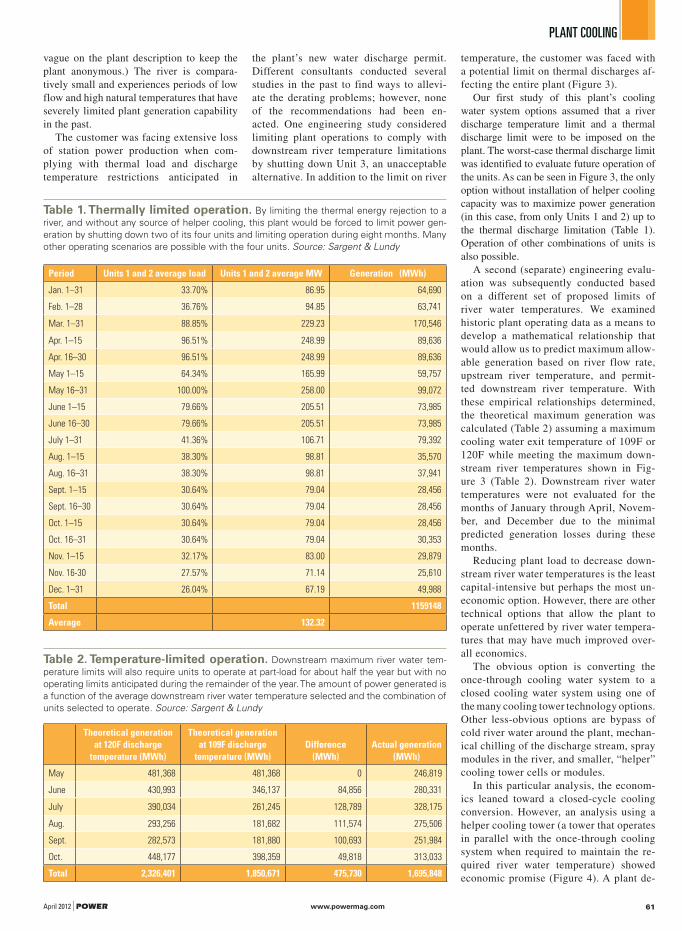
April 2012 | POWER www.powermag.com 61
PLANT COOLING
vague on the plant description to keep the
plant anonymous.) The river is compara-
tively small and experiences periods of low
flow and high natural temperatures that have
severely limited plant generation capability
in the past.
The customer was facing extensive loss
of station power production when com-
plying with thermal load and discharge
temperature restrictions anticipated in
the plant’s new water discharge permit.
Different consultants conducted several
studies in the past to find ways to allevi-
ate the derating problems; however, none
of the recommendations had been en-
acted. One engineering study considered
limiting plant operations to comply with
downstream river temperature limitations
by shutting down Unit 3, an unacceptable
alternative. In addition to the limit on river
temperature, the customer was faced with
a potential limit on thermal discharges af-
fecting the entire plant (Figure 3).
Our first study of this plant’s cooling
water system options assumed that a river
discharge temperature limit and a thermal
discharge limit were to be imposed on the
plant. The worst-case thermal discharge limit
was identified to evaluate future operation of
the units. As can be seen in Figure 3, the only
option without installation of helper cooling
capacity was to maximize power generation
(in this case, from only Units 1 and 2) up to
the thermal discharge limitation (Table 1).
Operation of other combinations of units is
also possible.
A second (separate) engineering evalu-
ation was subsequently conducted based
on a different set of proposed limits of
river water temperatures. We examined
historic plant operating data as a means to
develop a mathematical relationship that
would allow us to predict maximum allow-
able generation based on river flow rate,
upstream river temperature, and permit-
ted downstream river temperature. With
these empirical relationships determined,
the theoretical maximum generation was
calculated (Table 2) assuming a maximum
cooling water exit temperature of 109F or
120F while meeting the maximum down-
stream river temperatures shown in Fig-
ure 3 (Table 2). Downstream river water
temperatures were not evaluated for the
months of January through April, Novem-
ber, and December due to the minimal
predicted generation losses during these
months.
Reducing plant load to decrease down-
stream river water temperatures is the least
capital-intensive but perhaps the most un-
economic option. However, there are other
technical options that allow the plant to
operate unfettered by river water tempera-
tures that may have much improved over-
all economics.
The obvious option is converting the
once-through cooling water system to a
closed cooling water system using one of
the many cooling tower technology options.
Other less-obvious options are bypass of
cold river water around the plant, mechan-
ical chilling of the discharge stream, spray
modules in the river, and smaller, “helper”
cooling tower cells or modules.
In this particular analysis, the econom-
ics leaned toward a closed-cycle cooling
conversion. However, an analysis using a
helper cooling tower (a tower that operates
in parallel with the once-through cooling
system when required to maintain the re-
quired river water temperature) showed
economic promise (Figure 4). A plant de-
Period Units 1 and 2 average load Units 1 and 2 average MW Generation (MWh)
Jan. 1–31 33.70% 86.95 64,690
Feb. 1–28 36.76% 94.85 63,741
Mar. 1–31 88.85% 229.23 170,546
Apr. 1–15 96.51% 248.99 89,636
Apr. 16–30 96.51% 248.99 89,636
May 1–15 64.34% 165.99 59,757
May 16–31 100.00% 258.00 99,072
June 1–15 79.66% 205.51 73,985
June 16–30 79.66% 205.51 73,985
July 1–31 41.36% 106.71 79,392
Aug. 1–15 38.30% 98.81 35,570
Aug. 16–31 38.30% 98.81 37,941
Sept. 1–15 30.64% 79.04 28,456
Sept. 16–30 30.64% 79.04 28,456
Oct. 1–15 30.64% 79.04 28,456
Oct. 16–31 30.64% 79.04 30,353
Nov. 1–15 32.17% 83.00 29,879
Nov. 16-30 27.57% 71.14 25,610
Dec. 1–31 26.04% 67.19 49,988
Total 1159148
Average 132.32
Table 1. Thermally limited operation. By limiting the thermal energy rejection to a
river, and without any source of helper cooling, this plant would be forced to limit power gen-
eration by shutting down two of its four units and limiting operation during eight months. Many
other operating scenarios are possible with the four units. Source: Sargent & Lundy
Theoretical generation
at 120F discharge
temperature (MWh)
Theoretical generation
at 109F discharge
temperature (MWh)
Difference
(MWh)
Actual generation
(MWh)
May 481,368 481,368 0 246,819
June 430,993 346,137 84,856 280,331
July 390,034 261,245 128,789 328,175
Aug. 293,256 181,682 111,574 275,506
Sept. 282,573 181,880 100,693 251,984
Oct. 448,177 398,359 49,818 313,033
Total 2,326,401 1,850,671 475,730 1,695,848
Table 2. Temperature-limited operation. Downstream maximum river water tem-
perature limits will also require units to operate at part-load for about half the year but with no
operating limits anticipated during the remainder of the year. The amount of power generated is
a function of the average downstream river water temperature selected and the combination of
units selected to operate. Source: Sargent & Lundy

www.powermag.com POWER | April 201262
PLANT COOLING
rate analysis was performed to determine
the optimum number of cooling tower
cells required to produce a 109F and a
120F river water temperature downstream
of station discharge. When the discharge
requirement is 109F, adding more than
eight cooling tower cells (modules) pro-
vided negligible economic benefit.
Not surprising, the site layout did not
consider the future possibility of adding
a large cooling tower. Existing infrastruc-
ture was carefully considered to properly
locate the new cooling tower as well as
to minimize installed and operating costs.
Options for converting all four units, as
well as only two of the units, were also
investigated. The ultimate recommended
tower location was different than that sug-
gested by other consultants due to the po-
tential for icing of the switchyard. The new
location benefited from the ability to reuse
existing cooling water piping, although it
was directly adjacent to a busy haul road
and the coal pile.
After detailed discussions with tower
vendors, it was determined that as long as
a low clog-type tower fill was selected, the
amount of sludge to be removed during ba-
sin cleanings would increase, but the dusty
location would not otherwise affect tower
performance. Furthermore, plume abate-
ment was required due to the proximity of
the tower to a nearby bridge, which could
experience dangerous fogging and icing
from a tower plume.
The proper design point for the plume
abatement system was selected and the
corresponding additional cost was in-
cluded in the project budget. The customer
now has a solid plan ready to implement
should regulators add new river water ther-
mal discharge and/or temperature limits to
the plant’s NPDES permit in the future. ■
—Jeffrey S. Mallory, PE ([email protected]) is a project engineer I for
Sargent & Lundy.
4. Lend a helping hand. A “helper” cooling tower with perhaps eight cells was found
to be the best economic option for the case study plant if it must operate under a downstream
river water temperature limitation of 120F. Source: Sargent & Lundy
500,000
450,000
400,000
350,000
300,000
250,000
200,000
150,000
100,000
50,000
00
Lost
ge
ne
rati
on
(M
Wh
)
5 10 15
Number of rental cooling tower cells
Wind
Solar
Bioenergy
ocean
geothermal
WaSte to energy
hydro
octoBer 17-19, 2012OMNI SHOREHAM | WASHINGTON D.C.
www.retech2012.comHosted by: Organized by:

April 2012 | POWER www.powermag.com 63
INDUSTRY COMMUNICATION
POWER Gets SocialDo you have professional insights to share with others in the industry—or
questions for those with a particular expertise? Do you want to get news and information from POWER more than monthly or weekly? Then join POWER on these social media platforms.
By Dr. Gail Reitenbach
The tagline for POWER is “Business and
technology for the global generation in-
dustry.” These days, technologies in our
industry are becoming increasingly digital. In
the plant, you see digital tools everywhere,
from handheld monitoring devices to complete
digital control systems. Beyond the plant, the
entire electric system is slowly adding digital
information and communication technologies
all along the chain, from production through
transmission and distribution to consump-
tion—an updating process commonly referred
to by the shorthand term “smart grid.”
Social MediaCommunication, even social interaction, has
also gone digital, so POWER has entered the
social media realm. It’s just one more way
we provide valuable information to, and hear
from, our audience. If you use one or more
of the popular social media platforms, here’s
how you can join the POWER community.
Twitter. “Tweets,” as posts to this public
platform are known, are limited to 140 char-
acters. Anyone can see anyone else’s tweets,
but most users select a number of other users
to “follow” so those posts automatically show
up on their home page. It’s a good way to see
what others in a niche market or a broad in-
dustry are announcing and talking about. The
main POWER handle is @POWERmagazine.
You can also follow our gas technology editor,
Tom Overton, @thomas_overton. If we tweet
about something you like or find interesting,
retweet. We post from events we attend as well
as timely news items and reminders.
Facebook. Because Facebook allows lon-
ger posts than Twitter, it’s an easier place to
comment on stories or videos we link to, from
our own publications and other sources. When
you “Like” our Facebook fan page (facebook
.com/POWERmagazine), you can comment
on posts. However, unlike personal Facebook
pages, you cannot post directly to our wall.
Google+. This is one of the newest social
media platforms, but it shows some real prom-
ise for both individuals and businesses. The
Hangouts feature, for example, is a handy and
free videoconferencing tool. Add “POWER
magazine” (see Figure 1 screenshot) to your
Google+ circles and follow our posts so you
hear about any future Hangouts. We’re also
using Google+ for industry updates and re-
quests for information, but our use of this
platform is sure to evolve.
LinkedIn. This professional networking site
is home to thousands of groups for every in-
dustry and interest imaginable. POWER spon-
sors two: “POWER magazine” and “Women in
Power Generation.” These are “closed” groups,
so you must be a LinkedIn member to join. Col-
leagues in our media company who cover the
chemical engineering industry demonstrated
that a LinkedIn group can be a great way for
members to ask for advice, share best practices,
and generally develop a sense of a professional
community. (Remember to post job openings to
the Jobs tab and event promotions to the Promo-
tions tab rather than in the Discussions area.)
Though we try to cover the full spectrum
of issues in the global generation market-
place, we can’t cover it all, and we realize
that our audience is full of experts. These
LinkedIn groups are a great way for you to
contribute your expertise (but no sales pitch-
es, please). We hope you will join one or both
of our groups and use them to share your ex-
perience, insights, and sound advice.
Virtually SocialOur fleet of publications—POWER, POWER-
news, COAL POWER, MANAGING POWER,
and GAS POWER—is produced by a busy staff
of just five full-time editorial staff members.
That means we don’t have the bandwidth to re-
spond to or comment on all posts; however, we
do keep an eye and an ear on the social buzz.
When necessary, we will moderate and block
inappropriate posts, so please, keep all com-
ments professional; save anything else for your
personal social media pages.
Remember that you can still comment on in-
dividual stories by using the “Comment” feature
on all our stories online or by sending email to
[email protected]. That address reaches
all of the editors and is also the best address to
use for industry press announcements. Given
the volume of messages we receive daily, we
cannot respond to them individually. If some-
thing is of interest for a feature story, an editor
will follow up, and our marketing staff periodi-
cally posts selected press releases to that section
of powermag.com.
Social media can be a useful way to broaden
your professional network and share lessons
learned. It’s also faster and cheaper than real-
world interactions. However, there are some
in-person events you don’t want to miss. The
most important for our industry is the ELEC-
TRIC POWER Conference & Exhibition (pre-
sented by POWER’s parent company, TradeFair
Group, an Access Intelligence Company). This
year, ELECTRIC POWER will be held May
15–17 in Baltimore. We hope to see you there.
Until then, we’ll see you online! ■
—Dr. Gail Reitenbach is POWER’s managing editor.
1. Add POWER magazine to your circles. Source: POWER

www.powermag.com POWER | April 201264
NEW PRODUCTSTO POWER YOUR BUSINESS
Rust-Preventative Weldable PrimerTempil introduced BLOXIDE°, a rust-preventive weldable primer that provides protection from rust formation on edges prepared for welding. It also acts as an oxygen/oxide scavenger in the weld pool. This results in a clean X-ray quality weld. Steel sections having their prepared edges coated with BLOXIDE° can be stored outside in open yards for extended periods of time before being welded. These can be shop- or field-welded after several months without any need for further cleaning. This saves substantial material and labor costs. Because BLOXIDE° is aluminum based, an electrical welding arc can be struck directly on the coating with ease without generating any hazardous fumes or foul odor. Welding over the aluminum coating also ensures that there are no inclusions or porosity in the weld. (www.tempil.com)
Patented Filter Medium for Core CoolingMulti-disciplined engineering and consulting firm ENERCON received patents for a filter medium for strainers used in nuclear reactor emergency core cooling systems (ECCS). ENERCON’s Debris Bypass Eliminator was developed in response to the Nuclear Regulatory Commission’s Generic Safety Issue, GSI-191, “Assessment of Debris Accumulation on PWR Sump Performance.” During long-term recirculation for cooling of the reactor, core fibrous debris material could bypass through the ECCS sump strainer and potentially block cooling water flow paths in the reactor core. The Debris Bypass Eliminator is a secondary filter system that works with the ECCS sump strainer to reduce or eliminate the fibrous debris material in cooling water entering the reactor core. (www.enercon.com)
Inclusion in New Products does not imply endorsement by POWER magazine.
True Machine Train Alignment Ascertaining the alignment of all machines in a multiple machine train has always been a cumbersome and time-consuming process. The new ROTALIGN ULTRA MultiCoupling feature allows the alignment of up to seven machines in a train to be measured simultaneously, with a single quarter rotation (or less) of the shafts. This saves time and resources when aligning turbine trains on the critical path in an outage or machine trains with gearboxes that are difficult to turn. The millwright’s job efficiency is thereby enhanced while lightening the workload and increasing the accuracy of the final alignment through optimization of corrective moves throughout the train. (www.ludeca.com)

Need help? Need a job?
LINEAL RECRUITINGSERVICES
Contact Lisa Lineal in confi dence
www.Lineal.com • [email protected] free 877-386-1091
Electric Power Systems & Service Specialists Se habla Español
Opportunities in Operations and Maintenance,
Project Engineering and Project Management,
Business and Project Development,
First-line Supervision to Executive Level Positions.
Employer pays fee. Send resumes to:
POWER PROFESSIONALS
P.O. Box 87875Vancouver, WA 98687-7875
email: [email protected]
(360) 260-0979 l (360) 253-5292www.powerindustrycareers.com
PRODUCT Showcase
www.meltric.com800.433.7642
4Simplifies NFPA 70E®compliance4Protects from arc flashQualified technicians can quicklydeenergize and service equipment.Rated up to 200A, 600V, NEMA 4X
Dead FrontSafety Shutter
OFFButton
LOTO
Cost-effective, industry-standard performance test procedures and
calculation templates (Excel)•
ASME Steam Properties Add-In (‘67/’97, SI/English)
•Real Gas Properties Add-In (EOS Based)
•Gas & Steam Properties Calculators
Only $595*
Version 6.0
Free Trial!Try GPCALCS v6.0 free
for 30 days. If you’re not completely satisfied,
simply uninstall the software.
www.gpworldwide.com/gpcalcs
™GPCALCSTHE PERFORMANCE
ENGINEER’S TOOLBOX
For More Information
800.803.6737 • [email protected]
* VISA, MasterCard, AMEX Accepted
GPA-002015 Showcase ad_PowerMag.indd 1 3/12/12 2:05 PM
April 2012 | POWER www.powermag.com 65
POWER PLANT BUYERS’ MART
READER SERVICE NUMBER 201
NEED CABLE? FROM STOCK
Copper Power to 69KV; Bare ACSR & AAC Conductor
Underground UD-P & URD, Substation Control – Shielded and Non-shielded, Interlock Armor to 35KV, Thermocouple
BASIC WIRE & CABLEFax (773) 539-3500 Ph. (800) 227-4292
E-Mail: [email protected] SITE: www.basicwire.com
READER SERVICE NUMBER 203 READER SERVICE NUMBER 205
CONDENSER OR GENERATOR AIR COOLER TUBE PLUGSTHE CONKLIN SHERMAN COMPANY, INC.
Easy to install, saves time and money.
ADJUSTABLE PLUGS-all rubber with brass insert. Expand it, install it, reverse action for tight fi t.
PUSH PULL PLUGS-are all rubber, simply push it in. Sizes 0.530 O.D. to 2.035 O.D.
Tel: (203) 881-0190 • Fax:(203)881-0178E-mail: [email protected] • www.conklin-sherman.com
OVER ONE MILLION PLUGS SOLD
Turbine Controls
Woodward, GE, MHCParts and Service
TurboGen • (610) 631-3480 [email protected]
READER SERVICE NUMBER 204
READER SERVICE NUMBER 206 READER SERVICE NUMBER 207 READER SERVICE NUMBER 208
READER SERVICE NUMBER 202
George H. BodmanPres. / Technical Advisor
Of� ce 1-800-286-6069
Of� ce (281) 359-4006
PO Box 5758 E-mail: [email protected]
Kingwood, TX 77325-5758 Fax (281) 359-4225
GEORGE H. BODMAN, INC. Chemical cleaning advisory services for
boilers and balance of plant systems
BoilerCleaningDoctor.com
READER SERVICE NUMBER 200

www.powermag.com POWER | April 201266
POWER PLANT BUYERS’ MART
READER SERVICE NUMBER 209
READER SERVICE NUMBER 213
GAS TURBINES FOR SALE
• LM6000 • FRAME 9E • FRAME 5
50/60Hz, nat gas or liq fuel,installation and service available
Available for Immediate Shipment
Tel: +1 281.227.5687
Fax: +1 281.227.5698
READER SERVICE NUMBER 210
READER SERVICE NUMBER 211
24 / 7 EMERGENCY SERVICE
BOILERS20,000 - 400,000 #/Hr.
DIESEL & TURBINE GENERATORS50 - 25,000 KW
GEARS & TURBINES25 - 4000 HP
WE STOCK LARGE INVENTORIES OF:Air Pre-Heaters • Economizers • Deaerators
Pumps • Motors • Fuel Oil Heating & Pump SetsValves • Tubes • Controls • CompressorsPulverizers • Rental Boilers & Generators
847-541-5600 FAX: 847-541-1279WEB SITE: www.wabashpower.com
FOR SALE/RENT
POWER
EQUIPMENT CO.
444 Carpenter Avenue, Wheeling, IL 60090
wabash
READER SERVICE NUMBER 212
CONTACT
Diane Hammes
PHONE 713-444-9939 FAX 512-213-4855
CLASSIFIEDS
POWERTo Advertise in

April 2012 | POWER www.powermag.com 67
ADVERTISERS’ INDEXEnter reader service numbers on the FREE Product Information Source card in this issue.
AMEC . . . . . . . . . . . . . . . . . . . . . . . . . . . . . . . . . . . . . . . . . . . . . . . 15 . . . . . . . . . . 8
www.amec.com
Atlas Copco . . . . . . . . . . . . . . . . . . . . . . . . . . . . . . . . . . . . . . . . . . . 45 . . . . . . . . . 20
www.atlascopco.us
Bechel Corp. . . . . . . . . . . . . . . . . . . . . . . . . . . . . . . . . . . . . . . . . . . 17 . . . . . . . . . . .
www.bechtel.com
Caterpillar . . . . . . . . . . . . . . . . . . . . . . . . . . . . . . . . . . . . . . . Cover 4 . . . . . . . . . 22
www.catelectricpowerinfo.com/pm
Chromalloy. . . . . . . . . . . . . . . . . . . . . . . . . . . . . . . . . . . . . . . . . . . . . 3 . . . . . . . . . . 2
www.chromalloy.com
Fluor Corp . . . . . . . . . . . . . . . . . . . . . . . . . . . . . . . . . . . . . . . . . . . . 23 . . . . . . . . . 13
www.fluor.com
GE Energy. . . . . . . . . . . . . . . . . . . . . . . . . . . . . . . . . . . . . . . . . . . . . 13 . . . . . . . . . . 7
www.ge-energy.com
General Physics . . . . . . . . . . . . . . . . . . . . . . . . . . . . . . . . . . . . . . . . 7 . . . . . . . . . . 4
www.etaproefficiency.com
Harco . . . . . . . . . . . . . . . . . . . . . . . . . . . . . . . . . . . . . . . . . . . . . . 16 . . . . . . . . . . 9
www.harcolabs.com
Hytorc Inc. . . . . . . . . . . . . . . . . . . . . . . . . . . . . . . . . . . . . . . . . . . . . . 9 . . . . . . . . . . 5
www.hytorc.com
Hytorc Inc. . . . . . . . . . . . . . . . . . . . . . . . . . . . . . . . . . . . . . . . . . . . . 11 . . . . . . . . . . 6
www.hytorc.com
IFS North America . . . . . . . . . . . . . . . . . . . . . . . . . . . . . . . . . . . . . 27 . . . . . . . . . 15
www.ifsworld.com/en-NA
Jeffrey Rader. . . . . . . . . . . . . . . . . . . . . . . . . . . . . . . . . . . . . . . . . . 25 . . . . . . . . . 14
www.jeffreyrader.com
Outotec . . . . . . . . . . . . . . . . . . . . . . . . . . . . . . . . . . . . . . . . . . . . . . 39 . . . . . . . . . 18
www.outotec.com
Paharpur. . . . . . . . . . . . . . . . . . . . . . . . . . . . . . . . . . . . . . . . . . . . . . 21 . . . . . . . . . 12
www.paharpur.com
Prize Capital . . . . . . . . . . . . . . . . . . . . . . . . . . . . . . . . . . . . . . . . . . 19 . . . . . . . . . 10
www.prizecapital.net
Rentech Boiler . . . . . . . . . . . . . . . . . . . . . . . . . . . . . . . . . . . Cover 2 . . . . . . . . . . 1
www.rentechboilers.com
Roberts & Schaefer . . . . . . . . . . . . . . . . . . . . . . . . . . . . . . . . . . . . 35 . . . . . . . . . 17
www.r-s.com
SMA-America . . . . . . . . . . . . . . . . . . . . . . . . . . . . . . . . . . . . . . . . . 29 . . . . . . . . . 16
www.sma-america.com
STF S.p.A . . . . . . . . . . . . . . . . . . . . . . . . . . . . . . . . . . . . . . . . . . . . . 49 . . . . . . . . . 21
www.stf.it
Tyco Flow Control. . . . . . . . . . . . . . . . . . . . . . . . . . . . . . . . . . . . . . . 5 . . . . . . . . . . 3
www.tycoflowcontrol.com
URS . . . . . . . . . . . . . . . . . . . . . . . . . . . . . . . . . . . . . . . . . . . . . . . . . . 20 . . . . . . . . . 11
www.urs.com
Westinghouse. . . . . . . . . . . . . . . . . . . . . . . . . . . . . . . . . . . . . . . . . 43 . . . . . . . . . 19
www.westinghousenuclear.com
Page
Reader Service Number Page
Reader Service Number
CLASSIFIED ADVERTISINGPages 65-66. To place a classified ad, contact
Diane Hammes, 713-343-1885, [email protected]
3. FOR POWER PRODUCERS (check all that apply)What forms of energy are used at your power plants? For non-power producers, what forms of energy is your company interested in?o Coal – Ao Oil – Bo Natural Gas – Co Nuclear – Do Hydro – Eo Waste – Fo Renewables – Go Other________________________
Do you wish to receive a FREE* subscription to POWER? o YES o NO
Would you like to receive your magazine digitally (email required) or in print? o Digital o Print
Signature ______________________________________ Date ___________________________
Name _______________________________________________________________ Title _______________________________________________________
Company _______________________________________________________________________________________________________________________
Company address ________________________________________________________________________________________________________________
City ______________________________________ State ___________________Zip/Post Code ___________________ Country ______________________
Phone No. ________________________________ Fax No. ______________________________Mobile/Cell No. ____________________________________
E-mail __________________________________________________________________________________________________________________________
PROCESS MANUFACTURINGo Chemicals – 3Ao Petroleum – 3Bo Food – 3Co Paper – 3Do Rubber, stone, glass, clay – 3Eo Metal producing – 3Go Mining – 3Fo Metal fabricating – 3Ho Machinery (electrical mechanical) – 3Io Transportation equipment – 3Jo Lumber, wood products – 3Ko Textiles – 3Lo Other ___________________________
o Investor – Owned Utility – 1Ao IPP/Cogen – 1Bo Rural Electric Co-op 1Co Municipal Utility – 1D o Federal/State Electric System – 1E
o CONSULTING ENGINEERING FIRMS,
INCLUDING CONSTRUCTION, ARCHITECT-
ENGINEER FIRMS – 2A
2. PRIMARY JOB FUNCTION (check one)o General or Corporate
Management – A o Engineering, Operations or Maintenance – Bo Library or Company – C o Other
SUBSCRIBE TO POWER MAGAZINE
HA2009
REPLY ONLINE AT www.submag.com/sub/pw or Fax to: 832-251-1709
ALL questions MUST be answered to qualify for a FREE subscription.
1. DESCRIBE YOUR COMPANY’S BUSINESS (check one):ELECTRIC POWER PRODUCER
o If you prefer not to receive promotional mailings from other companies, please check box.* Publisher reserves the right to determine qualifications for free subscription.

www.powermag.com POWER | April 201268
COMMENTARY
Natural Gas: Secure Supply for Today and the FutureBy Jim Johnson
Ten years ago, I could not have written this column. The natural gas industry was different—limited domestic supply resulted in unstable prices. However, recent advancements
in drilling technology have enabled the industry to discover, ac-cess, and produce abundant sources of natural gas in America. Because the industry has changed, the country’s energy future is now more secure. In the electric utility sector this increase in natural gas supply means less price volatility, and producers are now able and willing to enter into longer-term contracts, which minimize risk to utilities and, ultimately, ratepayers.
Overview of Today’s U.S. Gas ReservesSecure supply should be at the core of any conversation about fuel switching. With a dramatic supply shift in the past decade, it is important to understand the natural gas reserves picture as it stands today. At year-end 2010, the Potential Gas Committee es-timated the current available natural gas resource base as 1,898 trillion cubic feet (Tcf), with a future supply of 2,170 Tcf. This is an almost 70% increase from the committee’s 2000 forecast and the highest resource evaluation reported in the organization’s 46-year history. According to a North American Resource Devel-opment Study, the U.S. has enough natural gas supply to fuel our country for 100 years, even anticipating the highest potential demand. Due to this supply discovery, some industry experts call the U.S. the “Saudi Arabia of natural gas.”
Hydraulic fracturing, combined with horizontal drilling, has enabled the production of this abundant resource directly from “the kitchen” where natural gas is “cooked.” This technology contributes to an efficient drilling and completion process, al-lowing for targeted recoveries, controlled capital expenditures, and consistent well performance. Comparing the production of two recent shale discoveries provides a telling example of this efficiency. The Barnett Shale was discovered in the late 1990s, and its production spans 12 years. After eight years of production in the Fort Worth, Texas, area, the shale achieved its full produc-tion capacity, and production stabilized. Compare that with the Marcellus Shale, located in West Virginia, Pennsylvania, and New York, and discovered in late 2007. The Marcellus Shale reached the same degree of production growth in just four years, or half the time of the Barnett Shale. This efficiency, coupled with state-of-the-art technology utilized by Chesapeake Energy Corp. and others to pinpoint resource basins, allows for reliable production for the power generation sector.
The Beneits of Supply and Price StabilityEfficient production and proven supply work in tandem to stabilize prices. In early 2012, natural gas hovered at $2.50/MMBtu, a 10-year low. This low price is consistent with the in-dustry’s history since the advancements in drilling technology, as is modest price fluctuation. From January 2009 to January
2012, the Henry Hub price ranged between $3 and $6/MMBtu despite extreme weather conditions. This three-year time period included the summer of 2011, which had the highest demand for cooling needs on a power-generated basis, and last winter, which was the second-coldest in 10 years. This combination of hot summers and cold winters created one of the most robust energy demand periods ever recorded, yet natural gas prices re-main consistently low. In fact, the U.S. Energy Information Ad-ministration (EIA) projects natural gas prices will remain below $7/MMBtu until 2025.
While supply and price stability are benefits across all sectors, long-term contracts provide certainty for electric utilities. To-day, natural gas companies are willing to enter into longer-term contracts. As an example, Chesapeake Energy Marketing Inc. has contracts with terms up to 10 years covering the sales of natural gas under a variety of pricing structures.
Environmental and Efficiency AdvantagesFrom an operational standpoint, natural gas offers environmen-tal and efficiency advantages. Because it is a cleaner-burning fuel, natural gas allows electric generation facilities another op-tion for long-term environmental compliance. The fuel emits no mercury and fewer pollutants than other sources. Also, natural gas–fired generation is load-following and flexible, making it a natural choice for baseload power to accommodate the aggres-sive build-out of renewable generation across the county.
In 2010, the natural gas power plant fleet ran only about 28% of the time. Given the increased reserves of natural gas, the U.S. could systematically ramp up its natural gas fleet to a load factor of at least 50% over time. Using the average emissions charac-teristics of the coal fleet and gas fleet, and the most recent EIA data, this conversion would eliminate: more than 450 million tons of carbon dioxide (implicated in climate change concerns); more than 530,000 tons of nitrogen oxide (which exacerbates respiratory and heart diseases); more than 2.5 million tons of sulfur dioxide (the main ingredient of acid rain); thousands of tons of mercury (a toxic substance, and nonexistent in natural gas); and millions of tons of particulates.
As our population grows, technology expands, and power needs increase, the utility industry can meet demand with a re-source better for the bottom line and the environment. Electric power producers can have confidence in natural gas for baseload and peaking power as a source that can provide ancillary services to accommodate renewable generation, and as a resource with a stable price and enough supply to fuel America’s future. ■
—Jim Johnson ([email protected]) is president of Chesapeake Energy Marketing Inc., which provides natural gas marketing services including commodity price structuring, contract ad-
ministration, and nomination services for Chesapeake Energy and its partners.

14TH ANNUAL
BALTIMORE CONVENTION CENTER
MAY 15-17, 2012BALTIMORE, MD
Register with VIP Code PWRT1 for the best
rates at www.electricpowerexpo.com
CO-LOCATED WITH:
LEAR . NE WORK. EXPLORE.Come and discover what the future holds for the power generation industry.
» Access Three Educational Opportunities Filled With Exclusive Industry Coverage.
» Continue the discussion! Share your ideas and lessons learned with 5,000+ of your closest friends - make connections with leading industry professionals.
» Looking for ways to improve safety performance? Tasked with creating operational efficiencies? Upgrading your facilities? Find all of the products, services and technologies that you need in one location!
TIME IS RUNNING OUT…
SECURE YOUR FREE EXPO
PASS TODAY!

14TH ANNUAL
BALTIMORE CONVENTION CENTER
MAY 15-17, 2012BALTIMORE, MD
PWRT1
CO-LOCATED WITH:
LEAR . NE WORK. EXPLORE.
Access Three Educational Opportunities Filled With Exclusive Industry Coverage.
Continue the discussion! Share your ideas and lessons learned with 5,000+ of your closest friends - make connections with leading industry professionals.
Looking for ways to improve safety performance? Tasked with creating operational efficiencies? Upgrading your facilities? Find all of the products, services and technologies that you need in one location!
TIME IS RUNNING OUT…
SECURE YOUR FREE EXPO
PASS TODAY!
The Cat® team shares your focus on protecting your customers – and your
good name. You’ll have a total power solution that delivers the 100 percent
uptime data centers require, with easy installation and the lowest total cost
of ownership. See why the world’s largest search engines, social media
sites and software companies rely on Cat power systems. We keep the
power on, so you can keep your mind on getting things done.
www.catelectricpowerinfo.com/pm
CAT, CATERPILLAR, their respective logos, “Caterpillar Yellow,” the “Power Edge” trade dress, as well as corporate
and product identity used herein, are trademarks of Caterpillar and may not be used without permission.
© 2012 Caterpillar. All Rights Reserved.
WE BOTH HAVE A REPUTATION TO UPHOLD. YOURS.
CIRCLE 22 ON READER SERVICE CARD