internal porosity of mineral coating supports microbial activity in
TRANSCRIPT

Internal Porosity of Mineral Coating Supports Microbial Activity inRapid Sand Filters for Groundwater Treatment
Arda Gülay,a Karolina Tatari,a Sanin Musovic,a Ramona V. Mateiu,b Hans-Jørgen Albrechtsen,a Barth F. Smetsa
Department of Environmental Engineering, Technical University of Denmark, Kongens Lyngby, Denmarka; Center for Electron Nanoscopy, Technical University ofDenmark, Kongens Lyngby, Denmarkb
A mineral coating develops on the filter grain surface when groundwater is treated via rapid sand filtration in drinking waterproduction. The coating changes the physical and chemical properties of the filter material, but little is known about its effect onthe activity, colonization, diversity, and abundance of microbiota. This study reveals that a mineral coating can positivelyaffect the colonization and activity of microbial communities in rapid sand filters. To understand this effect, we investi-gated the abundance, spatial distribution, colonization, and diversity of all and of nitrifying prokaryotes in filter materialwith various degrees of mineral coating. We also examined the physical and chemical characteristics of the mineral coat-ing. The amount of mineral coating correlated positively with the internal porosity, the packed bulk density, and the bio-logically available surface area of the filter material. The volumetric NH4
� removal rate also increased with the degree ofmineral coating. Consistently, bacterial 16S rRNA and amoA abundances positively correlated with increased mineralcoating levels. Microbial colonization could be visualized mainly within the outer periphery (60.6 � 35.6 �m) of the min-eral coating, which had a thickness of up to 600 � 51 �m. Environmental scanning electron microscopic (E-SEM) observa-tions suggested an extracellular polymeric substance-rich matrix and submicron-sized bacterial cells. Nitrifier diversityprofiles were similar irrespective of the degree of mineral coating, as indicated by pyrosequencing analysis. Overall, ourresults demonstrate that mineral coating positively affects microbial colonization and activity in rapid sand filters, mostlikely due to increased volumetric cell abundances facilitated by the large surface area of internal mineral porosity accessi-ble for microbial colonization.
Rapid sand filtration is a widespread technology to producedrinking water from groundwater. Granular materials such as
quartz sand or anthracite are typically used filter media, whichprovide surfaces for colonization of sessile microbial communities(1). Several electron donors in anoxic groundwater, among whichNH4
�, Mn2�, Fe2�, CH4, and low levels of assimilable organiccarbon can serve as energy sources for microbial growth (2).Among these chemical species, Mn2� and Fe2� are the dominantand most commonly occurring constituents in groundwaters (3).During filtration, Mn2� and Fe2� are converted to Fe3� and Mn4�
by biological or chemical oxidation, and together with a numberof other cationic species (e.g., Ca and Mg) they form metal oxy-hydroxides (MetOOH) of low solubility (4). These hydroxidesform mobile (5) or attached colloids (6), which can aggregate orcoalesce with the filter material, yielding a mineral coating. Accu-mulation of such precipitates on the filter material can increasethe hydraulic resistance across the filter and shorten the time in-tervals needed between backwashing to regain the hydraulic loss.
Although backwashing is expected to completely remove theseprecipitates, accumulated mineral coatings have been observed inmany rapid sand filters (RSFs) operating for more than 10 years(7). Increased accumulation of a mineral coating on the filter ma-terial affects the physical characteristics of the uncoated filter ma-terial (8, 9, 39, 44). Mature filter material from 12 drinking watertreatment plants (DWTPs) showed porosities up to 8 times andspecific surface areas up to 11 times higher than those of uncoatedsand (7). Additionally, mineral coating has been found to posi-tively impact the adsorption of metal ions (Fe2�, Mn2�, and As3�)from the inlet groundwater (10, 38, 45) and the sorption of bac-terial cells from synthetic groundwater (11, 12).
Although mineral coatings have been commonly observed in
RSFs, there are no published studies examining their impact onmicrobial colonization, activity, or diversity. However, since mi-croorganisms in RSFs are sessile, a relation between filter materialsurface and attached microorganisms is expected, and any altera-tion in the filter material characteristics caused by mineral coatingis expected to affect microbial communities in different ways.
We examined filter material from RSFs at different DWTPsand identified a strong correlation between the amount of mineralcoating and the amount of extractable DNA. Observations sug-gested that biomass increased in proportion to increases in coat-ing mass within a filter as well as in different filters. On the basis ofthese preliminary observations, we hypothesized that mineralcoatings support microbial growth in RSFs. To test this assertion,we obtained and segregated filter material from two differentdepths of a well-functioning RSF into different size fractions. Weexamined these size fractions using several molecular and bioki-netic techniques, employing nitrification and nitrifying pro-karyotes as the model function and guild. In addition, these frac-tions were subjected to several physicochemical measurements,
Received 12 June 2014 Accepted 29 August 2014
Published ahead of print 5 September 2014
Editor: S.-J. Liu
Address correspondence to Barth F. Smets, [email protected].
A.G. and K.T. contributed equally to this article.
Supplemental material for this article may be found at http://dx.doi.org/10.1128/AEM.01959-14.
Copyright © 2014, American Society for Microbiology. All Rights Reserved.
doi:10.1128/AEM.01959-14
7010 aem.asm.org Applied and Environmental Microbiology p. 7010 –7020 November 2014 Volume 80 Number 22
on April 11, 2018 by guest
http://aem.asm
.org/D
ownloaded from

while internal structure and microbial localization were revealedby grain-scale confocal and electron microscopic observations.Finally, we observed the microbial colonization capacity of thefilter material fractions by examining the mineral coating in pilot-scale RSFs operated with high NH4
� and P loading. Ultimately, allobservations indicated that mineral coatings are porous and pro-vide internal surface area that is available for microbial coloniza-tion, resulting in enhanced microbial density and activity.
MATERIALS AND METHODSPreliminary investigations. A series of preliminary investigations aimedto elucidate the relationship of mineral coating to biomass present on thefilter material. Filter material was collected from the top layer (0- to 0.1-mdepth) of the full-scale (FS) filters at DWTP 1 and DWTP 2 and of apilot-scale (PS) filter at DWTP 2 (DWTP 2-PS) using a custom-mademetal handler. DWTP 1 is located in Islevbro in the greater Copenhagenarea, and DWTP 2 is in Marbjerg, Denmark (see description in the sup-plemental material). Furthermore, filter material was collected at differentdepths of the filters at Sjælsø-1 (DWTP 3), Sjælsø-2 (DWTP 4), andLangerød (DWTP 5), all located in Denmark (see description in the sup-plemental material). Core samples were collected at three random hori-zontal locations in each filter using Plexiglas tubes (internal diameter of 12cm; length of 65 cm), and each core was sliced into the different depthsections. The samples were immediately transferred to the laboratory onice, where DNA and mineral coating were extracted as described below.
Sampling and experimental design of the main investigations. Themain investigations took place in DWTP 1, which treats anoxic ground-water abstracted from different nearby aquifers. In brief, the groundwateris first oxygenated to saturation by air injection in an aeration chamber(see Fig. S1 in the supplemental material). Fe2� is allowed to be oxidizedto Fe3� and precipitated on the filter bed of the prefilters. The water isthen led to the after-filters, designed to remove the remaining electrondonors (NH4
�, residual Fe2�, and Mn2�) mainly by biological processes,and thus our study focused on this step. After-filters have a 0.7-m-deepbed of quartz sand with a nominal average grain size of 0.8 to 1.2 mm,supported by a 0.3-m layer of coarser material. Treated water is suppliedto the distribution system without chlorination. Influent and effluent wa-ter were sampled and analyzed for chemical composition (Table 1). Dis-solved oxygen and pH were measured on site (WTW Oxi 340i with 325CellOx and SenTix 41 WTW probes, respectively), while NH4
� and NO2�
were measured colorimetrically (Spectroquant test kits 1.14752 and1.14776; Merck). Metal concentrations were determined by inductivelycoupled plasma optical emission spectrometry (ICP-OES) (Vista-MPXCCD Simultaneous ICP-OES; Varian), using a customized stock solution(Inorganic Ventures) that included most metallic elements and phospho-rus. Filter material for the main investigations was collected by core sam-pling as described above. From the obtained core two depth layers, top (0to 0.1 m) and middle (0.2 to 0.3 m), were divided and transported to thelab on ice.
A fraction of the filter material from each depth layer (top and middle)of DWTP 1 was dried overnight at 60°C, and the particle size distributionwas determined by sieving (vibratory sieve shaker AS 200 control; Retsch,Germany). In the top layer, 97% (mass-based percentage) of particles hada diameter of 1.0 to 2.5 mm, and 28% of middle-layer sand grains had adiameter of 1 to 2 mm, while 67% had a diameter of 0.5 to 1.0 mm. Wesegregated the remaining filter material from each depth into two frac-tions, one of larger and one of smaller particles, ultimately generating fourfilter material samples. The top layer was segregated into fractions withgrain sizes of 2.0 to 2.4 mm (T 2.0 –2.4) and 1.0 to 1.4 mm (T 1.0 –1.4),while the middle layer was segregated into fractions with grain sizes of 1.0to 1.4 (M 1.0 –1.4) and 0.6 to 1.0 (M 0.6 –1.0) mm. This segregation bydepth and particle size created four filter material samples with differentmineral coating properties that were used to investigate the relation ofmineral coating to the microbiological processes.
Determination of physical and chemical properties of the coatedfilter material. The drained wet mass of the four filter material sampleswas determined by passive drainage for 10 min. The packed volume of thesamples was measured in a graduated cylinder that initially contained 25ml of water. The drained wet packed bulk density was calculated from thepacked bulk volume and the respective drained wet mass. The porosity ofthe filter material was a combination of the internal pore volume (intra-grain volume) and the external pore volume (intergrain volume), and weestimated both volumes by measuring the water displacement in the grad-uated cylinder. Specifically, because the wet filter material was drainedbefore packing, the internal pores were considered already filled with wa-ter, while the external pores were filled with water after the filter materialwas packed in the graduated cylinder. The external pore volume was esti-mated from the water displacement volume in the graduated cylinder bysubtracting the water displacement volume from the packed bulk filtermaterial volume.
The four filter material samples were dried at 60°C overnight andweighed again to calculate the dry to drained wet mass conversion factor.The dried filter material was then packed in a graduated cylinder as de-scribed previously to estimate the total pore volume (internal and exter-nal) from the water volume displacement in the graduated cylinder. Thedifference between total and external pore volume was an estimate of theinternal filter material pore volume. The number of grains per volume ofpacked bulk filter material was manually counted in triplicate. Bulkpacked density and internal pore volume were estimated in triplicate foreach sample.
The external surface area per volume of packed bulk filter material was
TABLE 1 Chemical composition of the groundwater and influent andeffluent of the after-filters at DWTP 1
Parameter (units)
Value ina:
Groundwater RSF influent RSF effluent
Dissolved oxygen (mg/liter) 1.10 9.25 8.60pH 7.37 7.38 7.32Total alkalinity (HCO3
�
[meq/liter])NM 5.50 5.40
NH4�-N (mg/liter) 0.34 0.13 ND
NO2�-N (�g/liter) 8.00 8.00 17.0
NO3�-N (mg/liter) NM 0.46 0.58
NVOC (mg/liter)b NM 1.93 2.41CH4 (mg/liter) 0.03 NM NMH2S (mg/liter) 0.02 NM NMSO4
2� (mg/liter) NM 32.2 33.1PO4
3�-P (�g/liter) NM 13.0 3.00Cl� (mg/liter) NM 62.5 62.8Mn2� (mg/liter) 0.06 0.04 NDFe total (mg/liter) 1.07 0.16 0.03Fe2� (mg/liter)c NM 0.11 0.07Fe3� (mg/liter) NM 0.05 NDAl (mg/liter) NM 0.19 0.30Ba (mg/liter) NM 0.06 0.13Ca (mg/liter) NM 140 144Cd (mg/liter) ND 0.17 0.40Co (�g/liter) NM ND 0.08Cr (�g/liter) ND 1.64 1.33Cu (�g/liter) NM ND 87.2K (mg/liter) NM 3.78 6.01Mg (mg/liter) NM 24.8 25.5a NM, not measured, ND, not detected. Limits of detection: NH4
�-N, 0.01 mg/liter;Mn, 0.001 mg/liter; Fe, 0.001 mg/liter; Co, 0.3 �g/liter; Cu, 1.4 �g/liter.b NVOC, nonvolatile organic carbon.c Differentiation between Fe2� and Fe3� was done by filtration of the water with a 20-�m disposable filter right after sample collection.
Internal Porosity Supports Microbial Activity
November 2014 Volume 80 Number 22 aem.asm.org 7011
on April 11, 2018 by guest
http://aem.asm
.org/D
ownloaded from

calculated assuming spherical grains with an average diameter in eachsample, i.e., 2.2 mm for the T 2.0 –2.4 sample, 1.2 mm for the T 1.0 –1.4and M 1.0 –1.4 samples, and 0.8 mm for the M 0.6 –1.0 sample. The ex-ternal surface area calculated for each grain was multiplied by the numberof grains per volume of packed bulk filter material. The specific poresurface area of each filter material sample was estimated by Brunauer-Emmett-Teller (BET) sorption-desorption isotherms (Gemini III 2375Surface Area Analyzer; Micromeritics). Before analysis, the samples wereout-gassed with N2 (FlowPrep 060 degasser; Micromeritics) for 24 h atroom temperature. The method estimated the specific surface area of theinternal pores sized between 2 and 32 nm.
In both the preliminary and the main investigations, the mineral coat-ing was extracted from the filter material by acid digestion. Two grams ofdry sand from each sample was digested with 2 ml of 65% HNO3
� and 6ml of 37% HCl for 3 h at 80°C. The samples were then cooled at roomtemperature, 2 ml of 30% H2O2 was added, and samples were heated to80°C for 1 h to remove the organic carbon fraction from the sand surface(13). Samples were then dried overnight at 60°C before being weighedagain, and the difference in mass before and after the mineral coatingextraction was equal to the mineral coating mass present in each sample.
Nitrification activity of the filter material. Nitrification activity of thefour filter material samples from DWTP 1 was quantified in a biokineticassay described in detail elsewhere (14). Four lab-scale column filters werepacked with the four filter material samples and were operated continu-ously for 2 days at a volumetric loading rate of 35 g of NH4
�-N/m3/day(per volume of packed filter material). Effluent water from the investi-gated full-scale rapid sand filter was used for the column influents, sup-plemented with 1 mg/liter NH4
�-N as NH4Cl (Merck Chemicals). Theeffluent NH4
� and NO2� concentrations were monitored at regular times
(two to three times a day) by manual sampling and colorimetric analysis,giving a total of five data points for each column under this loading con-dition, as described above. At day 2 after start-up, the influent loading wasup-shifted to 350 g of NH4
�-N/m3/day, and the effluents were monitoredand sampled every 30 min for 4 h, giving a total of four measurementsfrom each column. The duration of experiments was intentionally shortto avoid substantial growth of nitrifying biomass in the filters. Duringcolumn operation at each of the two loading rates, the effluent concentra-tion stabilized at a different NH4
� levels. The NH4� volumetric (per
volume of packed filter material) removal rate was calculated from thedifference between influent and effluent (after it stabilized) NH4
�-Nloading, divided by the packed bulk filter material volume in the filter andaveraged over the available data points for each loading condition.
Microbial colonization capacity experiments. Two pilot-scale filterswere inoculated with filter material from the full-scale filter at DWTP 1 asdescribed elsewhere (15) and were operated at high NH4
� and P concen-trations (see the supplemental material). After 45 days of operation athigh-NH4
� and high-P influent loading (see detailed description in thesupplemental material), filter material was collected from the 0- to 0.1-m(top)- and 0.2- to 0.3-m (middle)-depth layers of both pilot-scale filtersand was segregated into size fractions of 2.0 to 2.4 and 1.0 to 1.4 mm forthe top layer and of 1.0 to 1.4 and 0.6 to 1.0 mm for the middle layer. Withthese investigations we examined whether this increase in NH4
� and Ploading resulted in increased microbial density and whether such a mi-crobial density increase could be visualized using microscopic and molec-ular techniques. Real-time PCR and confocal laser scanning microscopy(CLSM) imaging were used on these fractions, as described below.
Cryosectioning, live and dead staining, and CLSM imaging. The fil-ter material samples collected from the full- and pilot-scale filters ofDWTP 1 were fixed by 4% paraformaldehyde, embedded in 22-oxacal-citriol (OCT) compound (TissueTek; Sakura, The Netherlands), and fro-zen at �20°C. The mineral coatings of three representative sand grainsfrom each size fraction of the top layer of both filters were cut in 20-�mthin sections by a microtome and mounted on gelatin-coated glass slides(16). The samples originating from the middle layer could not be cut bythe microtome because of the small amounts of mineral coating. The
retrieved 10 sections from each representative grain were dehydrated andsequentially stained with a Live/Dead BacLight viability kit (L7012; Mo-lecular Probes/Invitrogen, USA) according to the manufacturer’s specifi-cations. Live/Dead staining distinguishes microorganisms that have dam-aged (dead) and nondamaged (live) cell membranes. Stained sectionswere analyzed with a confocal laser scanning microscope ([CLSM] TCSSP5; Leica, Germany) equipped with an Ar laser (488 nm), using 20� and64� objectives. SYTO (SYTO9; Invitrogen, Carlsbad, CA, USA)-stainedand propidium iodide-stained images were analyzed with a Leica AS AFLite (Leica, Germany) instrument and ImagePro (MediaCybernetics,USA) software to observe the spatial distribution of cells within the min-eral coating.
High-vacuum SEM (HV-SEM) and E-SEM. Cryosections from the T2.0 –2.4 sample of the full-scale filter were visualized with a scanning elec-tron microscope (SEM) (Quanta 200 F FEG; FEI) used both for environ-mental SEM (E-SEM) and regular SEM observations. For the E-SEM, thesections were placed on an aluminum tap with double-sided carbon tapeand imaged at a partial water pressure of 1.0 � 106 mPa with a secondarygaseous electron detector. Energy-dispersive X-ray spectroscopy (EDS)was conducted on the mineral coating of the T 2.0 –2.4 filter materialsamples with an 80-mm X-Max silicon drift detector (Oxford Instru-ments) coupled to the microscope. For the SEM, the coating sectionsobtained by cryosectioning were similarly mounted on an aluminum tapwith a double-sided carbon tape and imaged at high vacuum with anEverhart-Thornley detector.
SEM images were analyzed and calibrated with ImagePro (MediaCy-bernetics, USA) software to reveal the pore area distribution of the inves-tigated coating sections at different scales.
DNA extraction. Drained wet filter material (0.5 g) from DWTPs 1 to5 (preliminary and main investigations) were subjected to genomic DNAextraction using a FastDNA Spin kit (MP Biomedicals, Solon, OH, USA)according to the manufacturer’s instructions at room temperature. Theconcentration and purity of extracted DNA were checked by a NanoDrop2000 spectrophotometer (NanoDrop Technologies, Wilmington, DE,USA).
PCR, pyrosequencing, and bioinformatic analyses in the main in-vestigations. Ten nanograms of extracted DNA from the four samplesfrom DWTP 1 was PCR amplified using Phusion (Pfu) DNA polymerase(Finnzymes, Finland) and 16S rRNA gene-targeted modified universalprimers PRK341F (5=-CCTAYGGGRBGCASCAG-3=) and PRK806R (5=-GGACTACNNGGGTATCTAAT-3=) (17). PCR was performed as de-scribed elsewhere (18). The process of adapter- and sample-specific tagaddition and further amplicon quantification were done as described else-where (19). Pyrosequencing was applied in a two-region 454 run on a GSPicoTiterPlate (70- by 75-mm format) using a titanium kit and GS FLXpyrosequencing system at the National High-Throughput DNA Sequenc-ing Center (University of Copenhagen, Copenhagen, DK) according tothe manufacturer’s instructions (Roche) and as previously described (20).
All raw 16S rRNA gene amplicons were denoised, processed, and clas-sified using the QIIME (http://qiime.org/index.html) software package(21). Chimera checking was performed with the software UChime (22).High-quality sequences were clustered at 97% evolutionary similarity andaligned against the Greengenes reference set (23) using the PyNAST algo-rithm (24). Taxonomy assignment of each representative sequence wasimplemented using the BLAST algorithm (25) against the Silva 108 cu-rated database (26). All diversity estimations were performed using algo-rithms in QIIME software.
Extracted nitrifier sequences based on taxa at the genus level (see TableS1 in the supplemental material) were transferred to web-based SINA,version 1.2.11 (27), for alignment and selection of the top 10 closest rela-tives for each sequence. Aligned sequences were then imported into theARB software environment (28) for phylogenetic tree construction. Sta-tistical calculations and phylogenetic comparisons were carried out usingR software (R Development Core Team, 2012). A detailed description ofthe bioinformatics analysis is provided in the supplemental material.
Gülay et al.
7012 aem.asm.org Applied and Environmental Microbiology
on April 11, 2018 by guest
http://aem.asm
.org/D
ownloaded from

Real-time qPCR. Quantification of total bacteria (Eubacteria), ammo-nium-oxidizing bacteria (AOB), and ammonium-oxidizing archaea(AOA) was done by quantitative-PCR (qPCR) on the DNA extractedfrom the collected filter material samples.
A specific region on the 16S rRNA gene was amplified using the1055F and 1392R primer sets for total Eubacteria (29). To quantify AOBand AOA, the specific regions of a functional, ammonia monooxygenasesubunit A-encoding amoA gene were targeted by the amoA1F andamoA2R primer set for AOB (30) or the amoAF and amoAR primer set forAOA (31).
qPCR analyses were conducted in a Chromo4 thermocycler operatedby Opticon Monitor, version 3, software (Bio-Rad). Each qPCR mixturecontained 12.5 �l of 2� iQ SYBR green Supermix (Bio-Rad Laborato-ries), 500 nM primer, DNA template (10 ng), and DNA/RNA-free water(Mo Bio Laboratories) to 25 �l. The thermal cycling conditions consistedof an initial 5-min denaturation at 95°C, followed by 40 cycles of dena-turation at 94°C for 30 s and primer annealing for 30 s, 30 s, and 60 s at55°C, 56°C, and 60°C for total eubacteria, AOB, and AOA, respectively,with a 1-min extension at 72°C. The specific amplification was tested by amelting curve analysis (gradient, 0.2°C/s; range, 70 to 95°C) (32). Thegene copy number was interpolated from a standard curve.
Statistical analysis. Pearson’s product-moment correlation coeffi-cient analysis was used to identify linear correlations between the es-timated physical properties (packed bulk density, mass of coating ex-tracted, and BET-specific surface area), the observed NH4
� removalrates, and the abundance of AOB, AOA, and total bacteria in the fourfilter material samples. All calculations were implemented using SigmaPlot (version 11).
Nucleotide sequence accession numbers. Sequences generated in thisstudy were deposited in the European Nucleotide Archive (ENA) underaccession numbers LN515613 to LN551923.
RESULTSPreliminary mineral coating observations at different DWTPs.The first round of preliminary investigations aimed to identify thepresence of mineral coating and microbes on the filter material ofDWTP 1 and DWTP 2. As illustrated in Fig. S2 in the supplemen-tal material, mineral coating was present in both full-scale filtersbut was detected at a very low degree on the filter material from thepilot-scale filter in DWTP 2. In these three filters we noted a pos-itive linear correlation between the extracted DNA mass and theamount of coating on the filter material (see Fig. S2). Similarly, inthe second round of preliminary investigations, the amount ofDNA from different depths of the filters at DWTPs 1 and 5 in-
creased with the amount of mineral coating present (see Fig. S3). Avery low degree of mineral coating was detected at DWTPs 3 and4. Overall, these observations suggested that a higher degree ofcoating results in higher microbial density on the filter material.
Physical and chemical characteristics of coated filter mate-rial. The four filter material samples collected for the main inves-tigations (T 2.0 –2.4, T 1.0 –1.4, M 1.0 –1.4, and M 0.6 –1.0) wereanalyzed for their physical and chemical properties. In general themass of mineral coating decreased with depth and with grain size,at least for the top-layer samples (T 2.0 –2.4 and T 1.0 –1.4) (Table2). The bulk packed density of the filter material decreased withincreasing mineral coating mass, corresponding to the increase ininternal pore volume (per unit of filter material packed bulk vol-ume). This was confirmed by internal pore volume estimates (Ta-ble 2), which, in combination with the packed bulk density mea-surements, indicated that the mineral coating determined thedepth stratification of the filter material.
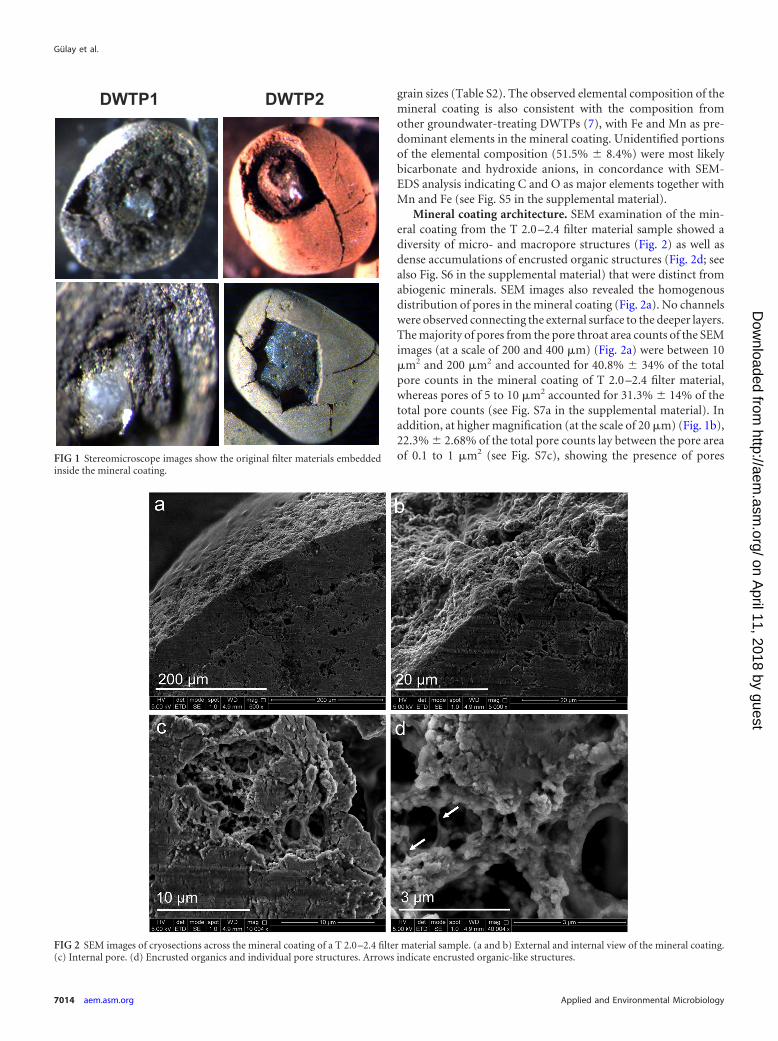
Consistently, the specific surface area estimated from the BETisotherms revealed that the filter material samples with more coat-ing mass per unit packed bulk volume of filter material (57 to 456kg/m3) had the highest surface areas (5.4 to 41 m2/m3). Pairwisecomparisons using the Pearson product-moment correlationshowed a strong positive correlation (r2 � 1, P � 0.0001) of min-eral coating mass and BET-specific surface, whereas packed bulkdensity and BET-specific surface area showed a strong negativecorrelation (r2 � �0.98, P � 0.02). Overall, these observationssuggest that the mineral coating formed a porous mineral matrixaround the original filter material. A clear image of the mineralcoating on the filter material is shown in Fig. 1.
Moreover, the total BET surface area increased with internalpore volume and decreased with external surface area, indicatingthat the mineral coating creates internal surface area while de-creasing the specific external surface area of the filter material (seeFig. S4 in the supplemental material).
Elemental analysis of the extracted mineral coating showed apredominance of Mn (26.4% � 4.1%), Fe (14.4% � 2.7%), andCa (4.1% � 0.8%), with small differences in relative mass percent-ages between the four filter material samples, and this distributionof chemical species did not differ appreciably between the filtermaterials; hence, no significant effect of coating composition onmicrobial communities was expected in the fractions of different
TABLE 2 Physical properties of the four investigated filter material samples collected and segregated by size from the full-scale after-filter at DWTP 1
Parameter
Value for indicated fractiona
T 2.0–2.4 T 1.0–1.4 M 1.0–1.4 M 0.6–1.0
Sampling depth in filter bed (m below surface) 0–0.1 0.2–0.3Grain size of filter material (diam range [mm])b 2.0–2.4 1.0–1.4 1.0–1.4 0.6–1.0Mass coating per vol of packed bulk filter material (kg/m3)c 456 389 57 100Density of drained wet packed bulk filter material (103 kg/m3)d 1.11 (�0.05) 1.28 (�0.03) 1.56 (�0.12) 1.67 (�0.10)Internal pore vol per vol of packed bulk filter material (m3/m3)e 0.63 (�0.03) 0.60 (�0.03) 0.28 (�0.03) 0.28 (�0.02)No. of filter material grains per vol of packed bulk filter material (107 grains/m3) 26.0 (�12) 44.0 (�16) 69.0 (�29) 136 (�78)External surface area per vol of packed bulk filter material (103 m2/m3)f 1.6 3 3.1 3.1BET-specific surface area per vol of packed bulk filter material (106 m2/m3) 41 35 5.4 8.6a Standard deviation is reported for triplicate measurementsb Filter material sizes were quantified by sieving.c Extracted by acid digestion of the coated filter material.d Measured by the mass and volume of packed bulk filter material in a graduated cylinder.e Estimated by water displacement of dry and drained wet sand in a graduated cylinder.f External surface area was calculated from external surface area of an equivalent spherical sand grain and multiplied by the number of sand grains per volume of packed bulk filtermaterial.
Internal Porosity Supports Microbial Activity
November 2014 Volume 80 Number 22 aem.asm.org 7013
on April 11, 2018 by guest
http://aem.asm
.org/D
ownloaded from
grain sizes (Table S2). The observed elemental composition of themineral coating is also consistent with the composition fromother groundwater-treating DWTPs (7), with Fe and Mn as pre-dominant elements in the mineral coating. Unidentified portionsof the elemental composition (51.5% � 8.4%) were most likelybicarbonate and hydroxide anions, in concordance with SEM-EDS analysis indicating C and O as major elements together withMn and Fe (see Fig. S5 in the supplemental material).
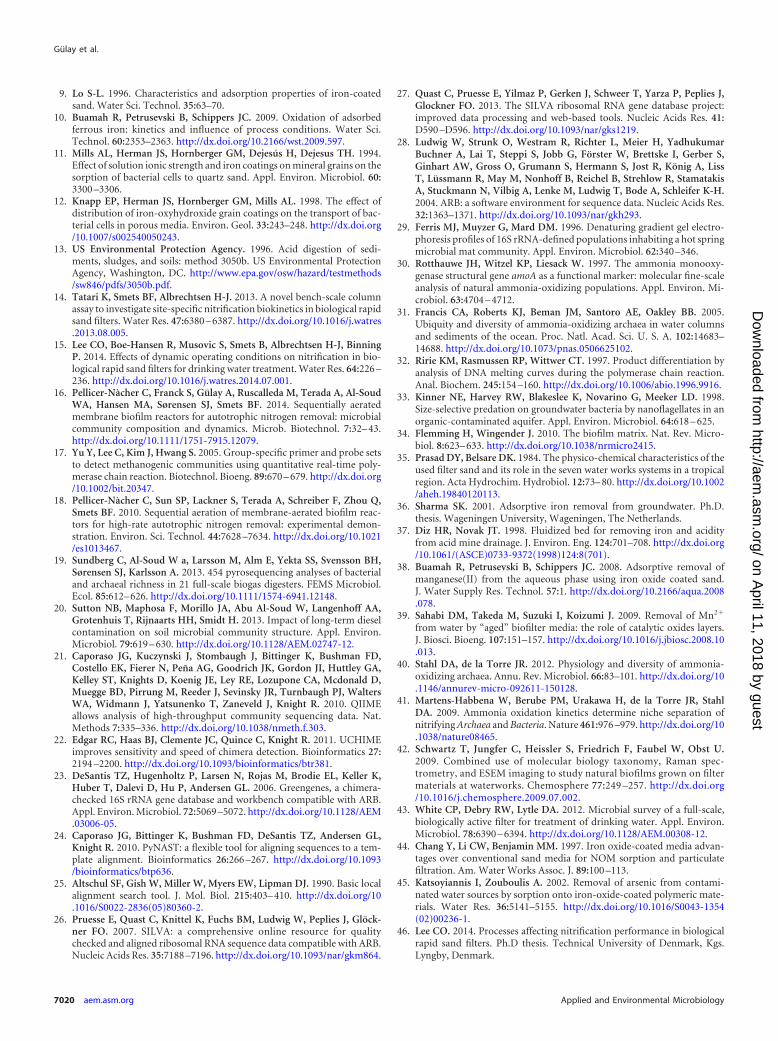
Mineral coating architecture. SEM examination of the min-eral coating from the T 2.0 –2.4 filter material sample showed adiversity of micro- and macropore structures (Fig. 2) as well asdense accumulations of encrusted organic structures (Fig. 2d; seealso Fig. S6 in the supplemental material) that were distinct fromabiogenic minerals. SEM images also revealed the homogenousdistribution of pores in the mineral coating (Fig. 2a). No channelswere observed connecting the external surface to the deeper layers.The majority of pores from the pore throat area counts of the SEMimages (at a scale of 200 and 400 �m) (Fig. 2a) were between 10�m2 and 200 �m2 and accounted for 40.8% � 34% of the totalpore counts in the mineral coating of T 2.0 –2.4 filter material,whereas pores of 5 to 10 �m2 accounted for 31.3% � 14% of thetotal pore counts (see Fig. S7a in the supplemental material). Inaddition, at higher magnification (at the scale of 20 �m) (Fig. 1b),22.3% � 2.68% of the total pore counts lay between the pore areaof 0.1 to 1 �m2 (see Fig. S7c), showing the presence of pores
DWTP1 DWTP2
FIG 1 Stereomicroscope images show the original filter materials embeddedinside the mineral coating.
FIG 2 SEM images of cryosections across the mineral coating of a T 2.0 –2.4 filter material sample. (a and b) External and internal view of the mineral coating.(c) Internal pore. (d) Encrusted organics and individual pore structures. Arrows indicate encrusted organic-like structures.
Gülay et al.
7014 aem.asm.org Applied and Environmental Microbiology
on April 11, 2018 by guest
http://aem.asm
.org/D
ownloaded from

smaller than typical average single prokaryotic cell diameters (33).Altogether, a large portion of the detected pores in T 2.0 –2.4 sam-ples were deemed appropriate for microbial colonization.
Nitrification activity of coated filter materials. Nitrificationactivity of the four differently coated filter material samples (T2.0 –2.4, T 1.0 –1.4, M 1.0 –1.4, and M 0.6 –1.0) revealed a signifi-cant increase in the volumetric NH4
� removal rate under bothhigh- and low-loading conditions with increasing mineral coatingmass (Fig. 3A) (r2 � 0.99 and P � 0.001 at high loading, r2 � 0.99and P � 0.003 at low loading).
There was no significant correlation (r2 � 0.22, P � 0.77) be-tween the nitrification activity and the calculated external surfacearea per unit of grain volume. Therefore, a normalized bioavail-able surface area (NBSA) estimate was used under the assumptionthat the area-specific NH4
� removal rates were equal for all fourfilter material samples. The area-specific NH4
� removal rate wascalculated by dividing the observed NH4
� removal rate at thehighest loading rate (350 g of NH4
�-N/m3/day) by the externalsurface area per packed bulk volume unit (Table 2) for the least-coated filter material (57 kg/m3). This calculation implied that theNBSA of the least-coated filter material sample (M 1.0 –1.4) isequal to the external surface area because of the negligible internalpore area of this fraction. The NBSA was calculated for the threeother filter material samples by dividing the measured nitrifica-tion activity under the high-loading condition by the area-specificNH4
� removal rate. The estimated NBSA increased with increas-ing mineral coating mass on the filter material (r2 � 0.96, P �0.04) (Fig. 3B), and the experimentally obtained BET-specific sur-face area (Fig. 3B) was significantly and positively correlated withthe estimated NBSA (r2 � 0.95, P � 0.04).
Spatial distribution of microorganisms within the mineralcoating. The cryosectioned filter material samples from the topfilter layer (T 2.0 –2.4 and T 1.0 –1.4) were visualized by CLSM.Microorganisms detected with DNA-binding stain (green fluores-cence) (Fig. 4b to e for T 2.0 –2.4; see also Fig. S8b in the supple-mental material for T 1.0 –1.4) were visible in the outer peripheryof the mineral coating and colocalized with dead-cell signals (redfluorescence) (Fig. 4c to f for T 2.0 –2.4; see Fig. S8c for T 1.0 –1.4).
Microbial clusters were homogeneously distributed inside themineral coating and up to 120 �m below the outer surface, with anaverage biofilm thickness of 15 �m. The average coating depthwhere most cells were found was 60.6 � 35.6 �m and 12.3 � 5.5�m for the T 2.0 –2.4 and T 1.0 –1.4 filter material samples, respec-tively. Sporadic cell signals were detected in the deeper parts of themineral coating, suggesting that these layers are possibly inactivezones for microbial activity. Microbial cells were primarily orga-nized in spatially separate microbial clusters instead of thick andcontinuous biofilms, suggesting internal isolation of microbialcommunities in a single filter material due to the dissociated in-ternal pores of the mineral coating.
Visualization of microbial cells and EPS within the mineralcoating. E-SEM images of the T 2.0 –2.4 filter material sampleshowed a white nebulous network with branching filaments at-tached to the surfaces of the internal pores (Fig. 5). Intriguingly,coccoid microbial cell-like structures with an average diameter ofca. 0.2 �m were observed in all analyzed micrographs. Coccoids aswell as white nebulous network structures were not observed inSEM images due to the high-vacuum condition in SEM examina-tion, which destroys organic structures. Cells were embedded in-side an organic network that strongly resembled extracellular
polymeric substances (EPS). Observation of such organic matri-ces is, however, surprising in this oligotrophic environment (34),given the low assimilable organic carbon content in the influentwater. As a conclusion, the E-SEM images suggest microbial col-onization within the mineral coating of the internal pores.
Microbial abundance in coated filter materials. Microbialabundance in the four filter material samples was measured byqPCR targeting both the 16S rRNA and the amoA genes. Bacterial16S rRNA abundances (expressed as the number of gene cop-ies/m3 of packed bulk filter material) increased and significantly
Mass mineral coating (kg/m3)
Cel
l abu
ndan
ce
Log 1
0(ce
lls/m
3 )
1010
1011
1012
1013
1014
1015
1016
Bacterial amoA geneArchaeal amoA gene
57 100 389 456
Rem
oval
rate
(g N
H4+ -
N/m
3 /d)
0
20
40
60
80
100
120A
57 100 389 456
Cal
cula
ted
biol
ogic
ally
ava
ilabl
esu
rface
are
a (m
2 /m
3 )
0
2.0x10⁴
4.0x10⁴
6.0x10⁴
8.0x10⁴
105
1.2x10⁵
1.4x10⁵
BE
Tsp
ecifi
c su
rface
are
a(m
2 /m
3 )
0
107
2x10⁷
3x10⁷
4x10⁷
5x10⁷
Calculated biologicallyavailable area
BET specific surfacearea
B
Loading rate35 g NH4
+-N/m3/d
350 g NH4+-N/m3/d
16S rRNA gene
57 100 389 456
1017
C
FIG 3 (A) Volumetric NH4� removal rate at high- and low-ammonium load-
ings for filter material samples with different coating masses per filter materialpacked volume. (B) Area equivalents for filter material with different coatingmasses per filter material packed volume. (C) Archaeal and bacterial amoA andbacterial 16S rRNA gene copy equivalents for filter material with differentcoating masses per filter material packed volume.
Internal Porosity Supports Microbial Activity
November 2014 Volume 80 Number 22 aem.asm.org 7015
on April 11, 2018 by guest
http://aem.asm
.org/D
ownloaded from

correlated with an increasing degree of coating (r2 � 0.96, P �0.03). An increase in bacterial 16S rRNA abundance was also cor-related with an increase in the nitrification rates (r2 � 0.97 andP � 0.02 for low-loading and r2 � 0.96 and P � 0.04 for high-loading conditions) measured by the activity assay. Likewise,bacterial 16S rRNA gene copy numbers exhibited a significantpositive correlation with the BET-specific surface area (r2 � 0.96,P � 0.04). Together, these results suggest a strong density-func-tion-colonization relation between mineral coating presence andbacterial biomass. The abundance of amoA copies (Fig. 3C) in-creased consistently with increases in the coating mass, surfacearea, and nitrification activity (see Fig. S4 in the supplementalmaterial). Archaeal amoA gene abundances were higher in themiddle-layer samples (M 1.0 to 1.4 and M 0.6 to 1.0) than in thetop-layer samples (T 2.0 to 2.4 and T 1.0 to 1.4). However, unlikethe bacterial amoA and total 16S rRNA gene abundances, no linearcorrelation was detected between coating mass, nitrification rates,and archaeal amoA gene abundances (see Fig. S4).
Microbial diversity and composition in coated filter materi-als. The four filter material samples were 454 pyrosequenced toassess nitrifier diversity in each filter material fraction and to iden-tify similarities in nitrifier composition between filter materialfractions. A total of 39,224 sequences passed through qualitychecks (with denoising and chimera removal) and were furtherdistributed across 1,949 operational taxonomic units (OTUs) at a97% (OTU0.03s) nucleotide sequence identity threshold. High-quality sequences were normalized by rarefying to 7,000 se-quences per sample for further diversity and taxonomic compar-isons.
The analysis of the unweighted and weighted UniFrac dis-
tances showed no significant differences in community composi-tions of known AOB and AOA between the four filter grainfractions (see Table S3 in the supplemental material), indicatingthat the NH4
� oxidation metabolisms were similar (Fig. 6). Like-wise, the phylogenetically based comparisons showed insignifi-cant differences between total microbial community composi-tions (see Table S3). Together, these results suggest that thedifference between the volumetric nitrification rates observed forthe four filter material samples in the activity assays is not relatedto different AOB phylogenies.
Evenness and taxonomic richness in the filter material samplesrevealed that changes in coating mass or internal surface area didnot strongly influence these diversity components as no signifi-cant linear correlation was detected (see Table S4 in the supple-mental material). Faith’s phylogenetic distance estimations alsoshowed an insignificant correlation with coating mass (see TableS4). Sequences closely related to the Archaea domain were solelydetected in filter material from the middle layer, confirming thequantification results from the amoA gene-based qPCR.
Links between microbes and mineral coating were further in-vestigated by correlating specific OTUs at a 97% similarity thresh-old and taxa at the phylum taxonomic level with coating massusing significant (P � 0.01) and strong (r2 0.97) Pearson rela-tions and network analysis (for the phylum level, see Fig. S9, andfor the OTU0.03 level, see Fig. S10 in the supplemental material).Among 1,949 OTU0.03s, only 20 were significantly correlated withthe coating mass. Positively correlated taxa (13 OTU0.03s) weremainly related to the candidate division OD1, Firmicutes, Bacte-riodetes, and Proteobacteria, and negatively correlated taxa
50 µm50 µm50 µm50 µm50 µm50 µm
200 µm200 µm 200 µm200 µm 200 µm200 µm
Sandcore
Sandcore
d
b
e f
a c
FIG 4 Confocal laser scanning micrographs of a cryosectioned mineral coating layer from the T 2.0 –2.4 filter material sample showing the spatial distributionof microorganisms. Visualization of the outer periphery (a, b, and c) and of the complete cross section of the mineral coating (d, e, and f) using differentialinterference contrast observation without staining and (a and d) and using fluorescence observation with SYTO9 (green; b and e) and propidium iodide staining(red; c and f).
Gülay et al.
7016 aem.asm.org Applied and Environmental Microbiology
on April 11, 2018 by guest
http://aem.asm
.org/D
ownloaded from

(OTU0.03s) were related to the Proteobacteria, candidate divisionTM7, Chloroflexi, and candidate division SR1 at the phylum level.
Microbial colonization capacity of mineral coating. We usedtwo parallel pilot-scale filters at DWTP 1 (15) to investigate thecolonization potential of the filter material by exposing the filtersto increased substrate (NH4
�) and nutrient (P) conditions (seethe description in the supplemental material). In both PS filters,the removal rate increased with increasing NH4
� and P loadingrates (46). Filter materials at the same depth and size fractionsconsistent with those examined in this study were subjected tobacterial 16S rRNA quantification and microscopic inspection.Microbial abundance measured by 16S rRNA gene-targeted qPCRconsistently increased (up to 1 order of magnitude), regardless ofthe size and amount of the mineral coating (Fig. 7a). In addition,it was visually confirmed that the cell density increased in theinternal pores of the mineral coating and not on the external sur-face area of the filter material (Fig. 7b and c). The average biofilmdepths now increased to 145 � 77 �m for T 2.0 –2.4 and to 66 � 19�m for T 1.4 –1.6 filter material samples.
DISCUSSIONChanges in abiotic phases due to the presence of mineral coat-ing. DWTP 1 is an RSF-based plant treating anoxic groundwaterwith a significant Fe2� concentration. Extraction of the mineralcoating from the filter material and examination of differentlycoated materials revealed that packed bulk density decreased with
increases in the degree of coating. Such a negative relationshipbetween mineral coating and filter material density in RSFs hasbeen reported before (7, 35) and could be the primary cause ofvertical stratification even though the filter is periodically back-washed. The mechanism of mineral coating formation has beenpreviously linked to adsorption of Fe2� coupled with oxidation(36) and to the attachment of small iron particles (�1.0 �m)coupled with consolidation (37). These scenarios postulate thatthe newly formed coating proliferates on the surface of a pre-formed coating. This is in accordance with our SEM images, inwhich encrusted biological structures were observed in the innercoating layer (120 �m) although no living cells were detectedthere by confocal imaging. A possible explanation for the zoneswithout cells in the inner layers could be the limitation of nutrientdiffusion into the inner layers due to the high microbial activity inthe outer periphery of the coatings. This is consistent with ourresults from microbial colonization capacity experiments; micro-bial growth in the inner pores (average depths of 145 � 77 �m and66 � 19 �m for T 2.0 –2.4 and T 1.0 –1.4 filter material samples,respectively) was detected when filter materials were exposed tohigher NH4
� and/or P loading than under full-scale operatingconditions.
The surface area measurements and electron micrographs in-dicate that mineral coating increases the internal porosity avail-able for microbial colonization. This increase in internal surface
FIG 5 E-SEM images of the mineral coating from a T 2.0 –2.4 filter material sample, showing internal pores, organic structures, and coccoid cell-like structures.Zoomed regions showing coccoid clusters are indicated by arrows and numbers.
Internal Porosity Supports Microbial Activity
November 2014 Volume 80 Number 22 aem.asm.org 7017
on April 11, 2018 by guest
http://aem.asm
.org/D
ownloaded from

area has been suggested to affect cell (11) and metal adsorption(38) from groundwaters, mainly because mineral complexes cancontain active adsorption sites (39). However, the latter effectswere not examined in this study.
Changes in the biotic phase due to the presence of a mineralcoating on the filter material. Concomitant qPCR, biokinetic,and microscopic analyses of coated filter material samples showedthat microbial abundance and activity increased with an increasein the presence of the mineral coating. Second, both total (16SrRNA gene) and functional (amoA) bacterial abundances arestrongly and positively correlated with the measured volumetricNH4
� removal rates at both low and high loading rates for theinvestigated size fractions (see Fig. S4 in the supplemental mate-rial). Together with spatial distribution and microbial abundancepatterns, this indicates that aggregation of the mineral coatingpositively affects microbial activity by supporting the total andfunctional microbial densities. Furthermore, phylogenetic analy-
sis suggested that the NH4�-oxidizing types in differently coated
filter material samples were similar, which strengthens our inter-pretation that the mineral coating supports higher nitrifier abun-dance and activity. Considering the microbial colonization capac-ity and spatial microbial distribution experiments, it is more likelythat the internal pore surfaces of the mineral coating create solid-liquid interfaces wherein microbes utilize substrate and grow andare protected from wash-out, as might occur during filter back-washing. Hence, the greater the pore surface area (with the averagebiofilm depths of 60.6 � 35 �m for T 2.0 –2.4 and 12.3 � 5 �m forT 1.0 –1.4 grain fractions from the outer boundary; no biofilmswere detected below this range) (Fig. 4b and c), the more biomassthat can be supported. This mechanism could also lead to an in-crease in abundance of functional groups (for example, AOBabundances) (Fig. 3) with increases in the degree of coating due tobetter accessibility of substrates and nutrients. The abundance ofNH4
�-oxidizing archaea (AOA), on the other hand, did not
AF272422.1, Nitrosomonas oligotropha(1 seq.)OTU1
AY123797.1, Nitrosomonas sp. Nm84OTU2 (1 seq.)
HQ221936.1, Uncultured Nitrosomonas bacteriumOTU3 (1 seq.)
OTU4 (1 seq.)OTU5 (1 seq.)
OTU6 (1 seq.)OTU7 (1 seq.)
OTU8 (25/11 seq.)HQ385566.1, Uncultured Nitrosospira bacterium
OTU9 (1 seq.)OTU10 (1 seq.)
FR828473.1, Nitrosomonas marinaAJ298734.1, Nitrosomonas aestuarii
AF272423.1, Nitrosomonas cryotoleransGQ451713.1, Nitrosomonas europaeaOTU11 (9 seq.)
M96403.1, Nitrosococcus mobilisX84659.1, Nitrosospira sp.
JX426837.1, Uncultured Candidatus Nitrosoarchaeum archaeonOTU12 (14/22/26/103 seq.)
JX426863.1, Uncultured Candidatus Nitrosoarchaeum archaeonHE589649.1, Uncultured Candidatus Nitrosoarchaeum archaeonOTU13 (47 seq.)
AM055706.1, Uncultured Marine Group I archaeonOTU14 (1 seq.)
DQ823185.1, Uncultured Nitrosococcus bacteriumOTU15 (2 seq.)
OTU16 (1 seq.)OTU17 (1 seq.)
EF019900.1, Uncultured Nitrospira sp.OTU18 (1 seq.)
OTU19 (5/1 seq.)EF018579.1, Uncultured Nitrospira sp.
OTU20 (54/14 seq.)OTU21 (1 seq.)AF293012.1, Uncultured Nitrospira bacterium MNF8
OTU22 (1 seq.)OTU23 (1 seq.)OTU24 (5 seq.)
OTU25 (1 seq.)AB252939.1, Uncultured Nitrospirae bacterium
OTU26 (33/14 seq.)HE603172.1, Uncultured Nitrospirae bacteriumJN802217.1, Uncultured Nitrospira sp.AF155152.1, Nitrospira cf. moscoviensis SBR1015X82558.1, Nitrospira moscoviensisOTU27 (14/102 seq.)AB176700.1, Uncultured Nitrospirae bacterium
OTU28 (1 seq.)OTU29 (1 seq.)
FJ484782.1, Uncultured Nitrospirae bacteriumOTU30 (1 seq.)
OTU31 (1 seq.)EF019030.1, Uncultured Nitrospira sp.
JF833528.1, Uncultured Nitrospira sp.OTU32 (1 seq.)
0.10
T 2.0-2.4T 1.0-1.4M 1.0-1.4M 0.6-1.0
FIG 6 Phylogenetic tree of OTU0.03s related to taxa of NH4�-oxidizing and NO2�-oxidizing prokaryotes in the investigated filter material samples. The tree
was constructed using the neighbor-joining algorithm in ARB with 1,000 bootstrap replicates. The percentage of replicate trees (60%) are shown by thickbranches. The scale bar represents 0.10 substitutions per nucleotide position. The numbers in parentheses refer to the observed sequences in each OTU0.03. Filtergrain fractions are as indicated on the figure. seq, sequence(s).
Gülay et al.
7018 aem.asm.org Applied and Environmental Microbiology
on April 11, 2018 by guest
http://aem.asm
.org/D
ownloaded from

change monotonically with coating mass; instead, it was higher forthe less coated filter material from the deeper filter layer (see TableS5 and Fig. S11 in the supplemental material). This is potentiallyattributed to different niche preferences than those of AOBs, suchas low tolerance for high NH4
� concentrations and higher NH4�
affinities (40, 41). Microbial colonization experiments, facilitatedby increasing the NH4
� and P load, indicated the availability ofinner pores for microbial colonization.
EPS compounds have previously been identified on the surfaceof filter materials in different RSFs (42, 43). Our E-SEM imagesconfirm the presence of EPS and embedded biofilms, but, incontrast to previous findings (42, 43), they were detected in theinternal pores of the mineral coating rather than on the exter-nal surface.
Concluding remarks. In contrast to the presumed negativeeffect of coatings on microbes, our results demonstrate the strongpositive effect of a mineral coating on microorganisms in RSFs.The large internal porosity of the mineral coating supports micro-bial colonization, resulting in higher NH4
� removal rates and mi-crobial densities. These positive correlations suggest that the min-eral coating plays a protective and supportive role in microbialcolonization, density, and activity in RSFs treating groundwater.
ACKNOWLEDGMENTS
We thank George Kwarteng Amoako for assistance in sample collectionand all personnel at the Islevbro Water Treatment Plant for access to their
facilities. We also thank Sinh Hy Nguyen and Annie Ravn Petersen fortechnical assistance and Carson O. Lee for samples from his pilot plant.
This research was financed by The Danish Council for Strategic Re-search (Project DW Biofilter).
REFERENCES1. Sharma SK, Greetham MR, Schippers JC. 1999. Adsorption of iron(II)
onto filter media. Aqua 48:84 –91.2. Bai Y, Liu R, Liang J, Qu J. 2013. Integrated metagenomic and physio-
chemical analyses to evaluate the potential role of microbes in the sandfilter of a drinking water treatment system. PLoS One 8:e61011. http://dx.doi.org/10.1371/journal.pone.0061011.
3. Søgaard EG, Madsen HT. 2013. Groundwater chemistry and treatment:application to Danish waterworks, p 223–246. In Elshorbagy W, Chowd-hury RK (ed), Water treatment. InTech, Rijeka, Croatia.
4. Teunissen K, Abrahamse A, Leijssen H, Rietveld L, van Dijk H. 2008.Removal of both dissolved and particulate iron from groundwater. Drink.Water Eng. Sci. Discuss. 1:87–115. http://dx.doi.org/10.5194/dwesd-1-87-2008.
5. Wolthoorn A, Temminghoff EJM, van Riemsdijk WH. 2004. Effect ofsynthetic iron colloids on the microbiological NH4
� removal process dur-ing groundwater purification. Water Res. 38:1884 –1892. http://dx.doi.org/10.1016/j.watres.2003.12.026.
6. Sharma SK, Sebwato C, Petrusevski B, Schippers JC. 2002. Effect ofgroundwater quality on adsorptive iron removal. J. Water Supply Res.Technol. 51:199 –208.
7. Sharma SK, Petrusevski B, Schippers JC. 2002. Characterisation ofcoated sand from iron removal plants. Water Supply 2:247–258.
8. Hu P-Y, Hsieh Y-H, Chen J-C, Chang C-Y. 2004. Characteristics ofmanganese-coated sand using SEM and EDAX analysis. J. Colloid Inter-face Sci. 272:308 –313. http://dx.doi.org/10.1016/j.jcis.2003.12.058.
FIG 7 (a) Bacterial 16S rRNA gene copy equivalents for grains with different sizes from one full-scale (DWTP 1-FS) and two pilot-scale (DWTP 1-PS1 andDWTP 1-PS2) filters. CLSM images of the cryosectioned mineral coating layer from a T 2.0 –2.4 filter material sample of the full-scale filter (b) and the pilot-scalefilter (c) show the spatial distribution of microorganisms (green, SYTO9 stain; yellow, propidium iodide with SYTO9 stain).
Internal Porosity Supports Microbial Activity
November 2014 Volume 80 Number 22 aem.asm.org 7019
on April 11, 2018 by guest
http://aem.asm
.org/D
ownloaded from
9. Lo S-L. 1996. Characteristics and adsorption properties of iron-coatedsand. Water Sci. Technol. 35:63–70.
10. Buamah R, Petrusevski B, Schippers JC. 2009. Oxidation of adsorbedferrous iron: kinetics and influence of process conditions. Water Sci.Technol. 60:2353–2363. http://dx.doi.org/10.2166/wst.2009.597.
11. Mills AL, Herman JS, Hornberger GM, Dejesús H, Dejesus TH. 1994.Effect of solution ionic strength and iron coatings on mineral grains on thesorption of bacterial cells to quartz sand. Appl. Environ. Microbiol. 60:3300 –3306.
12. Knapp EP, Herman JS, Hornberger GM, Mills AL. 1998. The effect ofdistribution of iron-oxyhydroxide grain coatings on the transport of bac-terial cells in porous media. Environ. Geol. 33:243–248. http://dx.doi.org/10.1007/s002540050243.
13. US Environmental Protection Agency. 1996. Acid digestion of sedi-ments, sludges, and soils: method 3050b. US Environmental ProtectionAgency, Washington, DC. http://www.epa.gov/osw/hazard/testmethods/sw846/pdfs/3050b.pdf.
14. Tatari K, Smets BF, Albrechtsen H-J. 2013. A novel bench-scale columnassay to investigate site-specific nitrification biokinetics in biological rapidsand filters. Water Res. 47:6380 – 6387. http://dx.doi.org/10.1016/j.watres.2013.08.005.
15. Lee CO, Boe-Hansen R, Musovic S, Smets B, Albrechtsen H-J, BinningP. 2014. Effects of dynamic operating conditions on nitrification in bio-logical rapid sand filters for drinking water treatment. Water Res. 64:226 –236. http://dx.doi.org/10.1016/j.watres.2014.07.001.
16. Pellicer-Nàcher C, Franck S, Gülay A, Ruscalleda M, Terada A, Al-SoudWA, Hansen MA, Sørensen SJ, Smets BF. 2014. Sequentially aeratedmembrane biofilm reactors for autotrophic nitrogen removal: microbialcommunity composition and dynamics. Microb. Biotechnol. 7:32– 43.http://dx.doi.org/10.1111/1751-7915.12079.
17. Yu Y, Lee C, Kim J, Hwang S. 2005. Group-specific primer and probe setsto detect methanogenic communities using quantitative real-time poly-merase chain reaction. Biotechnol. Bioeng. 89:670 – 679. http://dx.doi.org/10.1002/bit.20347.
18. Pellicer-Nàcher C, Sun SP, Lackner S, Terada A, Schreiber F, Zhou Q,Smets BF. 2010. Sequential aeration of membrane-aerated biofilm reac-tors for high-rate autotrophic nitrogen removal: experimental demon-stration. Environ. Sci. Technol. 44:7628 –7634. http://dx.doi.org/10.1021/es1013467.
19. Sundberg C, Al-Soud W a, Larsson M, Alm E, Yekta SS, Svensson BH,Sørensen SJ, Karlsson A. 2013. 454 pyrosequencing analyses of bacterialand archaeal richness in 21 full-scale biogas digesters. FEMS Microbiol.Ecol. 85:612– 626. http://dx.doi.org/10.1111/1574-6941.12148.
20. Sutton NB, Maphosa F, Morillo JA, Abu Al-Soud W, Langenhoff AA,Grotenhuis T, Rijnaarts HH, Smidt H. 2013. Impact of long-term dieselcontamination on soil microbial community structure. Appl. Environ.Microbiol. 79:619 – 630. http://dx.doi.org/10.1128/AEM.02747-12.
21. Caporaso JG, Kuczynski J, Stombaugh J, Bittinger K, Bushman FD,Costello EK, Fierer N, Peña AG, Goodrich JK, Gordon JI, Huttley GA,Kelley ST, Knights D, Koenig JE, Ley RE, Lozupone CA, Mcdonald D,Muegge BD, Pirrung M, Reeder J, Sevinsky JR, Turnbaugh PJ, WaltersWA, Widmann J, Yatsunenko T, Zaneveld J, Knight R. 2010. QIIMEallows analysis of high-throughput community sequencing data. Nat.Methods 7:335–336. http://dx.doi.org/10.1038/nmeth.f.303.
22. Edgar RC, Haas BJ, Clemente JC, Quince C, Knight R. 2011. UCHIMEimproves sensitivity and speed of chimera detection. Bioinformatics 27:2194 –2200. http://dx.doi.org/10.1093/bioinformatics/btr381.
23. DeSantis TZ, Hugenholtz P, Larsen N, Rojas M, Brodie EL, Keller K,Huber T, Dalevi D, Hu P, Andersen GL. 2006. Greengenes, a chimera-checked 16S rRNA gene database and workbench compatible with ARB.Appl. Environ. Microbiol. 72:5069 –5072. http://dx.doi.org/10.1128/AEM.03006-05.
24. Caporaso JG, Bittinger K, Bushman FD, DeSantis TZ, Andersen GL,Knight R. 2010. PyNAST: a flexible tool for aligning sequences to a tem-plate alignment. Bioinformatics 26:266 –267. http://dx.doi.org/10.1093/bioinformatics/btp636.
25. Altschul SF, Gish W, Miller W, Myers EW, Lipman DJ. 1990. Basic localalignment search tool. J. Mol. Biol. 215:403– 410. http://dx.doi.org/10.1016/S0022-2836(05)80360-2.
26. Pruesse E, Quast C, Knittel K, Fuchs BM, Ludwig W, Peplies J, Glöck-ner FO. 2007. SILVA: a comprehensive online resource for qualitychecked and aligned ribosomal RNA sequence data compatible with ARB.Nucleic Acids Res. 35:7188 –7196. http://dx.doi.org/10.1093/nar/gkm864.
27. Quast C, Pruesse E, Yilmaz P, Gerken J, Schweer T, Yarza P, Peplies J,Glockner FO. 2013. The SILVA ribosomal RNA gene database project:improved data processing and web-based tools. Nucleic Acids Res. 41:D590 –D596. http://dx.doi.org/10.1093/nar/gks1219.
28. Ludwig W, Strunk O, Westram R, Richter L, Meier H, YadhukumarBuchner A, Lai T, Steppi S, Jobb G, Förster W, Brettske I, Gerber S,Ginhart AW, Gross O, Grumann S, Hermann S, Jost R, König A, LissT, Lüssmann R, May M, Nonhoff B, Reichel B, Strehlow R, StamatakisA, Stuckmann N, Vilbig A, Lenke M, Ludwig T, Bode A, Schleifer K-H.2004. ARB: a software environment for sequence data. Nucleic Acids Res.32:1363–1371. http://dx.doi.org/10.1093/nar/gkh293.
29. Ferris MJ, Muyzer G, Mard DM. 1996. Denaturing gradient gel electro-phoresis profiles of 16S rRNA-defined populations inhabiting a hot springmicrobial mat community. Appl. Environ. Microbiol. 62:340 –346.
30. Rotthauwe JH, Witzel KP, Liesack W. 1997. The ammonia monooxy-genase structural gene amoA as a functional marker: molecular fine-scaleanalysis of natural ammonia-oxidizing populations. Appl. Environ. Mi-crobiol. 63:4704 – 4712.
31. Francis CA, Roberts KJ, Beman JM, Santoro AE, Oakley BB. 2005.Ubiquity and diversity of ammonia-oxidizing archaea in water columnsand sediments of the ocean. Proc. Natl. Acad. Sci. U. S. A. 102:14683–14688. http://dx.doi.org/10.1073/pnas.0506625102.
32. Ririe KM, Rasmussen RP, Wittwer CT. 1997. Product differentiation byanalysis of DNA melting curves during the polymerase chain reaction.Anal. Biochem. 245:154 –160. http://dx.doi.org/10.1006/abio.1996.9916.
33. Kinner NE, Harvey RW, Blakeslee K, Novarino G, Meeker LD. 1998.Size-selective predation on groundwater bacteria by nanoflagellates in anorganic-contaminated aquifer. Appl. Environ. Microbiol. 64:618 – 625.
34. Flemming H, Wingender J. 2010. The biofilm matrix. Nat. Rev. Micro-biol. 8:623– 633. http://dx.doi.org/10.1038/nrmicro2415.
35. Prasad DY, Belsare DK. 1984. The physico-chemical characteristics of theused filter sand and its role in the seven water works systems in a tropicalregion. Acta Hydrochim. Hydrobiol. 12:73– 80. http://dx.doi.org/10.1002/aheh.19840120113.
36. Sharma SK. 2001. Adsorptive iron removal from groundwater. Ph.D.thesis. Wageningen University, Wageningen, The Netherlands.
37. Diz HR, Novak JT. 1998. Fluidized bed for removing iron and acidityfrom acid mine drainage. J. Environ. Eng. 124:701–708. http://dx.doi.org/10.1061/(ASCE)0733-9372(1998)124:8(701).
38. Buamah R, Petrusevski B, Schippers JC. 2008. Adsorptive removal ofmanganese(II) from the aqueous phase using iron oxide coated sand.J. Water Supply Res. Technol. 57:1. http://dx.doi.org/10.2166/aqua.2008.078.
39. Sahabi DM, Takeda M, Suzuki I, Koizumi J. 2009. Removal of Mn2�
from water by “aged” biofilter media: the role of catalytic oxides layers.J. Biosci. Bioeng. 107:151–157. http://dx.doi.org/10.1016/j.jbiosc.2008.10.013.
40. Stahl DA, de la Torre JR. 2012. Physiology and diversity of ammonia-oxidizing archaea. Annu. Rev. Microbiol. 66:83–101. http://dx.doi.org/10.1146/annurev-micro-092611-150128.
41. Martens-Habbena W, Berube PM, Urakawa H, de la Torre JR, StahlDA. 2009. Ammonia oxidation kinetics determine niche separation ofnitrifying Archaea and Bacteria. Nature 461:976 –979. http://dx.doi.org/10.1038/nature08465.
42. Schwartz T, Jungfer C, Heissler S, Friedrich F, Faubel W, Obst U.2009. Combined use of molecular biology taxonomy, Raman spec-trometry, and ESEM imaging to study natural biofilms grown on filtermaterials at waterworks. Chemosphere 77:249 –257. http://dx.doi.org/10.1016/j.chemosphere.2009.07.002.
43. White CP, Debry RW, Lytle DA. 2012. Microbial survey of a full-scale,biologically active filter for treatment of drinking water. Appl. Environ.Microbiol. 78:6390 – 6394. http://dx.doi.org/10.1128/AEM.00308-12.
44. Chang Y, Li CW, Benjamin MM. 1997. Iron oxide-coated media advan-tages over conventional sand media for NOM sorption and particulatefiltration. Am. Water Works Assoc. J. 89:100 –113.
45. Katsoyiannis I, Zouboulis A. 2002. Removal of arsenic from contami-nated water sources by sorption onto iron-oxide-coated polymeric mate-rials. Water Res. 36:5141–5155. http://dx.doi.org/10.1016/S0043-1354(02)00236-1.
46. Lee CO. 2014. Processes affecting nitrification performance in biologicalrapid sand filters. Ph.D thesis. Technical University of Denmark, Kgs.Lyngby, Denmark.
Gülay et al.
7020 aem.asm.org Applied and Environmental Microbiology
on April 11, 2018 by guest
http://aem.asm
.org/D
ownloaded from