internal migration indonesia...mainly applied to international migration, and mostly on migration...
TRANSCRIPT

1
The determinants of internal migration in a developing country: quantitative evidence for Indonesia, 1930-2000
J. van Lottuma* and D. Marksb
a Cambridge Group for the History of Population and Social Structure, Geography
Department, University of Cambridge, Cambridge, UK
b International Institute for Social History Amsterdam / Faculty of Economics,
Utrecht University, Utrecht, the Netherlands
* Corresponding author. E-mail: [email protected]; Tel: +44(0)1223 333194
Keywords: Internal Migration; Indonesia; Gravity Model; Policy; Development
JEL codes: J61; J68; N15; O15
Abstract
This study specifies and estimates a gravity model for inter-provincial migration in
Indonesia. Using panel data for Indonesia’s 26 provinces for 5 survey years between
1930 and 2000 we show that throughout the twentieth century economic factors were
more important in the explanation of inter-provincial migration patterns in Indonesia
than planned migration policy aimed at the redistribution of the population. In
addition, our regression analysis demonstrates that the urban primacy of Jakarta,
Indonesia’s capital, had a strong effect on the direction and size of migration flows
as well. Our findings thus suggest that the costly government-supported migration is
not very successful and that a strongly centralized government induces migration
flows to the capital. These findings have policy implications for other developing
countries.
2
I. Introduction
Immigration is a controversial issue in developed and developing countries alike, and
increasingly economists have dealt with explaining its causes and effects (Lewer and
Van den Berg (2008). The economic approach to immigration has, however, been
mainly applied to international migration, and mostly on migration flows between
developed countries. The number of empirical studies that attempt to model internal
migration in developing countries is still relatively limited, and the lion share of such
studies has relied on the work Harris and Todaro (1970) which focuses on rural-
urban migration (a two sector model). The present article has a different aim and
methodology in that it studies developments in Indonesia’s inter-provincial
migration flows between 1930 and 2000 by applying a modified gravity model.
Using Borjas’ (1989) concept of immigrant markets and their gravitational behaviour
we aim to study the main determinants of migration flows in Indonesia during a
period where it changed from being part of the Dutch colonial empire to one of the
largest economies in (Southeast) Asia. Specifically we ask the question which factors
have driven internal population movements in Indonesia, and what the effect was of
deliberate government programs to promote migration from specific provinces, and
how the economic and social conditions in the sending and receiving provinces
influenced the inclination to migrate.
To answer this question we specify and estimate a modified gravity model of
migration using migration flows for five survey years covering seven decades: 1930,
1971, 1980, 1990 and 2000. The approach in estimating the model for internal
migration is similar to that of Lewer and Van den Berg (2007) and Karemera et al.

3
(2000) who, however, applied a gravity model on international migration. In
addition, following in particular Karemera et al.’s (2000) methodology of ranking
the migration elasticities (or the beta-coefficients) for the five survey years, we aim
to compare the importance of the determinants of internal migration in Indonesia
diachronically.
This article is in five parts. Section II presents an outline of internal migration
in Indonesia between 1930 and 2000. Section III lays out the theoretical assumptions
of our model, and discusses the data and the econometric procedures we applied in
this study. Section IV discusses the results. Finally, in section V we will present our
conclusions.
II. Internal migration in Indonesia, 1930-2000
Indonesia is an important case being the fourth most populous country in the world
with more than 200 million inhabitants in 2000. Moreover, it is the world’s largest
archipelago, consisting of ca 17,000 islands which span more than 5,000 km
eastward from Sabang in northern Sumatra to Merauke in Irian Jaya. If one would
superimpose a map of Indonesia over one of Europe, one will find that it stretches
from Ireland to Iran; compared to the United States, it covers the area from
California to Bermuda.
The available sources for the twentieth century show that internal migration
in Indonesia is far from a recent phenomenon. Already under Dutch rule – Indonesia
declared independence in 1945, which was only acknowledged by the Dutch in 1949
– it already had a highly geographically mobile population. According to the 1930
population census no less than 11.5% of the total indigenous population of Indonesia
4
lived outside their district of birth (Volkstelling, 1930) although only half of this
(5.6%) moved beyond the provincial borders. Still, in absolute figures this boils
down to a number of 3.3 million inter-provincial migrants. Throughout the twentieth
century, interprovincial migration increased significantly. While in 1971, with 5% of
the total population living in another province than the province of birth, levels of
internal migration were about equal to that of the colonial period, from the 1970s
onwards inter provincial migration increased significantly. In the following decade
the number of inter-provincial migration rose to 7.0 %, in 1990 it was 8.2 % and by
2000 it had increased to about double the share of 1930 and 1970: 10.1 %.
The – mostly sociological – literature on internal migration in colonial
Indonesia points out at least three factors that contributed to inter-provincial
population movements in Indonesia. Firstly, in the first half of the twentieth century
the number of Dutch plantations in the Outer Islands increased strongly.1 Since
labour was scarce here, planters recruited people from Java. Secondly, in 1905 the
Dutch government considered Java to be overpopulated and introduced a program to
resettle people from Java to the Outer Islands. Migrant families were provided some
money as a migration premium and could in addition get a credit, which had to be
repaid. Thirdly, the concentration of colonial activity in Java also led to a number of
growing urban centres such as Batavia (after independence it was renamed as
Jakarta), Surabaya and Semarang (Hugo, 1980, 114). According to Pelzer (1945,
175) these cities attracted people from the crowded interior because of the
employment opportunities they offered.
As the figures above pointed out, from the 1970s onwards inter-provincial
migration in Indonesia remained to be an important phenomenon. The causes for
1 Due to Java’s importance as core region, other parts of the archipelago are usually referred to collectively as the ‘Outer Islands’.
5
internal migration mentioned in the literature on post-colonial Indonesia are roughly
similar to those mentioned in the studies on the Dutch period. The concentration of
economic activity on Java and in particular in Jakarta, overall income differentials,
and the government policy of transmigration are seen as the most important
explaining factors for inter-provincial population movements in Indonesia since
independence. Tirtosudarmo (2009), however, speculates that due to substantial
reduction in the government capacity to move people under transmigration policy, in
recent years migration has become predominantly a function of the labour market
economy, this is something we will return to in our analysis.
This brief overview of the mostly qualitative literature on internal migration
in Indonesia highlights a number of factors that are deemed to be important in
determining migration patterns in Indonesia: relative income, migration policy in the
shape of transmigration, but also the role of Jakarta as urban primate. In the
following section we will not only test the hypotheses whether these factors had
indeed a statistical effect, but also determine their relative importance and whether
this changed over time.
III. A gravity model of internal migration in Indonesia, 1930-2000
Theoretical framework
In this paragraph we evaluate the factors affecting migration flows between regions
using a gravity model. The starting point of the gravity model of migration is the
assumption that migration is driven by the attractive force between migrant source
and destination location and impeded by the costs of moving from one country to
another (Ravenstein, 1885, 1889; Zipf, 1946). The hypothesis that people migrate if

6
the expected earnings exceed the costs of the move (using distance as a proxy for the
cost of migration) was further developed in the work of Greenwood (1975) and
Borjas (1989). The latter proposed a model of immigration taking into account a set
of variables in the host and destination country influencing the size and composition
of the immigrant influx: economic performance; immigration policies, political
orientation; and education levels.
Our model is based on the theoretical considerations of Borjas (1989), whose
model is built on three basic equations: a wage earning function for the country of
origin; one for the country of destination; and a function that takes into account the
costs of moving between the two. However, as Karemera et al. (2000) have argued,
neither Borjas nor Greenwood provides econometric estimates of the elasticities of
migration with regard to the characteristics in their models. Therefore, in this article,
we follow the successful approach of Karemera et al. (2000) and Lewer and Van den
Berg (2007) in formulating and estimating a gravity model of migration. In doing so
we aim to empirically derive migration impact elasticities for the five survey years in
our Indonesia dataset. Subsequently, we will compare the impact of the elasticities
diachronically, by means of ranking the beta-coefficients derived from the regression
analyses for 1930, 1971, 1980, 1990 and 2000.
The gravity model
Let us first look at formulation of the basic gravity model, which includes the
theoretical assumption mentioned above. The starting assumption of our model is
that migration is expected to be positively related to the population in the origin and
destination. Ceteris paribus, the more people there are in a source region, the more
people are likely to migrate; the larger the population in the destination region, the

7
larger is the labour market for immigrants. In addition, wage differentials between
sending and receiving provinces are also likely to influence migration patterns.
Following the neo-classical assumption of the labour market model in which
migrants are regarded as rational actors who want to better themselves, differences in
wages trigger population movements. At the same time, we assume migration to be
negatively related to the distance between sending and receiving region since one is
likely to incur higher costs if one needs to travel further. A final factor we control
for in our basic model is that people are likely to move to neighbouring provinces –
the concept of contiguity. To control for this phenomenon, we include a contiguity
dummy in our model. This leads to the basic gravity equation
ln (migij) = α0 + α1 ln(popi) + α2ln(popj) + α3relyij + α4 ln(distij) + α5contig + uij
(1)
where migij represents the migration from source region i to destination region j,
relyij is the ratio of source region to destination region of log per capita incomes,
distij is the logged distance between source region i and destination region j, contig is
a dummy variable with the value of 1 if provinces have a common boundary and 0
otherwise, and uij is an error term. The expected signs of the coefficients are α1> 0, α2
> 0, α3 < 0, α4 < 0 and α5 > 0.
The model can be improved by controlling for two other factors, namely
transmigration and urban primacy. We will first deal with the issue of
transmigration. The policy of transmigration policy was initiated under Dutch
colonial rule during the early twentieth century and taken over by the Indonesian
government after independence. Transmigration had three main goals. First of all,
8
the government aimed to use this policy measure to distribute the population more
evenly by moving millions of Indonesians from the densely populated islands (Java,
Bali, Madura) to the outer, less densely populated islands, indeed to achieve a more
balanced demographic development and to alleviate demographic pressure.
Secondly, it was aimed at the reduction of poverty by providing land and (thus) new
opportunities to poor landless settlers. Finally, the colonial and later national
government used this measure to exploit more effectively the agricultural potential
of the outer islands. To study the effect of transmigration we include a dummy
variable
ln (migij) = α0 + α1 ln(popi) + α2ln(popj) + α3relyij + α4 ln(distij) + α5contig +
α6trans_mig + uij
(2)
in which trans_mig is a transmigration dummy, which is 1 for migration from Java
to a transmigration region and 0 otherwise.
The second influence on internal migration in Indonesia we want to control
for is urban primacy. A primate city is the major city in a country, which as a result
plays a dominant role on different levels. It not only is a city that encapsules a large
proportion of the urban population of a country, but is also the political, economical,
cultural and transportation center of a nation (Ades and Glaeser, 1995; Henderson,
2000). The general rule is that whenever the ratio of the size of the first to that of the
second city exceeds two, the city size is said to be primate (Mutlu, 1989: 611).
Jakarta has clearly been the primate city of Indonesia throughout the
twentieth century. At the beginning of the twentyfirst century it was more than twice

9
as populous as the second largest city Surabaya (in the province of East Java).
Jakarta's population in 2005 was 8.8 million which is 3.2 times the population of
Surabaya (2.75 million). Moreover, the combined population of Surabaya, Bandung
(West Java) and Medan (North Sumatra) in 2005 – the second, third and fourth
populous cities in Indonesia respectively – was only 7.1 million: still well below the
number of inhabitants of Jakarta (United Nations, World Population Prospects). To
study the influence of urban primacy on internal migration patterns in Indonesia we
include a dummy variable for Jakarta in the basic gravity model (Equation 1), which
suggest the following equation.
ln (migij) = α0 + α1 ln(popi) + α2ln(popj) + α3relyij + α4 ln(distij) + α5contig + α7 Jkt +
uij
(3)
in which Jkt is a dummy which is 1 for migration to Jakarta and 0 otherwise. Clearly,
this dummy bears the risk of bringing in the problem of multicollinearity in the
model, since Jakarta is also the province with relatively high per capita income. Yet,
in estimating the model we do not find large changes in the estimated regression
coefficients when a predictor variable is added or deleted, and we do not find a high
R squared with low values for t-statistics (Alheety and Gore 2009; Bhattacharyya
2009).
The foregoing considerations combined suggests the following augmented
gravity equation

10
ln (migij) = α0 + α1 ln(popi) + α2ln(popj) + α3relyij + α4 ln(distij) + α5contig +
α6trans_mig + α7 Jkt + uij
(4)
Data
The migration data is based on lifetime migration flows for the survey years 1930,
1971, 1980, 1990 and 2000. This provided matrices of 650 migration flows between
the 26 provinces of Indonesia for the respective benchmark years. For the years 1930
and 2000 we had to make some adaptations, because in these survey years
Indonesia’s provincial division differed from the intermediate ones.
The distance variable in our analysis was calculated between the geographic
centres (or centroids) of the provinces using ArcGis software. Data on regional
Gross Domestic Product (GDP) per capita has been published by the Indonesian
Central Bureau of Statistics (BPS) since 1970 in the annual statistical yearbooks. For
1930 we had to rely on provincial wage data taken from Dros (1992).
IV. Results
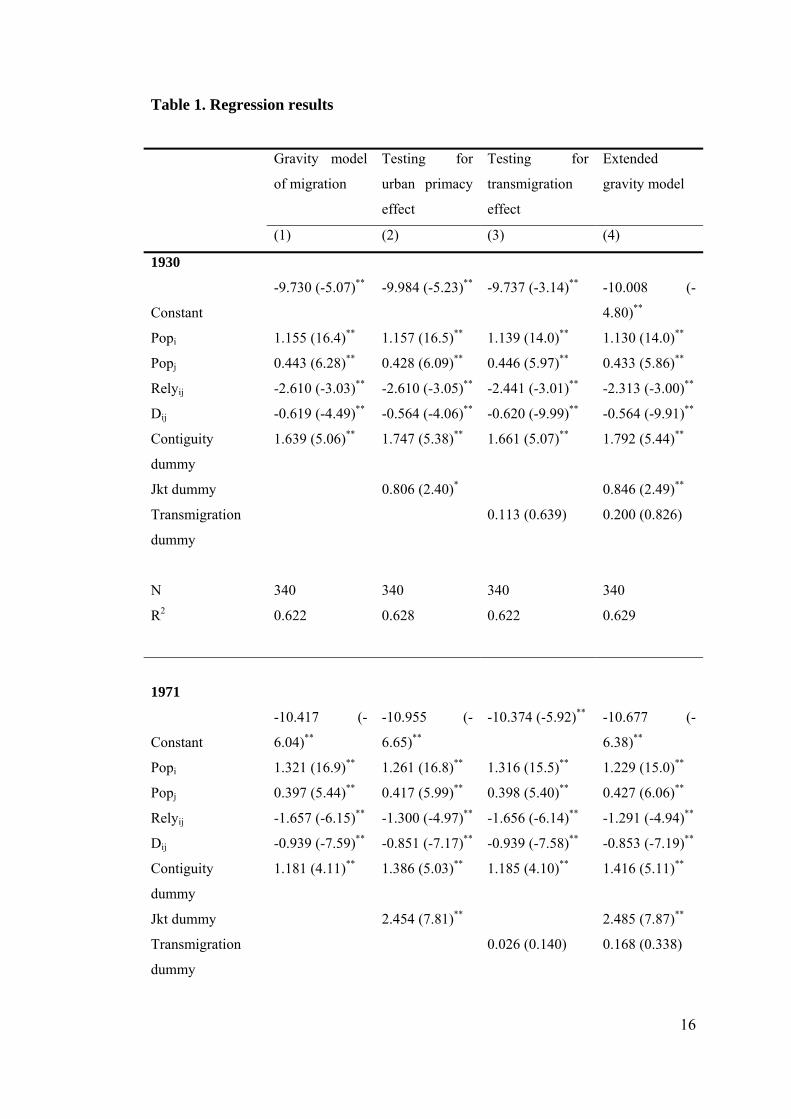
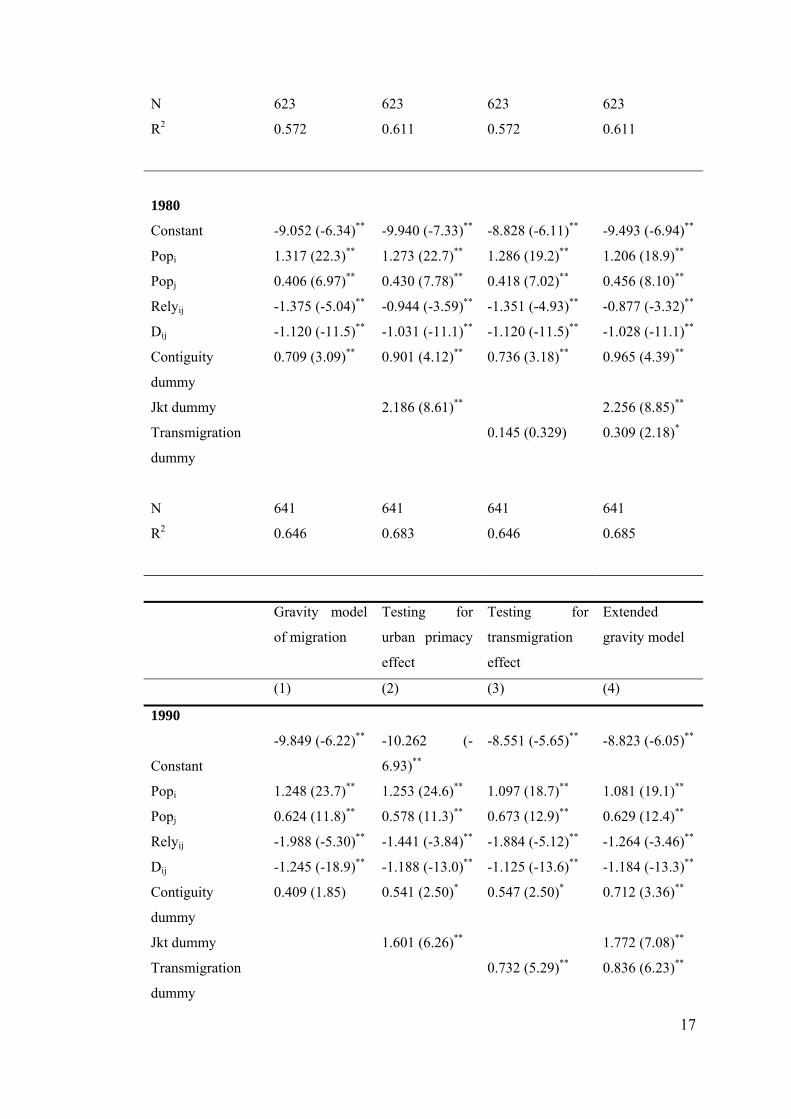
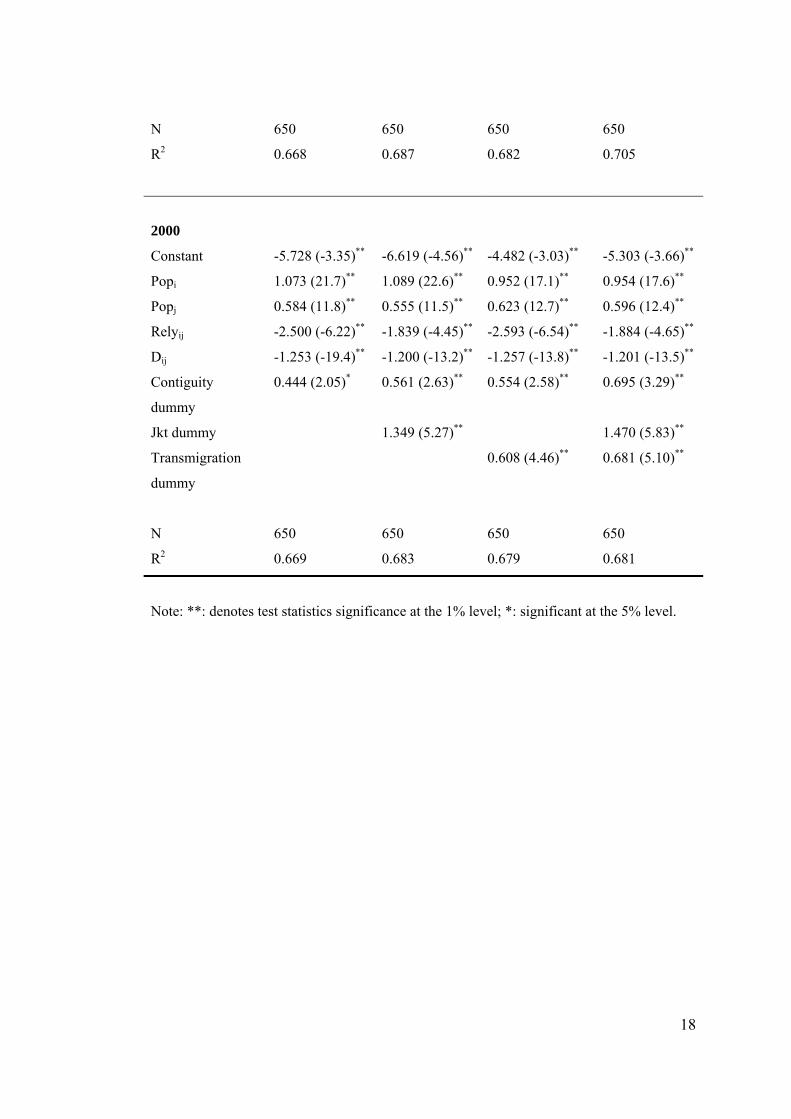
Table 1 provides the regression results for the 4 models in the 5 benchmark years.
All estimated variables have the expected sign and almost all are statistically
significant at the 1% level. In all cases the simple gravity model (Equation 1) already
explains at least 57.2% of the observed variation in the depended variable inter-
provincial migration, which increases when the dummy variables for transmigration
(Equation 2) and urban primacy are estimated (Equation 3).In all instances the

11
highest R square is reached in the most elaborate model (Equation 4) with a
minimum of 0.61 in 1971 and a maximum of 0.71 in 1990.
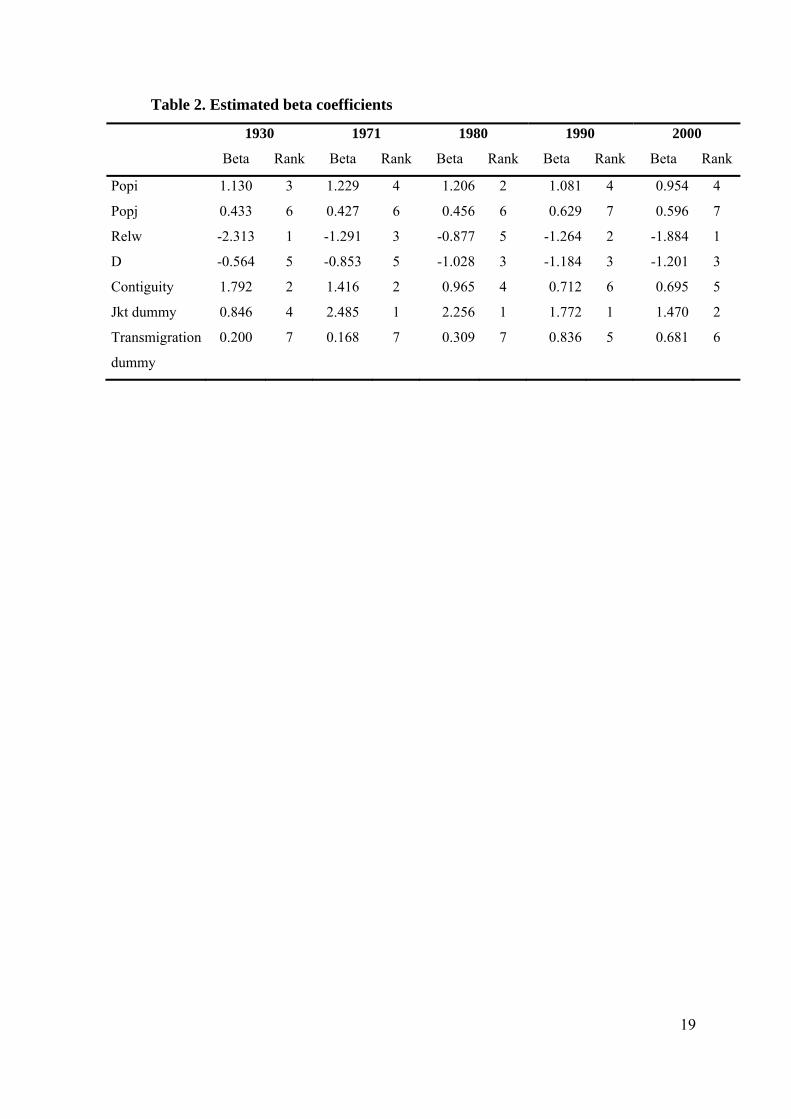
A number of interesting results emerge from the regression analysis, from
which we want to point out three main issues. Firstly, our analysis demonstrates that
the transmigration dummy is not significant for 1930, 1971 and 1980. This confirms
more qualitative studies evaluating transmigration until the 1980s (Van der Wijst,
1985; World Bank, 1988). For 1990 and 2000, however, transmigration has a
statistically significant effect on migration patterns. This can be attributed to
renewed focus on transmigration since the 1980s. Substantial loans by the World
Bank and the Asian Development Bank combined with bilateral financial assistance
made it possible to expand the transmigration programme, as a consequence in the
period 1980-1990 ten times more people were resettled than in the decades since the
beginning of state-sponsored transmigration (Adhiati and Bobsien, 2001).
Resettlement figures remained high in the first half of the 1990s, but the programme
collapsed as a result of the Asian Crisis. Nevertheless, the ranking of the beta-
coefficients in Table 2 reveals that although the effect of the transmigration policy –
mainly due to massive financial input – might have become statistically significant
from the 1990s onwards, its impact was still relatively limited compared to other
factors. Table 2 shows that the beta rank of the transmigration dummy was seventh
for the years 1930, 1971 and 1980, only fifth for 1990 to fall back again in 2000.
As the theory that underpins the basic gravity model would predict, wage
differentials between sending and receiving regions are likely to be the main
determinant in a well functioning, open economy and corresponding labour market.
Interestingly, the results of our estimation show that this variable was indeed the
most important determinant of inter-provincial migration in Indonesia in our first and

12
last survey year (1930 and 2000). Our regression analysis shows that the relative
wage was a less important factor in 1971 and 1980. The most likely explanation for
this is distortions in the (labour) market. Two causes for this can be identified:
hyperinflation and a subsequent economic and political crisis in the 1960s, and
windfall oil revenues in the 1970s. In 1990 income differentials become one of the
leading determinants again. This supports findings that markets in Indonesia were
relatively well integrated and functioned effectively in the late colonial period and
the late 20th century, while integration and efficiency in the period in between was
significantly lower (Marks, 2009). More generally, it also suggests that the basic
migration model as proposed by Borjas (1989) as well as the gravity model of
migration on which it is based has a universal applicability, not only in terms of
political setting but also diachronically.
A third finding is that the variables contiguity and distance were significant
throughout the entire period. This contrasts the findings of Lewer and Van den Berg
(2007), whose dataset contained a large number of European countries, and which
showed that contiguity was not significant. This finding stresses the fact that in
contrast for Europeans in the twentieth century, where once the distance variable
takes into account the transport costs the difficulty of moving to any other country
was more or less the same, in Indonesia people did have a tendency to move to
neighbouring provinces. This can probably be explained by the fact that for
Indonesia we are looking at internal migration while Lewer and Van den Berg
(2007) studied international migration. Compared to international migration cross
border migration is much more likely to occur for internal migration because
institutional and cultural barriers are lower.

13
Finally, a strikingly important determinant of migration patterns in Indonesia
is the role of urban primacy, as proxied by our Jakarta dummy. Since Indonesia’s
independence in the 1940s this variable has become the dominant factor in
explaining internal migration patterns. Clearly, the island of Java being Indonesia’s
economic core region, Jakarta has been the centre of this core. This explains its
attractiveness for migrants through three channels. To begin with, as Krugman and
Livas (1992) have shown for Mexico City, net transport costs are lower for domestic
goods in the central city because firms are located in that city; workers then come to
the city to pay lower prices for domestic goods. Another factor that explains the
significant effect of the Jakarta dummy is Indonesia’s trade and price intervention. In
general, the Indonesian government adopts a policy of protecting manufacturing
activities and has taxed primary sector based activities. This has led to protection of
the urban sector of Java, and Jakarta especially (Garcia-Garcia, 2000). Finally, since
its independence Jakarta has also been Indonesia’s political core. As suggested by
Ades and Glaeser (1995), urban giant leaders often extract wealth out of the
hinterlands and distribute in the capital. This pulls migrants to the city because of the
demand created by the concentration of wealth. Our analysis indicates that this
theory can also be applied to Indonesia.
V. Concluding remarks
This study applied a gravity model of model of migration on inter-provincial
migration in Indonesia between 1930 and 2000. The theoretical framework of our
study was Borjas’ (1989) model of migration, while the application of the traditional
gravity model on migration flows was based on the work of Lewer and Van den
14
Berg (2007) and Karemera et al. (2000). In order to capture the potential
determinants of internal migration flows we augmented the traditional gravity model
by including variables dealing with contiguity, migration policy and urban primacy.
This article demonstrated that the gravity model is very suitable for an
analysis of internal migration flows in a large developing country such as Indonesia,
not only for relatively recent migration flows, but also for more historical migration
movements. Our analysis showed that all in all five survey years, from 1930 up until
2000, the signs of the coefficients was as expected, and the augmented gravity model
explained a very large portion of the variation of the dependent variable, internal
migration. Given that the number of empirical studies that apply gravity models on
migration is still relatively limited, and the fact the application of the gravity model
on Indonesian migration flows for over a period of 70 years – covering different
political and economic settings – was successful, our study should thus be regarded
as a next step in the testing of the robustness and overall validity of the model.
Our analysis showed that in Indonesia between 1930 and 2000 wage
differentials between sending and receiving provinces and the presence of an urban
primate in the shape of Jakarta were the most important determinants of migration.
Nevertheless, the fact that other factors seemed to have had less influence is perhaps
equally interesting. One of the main conclusions of this study is that a policy of
supported migration (transmigration in the Indonesian case) is not only costly, but
also of relatively limited effect. Our regression analysis showed that migrants have a
tendency to base their decision on the more tangible prospect of economic
betterment, either in the shape of improvements of one’s (expected) income or the
attractiveness of moving to a primate city, than on the less concrete prospect of
moving to a region that lacks these features – even if this move is supported

15
financially by the government. This in turn suggests that in order to influence
migration patterns, for instance as a means of alleviating demographic pressure or to
even out the negative effects of lopsided regional economic growth, it seems more
effective to focus on the development of less developed regions directly than simply
to promote migration to them and thus create economic development in an in-direct
way. Indonesia is in this respect an interesting case since it already has adopted
decentralization measures since the beginning of the twenty-first century, and as
such has begun to redistribute power and wealth; as a result in recent years Jakarta
has already lost importance as economic and political core. Whether this will in fact
result in different inter-provincial migration patterns, i.e. a less central role for
Jakarta, and thus a more evenly distributed population, as indeed our analysis
suggests, is yet too early to tell and is therefore a topic for future research.
16
Table 1. Regression results
Gravity model
of migration
Testing for
urban primacy
effect
Testing for
transmigration
effect
Extended
gravity model
(1) (2) (3) (4)
1930
Constant
-9.730 (-5.07)** -9.984 (-5.23)** -9.737 (-3.14)** -10.008 (-
4.80)**
Popi 1.155 (16.4)** 1.157 (16.5)** 1.139 (14.0)** 1.130 (14.0)**
Popj 0.443 (6.28)** 0.428 (6.09)** 0.446 (5.97)** 0.433 (5.86)**
Relyij -2.610 (-3.03)** -2.610 (-3.05)** -2.441 (-3.01)** -2.313 (-3.00)**
Dij -0.619 (-4.49)** -0.564 (-4.06)** -0.620 (-9.99)** -0.564 (-9.91)**
Contiguity
dummy
1.639 (5.06)** 1.747 (5.38)** 1.661 (5.07)** 1.792 (5.44)**
Jkt dummy 0.806 (2.40)* 0.846 (2.49)**
Transmigration
dummy
0.113 (0.639) 0.200 (0.826)
N 340 340 340 340
R2 0.622 0.628 0.622 0.629
1971
Constant
-10.417 (-
6.04)**
-10.955 (-
6.65)**
-10.374 (-5.92)** -10.677 (-
6.38)**
Popi 1.321 (16.9)** 1.261 (16.8)** 1.316 (15.5)** 1.229 (15.0)**
Popj 0.397 (5.44)** 0.417 (5.99)** 0.398 (5.40)** 0.427 (6.06)**
Relyij -1.657 (-6.15)** -1.300 (-4.97)** -1.656 (-6.14)** -1.291 (-4.94)**
Dij -0.939 (-7.59)** -0.851 (-7.17)** -0.939 (-7.58)** -0.853 (-7.19)**
Contiguity
dummy
1.181 (4.11)** 1.386 (5.03)** 1.185 (4.10)** 1.416 (5.11)**
Jkt dummy 2.454 (7.81)** 2.485 (7.87)**
Transmigration
dummy
0.026 (0.140) 0.168 (0.338)
17
N 623 623 623 623
R2 0.572 0.611 0.572 0.611
1980
Constant -9.052 (-6.34)** -9.940 (-7.33)** -8.828 (-6.11)** -9.493 (-6.94)**
Popi 1.317 (22.3)** 1.273 (22.7)** 1.286 (19.2)** 1.206 (18.9)**
Popj 0.406 (6.97)** 0.430 (7.78)** 0.418 (7.02)** 0.456 (8.10)**
Relyij -1.375 (-5.04)** -0.944 (-3.59)** -1.351 (-4.93)** -0.877 (-3.32)**
Dij -1.120 (-11.5)** -1.031 (-11.1)** -1.120 (-11.5)** -1.028 (-11.1)**
Contiguity
dummy
0.709 (3.09)** 0.901 (4.12)** 0.736 (3.18)** 0.965 (4.39)**
Jkt dummy 2.186 (8.61)** 2.256 (8.85)**
Transmigration
dummy
0.145 (0.329) 0.309 (2.18)*
N 641 641 641 641
R2 0.646 0.683 0.646 0.685
Gravity model
of migration
Testing for
urban primacy
effect
Testing for
transmigration
effect
Extended
gravity model
(1) (2) (3) (4)
1990
Constant
-9.849 (-6.22)** -10.262 (-
6.93)**
-8.551 (-5.65)** -8.823 (-6.05)**
Popi 1.248 (23.7)** 1.253 (24.6)** 1.097 (18.7)** 1.081 (19.1)**
Popj 0.624 (11.8)** 0.578 (11.3)** 0.673 (12.9)** 0.629 (12.4)**
Relyij -1.988 (-5.30)** -1.441 (-3.84)** -1.884 (-5.12)** -1.264 (-3.46)**
Dij -1.245 (-18.9)** -1.188 (-13.0)** -1.125 (-13.6)** -1.184 (-13.3)**
Contiguity
dummy
0.409 (1.85) 0.541 (2.50)* 0.547 (2.50)* 0.712 (3.36)**
Jkt dummy 1.601 (6.26)** 1.772 (7.08)**
Transmigration
dummy
0.732 (5.29)** 0.836 (6.23)**
18
N 650 650 650 650
R2 0.668 0.687 0.682 0.705
2000
Constant -5.728 (-3.35)** -6.619 (-4.56)** -4.482 (-3.03)** -5.303 (-3.66)**
Popi 1.073 (21.7)** 1.089 (22.6)** 0.952 (17.1)** 0.954 (17.6)**
Popj 0.584 (11.8)** 0.555 (11.5)** 0.623 (12.7)** 0.596 (12.4)**
Relyij -2.500 (-6.22)** -1.839 (-4.45)** -2.593 (-6.54)** -1.884 (-4.65)**
Dij -1.253 (-19.4)** -1.200 (-13.2)** -1.257 (-13.8)** -1.201 (-13.5)**
Contiguity
dummy
0.444 (2.05)* 0.561 (2.63)** 0.554 (2.58)** 0.695 (3.29)**
Jkt dummy 1.349 (5.27)** 1.470 (5.83)**
Transmigration
dummy
0.608 (4.46)** 0.681 (5.10)**
N 650 650 650 650
R2 0.669 0.683 0.679 0.681
Note: **: denotes test statistics significance at the 1% level; *: significant at the 5% level.
19
Table 2. Estimated beta coefficients
1930 1971 1980 1990 2000
Beta Rank Beta Rank Beta Rank Beta Rank Beta Rank
Popi 1.130 3 1.229 4 1.206 2 1.081 4 0.954 4
Popj 0.433 6 0.427 6 0.456 6 0.629 7 0.596 7
Relw -2.313 1 -1.291 3 -0.877 5 -1.264 2 -1.884 1
D -0.564 5 -0.853 5 -1.028 3 -1.184 3 -1.201 3
Contiguity 1.792 2 1.416 2 0.965 4 0.712 6 0.695 5
Jkt dummy 0.846 4 2.485 1 2.256 1 1.772 1 1.470 2
Transmigration
dummy
0.200 7 0.168 7 0.309 7 0.836 5 0.681 6
20
References
Alheety, M. I.; Gore, S. D. (2009), ‘Two Strategies for Removing Multicollinearity’,
Bulletin of Statistics and Economics, 3, pp. 62-79.
Ades, A. F. And E. L. Glaeser (1995) Trade and Circuses: Explaining Urban Giants,
The Quarterly Journal of Economics, 110, pp. 195-227.
Adhiati, M. A. S.. and Bobsien, A. (2001) Indonesia's Transmigration Programme:
an Update, Report for Down to Earth, International Campaign for Ecological Justice
in Indonesia. Available at http://dte.gn.apc.org/ctrans.htm (accessed 15 February
2010).
Bhattacharyya, S. (2009), ‘Unbundled Institutions, Human Capital and Growth’,
Journal of Comparative Economics, 37, pp. 106–120.
Borjas, J.G. (1989) Economic Theory and International Migration, International
Migration Review, 23, pp. 457-485.
Dros, N. (1992), Changing Economy in Indonesia: a Selection of Statistical Source
Material from the Early 19th Century up to 1940, Volume 13: Wages 1820-1940,
Amsterdam
Garcia-Garcia, J. (2000) Indonesia’s Trade and Price Interventions: Pro-Java and
Pro-Urban, Bulletin of Indonesian Economic Studies, 36, pp. 93-112.
21
Greenwood, M. (1975) Research on Internal Migration in the United States: a
Survey, Journal of Economic Literature, 13, pp. 397-433.
Harris, J.R. and Todaro, N.O., ‘Migration, unemployment and development: a two
sector analysis’, The American Economic Review, 60 (1970), pp. 126-142.
Henderson, V. (2000) How Urban Concentration Affects Economic Growth, World
Bank Policy Research Working Paper No. 2326, World Bank.
Karemera, D, Iwuagwu Oguledo, V., and Davis, B. (2000) A Gravity Model
Analysis of International Migration to North America, Applied Economics, 32, pp.
1745-1755.
Krugman, P. and Livas, R. (1992) Trade Policy and Third World Metropolis, NBER
Working Paper No. 4238, NBER, Cambridge, Mass.
Lewer, J. J. and Van den Berg, H. (2008) A Gravity Model of Immigration,
Economics Letters, 99, pp. 164-167.
Marks, Daan (2009), ‘Unity or diversity? On the integration and efficiency of rice
markets in Indonesia, c. 1920–2006’, Explorations in Economic History,
doi:10.1016/j.eeh.2009.08.002.

22
Mutlu, S. (1989) Urban Concentration and Primacy Revisited: An Analysis and
Some Policy Conclusions, Economic Development and Cultural Change, 37, pp.
611-639.
Pelzer, K. J. (1945), Pioneer Settlement in the Asiatic Tropics, New Haven: Yale
University Press.
Ravenstein, E. (1885) The Laws of Migration, Journal of the royal Statistical
Society, 48, pp. 167-235.
Ravenstein, E. (1889) The Laws of Migration: Second Paper, Journal of the Royal
Statistical Society, 52, pp. 241-305.
Tirtosudarmo, R. (2009), Mobility and Human Development in Indonesia, UNDP
Human Development Research Paper 2009/19, United Nations, New York.
Van der Wijst, T. (1985), Transmigration in Indonesia: An Evaluation of a
Population Redistribution Policy, Population Research and Policy Review, 4, pp. 1-
30.
World Bank (1988) Indonesia: The Transmigration Program in Perspective,
Washington DC.
Zipf, G. (1946) The P1P2/D hypothesis: on the Intercity Movement of Persons,
American Sociological Review, 11, pp. 677-686.

23
Volkstelling 1930, Landsdrukkerij, Batavia.