internal dynamics of the ferroelectric (c n h studied...
TRANSCRIPT

3
Internal Dynamics of the Ferroelectric (C3N2H5)5Bi2Cl11
Studied by 1H NMR and IINS Methods
Krystyna Hołderna-Natkaniec1, Ryszard Jakubas2 and Ireneusz Natkaniec3,1
1Department of Physics Adam Mickiewicz University, Poznań, 2Faculty of Chemistry, University of Wroclaw, Wroclaw,
3Joint Institute for Nuclear Research, Dubna, 1,2Poland
3Russian Federation
1. Intoduction
Ferroelectric properties of materials of the general formula RaMbX(3b+a) (R-organic cation, M=Sb, Bi, X=Cl, Br, I) have been studied during the last twenty years (Gagor, 2011; Sobczyk, 1997; Piecha, 2005; Jakubas, 2005). The family of halogenobismuthates (III) and halogenoantimonates (III) is characterized by a rich diversity of the anionic forms. It has been shown that ferroelectricity is restricted to compounds characterized by two types of the anionic substructure: two-dimensional anionic layers (M2X93-)∝ and discrete bioctahedral units Bi2X115-. Especially, the latter type compounds evoke much interest because all connections crystallizing with the R5M2X11 composition, reported to date, were found to exhibit ferroelectric properties. Within this subclass there are known three imidazolium ferroelectrics which appeared to be isomorphous in their paraelectric phase. One of these compounds, namely imidazolium undecachlorodibismuthate III of chemical formula (C3N2H5)5Bi2Cl11 (abbreviated as ICB) undergoes the following sequence of phase transitions (Sobczyk, 1997; Piecha, 2005; Jakubas, 2005) :
36014 2 2 /KP n P n
−
⎯⎯⎯→ (I→II), 1661 12 / 2KP n P⎯⎯⎯→ (II→III).
Phase III exhibits the ferroelectric properties. The Bi2Cl11–5 anion consists of two octahedrons joined by their top ligands with the bridging chlorine atom Cl(5) placed at the inversion centre. In the paraelectric phase two of five cations are ordered. The remaining three cations (nonequivalent) are disordered being distributed over two positions (two –site model). In the ferroelectric phase these cations become more and more ordered with decreasing of temperature and below 100 K they are fully ordered. The aim of our study was to check if the distortion of the crystal structure taking place through the ferroelectric-paraelectric phase transition in [(C3N2H5)5Bi2Cl11] is accompanied by a change in a molecular dynamics of the imidazolium cation. The methods suitable for this purpose were the inelastic incoherent neutron scattering and 1H NMR.
www.intechopen.com

Ferroelectrics - Characterization and Modeling
42
In the inelastic incoherent neutron scattering (IINS) spectra the intensity of selected bands depends on the number of scattering centres, amplitude of vibrations of atoms and cross-section for neutron scattering. The cross-section for neutron scattering on protons σinc is 82 barn and brings a dominant effect, while σinc for C, N, Bi and Cl nuclei is 5.5, 11.5, 9.1, 21.8 barns, respectively. Therefore the vibration modes induced by motion of hydrogen atoms give intense bands in the IINS spectrum. Consequently, the IINS spectroscopy is a nice tool to observe dynamics of protons (Lovesey,1984; Dianoux, 2003). To discuss the internal dynamics of protons of imidazolium the 1H NMR study was undertaken. The analysis of 1H NMR absorption signal by the continuous wave method gives insight into the slow internal motions of frequencies of several kHz [Abragam,1961].
2. Experiment
Inelastic incoherent neutron scattering measurements (IINS) for (C3H5N2)5Bi2Cl11 were performed using the inverted geometry spectrometer NERA at the high flux pulsed reactor IBR-2, JINR in Dubna, Russia (flnp.jinr.ru/134; Natkaniec,1994). The upper limit of energy transfer in the spectra analysed was set at 1700 cm-1 (~211 meV), because according to the scattering low, the band intensity and the spectrometer resolving power decrease with increasing energy transfer (Lovesey, 1984). The IINS spectra were recorded at several temperatures on heating the sample in the range from 20 K to 300 K (ΔT = ±1 deg). They were detected by 15 crystalline detectors arranged to collect scattering at different angles from the range 20 - 160°, at every 10°, and recorded for the incident neutrons wavelengths ranging from 0.1 to 7Å. Final spectra were obtained by summation of those taken at different angles, normalization to the monitor count and subtraction of the background from sample holder and the cryostat. Then, the averaging over the whole Brillouin zone was performed. The density of states function Gcal(ν) was calculated according to the following formula for double differential scattering cross-section σ of neutrons on protons in the sample (Lovesey,1984):
( )( )2
2,
exp 2 ,σ( )
Ω E1-exp
2
pF
inc ppI
B
W Qkdb G
d d k h
k T
νυ
ν
−= ×
−
(1)
where Fk and Ik are the wave vectors of incident and scattered neutrons, respectively, binc - the incoherent scattering length, exp(-2Wp( , )Q υ ) is the Debye-Waller factor. The neutron momentum transfer vector F IQ k k= − scans many Brillouin zones in the sample studied. The effect of neutron scattering on protons was dominant (Lovesey,1984; Dianoux, 2003). The density functional theory calculations were performed for the following reference systems: isolated resonance hybrid of imidazole (Im), isolated imidazolium cation (Im)+ with the Becke-style hybrid B3LYP functional (Becke’s three-parameter exchange correlation functional in combination with the Lee-Yang-Parr functional) (Becke, 1988, 1992, 1993; Lee, 1988), while the calculations for a cluster (Im)+Cl- and BiCl3(IMD)3+ were performed with B3LYP functional with the LanL2Dz basis set [Zhanpelsov, 1998; Niclasc, 1995) both using the Gaussian’03 program (Frish, 2003). The output (without scaling) was used to calculate the IINS spectra with the programme a-Climax (Ramirez-Cuesta, 2004)
www.intechopen.com

Internal Dynamics of the Ferroelectric (C3N2H5)5Bi2Cl11 Studied by
1H NMR and IINS Methods
43
which was used for modelling of the neutron scattering function S(Q, ν) at a TOSCA spectrometer. The intensities in the spectrum of single phonon neutron scattering calculated by the a-CLIMAX are expressed as the δ function. Then, taking into regard the different geometry of TOSCA (www.isis.stfc.ac.uk) and NERA [flnp.jinr.ru/134; Natkaniec, 1993) spectrometers, the phonon densities of the state function Gcal(ν) were calculated at the Γ point approximation. To enable a comparison of the quantum chemical calculations with the experimental data, the δ function of the phonon density of states (frequency and intensity of the subsequent bands) was convoluted with the spectrometer resolving power using the program RESOL (Kazimirov, 2003). In the IINS vibrational spectra the optical selection rules are not valid and all transitions were observed. This property of the IINS spectra permits testing internal structure by the calculations of the normal modes in the low frequency vibrational spectra. The QC calculations were performed also by the semi-empirical PM3 method [Steward, 1989; 1991, 2004; Khavryutchenko, 1990) for the same systems. This method is reliable for organic chemistry and nitro-compounds. It is attractive for the computation of vibrational mode wavenumbers because of its low computational cost. The 1H NMR measurements were carried out on a powdered sample of ICB on a lab-made spectrometer operating in the double modulation system at a frequency of 22.6 MHz varying in the range up to 200 kHz, at permanent magnetic field (F19 NMR stabilization) in the temperature range from 140 to 380 K.
3. Results
Fig.1 presents the scattering intensity I(λ) versus incoming neutron wavelength in ICB at 20, 90, 140, 180 and 294 K. The spectrum recorded at 20 K, in the range of the incident neutron wavelengths from 0.5 to 1.3 Å, shows the bands assigned to internal vibrations well separated from the branch of lattice vibrations appearing in the range from 1.3 to 3.8 Å. The presence of the lattice vibration bands at 2.2, 2.6, 2.75, 3.34 Å suggests ordering of the crystal structure at low temperatures. On heating, above the phase transition at 166 K, the bands of Gexp(ν) spectra get broadened. The branch of the lattice vibrations is separated from the internal vibration modes up to room temperature. The intensity of the peak corresponding to the elastic neutron scattering occurring at the incident neutron wavelength of 4.5 Å decreases on heating the sample. No contribution of the quasi-elastic neutron scattering QENS to the IINS spectrum of ICB was observed within the FWMH of the elastic line of 5.6 cm-1, in the range from 20 to 294 K, so the frequencies of stochastic motions of protons were different than 10-12 Hz. The IINS spectra were converted into the amplitude-weighted spectrum of the phonon density of states, Gexp(ν), presented in Fig. 2. The phonon density of state spectra Gexp(ν) calculated in the single-phonon scattering approximation show bands of different widths at different temperatures. From the form of the low temperature lattice branch of the Gexp(ν) analysed at low energy transfer, one may conclude on the ordering or disordering of the structure. The Gexp(ν) spectrum of the crystal under study recorded at 20 K shows strong bands of normal internal vibrations at the energy transfer of 628, 765, 817, 877, 974 , 1115, 1204 cm-1. On heating this band gets broadened and its intensity decreases. The Gexp(ν) spectra taken at 140 K and 180 K show intensive bands at 635, 758, 810, 852, 928, 1027 cm-1 and 675, 795, 870, 912, 954, 1001, 1051, 1147 cm-1, respectively. The broadening of the bands significantly
www.intechopen.com

Ferroelectrics - Characterization and Modeling
44
increases above 90 K. At room temperature the spectrum gets smeared, but the energy gap between the branch of the lattice modes and that of internal vibrations is well seen.
Fig. 1. The scattering intensity of the IINS spectra of imidazolium undecachlorodibismuthate (III) versus incoming neutron wave lengths measured at different temperatures ( Holderna-Natkaniec, 2008).
The low frequency region of the experimental G(ν) (up to 30 cm-1) can be described by the square function of the energy transfer, as shown in Fig. 2a. This indicates the Debye-like behaviour of the G(ν) function and ordering of the system. At room temperature a linear character of the low frequency dependence G(ν) was observed (Fig.2b), the crystal structure of the compound under investigations is partially disordered (cationic sublayer).
www.intechopen.com

Internal Dynamics of the Ferroelectric (C3N2H5)5Bi2Cl11 Studied by
1H NMR and IINS Methods
45
(a) (b)
Fig. 2. Spectra of imidazolium undecachlorodibismuthate (III) converted on single phonon scattering approximation to the generalized density of vibrational states G(υ) (Holderna-Natkaniec, 2006). Low frequency region of generalized density of state at 20 K(fig.2a) and 294 K (fig.2b).
www.intechopen.com

Ferroelectrics - Characterization and Modeling
46
4. Discussion
Calculations of the vibrational spectra require the molecular structure and the force field constants to be known. In order to analyse the low-temperature spectrum of ICB the structures of isolated molecule of diamagnetic Im, (Im)+, Im+Cl- system and the connection of imidazolium cations with the halogenobismuthate(III) anion were optimised. The force field was determined as a derivative of the total energy of the molecule over the atoms’ displacements. Fig. 3 presents the structure of an isolated imidazolium cation and the notation assumed. Table 1 collects the bond lengths and angles between the bonds determined on the basis of X-ray diffraction at 150 K by S. Martinez-Carrera, (1966) and from the neutron diffraction data by B.M. Craven, R.K. McMullan, J.D. Bell, H.C. Freeman, (Craven et al., 1977) given at 150 K for imidazole (abbreviation Im) and for the sample of ICB studied at room temperature (Jakubas, 2005) together with the structure optimisation data (Holderna-Natkaniec,2006). On the basis of the X-ray and neutron diffraction data (Piecha et al., 2007; Zhang et al., 2005; Adams et al.,2008; Levasseur et.al., 1991; Zhang et al., 2005; Valle&Ettorare ,1997) it can be concluded that imidazolium cation actually does not have the mm2 symmetry. However, the five-membered ring of imidazole skeleton is planar, but the hydrogen atoms lay more than 0.16 Å out-of-plane of the heterocyclic ring system, while both nitrogen atoms are linked to hydrogen atoms. Similarly as the other heterocyclic ring systems, imidazole can be represented as a resonance hybrid.
Fig. 3. Skeleton of imidazole with the atom numbering system.
The quality of the agreement of the experimental data Xexper ( Jakubas, 2005; Craven,1977) with the values predicted by quantum mechanical calculations Xpredicted can be expressed by the root mean square deviation determined as:
( )
2expcalx x
RMSn
−=
. (2)
www.intechopen.com

Internal Dynamics of the Ferroelectric (C3N2H5)5Bi2Cl11 Studied by
1H NMR and IINS Methods
47
Only the structure of the ordered (Im) skeleton (Jakubas, 2005) was used for comparison with the other data collected in Table 1, as the hydrogen positions determined by X-Ray diffraction are charged with too much error because of low electron density clouds of hydrogen atom. The lowest RMS value for bond length and angles is 0.0011 Ǻ and 2.80o, respectively. Consequently, the B3LYP/LanL2Dz method leads to the geometric parameters of imidazole structure close to the experimental data.
Property /bond length
[A]
(Im)5Bi2Cl11 X-ray [RT]
(Jakubas, 2005)
(Im)o B3LYP/ 6-311G*
(Im)+ B3LYP/ 6-311G*
(Im)+ LanL2Dz
(Im+)3 BiCl6 LanL2Dz
N1-C2 1.269 1.241 1.256 1.258 1.2156 1.3493 1.2156 1.2156 1.2502 1.2158 C2-N3 1.216 1.265 1.276 1.333 1.2690 1.3263 1.2590 1.2690 1.2759 1.2650 N3-C4 1.352 1.365 1.329 1.368 1.3433 1.3777 1.3432 1.3432 1.3290 1.3432 C4-C5 1.241 1.328 1.298 1.238 1.2413 1.3580 1.2413 1.2412 1.2977 1.2412 C5-N1 1.343 1.374 1.338 1.354 1.3525 1.3690 1.3524 1.3524 1.3380 1.3526 N1-H N2-H
0.819 1.153
1.044
1.052
1.017
1.172
0.840 1.0715
1.0470 0.9999
1.0000 1.0000
1.000 1.000
1.000 1.000
1.000 1.000
C2-H 1.108 1.118 1.078 0.866 1.1091 1.0822 1.0900 1.091 1.090 1.0899 C4-H 1.033 1.020 1.119 0.851 1.0933 0.9583 1.0900 1.090 1.0899 1.0900 C5-H 1.003 0.946 0.957 1.046 1.0334 1.0307 1.009 1.0899 1.090 1.0900
Angles [deg]
C5 N1 C2 107.59 110.03 108.04 111.95 108.59 107.26 108.59 108.59 108.04 109.59
N1 C2 N3 109.41 106.31 110.00 103.05 109.50 111.26 109.40 109.40 110.99 109.40
C2 N3 C4 107.80 97.69 106.76 111.17 107.79 105.38 107.79 107.79 106.75 107.79
N3 C4 C5 106.64 100.36 107.37 104.74 106.55 109.77 106.53 106.53 107.87 106.54
C4 C5 N1 107.37 108.35 106.93 109.03 107.37 109.77 107.37 107.37 106.33 107.37
C5 N1 H 119.60 125.3 121.22 116.10 122.44 133.31 125.70 125.97 125.70 N1 C2 H 121.02 122.15 116.29 115.29 125.72 110.44 125.29 124.50 125.29 C5 C4 H 128.94 120.36 141.30 147.02 131.97 133.21 126.73 107.87 126.73 N1 C5 H 122.90 121.39 120.05 110.30 128.25 117.38 126.31 126.83 126.31
RMS (l) 0.0011 0.0067 0.0009 0.0011 0.0015 0.0015 RMS(∠) 2.75 6.44 2.84 2.85 2.84
Table 1. Comparison of observed and calculated geometry of imidazole. (in bold - the parameters of ordered structure).
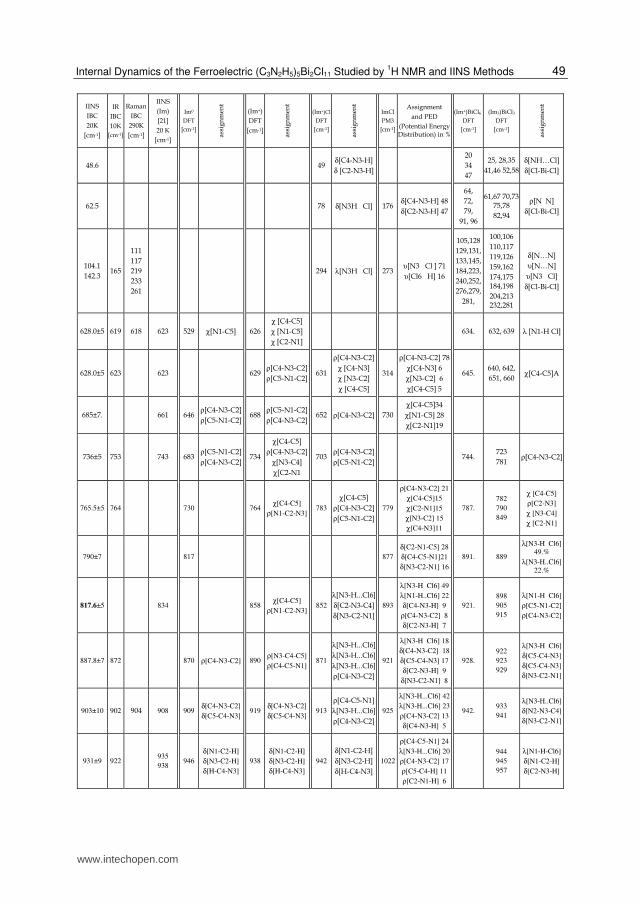
Fig.4 presents the low-temperature spectra of the phonon density of states Gexp(ν) for ICB compared with the spectra calculated by DFT and semi-empirical methods for the systems discussed, in the energy transfer range up to 1700 cm-1. Harmonic vibrational wavenumbers of normal modes computed for the reference systems and those corresponding to the experimental of ICB are listed in Table 2. It can be seen that the agreement is remarkable, showing that the DFT/LanL2Dz performed for a simple system built of imidazolium cation and BiCl6 anion has accurately modelled the system, while the region of internal modes is well described by DFT/B3LYP/6-311G** performed for isolated imidazolium cation. The frequencies are unscaled. As shown Fig.4, the internal vibration of anion mainly influence the phonon density of state spectrum in the lattice branch region (below 400 cm-1).
www.intechopen.com

Ferroelectrics - Characterization and Modeling
48
Fig. 4. Comparison of the low temperature phonon density of state spectra of imidazolium undecachlorodibismuthate (III) (C) with the ones calculated in the isolated molecule approximation by the Density Functional Theory method B3LYP with 6-311G** and LanL2Dz basis sets for the following systems: (Im) (A) , (Im)+ (B), (Im)3 BiCl6 (D), respectively (below energy transfer 800 cm-1 in Holderna-Natkaniec, 2008).
www.intechopen.com
Internal Dynamics of the Ferroelectric (C3N2H5)5Bi2Cl11 Studied by
1H NMR and IINS Methods
49
IINS IBC 20K
[cm-1]
IR IBC 10K
[cm-1]
Raman IBC
290K [cm-1]
IINS (Im) [21] 20 K
[cm-1]
Im0
DFT[cm-1]
assi
gnm
ent
(Im+)DFT
[cm-1]
assi
gnm
ent
(Im+)Cl
DFT [cm-1]
assi
gnm
ent
ImClPM3
[cm-1]
Assignment and PED
(Potential Energy Distribution) in %
(Im+)BiCl6
DFT [cm-1]
(Im3)BiCl3 DFT
[cm-1]
assi
gnm
ent
48.6 49 δ[C4-N3-H]δ [C2-N3-H]
20 34 47
25, 28,35 41,46 52,58
δ[NH…Cl] δ[Cl-Bi-Cl]
62.5 78 δ[N3H Cl] 176δ[C4-N3-H] 48δ[C2-N3-H] 47
64, 72, 79,
91, 96
61,67 70,73 75,78 82,94
ρ[N N] δ[Cl-Bi-Cl]
104.1 142.3
165
111 117 219 233 261
294 λ[N3H Cl] 273υ[N3 Cl ] 71 υ[Cl6 H] 16
105,128129,131,133,145,184,223,240,252,276,279,
281,
100,106 110,117 119,126 159,162 174,175 184,198 204,213 232,281
δ[N…N] υ[N…N] υ[N3 Cl] δ[Cl-Bi-Cl]
628.0±5 619 618 623 529 χ[N1-C5] 626χ [C4-C5] χ [N1-C5] χ [C2-N1]
634. 632, 639 λ [N1-H Cl]
628.0±5 623 623 629ρ[C4-N3-C2]ρ[C5-N1-C2]
631
ρ[C4-N3-C2]χ [C4-N3] χ [N3-C2] χ [C4-C5]
314
ρ[C4-N3-C2] 78χ[C4-N3] 6 χ[N3-C2] 6 χ[C4-C5] 5
645. 640, 642, 651, 660
χ[C4-C5]A
685±7. 661 646ρ[C4-N3-C2]ρ[C5-N1-C2]
688ρ[C5-N1-C2]ρ[C4-N3-C2]
652 ρ[C4-N3-C2] 730χ[C4-C5]34 χ[N1-C5] 28 χ[C2-N1]19
736±5 753 743 683ρ[C5-N1-C2]ρ[C4-N3-C2]
734
χ[C4-C5] ρ[C4-N3-C2]
χ[N3-C4] χ[C2-N1
703 ρ[C4-N3-C2]ρ[C5-N1-C2]
744. 723 781
ρ[C4-N3-C2]
765.5±5 764 730 764 χ[C4-C5]
ρ[N1-C2-N3]783
χ[C4-C5] ρ[C4-N3-C2]ρ[C5-N1-C2]
779
ρ[C4-N3-C2] 21
χ[C4-C5]15
χ[C2-N1]15
χ[N3-C2] 15
χ[C4-N3]11
787.
782
790
849
χ [C4-C5]
ρ[C2-N3]
χ [N3-C4]
χ [C2-N1]
790±7 817 877
δ[C2-N1-C5] 28
δ[C4-C5-N1]21
δ[N3-C2-N1] 16
891. 889
λ[N3-H Cl6]
49.%
λ[N3-H..Cl6]
22.%
817.6±5 834 858 χ[C4-C5]
ρ[N1-C2-N3]852
λ[N3-H...Cl6]δ[C2-N3-C4]δ[N3-C2-N1]
893
λ[N3-H Cl6] 49
λ[N1-H..Cl6] 22
δ[C4-N3-H] 9
ρ[C4-N3-C2] 8
δ[C2-N3-H] 7
921.
898
905
915
λ[N1-H Cl6]
ρ[C5-N1-C2]
ρ[C4-N3-C2]
887.8±7 872 870 ρ[C4-N3-C2] 890 ρ[N3-C4-C5]
ρ[C4-C5-N1]871
λ[N3-H...Cl6]λ[N3-H...Cl6]λ[N3-H...Cl6]ρ[C4-N3-C2]
921
λ[N3-H Cl6] 18
δ[C4-N3-C2] 18
δ[C5-C4-N3] 17
δ[C2-N3-H] 9
δ[N3-C2-N1] 8
928.
922
923
929
λ[N3-H Cl6]
δ[C5-C4-N3]
δ[C5-C4-N3]
δ[N3-C2-N1]
903±10 902 904 908 909 δ[C4-N3-C2]
δ[C5-C4-N3]919
δ[C4-N3-C2]
δ[C5-C4-N3]913
ρ[C4-C5-N1]λ[N3-H...Cl6]ρ[C4-N3-C2]
925
λ[N3-H...Cl6] 42
λ[N3-H...Cl6] 23
ρ[C4-N3-C2] 13
δ[C4-N3-H] 5
942. 933
941
λ[N3-H..Cl6]
δ[N2-N3-C4]
δ[N3-C2-N1]
931±9 922 935
938 946
δ[N1-C2-H]
δ[N3-C2-H]
δ[H-C4-N3]
938
δ[N1-C2-H]
δ[N3-C2-H]
δ[H-C4-N3]
942
δ[N1-C2-H]δ[N3-C2-H]δ[H-C4-N3]
1022
ρ[C4-C5-N1] 24
λ[N3-H...Cl6] 20
ρ[C4-N3-C2] 17
ρ[C5-C4-H] 11
ρ[C2-N1-H] 6
944
945
957
λ[N1-H-Cl6]
δ[N1-C2-H]
δ[C2-N3-H]
www.intechopen.com

Ferroelectrics - Characterization and Modeling
50
IINS IBC 20K
[cm-1]
IR IBC 10K
[cm-1]
Raman IBC
290K [cm-1]
IINS (Im) [21] 20 K
[cm-1]
Im0
DFT[cm-1]
assi
gnm
ent
(Im+)DFT
[cm-1]
assi
gnm
ent
(Im+)Cl
DFT [cm-1]
assi
gnm
ent
ImClPM3
[cm-1]
Assignment and PED
(Potential Energy Distribution) in %
(Im+)BiCl6
DFT [cm-1]
(Im3)BiCl3 DFT
[cm-1]
assi
gnm
ent
974.2±17 961 1062
δ[N1-C2-H]
δ[N3-C2-H]
δ[H-C4-N3]
δ[C5-C4-H]
1038
λ[N3-H...Cl6] 20
δ[N1-C2-H]- 22
δ[N3-C2-H] 21
δ[H-C4-N3] 16
δ[C5-C4-H] 13
998
986
999
1032
λ[N3-H..Cl6]
ρ[C2-N3-H]
ρ[N3-C4-H]
1059±17 1039 1084ρ[C2-N3-H]
ρ[N3-C4-H] 1075
δ[C5-C4-H] 23
δ[H-C4-N3] 23
δ[C4-C5-H] 14
δ[N1-C5-H] 13
1065±17
1043
1046
1049
1084
1041
1087 1061 1074
ρ[C2-N3-H]
ρ[N3-C4-H] 1070
δ[C4-N3-C2]
δ[C5-C4-N3] 1108
δ[C5-C4-H]
ρ[H-C4-N3] 1089
ρ[C2-N1-H] 51
ρ[C5-C4-H] 11
ρ[C2-N1] 8
ρ[N1-C5] 7
1069
1041
1066
1074
ρ[N3-C2-N1]
δ[C4-C5-H]
δ[N1-C5-H]
1115±17 1089
1109 1108 1098 1092 1120
δ[C5-C4-H]
δ[H-C4-N3]
δ[C4-C5-H]
1137 ρ[C5-C4-H] 1116
ρ[N3-C2-N1] 56
ρ[C4-C5-N1] 14
ρ[C4-N3-C2] 10
ρ[C5-C4-H] 6
1121
1078
1113
1119
δ[N1-C2-H
δ[C2-N3-H]
1156
1161
1189
1171
1190 1141 1145
δ[H-N1-C4]
δH-N1-C2]
δ[H-N3-C2]
δ[H-N3-C4]
1134δ[C5-C4-H]
δ[H-C4-N3] 1169
δ[N1-C5-H]
δ[N1-C2-H]
δ[N3-C2-H]
1135
ρ[C5-C4-H] 15
δ[N1-C5-H] 12
δ[N1-C2-H]11
ρ[C4-C5-N1] 11
δ[N3-C2-H] 10
1146.
1121
1149
1150
δ[C2-N3-H]
δ[N1-C5-H]
1204±20 1186 1161δ[H-C-N]
δ[H-C-C] 1199.
δ[N1-C5-H]
δ[N3-C2-H]
δ[N1-C2-H]
1231δ[C-N3-H]
δ[N3-C-H] 1140
ρ[C5-C4-H] 34
ρ[N3-C2-N1] 14
ρ[C4-C5-N1] 10
δ[N1-C5-H] 7
δ[C4-C5-H] 6
1209.
1156
1207
1215
δ[N1-C5-H]
δ[N1-C2-H]
δ[N3-C2-H]
1235±20 1302 1265 1281
δ[N1-C2-N3]
δ[N1-C2-H]
δ[N3-C2-H]
1221
δ[H-N1-C4]
δ[H-N1-C2]
δ[H-N3-C2]
δ [H-N3-C4]
1333.
δ[N1-C5-H]
δ[C2-N3-H...Cl]
1246δ[C4-C5-N1] 3
δ[C2-N1-H] 31 1250.
1234
1236
1249
1270
δ[C4-C5-N1]
δ[C2-N1-H]
1306 1363δ[C4=C5-H]
υ [C4-N3] 1343
δ[H-C-N]
δ[H-C-C] 1397.
δ[C2-N3-H...Cl] 1369
υ [C4-N3] 32
υ [C5-N1] 28 1354
1347
1357
1357
δ[N1-C5-H]
δ[N3-C4-H]
1438 1434
υ [N1-C5]
υ [N1-C2]
υ [N3-C2]
1471
δ[N1-C2-H]
δ[N3-C2-H]
υ [N1-C5]
υ [C4-N3]
1435υ [N1-C2]
υ [N3-C2] 1519
υ [N1-C2] 41
υ [N3-C2]9
δ[C4=C5-H] 7
1445
1449
1474
υ [N1-C5]
υ [N1-C2]
1460 υ [N1-C5] 1562
υ [N1-C2] 30
υ [N3-C4] 27
δ[N3-C2-H] 20
1475
1480
1484
υ [N1-C5]
1527
1576 1500
υ [C4=C5]
υ [N1-C2] 1560
υ [N1-C2]
υ [N3-C2] 1523
υ [N1-C2]
υ [N3-C2] 1632
υ [N3-C2] 49
υ [C4=C5] 18
1554
1556
1557
υ [N1-C2]
1581 1579 1558 υ [C4=C5] 1629 υ [C4=C5] 1593 υ [C4=C5] 1694υ [C4=C5] 51
υ [N3-C2] 16
1597
1614
1624
υ [C4=C5]
Used notation : χ− torsional out-of-plane, ρ out-of plane, δ deformational –in-plane, ν -stretching
Table 2. The frequencies and assignment of the observed bands of normal modes calculated for different clusters, modeling interactions in ICB
www.intechopen.com

Internal Dynamics of the Ferroelectric (C3N2H5)5Bi2Cl11 Studied by
1H NMR and IINS Methods
51
The normal modes of diamagnetic imidazole were calculated in the isolated molecule approximation by B3LYP/6-311G**. They were predicted at 529, 646, 683 and 730 cm-1 as torsional puckering and close to 800 cm-1 are separated from deformational in-plane modes, as shown Fig.4A. For the isolated imidazolium cation (Im)+ they have been calculated by B3LYP/6-311G** at 626, 629.7, 688.0, 734 and 764 cm-1 (Fig.4B). The B3LYP/LanL2Dz calculations made for the Im+Cl- system predicted the lowest intra-molecular torsional out-of-plane modes assigned to ρ[C4-N3-C2], χ[C2-N3], χ[C3-N3] at 631, 652, 703 cm-1 and to ρ[C4-N3-C2], ρ[C5-N1-C2] at 765 and 811 cm-1, respectively (Table 2). As follows from the calculations performed for [(Im)3 BiCl6] by B3LYP/LanL3Dz, the torsional out-of-plane modes appear in the energy transfer region from 640.9 to 890.0 cm-1 (Fig.4D). According to PM3 results, they are at 730 and 779 cm-1. Also in the IINS spectrum of polycrystalline imidazolium recorded at 20 K [24] the bands assigned to the out-of-plane vibrations are at 623, 661, 743 cm-1. In the experimental neutron vibration spectra of ICB taken at 20 K the lowest intra-molecular modes appear at (628 ± 5) ( asymmetric in the low frequency part), (651 ± 5), (685 ± 5), (736 ± 5), (765 ± 5) and (817 ± 8) cm-1. Moreover, the FT IR spectra of ICB taken in KBr (Piecha et al., 2009) show two modes (at 619 and 623 cm-1 at 10 K, as split on cooling from modes recorded at 620 cm-1 at 166K), and next subsequently at 753 and 764, 782 cm-1. The calculated and experimental frequencies are close, then the influence of external interactions on these modes is rather weak. The other bands observed in the experimental spectra are at (888 ± 8) and (931 ± 10), (974 ± 10), (1059 ± 17) cm-1. Also the low temperature G(ν) spectra of polycrystalline imidazole (Loeffen, et al.,1995) show bands at 909, 935, 961, 1061 cm-1 assigned to the deformational in-plane modes predicted for the isolated diamagnetic molecule (Im) by B3LYP/6-311G** methods to be at 870, 909, 946, 1074 cm-1, while for the cation of imidazole (Im)+ the B3LYP/6-311G** calculations give their positions at 890, 919, 938, 1071 cm-1. These modes can be assigned mainly to the deformational in-plane δ[C-N1-C], δ[C-N2-H]. According to the B3LYP/LanL2Dz calculations for the Im+Cl- system, they are predicted at 871, 913, 942, 1062 cm-1, while the PM3 calculations give their positions at 893, 921, 925, 1038 cm-1. The calculations performed for (Im)3BiCl5 by the B3LYP/LanL2Dz method predicted the positions of the deformational in-plane modes in the region from 905 to 1032 cm-1. The observed evolution in this part of the Gexp(ν) spectra ( 887, 974) cm-1 may be assigned to the dynamics of hydrogen bond. In the Gexp(ν) spectra taken of the compound under study in the ferroelectric phase, the above mentioned bands appear at nearly the same energy transfer values; their intensity is reduced because of thermal motions. The Gexp(ν) spectrum recorded in paraelectric state, at 180 K, shows bands at 632, 816 and 862 cm-1 (Fig. 2) which may be assigned to normal modes of almost free (Im) group in the structure of the compound studied. The calculated phonon density of states spectrum Gcal(ν) of diamagnetic imidazolium for the structure under optimisation, determined at 150 K by the neutron elastic scattering method (Craven et al., 1977), gives the bands assigned to normal modes at 646, 816, 870 cm-1. Hence, one may conclude that in the paraelectric phase the (Im) groups are almost free in the crystal structure of the compound studied.
4.2 H…B interaction In the crystal structure of ICB the N-H…Cl interactions are involved. Fig.5 presents schematically the shorter hydrogen bridge bond system lying nearly along the (010) axis. The distances between H…Cl atoms of the N-H…Cl bridge, forming the zigzag chain, are 2.327, 2.648 Ǻ, respectively [Jakubas, et al., 2005]. These hydrogen bonds are weak.
www.intechopen.com

Ferroelectrics - Characterization and Modeling
52
Fig. 5. Systems of the shortest hydrogen bridge bonds N-H…Cl of the sample studied.
The characteristic hydrogen bond vibration modes for normal hydrogen bonds can be assigned subsequently as (Jeffrey, 1997) : - bending (λ), - stretching N…H (ν), both in the lattice branch as well as the out-of-plane bending, - out-of-plane (ρ) when hydrogen atom undergoes vibrations perpendicular to the axis of
the hydrogen bridge bond N-H…Cl, - deformational in-plane (δ), in the region corresponding to the internal modes. The stretching ν[N-H] is not manifested in the IINS spectrum, because of low resolution power of the spectrometers at energy transfer close to 3000 cm-1 (according to the scattering law the resolution of the IINS spectra decreases with increasing energy transfer) and therefore this mode is studied by IR spectroscopy. Fig. 6 presents schematically, using arrows, the characteristic displacement of atoms forming hydrogen bridge bond on the example of the simplest system Im+-Cl-. Analysis of the effect of hydrogen bond on the internal dynamics should also include the bending and stretching modes in the lattice branch and the stretching vibrations ν [N-H]; in agreement with the DFT calculations performed for the Im+Cl- and (Im)3BiCl6 systems, the bands predicted to appear at 49 and 294 cm-1 should be assigned to λ[NH...Cl] and ν[N-H...Cl] vibrations, respectively; the former bring information on the changes along the chain of hydrogen bonds. The DFT calculations predict the N-H…X out-of-plane bending modes ρ (hydrogen vibrations - perpendicular to the imidazolium plane) at 1084 cm-1. The N-H...Cl in-plane bend mode was predicted for simple system at 1231 cm-1. For (Im)3BiCl5 the modes are calculated by DFT method at lower frequencies (~ 1032, and 1213 cm-1), respectively. Both nitrogen atoms of imidazolium pentagon are involved in the hydrogen bridge N-H…X. Analysis of the phonon density of state spectra taken at different temperatures shows that in the paraelectric phase the band at (890 ± 10) cm-1 and (1204 ± 20), (1235 ± 20) cm-1 recorded in the ferroelectric state was weaker. In the crystals structure of ICB the hydrogen bridge bonds interactions between neighbouring imidazolium group also take place. The neutron vibrational spectra of solid imidazole (Loeffen, 1995) show the low frequency bands at 623, 661, 743 cm-1. The data are close to energy transfer values obtained for ICB at 20 K, as was given in Table 2.
www.intechopen.com

Internal Dynamics of the Ferroelectric (C3N2H5)5Bi2Cl11 Studied by
1H NMR and IINS Methods
53
Hydrogen bond bend, 49 cm-1 Hydrogen bond stretch, 294 cm-1
Hydrogen bond out of plane bend, 1084 cm-1 Hydrogen bond in plane bend, 1231 cm-1
N-H stretch, 3676 cm-1
Fig. 6. Hydrogen bond vibration modes for N-H…Cl.
4.3 1H NMR
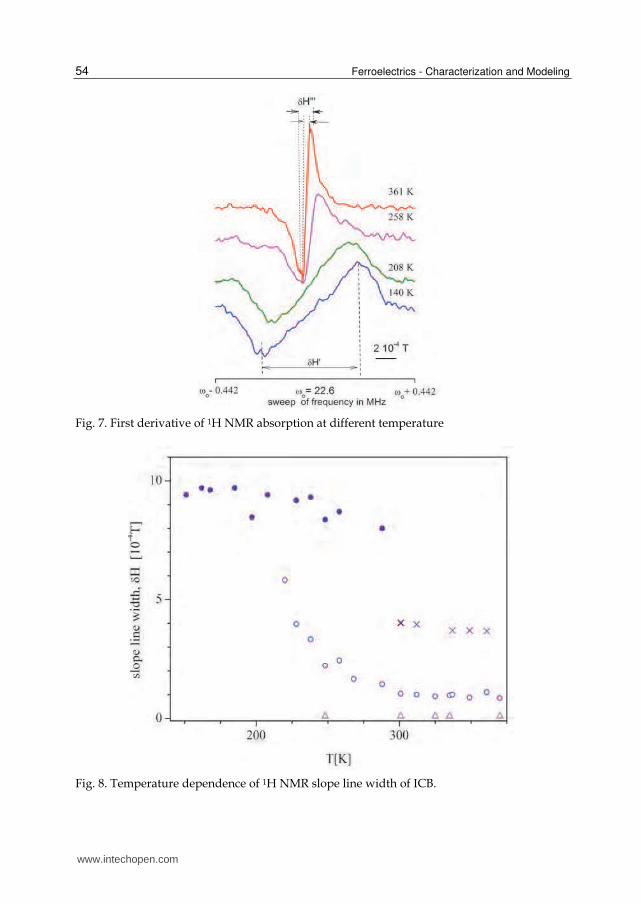
Internal dynamics of imidazolium cations was studied by different 1H NMR techniques (Abragam, 1983). The first derivative of the absorption line recorded by the continuous wave method at selected temperatures is presented in Fig.7. In the H NMR spectra at 220K one may distinguished two components of the line, characterised by the slope line widths dH’ and dH”. The line width of the broad component changes slightly and its intensity decreases on heating. Finally, the broad component of 1H NMR line (δH=9.5 * 10-4T) disappeared at about T=290 K. It means that above 290 K imidazolium cations undergo fast reorientation. In the temperature range (227 - 293) K the ratio of areas of particular components of the NMR spectrum, disregarding the narrowest line, is 2/3, which is in agreement with the X-Ray data (Jakubas et al, 2005). This suggests different mobilities of imidazolium cations of ICB at the room temperature. Three imidazolium cations seem to be more mobile than the other two. The three disordered imidazolium cations occupy positions at the centre of inversion and are distributed between two positions (1800 reorientation model) within the pentagonal ring. Above room temperature they are indistinguishable because all of them are orientationally disordered, which has also been indicated by the calorimetric studies (Przeslawski et al., 2007, Piecha et al.,2007).
www.intechopen.com
Ferroelectrics - Characterization and Modeling
54
Fig. 7. First derivative of 1H NMR absorption at different temperature
Fig. 8. Temperature dependence of 1H NMR slope line width of ICB.
www.intechopen.com

Internal Dynamics of the Ferroelectric (C3N2H5)5Bi2Cl11 Studied by
1H NMR and IINS Methods
55
The two narrow components of NMR spectrum with slope line widths of 3 10-4T and 0.1* 10-
4T were also observed on heating from 227 K to 375 K. As two of the five hydrogens of imidazolium cation were bonded to nitrogens ( denoted as N1 and N3 in Fig.3) they were involved also in hydrogen bridge bonds N-H…N network. These protons perform translational diffusion which explains the appearance of the component of the smallest slope line width (0.1 10-4 T). The component of the δH=3 10-4 T can be assigned to the dynamics of the other three hydrogen atoms of the imidazole ring. It means that the imidazolium cation does not undergo diffusion process in the bulk of the crystal studied. Fig. 9 presents the temperature dependence of the second moment M2 of the 1H NMR line. No change in M2 of 1H NMR lines was found below 166K. When temperature was increased above the phase transition point, the value of 1H M2 decreased from 8.5·10-8 T2 at 166 K approaching 1.2·10-8 T2 at room temperature. The second moment value for the rigid lattice was determined from the van Vleck formula (vanVleck,1948):
M2 = 23
5 Hγ 2 I(I+1) 6
,
1 N
H Hj kN r
−
− + 4
152
Sγ 2 S(S+1)
1N
6
,
N
H Sj k
r−
− , (3)
where I - the resonant spin, S - the nonresonant spins, γH – the gyromagnetic ratio of resonant spin, γS – the gyromagnetic ratio of nonresonant spins, rj,k – internuclear distance in whole sample, N - number of resonant spin in the molecule.
Fig. 9. Temperature dependence of second moment of 1H NMR line of imidazolium undecachlorodibismuthate (III) ( Holderna-Natkaniec, 2008).
www.intechopen.com

Ferroelectrics - Characterization and Modeling
56
The second moment of the 1H NMR line was calculated taking into account the homo- H-H and hetero-nucleus H-N interactions. Given the structural parameters from the diffraction study [Jakubas, et al., 2005; Martinez-Carrera, 1996; Craven et al., 1997; Piecha et at., 2007, 2009; Bujak & Zaleski ,2003;) and assuming that all N-H bond are not coplanar with the imidazole skeleton, we find M2rigid as 10.7·10-8 T2, as a sum of 5.3 and 3.7 (in 10-8 T2) from H-H, and H-N intramolecular interactions, respectively, whereas the inter-imidazole contribution to 1H M2 takes the value of 1.7·10-8 T2. When the inter-nucleus vector rj,k undergoes reorientation around the distinguished axis a, and γj,k is the angle between them, the second moment decreases from the rigid lattice value M2rigid according to the formula (Slichter,1980):
22
j,k2 2
3cos 1M M
2rigidrot
γ − = . (4)
The imidazolium is considered to perform reorientations around the following axes: - the axis in the plane of the pentagon and parallel to the N1-N3 direction (the axis of
minimum value of the moment of inertia), - the axis in the plane of the pentagon, perpendicular to the N1-N3 direction, passing
through C2 and the middle of the C4-C5 bond, - the axis perpendicular to the plane of the five-membered imidazole ring, for which the
moment of inertia is the highest. The proton jump in N-H…Cl bridges is the reason why M2 value changes to 10.55 10-8 T2. The effect of the anisotropic reorientations of imidazolium cation about the mentioned above two-fold symmetry axes on the M2 reduces its value to 9.5 and 8.5·10-8 T2, respectively. The reorientation around the nearly five-fold symmetry axis caused a reduction of M2 to 2.1·10-8 T2, which is close to the M2 value observed at room temperature. The diffusion process in the bulk of the crystal is a reason that second moment value decreased on heating above room temperature. The temperature dependence of the second moment of NMR line is described by the formula (Gutowsky, 1950):
(δH)2=B2+(C2 - B2) 2/π arctg (αγ δH /2πνc), (5)
where δH2 - the second moment of NMR line at temperature T (when δH ~ νc), B2, C2 - the NMR second moment determined for the high- and low-temperature plateau, for sqrt(C2)<< νc or sqrt(B2)>>νc, respectively, α - a constant of the order of 1, γ - the gyromagnetic factor of a resonant nucleus, νc - the frequency of intramolecular reorientations described by the Arrhenius dependence: νc = νo·exp(-Ea/RT). The activation energy of the imidazolium cation reorientation in ICB was close to 12.3 kJ/mol. The calculated values of the second moment indicate that below the ferroelectric phase transition the imidazolium cations are ordered, while above the transition temperature to the paraelectric phase the onset of the cation reorientation with a frequency of an order of several kHz takes place. In order to describe the form of the 1H NMR absorption line the ratio of its fourth and second moments was determined versus temperature, as shown in Fig.8c. On heating above 200 K a considerable increase in the M4/M2 ratio is observed, as the shape of the 1H NMR signal changes from a Gauss to Lorentz one. Moreover, on heating from 200 K (ICB is an insulator) to 300 K the electrical conductivity increases (Zdanowska-Fraczek et al., (2009), Munch et al.,(2001)). At 300 the imidazolium cation are disordered and the line is narrow.
www.intechopen.com

Internal Dynamics of the Ferroelectric (C3N2H5)5Bi2Cl11 Studied by
1H NMR and IINS Methods
57
Fig. 8. c. The ratio of fourth and second moment of the 1H NMR line at different temperatures (Zdanowska-Fraczek et al., (2009)).
The temperature dependence of the spin-lattice relaxation time of (Im)5Bi2Cl11 is shown in [22]. On heating from the ferroelectric to the paraelectric phase, the relaxation time continuously decreases from 176 s at 87 K to 2.4 s at 166 K. In the paraelectric phase the decrease in the relaxation time is reasonably smaller, and T1 is equal to 1.1 s at 345 K. Above the next phase transition temperature at 366 K, T1 increases, and at 389 K it is 6.7 s. Unfortunately, the local minimums of the function describing the relaxation rate versus reciprocal temperature were obtained at temperatures of both phase transitions. Therefore we can estimate only the activation energy for the pentagon (Im) cation reorientation when ωτc>>1, i.e. from the right branch of the experimental results of T1 versus reciprocal temperature in semi-logarithmic scale. It is close to 12 kJ/mol, as was obtained from the temperature dependence of the second moment of the 1H NMR line.
5. Conclusions
Results of IINS, 1H NMR and QC calculations obtained for the imidazolium undecachlorodibismuthate (III) studied in temperature range from 20 K to 290 K permit proposing the assignment of subsequent bands in their vibrational spectrum. As an attempt to explain the differences in vibrational spectra of imidazolium cation and the sample studied, especially in the range 760 - 1700 cm-1, the results were discussed versus the data of quantum chemical calculations performed for different reference systems to get insight into the vibrational spectrum of the molecule studied and also to conclude about the molecular structure. The importance of hydrogen bonds formation in the ferroelectric phase was shown.
www.intechopen.com

Ferroelectrics - Characterization and Modeling
58
Analysis of the temperature dependence of 1H NMR line width and the second moment of NMR line give a unique possibility to conclude about the onset of reorientation of imidazolium cations close to the phase transition at 166 K accompanied by proton diffusion at higher temperatures. On heating the changes in the 1H NMR and IINS spectra can be interpreted as the onset of proton jump in N-H...Cl hydrogen bond, reorientation of imidazole ring around the pseudo-five-fold symmetry axis and diffusion process in the crystal. The activation energy of this cation’s reorientation was estimated as 12.3 kJ/mol.
6. Acknowledgment
The QC calculation were performed under the grant at PSCC in Poznan.
7. References
Gągor, A.; Piecha, A.; Jakubas, R.; Miniewicz,A.; (2011). Crystal structure and characterization of a novel acentric imidazolium analog [C3N2H5+][Br-], Chemical Physics Letters, Vol.503, (2011), pp.134-138 (and references cited therein).
Sobczyk , L.; Jakubas ,R.; Zaleski , J.; (1997). Self-Assembly of Sb(III) and Bi(III) Halo-Coordinated Octahedra in Salts of Organic Cations. Structure, P roperties and Phase Transitions, Polish Journal of Chemistry, Vol. 71, (1997), pp. 265 -300, (and references cited therein).
Piecha , A.; Bator , G.; Jakubas, R.; (2005). Critical slowing down of low-frequency dielectric relaxation in ferroelectric (C3N2H5)5Bi2Cl11 , Journal of Physics: Condensed Matter. Vol.17, (2005), pp. L411-L417.
Jakubas, R.; Piecha, A.; Pietraszko, A.; Bator, G.; (2005). Structure and ferroelectric properties of [C3N2H5]5Bi2Cl11, Physical Review, Vol B 72, (2005), pp. 104107.1- 8. DOI: 10.1103/PhysRevB.72.104107.
Lovesey, S.W., Theory of Neutron Scattering from Condensed Matter, Clarendon Press, Oxford 1984. Oxford University Press 2006, ISBN 0-19-852029-8.
Dianoux, A.J.; Lander, E,; (Eds), Neutron data Booklet, ILL Neutrons for Sciences, Grenoble, 2003. ISBN:0-9704143-7-4.
Abragam, A.; The Principles of Nuclear Magnetism, Oxford University Press, Oxford, 1983. ISBN 13:9780198520146.ISBN10:10-19-852014-X
www.isis.stfc.ac.uk/instruments/tosca www.jinr.ru, http:/flnp.jinr.ru/134 Natkaniec, I.; Bragin, S. I.; Brankowski, J.; Mayer, J.;(1993). Inverted geometry spectrometer
NERA, Proceedings of the ICANS XII Meeting, Abington, 1993, vol. I, 1994, RAL Report, 94-025, I, pp.89-94. Rutherford Appleton Laboratory, Abingdon, Oxfordshire, UK, May 24-28, 1993.
Becke, D.A., (1988). Density-functional exchange-energy approximation with correct asymptotic behavior, Physical Review Vol. A 38, (1988), pp.3098-3100; (1992) Density-functional thermochemistry. II. The effect of the Perdew-Wang generalized-gradient correlation correction , Journal of Chemical Physics , Vol.97, No.12, (1988), pp. 9173-9177; (1993) Density-functional thermochemistry. III. The role of exact exchange, The Journal of Chemical Physics, Vol.98,No.7, (1993), pp. 5648-5652.
Lee, C.; Yang, W.; Parr, R. G.; (1988). Development of the Colle-Salvetti correlation-energy formula into a functional of the electron density, Physical Review, Vol. B 37, (1988), pp. 785-789.
www.intechopen.com

Internal Dynamics of the Ferroelectric (C3N2H5)5Bi2Cl11 Studied by
1H NMR and IINS Methods
59
Zhanpeisov, N.; Matsuoka, M.; Yamashite, H.; Anpo, M.; (1998). Cluster Quantum Chemical ab Initio Study on the Interaction of NO Molecules with Highly Dispersed Titanium Oxides Incorporated into Silicalite and Zeolites, (1998). Journal of Physical Chemistry, Vol.B102, (1998), pp. 6915-6920.
Niclasc, N.; Dolg, M.; Stoll, H.; Preuss, H.;; (1995). Ab initio energy-adjusted pseudopotentials for the noble gases Ne through Xe: Calculation of atomic dipole and quadrupole polarizabilities. Journal of Chemical Physics, Vol. 102, No. 22, (1995), pp. 8942-8953.
Gaussian 03, Revision C.02, Frisch, M. J.; Trucks, G. W.; Schlegel, H. B.; Scuseria, G. E.; Robb, M. A.; Cheeseman, J. R.; Montgomery, Jr., J. A.; Vreven, T.; Kudin, K. N.; Burant, J. C.; Millam, J. M.; Iyengar, S. S.; Tomasi, J.; Barone, V.; Mennucci, B.; Cossi, M.; Scalmani, G.; Rega, N.; Petersson, G. A.; Nakatsuji, H.; Hada, M.; Ehara, M.; Toyota, K.; Fukuda, R.; Hasegawa, J.; Ishida, M.; Nakajima, T.; Honda, Y.; Kitao, O.; Nakai, H.; Klene, M.; Li, X.; Knox, J. E.; Hratchian, H. P.; Cross, J. B.; Bakken, V.; Adamo, C.; Jaramillo, J.; Gomperts, R.; Stratmann, R. E.; Yazyev, O.; Austin, A. J.; Cammi, R.; Pomelli, C.; Ochterski, J. W.; Ayala, P. Y.; Morokuma, K.; Voth, G. A.; Salvador, P.; Dannenberg, J. J.; Zakrzewski, V. G.; Dapprich, S.; Daniels, A. D.; Strain, M. C.; Farkas, O.; Malick, D. K.; Rabuck, A. D.; Raghavachari, K.; Foresman, J. B.; Ortiz, J. V.; Cui, Q.; Baboul, A. G.; Clifford, S.; Cioslowski, J.; Stefanov, B. B.; Liu, G.; Liashenko, A.; Piskorz, P.; Komaromi, I.; Martin, R. L.; Fox, D. J.; Keith, T.; Al-Laham, M. A.; Peng, C. Y.; Nanayakkara, A.; Challacombe, M.; Gill, P. M. W.; Johnson, B.; Chen, W.; Wong, M. W.; Gonzalez, C.; and Pople, J. A.; Gaussian, Inc., Wallingford CT, 2004.
Ramirez-Cuesta,A.J.J; (2004) CLIMAX 4.0.1, the new version of the software for analyzing and interpreting INS spectra Computer Physics Communication. 157 (2004), 226-238.
http://www.ccdc.cam.ac.uk Kazimirov, W. J.; I. Natkaniec, I.; Programme for Calculation of the Resolution Function of
NERA-PR and KDSOG-M Inelastic Neutron Scattering Inverse Geometry Spectrometers, Preprint P14-2003-48 JINR, Dubna, 2003.
Stewart,J. J .P.; Optimization of parameters of semiempirical methods.I Methods; Journal of Computational chemistry. Vol.10, (1989), 209-220.; Optimization of parameters for semiempirical methods, II Applications , Journal of Computational chemistry. Vol.10, (1989) pp. 221-264; (1991), Optimization of parameters for semiempirical methods. III Extension of PM3 to Be, Mg, Zn, Ga, Ge, As, Se, Cd, In, Sn, Sb, Te, Hg, Tl, Pb, and Bi (pp. 320–341). Journal of Computational chemistry. 12, (1991), pp. 320-341., Optimization of parameters for semiempirical methods IV: extension of MNDO, AM1, and PM3 to more main group elements Journal of Molecular Modeling Vol. 10, (2004),pp. 155-164,DOI-10.1007/3 00894-004-0183-2..
Khavryutchenko, V. D.; COSPECO Complex Program for Vibrational Spectroscopy, Instytiute of Surface Chemistry Ukrainian Academy of Sciences, Kiev, 1990.
Martinez-Carrera, S.; (1996). The crystal structure of imidazole at -150°C, Acta Crystallographica. Vol.20 (1966) 783-789 . doi:10.1107/S0365110X66001853
Craven, B.M.; McMullan, R.K.; Bell, J.D.; Freeman, H.C.; The crystal structure of imidazole by neutron diffraction at 20°C and -150°C, Acta Crystallographica. Vol. B33 (1977) 2585-2589. doi:10.1107/S0567740877008954
Holderna-Natkaniec, K.; Natkaniec, I.; Jakubas, R.; Nowak, D.; Medycki, W.; Internal dynamics of (C3N2H5)5Bi2Cl11 studied by IINS, 1H NMR and QC methods, Journal of Molecular Structure. Vol. 891 (2008) 143-150.
www.intechopen.com

Ferroelectrics - Characterization and Modeling
60
Wang, Y-T.; Tang, G-M.; Wan, W-Z.; (2006). Naphthalene-2,7-diol-imidazole, Acta Crystallographica, Vol. E62, (2006), pp. o-3396-o3397.
Piecha, R. Jakubas, , A. Pietraszko; Baran, J.; (2007). Structural characterization and spectroscopic properties of imidazolium chlorobismuthate(III): [C3H5N2]6[Bi4Cl18], Journal of molecular structures , Vol. 844-845, (2007), pp. 132-139.
Bujak, M.; Zaleski, J.; (2003). Structure of chloroantomonates(III) with imidazolium cation (C3H5N2)SbCl4 and (C3H5N2)2SbCl5 Journal of Molecular structures, Vol. 647 (2003). pp.121-128.
Zhang H.; Fang,L.; Dronskowski,D.; Krauze,K,; Yuan,R.; (2005). Bis(imidazolium)hexachlorostrontate(IV), Acta Crystallographica, Vol.E61, (2005), m541-m542.
Valle, G.; Ettorore, R.; (1991). Bis(imidazolium)tetrachloropalladium, Zietschrift fur Kristallographie, Vol.212, (1997), pp. 166-168.
Levasseur, G.; Beauchanyp, A. L.;(1991). Structure of imidazolium hexachlorotantalate (V), Acta Crystallographica, Vol. C47, (1991), pp.547-550.
Adams, Ch.; Kurawa, M. A.; Lusi, M.; Orpen, A. G.; (2008). Solid State synthesis of coordination compounds from basic metal salts, Crystals Engineering Communications,Vol.10 (2008) pp.1790-1795
Piecha, A.; Kinzhybalo, K.; Slepokura, K.; Jakubas, R.; (2007). Structural characterization, thermal and electrical properties of imidazolium bromoantimonate (III)(C3H5N2)3Sb2Br9, Journal of Solid State Chemistry, Vol. 180, (2007), pp. 264-275.
Loeffen P. W.; Pettifer, R. F.; Fillaux, F.; Kearley, G.J.; (1995). Vibrational force field of solid imidazole from inelastic neutron scattering. Journal of Chemical Physics. Vol. 103, (1995) pp.8444-8455.
Piecha, A.; Jakubas, R.; Bator, G.; Baran, J. (2009). Infrared investigations of the order–disorder ferroelectric phase transitions in imidazolium halogenobismuthates (III) and halogenoantimonates (III): (C3N2H5)5Bi2Cl11, (C3N2H5)5Bi2Br11and (C3N2H5)5Sb2Br11, Vibrational spectroscopy Vol. 51.No. 2, (2009) ,pp.226-237.
Jeffrey, G.A.; An Introduction to Hydrogen Bonding, New York, Oxford, 1997. Przeslawski, J.; Kosturek, B.; Dacko, S.; Jakubas, R.; (2007). Thermal and optical properties of
the ferroelectric (C3N2H5)5Bi2Cl11 crystal , Solid State Communications.Vol.142, (2007), 713-717.
Slichter, C.P.; Principles of magnetic resonance, Springer Verlag, Berlin, Heidelberg, New York 1980.
Van Vleck, J. H.; The dipolar broadening of magnetic resonance lines in crystals, Physical. Review. Vol.74, (1948), pp.1168-1183.
Gutowsky, H. S.; Pake, G. E.; Nuclear Magnetism in Studies of Molecular Structure and Rotation in Solids: Ammonium Salts, Journal of Chemical Physics. Vol. 18, (1950), 162-163.
Zdanowska-Fraczek, M.; Holderna-Natkaniec, K.; Fraczek, Z. J.; Jakubas, R.; Molecular dynamics and electrical conductivity of (C3N2H5)5Bi2Cl11, Solid State Ionics , Vol. 180, No. 1, (2009), pp. 9-12.
Munch, W.; Kreuer K. D.; Silvestri, W.; Maier, J.; Seifert, G.;The diffusion mechanism of an excess proton in imidazole molecule chains: first results of an ab initio molecular dynamics study, Solid State Ionic, Vol.145, No.1-4, (2001) , pp. 437-443.
www.intechopen.com

Ferroelectrics - Characterization and ModelingEdited by Dr. Mickaël Lallart
ISBN 978-953-307-455-9Hard cover, 586 pagesPublisher InTechPublished online 23, August, 2011Published in print edition August, 2011
InTech EuropeUniversity Campus STeP Ri Slavka Krautzeka 83/A 51000 Rijeka, Croatia Phone: +385 (51) 770 447 Fax: +385 (51) 686 166www.intechopen.com
InTech ChinaUnit 405, Office Block, Hotel Equatorial Shanghai No.65, Yan An Road (West), Shanghai, 200040, China Phone: +86-21-62489820 Fax: +86-21-62489821
Ferroelectric materials have been and still are widely used in many applications, that have moved from sonartowards breakthrough technologies such as memories or optical devices. This book is a part of a four volumecollection (covering material aspects, physical effects, characterization and modeling, and applications) andfocuses on the characterization of ferroelectric materials, including structural, electrical and multiphysicaspects, as well as innovative techniques for modeling and predicting the performance of these devices usingphenomenological approaches and nonlinear methods. Hence, the aim of this book is to provide an up-to-datereview of recent scientific findings and recent advances in the field of ferroelectric system characterization andmodeling, allowing a deep understanding of ferroelectricity.
How to referenceIn order to correctly reference this scholarly work, feel free to copy and paste the following:
Krystyna Hołderna-Natkaniec, Ryszard Jakubas and Ireneusz Natkaniec (2011). Internal Dynamics of theFerroelectric (C3N2H5)5Bi2Cl11 Studied by 1H NMR and IINS Methods, Ferroelectrics - Characterization andModeling, Dr. Mickaël Lallart (Ed.), ISBN: 978-953-307-455-9, InTech, Available from:http://www.intechopen.com/books/ferroelectrics-characterization-and-modeling/internal-dynamics-of-the-ferroelectric-c3n2h5-5bi2cl11-studied-by-1h-nmr-and-iins-methods