internal curing of high- performance concrete for bridge decks · internal curing of...
TRANSCRIPT
INTERNAL CURING OF HIGH-PERFORMANCE CONCRETE
FOR BRIDGE DECKS
Final Report
SPR 711

INTERNAL CURING OF HIGH-PERFORMANCE CONCRETE FOR BRIDGE DECKS
Final Report
SPR 711
by
Jason H. Ideker, PhD Tyler Deboodt, MSCE
Tengfei Fu, MSCE, LEED GA
for
Oregon Department of Transportation Research Section
200 Hawthorne Ave. SE, Suite B-240 SalemOR97301-5192
and
Federal Highway Administration 400 Seventh Street, SW
Washington, DC20590-0003
March 2013

Technical Report Documentation Page
1. Report No.FHWA-OR-RD-13-06
2. Government Accession No. 3. Recipient’s Catalog No.
4. Title and Subtitle
Internal Curing of High-Performance Concrete for Bridge Decks
5. Report DateMarch 2013
6. Performing Organization Code
7. Author(s)Jason H. Ideker, PhDTyler Deboodt, MSCETengfei Fu, MSCE, LEED GA
8. Performing Organization Report N
9. Performing Organization Name and Address
Oregon State UniversitySchool of Civil and Construction Engineering101 Kearney HallCorvallis, OR 97331
10. Work Unit No. (TRAIS)
11. Contract or Grant No.
SPR 71112. Sponsoring Agency Name and Address
Oregon Department of TransportationResearch Section and Federal Highway Administration 200 Hawthorne Ave. SE, Suite B-240 400 Seventh Street, SW Salem, OR97301-5192 Washington, DC20590-0003
13. Type of Report and PeriodCovered
Final Report
14. Sponsoring Agency Code
15. Supplementary Notes
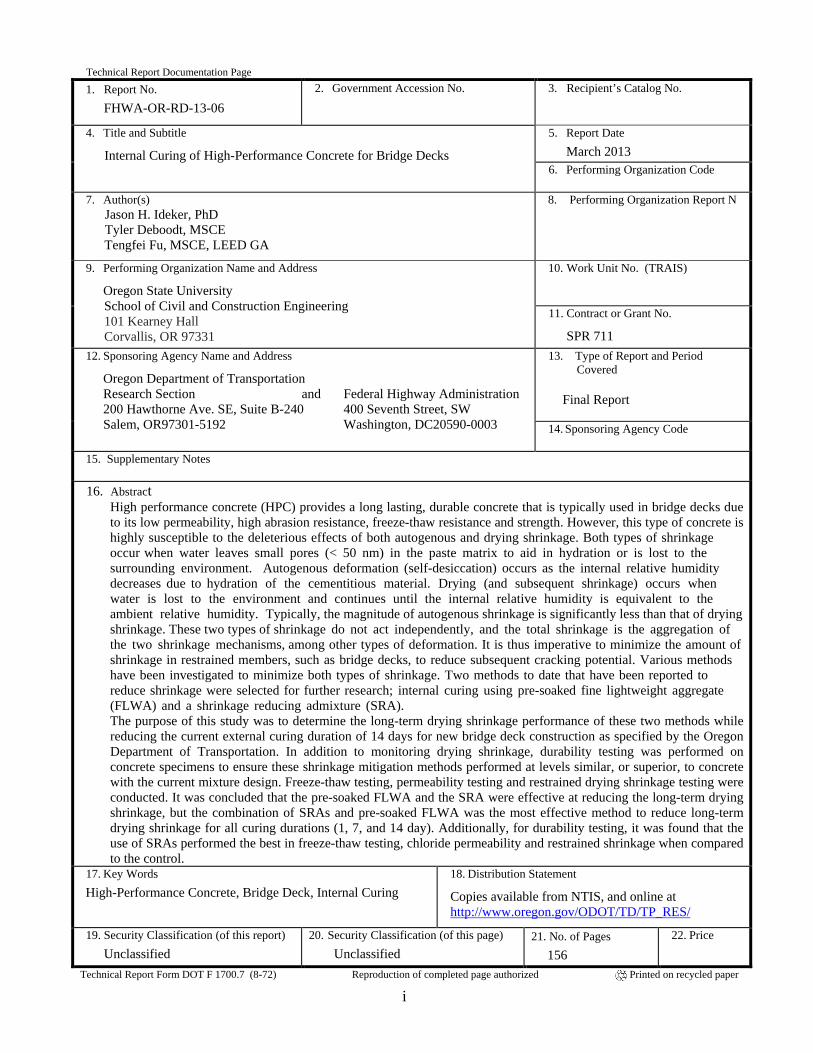
16. AbstractHigh performance concrete (HPC) provides a long lasting, durable concrete that is typically used in bridge decks due to its low permeability, high abrasion resistance, freeze-thaw resistance and strength. However, this type of concrete is highly susceptible to the deleterious effects of both autogenous and drying shrinkage. Both types of shrinkage occur when water leaves small pores (< 50 nm) in the paste matrix to aid in hydration or is lost to the surrounding environment. Autogenous deformation (self-desiccation) occurs as the internal relative humidity decreases due to hydration of the cementitious material. Drying (and subsequent shrinkage) occurs when water is lost to the environment and continues until the internal relative humidity is equivalent to the ambient relative humidity. Typically, the magnitude of autogenous shrinkage is significantly less than that of drying shrinkage. These two types of shrinkage do not act independently, and the total shrinkage is the aggregation of the two shrinkage mechanisms, among other types of deformation. It is thus imperative to minimize the amount of shrinkage in restrained members, such as bridge decks, to reduce subsequent cracking potential. Various methods have been investigated to minimize both types of shrinkage. Two methods to date that have been reported to reduce shrinkage were selected for further research; internal curing using pre-soaked fine lightweight aggregate (FLWA) and a shrinkage reducing admixture (SRA).The purpose of this study was to determine the long-term drying shrinkage performance of these two methods while reducing the current external curing duration of 14 days for new bridge deck construction as specified by the Oregon Department of Transportation. In addition to monitoring drying shrinkage, durability testing was performed on concrete specimens to ensure these shrinkage mitigation methods performed at levels similar, or superior, to concrete with the current mixture design. Freeze-thaw testing, permeability testing and restrained drying shrinkage testing were conducted. It was concluded that the pre-soaked FLWA and the SRA were effective at reducing the long-term drying shrinkage, but the combination of SRAs and pre-soaked FLWA was the most effective method to reduce long-term drying shrinkage for all curing durations (1, 7, and 14 day). Additionally, for durability testing, it was found that the use of SRAs performed the best in freeze-thaw testing, chloride permeability and restrained shrinkage when compared to the control.
17. Key WordsHigh-Performance Concrete, Bridge Deck, Internal Curing
18. Distribution Statement
Copies available from NTIS, and online at http://www.oregon.gov/ODOT/TD/TP_RES/
19. Security Classification (of this report)Unclassified
20. Security Classification (of this page)Unclassified
21. No. of Pages156
22. Price
Technical Report Form DOT F 1700.7 (8-72) Reproduction of completed page authorized Printed on recycled paper
i
SI* (MODERN METRIC) CONVERSION FACTORS APPROXIMATE CONVERSIONS TO SI UNITS APPROXIMATE CONVERSIONS FROM SI UNITS
Symbol When You Know Multiply By To Find Symbol Symbol When You Know Multiply By To Find Symbol
LENGTH LENGTH in inches 25.4 millimeters mm mm millimeters 0.039 inches in
ft feet 0.305 meters m m meters 3.28 feet ft yd yards 0.914 meters m m meters 1.09 yards yd mi miles 1.61 kilometers km km kilometers 0.621 miles mi
AREA AREA in2 square inches 645.2 millimeters squared mm2 mm2 millimeters squared 0.0016 square inches in2
ft2 square feet 0.093 meters squared m2 m2 meters squared 10.764 square feet ft2 yd2 square yards 0.836 meters squared m2 m2 meters squared 1.196 square yards yd2 ac acres 0.405 hectares ha ha hectares 2.47 acres ac mi2 square miles 2.59 kilometers squared km2 km2 kilometers squared 0.386 square miles mi2
VOLUME VOLUME floz fluid ounces 29.57 milliliters ml ml milliliters 0.034 fluid ounces floz gal gallons 3.785 liters L L liters 0.264 gallons gal ft3 cubic feet 0.028 meters cubed m3 m3 meters cubed 35.315 cubic feet ft3 yd3 cubic yards 0.765 meters cubed m3 m3 meters cubed 1.308 cubic yards yd3
NOTE: Volumes greater than 1000 L shall be shown in m3.
MASS MASS oz ounces 28.35 grams g g grams 0.035 ounces oz lb pounds 0.454 kilograms kg kg kilograms 2.205 pounds lb T short tons (2000 lb) 0.907 megagrams Mg Mg megagrams 1.102 short tons (2000 lb) T
TEMPERATURE (exact) TEMPERATURE (exact)
°F Fahrenheit (F-32)/1.8 Celsius °C °C Celsius 1.8C+32 Fahrenheit °F
*SI is the symbol for the International System of Measurement
ii
ACKNOWLEDGEMENTS
Special thanks to James Batti, Michael Dyson, and Manfred Dittrich for their help fabricating and setting up equipment for experimentation. Chuck Williams, Brian Gray, Deanna Amneus, David Rodriguez, Jose Banuelos, and Monica Morales, thank you for your help with preparation and monitoring of specimens.
DISCLAIMER
This document is disseminated under the sponsorship of the Oregon Department of Transportation and the United States Department of Transportation in the interest of information exchange. The State of Oregon and the United States Government assume no liability of its contents or use thereof.
The contents of this report reflect the view of the authors who are solely responsible for the facts and accuracy of the material presented. The contents do not necessarily reflect the official views of the Oregon Department of Transportation or the United States Department of Transportation.
The State of Oregon and the United States Government do not endorse products of manufacturers. Trademarks or manufacturers’ names appear herein only because they are considered essential to the object of this document.
This report does not constitute a standard, specification, or regulation.
iii

iv
TABLE OF CONTENTS
1.0 INTRODUCTION............................................................................................................. 1
2.0 SHRINKAGE MECHANISMS ....................................................................................... 3
2.1 CHEMICAL SHRINKAGE .................................................................................................... 3 2.2 AUTOGENOUS DEFORMATION .......................................................................................... 3 2.3 DRYING SHRINKAGE......................................................................................................... 5 2.4 SHRINKAGE MITIGATION TECHNIQUES ............................................................................. 5
2.4.1 Water to cementitious material ratio .......................................................................... 5 2.4.2 Curing ......................................................................................................................... 6 2.4.3 Admixtures .................................................................................................................. 6 2.4.4 Internal curing ............................................................................................................ 7 2.4.5 Type of cement .......................................................................................................... 11 2.4.6 Supplementary cementitious materials (SCMs) ........................................................ 12 2.4.7 Aggregate selection ................................................................................................... 13
3.0 DURABILITY ................................................................................................................. 15
3.1 FREEZE-THAW ................................................................................................................ 15 3.2 CHLORIDE INGRESS ........................................................................................................ 16
4.0 METHODS AND MATERIALS ................................................................................... 19
4.1 TESTING METHODS ......................................................................................................... 19 4.1.1 FLWA testing ............................................................................................................ 19 4.1.2 Autogenous deformation ........................................................................................... 19 4.1.3 Chemical shrinkage .................................................................................................. 26 4.1.4 Drying shrinkage – free shrinkage ........................................................................... 30 4.1.5 Drying shrinkage - restrained shrinkage .................................................................. 32 4.1.6 Chloride ingress ........................................................................................................ 34 4.1.7 Freeze-thaw............................................................................................................... 36 4.1.8 Mechanical properties .............................................................................................. 37
4.2 MATERIAL DESCRIPTIONS .............................................................................................. 37 4.2.1 Aggregates ................................................................................................................ 37 4.2.2 Cementitious materials ............................................................................................. 38 4.2.3 Chemical admixtures ................................................................................................ 39
4.3 CONCRETE MIXTURE DESIGN .......................................................................................... 39
5.0 RESULTS AND DISCUSSION ..................................................................................... 41
5.1 FLWA CLASSIFICATION ................................................................................................. 41
v
5.2 AUTOGENOUS DEFORMATION ........................................................................................ 43 5.2.1 Setting time................................................................................................................ 44 5.2.2 Autogenous deformation – Effect of SCMs ............................................................... 45 5.2.3 Autogenous deformation – Effect of SRA .................................................................. 46
5.3 CHEMICAL SHRINKAGE ................................................................................................... 47 5.3.1 Depercolation study .................................................................................................. 48 5.3.2 Long-term chemical shrinkage ................................................................................. 49
5.4 FRESH PROPERTIES ......................................................................................................... 50 5.5 MECHANICAL PROPERTIES ............................................................................................. 52
5.5.1 Compressive strength ................................................................................................ 52 5.5.2 Modulus of elasticity ................................................................................................. 53 5.5.3 Splitting tensile strength ........................................................................................... 54
5.6 DRYING SHRINKAGE ..................................................................................... 54 5.6.1 Pre-wetted clay FLWA .............................................................................................. 55 5.6.2 Pre-wetted shale and SRA ......................................................................................... 57 5.6.3 Shrinkage reducing admixtures ................................................................................ 59 5.6.4 Overall discussion of drying shrinkage .................................................................... 61
5.7 RESTRAINED SHRINKAGE ............................................................................................... 62 5.7.1 Time to cracking ....................................................................................................... 62 5.7.2 Stress rate and cracking potential ............................................................................ 68
5.8 RAPID CHLORIDE PERMEABILITY TEST ........................................................................... 70 5.9 FREEZE-THAW ................................................................................................................ 72
6.0 CONCLUSIONS ............................................................................................................. 75
6.1 DRYING SHRINKAGE ...................................................................................................... 75 6.2 DURABILITY ................................................................................................................... 76 6.3 RECOMMENDATIONS FOR HIGH PERFORMANCE CONCRETE BRIDGE DECKS BASED ON
THIS RESEARCH .......................................................................................................................... 77 6.4 FUTURE RESEARCH ........................................................................................................ 78
7.0 REFERENCES ................................................................................................................ 79
APPENDIX A – DRYING SHRINKAGE
APPENDIX B – MASS LOSS
APPENDIX C – TABULATED VALUES FOR DRYING SHRINKAGE
vi
LIST OF FIGURES
Figure 2.1: Typical length change characteristics of shrinkage compensating and portland cement concretes(Gruner and Plain 1993) ................................................................................................... 11
Figure 2.2: Variation of drying shrinkage of concrete with varying fly ash content (Kumar et al. 2007) ........... 12 Figure 3.1: SEM micrographs of mortars incorporating normal weight sand and pre-soaked FLWA (Bentz
2009) ................................................................................................................................................. 17 Figure 4.1: Polyurethane membrane (left) and latex membrane (right) filled with cement paste(Lura and
Jensen 2007) ..................................................................................................................................... 20 Figure 4.2: Experimental set-up for membrane method to test autogenous strain for cement paste (Fu 2011;
Lura and Jensen 2007) ..................................................................................................................... 21 Figure 4.3: Special corrugated plastic mold for autogenous deformation measurements(Lura 2003) ................ 22 Figure 4.4: Dilatometer with corrugated molds for measurements of linear and autogenous strain .................... 22 Figure 4.5: Comparison of rotated and non-rotated autogenous testing(Mohr and Hood 2010) ......................... 23 Figure 4.6: Larger corrugated tubes for testing autogenous strain of concrete(Bentz et al. 2009) ...................... 23 Figure 4.7: Comparison of autogenous shrinkage measured in sealed specimens using ASTM C157
(beginning at 24 h) and corrugated mold procedure (beginning immediately after mixing) for a w/cm = 0.30 mixture(Sant et al. 2006).............................................................................................. 24
Figure 4.8: JCI standard autogenous strain test set-up(Tazawa 1999) ................................................................ 25 Figure 4.9: Chemical shrinkage measurement methods(Bouasker et al. 2008) ................................................... 26 Figure 4.10: Automated chemical shrinkage test set-up(Ideker 2008) ................................................................ 27 Figure 4.11: Typical chemical shrinkage results for OPC mixtures at 20 oC(Fu 2011) ...................................... 28 Figure 4.12: Pressure method device to measure chemical shrinkage: (a) whole assembly; (b) main
chamber; (c) closure(Peethamparan et al. 2010) ............................................................................... 29 Figure 4.13: Comparison of CS results for pressure method and ASTM C1608(Peethamparan et al. 2010) ...... 30 Figure 4.14: Restrained ring mold(ASTM C1581 2004) ..................................................................................... 32 Figure 5.1: Absorption capacity of FLWAs ........................................................................................................ 41 Figure 5.2: Desorption testing of FLWA ............................................................................................................. 43 Figure 5.3: Vicat setting time results for OPC systems (w/cm = 0.37, 20 oC) .................................................... 44 Figure 5.4: Effect of SCMs on autogenous deformation (w/cm = 0.37 w/cm, 20 oC) ......................................... 45 Figure 5.5: Effect of SRAs on autogenous deformation (w/cm = 0.37, 20 oC) ................................................... 46 Figure 5.6: CS depercolation study(Fu et al. 2012) ............................................................................................. 48 Figure 5.7: CS development curve, HPC w/cm = 0.37 at 23 oC isothermal(Fu et al. 2012) ................................ 50 Figure 5.8: Drying shrinkage results, 1 day cure (clay FLWA mixtures)............................................................ 55 Figure 5.9: Drying shrinkage results, 7 day cure (clay FLWA mixtures)............................................................ 56 Figure 5.10: Drying shrinkage results, 14 day cure (clay FLWA mixtures) ........................................................ 56 Figure 5.11: Drying shrinkage results, 1 day cure (shale FLWA mixtures) ........................................................ 57 Figure 5.12: Drying shrinkage results, 7 day cure (shale FLWA mixtures) ........................................................ 58 Figure 5.13: Drying shrinkage results, 14 day cure (shale FLWA mixtures) ...................................................... 58 Figure 5.14: Drying shrinkage results, 1 day cure (SRA mixtures) ..................................................................... 60 Figure 5.15: Drying shrinkage results, 7 day cure (SRA mixtures) ..................................................................... 60 Figure 5.16: Drying shrinkage results, 14 day cure (SRA mixtures) ................................................................... 61 Figure 5.17: Restrained shrinkage, HPC control - 14 day cure (Test 1) .............................................................. 62 Figure 5.18: Restrained shrinkage, HPC control - 14 day cure (Test 2) .............................................................. 63 Figure 5.19: Restrained shrinkage, HPC w/ SRA - 14 day cure .......................................................................... 64 Figure 5.20: Restrained shrinkage, HPC w/ Shale-2 - 14 day cure ..................................................................... 65 Figure 5.21: Restrained shrinkage, HPC control - 3 day cure ............................................................................. 66 Figure 5.22: Restrained shrinkage, HPC w/ SRA - 3 day cure ............................................................................ 67 Figure 5.23: Restrained shrinkage, HPC w/ Shale-2 - 3 day cure ....................................................................... 68 Figure 5.24: RCPT results ................................................................................................................................... 70 Figure 5.25: Freeze-thaw testing, relative dynamic modulus .............................................................................. 72
vii
LIST OF TABLES Table 4.1: Chloride ion penetrability based on charge passed(ASTM Standard C1202 2010) .......................... 35 Table 4.2: Aggregate properties ......................................................................................................................... 38 Table 4.3: Oxide analysis of cementitious materials .......................................................................................... 38 Table 4.4: Concrete mixture designs .................................................................................................................. 39 Table 5.1: Autogenous strains of OPC systems (µm/m) at 50 h from initial contact ......................................... 47 Table 5.2: Chemical shrinkage (ml/g), HPC w/cm = 0.37 at 23 oC isothermal .................................................. 49 Table 5.3: Fresh concrete properties, mechanical property and drying shrinkage testing .................................. 51 Table 5.4: Fresh concrete properties, restrained shrinkage ................................................................................. 51 Table 5.5: Fresh concrete properties, RCPT ....................................................................................................... 51 Table 5.6: Fresh concrete properties, freeze-thaw .............................................................................................. 51 Table 5.7: Compressive strength of concrete cylinders ...................................................................................... 52 Table 5.8: Elastic modulus of concrete cylinders ............................................................................................... 53 Table 5.9: Splitting tensile strength of concrete cylinders .................................................................................. 54 Table 5.10:Summary of cracking potential of different concrete mixtures ......................................................... 69 Table 5.11:RCPT results, FLWA air study .......................................................................................................... 71 Table 5.12 Mass loss and relative dynamic modulus of elasticity after 300 cycles ............................................. 73
viii
1.0 INTRODUCTION
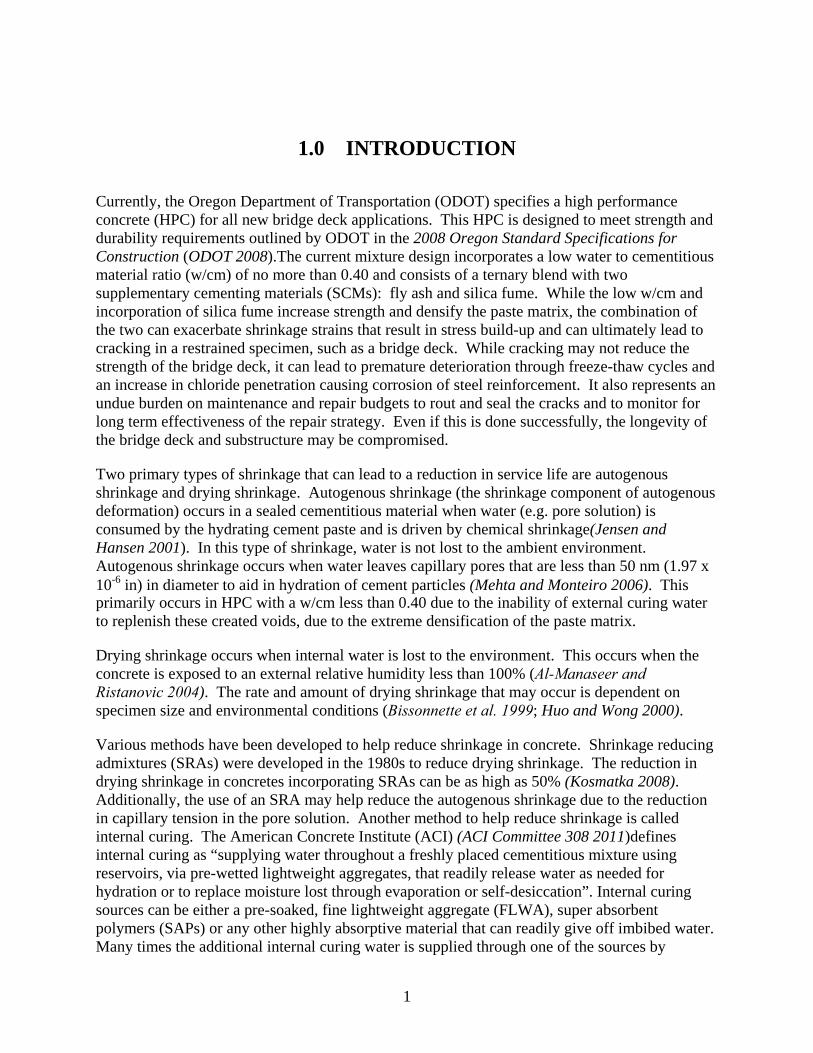
Currently, the Oregon Department of Transportation (ODOT) specifies a high performance concrete (HPC) for all new bridge deck applications. This HPC is designed to meet strength and durability requirements outlined by ODOT in the 2008 Oregon Standard Specifications for Construction (ODOT 2008).The current mixture design incorporates a low water to cementitious material ratio (w/cm) of no more than 0.40 and consists of a ternary blend with two supplementary cementing materials (SCMs): fly ash and silica fume. While the low w/cm and incorporation of silica fume increase strength and densify the paste matrix, the combination of the two can exacerbate shrinkage strains that result in stress build-up and can ultimately lead to cracking in a restrained specimen, such as a bridge deck. While cracking may not reduce the strength of the bridge deck, it can lead to premature deterioration through freeze-thaw cycles and an increase in chloride penetration causing corrosion of steel reinforcement. It also represents an undue burden on maintenance and repair budgets to rout and seal the cracks and to monitor for long term effectiveness of the repair strategy. Even if this is done successfully, the longevity of the bridge deck and substructure may be compromised.
Two primary types of shrinkage that can lead to a reduction in service life are autogenous shrinkage and drying shrinkage. Autogenous shrinkage (the shrinkage component of autogenous deformation) occurs in a sealed cementitious material when water (e.g. pore solution) is consumed by the hydrating cement paste and is driven by chemical shrinkage(Jensen and Hansen 2001). In this type of shrinkage, water is not lost to the ambient environment. Autogenous shrinkage occurs when water leaves capillary pores that are less than 50 nm (1.97 x 10⁻⁶ in) in diameter to aid in hydration of cement particles (Mehta and Monteiro 2006). This primarily occurs in HPC with a w/cm less than 0.40 due to the inability of external curing water to replenish these created voids, due to the extreme densification of the paste matrix.
Drying shrinkage occurs when internal water is lost to the environment. This occurs when the concrete is exposed to an external relative humidity less than 100% (Al-Manaseer and Ristanovic 2004). The rate and amount of drying shrinkage that may occur is dependent on specimen size and environmental conditions (Bissonnette et al. 1999; Huo and Wong 2000).
Various methods have been developed to help reduce shrinkage in concrete. Shrinkage reducing admixtures (SRAs) were developed in the 1980s to reduce drying shrinkage. The reduction in drying shrinkage in concretes incorporating SRAs can be as high as 50% (Kosmatka 2008). Additionally, the use of an SRA may help reduce the autogenous shrinkage due to the reduction in capillary tension in the pore solution. Another method to help reduce shrinkage is called internal curing. The American Concrete Institute (ACI) (ACI Committee 308 2011)defines internal curing as “supplying water throughout a freshly placed cementitious mixture using reservoirs, via pre-wetted lightweight aggregates, that readily release water as needed for hydration or to replace moisture lost through evaporation or self-desiccation”. Internal curing sources can be either a pre-soaked, fine lightweight aggregate (FLWA), super absorbent polymers (SAPs) or any other highly absorptive material that can readily give off imbibed water. Many times the additional internal curing water is supplied through one of the sources by
1
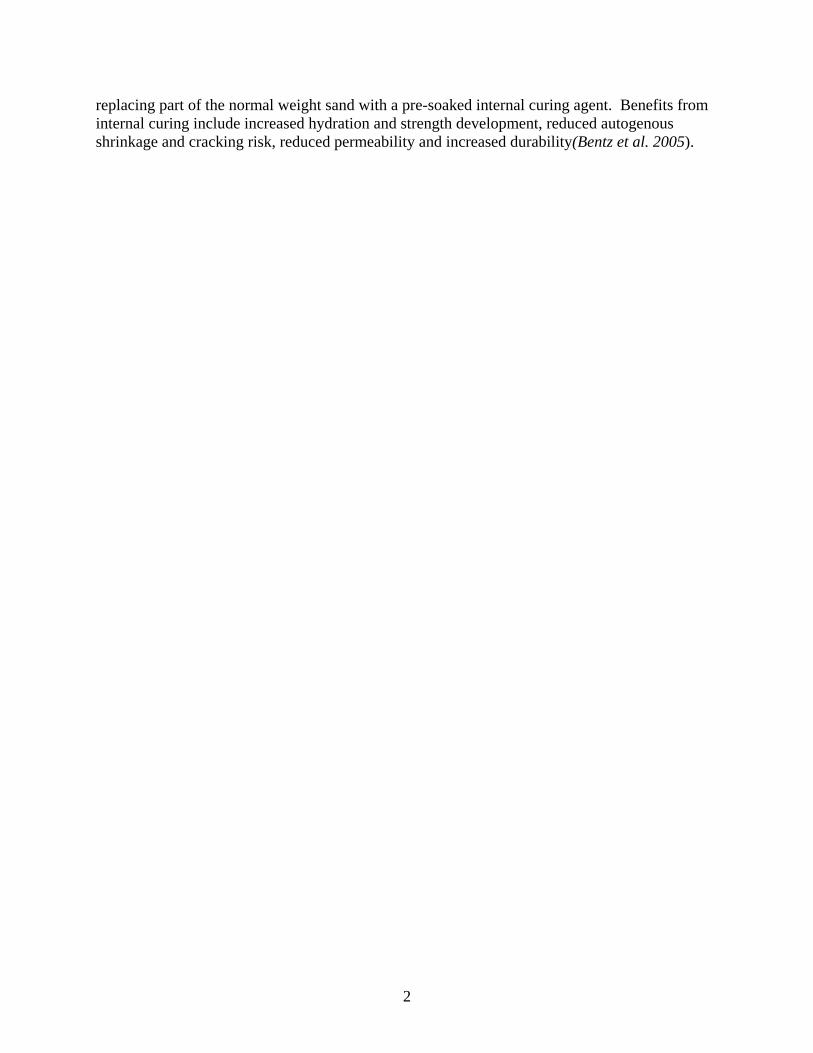
replacing part of the normal weight sand with a pre-soaked internal curing agent. Benefits from internal curing include increased hydration and strength development, reduced autogenous shrinkage and cracking risk, reduced permeability and increased durability(Bentz et al. 2005).
2
2.0 SHRINKAGE MECHANISMS
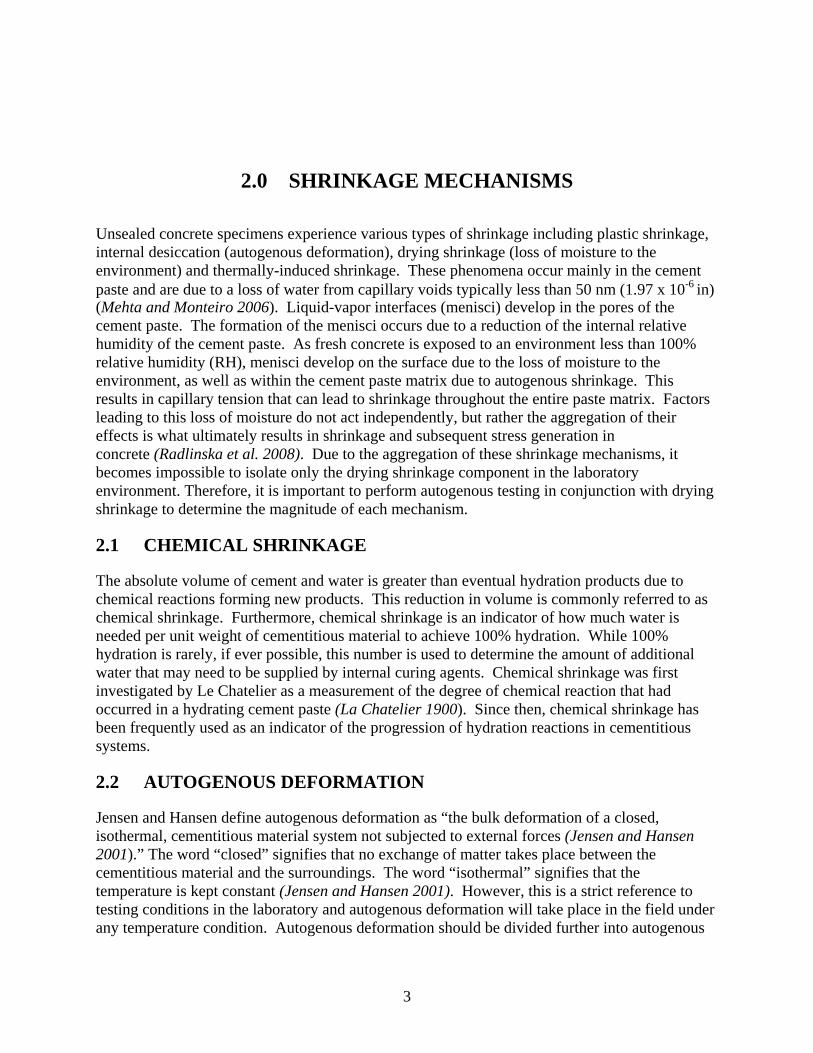
Unsealed concrete specimens experience various types of shrinkage including plastic shrinkage, internal desiccation (autogenous deformation), drying shrinkage (loss of moisture to the environment) and thermally-induced shrinkage. These phenomena occur mainly in the cement paste and are due to a loss of water from capillary voids typically less than 50 nm (1.97 x 10⁻⁶ in) (Mehta and Monteiro 2006). Liquid-vapor interfaces (menisci) develop in the pores of the cement paste. The formation of the menisci occurs due to a reduction of the internal relative humidity of the cement paste. As fresh concrete is exposed to an environment less than 100% relative humidity (RH), menisci develop on the surface due to the loss of moisture to the environment, as well as within the cement paste matrix due to autogenous shrinkage. This results in capillary tension that can lead to shrinkage throughout the entire paste matrix. Factors leading to this loss of moisture do not act independently, but rather the aggregation of their effects is what ultimately results in shrinkage and subsequent stress generation in concrete (Radlinska et al. 2008). Due to the aggregation of these shrinkage mechanisms, it becomes impossible to isolate only the drying shrinkage component in the laboratory environment. Therefore, it is important to perform autogenous testing in conjunction with drying shrinkage to determine the magnitude of each mechanism.
2.1 CHEMICAL SHRINKAGE
The absolute volume of cement and water is greater than eventual hydration products due to chemical reactions forming new products. This reduction in volume is commonly referred to as chemical shrinkage. Furthermore, chemical shrinkage is an indicator of how much water is needed per unit weight of cementitious material to achieve 100% hydration. While 100% hydration is rarely, if ever possible, this number is used to determine the amount of additional water that may need to be supplied by internal curing agents. Chemical shrinkage was first investigated by Le Chatelier as a measurement of the degree of chemical reaction that had occurred in a hydrating cement paste (La Chatelier 1900). Since then, chemical shrinkage has been frequently used as an indicator of the progression of hydration reactions in cementitious systems.
2.2 AUTOGENOUS DEFORMATION
Jensen and Hansen define autogenous deformation as “the bulk deformation of a closed, isothermal, cementitious material system not subjected to external forces (Jensen and Hansen 2001).” The word “closed” signifies that no exchange of matter takes place between the cementitious material and the surroundings. The word “isothermal” signifies that the temperature is kept constant (Jensen and Hansen 2001). However, this is a strict reference to testing conditions in the laboratory and autogenous deformation will take place in the field under any temperature condition. Autogenous deformation should be divided further into autogenous
3
shrinkage and autogenous expansion. The Japanese Concrete Institute (Tazawa 1999) defines autogenous shrinkage as:
“Autogenous shrinkage is the macroscopic volume reduction of cementitious materials when cement hydrates after initial setting. Autogenous shrinkage does not include volume change due to loss or ingress of substances, temperature variation, application of an external force and restraint (Tazawa 1999).”
Similarly, the autogenous expansion is defined as:
“Autogenous expansion is the macroscopic volume increase of cementitious materials when cement hydrates after initial setting. Autogenous expansion does not include volume change due to loss or ingress of substances, temperature variation, application of an external force and restraint (Tazawa 1999).”
Autogenous shrinkage is a phenomenon closely related to changes in internal RH. In ordinary portland cement concretes with high w/cm (>0.42) (Holt 2001), autogenous shrinkage is negligible when compared to drying shrinkage. While in HPC with low w/cm with the addition of silica fume, autogenous shrinkage can be significant enough to induce micro- or macro-cracking and may reduce the concrete quality (Lura 2003). While the mechanisms leading to autogenous shrinkage are not yet fully understood, it is generally agreed upon that a relationship exists between autogenous shrinkage and changes in relative humidity of capillary pores in the cement paste. This relationship can be explained by the difference in chemical shrinkage between cementitious materials in HPC. For instance, the chemical shrinkage of ordinary portland cement is typically around 0.07, which means a 7% mass of water per mass of cement is needed to complete the hydration process and maintain saturation of the capillary pores. While in an HPC system, the same coefficients for silica fume, slag and fly ash are 0.22, 0.18 and 0.10 to 0.16 (range for fly ash) (Bentz 2007). This means that for complete hydration in HPC, more water to compensate for chemical shrinkage is required. In HPC, as the internal RH decreases due to increasing water demand, the resulting capillary pressure arising from water leaving small capillaries can be high enough to cause these pores to collapse and/or to exert shrinkage stresses on the system, as a result macroscopic shrinkage may occur – termed autogenous shrinkage (Mehta and Monteiro 2006).
The critical factor controlling autogenous shrinkage is the supply of water. Simply increasing the w/cm is not an option as a low w/cm is what leads to high strength, low permeability and increased durability in HPC. As a result, several innovative shrinkage mitigation strategies have been developed to provide water from a source other than the original mixing water (e.g. internal water curing by FLWA or SAP)(Kovler and Jensen 2005), or to reduce the capillary tension by reducing the water surface tension through the incorporation of chemical admixtures such as SRAs (Kovler and Jensen 2005).
It was observed more than a century ago by Le Chatelier that if a cement paste hydrates in saturated conditions, it will expand (La Chatelier 1900). Recently, Le Chatelier’s experiment was reproduced with modern cements at the University of Sherbrooke where cracks were observed on the surface of flasks containing cement paste as a result of autogenous expansion (Durán-Herrera et al. 2008). One possible explanation given by Powers(Powers 1935) is that
4
the expansion is due to the fact that in a hardening paste cured in saturated conditions, no capillary pressure develops to oppose the expansion of the solid phases. Recent work by Mohr and Hood (Mohr and Hood 2010) observed autogenous expansion in pastes. It was determined that the expansion was caused by bleed water reabsorption in autogenous testing in the "corrugated tube method.” This test method is discussed later. However, the expansion in these pastes was eliminated by rotating the specimens during testing to eliminate early bleeding of the paste.
2.3 DRYING SHRINKAGE
According to Radlinska et al., drying shrinkage is the “shrinkage that is caused by the loss of water to the surrounding environment (i.e., external drying)(Radlinska et al. 2008).” This type of shrinkage occurs when hardened concrete is exposed to air that has less that 100% relative humidity(Al-Manaseer and Ristanovic 2004). Many factors affect the drying shrinkage of concrete that will occur until the internal RH of the cement paste reaches equilibrium with the atmospheric relative humidity(Radlinska et al. 2008). These factors include the type of cement, type of aggregate, aggregate size, w/cm, relative humidity, admixtures, duration of curing and the size of the concrete specimen(Huo and Wong 2000).
Drying shrinkage may continue for many years depending on the mass and shape of the concrete and can be detrimental to the concrete by creating unexpected cracks in restrained slabs and walls. Additionally, in structures, large stresses may form that can be detrimental(Kosmatka 2008; Nilson et al. 2004). Tests performed by Bissonnette et al.(Bissonnette et al. 1999) have shown that the rate of drying is much slower for a larger specimen (50 x 50 x 400 mm or 2 x 2 x 15.75 in) compared to a smaller specimen (4 x 8 x 32 mm or 0.16 x 0.32 x 1.25 in). Hygrometric equilibrium had not been reached on some of the larger specimens even after 500 d.
Methods to reduce the amount of drying shrinkage have been established. One method to reduce drying shrinkage is the use of fibers. Research by Chen and Chung(Chen and Chung 1996) determined that the amount of drying shrinkage could be reduced by up to 84% in concretes with a 0.5% addition (of cement weight) of carbon fibers, when compared to a similar mixture without fibers. Similar trends in the reduction of drying shrinkage were found in concrete incorporating steel fibers in research by Chern and Young(Chern and Young 1990). It was also concluded that the steel fibers were more effective at reducing drying shrinkage at later ages due to an improved interfacial bond between the fibers and the cement paste matrix. Additionally, with the advent of SRAs, it has been found that drying shrinkage in concrete can be reduced by as much as 50%(Bentz 2006; Kosmatka 2008; Shah et al. 1992). Furthermore, internal curing using pre-soaked FLWAs has been effective at reducing drying shrinkage in mortars up to 28 d of curing(Schlitter et al. 2010). A more detailed discussion on how SRAs and pre-soaked FLWA mitigate shrinkage is provided below in sections 2.4.3 and2.4.4.
2.4 SHRINKAGE MITIGATION TECHNIQUES
2.4.1 Water to cementitious material ratio
“The most important controllable factor affecting drying shrinkage is the amount of water per unit volume of concrete(Kosmatka 2008).” At a lower w/cm, there is less evaporation after
5
curing. Generally at a lower w/cm the elastic modulus of the material is also higher thereby resulting in better resistance to shrinkage forces. Therefore, there should be less drying shrinkage caused by a decrease in w/cm and thus permeability. The decrease in permeability is attributed to a denser cement paste matrix that develops in low w/cm concrete. Fresh concrete requirements can have an effect on drying shrinkage as well. The need for a high slump for workability, having high fresh concrete temperatures, high fine aggregate contents and/or using small maximum size coarse aggregate can increase the water requirements, resulting in an increase in drying shrinkage (Kosmatka 2008). It is estimated that the drying shrinkage is reduced by up to 30 microstrain per 5.9 kg/m3 (10 lb/yd3) of water removed from the mix design (Babaei and Fouladgar 1997). A lower w/cm ratio results in less capillary porosity, which helps minimize the drying shrinkage of a specimen (Kosmatka 2008).
2.4.2 Curing
High performance concrete has a greater potential for cracking at an early age if not properly cured, because of the combination of drying shrinkage, autogenous shrinkage and plastic shrinkage that are typically exacerbated in this type of concrete. Therefore, appropriate mitigation methods to reduce shrinkage in combination with careful curing practices should be used to minimize and control shrinkage (Huo and Wong 2000). The curing methods may be an external or internal source. The external curing should be prolonged long enough to eliminate evaporation during the curing process (Nilson et al. 2004). There are various methods to provide external curing for the concrete. However, with the development of HPC it may not always be practical to implement an adequate external wet cure due to time or densification of the cement paste matrix that prevents the ingress of external water to complete hydration (Bentz and Jensen 2004). Therefore, other options to reduce shrinkage or improve curing need to be explored for these types of mixtures. Some methods trap the moisture, i.e. curing compounds, sealers, and coatings, and delay the shrinkage. Fogging or wet burlap holds off shrinkage until the concrete has hardened. After hardening and the external curing source has been removed, the concrete will shrink when exposed to a relative humidity of less than 100% and have the potential for cracking caused by stress generation during shrinkage (Kosmatka 2008). While shrinkage will occur in all concrete mixtures, it does not necessarily result in cracking. Variables including the degree of restraint, stress development and strength development all are important to consider when assessing cracking potential. Once the tensile stress exceeds the tensile strength of the concrete, cracking will be imminent.
2.4.3 Admixtures
Shrinkage reducing admixtures (SRAs) have been shown to be successful in reducing both autogenous and drying shrinkage, as well as the potential for cracking due to the corresponding shrinkage. SRAs reduce the capillary tension by as much as 50% and likewise the corresponding tensile forces that occur in hardening concrete (Bentz 2006; Shah et al. 1992). Research performed by Bentz (Bentz 2006)analyzed the effects of SRAs on cement pastes with a w/cm of 0.35 when exposed to a drying environment of 23 °C (73 oF) and 50% relative humidity. Results indicated the addition of SRAs reduce drying shrinkage in cement paste specimens, when there is a potential for drying shrinkage. Bentz concludes SRAs are successful at reducing plastic shrinkage and autogenous deformation due to the reduction in capillary tension. Additionally, “the addition of an SRA should also significantly increase the pore solution viscosity, which
6

could potentially have beneficial implications for reducing the diffusion coefficients of deleterious ions (chloride, sulfate, etc.) in cement-based materials (Bentz 2006).”
Similarly, a reduction in autogenous shrinkage has also been shown. The amount of autogenous shrinkage is related to the stress in the capillaries. Therefore, a reduction in capillary tension will result in a reduction in shrinkage (Bentz and Jensen 2004). Research performed by Tazawa and Miyazawa (Tazawa and Miyazawa 1995) found that the reduction in autogenous shrinkage is related to the reduction in the surface tension of the pore solution. Concrete mixtures with SRA have exhibited a reduction in autogenous shrinkage when tested in a free-deformation frame (Slatnick et al. 2011).
While the use of SRAs is effective at reducing shrinkage, they have been shown to reduce strength(Bentz and Jensen 2004; Folliard and Berke 1997; Shah et al. 1992; Slatnick et al. 2011). Research performed by Rajabipour et al. has shown that the set time of cement paste incorporating SRA could result in a two hour delay. It was determined that the addition of SRAs decreases the alkalinity of the pore solution, and directly impacts the rate of hydration. This retardation in hydration adversely affects strength development. A delayed addition of the SRA, such as adding the SRA on site and not at the mixing plant, was found to reduce the set time delay (e.g. less of a negative impact). The reduction in delay was attributed to the dissolution of alkalis into the mixing water from the portland cement before the addition of the SRA(Rajabipour et al. 2008).
Some chemical admixtures do not have much effect on shrinkage. However, using an accelerator can actually increase shrinkage. This is caused by a rapid increase in the heat of hydration and can promote drying shrinkage. Air entrainment typically has little or no effect on drying shrinkage (Kosmatka 2008). However, some research has shown that the addition of superplasticizer in concrete mixtures can increase shrinkage even though the water content is less. Research performed by Atiş showed with the use of a superplasticizer could increase the concrete shrinkage by up to 50%. It was claimed by Atiş that the increase in shrinkage was attributed to the reduction in surface tension in the pore water (Atiş 2003). However, further research on SRAs has shown that a reduction in surface tension typically reduces the amount of shrinkage (Bentz 2006; Bentz and Jensen 2004; Shah et al. 1992).
2.4.4 Internal curing
Since the early 1990s,research has shown that lightweight aggregates (LWA) pre-soaked with water could provide internal water reservoirs to aid in curing that can help mitigate autogenous shrinkage in concretes incorporating silica fume, thereby reducing shrinkage-related stresses and the potential for early-age cracking (Hammer 1992). Momentum in the area of internal curing using saturated LWAs has increased since 2000 with increasing evidence of application of internal curing in field concretes (Friggle and Reeves 2008; Roberts 2004; Villarreal 2008).
Research by Bentz and co-workers has led to the development of an equation for predicting the amount of lightweight saturated fine aggregate needed to protect concrete from the potentially deleterious effects of autogenous shrinkage (Bentz et al. 2005; Bentz and Snyder 1999). The equation is as follows:
7
max* **
fLWA
LWA
C CSM
Sα
φ= Equation 1
Where:
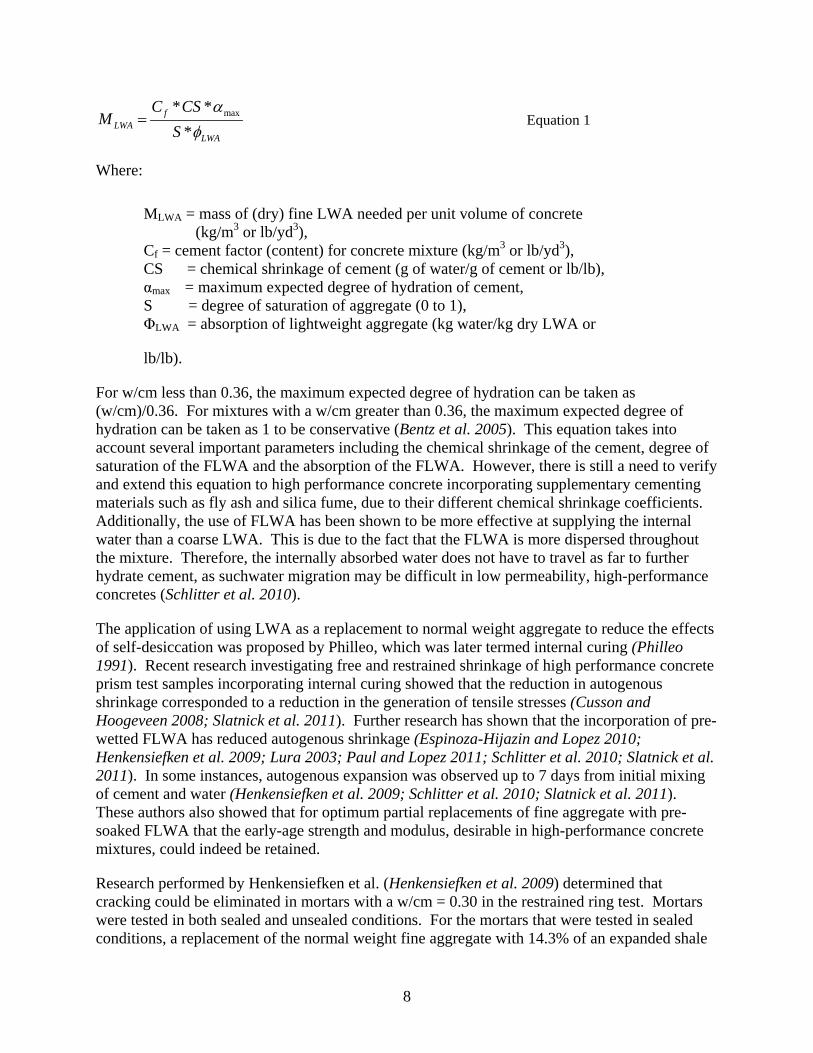
MLWA = mass of (dry) fine LWA needed per unit volume of concrete (kg/m3 or lb/yd3), Cf = cement factor (content) for concrete mixture (kg/m3 or lb/yd3), CS = chemical shrinkage of cement (g of water/g of cement or lb/lb), αmax = maximum expected degree of hydration of cement, S = degree of saturation of aggregate (0 to 1), ΦLWA = absorption of lightweight aggregate (kg water/kg dry LWA or
lb/lb).
For w/cm less than 0.36, the maximum expected degree of hydration can be taken as (w/cm)/0.36. For mixtures with a w/cm greater than 0.36, the maximum expected degree of hydration can be taken as 1 to be conservative (Bentz et al. 2005). This equation takes into account several important parameters including the chemical shrinkage of the cement, degree of saturation of the FLWA and the absorption of the FLWA. However, there is still a need to verify and extend this equation to high performance concrete incorporating supplementary cementing materials such as fly ash and silica fume, due to their different chemical shrinkage coefficients. Additionally, the use of FLWA has been shown to be more effective at supplying the internal water than a coarse LWA. This is due to the fact that the FLWA is more dispersed throughout the mixture. Therefore, the internally absorbed water does not have to travel as far to further hydrate cement, as suchwater migration may be difficult in low permeability, high-performance concretes (Schlitter et al. 2010).
The application of using LWA as a replacement to normal weight aggregate to reduce the effects of self-desiccation was proposed by Philleo, which was later termed internal curing (Philleo 1991). Recent research investigating free and restrained shrinkage of high performance concrete prism test samples incorporating internal curing showed that the reduction in autogenous shrinkage corresponded to a reduction in the generation of tensile stresses (Cusson and Hoogeveen 2008; Slatnick et al. 2011). Further research has shown that the incorporation of pre-wetted FLWA has reduced autogenous shrinkage (Espinoza-Hijazin and Lopez 2010; Henkensiefken et al. 2009; Lura 2003; Paul and Lopez 2011; Schlitter et al. 2010; Slatnick et al. 2011). In some instances, autogenous expansion was observed up to 7 days from initial mixing of cement and water (Henkensiefken et al. 2009; Schlitter et al. 2010; Slatnick et al. 2011). These authors also showed that for optimum partial replacements of fine aggregate with pre-soaked FLWA that the early-age strength and modulus, desirable in high-performance concrete mixtures, could indeed be retained.
Research performed by Henkensiefken et al. (Henkensiefken et al. 2009) determined that cracking could be eliminated in mortars with a w/cm = 0.30 in the restrained ring test. Mortars were tested in both sealed and unsealed conditions. For the mortars that were tested in sealed conditions, a replacement of the normal weight fine aggregate with 14.3% of an expanded shale
8
effectively eliminated cracking during the test. For the unsealed conditions, when the mortar was exposed to a drying environment of 23.0 ± 0.1 oC (73.4 ± 0.2 oF) and 50 ± 0.1% RH, the replacement level of the expanded shale FLWA needed to be as high as 33.0% in order to eliminate cracking. Cusson and Hoogeveen (Cusson and Hoogeveen 2008) also showed that the risk of concrete cracking could be conservatively estimated using free shrinkage strain data. They also demonstrated that the early-age autogenous expansion which pushed elastic and creep strains into a zone of compression allowed for tensile strength development in the concrete to occur ahead of the development of tensile stresses due to shrinkage, which also reduced the risk of early-age cracking. However, the concrete mixtures investigated by both of these researchers did not incorporate supplementary cementing materials, such as fly ash or silica fume, and as a result it will be necessary to further this work by demonstrating the efficacy of internal curing applied to systems capable of generating higher autogenous shrinkage strains (Cusson and Hoogeveen 2008; Slatnick et al. 2011).
Research performed by Zhang (Zhang et al. 2005) investigated the effects of pre-soaked LWA on drying shrinkage. In this study normal coarse aggregate was replaced with expanded clay LWA and compared with a control mixture with normal-weight crushed granite as the sole coarse aggregate. Specimens were tested for two years to analyze short-term and long-term effects of pre-soaked LWA on drying shrinkage. Prior to mixing, the LWA aggregate was soaked for one hour, and the free surface water was deducted from the total mixing water. However, further research on implementing saturated LWA suggests soaking the aggregate for 24 h prior to mixing to allow the saturated LWA to be properly conditioned (Bentur et al. 2001; Bentz et al. 2006). The specimens were moist cured for 7 d, then exposed to a temperature of 30 ± 1 oC(86 ± 1.8 oF) and a relative humidity of 65%. These specimens were monitored for 2 years. Test specimens were also cast to determine the compressive strength, tensile strength and modulus of elasticity.
Results from this study indicated that concrete with pre-soaked LWA resulted in a slightly higher tensile strength, but lower modulus of elasticity. The shrinkage was less than half at 28 d and 40% lower at 91 d for the pre-soaked LWA concrete compared to conventional concrete. This may have occurred due to replacement of hydration water from the LWA, as well as the water lost from being exposed to a dry environment. However, after one year the LWA concrete had a higher shrinkage than the normal weight aggregate concrete (Zhang et al. 2005). Zhang suspected that this was due to the lower modulus of elasticity and the lower ability to restrain shrinkage in the saturated LWA concrete. Even though the saturated LWA concrete exhibited more shrinkage, it may still be less susceptible to cracking due to its lower modulus of elasticity (Zhang et al. 2005).
The incorporation of FLWA has also been shown to reduce the effects of drying shrinkage on mortars. With low replacements (< 11%) of normal weight fine aggregate with FLWA, little change in drying shrinkage results was found. However, with higher replacements (33%) of FLWA, expansion was observed up to 28 d (Henkensiefken et al. 2009; Schlitter et al. 2010).
The benefit of using pre-wetted FLWA has also been shown to reduce plastic shrinkage. Concretes made with a w/cm = 0.55 were cast and placed in a controlled environment of 36 ± 3oC (97 ± 5oF), RH of 30 ± 5%, and wind velocity of 24 ± 2 km/h (14.7 ± 1.2 mph) for 6 h at 25 min after initial contact of water and cement. It was discovered that replacing 18.0% of the
9
normal weight fine aggregate with a pre-soaked expanded shale FLWA could eliminate plastic shrinkage cracking (Henkensiefken et al. 2010).
In addition to reducing the effects of autogenous and drying shrinkage, the use of pre-wetted FLWA has been shown to improve mechanical properties of concrete. The incorporation of FLWA reduced long-term creep, by 10% when compared to a control HPC mixture(Lopez et al. 2008). Benefits to mechanical property development have been shown using internal curing with FLWA under poor curing conditions. Concrete cylinders were cast with and without pre-soaked FLWA and were subjected to 23 oC (73 oF) and 50% RH after 24 h and then tested at 90 d. The concrete made with the FLWA exhibited 16% higher hydration, 19% higher compressive strength, and 30% lower permeability when compared to the concrete made without FLWA (Espinoza-Hijazin and Lopez 2010). However, some research showed that the compressive strength of mortar incorporating FLWA was 20% lower at 7 d when compared to a mixture without FLWA (Geiker et al. 2002). The lower compressive strength was attributed to a lower intrinsic strength of the FLWA(Geiker et al. 2002; Schlitter et al. 2010). However, when tested at 28 d, the compressive strength of the mortar using internal curing with FLWA was 19% higher than the control mixture. The higher later age strength was attributed to the continuation of hydration by water supplied by the pre-soaked FLWA (Geiker et al. 2002; Weber and Reinhardt 1997). While the incorporation of pre-wetted FLWA typically increases strength, modulus of elasticity development is usually lower than mixtures without FLWA. This is due to the LWA being weaker than normal weight fine aggregate(Schlitter et al. 2010). However, thelower modulus of elasticity may provide benefits as to the reduction in early-age cracking.
Additional benefits of pre-soaked FLWA in HPC include that permeability is decreased when compared to a mixture without FLWA, resulting in a reduction in chloride ingress (Thomas 2006). Furthermore, freeze-thaw testing on concrete made with coarse LWA met performance standards outlined by the Kansas Department of Transportation (Grotheer and Peterman 2009). Additional research on mortars with FLWA has shown that there were no negative effects when compared to a mortar made with normal weight sand. The relative dynamic modulus was lower for the mixtures with FLWA, which can be attributed to the decrease in modulus of elasticity due to the lower density of the FLWA(Schlitter et al. 2010). A summary of the benefits of using pre-wetted FLWA can be found in a paper by Henkensiefken and co-workers (Henkensiefken et al. 2009)
In addition to FLWA, it has been found that super absorbent polymers (SAPs) are also effective as an internal curing agent. Research on SAPs has primarily focused on autogenous shrinkage. An SAP is a cross-linked polyelectrolyte that has an ionic nature and interconnected structure. As a result, SAPs have the ability to imbibe a significant amount of liquid, and retain it without dissolving. The water absorbed in SAPs is loosely held, and all the water can be considered as bulk water. Theoretically, the absorption of SAPs is 5000 times their self-weight. However, in cement paste the absorption of SAPs may only be 20 times their self-weight. This reduction in absorption occurs because the cement paste is highly ionic (alkaline). As the concrete mixes, the SAPs form macro-inclusions that contain free water. The excess water in these inclusions is consumed as the cement hydrates (Kovler and Jensen 2005).
Research performed by Wang (Wang et al. 2009) analyzed SAPs as internal curing agents. The SAP size used was no larger than 0.5 mm (0.0197 in) with a maximum absorption rate in
10
distilled water of 400 g water/g SAP. Cement paste was mixed with saturated SAPs and placed on a clear plate and observed in a cracking viewer to study the water release process. The SAPs were mixed with red ink to better examine the water release process. Part of the water in the saturated SAPs had been released after 3 d of curing. After 7 d, the majority of the water had been released by the small particles, but some larger particles still retained water. As the water was released from the SAPs, they decreased in size. This left behind honeycombed pores in the hardened cement paste. The honeycombed pores could have an effect on the compressive strength as well as the long-term performance (e.g. durability) of the concrete if the SAP dosage is not properly controlled (Wang et al. 2009).
2.4.5 Type of cement
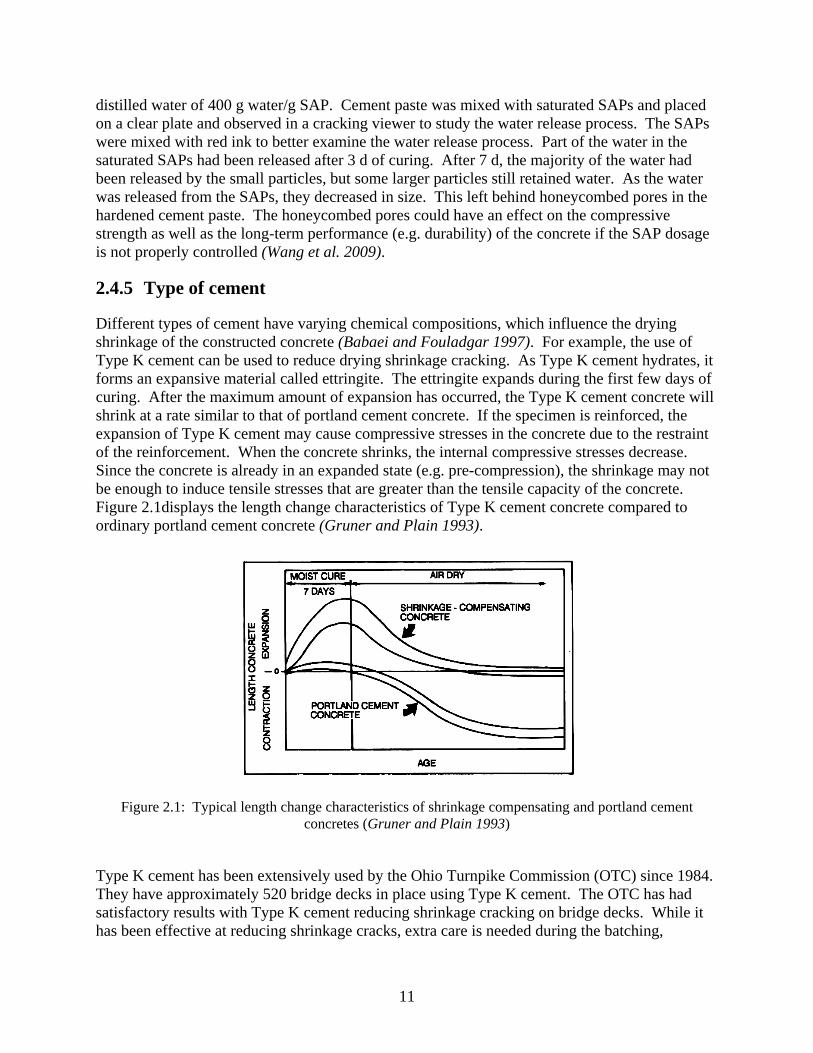
Different types of cement have varying chemical compositions, which influence the drying shrinkage of the constructed concrete (Babaei and Fouladgar 1997). For example, the use of Type K cement can be used to reduce drying shrinkage cracking. As Type K cement hydrates, it forms an expansive material called ettringite. The ettringite expands during the first few days of curing. After the maximum amount of expansion has occurred, the Type K cement concrete will shrink at a rate similar to that of portland cement concrete. If the specimen is reinforced, the expansion of Type K cement may cause compressive stresses in the concrete due to the restraint of the reinforcement. When the concrete shrinks, the internal compressive stresses decrease. Since the concrete is already in an expanded state (e.g. pre-compression), the shrinkage may not be enough to induce tensile stresses that are greater than the tensile capacity of the concrete. Figure 2.1displays the length change characteristics of Type K cement concrete compared to ordinary portland cement concrete (Gruner and Plain 1993).
Figure 2.1: Typical length change characteristics of shrinkage compensating and portland cement concretes (Gruner and Plain 1993)
Type K cement has been extensively used by the Ohio Turnpike Commission (OTC) since 1984. They have approximately 520 bridge decks in place using Type K cement. The OTC has had satisfactory results with Type K cement reducing shrinkage cracking on bridge decks. While it has been effective at reducing shrinkage cracks, extra care is needed during the batching,
11
placement and curing of Type K bridge decks. This type of bridge deck is less robust than common portland cement concrete decks. Type K cement concrete has a shorter working time and the curing requirements are more demanding. Phillips, Ramey and Pittman recommend that the delivery time, with an approved retarder, be limited to 75 minutes or less. With regard to curing, they propose that two layers of wet burlap be placed shortly after texturing. The wet burlap should be maintained for 7 d after concrete placement to allow the concrete to properly cure (Phillips et al. 1997).
2.4.6 Supplementary cementitious materials (SCMs)
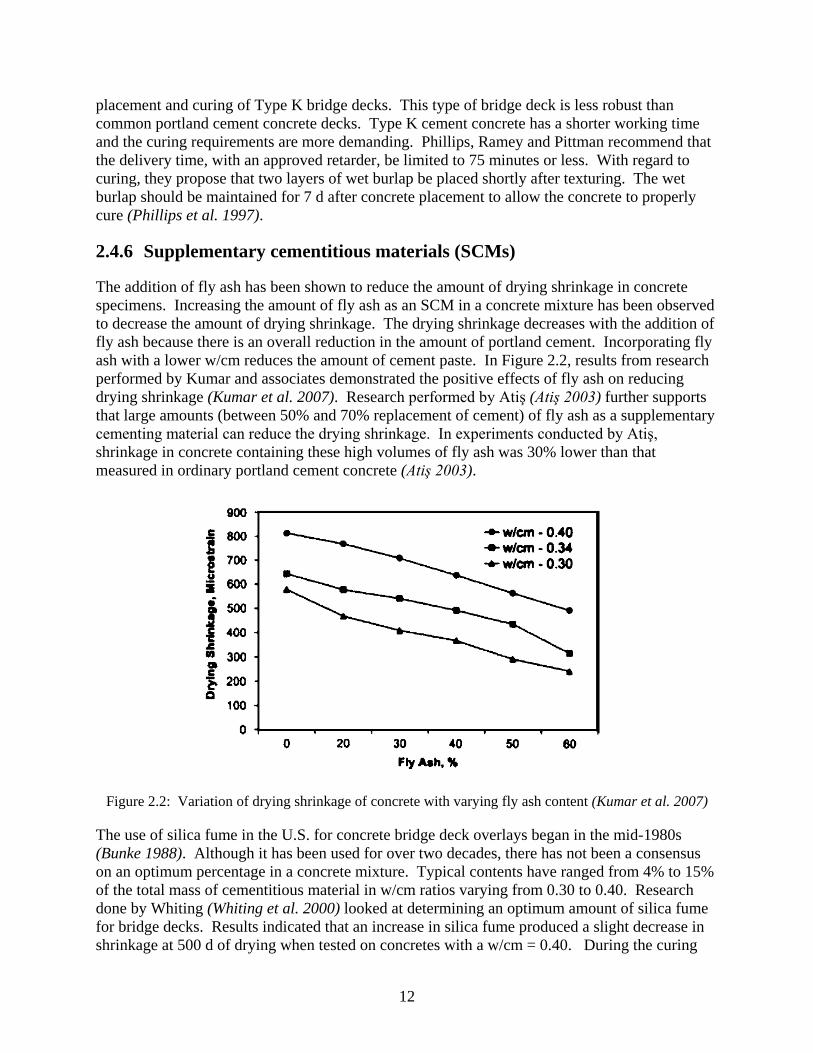
The addition of fly ash has been shown to reduce the amount of drying shrinkage in concrete specimens. Increasing the amount of fly ash as an SCM in a concrete mixture has been observed to decrease the amount of drying shrinkage. The drying shrinkage decreases with the addition of fly ash because there is an overall reduction in the amount of portland cement. Incorporating fly ash with a lower w/cm reduces the amount of cement paste. In Figure 2.2, results from research performed by Kumar and associates demonstrated the positive effects of fly ash on reducing drying shrinkage (Kumar et al. 2007). Research performed by Atiş (Atiş 2003) further supports that large amounts (between 50% and 70% replacement of cement) of fly ash as a supplementary cementing material can reduce the drying shrinkage. In experiments conducted by Atiş, shrinkage in concrete containing these high volumes of fly ash was 30% lower than that measured in ordinary portland cement concrete (Atiş 2003).
Figure 2.2: Variation of drying shrinkage of concrete with varying fly ash content (Kumar et al. 2007)
The use of silica fume in the U.S. for concrete bridge deck overlays began in the mid-1980s (Bunke 1988). Although it has been used for over two decades, there has not been a consensus on an optimum percentage in a concrete mixture. Typical contents have ranged from 4% to 15% of the total mass of cementitious material in w/cm ratios varying from 0.30 to 0.40. Research done by Whiting (Whiting et al. 2000) looked at determining an optimum amount of silica fume for bridge decks. Results indicated that an increase in silica fume produced a slight decrease in shrinkage at 500 d of drying when tested on concretes with a w/cm = 0.40. During the curing
12
process of concrete incorporating silica fume, the “silica fume quickly reacts with the calcium hydroxide produced by the hydration of cement, forming calcium silicate hydrate(Whiting et al. 2000).” The calcium silicate hydrate fills the voids creating a relatively impermeable material. The impermeability decreases the rate and the total amount of bleed water. However, the decreased bleed water can lead to cracking at early-ages in the concrete(Whiting et al. 2000).
Conclusions by Whiting indicate that silica fume had little effect on the long term shrinkage of normal weight aggregate concrete (Whiting et al. 2000; Zhang et al. 2005). However, according to research performed by Zhang, adding 5% silica fume to a concrete mix with saturated LWA as the coarse aggregate can decrease shrinkage up to 20% (Zhang et al. 2005). The factor that contributes the most to shrinkage is the w/cm with silica fume in concrete. This is critical to construction practices since water may be intentionally added. If the silica fume content is high, it may lead to a large increase in shrinkage. Whiting suggests “unless there is a specific reason for using high levels of silica fume, a range of 6 to 8% should yield the desired levels of performance(Whiting et al. 2000).”
2.4.7 Aggregate selection
The selection of aggregate can affect drying shrinkage in several ways. Certain aggregate types need additional water to create a proper slump for workability. “Aggregates that need more water in the mix to produce the same workability have smaller coarse aggregate, rough texture, and/or flat and elongated particles. However, since the water content of the concrete is measured and controlled through its maximum allowable w/cm, this characteristic of aggregate cannot unexpectedly increase the shrinkage of concrete(Babaei and Fouladgar 1997).”
Another way is that some aggregates do not provide enough restraint against the pressure from the paste shrinking, therefore causing the aggregate to compress. This factor is attributed to the mineralogy and porosity of the aggregate. The porosity of the aggregate can make it become more compressible. Also, as higher porosity aggregates lose moisture, it may have the tendency to shrink as it dries (Babaei and Fouladgar 1997). “In general, concretes low in shrinkage often contain quartz, limestone, dolomite, granite, or feldspar, whereas those high in shrinkage often contain sandstone, slate, basalt, trap rock, or other aggregates which shrink considerably of themselves or have low rigidity to the compressive stresses developed by the shrinkage of paste(Troxell and Davis 1956).”
The shape of the aggregate is an important factor when determining drying shrinkage. Crushed aggregates provide better restraint to shrinkage because of their rough surface. The rough surface provides an increased surface area, which results in higher restraint against the shrinkage of the cement paste (RILEM Committee 119 1998).
However, according to Radlinska et al., most aggregates do not change volumetrically, and shrinkage is generally considered a paste property(Radlinska et al. 2008). Additionally, increasing the aggregate content with competent aggregates in a mix design can significantly decrease shrinkage as aggregates generally resist shrinkage forces from the paste(Nilson et al. 2004).
13

14
3.0 DURABILITY
While the primary focus of this research project is to reduce long-term drying shrinkage, it is imperative that a change in mixture design will not have any negative effects on the long-term durability of the concrete. Durability factors of concern are freeze-thaw resistance, permeability and chloride ingress and abrasion resistance. For the purpose of this study, freeze-thaw resistance and rapid chloride permeability were studied.
3.1 FREEZE-THAW
In environmental conditions where concrete is subjected to freezing and thawing cycles, it is imperative to provide adequate protection. The most effective method to provide protection is through the addition of an air entraining admixture. Air entraining admixtures purposefully add uniformly distributed air voids into the cement paste during the mixing action (Kosmatka 2008). Proper spacing of air voids is also important. The void spacing factor should not be greater than 0.2 mm (7.9 x 10⁻³ in)(Mehta and Monteiro 2006). It should be noted that for damage to occur from freezing and thawing, the concrete must have an internal relative humidity higher than 75- 80% (ACI Committee 201 2008). A critical saturation point of 90% or higher internal relative humidity has been determined for damage to occur(MacInnis and Beaudoin 1968). This is due to the fact that water expands approximately 9% during its transformation between liquid and solid (Powers 1958).
While the use of SRAs has been effective at reducing both autogenous and drying shrinkage in concretes, the use of SRAs had been limited to environments where freezing and thawing cycles were limited due to difficulties in ensuring a stable air void system(Cope and Ramey 2001; Schemmel et al. 1999) in early production runs of SRA. A reduction in surface tension in the pore solution(Bae et al. 2002) can have an effect on the formation of an adequate air void system to provide protection against freezing and thawing cycles(Berke et al. 2003; Cope and Ramey 2001; Schemmel et al. 1999). Developments in the past 10 years in the formulation of SRAs have shown that a stable air void system in concrete can be achieved (Bae et al. 2002; Berke et al. 2003). Previous research has shown conflicting results in the freeze-thaw performance of concretes incorporating SRAs. Research performed by Berke et al.(Berke et al. 2003) and Bae and co-workers (Bae et al. 2002) demonstrated that a stable air void system can be achieved to provide freeze-thaw resistance. Results indicated that a relative dynamic modulus of elasticity (RDME) of 99% and a mass change of less than 0.25% could be achieved in concrete incorporating a glycol ether SRA after 300 cycles of freezing and thawing. Research performed by Cope and Ramey(Cope and Ramey 2001) showed that an adequate RDME could be achieved in concrete mixtures incorporating SRAs, but the concrete exhibited significant scaling throughout the testing. Furthermore, it has typically been found that the incorporation of SRAs required higher dosages of air-entraining admixture to obtain an adequate volume of air into the mixture (Bae et al. 2002; Berke et al. 2003; Cope and Ramey 2001).
15
Early research on the effects of pre-soaked LWAs on the durability of concretes when subjected to freezing and thawing cycles focused on concretes made with no air-entrainment and on concretes made with moderate air entrainment (Klieger and Hanson 1961). Further research performed by Pfeifer showed little change in performance in concretes made with air dried LWAs when subjected to freezing and thawing (Pfeifer 1967). More current research performed by Grotheer et al (Grotheer and Peterman 2009) showed the use of FLWA in HPC mixtures performed well when subjected to freezing and thawing environments. Three sources of FLWA were tested for freeze-thaw performance in concretes with a w/cm = 0.38 using ASTM C666 Procedure B (freezing in air and thawing in water). The specimens were cast with an air content ranging from 6.0-7.5%, were wet cured for 67 d, and then placed in a drying environment for 21 d prior to testing. Results indicated that a durability factor ranging from 96.5 to 100 could be obtained in these mixtures after 300 cycles of freezing and thawing. Similar results were found by Schlitter and co-workers (Schlitter et al. 2010) on high-performance mortars incorporating pre-soaked FLWA. Mortars were cast with a w/cm of 0.30 and had no entrained air. The mortars were allowed to cure for 14 d before being subjected to freezing and thawing. It was found that an increase in RDME was achieved and no mass change was observed after beyond 300 cycles indicating that no freeze-thaw damage was observed in these mortars. 3.2 CHLORIDE INGRESS
Two important factors affecting the porosity of concrete are the w/cm and the water content of the mixture. As the w/cm decreases, the concrete becomes less porous. The connectivity of the pores is important when considering durability. Ingress of moisture may increase the effects of freeze-thaw cycles or contain aggressive chemicals that can cause corrosion and thereby lead to a decreased service life (Mindess et al. 2003). Work by Powers (Powers and Brownyard 1944) proved that the porosity of cement paste decreased with a decrease in the w/cm. Furthermore, the porosity is also dependent on the degree of hydration. As the degree of hydration approaches 100%, the porosity continually decreases.
Previous research performed by Thomas (Thomas 2006) showed that the use of pre-soaked FLWA and lightweight coarse aggregate reduced the chloride penetration of non-air entrained HPC incorporating silica fume and fly ash. A reduction in chloride penetrability of up to 70% was found after 1 and 3 years of curing in both the rapid chloride permeability test (ASTM C 1202) and bulk diffusion testing. This reduction in penetrability was attributed to the internally absorbed water providing moisture for increased hydration of cement particles. Zhang and Gjorv (Zhang and Gjorv 1991)also showed a decrease in permeability in high-strength lightweight concrete. However, it was stated that the permeability of the lightweight concrete appeared to depend more on the porosity of the mortar than that of the aggregate. Results indicated that lightweight aggregates with high porosity produced similar results in terms of permeability when compared to denser aggregates. Similarly, research performed by Bentz (Bentz 2009) on non-air entrained mortars with a w/cm = 0.40 has shown that the use of pre-soaked FLWAproduced a diffusion coefficient for chloride ions that was 55% -75% lower than that of the control mixture without FLWA. Through modeling, the reduction in chloride diffusion was credited to a reduced percolated interfacial transition zone (ITZ) and enhanced hydration in the mortars incorporating FLWA. The improved ITZ in and around the pre-soaked FLWA can be seen inFigure 3.1.
16
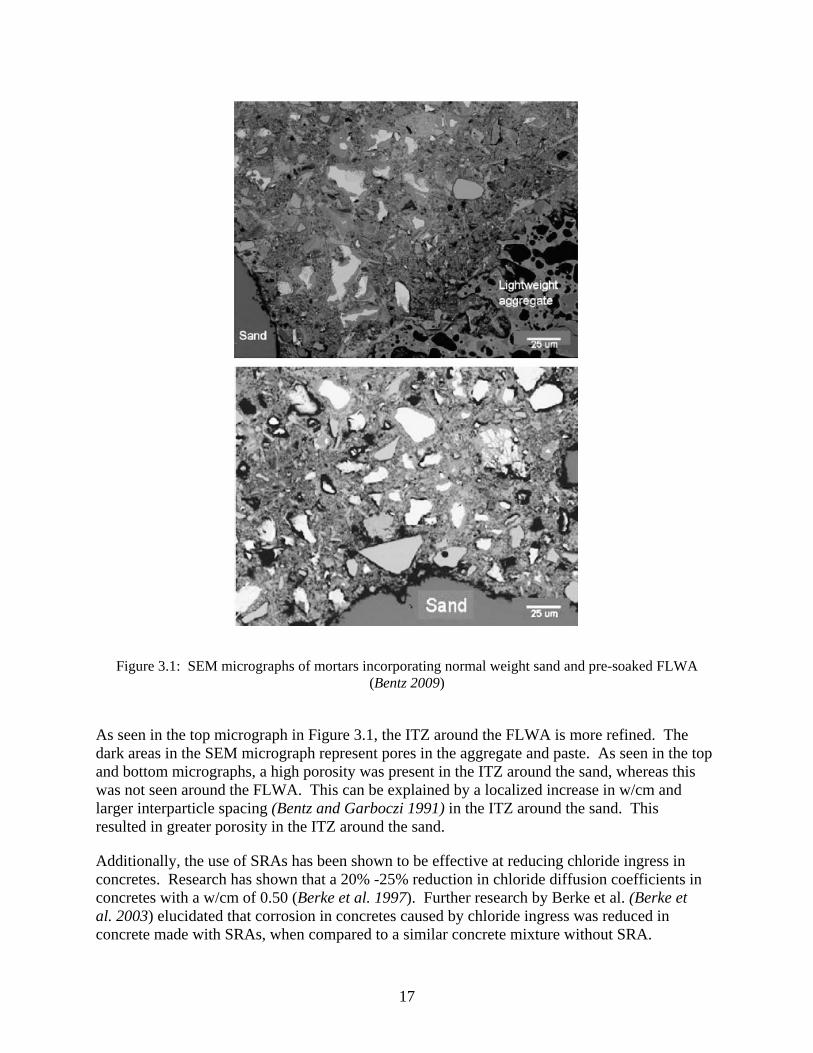
Figure 3.1: SEM micrographs of mortars incorporating normal weight sand and pre-soaked FLWA (Bentz 2009)
As seen in the top micrograph in Figure 3.1, the ITZ around the FLWA is more refined. The dark areas in the SEM micrograph represent pores in the aggregate and paste. As seen in the top and bottom micrographs, a high porosity was present in the ITZ around the sand, whereas this was not seen around the FLWA. This can be explained by a localized increase in w/cm and larger interparticle spacing (Bentz and Garboczi 1991) in the ITZ around the sand. This resulted in greater porosity in the ITZ around the sand.
Additionally, the use of SRAs has been shown to be effective at reducing chloride ingress in concretes. Research has shown that a 20% -25% reduction in chloride diffusion coefficients in concretes with a w/cm of 0.50 (Berke et al. 1997). Further research by Berke et al. (Berke et al. 2003) elucidated that corrosion in concretes caused by chloride ingress was reduced in concrete made with SRAs, when compared to a similar concrete mixture without SRA.
17

18
4.0 METHODS AND MATERIALS
4.1 TESTING METHODS
4.1.1 FLWA testing
During this project there was not an agreed upon method to determine the absorption capacity of FLWA, there are various proposed methods to determine this value (Castro et al. 2011; Paul and Lopez 2011; Schlitter et al. 2010). However, in 2012 there was a publication of a new ASTM Standard – ASTM C 1761-12 “Standard Specification for Lightweight Aggregate for Internal Curing of Concrete”. This may be referred to for guidance on determining absorption capacity of FLWA. In this research, ASTM C128 (ASTM Standard C128 2007) was used to determine the absorption capacity and rate. Oven dry FLWA was soaked in water for 0.5-, 1-, 24-, 48-, 72-, and 168-h to determine the rate of absorption. The standard cone test was performed, and the surface dry condition was determined when the cone of aggregate began to slump. However, there is dispute on using the cone test for FLWA. Because the FLWA is typically angular, particle interlock may occur and the aggregate may be dried beyond the surface dry condition before slumping of the cone occurs (Castro et al. 2011). However, various researchers have used the cone test effectively as the method to determine the surface dry condition of FLWA, although it may result in underestimation of the absorption capacity due to particle interlock (Castro et al. 2011; Schlitter et al. 2010).
Desorption isotherms were performed on pre-soaked surface dry FLWA to determine the potential for the FLWA to give off imbibed water at a high RH (90% or higher). Modifications to ASTM C1498 (ASTM Standard C1498 2004) were used to determine the desorption of the FLWA. The aggregate was allowed to soak until the absorption capacity of the FLWA had been achieved, and then brought to a surface dry condition prior to desorption testing. Approximately 10 g (0.022 lb) of FLWA was placed in a series of desiccators, each with a known RH. The FLWA was first subjected to a desiccator with a RH of 97% and allowed to desorb the imbibed water until hygroscopic equilibrium was achieved. The mass of the FLWA sample was recorded before being placed in the next desiccator. The aggregate was then placed in a desiccator with 92% RH; the same procedures above were followed. The sample was then placed in a third desiccator at 84% RH and then finally brought back to an oven dry condition.
4.1.2 Autogenous deformation
To capture the autogenous deformation or to assess the effectiveness of shrinkage mitigation strategies, many measurement techniques and apparatus to assess autogenous deformation have been developed. These measurement techniques have been the highlight of much debate as to their accuracy, repeatability, applicability to field concrete and ease of use. However, until 2009 no standard test method had been adopted by major standards organizations (ACI, ASTM, AASHTO). The recent adoption of ASTM C1698 for assessing autogenous deformation has
19
pushed one method into the forefront for standard testing purposes. Fundamentally, all proposed measurements of autogenous strain of cement-based materials can be characterized into two different categories: measurement of volumetric strain and measurement of linear strain. ASTM C 1698 (ASTM C1698 2009) is a linear shrinkage testing method which is further described below in methods for measuring autogenous shrinkage. The remainder of this section provides a summary of test methods for assessing autogenous deformation.
4.1.2.1 Volumetric measurements of autogenous deformation
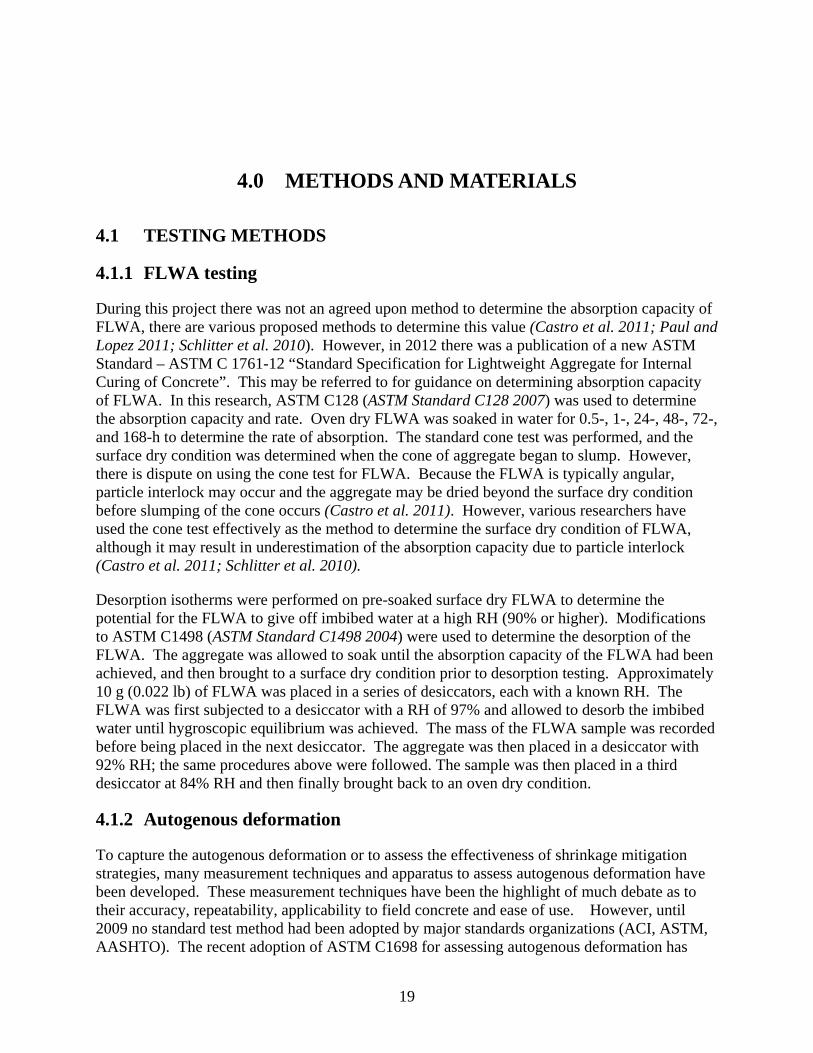
Volumetric measurements of autogenous strain are frequently performed by placing fresh cement paste in an elastic rubber membrane immersed in a liquid. The change in volume of the cement paste is measured by the amount of liquid displaced by the immersed sample, typically by measuring the specimen’s change in mass while it is submerged in liquid. Typical membrane samples filled with cement paste are shown in Figure 4.1.
Figure 4.1: Polyurethane membrane (left) and latex membrane (right) filled with cement paste (Lura and Jensen 2007)
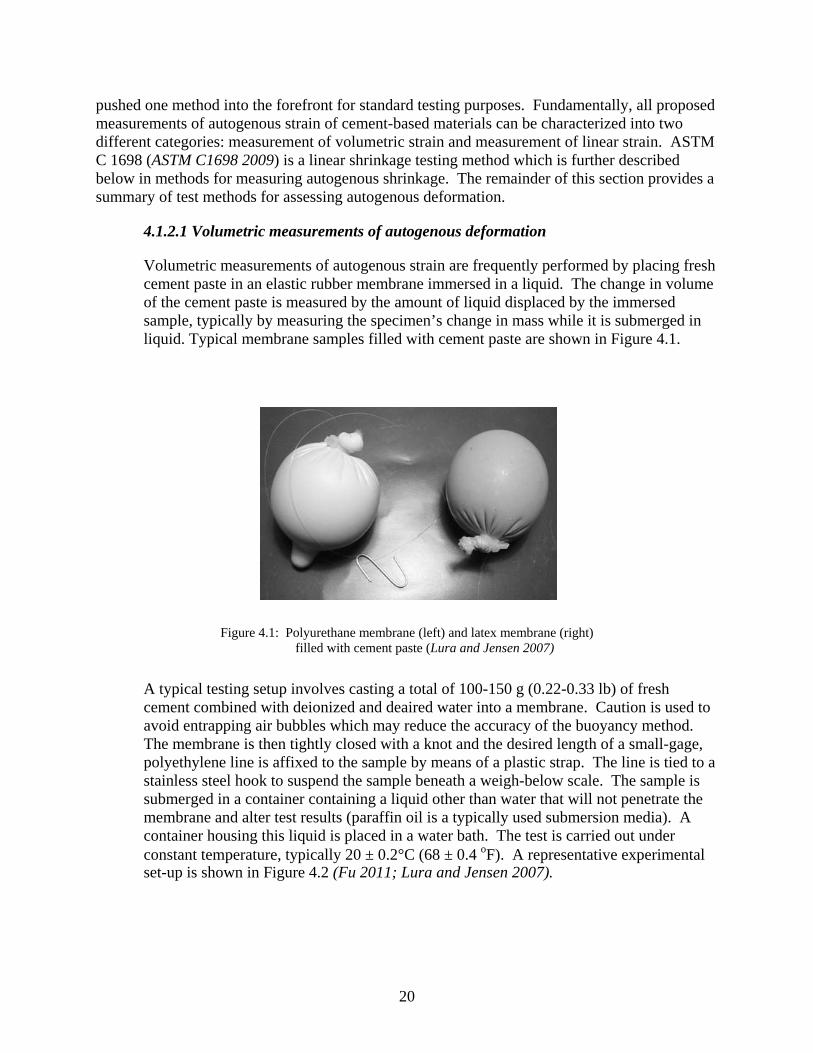
A typical testing setup involves casting a total of 100-150 g (0.22-0.33 lb) of fresh cement combined with deionized and deaired water into a membrane. Caution is used to avoid entrapping air bubbles which may reduce the accuracy of the buoyancy method. The membrane is then tightly closed with a knot and the desired length of a small-gage, polyethylene line is affixed to the sample by means of a plastic strap. The line is tied to a stainless steel hook to suspend the sample beneath a weigh-below scale. The sample is submerged in a container containing a liquid other than water that will not penetrate the membrane and alter test results (paraffin oil is a typically used submersion media). A container housing this liquid is placed in a water bath. The test is carried out under constant temperature, typically 20 ± 0.2°C (68 ± 0.4 oF). A representative experimental set-up is shown in Figure 4.2 (Fu 2011; Lura and Jensen 2007).
20
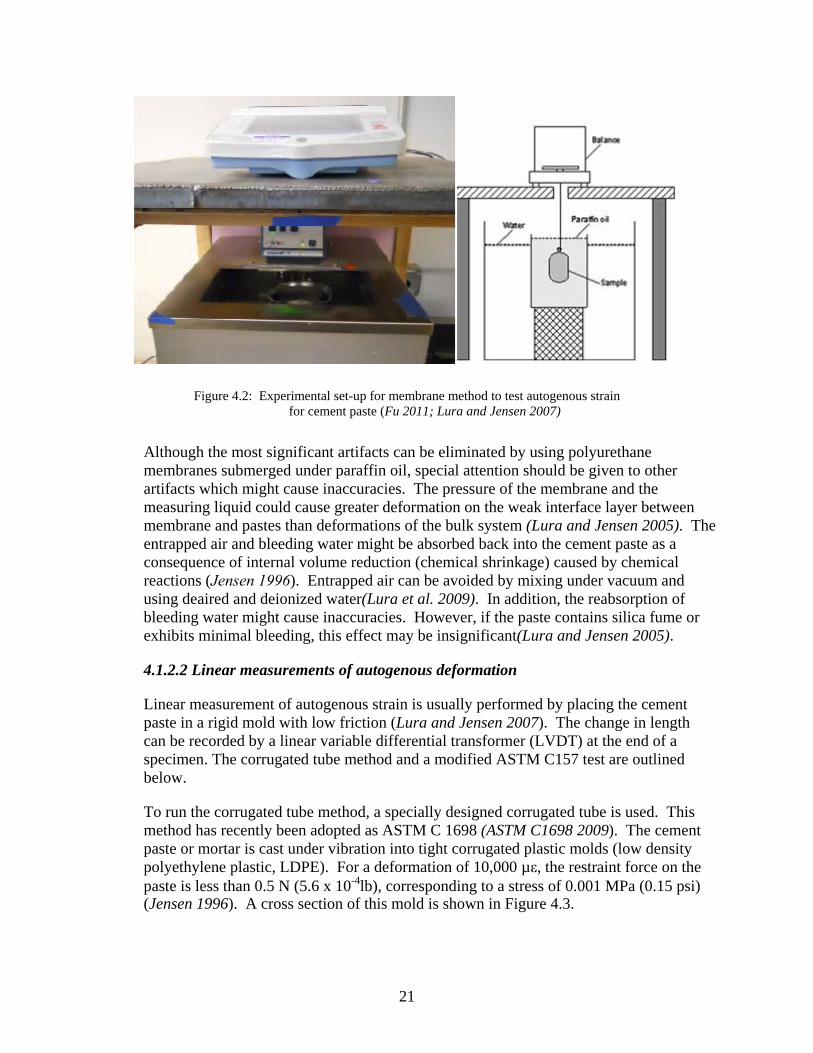
Figure 4.2: Experimental set-up for membrane method to test autogenous strain for cement paste (Fu 2011; Lura and Jensen 2007)
Although the most significant artifacts can be eliminated by using polyurethane membranes submerged under paraffin oil, special attention should be given to other artifacts which might cause inaccuracies. The pressure of the membrane and the measuring liquid could cause greater deformation on the weak interface layer between membrane and pastes than deformations of the bulk system (Lura and Jensen 2005). The entrapped air and bleeding water might be absorbed back into the cement paste as a consequence of internal volume reduction (chemical shrinkage) caused by chemical reactions (Jensen 1996). Entrapped air can be avoided by mixing under vacuum and using deaired and deionized water(Lura et al. 2009). In addition, the reabsorption of bleeding water might cause inaccuracies. However, if the paste contains silica fume or exhibits minimal bleeding, this effect may be insignificant(Lura and Jensen 2005).
4.1.2.2 Linear measurements of autogenous deformation
Linear measurement of autogenous strain is usually performed by placing the cement paste in a rigid mold with low friction (Lura and Jensen 2007). The change in length can be recorded by a linear variable differential transformer (LVDT) at the end of a specimen. The corrugated tube method and a modified ASTM C157 test are outlined below.
To run the corrugated tube method, a specially designed corrugated tube is used. This method has recently been adopted as ASTM C 1698 (ASTM C1698 2009). The cement paste or mortar is cast under vibration into tight corrugated plastic molds (low density polyethylene plastic, LDPE). For a deformation of 10,000 µε, the restraint force on the paste is less than 0.5 N (5.6 x 10⁻⁴lb), corresponding to a stress of 0.001 MPa (0.15 psi) (Jensen 1996). A cross section of this mold is shown in Figure 4.3.
21
Figure 4.3: Special corrugated plastic mold for autogenous deformation measurements(Lura 2003)
The sample usually has a length-to-diameter ratio of approximately 30:1. The specimens are placed in a dilatometer placed in a temperature controlled environment at an isothermal temperature of 20 ± 0.1°C (68 ± 0.4 oF). A top view of the dilatometer is shown in Figure 4.4.a, and an actual set-up is shown in Figure 4.4.b. The dilatometer frame consists of two steel plates joined rigidly by four solid invar steel rods. Each specimen is supported longitudinally by two smaller parallel rods attached to the steel plates. The specimens are typically fixed at one end, and the sample can thus move freely on the support rods. The entire set-up is immersed into a glycol bath (to prevent any water transport through the sealed end caps should a leak occur), which can also function as lubricant to reduce frictional forces. The longitudinal deformation is measured at the free end by an LVDT, and the results may be recorded automatically through appropriate data acquisition devices (Lura 2003).
a) Schematic(Jensen 1996) b) Representative picture(Lura and Jensen 2007)
Figure 4.4: Dilatometer with corrugated molds for measurements of linear and autogenous strain
Although the corrugated tube method is easy to perform and repeat, some considerations should be given in application. Air entrapped within the tube might cause inaccuracies, which can be insignificant when special attention is given to preparing the specimen. Due to the fact that the test specimens are submerged under a glycol bath, proper sealing is very important and should be checked by monitoring the weight change of each sample before and after the test(Lura and
22
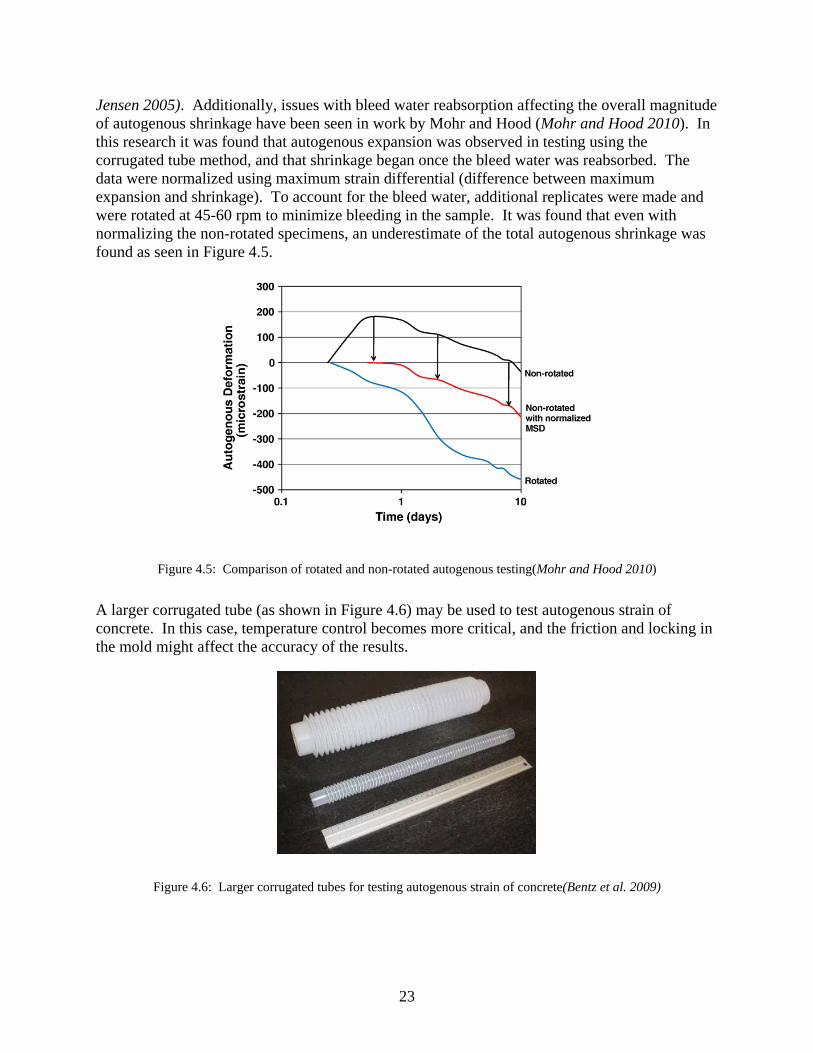
Jensen 2005). Additionally, issues with bleed water reabsorption affecting the overall magnitude of autogenous shrinkage have been seen in work by Mohr and Hood (Mohr and Hood 2010). In this research it was found that autogenous expansion was observed in testing using the corrugated tube method, and that shrinkage began once the bleed water was reabsorbed. The data were normalized using maximum strain differential (difference between maximum expansion and shrinkage). To account for the bleed water, additional replicates were made and were rotated at 45-60 rpm to minimize bleeding in the sample. It was found that even with normalizing the non-rotated specimens, an underestimate of the total autogenous shrinkage was found as seen in Figure 4.5.
Figure 4.5: Comparison of rotated and non-rotated autogenous testing(Mohr and Hood 2010)
A larger corrugated tube (as shown in Figure 4.6) may be used to test autogenous strain of concrete. In this case, temperature control becomes more critical, and the friction and locking in the mold might affect the accuracy of the results.
Figure 4.6: Larger corrugated tubes for testing autogenous strain of concrete(Bentz et al. 2009)
23
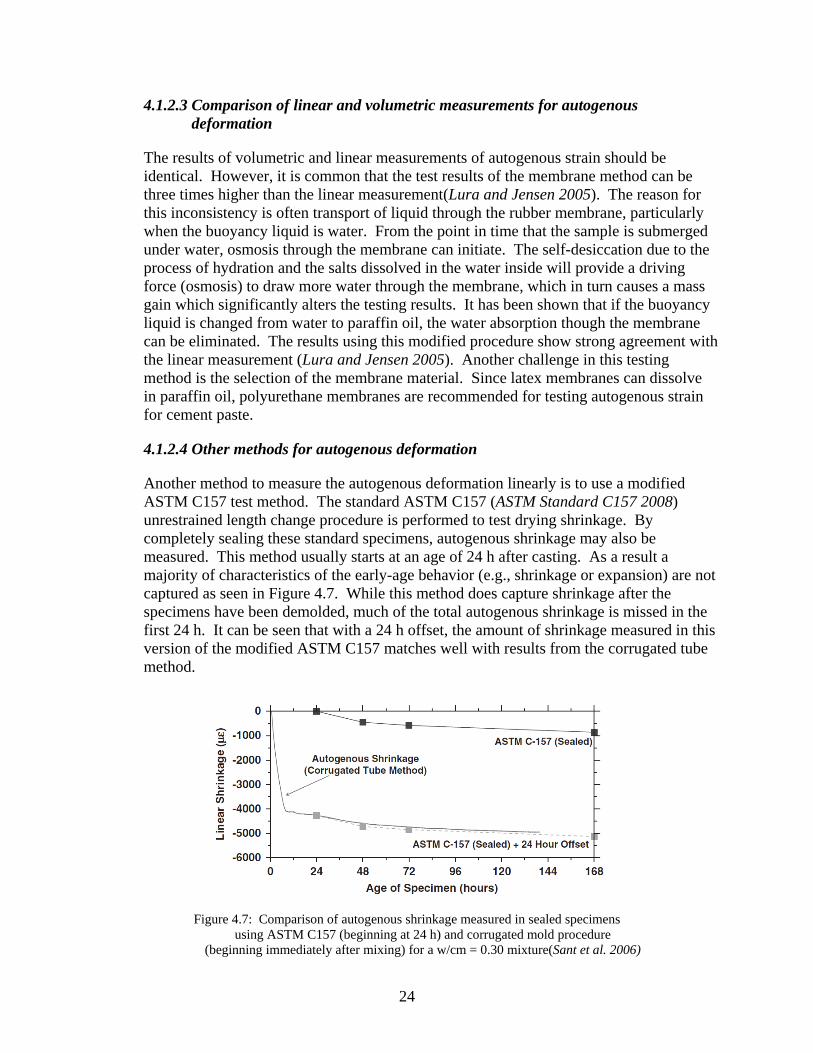
4.1.2.3 Comparison of linear and volumetric measurements for autogenous deformation
The results of volumetric and linear measurements of autogenous strain should be identical. However, it is common that the test results of the membrane method can be three times higher than the linear measurement(Lura and Jensen 2005). The reason for this inconsistency is often transport of liquid through the rubber membrane, particularly when the buoyancy liquid is water. From the point in time that the sample is submerged under water, osmosis through the membrane can initiate. The self-desiccation due to the process of hydration and the salts dissolved in the water inside will provide a driving force (osmosis) to draw more water through the membrane, which in turn causes a mass gain which significantly alters the testing results. It has been shown that if the buoyancy liquid is changed from water to paraffin oil, the water absorption though the membrane can be eliminated. The results using this modified procedure show strong agreement with the linear measurement (Lura and Jensen 2005). Another challenge in this testing method is the selection of the membrane material. Since latex membranes can dissolve in paraffin oil, polyurethane membranes are recommended for testing autogenous strain for cement paste.
4.1.2.4 Other methods for autogenous deformation
Another method to measure the autogenous deformation linearly is to use a modified ASTM C157 test method. The standard ASTM C157 (ASTM Standard C157 2008) unrestrained length change procedure is performed to test drying shrinkage. By completely sealing these standard specimens, autogenous shrinkage may also be measured. This method usually starts at an age of 24 h after casting. As a result a majority of characteristics of the early-age behavior (e.g., shrinkage or expansion) are not captured as seen in Figure 4.7. While this method does capture shrinkage after the specimens have been demolded, much of the total autogenous shrinkage is missed in the first 24 h. It can be seen that with a 24 h offset, the amount of shrinkage measured in this version of the modified ASTM C157 matches well with results from the corrugated tube method.
Figure 4.7: Comparison of autogenous shrinkage measured in sealed specimens using ASTM C157 (beginning at 24 h) and corrugated mold procedure
(beginning immediately after mixing) for a w/cm = 0.30 mixture(Sant et al. 2006)
24
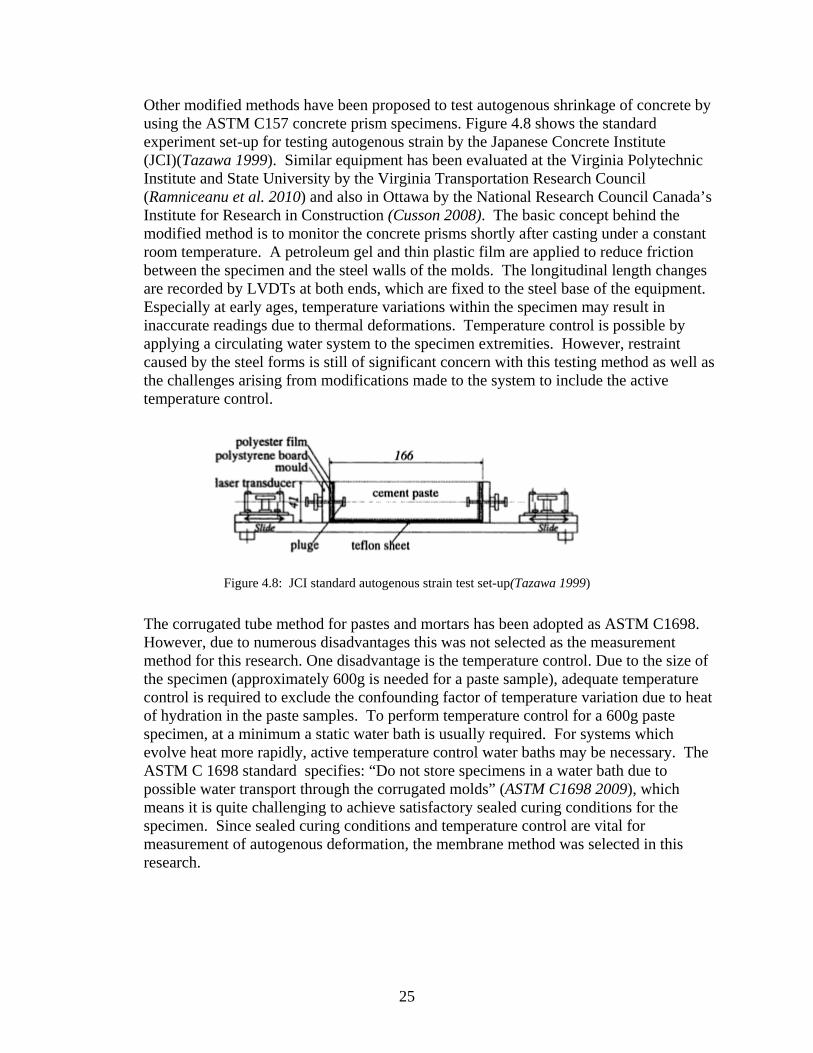
Other modified methods have been proposed to test autogenous shrinkage of concrete by using the ASTM C157 concrete prism specimens. Figure 4.8 shows the standard experiment set-up for testing autogenous strain by the Japanese Concrete Institute (JCI)(Tazawa 1999). Similar equipment has been evaluated at the Virginia Polytechnic Institute and State University by the Virginia Transportation Research Council (Ramniceanu et al. 2010) and also in Ottawa by the National Research Council Canada’s Institute for Research in Construction (Cusson 2008). The basic concept behind the modified method is to monitor the concrete prisms shortly after casting under a constant room temperature. A petroleum gel and thin plastic film are applied to reduce friction between the specimen and the steel walls of the molds. The longitudinal length changes are recorded by LVDTs at both ends, which are fixed to the steel base of the equipment. Especially at early ages, temperature variations within the specimen may result in inaccurate readings due to thermal deformations. Temperature control is possible by applying a circulating water system to the specimen extremities. However, restraint caused by the steel forms is still of significant concern with this testing method as well as the challenges arising from modifications made to the system to include the active temperature control.
Figure 4.8: JCI standard autogenous strain test set-up(Tazawa 1999)
The corrugated tube method for pastes and mortars has been adopted as ASTM C1698. However, due to numerous disadvantages this was not selected as the measurement method for this research. One disadvantage is the temperature control. Due to the size of the specimen (approximately 600g is needed for a paste sample), adequate temperature control is required to exclude the confounding factor of temperature variation due to heat of hydration in the paste samples. To perform temperature control for a 600g paste specimen, at a minimum a static water bath is usually required. For systems which evolve heat more rapidly, active temperature control water baths may be necessary. The ASTM C 1698 standard specifies: “Do not store specimens in a water bath due to possible water transport through the corrugated molds” (ASTM C1698 2009), which means it is quite challenging to achieve satisfactory sealed curing conditions for the specimen. Since sealed curing conditions and temperature control are vital for measurement of autogenous deformation, the membrane method was selected in this research.
25
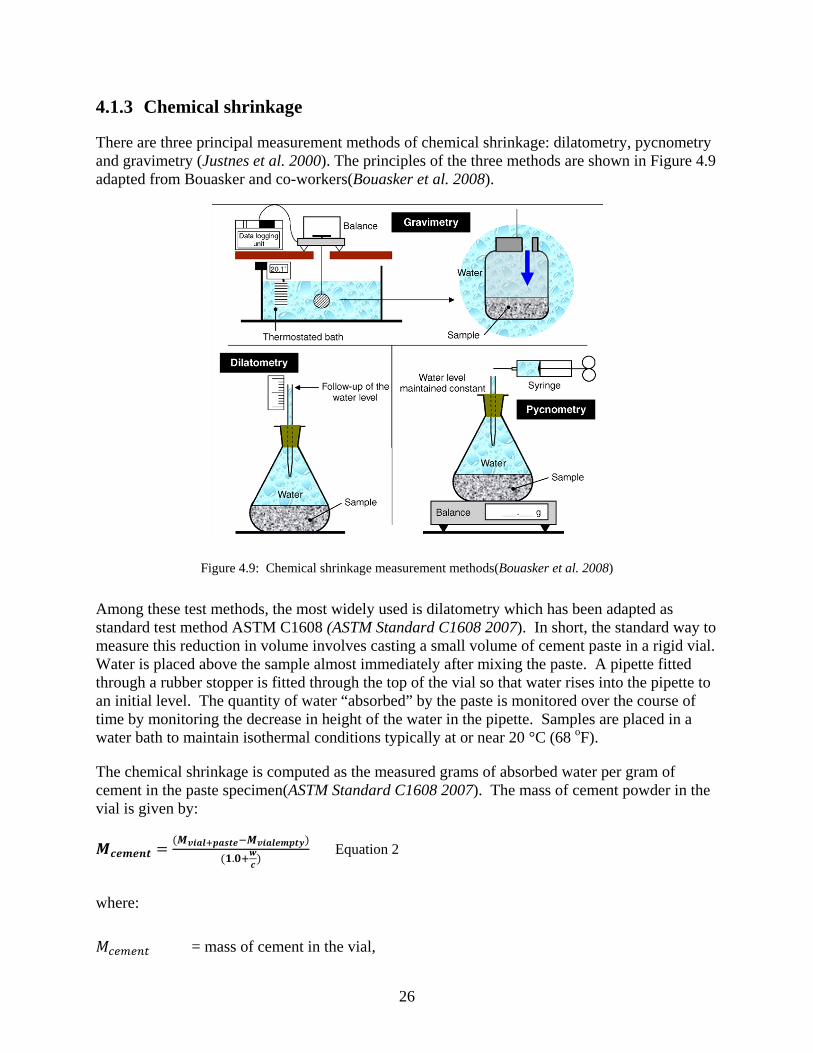
4.1.3 Chemical shrinkage
There are three principal measurement methods of chemical shrinkage: dilatometry, pycnometry and gravimetry (Justnes et al. 2000). The principles of the three methods are shown in Figure 4.9 adapted from Bouasker and co-workers(Bouasker et al. 2008).
Figure 4.9: Chemical shrinkage measurement methods(Bouasker et al. 2008)
Among these test methods, the most widely used is dilatometry which has been adapted as standard test method ASTM C1608 (ASTM Standard C1608 2007). In short, the standard way to measure this reduction in volume involves casting a small volume of cement paste in a rigid vial. Water is placed above the sample almost immediately after mixing the paste. A pipette fitted through a rubber stopper is fitted through the top of the vial so that water rises into the pipette to an initial level. The quantity of water “absorbed” by the paste is monitored over the course of time by monitoring the decrease in height of the water in the pipette. Samples are placed in a water bath to maintain isothermal conditions typically at or near 20 °C (68 oF).
The chemical shrinkage is computed as the measured grams of absorbed water per gram of cement in the paste specimen(ASTM Standard C1608 2007). The mass of cement powder in the vial is given by:
Equation 2
where:
= mass of cement in the vial,
26
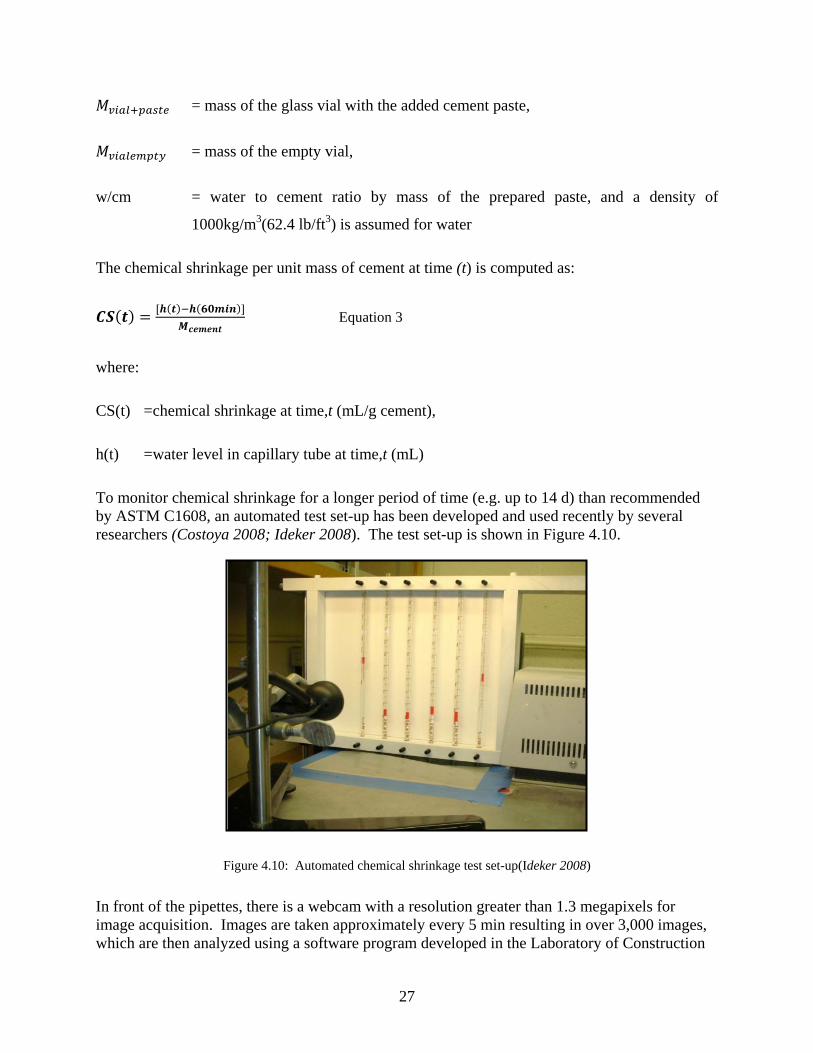
= mass of the glass vial with the added cement paste,
= mass of the empty vial,
w/cm = water to cement ratio by mass of the prepared paste, and a density of
1000kg/m3(62.4 lb/ft3) is assumed for water
The chemical shrinkage per unit mass of cement at time (t) is computed as:
Equation 3
where:
CS(t) =chemical shrinkage at time,t (mL/g cement),
h(t) =water level in capillary tube at time,t (mL)
To monitor chemical shrinkage for a longer period of time (e.g. up to 14 d) than recommended by ASTM C1608, an automated test set-up has been developed and used recently by several researchers (Costoya 2008; Ideker 2008). The test set-up is shown in Figure 4.10.
Figure 4.10: Automated chemical shrinkage test set-up(Ideker 2008)
In front of the pipettes, there is a webcam with a resolution greater than 1.3 megapixels for image acquisition. Images are taken approximately every 5 min resulting in over 3,000 images, which are then analyzed using a software program developed in the Laboratory of Construction
27

Materials (LMC) at École Polytechnique Fédérale de Lausanne (EPFL) in Lausanne, Switzerland. This method determines the total water uptake by the hydrating cement paste and provides significant enhancement to the accuracy of chemical shrinkage results (Costoya 2008; Ideker 2008). Figure 4.11 shows typical chemical shrinkage results for a series of different cement pastes assessed with the automated image analysis system.
Figure 4.11: Typical chemical shrinkage results for OPC mixtures at 20 oC (Fu 2011)
Furthermore, a method developed by Peethamparan et al. (Peethamparan et al. 2010) to measure the chemical shrinkage of cementitious systems has been shown to be an effective alternative to ASTM C1608. The apparatus to measure the chemical shrinkage is shown in Figure 4.12.
28
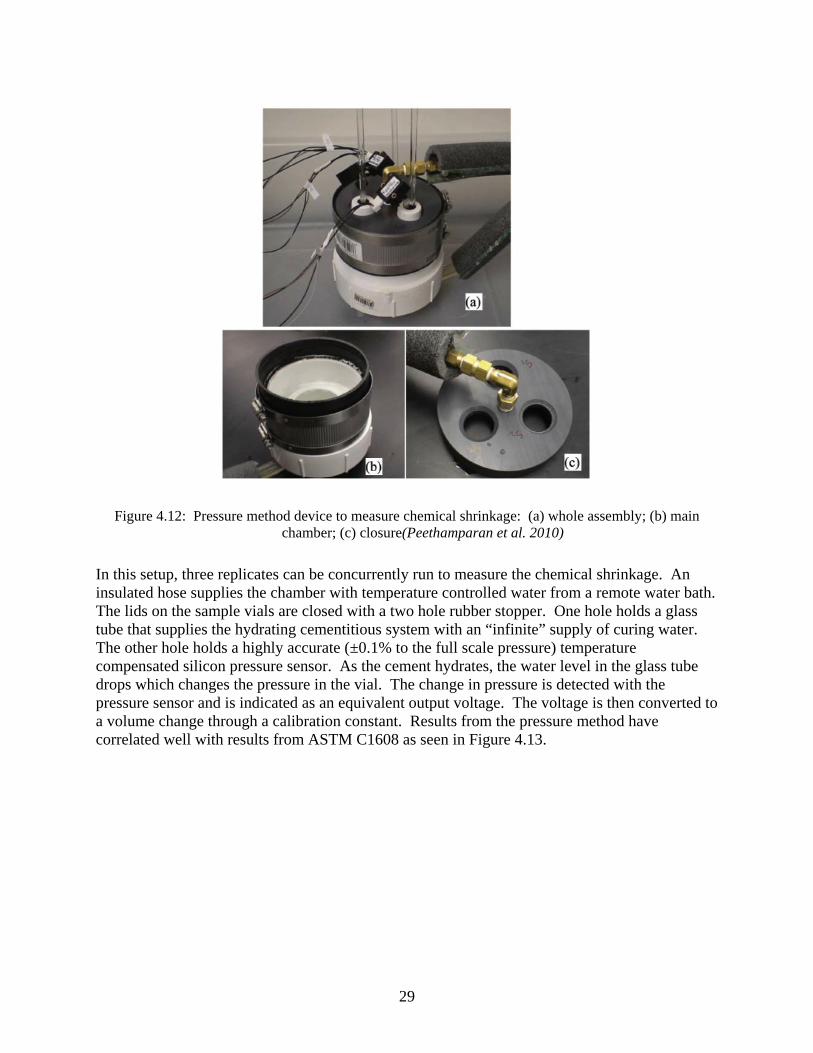
Figure 4.12: Pressure method device to measure chemical shrinkage: (a) whole assembly; (b) main chamber; (c) closure(Peethamparan et al. 2010)
In this setup, three replicates can be concurrently run to measure the chemical shrinkage. An insulated hose supplies the chamber with temperature controlled water from a remote water bath. The lids on the sample vials are closed with a two hole rubber stopper. One hole holds a glass tube that supplies the hydrating cementitious system with an “infinite” supply of curing water. The other hole holds a highly accurate (±0.1% to the full scale pressure) temperature compensated silicon pressure sensor. As the cement hydrates, the water level in the glass tube drops which changes the pressure in the vial. The change in pressure is detected with the pressure sensor and is indicated as an equivalent output voltage. The voltage is then converted to a volume change through a calibration constant. Results from the pressure method have correlated well with results from ASTM C1608 as seen in Figure 4.13.
29
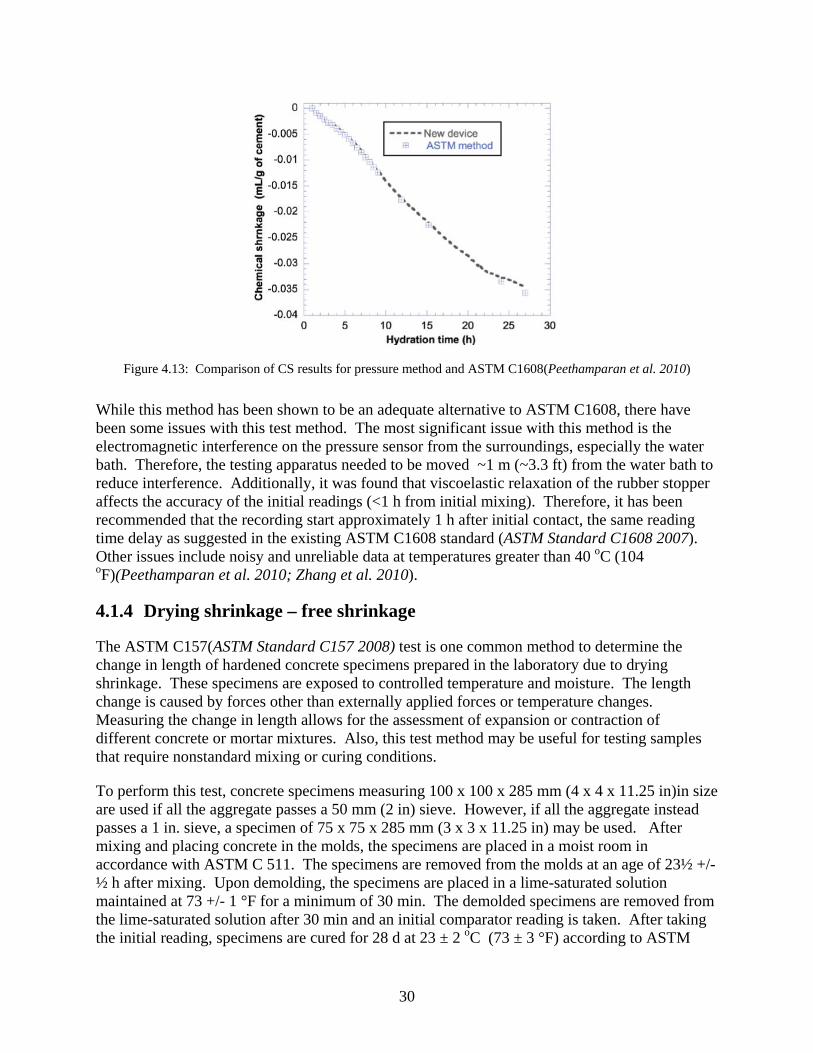
Figure 4.13: Comparison of CS results for pressure method and ASTM C1608(Peethamparan et al. 2010)
While this method has been shown to be an adequate alternative to ASTM C1608, there have been some issues with this test method. The most significant issue with this method is the electromagnetic interference on the pressure sensor from the surroundings, especially the water bath. Therefore, the testing apparatus needed to be moved ~1 m (~3.3 ft) from the water bath to reduce interference. Additionally, it was found that viscoelastic relaxation of the rubber stopper affects the accuracy of the initial readings (<1 h from initial mixing). Therefore, it has been recommended that the recording start approximately 1 h after initial contact, the same reading time delay as suggested in the existing ASTM C1608 standard (ASTM Standard C1608 2007). Other issues include noisy and unreliable data at temperatures greater than 40 oC (104 oF)(Peethamparan et al. 2010; Zhang et al. 2010).
4.1.4 Drying shrinkage – free shrinkage
The ASTM C157(ASTM Standard C157 2008) test is one common method to determine the change in length of hardened concrete specimens prepared in the laboratory due to drying shrinkage. These specimens are exposed to controlled temperature and moisture. The length change is caused by forces other than externally applied forces or temperature changes. Measuring the change in length allows for the assessment of expansion or contraction of different concrete or mortar mixtures. Also, this test method may be useful for testing samples that require nonstandard mixing or curing conditions.
To perform this test, concrete specimens measuring 100 x 100 x 285 mm (4 x 4 x 11.25 in)in size are used if all the aggregate passes a 50 mm (2 in) sieve. However, if all the aggregate instead passes a 1 in. sieve, a specimen of 75 x 75 x 285 mm (3 x 3 x 11.25 in) may be used. After mixing and placing concrete in the molds, the specimens are placed in a moist room in accordance with ASTM C 511. The specimens are removed from the molds at an age of 23½ +/- ½ h after mixing. Upon demolding, the specimens are placed in a lime-saturated solution maintained at 73 +/- 1 °F for a minimum of 30 min. The demolded specimens are removed from the lime-saturated solution after 30 min and an initial comparator reading is taken. After taking the initial reading, specimens are cured for 28 d at 23 ± 2 oC (73 ± 3 °F) according to ASTM
30
C511(ASTM Standard C511 2009). When curing has completed, the specimens are placed in a drying room that is maintained at 23 ± 2 oC (73 ± 3 °F) and at a relative humidity of 50 +/- 4 %. It is important to provide adequate spacing to allow even drying. The spacing requirement recommended by the ASTM standard is a minimum of 25.4 mm (1 in) on all sides of the specimen. Comparator readings should take place at 4, 7, 14, and 28 d, and after 8, 16, 32, and 64 weeks. The length change of the specimen is given by the following equation:
ΔLx = CRD – initial CRD x 100 Equation 4 G
Where: ΔLx = length change of a specimen at any age, %;
CRD = difference between the comparator reading of the
specimen and the reference bar at any age;
G = gage length (250 mm [10 in])
This test is effective for the determination of free shrinkage of concretes with a high w/cm ratio, but problems can arise when testing concrete with a w/cm < 0.42 (Aitcin 1998). The problems can be attributed to the self-desiccation of the cement paste. In return, the self-desiccation leads to autogenous shrinkage that develops in the first 24 h before the specimen has been demolded (Sant et al. 2006). Since autogenous deformation is a cement paste phenomena, different studies need to be performed to quantify the amount of deformation that occurs in early ages in high performance concrete. The amount of autogenous shrinkage should be accounted for in using the ASTM C157 test method on high performance concretes. Methods to determine autogenous deformation are outlined in section 4.1.2.
Modifications to this test method have been shown to effectively measure the effects of autogenous deformation after concrete specimens have been demolded (Schlitter et al. 2010). Samples are cast according to ASTM C192 and then demolded at 24 h. Upon demolding, the specimen is then taped with a waterproof, aluminum tape on all sides to eliminate moisture movement. While this test method is effective at measuring autogenous deformation after the concrete has hardened, it is missing the initial autogenous deformation that is occurring in the paste during the first 24 h. Therefore, other methods must be used to determine the total amount of autogenous deformation.
Modifications to ASTM C157 were made in order to account for a reduced external wet cure. The curing duration performed in this research was 1-, 3-, 7- and 14-day external wet cure. Concrete prisms were cast according to ASTM C192 (ASTM Standard C192 2007)and ASTM C157(ASTM Standard C157 2008). The specimens were covered with wet burlap and wrapped with plastic sheeting and allowed to cure for 24 h before being removed from their respective molds. Upon removal from the molds, three concrete prisms were placed in a drying environment of 23 ± 2 oC (73 ± 3oF) and 50 ± 4% RH and the initial mass and length were recorded. The other prisms were wet cured in a 100% RH curing room, and allowed to cure for either 3-, 7- or 14-d. After the specified curing duration, three concrete prisms were transferred to the drying environment and an initial measurement for mass and length were recorded. Mass
31
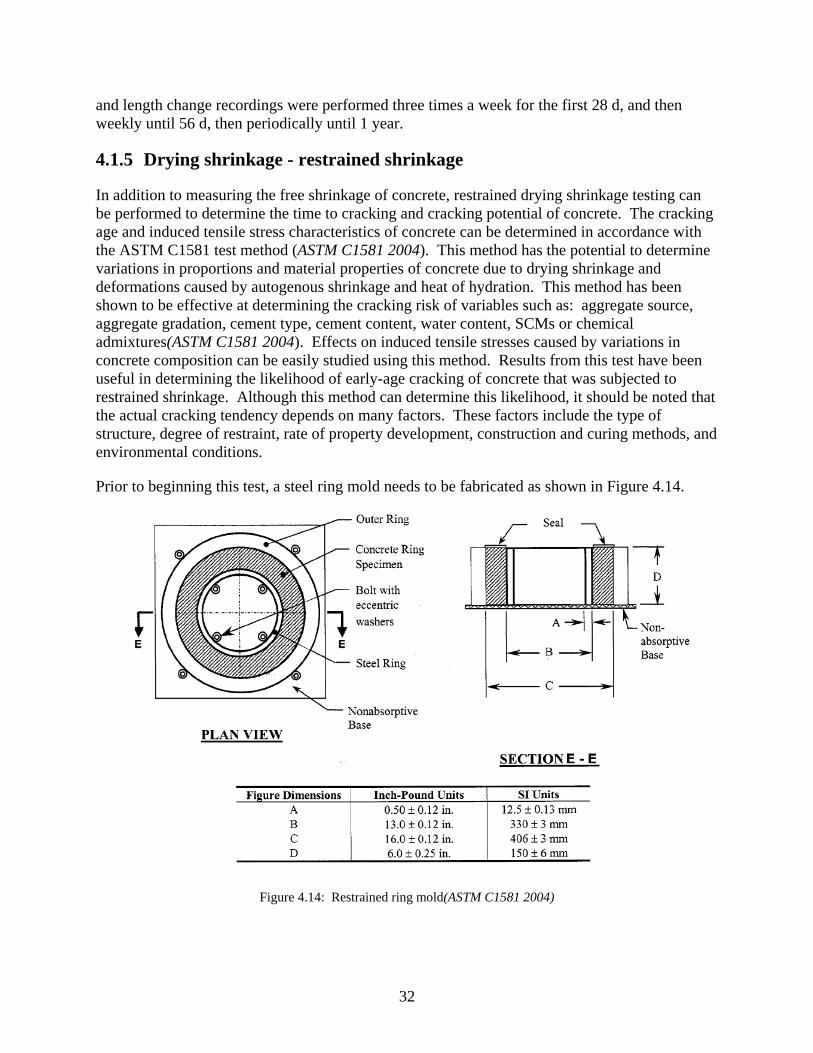
and length change recordings were performed three times a week for the first 28 d, and then weekly until 56 d, then periodically until 1 year.
4.1.5 Drying shrinkage - restrained shrinkage
In addition to measuring the free shrinkage of concrete, restrained drying shrinkage testing can be performed to determine the time to cracking and cracking potential of concrete. The cracking age and induced tensile stress characteristics of concrete can be determined in accordance with the ASTM C1581 test method (ASTM C1581 2004). This method has the potential to determine variations in proportions and material properties of concrete due to drying shrinkage and deformations caused by autogenous shrinkage and heat of hydration. This method has been shown to be effective at determining the cracking risk of variables such as: aggregate source, aggregate gradation, cement type, cement content, water content, SCMs or chemical admixtures(ASTM C1581 2004). Effects on induced tensile stresses caused by variations in concrete composition can be easily studied using this method. Results from this test have been useful in determining the likelihood of early-age cracking of concrete that was subjected to restrained shrinkage. Although this method can determine this likelihood, it should be noted that the actual cracking tendency depends on many factors. These factors include the type of structure, degree of restraint, rate of property development, construction and curing methods, and environmental conditions.
Prior to beginning this test, a steel ring mold needs to be fabricated as shown in Figure 4.14.
Figure 4.14: Restrained ring mold(ASTM C1581 2004)
32
After fabrication, two strain gages are mounted on the interior surface of the steel ring. The gages are placed diametrically opposite of each other and oriented to measure in the circumferential direction. The outer ring and inner steel ring are secured to the base by tightening the bolts with eccentric washers. Prior to placing the concrete in the molds, a releasing agent is applied to the inner and outer rings.
Mixing of the fresh concrete conforms to ASTM C192(ASTM Standard C192 2007) and the mixed concrete is placed in the molds in two layers. Before placing the subsequent layer, the concrete is rodded 75 times with a 9.5 mm (⅜-in) diameter rod, and vibrated on a vibrating table to ensure adequate consolidation. The same procedures for the second layer should follow the placement of the first. After all the concrete is in the molds, spilled concrete should be removed. After casting, the specimens are moved to the curing environment within 10 min of final casting. All bolts and washers are loosened and strain gage wires connected prior to curing. Strain measurement intervals are not to exceed 30 min. To ensure adequate curing, the specimens are wrapped in wet burlap and polyethylene film for 24 h. After the initial 24 h curing period, the outer ring is removed. If additional curing is required, re-wrap the specimens with wet burlap and continue the curing process. Once the specified curing duration is complete, the top of the specimen is sealed with either molten paraffin wax or adhesive aluminum foil tape. The continuation of strain monitoring should occur until the specimens have cracked. A sudden decrease in strain (~30 µε) recorded by the strain gages indicates the ring has cracked.
Determining the time to cracking and strength of the concrete at cracking is important for durability issues. Once the concrete cracks, a fast-path for aggressive agents such as chloride ions, moisture, air and/or freezing water is established that can further exacerbate the deterioration of the concrete. Research has shown that with the addition of SRAs to typical concrete bridge deck mixtures, the time to cracking is prolonged. Research performed by Folliard et al. (Folliard et al. 2003) showed that the addition of SRAs to HPC mixtures greatly prolongs the time to cracking. It was found that the control mixture had an average time to cracking of 39 d, whereas the mixture incorporating SRA had no cracking at an age of 590+ d. Testing by Qiao and co-workers (Qiao et al. 2010) showed that cracking had not occurred at 28 d in mixtures incorporating SRAs. Additionally, restrained shrinkage performed on high-performance mortars with w/cm = 0.30 that incorporated pre-soaked FLWA indicated that with the addition of more FLWA, the time to cracking was reduced. In fact, with a replacement level of 33.0% of normal weight sand with pre-soaked FLWA, no cracking was observed up to 14 d of monitoring (Schlitter et al. 2010).
Restrained shrinkage testing was performed on selected HPC mixtures. Concrete was mixed according to ASTM C192 (ASTM Standard C192 2007) and cast according to ASTM C1581 (ASTM C1581 2004). A 16 in. concrete ring (outer diameter) with a thickness of 1.5 in. was cast around a 0.5 in. thick steel ring with an outer diameter of 13 in. The height of the rings used was 6 in. Minor modifications to ASTM C1581 were made on the testing apparatus. Four strain gages were mounted 90o apart and placed at mid-height on the steel ring; instead of the specified two diametrically opposed gages. Three different mixtures were cast, and three replicates of each mixture were performed. Upon finishing the specimens, the strain gages were connected to a data acquisition system and the specimens were wrapped in wet burlap and covered with plastic sheeting. The strain was recorded at 5 min intervals throughout the testing. At 24 h of age, the outer PVC ring was removed and the specimens were wrapped in wet burlap
33
and covered with plastic sheeting until the specified curing duration had been achieved. The burlap was re-wetted with water using an agricultural type sprayer every 48 h to provide adequate moisture for external curing. Upon removal of the burlap, the top of the concrete was sealed using a flexible, waterproof sealant to allow drying to only occur circumferentially. Additionally, match-cured cylinders were cast to determine the corresponding mechanical properties at the time of cracking. The cylinders were demolded at 24 h from initial contact, and placed in a 100% RH curing environment. When the burlap on the restrained rings was removed, cylinders were moved from their curing environment to the drying environment. Testing of the concrete cylinders occurred when at least two of the three rings cracked. Additional specimens were cured in 100% RH for 28 d and tested for mechanical properties.
4.1.6 Chloride ingress
Two test methods have been developed to determine the chloride penetrability of concrete. In the American Association of State Highway and Transportation Officials (AASHTO) T259 standard, a concrete slab is cast and is ponded with a salt solution. The depth of chloride penetration is measured at 90 d (AASHTO 2002). While this test provides the most accurate representation of the concrete’s penetrability, the test takes 90 d to run. A more rapid test method to determine the permeability of concrete was developed. ASTM C1202 (ASTM Standard C1202 2010) measures the electrical conductance of the concrete, and correlates to results from AASHTO T259. Testing in this research implemented ASTM C1202 to determine the rapid chloride permeablity of concrete specimens and is discussed below.
4.1.6.1 ASTM C1202
One method to determine concrete’s ability to resist chloride ion penetration is the ASTM C1202 test method (ASTM Standard C1202 2010). This rapid test method determines the electrical conductance of concrete to determine the ability of concrete to resist the penetration of chlorides. A constant potential difference of 60 V is applied to the ends of the specimen. One end is immersed in a 3% sodium chloride solution, while the other end is immersed in a 0.3 N sodium hydroxide solution. The total charge passed through a 50 mm (2-in) thick, 100 mm (4-in) diameter piece of concrete during a 6 h period provides an indication of the permeability. Additionally, the sample age may have a significant effect on the results. Typically, in most concrete, the permeability value becomes less if the sample is properly cured.
Test samples are cast in accordance with ASTM C192 (ASTM Standard C192 2007), or drilled cores may be taken according to ASTM C42 (ASTM Standard C42 2012). At the desired duration of curing, 50 mm (2-in) thick slices of concrete are cut using a water-cooled diamond saw or silicon carbide saw, and the specimens are conditioned for testing. The specimens are allowed to air dry for at least 1 h before sealing it by applying a rapid setting coating on the sides of the specimen. After the sealant has set, the specimen is placed in a vacuum dessicator with both ends exposed. Once the specimens are in the desiccator, a vacuum pump is started, and a pressure of less than 1 mm (0.039 in) Hg should be achieved and maintained for 3 h. While the vacuum pump is still running, de-aerated water is introduced through a stopcock. Once the specimens are submerged, the stopcock is closed, and the vacuum is applied for 1 more h. At the end of
34
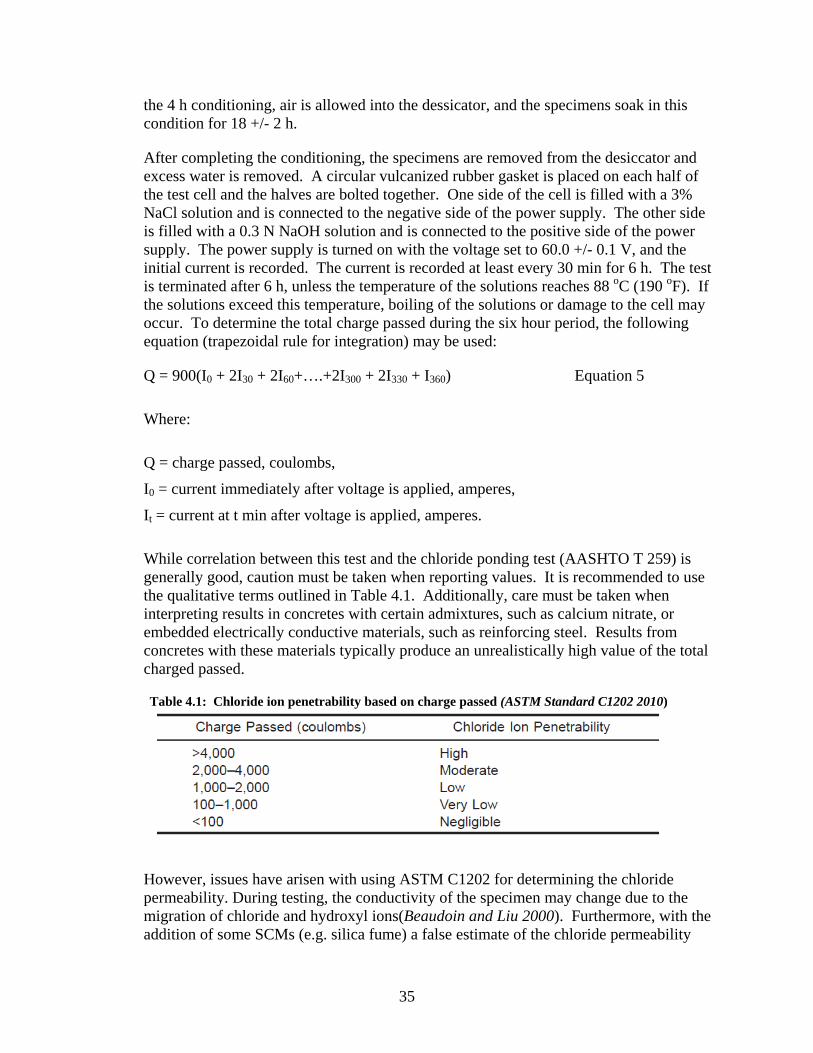
the 4 h conditioning, air is allowed into the dessicator, and the specimens soak in this condition for 18 +/- 2 h.
After completing the conditioning, the specimens are removed from the desiccator and excess water is removed. A circular vulcanized rubber gasket is placed on each half of the test cell and the halves are bolted together. One side of the cell is filled with a 3% NaCl solution and is connected to the negative side of the power supply. The other side is filled with a 0.3 N NaOH solution and is connected to the positive side of the power supply. The power supply is turned on with the voltage set to 60.0 +/- 0.1 V, and the initial current is recorded. The current is recorded at least every 30 min for 6 h. The test is terminated after 6 h, unless the temperature of the solutions reaches 88 oC (190 oF). If the solutions exceed this temperature, boiling of the solutions or damage to the cell may occur. To determine the total charge passed during the six hour period, the following equation (trapezoidal rule for integration) may be used:
Q = 900(I0 + 2I30 + 2I60+….+2I300 + 2I330 + I360) Equation 5
Where:
Q = charge passed, coulombs,
I0 = current immediately after voltage is applied, amperes,
It = current at t min after voltage is applied, amperes.
While correlation between this test and the chloride ponding test (AASHTO T 259) is generally good, caution must be taken when reporting values. It is recommended to use the qualitative terms outlined in Table 4.1. Additionally, care must be taken when interpreting results in concretes with certain admixtures, such as calcium nitrate, or embedded electrically conductive materials, such as reinforcing steel. Results from concretes with these materials typically produce an unrealistically high value of the total charged passed.
Table 4.1: Chloride ion penetrability based on charge passed (ASTM Standard C1202 2010)
However, issues have arisen with using ASTM C1202 for determining the chloride permeability. During testing, the conductivity of the specimen may change due to the migration of chloride and hydroxyl ions(Beaudoin and Liu 2000). Furthermore, with the addition of some SCMs (e.g. silica fume) a false estimate of the chloride permeability
35
may result(Feldman et al. 1999). In mixtures that have low porosity, overheating of the specimens may occur, causing the test to be ended prematurely (Adam 2009). Although there is dispute to the accuracy of this test method, it is the acceptable test method for chloride permeability according to ODOT(ODOT 2008).
The ability for the HPC used in this research to resist chloride penetration was determined using the rapid chloride permeability test (RCPT) according to ASTM C1202 (ASTM Standard C1202 2010). Cylindrical concrete specimens were demolded at 24 h and placed in a 100% RH curing environment. The specimens were wet cured for 56 and 90 d prior to testing. Furthermore, a small study was performed on the same mixtures with different air contents to determine the effect of air content on chloride permeability of concretes made with pre-soaked FLWA.
4.1.7 Freeze-thaw
ASTM C666 (ASTM Standard C666 2003) is used to determine the resistance of concrete to freezing and thawing cycles,. This test method can be performed in two different ways. In Procedure A, the concrete is subjected to rapid freezing and thawing in water. In Procedure B, the concrete is subjected to rapid freezing in air and rapid thawing in water. These two procedures both determine the effects of variations in proportions, curing and soundness of the aggregates. The low temperature of the freeze cycle is -17.8 oC (0 oF) and the target thaw temperature is 4.4 oC (40 oF).
Test specimens are cast according to ASTM C192 (ASTM Standard C192 2007), and demolded at an age of 24 +/- ½ h after initial contact of cement and water. Cored samples may also be taken in accordance with ASTM C42 (ASTM Standard C42 2012). The specimens are then allowed to cure for a minimum of 14 d unless specified otherwise. The additional curing duration may be needed to allow mixtures incorporating SCMs to develop an adequate strength prior to testing. Upon completion of curing, the specimens are cooled to a temperature within -1 oC (-2 oF) and +2 oC (+4 oF) of the target thaw temperature. The specimens are protected from moisture loss during the cooling until the freeze-thaw testing begins. Prior to the initial cycle, the mass and initial fundamental transverse frequency are measured. ASTM C215 (ASTM Standard C215 2008)outlines the procedures for determining the fundamental transverse frequency. Once freeze-thaw cycles have begun, the specimens are tested for fundamental transverse frequency and the mass recorded during the thawed condition. These parameters need to be tested at intervals not exceeding 36 cycles. The specimens are placed back in the chamber either randomly or in a predetermined rotation to ensure that the specimens are subjected to all conditions throughout the chamber. The test is continued until the specimens have been subjected to either 300 cycles or their relative dynamic modulus has reached 60% of the initial modulus. The relative dynamic modulus can be calculated as follows:
Pc = (n12/n2) x 100 Equation 6
Where:
Pc = relative dynamic modulus, after c cycles of freezing and thawing, percent,
36
n = fundamental transverse frequency at 0 cycles of freezing and thawing,
n1 = fundamental transverse frequency after c cycles of freezing and thawing.
ASTM C666 (ASTM Standard C666 2003) Method A, rapid freezing and thawing in water, was used to test the ability of the concrete to resist freezing and thawing cycles. The specimens were allowed to cure for 28 d prior to testing. A longer curing duration was selected to allow for the concrete to gain adequate strength, e.g. 34.4 MPa (5000 psi), due to the high amount of supplementary cementitious materials (SCMs) used as a replacement for portland cement (34% replacement) with class F fly ash as a 30% replacement and silica fume as 4% replacement. The specimens tested were 76 mm x 102 mm x 406 mm (3”x4”x16”). Prior to placing the specimens in the freeze-thaw chamber, they were cooled to within 1 oC (1.8 oF) of the thaw temperature of 4.4 oC (40 oF). The initial mass and transverse frequencies were recorded prior to being subjected to freezing and thawing at a rate of 4 cycles per day. The temperature cycled from -17.8 to 4.4 oC (0 to 40 oF). The transverse frequency was measured according to ASTM C215 (ASTM Standard C215 2008). Testing of the concrete specimens was performed approximately every 36 cycles. Testing occurred until either failure or until 300 cycles of freezing/thawing were reached.
All mixtures, including those incorporating FLWA, were tested under the same curing conditions as the mixtures that did not have FLWA. ASTM C330 (ASTM Standard C330 2009) specifies wet curing for 14 d, but in this research, all specimens were tested with a 28 d wet cure prior to freeze-thaw testing. This provided a worst case scenario for the mixtures incorporating the pre-soaked FLWA due to the aggregates potentially having internally absorbed water. According to ASTM C330, after the curing duration of 14 d, the concrete specimens are moved to a drying environment at 23 oC (73 oF) and 50% RH for 14 d, and prior to testing the specimens are soaked for 24 h prior to testing.
4.1.8 Mechanical properties
The mechanical properties of all of the HPC mixtures were tested. Concrete cylinders were cast according to ASTM C192 (ASTM Standard C192 2007) and allowed to cure for 24 ± ½ h before being removed from the molds. After removing the concrete specimens from their molds, they were placed in a 100% RH curing room. For compressive strength tests, three cylinders were each tested according to ASTM C39 (ASTM Standard C39 2009) at 7 and 28 d. Modulus of elasticity tests were performed according to ASTM C469 (ASTM Standard C469 2002) on two cylinders at 28 d. Two cylinders were tested for splitting tensile strength according to ASTM C496 (ASTM Standard C496 2004) at 7 d and 28 d.
4.2 MATERIAL DESCRIPTIONS
4.2.1 Aggregates
A local siliceous river gravel, with a maximum nominal size of 3/4 in, was used as the coarse aggregate, and a local natural siliceous sand was used as the normal weight, fine aggregate in all mixtures. Four different sources of FLWA were initially studied to determine their absorption capacity and desorption rate. However, only two sources were chosen for further testing. All
37
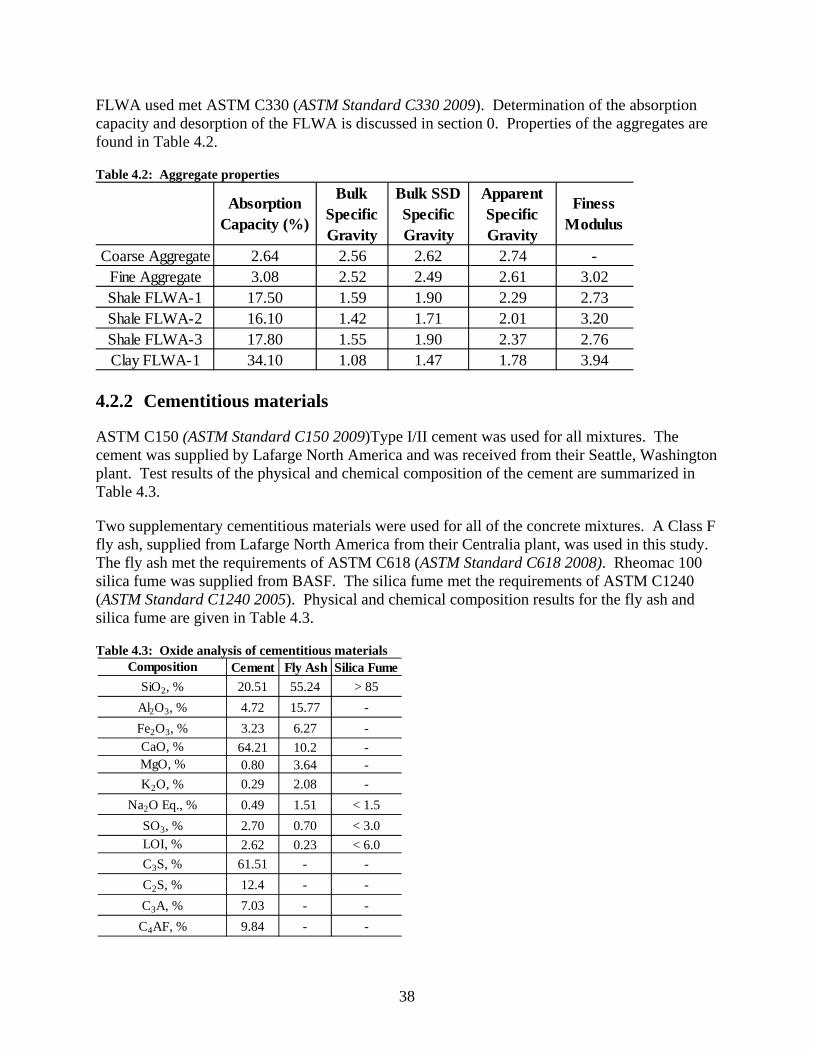
FLWA used met ASTM C330 (ASTM Standard C330 2009). Determination of the absorption capacity and desorption of the FLWA is discussed in section 0. Properties of the aggregates are found in Table 4.2.
Table 4.2: Aggregate properties
4.2.2 Cementitious materials
ASTM C150 (ASTM Standard C150 2009)Type I/II cement was used for all mixtures. The cement was supplied by Lafarge North America and was received from their Seattle, Washington plant. Test results of the physical and chemical composition of the cement are summarized in Table 4.3.
Two supplementary cementitious materials were used for all of the concrete mixtures. A Class F fly ash, supplied from Lafarge North America from their Centralia plant, was used in this study. The fly ash met the requirements of ASTM C618 (ASTM Standard C618 2008). Rheomac 100 silica fume was supplied from BASF. The silica fume met the requirements of ASTM C1240 (ASTM Standard C1240 2005). Physical and chemical composition results for the fly ash and silica fume are given in Table 4.3.
Table 4.3: Oxide analysis of cementitious materials
Absorption Capacity (%)
Bulk Specific Gravity
Bulk SSD Specific Gravity
Apparent Specific Gravity
Finess Modulus
Coarse Aggregate 2.64 2.56 2.62 2.74 -Fine Aggregate 3.08 2.52 2.49 2.61 3.02Shale FLWA-1 17.50 1.59 1.90 2.29 2.73Shale FLWA-2 16.10 1.42 1.71 2.01 3.20Shale FLWA-3 17.80 1.55 1.90 2.37 2.76Clay FLWA-1 34.10 1.08 1.47 1.78 3.94
Cement Fly Ash Silica Fume20.51 55.24 > 854.72 15.77 -3.23 6.27 -
64.21 10.2 -0.80 3.64 -0.29 2.08 -0.49 1.51 < 1.52.70 0.70 < 3.02.62 0.23 < 6.0
61.51 - -12.4 - -7.03 - -9.84 - -
C3A, %C4AF, %
K2O, %Na2O Eq., %
SO3, %LOI, %C3S, %C2S, %
CompositionSiO2, %
Al2O3, %Fe2O3, %CaO, %MgO, %
38

4.2.3 Chemical admixtures
An ASTM C494 (ASTM Standard C494 2010) Type F polycarboxolate-based high-range water reducing admixture (HRWRA) supplied by Grace Construction Products was used to improve workability in all of the mixtures. Dosage rates of the HRWRAvaried in order to produce similar workabilities in the fresh concrete. An air-entraining admixture supplied by Grace Construction Products was also added to achieve a target air content of 6 ± 1% for all concrete mixtures. Additionally, an SRA supplied by Grace Construction Products was used in certain concrete mixtures. The SRA was added at 2% of the total cementitious material by mass, replacing an equal amount of water that was contributed by the SRA.
Concrete mixture design Table 4.4 shows the mixture proportions used in this study. All mixtures had a w/cm of 0.37. Each mixture was proportioned with 633 lb/yd3 of cementitious material. The fly ash used for the mixture design was a 30% replacement of cement by mass, and the silica fume was a 4% replacement of cement by mass. For mixtures HPC w/ Clay-1 and HPC w/ Shale-1, chemical shrinkage values of 0.056 ml/g were used in equation 1(Bentz et al. 2005) to get replacement levels of normal weight fine aggregate with FLWA of 9% and 20% respectively. For mixtures HPC w/ Clay-2, HPC w/ Shale-2, and HPC w/ Shale+SRA, a chemical shrinkage value of 0.07 ml/g was used in equation 1 to get replacement levels of normal weight fine aggregate with FLWA of 12%, 25%, and 25% respectively. For mixture HPC w/ Shale-3, 100% of the normal weight fine aggregate was replaced with FLWA. A detailed discussion on determining the proper CS value for us in equation 1 can be found in section 5.3. Table 4.4: Concrete mixture designs
Name and description
HPC control
HPC w/ SRA
HPC w/ Clay-1
HPC w/ Clay-2
HPC w/ Shale-1
HPC w/ Shale-2
HPC w/ Shale-3
HPC w/ Shale+SRA
Cement, lb/yd3 419 419 419 419 419 419 419 419
Fly Ash, lb/yd3 189 189 189 189 189 189 189 189Silica Fume,
lb/yd3 25 25 25 25 25 25 25 25
Water, lb/yd3 234 221 234 234 234 234 234 221Coarse
Aggregate, lb/yd3
1810 1810 1810 1810 1810 1810 1810 1810
Fine Aggregate, lb/yd3 1110 1110 872 812 761 674 - 674
FLWA, lb/yd3 - - 104 130 222 277 785 277
SRA, lb/yd3 - 12.70 - - - - - 12.70AE, fl oz/cwt 0.55 1.08 0.55 0.55 0.55 0.55 0.55 1.08
HRWR, fl oz/cwt
8.10 9.30 8.10 8.10 8.10 8.10 8.10 9.30
% replacement of FLWA
- - 9% 12% 20% 25% 100% 25%
39

40
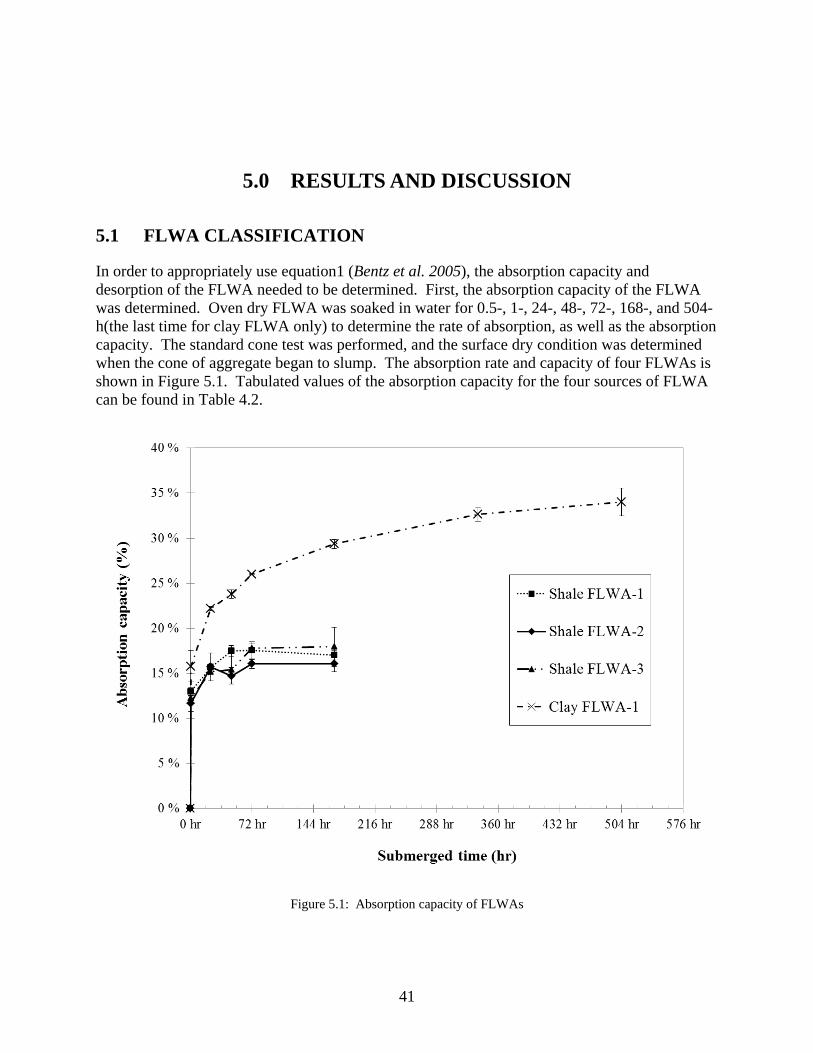
5.0 RESULTS AND DISCUSSION
5.1 FLWA CLASSIFICATION
In order to appropriately use equation1 (Bentz et al. 2005), the absorption capacity and desorption of the FLWA needed to be determined. First, the absorption capacity of the FLWA was determined. Oven dry FLWA was soaked in water for 0.5-, 1-, 24-, 48-, 72-, 168-, and 504-h(the last time for clay FLWA only) to determine the rate of absorption, as well as the absorption capacity. The standard cone test was performed, and the surface dry condition was determined when the cone of aggregate began to slump. The absorption rate and capacity of four FLWAs is shown in Figure 5.1. Tabulated values of the absorption capacity for the four sources of FLWA can be found in Table 4.2.
Figure 5.1: Absorption capacity of FLWAs
41
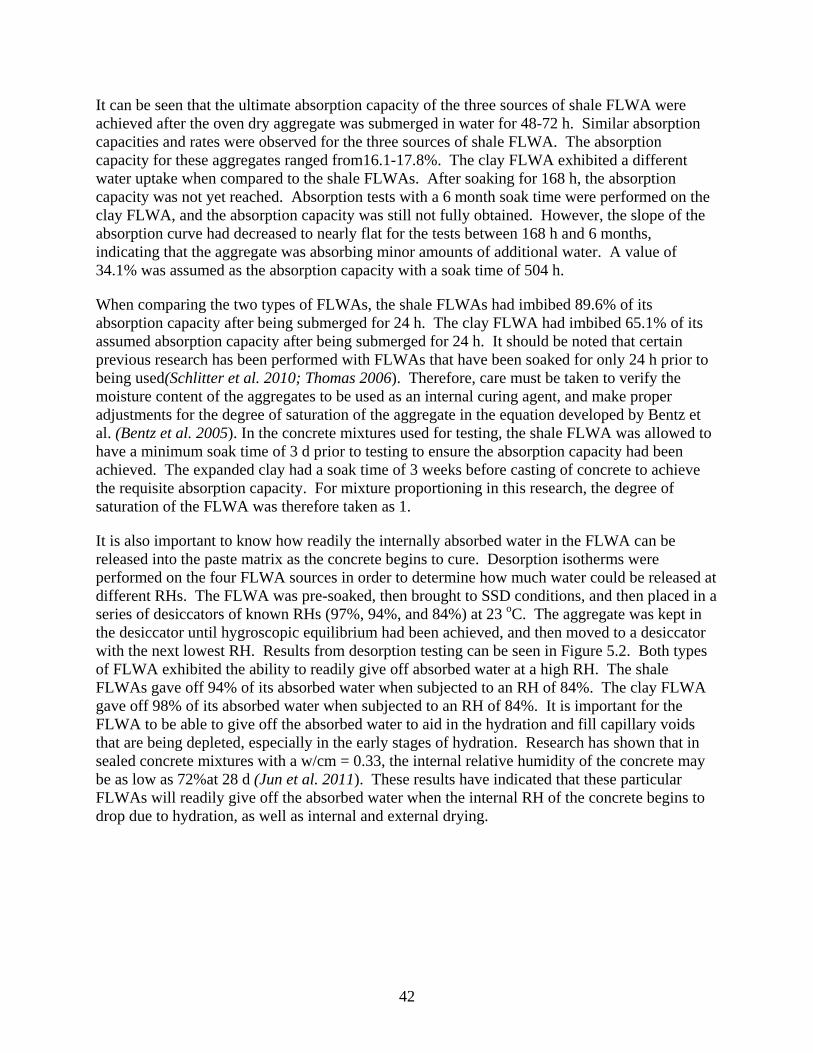
It can be seen that the ultimate absorption capacity of the three sources of shale FLWA were achieved after the oven dry aggregate was submerged in water for 48-72 h. Similar absorption capacities and rates were observed for the three sources of shale FLWA. The absorption capacity for these aggregates ranged from16.1-17.8%. The clay FLWA exhibited a different water uptake when compared to the shale FLWAs. After soaking for 168 h, the absorption capacity was not yet reached. Absorption tests with a 6 month soak time were performed on the clay FLWA, and the absorption capacity was still not fully obtained. However, the slope of the absorption curve had decreased to nearly flat for the tests between 168 h and 6 months, indicating that the aggregate was absorbing minor amounts of additional water. A value of 34.1% was assumed as the absorption capacity with a soak time of 504 h.
When comparing the two types of FLWAs, the shale FLWAs had imbibed 89.6% of its absorption capacity after being submerged for 24 h. The clay FLWA had imbibed 65.1% of its assumed absorption capacity after being submerged for 24 h. It should be noted that certain previous research has been performed with FLWAs that have been soaked for only 24 h prior to being used(Schlitter et al. 2010; Thomas 2006). Therefore, care must be taken to verify the moisture content of the aggregates to be used as an internal curing agent, and make proper adjustments for the degree of saturation of the aggregate in the equation developed by Bentz et al. (Bentz et al. 2005). In the concrete mixtures used for testing, the shale FLWA was allowed to have a minimum soak time of 3 d prior to testing to ensure the absorption capacity had been achieved. The expanded clay had a soak time of 3 weeks before casting of concrete to achieve the requisite absorption capacity. For mixture proportioning in this research, the degree of saturation of the FLWA was therefore taken as 1.
It is also important to know how readily the internally absorbed water in the FLWA can be released into the paste matrix as the concrete begins to cure. Desorption isotherms were performed on the four FLWA sources in order to determine how much water could be released at different RHs. The FLWA was pre-soaked, then brought to SSD conditions, and then placed in a series of desiccators of known RHs (97%, 94%, and 84%) at 23 oC. The aggregate was kept in the desiccator until hygroscopic equilibrium had been achieved, and then moved to a desiccator with the next lowest RH. Results from desorption testing can be seen in Figure 5.2. Both types of FLWA exhibited the ability to readily give off absorbed water at a high RH. The shale FLWAs gave off 94% of its absorbed water when subjected to an RH of 84%. The clay FLWA gave off 98% of its absorbed water when subjected to an RH of 84%. It is important for the FLWA to be able to give off the absorbed water to aid in the hydration and fill capillary voids that are being depleted, especially in the early stages of hydration. Research has shown that in sealed concrete mixtures with a w/cm = 0.33, the internal relative humidity of the concrete may be as low as 72%at 28 d (Jun et al. 2011). These results have indicated that these particular FLWAs will readily give off the absorbed water when the internal RH of the concrete begins to drop due to hydration, as well as internal and external drying.
42
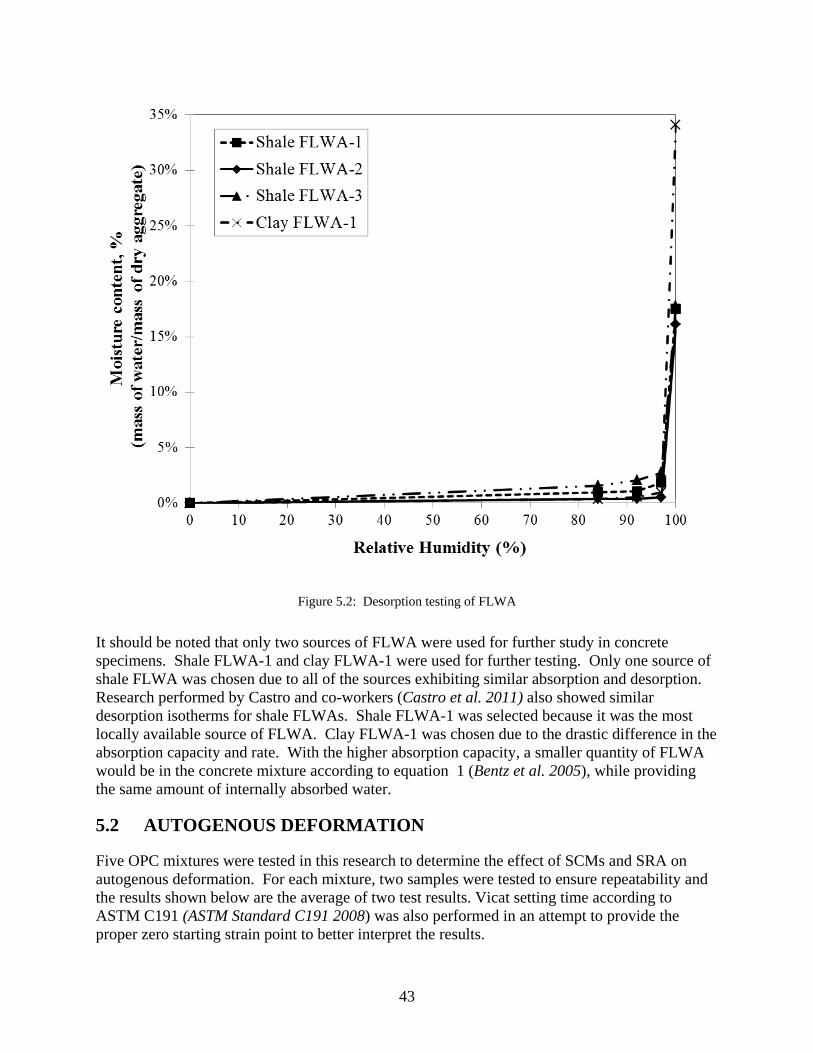
Figure 5.2: Desorption testing of FLWA
It should be noted that only two sources of FLWA were used for further study in concrete specimens. Shale FLWA-1 and clay FLWA-1 were used for further testing. Only one source of shale FLWA was chosen due to all of the sources exhibiting similar absorption and desorption. Research performed by Castro and co-workers (Castro et al. 2011) also showed similar desorption isotherms for shale FLWAs. Shale FLWA-1 was selected because it was the most locally available source of FLWA. Clay FLWA-1 was chosen due to the drastic difference in the absorption capacity and rate. With the higher absorption capacity, a smaller quantity of FLWA would be in the concrete mixture according to equation 1 (Bentz et al. 2005), while providing the same amount of internally absorbed water.
5.2 AUTOGENOUS DEFORMATION
Five OPC mixtures were tested in this research to determine the effect of SCMs and SRA on autogenous deformation. For each mixture, two samples were tested to ensure repeatability and the results shown below are the average of two test results. Vicat setting time according to ASTM C191 (ASTM Standard C191 2008) was also performed in an attempt to provide the proper zero starting strain point to better interpret the results.
43
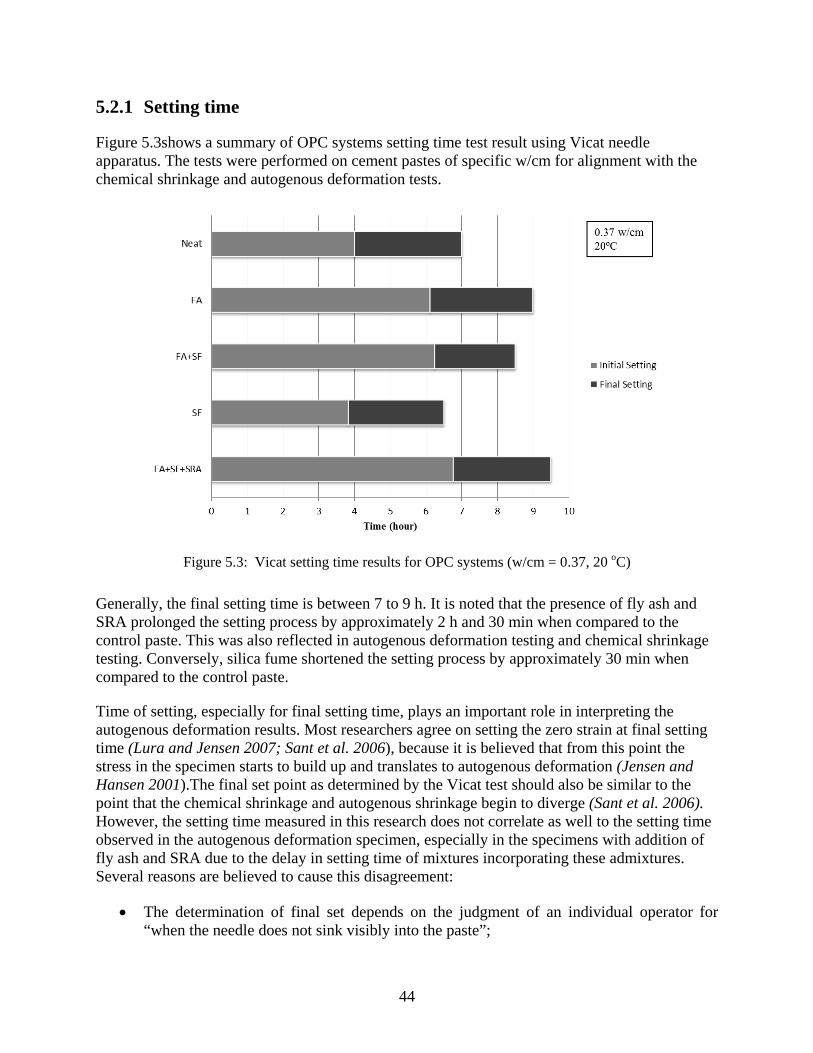
5.2.1 Setting time
Figure 5.3shows a summary of OPC systems setting time test result using Vicat needle apparatus. The tests were performed on cement pastes of specific w/cm for alignment with the chemical shrinkage and autogenous deformation tests.
Figure 5.3: Vicat setting time results for OPC systems (w/cm = 0.37, 20 oC)
Generally, the final setting time is between 7 to 9 h. It is noted that the presence of fly ash and SRA prolonged the setting process by approximately 2 h and 30 min when compared to the control paste. This was also reflected in autogenous deformation testing and chemical shrinkage testing. Conversely, silica fume shortened the setting process by approximately 30 min when compared to the control paste.
Time of setting, especially for final setting time, plays an important role in interpreting the autogenous deformation results. Most researchers agree on setting the zero strain at final setting time (Lura and Jensen 2007; Sant et al. 2006), because it is believed that from this point the stress in the specimen starts to build up and translates to autogenous deformation (Jensen and Hansen 2001).The final set point as determined by the Vicat test should also be similar to the point that the chemical shrinkage and autogenous shrinkage begin to diverge (Sant et al. 2006). However, the setting time measured in this research does not correlate as well to the setting time observed in the autogenous deformation specimen, especially in the specimens with addition of fly ash and SRA due to the delay in setting time of mixtures incorporating these admixtures. Several reasons are believed to cause this disagreement:
• The determination of final set depends on the judgment of an individual operator for“when the needle does not sink visibly into the paste”;
44
• During the Vicat test, moisture loss during testing is inevitable and drying at the surfaceof the setting time sample might reduce the setting time, and;
• As a destructive test method, the Vicat test measures setting time by intruding the needleinto the paste repeatedly.This might cause a difference from the pastes in autogenoussample which remain unspoiled. A non-destructive Vicat test was proposed recently(Sleiman et al. 2010). Incorporation of this testing is beyond the scope of this research.
5.2.2 Autogenous deformation – Effect of SCMs
In this research, two SCMs, a Class F fly ash and silica fume, were replaced for OPC at mass percentages of 30% and 4%, respectively. Figure 5.4shows the results of paste samples(0.37 w/cm)incorporating different SCMs at 20 °C isothermal.
Figure 5.4: Effect of SCMs on autogenous deformation (w/cm = 0.37 w/cm, 20 oC)
It was observed that the autogenous shrinkage increased significantly with the presence of silica fume. In general, silica fume increases the water demand in a concrete mixture and contributes to a stiffened and sticky consistency of the concrete mixture (Thomas et al. 2002). This is because the surface area of silica fume particles is nominally 50 times larger than cement particles. This also causes an increased capillary tension in the paste matrix. The silica fume particles are also much finer (Φ<0.1μm) than cement and other SCMs; therefore, much smaller pores are created in mixtures with silica fume. As discussed previously, pores with a radius less than 50 nm can have a tensile stress develop due to a full collapse of the pore or partial emptying of the pore that generates menisci as the pore solution leaves during hydration to hydrate adjacent cement grains. Therefore, more autogenous shrinkage was observed. This was also reported by several other researchers (Jensen and Hansen 1996; Lura and Jensen 2005; Slatnick et al. 2011).
-2000
-1500
-1000
-500
0
500
1000
1500
2000
2500
3000
0 5 10 15 20 25 30 35 40 45 50
Aut
ogen
ous D
efor
mat
ion
(μm
/m)
Time (hours)
Neat
SF
FA
SF+FAFA
Neat
SF
SF+FA
45
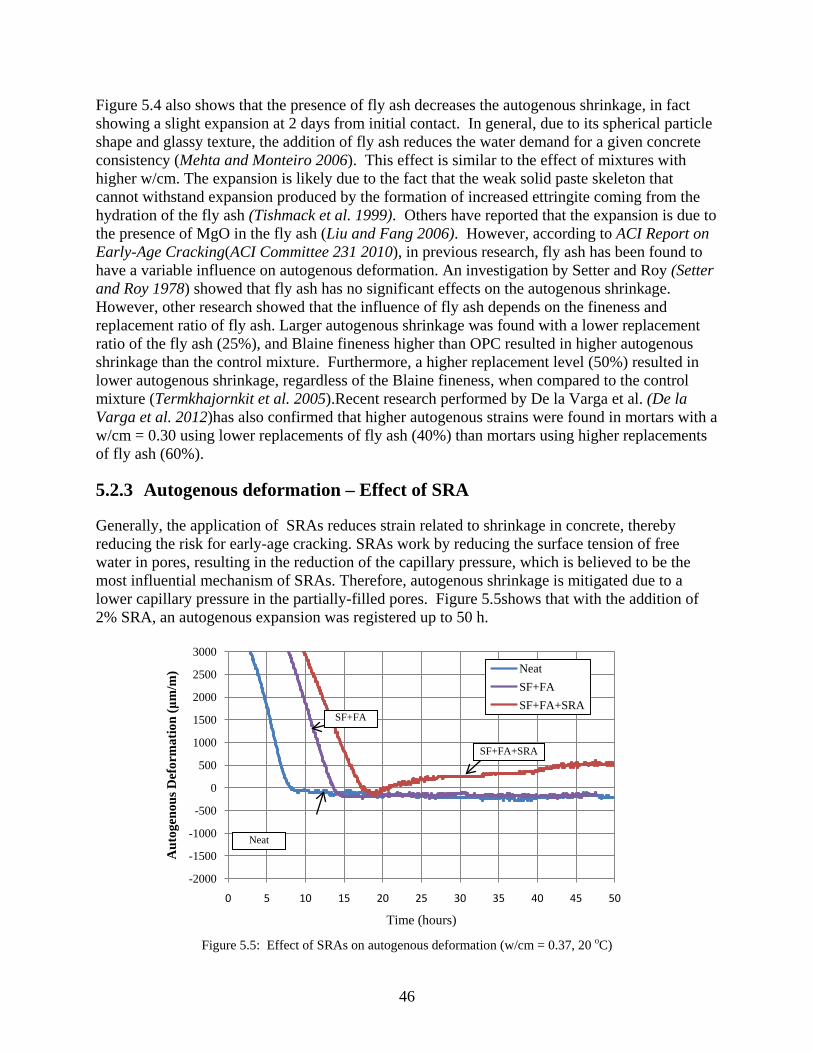
Figure 5.4 also shows that the presence of fly ash decreases the autogenous shrinkage, in fact showing a slight expansion at 2 days from initial contact. In general, due to its spherical particle shape and glassy texture, the addition of fly ash reduces the water demand for a given concrete consistency (Mehta and Monteiro 2006). This effect is similar to the effect of mixtures with higher w/cm. The expansion is likely due to the fact that the weak solid paste skeleton that cannot withstand expansion produced by the formation of increased ettringite coming from the hydration of the fly ash (Tishmack et al. 1999). Others have reported that the expansion is due to the presence of MgO in the fly ash (Liu and Fang 2006). However, according to ACI Report on Early-Age Cracking(ACI Committee 231 2010), in previous research, fly ash has been found to have a variable influence on autogenous deformation. An investigation by Setter and Roy (Setter and Roy 1978) showed that fly ash has no significant effects on the autogenous shrinkage. However, other research showed that the influence of fly ash depends on the fineness and replacement ratio of fly ash. Larger autogenous shrinkage was found with a lower replacement ratio of the fly ash (25%), and Blaine fineness higher than OPC resulted in higher autogenous shrinkage than the control mixture. Furthermore, a higher replacement level (50%) resulted in lower autogenous shrinkage, regardless of the Blaine fineness, when compared to the control mixture (Termkhajornkit et al. 2005).Recent research performed by De la Varga et al. (De la Varga et al. 2012)has also confirmed that higher autogenous strains were found in mortars with a w/cm = 0.30 using lower replacements of fly ash (40%) than mortars using higher replacements of fly ash (60%).
5.2.3 Autogenous deformation – Effect of SRA
Generally, the application of SRAs reduces strain related to shrinkage in concrete, thereby reducing the risk for early-age cracking. SRAs work by reducing the surface tension of free water in pores, resulting in the reduction of the capillary pressure, which is believed to be the most influential mechanism of SRAs. Therefore, autogenous shrinkage is mitigated due to a lower capillary pressure in the partially-filled pores. Figure 5.5shows that with the addition of 2% SRA, an autogenous expansion was registered up to 50 h.
Figure 5.5: Effect of SRAs on autogenous deformation (w/cm = 0.37, 20 oC)
-2000
-1500
-1000
-500
0
500
1000
1500
2000
2500
3000
0 5 10 15 20 25 30 35 40 45 50
Aut
ogen
ous D
efor
mat
ion
(μm
/m)
Time (hours)
NeatSF+FASF+FA+SRA
SF+FA+SRA
SF+FA
Neat
46
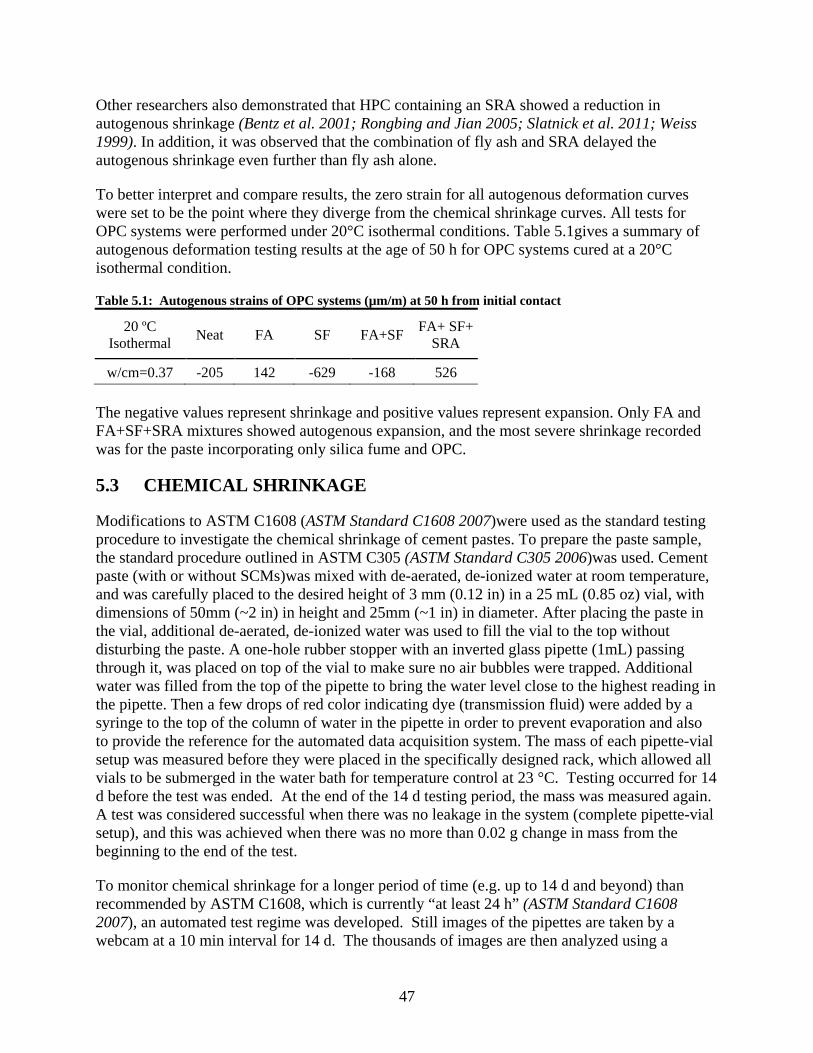
Other researchers also demonstrated that HPC containing an SRA showed a reduction in autogenous shrinkage (Bentz et al. 2001; Rongbing and Jian 2005; Slatnick et al. 2011; Weiss 1999). In addition, it was observed that the combination of fly ash and SRA delayed the autogenous shrinkage even further than fly ash alone.
To better interpret and compare results, the zero strain for all autogenous deformation curves were set to be the point where they diverge from the chemical shrinkage curves. All tests for OPC systems were performed under 20°C isothermal conditions. Table 5.1gives a summary of autogenous deformation testing results at the age of 50 h for OPC systems cured at a 20°C isothermal condition.
Table 5.1: Autogenous strains of OPC systems (µm/m) at 50 h from initial contact
20 ºC Isothermal Neat FA SF FA+SF FA+ SF+
SRA
w/cm=0.37 -205 142 -629 -168 526
The negative values represent shrinkage and positive values represent expansion. Only FA and FA+SF+SRA mixtures showed autogenous expansion, and the most severe shrinkage recorded was for the paste incorporating only silica fume and OPC.
5.3 CHEMICAL SHRINKAGE
Modifications to ASTM C1608 (ASTM Standard C1608 2007)were used as the standard testing procedure to investigate the chemical shrinkage of cement pastes. To prepare the paste sample, the standard procedure outlined in ASTM C305 (ASTM Standard C305 2006)was used. Cement paste (with or without SCMs)was mixed with de-aerated, de-ionized water at room temperature, and was carefully placed to the desired height of 3 mm (0.12 in) in a 25 mL (0.85 oz) vial, with dimensions of 50mm (~2 in) in height and 25mm (~1 in) in diameter. After placing the paste in the vial, additional de-aerated, de-ionized water was used to fill the vial to the top without disturbing the paste. A one-hole rubber stopper with an inverted glass pipette (1mL) passing through it, was placed on top of the vial to make sure no air bubbles were trapped. Additional water was filled from the top of the pipette to bring the water level close to the highest reading in the pipette. Then a few drops of red color indicating dye (transmission fluid) were added by a syringe to the top of the column of water in the pipette in order to prevent evaporation and also to provide the reference for the automated data acquisition system. The mass of each pipette-vial setup was measured before they were placed in the specifically designed rack, which allowed all vials to be submerged in the water bath for temperature control at 23 °C. Testing occurred for 14 d before the test was ended. At the end of the 14 d testing period, the mass was measured again. A test was considered successful when there was no leakage in the system (complete pipette-vial setup), and this was achieved when there was no more than 0.02 g change in mass from the beginning to the end of the test.
To monitor chemical shrinkage for a longer period of time (e.g. up to 14 d and beyond) than recommended by ASTM C1608, which is currently “at least 24 h” (ASTM Standard C1608 2007), an automated test regime was developed. Still images of the pipettes are taken by a webcam at a 10 min interval for 14 d. The thousands of images are then analyzed using a
47
computer software program developed in the Laboratory of Materials of Construction (LMC) at EPFL in Lausanne, Switzerland, to determine the total water uptake by the hydrating cement paste (Bishnoi 2009). Similar experimental setups have been used by several other researchers (Costoya 2008; Fu et al. 2012; Ideker 2008; Jaouadi 2008).
5.3.1 Depercolation study
As per ASTM C1608 (ASTM Standard C1608 2007), the thickness should be 5mm to 10mm for a nominal w/cm of 0.4, which is approximately 5g to 10g of paste in the vial used in this testing. Boivinand co-workers have shown that for a low w/cm sample with thickness less than 10mm, the influence of sample height was insignificant (Boivin et al. 1998). However, recent work by Sant and co-workers has shown a thickness (size) dependent deviation on chemical shrinkage measurements (Sant et al. 2011; Sant et al. 2006). It should be noted that the influence was investigated based on a test period of 24 h to 48 h in both studies.
In this research, four different thicknesses were selected, 3 mm, 5 mm, 7mm and 10 mm, to be tested for up to 14 d, to investigate the long-term effect of sample size dependence. Note that the unit of chemical shrinkage is g/g, which indicates water consumed (g) by unit mass (g) of cement. The results (average of three tests per thickness) show that the 14 d chemical shrinkage systematically increased with a decrease of sample thicknessas seen in Figure 5.6.
Figure 5.6: CS depercolation study(Fu et al. 2012)
48
One possible explanation of the sample size dependence would be that the SCMs and low w/cm densify the paste so that the water cannot penetrate through the thicker section. Sant and co-workers describe this phenomenon as “with increasing hydration in the thick section, a combination of effects due to a global porosity decrease and a decrease in connectivity of the capillary pores due to hydration impedes the movement of water (Sant et al. 2011)”. Therefore, a sample thickness of 3 mm (approximately 3 g of paste) was selected to better quantify the water demand for proportioning the pre-wetted lightweight fine aggregate. This sample thickness was also justified by another recent work using neutron tomography indicating that water can travel up to 3 mm 20 h after casting from lightweight aggregate particle to the surrounding paste with a w/cm of 0.25 (Trtik et al. 2011).
5.3.2 Long-term chemical shrinkage
Tests were performed on OPC neat paste, binary and ternary systems, as well as systems with SRA under 23 ºC isothermal conditions. By applying the automated logging system, the shape of the chemical shrinkage curve can also be precisely illustrated, representing the reaction rate of each mixture. The shape of the curve is affected by influential factors such as type of cement, curing temperature, w/cm, fineness of cement, and SCMs or SRA additions in the mixture (Xiao et al. 2009). Xiao and co-workers also proposed a mathematical model to describe and predict the long-term chemical shrinkage (Xiao et al. 2009). To use this model, a chemical shrinkage test up to a certain age needs to be done first. Then, a hyperbolic-like function converging to an asymptote (Equation 7) is fit to describe and predict the measured CS development curve.
Equation 7
Where:
CS(t) = chemical shrinkage value at age of t (day); CS∞= long-term chemical shrinkage value; a,b=hydration constants related to cementitious materials properties.
A non-linear Levenberg-Marquardt least squares fitting tool was used to determine the three parameters (a,b, CS∞). More detailed information about this method can be found in other literature (Fu et al. 2012; Xiao et al. 2009). Figure 5.7 shows the chemical shrinkage curves for the ODOT HPC mix. A brief summary of the 14 day/predicted long-term chemical shrinkage values are listed in Table 5.2. Each measured value in Table 5.2 is the average of three samples.
Table 5.2: Chemical shrinkage (ml/g), HPC w/cm = 0.37 at 23 oC isothermal Neat SF FA SF+FA SRA
14 day 0.0552 0.0550 0.0588 0.0547 0.0599 Predicted long-term 0.0670 0.0693 0.0796 0.0676 0.0671
Another study on the stability of predicted long-term CS based on data from Xaio et al. showed that beyond the 14 d testing period, the predicted long-term CS is stable (within 3% difference)
49
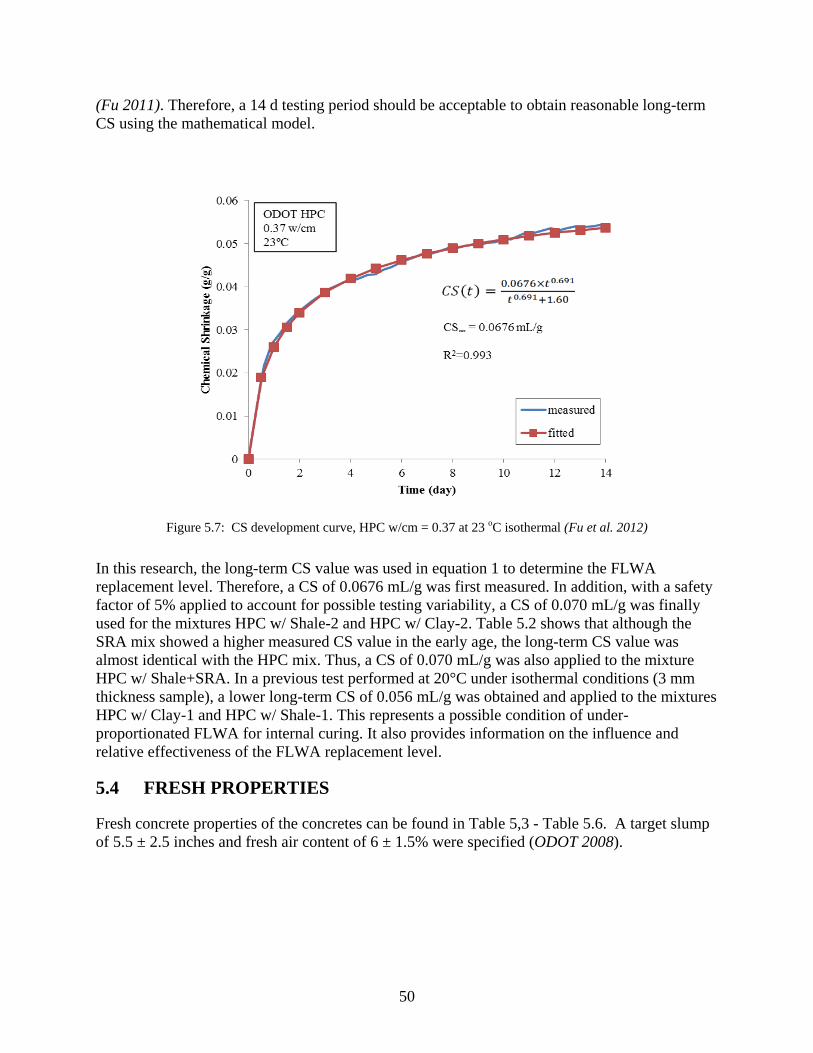
(Fu 2011). Therefore, a 14 d testing period should be acceptable to obtain reasonable long-term CS using the mathematical model.
Figure 5.7: CS development curve, HPC w/cm = 0.37 at 23 oC isothermal (Fu et al. 2012)
In this research, the long-term CS value was used in equation 1 to determine the FLWA replacement level. Therefore, a CS of 0.0676 mL/g was first measured. In addition, with a safety factor of 5% applied to account for possible testing variability, a CS of 0.070 mL/g was finally used for the mixtures HPC w/ Shale-2 and HPC w/ Clay-2. Table 5.2 shows that although the SRA mix showed a higher measured CS value in the early age, the long-term CS value was almost identical with the HPC mix. Thus, a CS of 0.070 mL/g was also applied to the mixture HPC w/ Shale+SRA. In a previous test performed at 20°C under isothermal conditions (3 mm thickness sample), a lower long-term CS of 0.056 mL/g was obtained and applied to the mixtures HPC w/ Clay-1 and HPC w/ Shale-1. This represents a possible condition of under-proportionated FLWA for internal curing. It also provides information on the influence and relative effectiveness of the FLWA replacement level.
5.4 FRESH PROPERTIES
Fresh concrete properties of the concretes can be found in Table 5,3 - Table 5.6. A target slump of 5.5 ± 2.5 inches and fresh air content of 6 ± 1.5% were specified (ODOT 2008).
50
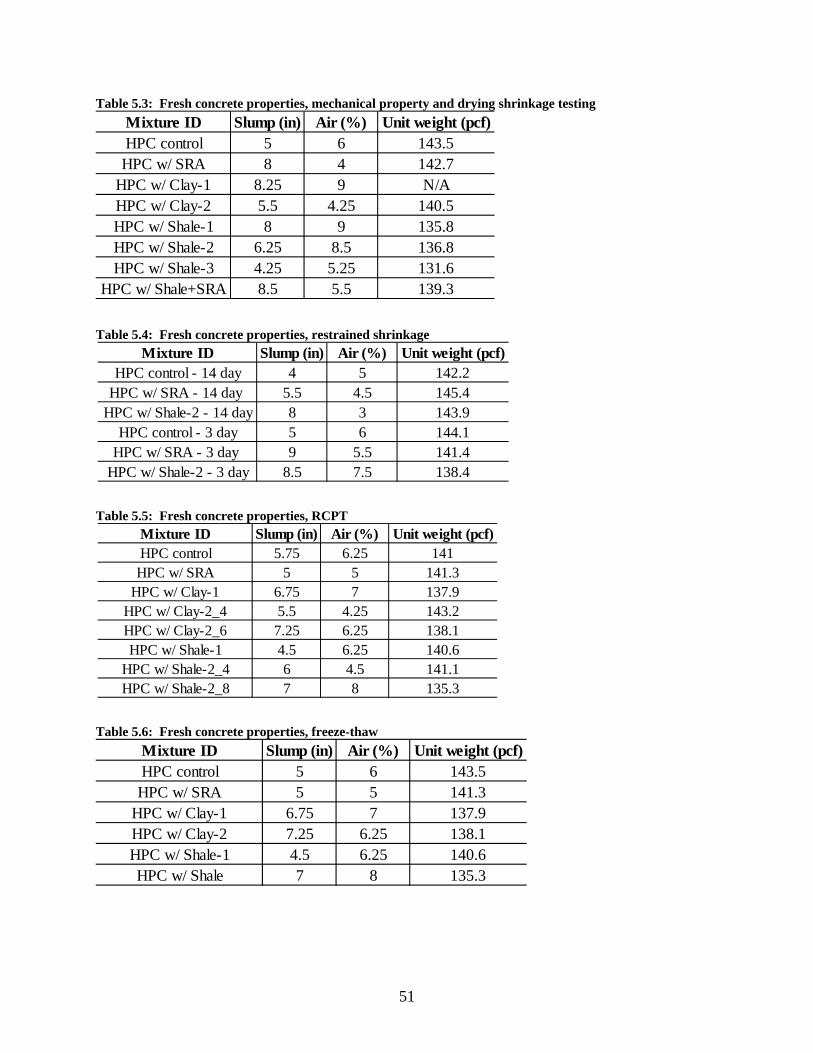
Table 5.3: Fresh concrete properties, mechanical property and drying shrinkage testing
Table 5.4: Fresh concrete properties, restrained shrinkage
Table 5.5: Fresh concrete properties, RCPT
Table 5.6: Fresh concrete properties, freeze-thaw
Mixture ID Slump (in) Air (%) Unit weight (pcf)HPC control 5 6 143.5HPC w/ SRA 8 4 142.7
HPC w/ Clay-1 8.25 9 N/AHPC w/ Clay-2 5.5 4.25 140.5HPC w/ Shale-1 8 9 135.8HPC w/ Shale-2 6.25 8.5 136.8HPC w/ Shale-3 4.25 5.25 131.6
HPC w/ Shale+SRA 8.5 5.5 139.3
Mixture ID Slump (in) Air (%) Unit weight (pcf)HPC control - 14 day 4 5 142.2
HPC w/ SRA - 14 day 5.5 4.5 145.4HPC w/ Shale-2 - 14 day 8 3 143.9
HPC control - 3 day 5 6 144.1HPC w/ SRA - 3 day 9 5.5 141.4
HPC w/ Shale-2 - 3 day 8.5 7.5 138.4
Mixture ID Slump (in) Air (%) Unit weight (pcf)HPC control 5.75 6.25 141HPC w/ SRA 5 5 141.3
HPC w/ Clay-1 6.75 7 137.9HPC w/ Clay-2_4 5.5 4.25 143.2HPC w/ Clay-2_6 7.25 6.25 138.1HPC w/ Shale-1 4.5 6.25 140.6
HPC w/ Shale-2_4 6 4.5 141.1HPC w/ Shale-2_8 7 8 135.3
Mixture ID Slump (in) Air (%) Unit weight (pcf)HPC control 5 6 143.5HPC w/ SRA 5 5 141.3
HPC w/ Clay-1 6.75 7 137.9HPC w/ Clay-2 7.25 6.25 138.1HPC w/ Shale-1 4.5 6.25 140.6HPC w/ Shale 7 8 135.3
51
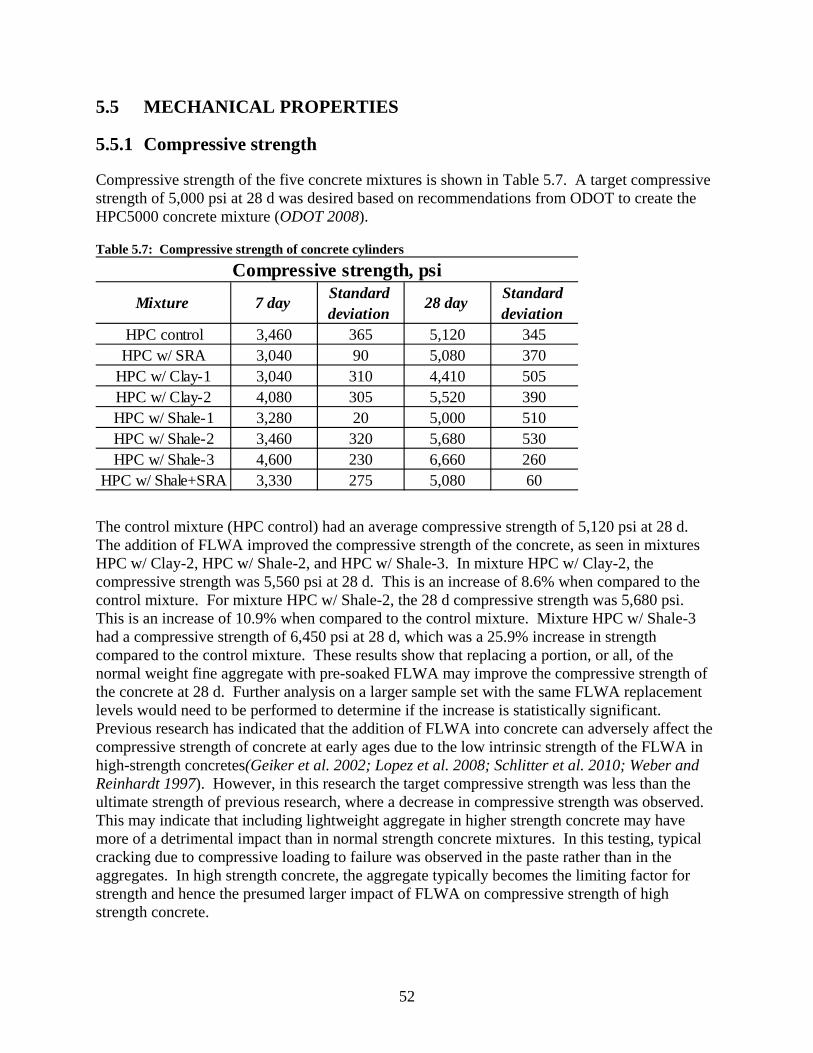
5.5 MECHANICAL PROPERTIES
5.5.1 Compressive strength
Compressive strength of the five concrete mixtures is shown in Table 5.7. A target compressive strength of 5,000 psi at 28 d was desired based on recommendations from ODOT to create the HPC5000 concrete mixture (ODOT 2008).
Table 5.7: Compressive strength of concrete cylinders
The control mixture (HPC control) had an average compressive strength of 5,120 psi at 28 d. The addition of FLWA improved the compressive strength of the concrete, as seen in mixtures HPC w/ Clay-2, HPC w/ Shale-2, and HPC w/ Shale-3. In mixture HPC w/ Clay-2, the compressive strength was 5,560 psi at 28 d. This is an increase of 8.6% when compared to the control mixture. For mixture HPC w/ Shale-2, the 28 d compressive strength was 5,680 psi. This is an increase of 10.9% when compared to the control mixture. Mixture HPC w/ Shale-3 had a compressive strength of 6,450 psi at 28 d, which was a 25.9% increase in strength compared to the control mixture. These results show that replacing a portion, or all, of the normal weight fine aggregate with pre-soaked FLWA may improve the compressive strength of the concrete at 28 d. Further analysis on a larger sample set with the same FLWA replacement levels would need to be performed to determine if the increase is statistically significant. Previous research has indicated that the addition of FLWA into concrete can adversely affect the compressive strength of concrete at early ages due to the low intrinsic strength of the FLWA in high-strength concretes(Geiker et al. 2002; Lopez et al. 2008; Schlitter et al. 2010; Weber and Reinhardt 1997). However, in this research the target compressive strength was less than the ultimate strength of previous research, where a decrease in compressive strength was observed. This may indicate that including lightweight aggregate in higher strength concrete may have more of a detrimental impact than in normal strength concrete mixtures. In this testing, typical cracking due to compressive loading to failure was observed in the paste rather than in the aggregates. In high strength concrete, the aggregate typically becomes the limiting factor for strength and hence the presumed larger impact of FLWA on compressive strength of high strength concrete.
Mixture 7 day Standard deviation
28 day Standard deviation
HPC control 3,460 365 5,120 345HPC w/ SRA 3,040 90 5,080 370
HPC w/ Clay-1 3,040 310 4,410 505HPC w/ Clay-2 4,080 305 5,520 390HPC w/ Shale-1 3,280 20 5,000 510HPC w/ Shale-2 3,460 320 5,680 530HPC w/ Shale-3 4,600 230 6,660 260
HPC w/ Shale+SRA 3,330 275 5,080 60
Compressive strength, psi
52
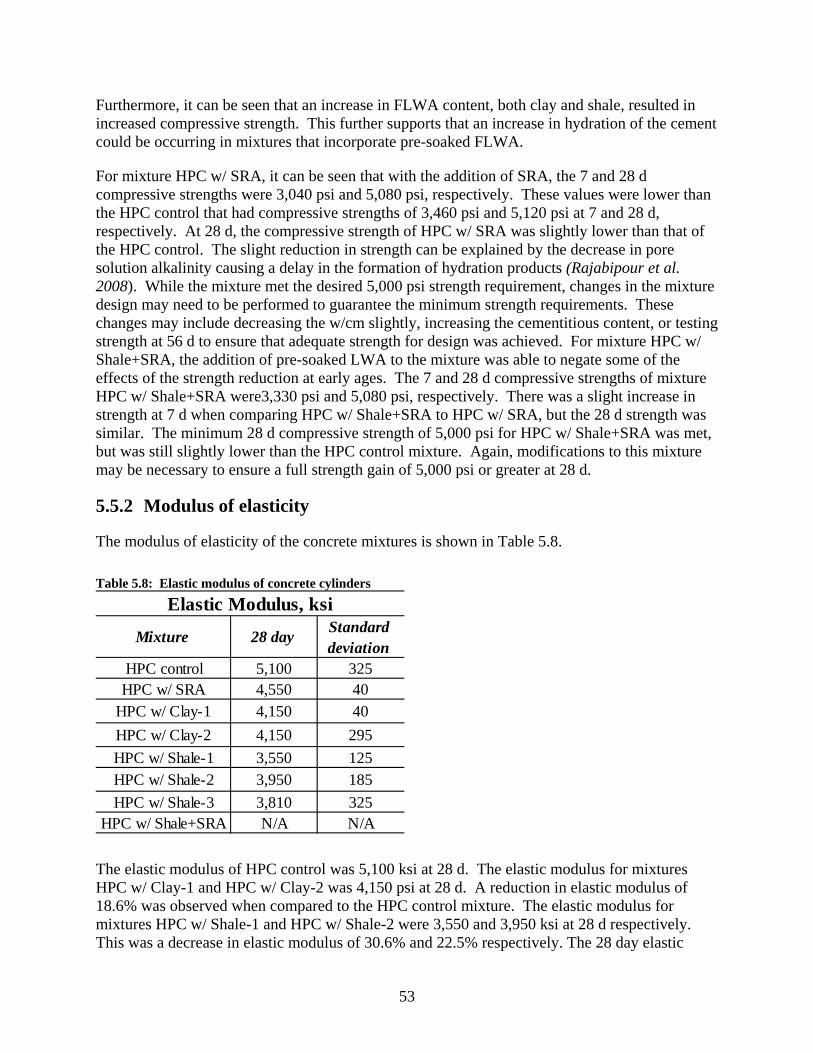
Furthermore, it can be seen that an increase in FLWA content, both clay and shale, resulted in increased compressive strength. This further supports that an increase in hydration of the cement could be occurring in mixtures that incorporate pre-soaked FLWA.
For mixture HPC w/ SRA, it can be seen that with the addition of SRA, the 7 and 28 d compressive strengths were 3,040 psi and 5,080 psi, respectively. These values were lower than the HPC control that had compressive strengths of 3,460 psi and 5,120 psi at 7 and 28 d, respectively. At 28 d, the compressive strength of HPC w/ SRA was slightly lower than that of the HPC control. The slight reduction in strength can be explained by the decrease in pore solution alkalinity causing a delay in the formation of hydration products (Rajabipour et al. 2008). While the mixture met the desired 5,000 psi strength requirement, changes in the mixture design may need to be performed to guarantee the minimum strength requirements. These changes may include decreasing the w/cm slightly, increasing the cementitious content, or testing strength at 56 d to ensure that adequate strength for design was achieved. For mixture HPC w/ Shale+SRA, the addition of pre-soaked LWA to the mixture was able to negate some of the effects of the strength reduction at early ages. The 7 and 28 d compressive strengths of mixture HPC w/ Shale+SRA were3,330 psi and 5,080 psi, respectively. There was a slight increase in strength at 7 d when comparing HPC w/ Shale+SRA to HPC w/ SRA, but the 28 d strength was similar. The minimum 28 d compressive strength of 5,000 psi for HPC w/ Shale+SRA was met, but was still slightly lower than the HPC control mixture. Again, modifications to this mixture may be necessary to ensure a full strength gain of 5,000 psi or greater at 28 d.
5.5.2 Modulus of elasticity
The modulus of elasticity of the concrete mixtures is shown in Table 5.8.
Table 5.8: Elastic modulus of concrete cylinders
The elastic modulus of HPC control was 5,100 ksi at 28 d. The elastic modulus for mixtures HPC w/ Clay-1 and HPC w/ Clay-2 was 4,150 psi at 28 d. A reduction in elastic modulus of 18.6% was observed when compared to the HPC control mixture. The elastic modulus for mixtures HPC w/ Shale-1 and HPC w/ Shale-2 were 3,550 and 3,950 ksi at 28 d respectively. This was a decrease in elastic modulus of 30.6% and 22.5% respectively. The 28 day elastic
Mixture 28 day Standard deviation
HPC control 5,100 325HPC w/ SRA 4,550 40
HPC w/ Clay-1 4,150 40HPC w/ Clay-2 4,150 295HPC w/ Shale-1 3,550 125HPC w/ Shale-2 3,950 185HPC w/ Shale-3 3,810 325
HPC w/ Shale+SRA N/A N/A
Elastic Modulus, ksi
53
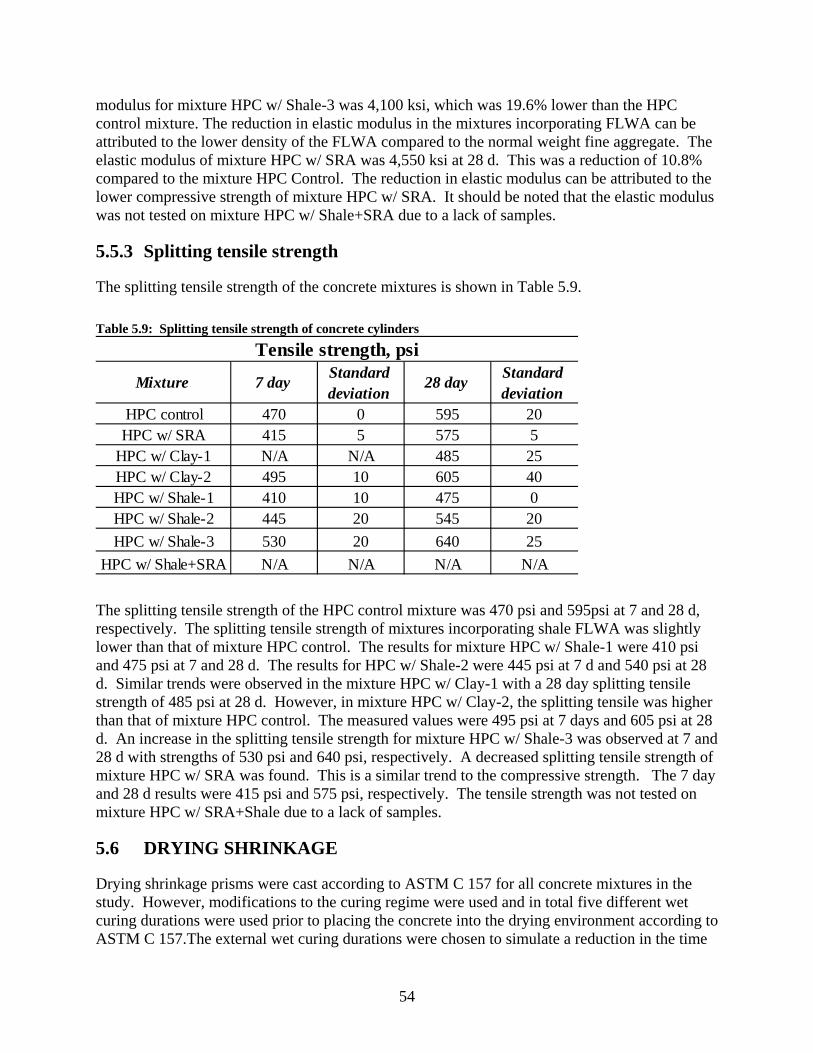
modulus for mixture HPC w/ Shale-3 was 4,100 ksi, which was 19.6% lower than the HPC control mixture. The reduction in elastic modulus in the mixtures incorporating FLWA can be attributed to the lower density of the FLWA compared to the normal weight fine aggregate. The elastic modulus of mixture HPC w/ SRA was 4,550 ksi at 28 d. This was a reduction of 10.8% compared to the mixture HPC Control. The reduction in elastic modulus can be attributed to the lower compressive strength of mixture HPC w/ SRA. It should be noted that the elastic modulus was not tested on mixture HPC w/ Shale+SRA due to a lack of samples.
5.5.3 Splitting tensile strength
The splitting tensile strength of the concrete mixtures is shown in Table 5.9.
Table 5.9: Splitting tensile strength of concrete cylinders
The splitting tensile strength of the HPC control mixture was 470 psi and 595psi at 7 and 28 d, respectively. The splitting tensile strength of mixtures incorporating shale FLWA was slightly lower than that of mixture HPC control. The results for mixture HPC w/ Shale-1 were 410 psi and 475 psi at 7 and 28 d. The results for HPC w/ Shale-2 were 445 psi at 7 d and 540 psi at 28 d. Similar trends were observed in the mixture HPC w/ Clay-1 with a 28 day splitting tensilestrength of 485 psi at 28 d. However, in mixture HPC w/ Clay-2, the splitting tensile was higher than that of mixture HPC control. The measured values were 495 psi at 7 days and 605 psi at 28 d. An increase in the splitting tensile strength for mixture HPC w/ Shale-3 was observed at 7 and28 d with strengths of 530 psi and 640 psi, respectively. A decreased splitting tensile strength of mixture HPC w/ SRA was found. This is a similar trend to the compressive strength. The 7 day and 28 d results were 415 psi and 575 psi, respectively. The tensile strength was not tested on mixture HPC w/ SRA+Shale due to a lack of samples.
5.6 DRYING SHRINKAGE
Drying shrinkage prisms were cast according to ASTM C 157 for all concrete mixtures in the study. However, modifications to the curing regime were used and in total five different wet curing durations were used prior to placing the concrete into the drying environment according to ASTM C 157.The external wet curing durations were chosen to simulate a reduction in the time
Mixture 7 day Standard deviation
28 day Standard deviation
HPC control 470 0 595 20HPC w/ SRA 415 5 575 5
HPC w/ Clay-1 N/A N/A 485 25HPC w/ Clay-2 495 10 605 40HPC w/ Shale-1 410 10 475 0HPC w/ Shale-2 445 20 545 20HPC w/ Shale-3 530 20 640 25
HPC w/ Shale+SRA N/A N/A N/A N/A
Tensile strength, psi
54
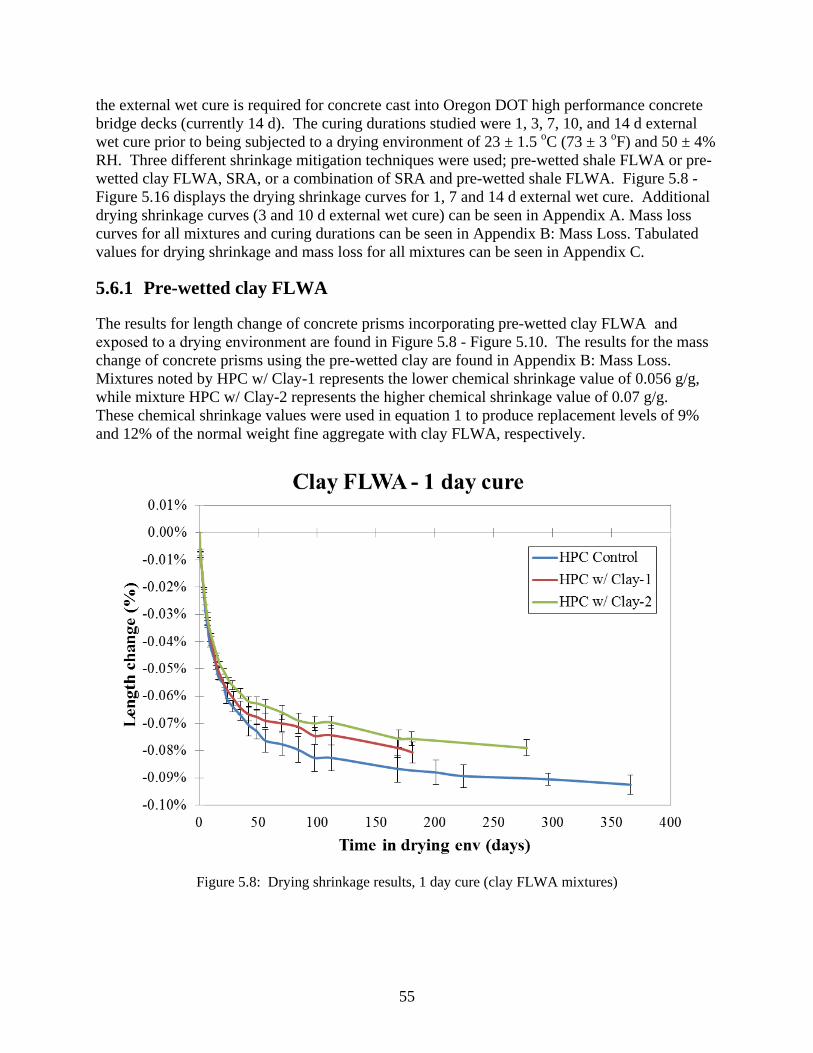
the external wet cure is required for concrete cast into Oregon DOT high performance concrete bridge decks (currently 14 d). The curing durations studied were 1, 3, 7, 10, and 14 d external wet cure prior to being subjected to a drying environment of 23 ± 1.5 oC (73 ± 3 oF) and 50 ± 4% RH. Three different shrinkage mitigation techniques were used; pre-wetted shale FLWA or pre-wetted clay FLWA, SRA, or a combination of SRA and pre-wetted shale FLWA. Figure 5.8 - Figure 5.16 displays the drying shrinkage curves for 1, 7 and 14 d external wet cure. Additional drying shrinkage curves (3 and 10 d external wet cure) can be seen in Appendix A. Mass loss curves for all mixtures and curing durations can be seen in Appendix B: Mass Loss. Tabulated values for drying shrinkage and mass loss for all mixtures can be seen in Appendix C.
5.6.1 Pre-wetted clay FLWA
The results for length change of concrete prisms incorporating pre-wetted clay FLWA and exposed to a drying environment are found in Figure 5.8 - Figure 5.10. The results for the mass change of concrete prisms using the pre-wetted clay are found in Appendix B: Mass Loss. Mixtures noted by HPC w/ Clay-1 represents the lower chemical shrinkage value of 0.056 g/g, while mixture HPC w/ Clay-2 represents the higher chemical shrinkage value of 0.07 g/g. These chemical shrinkage values were used in equation 1 to produce replacement levels of 9% and 12% of the normal weight fine aggregate with clay FLWA, respectively.
Figure 5.8: Drying shrinkage results, 1 day cure (clay FLWA mixtures)
55
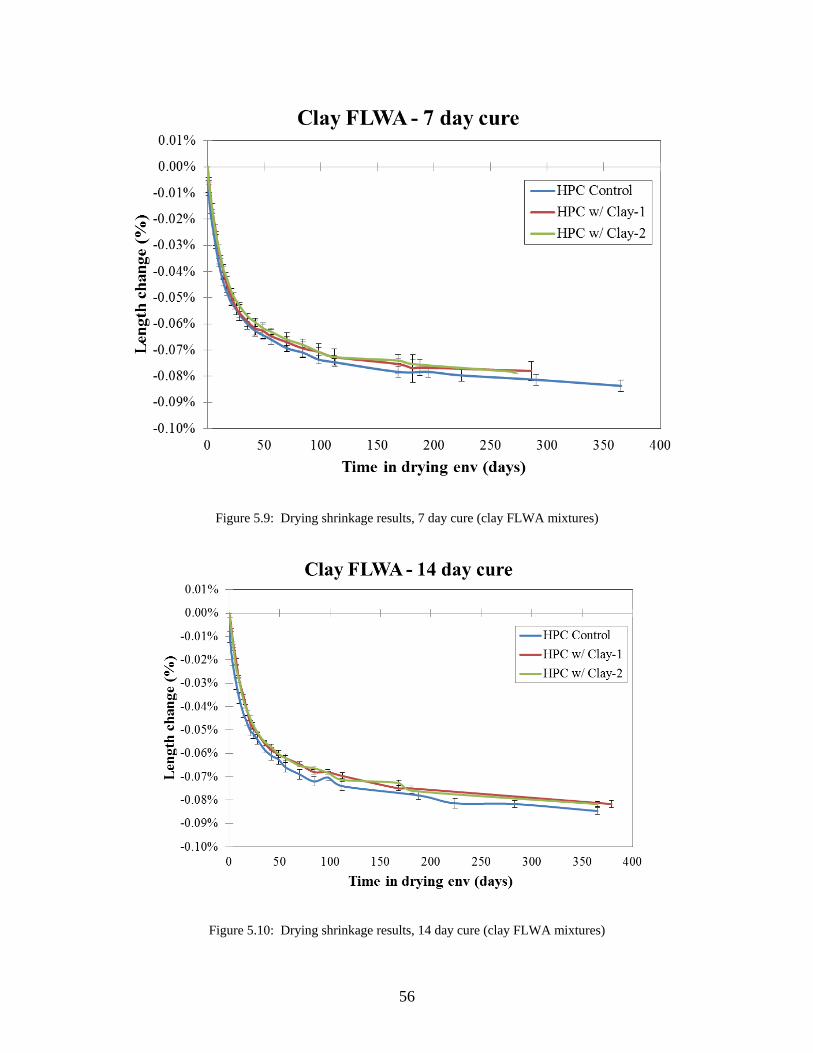
Figure 5.9: Drying shrinkage results, 7 day cure (clay FLWA mixtures)
Figure 5.10: Drying shrinkage results, 14 day cure (clay FLWA mixtures)
56
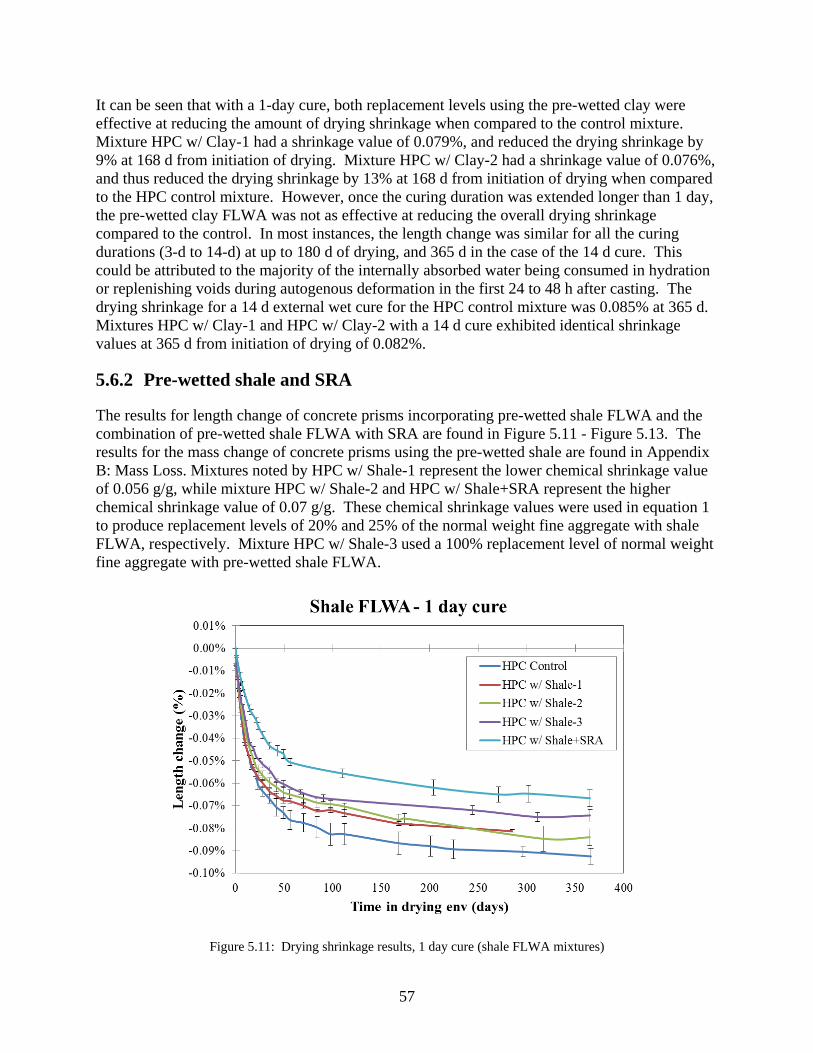
It can be seen that with a 1-day cure, both replacement levels using the pre-wetted clay were effective at reducing the amount of drying shrinkage when compared to the control mixture. Mixture HPC w/ Clay-1 had a shrinkage value of 0.079%, and reduced the drying shrinkage by 9% at 168 d from initiation of drying. Mixture HPC w/ Clay-2 had a shrinkage value of 0.076%, and thus reduced the drying shrinkage by 13% at 168 d from initiation of drying when compared to the HPC control mixture. However, once the curing duration was extended longer than 1 day, the pre-wetted clay FLWA was not as effective at reducing the overall drying shrinkage compared to the control. In most instances, the length change was similar for all the curing durations (3-d to 14-d) at up to 180 d of drying, and 365 d in the case of the 14 d cure. This could be attributed to the majority of the internally absorbed water being consumed in hydration or replenishing voids during autogenous deformation in the first 24 to 48 h after casting. The drying shrinkage for a 14 d external wet cure for the HPC control mixture was 0.085% at 365 d. Mixtures HPC w/ Clay-1 and HPC w/ Clay-2 with a 14 d cure exhibited identical shrinkage values at 365 d from initiation of drying of 0.082%.
5.6.2 Pre-wetted shale and SRA
The results for length change of concrete prisms incorporating pre-wetted shale FLWA and the combination of pre-wetted shale FLWA with SRA are found in Figure 5.11 - Figure 5.13. The results for the mass change of concrete prisms using the pre-wetted shale are found in Appendix B: Mass Loss. Mixtures noted by HPC w/ Shale-1 represent the lower chemical shrinkage value of 0.056 g/g, while mixture HPC w/ Shale-2 and HPC w/ Shale+SRA represent the higher chemical shrinkage value of 0.07 g/g. These chemical shrinkage values were used in equation 1 to produce replacement levels of 20% and 25% of the normal weight fine aggregate with shale FLWA, respectively. Mixture HPC w/ Shale-3 used a 100% replacement level of normal weight fine aggregate with pre-wetted shale FLWA.
Figure 5.11: Drying shrinkage results, 1 day cure (shale FLWA mixtures)
57
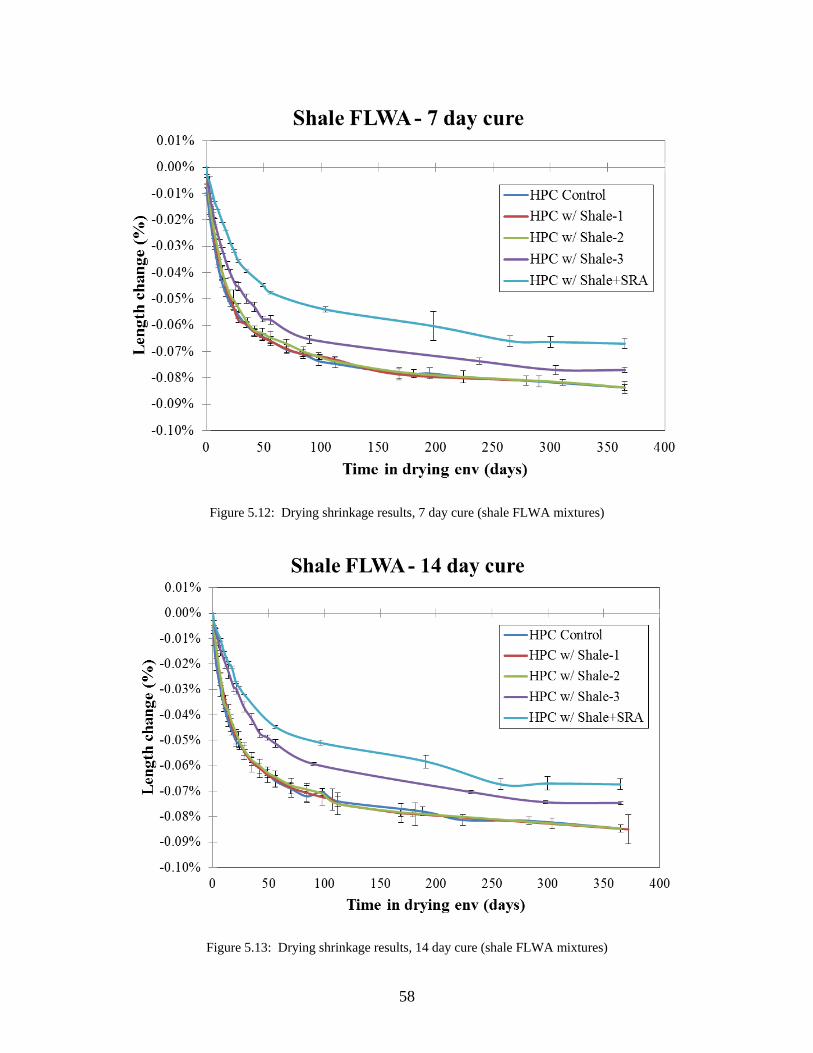
Figure 5.12: Drying shrinkage results, 7 day cure (shale FLWA mixtures)
Figure 5.13: Drying shrinkage results, 14 day cure (shale FLWA mixtures)
58
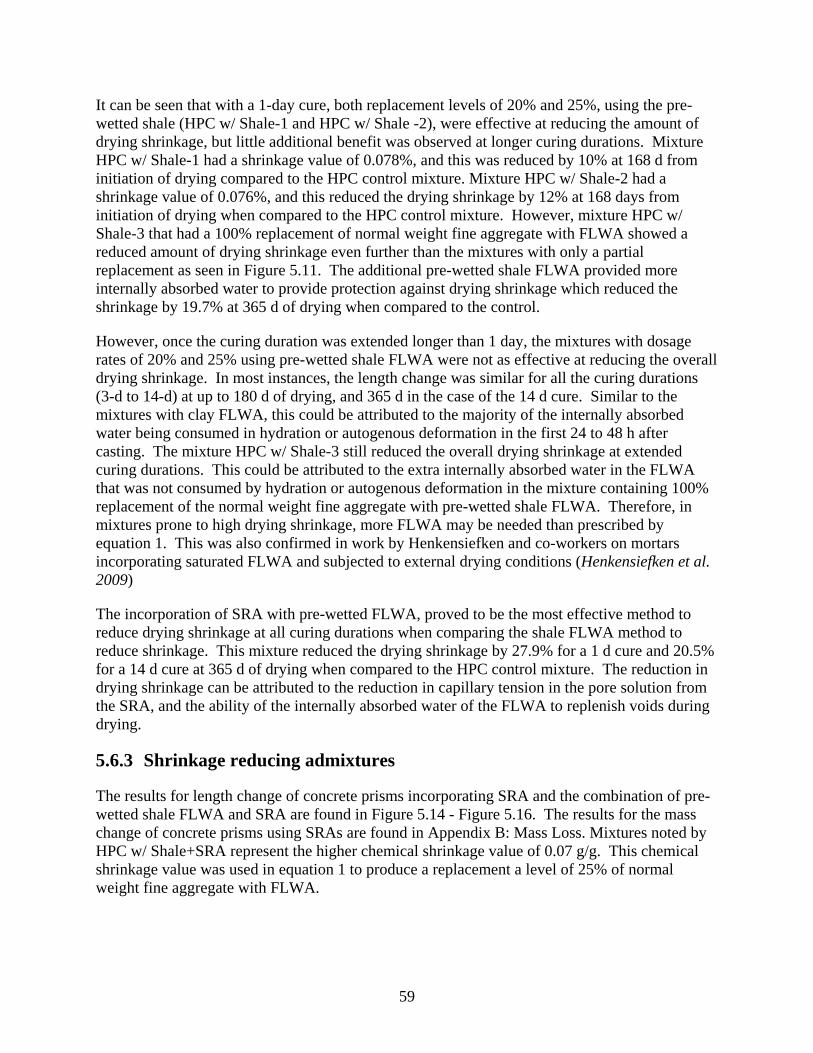
It can be seen that with a 1-day cure, both replacement levels of 20% and 25%, using the pre-wetted shale (HPC w/ Shale-1 and HPC w/ Shale -2), were effective at reducing the amount of drying shrinkage, but little additional benefit was observed at longer curing durations. Mixture HPC w/ Shale-1 had a shrinkage value of 0.078%, and this was reduced by 10% at 168 d from initiation of drying compared to the HPC control mixture. Mixture HPC w/ Shale-2 had a shrinkage value of 0.076%, and this reduced the drying shrinkage by 12% at 168 days from initiation of drying when compared to the HPC control mixture. However, mixture HPC w/ Shale-3 that had a 100% replacement of normal weight fine aggregate with FLWA showed a reduced amount of drying shrinkage even further than the mixtures with only a partial replacement as seen in Figure 5.11. The additional pre-wetted shale FLWA provided more internally absorbed water to provide protection against drying shrinkage which reduced the shrinkage by 19.7% at 365 d of drying when compared to the control.
However, once the curing duration was extended longer than 1 day, the mixtures with dosage rates of 20% and 25% using pre-wetted shale FLWA were not as effective at reducing the overall drying shrinkage. In most instances, the length change was similar for all the curing durations (3-d to 14-d) at up to 180 d of drying, and 365 d in the case of the 14 d cure. Similar to the mixtures with clay FLWA, this could be attributed to the majority of the internally absorbed water being consumed in hydration or autogenous deformation in the first 24 to 48 h after casting. The mixture HPC w/ Shale-3 still reduced the overall drying shrinkage at extended curing durations. This could be attributed to the extra internally absorbed water in the FLWA that was not consumed by hydration or autogenous deformation in the mixture containing 100% replacement of the normal weight fine aggregate with pre-wetted shale FLWA. Therefore, in mixtures prone to high drying shrinkage, more FLWA may be needed than prescribed by equation 1. This was also confirmed in work by Henkensiefken and co-workers on mortars incorporating saturated FLWA and subjected to external drying conditions (Henkensiefken et al. 2009)
The incorporation of SRA with pre-wetted FLWA, proved to be the most effective method to reduce drying shrinkage at all curing durations when comparing the shale FLWA method to reduce shrinkage. This mixture reduced the drying shrinkage by 27.9% for a 1 d cure and 20.5% for a 14 d cure at 365 d of drying when compared to the HPC control mixture. The reduction in drying shrinkage can be attributed to the reduction in capillary tension in the pore solution from the SRA, and the ability of the internally absorbed water of the FLWA to replenish voids during drying.
5.6.3 Shrinkage reducing admixtures
The results for length change of concrete prisms incorporating SRA and the combination of pre-wetted shale FLWA and SRA are found in Figure 5.14 - Figure 5.16. The results for the mass change of concrete prisms using SRAs are found in Appendix B: Mass Loss. Mixtures noted by HPC w/ Shale+SRA represent the higher chemical shrinkage value of 0.07 g/g. This chemical shrinkage value was used in equation 1 to produce a replacement a level of 25% of normal weight fine aggregate with FLWA.
59
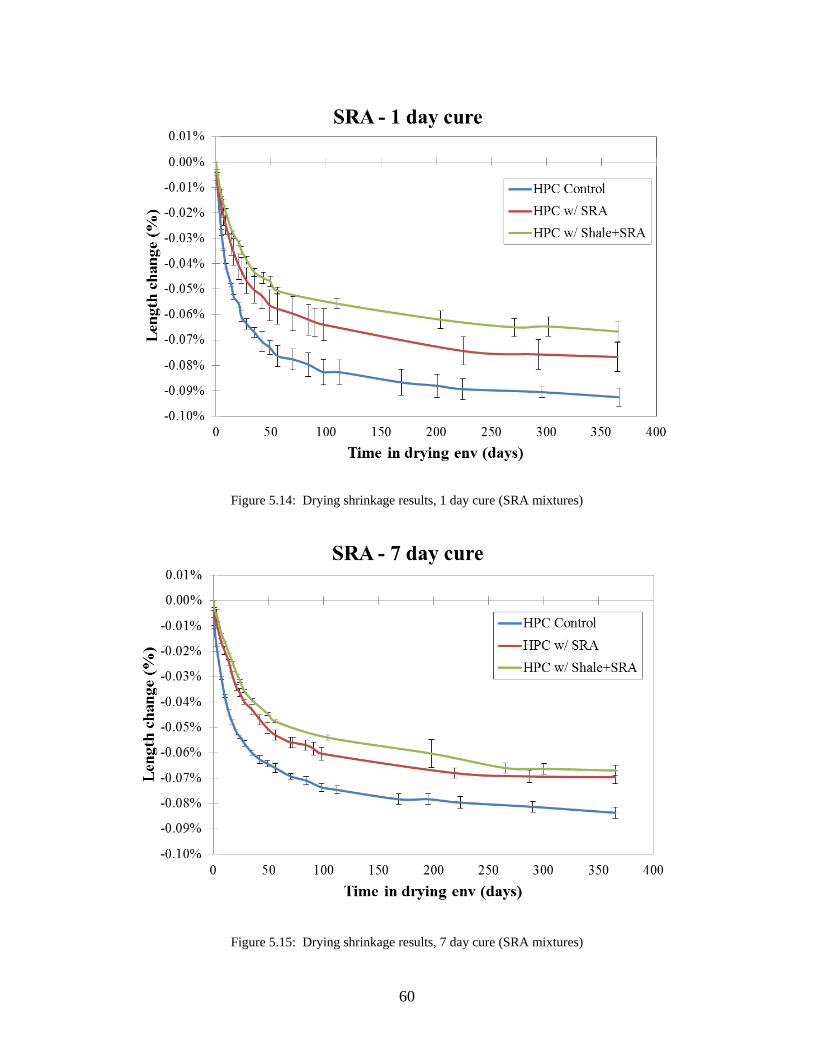
Figure 5.14: Drying shrinkage results, 1 day cure (SRA mixtures)
Figure 5.15: Drying shrinkage results, 7 day cure (SRA mixtures)
60
Figure 5.16: Drying shrinkage results, 14 day cure (SRA mixtures)
The addition of an SRA reduced the drying shrinkage of the concrete. Mixture HPC w/ SRA was the second most effective method at reducing the drying shrinkage. The reduction in drying shrinkage was 17.1%, 16.7%, and 17.9% at 1, 7, and 14 d, respectively at 365 d from initiation of drying. However, the combination of shale FLWA (25%) and SRA was the most effective method at reducing drying shrinkage, which reduced the drying shrinkage by 27.9% when compared to the HPC control mixture for the 1d cure. The 7 and 14d external wet cure drying shrinkage values were reduced by 19.9% and 20.5%, respectively at 365 d of drying. The reduction in drying shrinkage can be attributed to the ability of both the FLWA and the SRA to reduce the autogenous and drying shrinkage of the concrete. The SRA reduced the capillary stress of the pore solution, while the pre-soaked FLWA may have been effective at replenishing water in voids less than 50 nm that typically cause shrinkage. In essence, the synergy between the two different shrinkage reducing methods resulted in the most dramatic overall decrease in drying shrinkage.
5.6.4 Overall discussion of drying shrinkage
While the incorporation of FLWA, was shown to be the least effective at reducing the drying shrinkage, the compressive strength gain for the higher replacement levels were the highest when compared to the HPC control mixture. Although a higher amount of shrinkage was observed compared to the other methods of mitigation, the concrete was shown to gain the most strength which could provide a reduction in cracking potential. Once the induced tensile stresses overcome the tensile capacity of the concrete, cracking will occur which can lead to premature deterioration. Additionally, the reduced modulus of elasticity in the FLWA concretes could allow for more deformation to occur before cracking occurs.
61
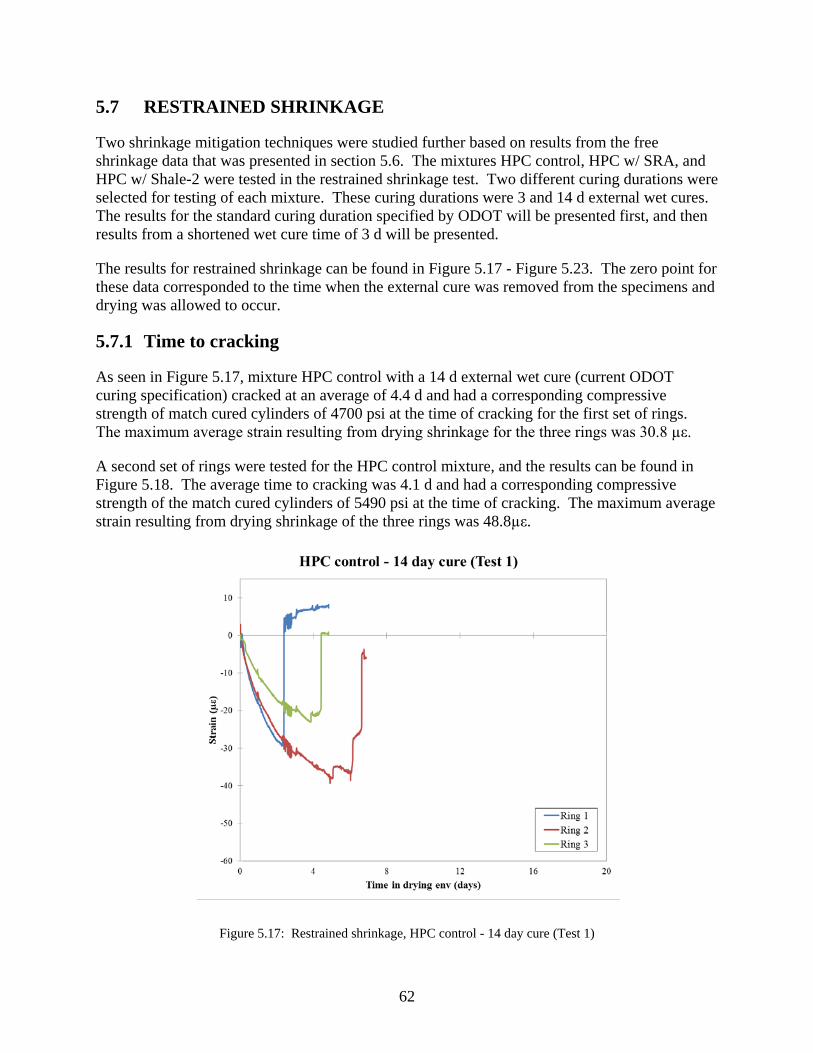
5.7 RESTRAINED SHRINKAGE
Two shrinkage mitigation techniques were studied further based on results from the free shrinkage data that was presented in section 5.6. The mixtures HPC control, HPC w/ SRA, and HPC w/ Shale-2 were tested in the restrained shrinkage test. Two different curing durations were selected for testing of each mixture. These curing durations were 3 and 14 d external wet cures. The results for the standard curing duration specified by ODOT will be presented first, and then results from a shortened wet cure time of 3 d will be presented.
The results for restrained shrinkage can be found in Figure 5.17 - Figure 5.23. The zero point for these data corresponded to the time when the external cure was removed from the specimens and drying was allowed to occur.
5.7.1 Time to cracking
As seen in Figure 5.17, mixture HPC control with a 14 d external wet cure (current ODOT curing specification) cracked at an average of 4.4 d and had a corresponding compressive strength of match cured cylinders of 4700 psi at the time of cracking for the first set of rings. The maximum average strain resulting from drying shrinkage for the three rings was 30.8 µε.
A second set of rings were tested for the HPC control mixture, and the results can be found in Figure 5.18. The average time to cracking was 4.1 d and had a corresponding compressive strength of the match cured cylinders of 5490 psi at the time of cracking. The maximum average strain resulting from drying shrinkage of the three rings was 48.8µε.
Figure 5.17: Restrained shrinkage, HPC control - 14 day cure (Test 1)
62
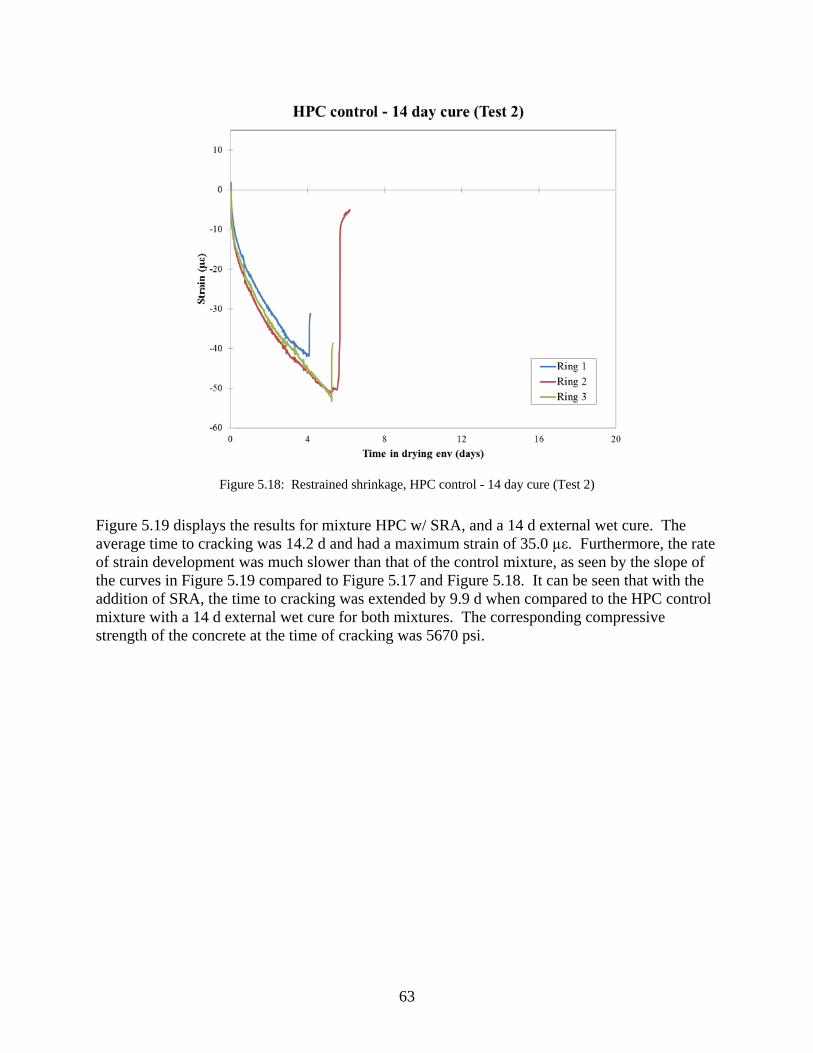
Figure 5.18: Restrained shrinkage, HPC control - 14 day cure (Test 2)
Figure 5.19 displays the results for mixture HPC w/ SRA, and a 14 d external wet cure. The average time to cracking was 14.2 d and had a maximum strain of 35.0 µε. Furthermore, the rate of strain development was much slower than that of the control mixture, as seen by the slope of the curves in Figure 5.19 compared to Figure 5.17 and Figure 5.18. It can be seen that with the addition of SRA, the time to cracking was extended by 9.9 d when compared to the HPC control mixture with a 14 d external wet cure for both mixtures. The corresponding compressive strength of the concrete at the time of cracking was 5670 psi.
63
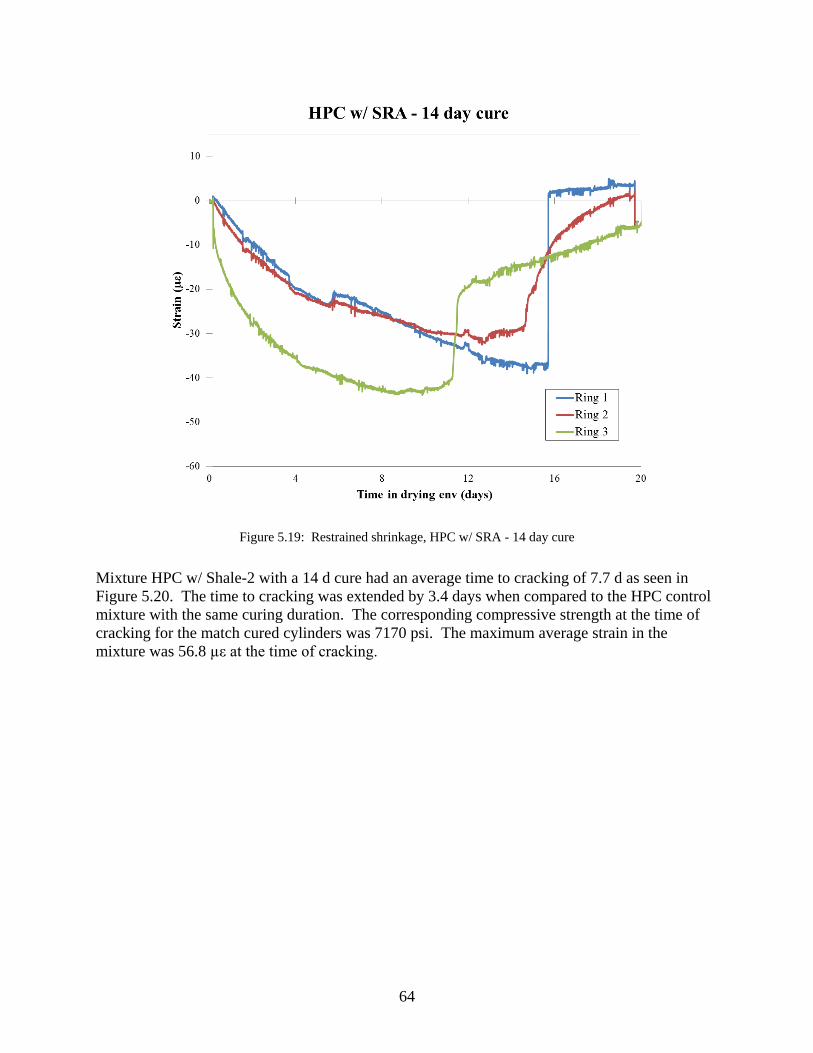
Figure 5.19: Restrained shrinkage, HPC w/ SRA - 14 day cure
Mixture HPC w/ Shale-2 with a 14 d cure had an average time to cracking of 7.7 d as seen in Figure 5.20. The time to cracking was extended by 3.4 days when compared to the HPC control mixture with the same curing duration. The corresponding compressive strength at the time of cracking for the match cured cylinders was 7170 psi. The maximum average strain in the mixture was 56.8 µε at the time of cracking.
64
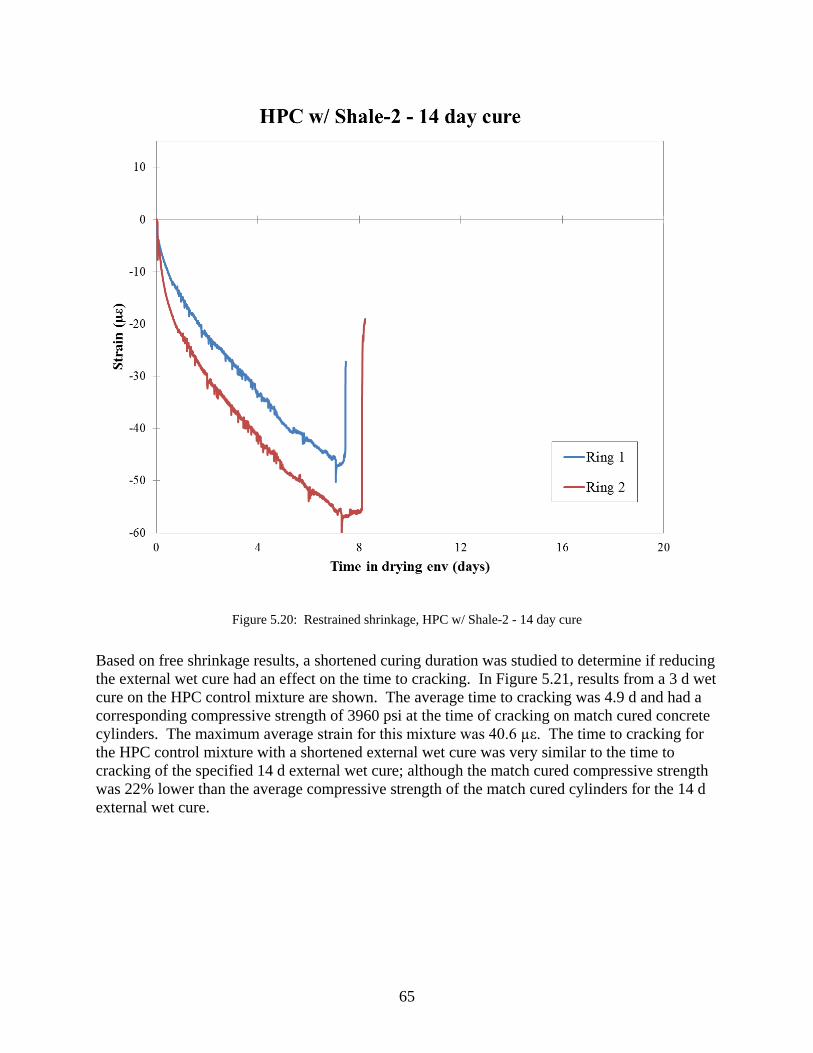
Figure 5.20: Restrained shrinkage, HPC w/ Shale-2 - 14 day cure
Based on free shrinkage results, a shortened curing duration was studied to determine if reducing the external wet cure had an effect on the time to cracking. In Figure 5.21, results from a 3 d wet cure on the HPC control mixture are shown. The average time to cracking was 4.9 d and had a corresponding compressive strength of 3960 psi at the time of cracking on match cured concrete cylinders. The maximum average strain for this mixture was 40.6 µε. The time to cracking for the HPC control mixture with a shortened external wet cure was very similar to the time to cracking of the specified 14 d external wet cure; although the match cured compressive strength was 22% lower than the average compressive strength of the match cured cylinders for the 14 d external wet cure.
65

Figure 5.21: Restrained shrinkage, HPC control - 3 day cure
Restrained shrinkage data for mixture HPC w/ SRA, and a 3 d external wet cure, is shown in Figure 5.22. The average time to cracking for the three rings was 16.8 d with a maximum average strain of 33.4 µε. The compressive strength of match cured cylinders at the time of cracking was 4560 psi. Cracking was observed on one of the three rings at 13.6 d, and cracking was observed in the other two rings at 18.2 and 18.5 d, respectively. With the addition of SRA, the time to cracking was extended by 12.4 d, for the reduced external wet cure duration of 3 days. As expected, the rate of shrinkage was also reduced when compared to the HPC control mixture. This corresponds well to free shrinkage data reported in section 5.6. Similar results on the prolonged time to cracking in restrained shrinkage on HPC incorporating SRAs were found by Folliard et al (Folliard et al. 2003).
66
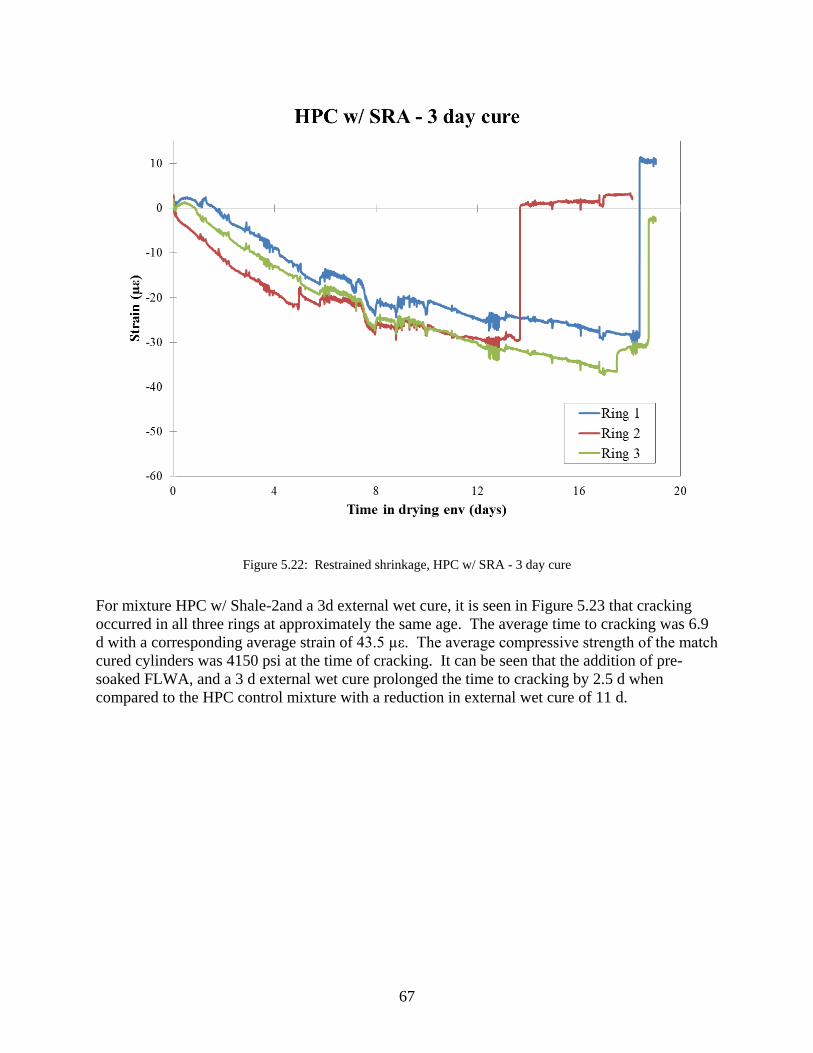
Figure 5.22: Restrained shrinkage, HPC w/ SRA - 3 day cure
For mixture HPC w/ Shale-2and a 3d external wet cure, it is seen in Figure 5.23 that cracking occurred in all three rings at approximately the same age. The average time to cracking was 6.9 d with a corresponding average strain of 43.5 µε. The average compressive strength of the match cured cylinders was 4150 psi at the time of cracking. It can be seen that the addition of pre-soaked FLWA, and a 3 d external wet cure prolonged the time to cracking by 2.5 d when compared to the HPC control mixture with a reduction in external wet cure of 11 d.
67
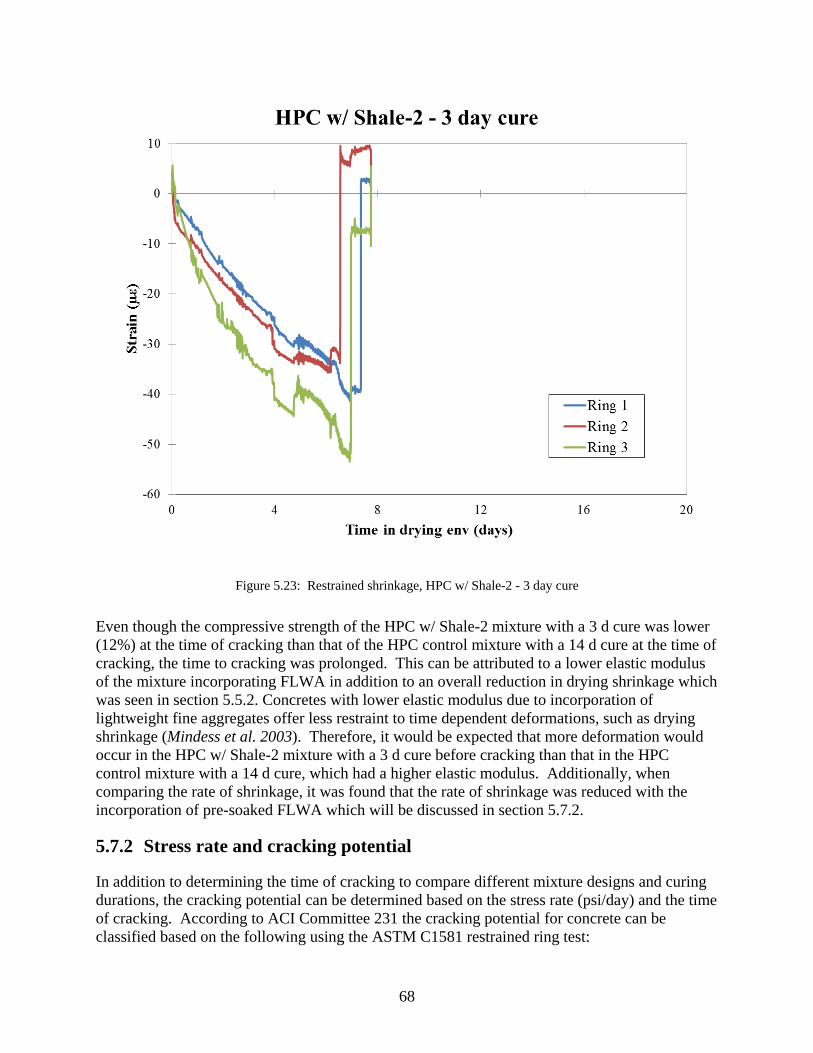
Figure 5.23: Restrained shrinkage, HPC w/ Shale-2 - 3 day cure
Even though the compressive strength of the HPC w/ Shale-2 mixture with a 3 d cure was lower (12%) at the time of cracking than that of the HPC control mixture with a 14 d cure at the time of cracking, the time to cracking was prolonged. This can be attributed to a lower elastic modulus of the mixture incorporating FLWA in addition to an overall reduction in drying shrinkage which was seen in section 5.5.2. Concretes with lower elastic modulus due to incorporation of lightweight fine aggregates offer less restraint to time dependent deformations, such as drying shrinkage (Mindess et al. 2003). Therefore, it would be expected that more deformation would occur in the HPC w/ Shale-2 mixture with a 3 d cure before cracking than that in the HPC control mixture with a 14 d cure, which had a higher elastic modulus. Additionally, when comparing the rate of shrinkage, it was found that the rate of shrinkage was reduced with the incorporation of pre-soaked FLWA which will be discussed in section 5.7.2.
5.7.2 Stress rate and cracking potential
In addition to determining the time of cracking to compare different mixture designs and curing durations, the cracking potential can be determined based on the stress rate (psi/day) and the time of cracking. According to ACI Committee 231 the cracking potential for concrete can be classified based on the following using the ASTM C1581 restrained ring test:
68

• A zone of high potential for cracking, stress rates exceeding 50 psi/day and crackingoccurring within 7 d after the initiation of drying
• A zone of moderate-high potential for cracking, stress rates between 25 and 50 psi/dayand cracking occurring between 7 and 14 d after the initiation of drying
• A zone of moderate-low potential for cracking, stress rates between 15 and 25 psi/dayand cracking occurring between 14 and 28 d after the initiation of drying
• A zone of low potential for cracking, stress rates lower than 15 psi/day and crackingoccurring beyond 28 d from initiation of drying, or no cracking occurring between 28days and the end of the test(ACI Committee 231 2010)
The stress rate was calculated according to the procedure laid out by See and co-workers (See et al. 2004) . A summary of the time of cracking and stress rates for the different concrete mixtures is found in Table 5.10.
Table 5.10: Summary of cracking potential of different concrete mixtures
It can be seen that the HPC control mixture, regardless of the curing duration, had a high potential for cracking based on both the stress rate generation and the time of cracking. With the
Mixture MSACuring
Duration (days)
RingTime of
Cracking (days)
Stress Rate
(psi/day) at ToC
Cracking Potential
Average ToC
(days)
Overall Evaluation
1 4.0 55 H2 5.5 46 MH3 5.2 49 MH1 2.4 80 H2 4.4 50 MH3 6.6 28 MH4 4.6 41 MH5 3.6 70 H1 4.3 38 MH2 3.5 53 H3 3.5 51 H1 6.5 34 MH2 7.0 31 MH3 7.3 41 MH1 7.4 35 MH2 7.9 38 MH1 13.9 14 ML-L2 18.4 11 ML-L3 18.8 14 ML-L1 16.1 15 ML2 14.9 13 ML-L3 11.6 20 ML
High
High
Moderate-High
Moderate-High
Moderate-Low
Moderate-Low14
Time of Cracking in ASTM Rings (days)
4.9
4.3
3.8
6.9
7.7
17.0
14.2
High3
14
14
3
14
3
HPC w/ SRA
3/4"
3/4"
1/2"
3/4"
3/4"
3/4"
3/4"
HPC Control
HPC Control
HPC Control
HPC w/ Shale-2
HPC w/ Shale-2
HPC w/ SRA
69
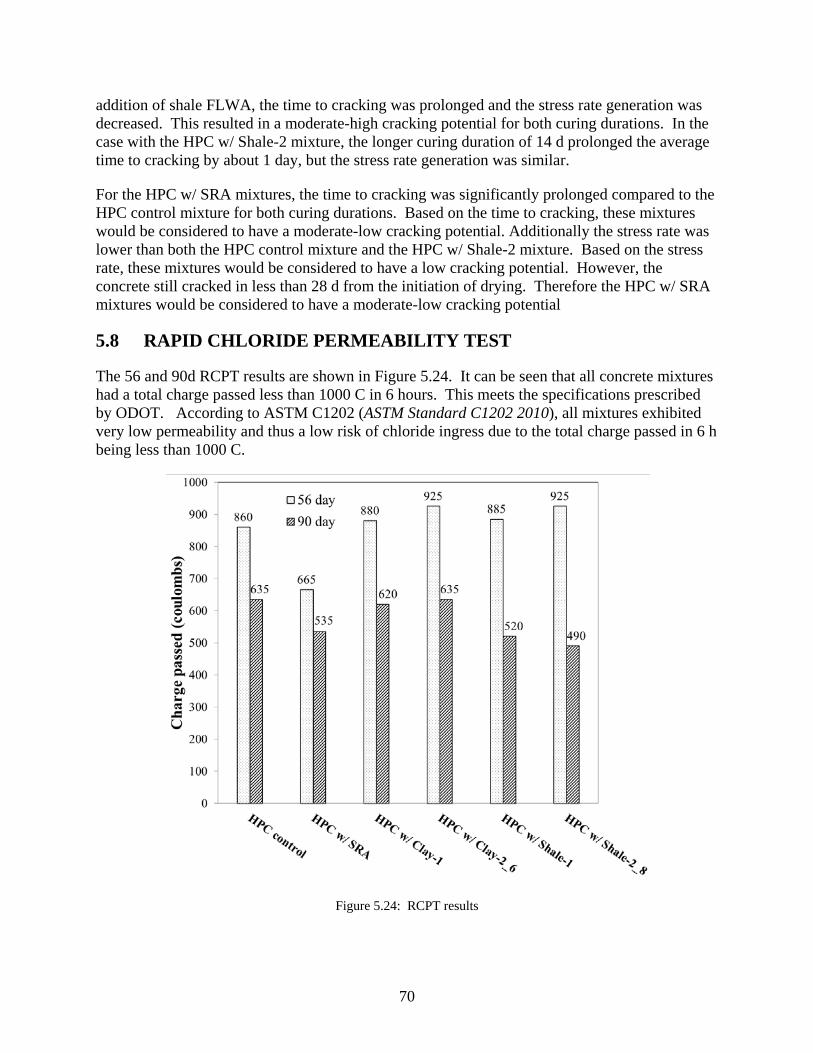
addition of shale FLWA, the time to cracking was prolonged and the stress rate generation was decreased. This resulted in a moderate-high cracking potential for both curing durations. In the case with the HPC w/ Shale-2 mixture, the longer curing duration of 14 d prolonged the average time to cracking by about 1 day, but the stress rate generation was similar.
For the HPC w/ SRA mixtures, the time to cracking was significantly prolonged compared to the HPC control mixture for both curing durations. Based on the time to cracking, these mixtures would be considered to have a moderate-low cracking potential. Additionally the stress rate was lower than both the HPC control mixture and the HPC w/ Shale-2 mixture. Based on the stress rate, these mixtures would be considered to have a low cracking potential. However, the concrete still cracked in less than 28 d from the initiation of drying. Therefore the HPC w/ SRA mixtures would be considered to have a moderate-low cracking potential
5.8 RAPID CHLORIDE PERMEABILITY TEST
The 56 and 90d RCPT results are shown in Figure 5.24. It can be seen that all concrete mixtures had a total charge passed less than 1000 C in 6 hours. This meets the specifications prescribed by ODOT. According to ASTM C1202 (ASTM Standard C1202 2010), all mixtures exhibited very low permeability and thus a low risk of chloride ingress due to the total charge passed in 6 h being less than 1000 C.
Figure 5.24: RCPT results
70
The HPC control mixture had a 56-d value of 860 C passed in 6 h. The 90 d results produced a value of 635 C passed in 6 h. The additional curing thus provided a less permeable concrete and one that would be even more resistant to ingress of deleterious chlorides based on this test.
Mixture HPC w/ SRA had a 56 d value of 665 C and 90 d value of 540 C respectively. The 56 d value for HPC w/ SRA was 23% lower than that of the HPC control mixture, and the 90 d value 15% lower than the HPC control. The decreased permeability in concrete mixtures incorporating SRAs was also found in research performed by Berke et al.(Berke et al. 2003) and Bentz (Bentz 2009).
Mixtures incorporating lower dosages (CS = 0.056 ml/g) of FLWA performed similarly to the HPC control mixture with a 56 d cure. It can be seen that with higher dosages of FLWA, the permeability of the concrete was slightly higher at 56 d, as measured by ASTM C1202. However, at 90 d the permeability was the same in the mixtures incorporating the clay FLWA as in the control mixture. However, in the mixture incorporating the shale FLWA, the charge passed was reduced from 635 C in the HPC control mixture to 490 C in the HPC w/ Shale-2 mixture. The reduction in permeability from 56 d to 90 d can be attributed to the improved hydration and densification of the ITZ with the FLWA as observed by Bentz (Bentz 2009).
Additional testing to study the impact of air-entrainment on permeability in conjunction with FLWA was performed on the FLWA mixtures that were proportioned with CS = 0.07 g/g. It can be seen in Table 5.11that the amount of entrained air has an effect on the permeability of the concrete, especially at 56 d testing.
Table 5.11: RCPT results, FLWA air study
At 56 d it was found that there was a reduction in permeability with a decrease in air content. This finding was especially profound in the mixtures incorporating expanded shale FLWA. It was found that with a 3.5% reduction in air content resulted in 36.7% reduction in charge passed. These results are supported by research by Zhang and Gjorv (Zhang and Gjorv 1991). In their research, it was found that the porosity of the mortar matrix played a more important role than the porosity of the aggregate when determining the permeability of the concrete. However, the same trend was not observed in RCPT results on the mixtures cured for 90 d. The mixtures with the same FLWAs typically exhibited similar permeability regardless of the air content. The mixtures with expanded shale had lower permeability than those with expanded clay. This suggests that aggregates with very high absorption capacities (>30%) may have increased permeability. It is recommended that further research on actual chloride ingress to calculate diffusion rates be conducted to confirm this observation. However, it should be noted that regardless of the air entrainment, the permeability of the concrete made with the pre-soaked
Air content 56 day 90 dayHPC w/ Clay-2_4 4.25% 845 540HPC w/ Clay-2_6 6.25% 925 635HPC w/ Shale-2_4 4.50% 585 490HPC w/ Shale-2_8 8.00% 925 490
Charge Passed (coulombs)
71
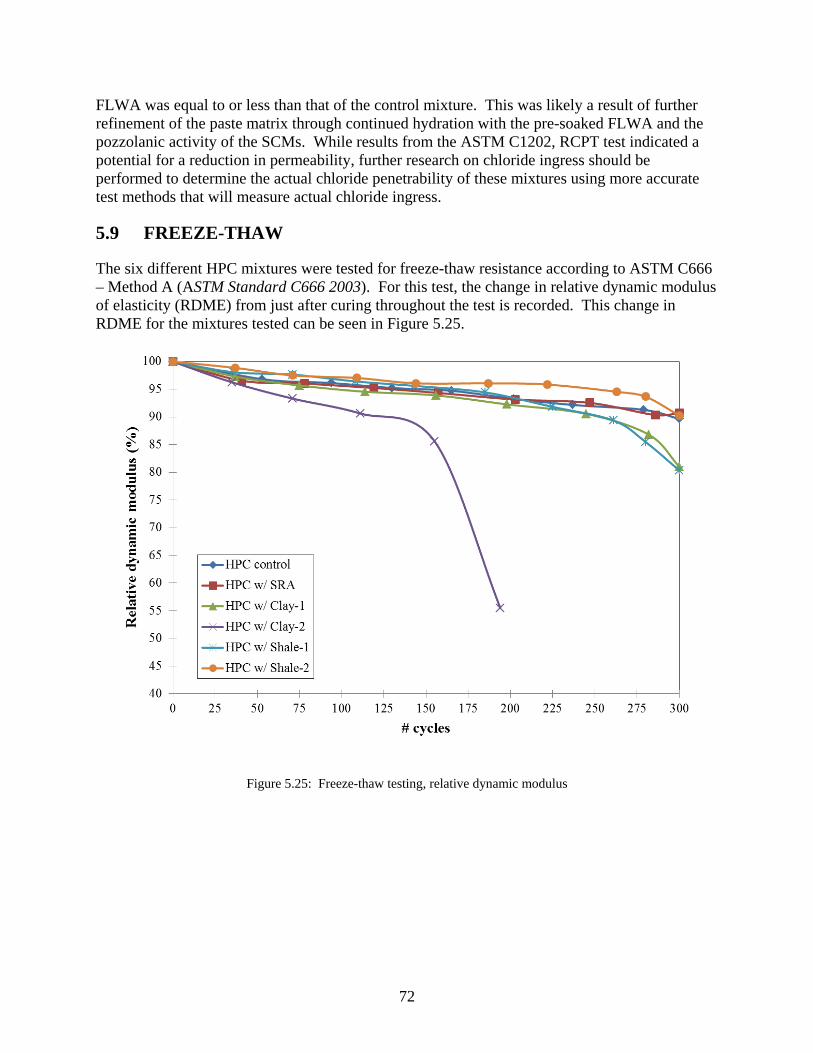
FLWA was equal to or less than that of the control mixture. This was likely a result of further refinement of the paste matrix through continued hydration with the pre-soaked FLWA and the pozzolanic activity of the SCMs. While results from the ASTM C1202, RCPT test indicated a potential for a reduction in permeability, further research on chloride ingress should be performed to determine the actual chloride penetrability of these mixtures using more accurate test methods that will measure actual chloride ingress.
5.9 FREEZE-THAW
The six different HPC mixtures were tested for freeze-thaw resistance according to ASTM C666 – Method A (ASTM Standard C666 2003). For this test, the change in relative dynamic modulusof elasticity (RDME) from just after curing throughout the test is recorded. This change in RDME for the mixtures tested can be seen in Figure 5.25.
Figure 5.25: Freeze-thaw testing, relative dynamic modulus
72
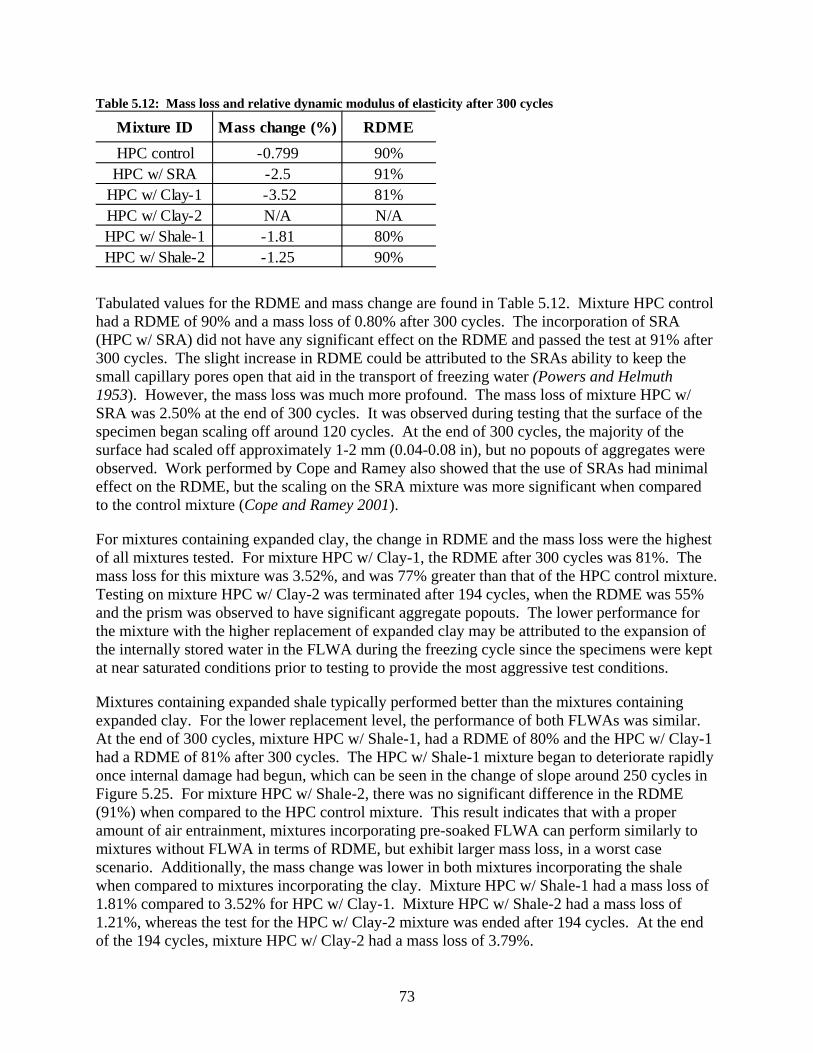
Table 5.12: Mass loss and relative dynamic modulus of elasticity after 300 cycles
Tabulated values for the RDME and mass change are found in Table 5.12. Mixture HPC control had a RDME of 90% and a mass loss of 0.80% after 300 cycles. The incorporation of SRA (HPC w/ SRA) did not have any significant effect on the RDME and passed the test at 91% after 300 cycles. The slight increase in RDME could be attributed to the SRAs ability to keep the small capillary pores open that aid in the transport of freezing water (Powers and Helmuth 1953). However, the mass loss was much more profound. The mass loss of mixture HPC w/SRA was 2.50% at the end of 300 cycles. It was observed during testing that the surface of the specimen began scaling off around 120 cycles. At the end of 300 cycles, the majority of the surface had scaled off approximately 1-2 mm (0.04-0.08 in), but no popouts of aggregates were observed. Work performed by Cope and Ramey also showed that the use of SRAs had minimal effect on the RDME, but the scaling on the SRA mixture was more significant when compared to the control mixture (Cope and Ramey 2001).
For mixtures containing expanded clay, the change in RDME and the mass loss were the highest of all mixtures tested. For mixture HPC w/ Clay-1, the RDME after 300 cycles was 81%. The mass loss for this mixture was 3.52%, and was 77% greater than that of the HPC control mixture. Testing on mixture HPC w/ Clay-2 was terminated after 194 cycles, when the RDME was 55% and the prism was observed to have significant aggregate popouts. The lower performance for the mixture with the higher replacement of expanded clay may be attributed to the expansion of the internally stored water in the FLWA during the freezing cycle since the specimens were kept at near saturated conditions prior to testing to provide the most aggressive test conditions.
Mixtures containing expanded shale typically performed better than the mixtures containing expanded clay. For the lower replacement level, the performance of both FLWAs was similar. At the end of 300 cycles, mixture HPC w/ Shale-1, had a RDME of 80% and the HPC w/ Clay-1 had a RDME of 81% after 300 cycles. The HPC w/ Shale-1 mixture began to deteriorate rapidly once internal damage had begun, which can be seen in the change of slope around 250 cycles in Figure 5.25. For mixture HPC w/ Shale-2, there was no significant difference in the RDME (91%) when compared to the HPC control mixture. This result indicates that with a proper amount of air entrainment, mixtures incorporating pre-soaked FLWA can perform similarly to mixtures without FLWA in terms of RDME, but exhibit larger mass loss, in a worst case scenario. Additionally, the mass change was lower in both mixtures incorporating the shale when compared to mixtures incorporating the clay. Mixture HPC w/ Shale-1 had a mass loss of 1.81% compared to 3.52% for HPC w/ Clay-1. Mixture HPC w/ Shale-2 had a mass loss of 1.21%, whereas the test for the HPC w/ Clay-2 mixture was ended after 194 cycles. At the end of the 194 cycles, mixture HPC w/ Clay-2 had a mass loss of 3.79%.
Mixture ID Mass change (%) RDMEHPC control -0.799 90%HPC w/ SRA -2.5 91%
HPC w/ Clay-1 -3.52 81%HPC w/ Clay-2 N/A N/AHPC w/ Shale-1 -1.81 80%HPC w/ Shale-2 -1.25 90%
73
When comparing the two mixtures incorporating FLWA, it was seen that the shale FLWA performed better than the clay. One reason for this may be attributed to the absorption capacity of the aggregates. The shale had a lower absorption capacity and therefore a lower amount of internally absorbed water would be in each aggregate. During the hydration of cement, the FLWA will give off much of its absorbed water. Since the specimens were kept in a 100% RH environment until testing, the FLWA could still have some internally absorbed water. Furthermore, in FLWAs with lower absorption capacity, there would be less expansion in the aggregate due to freezing of the internally stored water. It can be seen that in mixture HPC w/ Shale-2, the higher air content performed better than HPC w/ Shale-1 which had a lower air content even though there was more FLWA present. The higher air content provided increased freeze-thaw performance. In mixtures incorporating pre-soaked FLWA that are subjected to freezing and thawing conditions in a near saturated condition, a higher air content may be needed to provide similar performance to mixtures that do not have FLWA under similar conditions.
ASTM C330 (ASTM Standard C330 2009), testing of concretes with FLWA ,states to dry the specimen for 14 d prior to testing where ASTM C666 states that the specimens should be kept in a saturated condition. This would have allowed the internally absorbed water in the aggregate to be released prior to testing. The release of the water would have produced a refined ITZ around the FLWA. The densification of the ITZ around the aggregate could have made it difficult for the FLWA to re-absorb water during freeze-thaw testing. This would have eliminated any potentially deleterious effect of the FLWA expanding during the freezing cycle. A recommended modification would be that the internal RH development of the concrete should be determined prior to testing to approximate how much internally absorbed water is left in the FLWA. Once the internal RH of the concrete is known, the amount of water in the FLWA can be approximated from desorption testing on the FLWA.
74
6.0 CONCLUSIONS
High performance concrete is susceptible to the deleterious and combined effects of autogenous and drying shrinkage. If the specimen is restrained, the tensile stress development may exceed the tensile strength, leading to premature cracking. The use of SRAs and pre-soaked FLWA have been shown to be effective methods to reduce both types of shrinkage. However, the focus has mainly been on the reduction of autogenous deformation. Since the magnitude of drying shrinkage is typically much higher (5-10 times or more) this is an important area for study. In addition to a lack of information on long-term drying shrinkage the overall performance, specifically durability, of concrete specimens incorporating these mitigation measures is also lacking.
The goal of this research project was to determine the ability of SRAs and internal curing, using pre-soaked FLWA, to reduce long-term drying shrinkage in HPC prisms. In addition to performing drying shrinkage testing, durability testing was performed to ensure that the neither of the shrinkage mitigation techniques had a negative impact on durability. Freeze-thaw, permeability and restrained drying shrinkage testing to determine the cracking potential was also performed.
Overall conclusions from this research were:
6.1 DRYING SHRINKAGE
• For the range of external curing durations investigated (1, 3, 7, 10 and 14 d) it wasobserved that external wet curing beyond 3 d did not provide any additional protectionagainst drying shrinkage for the HPC mixtures investigated in this study (compared to thecurrent 14 d external wet curing duration).
• The use of FLWA, SRA and combinations of both were shown to provide improvedprotection against drying shrinkage in particular at shorter external wet curing durations(up to 3 d of external wet curing). Beyond three days of external wet curing mixtureswith 2.0% SRA or 25% FLWA + 2.0% SRA (by mass of total cementitious) were themost beneficial in reducing long-term drying shrinkage.
• The replacement of normal weight fine aggregate with FLWA at percentages rangingfrom 10-100% showed a reduction in long-term drying shrinkage compared to a highperformance control concrete mixture (0.37 w/cm, 30% Class F fly ash, 4% silica fume,633 lb/yd3 total cementitious and natural river gravel). The reduction in drying shrinkagewas most pronounced for mixtures with a 25 and 100% replacement using an expandedshale as the FLWA. This was particularly evident at shorter external wet curingdurations.
75
• At longer external wet curing durations (e.g. 7, 10 and 14 d) the use of FLWA on its ownwas comparable to the control HPC mixture in terms of the magnitude of dryingshrinkage observed thereafter. This was likely due to most (if not all) of the internallystored water in the aggregate being consumed in hydration or to mitigate autogenousshrinkage during the curing process. Therefore, no additional internal water wasavailable to provide protection against drying shrinkage. Higher replacements of FLWAmay need to be added to the mixture design to mitigate drying shrinkage. However,higher percentages were not fully investigated in this project as there was concern aboutabrasion of high performance concrete bridge decks since the use of studded tires duringthe winter are permitted in Oregon.
• The incorporation of a shrinkage reducing admixture at a standard 2% dosage by mass ofcementitious material was more effective than the FLWA replacements alone. However,the addition of SRA reduced the compressive strength slightly below the target strength(of 5,000 psi at 28 d). The strength was recovered by 56 d of testing.
• The most effective means of reducing drying shrinkage was through the replacement ofnormal weight fine aggregate with FLWA (at 25%) and incorporation of SRA where anaverage reduction in shrinkage of 23% at 365 d after initiation of drying(various externalwet cure durations) was observed.
6.2 DURABILITY
• When tested in the ASTM C1581 restrained ring test, the HPC control mixture,regardless of the curing duration, had a high potential for cracking (ACI 231 Committee2010) based on both the stress rate generation and the time of cracking.
• With the addition of shale FLWA, the time to cracking was prolonged in the ASTMC1581 restrained ring test and the stress rate generation was decreased. This resulted in amoderate-high cracking potential for both curing durations (3 and 14 d). In the case withthe HPC w/ Shale-2 mixture, the longer curing duration of 14 d prolonged the averagetime to cracking by about 1 day, but the stress generation rate was similar.
• For the HPC w/ SRA mixtures, the time to cracking was significantly prolongedcompared to the HPC control mixture for both curing durations. Based on the time tocracking alone, these mixtures would be considered to have a moderate-low crackingpotential. Additionally the stress rate was lower than both the HPC control mixture andthe HPC w/ Shale-2 mixture. Based on the stress rate alone, these mixtures would beconsidered to have a low cracking potential. However, since the concrete still cracked inless than 28 d from the initiation of drying, the HPC w/ SRA mixtures would beconsidered to have a moderate-low cracking potential
• No reduction in relative dynamic modulus of elasticity in mixtures containing SRA wasobserved when tested for freeze-thaw resistance. However, surface scaling was observedin these specimens after 300 cycles of testing commensurate with mass lossmeasurements.
76
• Conflicting results on the performance of FLWA mixtures was found when tested forfreeze-thaw resistance. When an adequate air void system was present in the HPC, themixtures incorporating FLWA maintained a relative dynamic modulus of 90 or higher(mixtures said to have a high resistance from freeze-thaw attack according to ASTMC666). The air content for mixtures incorporating FLWA may need to be higher than acomparable mixture without FLWA when the concrete is nearly saturated (e.g. worst-case scenario for freeze/thaw attack). Additional testing on the freeze-thaw performanceof HPC incorporating FLWA should be performed following the guidelines of ASTMC330.
• The incorporation of both shrinkage mitigation techniques (SRA or pre-soaked FLWA)reduced the chloride penetrability of the HPC mixture according to the rapid chloridepermeability test, ASTM C1202. All mixtures passed the test with total charge passedless than 1,000 C at 56 d of curing (ODOT required specification). The 56 d value formixture incorporating SRA was 23% lower than that of the control mixture, and the 90 dvalue 15% lower than that of the control mixture.
• Mixtures incorporating FLWA (clay and shale)as are placement of the normal weight fineaggregate performed, in terms of total charge passed in 6 hours ,similarly to the controlwith a 56 d cure in ASTM C1202. At 90 d, the permeability was lower in the mixturescontaining FWLA when compared to the control mixture. All of the mixtures testedresulted in a total charge passed less than 1000 C at all ages. This resulted in themixtures being classified as having a very low chloride ion penetrability based on theparameters in ASTM C1202.
6.3 RECOMMENDATIONS FOR HIGH PERFORMANCE CONCRETE BRIDGE DECKS BASED ON THIS RESEARCH
Based on the results in this research report, it is evident that the high performance concrete mixture investigated has a high potential for long-term drying shrinkage and thus a high risk for cracking. Furthermore, it was observed that external wet curing beyond 3 d, compared to the 14 d control, did not provide any additional reduction in long-term drying shrinkage.
• For the high performance concrete mixture investigated herein to be effectively used inconcrete bridge deck applications it is recommended that some method of shrinkagereduction be incorporated. This may be the use of fine lightweight aggregate (FLWA atapproximately 25%replacement of the normal weight fine aggregate is a good startingpoint), shrinkage reducing admixture (SRA) at a 2.0% addition by mass of cement, or acombination of both techniques.
• Reducing the external curing duration to less than 3 d is not recommended based on theresults of this research project even when the techniques above are employed.
• Techniques should be investigated to reduce the shrinkage potential in the highperformance concrete mixture investigated in this research project. These techniquesshould be verified to ensure that mechanical and durability requirements are still metwhile the drying shrinkage is reduced. Such improvements may include a slightly higher
77
w/cm (0.40 to 0.44), lowered total cementitious content, larger maximum size aggregate and/or different supplementary cementitious materials or altered amounts of supplementary cementitious materials.
6.4 FUTURE RESEARCH
While the testing herein showed an overall reduction in drying shrinkage for the various mitigation methods and similar durability performance, further investigations are recommended.
• Evaluate the baseline high performance concrete mixture for modifications which canreduce the inherent shrinkage potential. This may include a lower cementitious content,different supplementary cementitious materials, a slightly higher water/cement ratio andlarger maximum size aggregate among others.
• Ensure that modifications to the baseline HPC mixture (recommended above) still meetODOT specifications.
• It is recommended that restrained ring testing (ASTM C 1581) and drying shrinkage(ASTM C 157) for HPC mixtures incorporating FLWA and SRA should be conductedonce the base HPC mixture is evaluated and modified.
• The use of synthetic fibers (both uniform size and blended size) should be investigated tosee how mechanical confinement can aid in the reduction of long-term shrinkage of highperformance concrete. This technique in combination with FLWA and/or SRA mayprovide an effective means of reducing shrinkage parameters in the baseline HPC mixtureas well.
• Freeze-thaw testing meeting ASTM C330 should be performed to accurately verify theperformance of mixtures incorporating FLWA.
• Finally, it is recommended that small-scale trial (s) be conducted (field sites preferred butsmall scale bridge decks at an outdoor exposure site such as the one at Oregon StateUniversity would be acceptable) to ensure performance of a candidate mixture(s) prior tofull implementation.
There are a number of states that have field trials with fine lightweight aggregate and/or SRA as a mitigation technique for shrinkage. Those states with the most experience include New York, Texas, Indiana, and Illinois as well as other limited trials in other states. Their experience may prove useful, as well when moving forward to implement the research findings from this project and/or validate additional investigations.
78
7.0 REFERENCES
AASHTO (2002). "Standard Method of Test for Resistance of Concrete to Chloride Ion Penetration." AASHTO T259, AASHTO, ed.
ACI Committee 201 (2008). "Guide to Durable Concrete." ACI 201.2R-08, American Concrete Institute, Farmington Hills, MI.
ACI Committee 231 (2010). "Report on Early-Age Cracking: Causes, Measurement, and Mitigation." American Concrete Institute, Farmington Hills, Michigan.
ACI Committee 308 (2011). "Specifications for Curing Concrete." American Concrete Institute, Farmington Hills, Michigan.
Adam, A. A. (2009). "Strength and Durability Properties of Alkali Activated Slag and Fly Ash-Based Geopolymer Concrete." Doctor of Philosophy, RMIT University, Melbourne, Australia.
Aitcin, P.-C. "Autogenous Shrinkage Measurement." Proc., Proc., Autoshrink '98: International Workshop on Autogenous Shrinkage of Concrete, 245 - 256.
Al-Manaseer, A., and Ristanovic, S. (2004). "Predicting Drying Shrinkage of Concrete." Concrete International, 26(08), 79-83.
ASTM Standard C39 (2009). "Standard Test Method for Compressive Strength of Cylindrical Concrete Specimens." ASTM C39-09a, ASTM International, ed., ASTM International, West Conshocken, PA.
ASTM Standard C42 (2012). "Standard Test Method for Obtaining and Testing Drilled Cores and Sawed Beams of Concrete." ASTM C 142-12, ASTM International, ed., ASTM International, West Conshocken, PA.
ASTM Standard C128 (2007). "Standard Test Method for Density, Relative Density (Specific Gravity), and Absorption of Fine Aggregate." ASTM C 128-07a, ASTM International, ed., ASTM International, West Conshocken, PA.
ASTM Standard C150 (2009). "Standard Specification for Portland Cement." ASTM C 150-09, ASTM International, ed., ASTM International, West Conshocken, PA.
ASTM Standard C157 (2008). "Standard Test Method for Length Change of Hardened Hydraulic-Cement Mortar and Concrete." ASTM C157-08, ASTM International, ed., ASTM International, West Conshocken, PA.
79
ASTM Standard C191 (2008). " Standard Test Methods for Time of Setting of Hydraulic Cement by Vicat Needle." ASTM C191-08, ASTM International, ed., ASTM International, West Conshocken, PA.
ASTM Standard C192 (2007). "Standard Practice for Making and Curing Concrete Test Specimens in the Laboratory." ASTM C 192-07, ASTM International, ed., ASTM International, West Conshocken, PA.
ASTM Standard C215 (2008). "Standard Test Method for Fundamental Transverse, Longitudinal, and Torsional Resonant Frequencies of Concrete Specimens." ASTM C215-08, ASTM International, ed., ASTM International, West Conshocken, PA.
ASTM Standard C305 (2006). "Standard Practice for Mechanical Mixing of Hydraulic Cement Pastes and Mortars of Plastic Consistency." ASTM C305-06, ASTM International, ed., ASTM International, West Conshocken, PA.
ASTM Standard C330 (2009). "Standard Specification for Lightweight Aggregates for Structural Concrete." ASTM C330-09, ASTM International, ed., ASTM International, West Conshocken, PA.
ASTM Standard C469 (2002). "Standard Test Method for Static Modulus of Elasticity and Poisson’s Ratio of Concrete in Compression." ASTM C469-02e1, ASTM International, ed., ASTM International, West Conshocken, PA.
ASTM Standard C494 (2010). "Standard Specification for Chemical Admixtures for Concrete." ASTM C494-10, ASTM International, ed., ASTM International, West Conshocken, PA.
ASTM Standard C496 (2004). "Standard Test Method for Splitting Tensile Strength of Cylindrical Concrete Specimens." ASTM C496-04e1, ASTM International, ed., ASTM International, West Conshocken, PA.
ASTM Standard C511 (2009). "Standard Specification for Mixing Rooms, Moist Cabinets, and Water Storage Tanks Used in the Testing of Hydraulic Cements and Concretes." ASTM C 1511-09, ASTM International, ed., ASTM, West Conshohocken, PA.
ASTM Standard C618 (2008). "Standard Specification for Coal Fly Ash and Raw or Calcined Natural Pozzolan for Use in Concrete." ASTM C 618-08, ASTM International, ed., ASTM International, West Conshocken, PA.
ASTM Standard C666 (2003). "Standard Test Method for Resistance of Concrete to Rapid Freezing and Thawing." ASTM C666-03, ASTM International, ed., ASTM International, West Conshocken, PA.
ASTM Standard C1202 (2010). "Standard Test Method for Electrical Indication of Concrete's Ability to Resist Chloride Ion Penetration." ASTM C1202-10, ASTM International, ed., ASTM International, West Conshocken, PA.
80
ASTM Standard C1240 (2005). "Standard Specification for Silica Fume Used in Cementitious Mixtures." ASTM C1240-05, ASTM International, ed., ASTM International, West Conshocken, PA.
ASTM Standard C1498 (2004). "Standard Test Method for Hygroscopic Sorption Isotherms of Building Materials." ASTM C 1498-04a, ASTM International, ed., ASTM International, West Conshohocken, PA.
ASTM Standard C1608 (2007). "Standard Test Method for Chemical Shrinkage of Hydraulic Cement Paste." ASTM C1608-07, ASTM International, ed., ASTM International, West Conshocken, PA.
ASTM C1581 (2004). "ASTM C1581: Standard Test Method for Determining Age at Cracking and Induced Tensile Stress Characteristics of Mortar and Concrete under Restrained Shrinkage." ASTM C 1581, ASTM International, ed., ASTM International, West Conshohocken, PA.
ASTM C1698 (2009). "ASTM C1698: Standard Test Method of Autogenous Deformation." ASTM C 1698, ASTM International, ed., ASTM International, West Conshocken, Pennsylvania.
Atiş, C. D. (2003). "High-Volume Fly Ash Concrete with High Strength and Low Drying Shrinkage." Journal of Materials in Civil Engineering(March-April 2003), 153-156.
Babaei, K., and Fouladgar, A. M. (1997). "Solutions to Concrete Bridge Deck Cracking." Concrete International, 19(7), 34-37.
Bae, J., Berke, N. S., Hoopes, R. J., and Malone, J. (2002). "Freezing and Thawing Resistance of Concretes with Shrinkage Reducing Admixtures." PRO 24 (Frost Resistance of Concrete: From Nano-Structure and Pore Solution Macroscopic Beaviour and Testing, 327-333.
Beaudoin, J. J., and Liu, Z. (2000). "The Permeability of Cement Systems to Chloride Ingress and Related Test Methods." Cement, Concrete, and Aggregates, 22(1), 16-23.
Bentur, A., Igarashi, S.-i., and Kovler, K. (2001). "Prevention of autogenous shrinkage in high-strength concrete by internal curing using wet lightweight aggregates." Cement and Concrete Research, 31(11), 1587-1591.
Bentz, D., Kim, H., Mokarem, D., Rodriguez, F., Lura, P., and Weiss, J. (2009). "ACI 2009 Spring Convention-Early-Age Test Methods." March 17, 2009.
Bentz, D. P. (2006). "Influence of Shrinkage-Reducing Admixtures on Early-Age Properties of Cement Pastes." Journal of Advanced Concrete Technology, 4(3), 423-429.
Bentz, D. P. (2007). "Internal Curing of High-Performance Blended Cement Mortar." ACI Materials Journal, 104(4), 408-414.
Bentz, D. P. (2009). "Influence of internal curing using lightweight aggregates on interfacial transition zone percolation and chloride ingress in mortars." Cement and Concrete Composites, 31(5), 285-289.
81
Bentz, D. P., and Garboczi, E. J. (1991). "Simulation Studies of the Effects of Mineral Admixtures on the Cement Paste-Aggregate Interfacial Zone." ACI, SP-105, 518-529.
Bentz, D. P., Geiker, M. R., and Hansen, K. K. (2001). "Shrinkage-Reducing Admixtures and Early-Age Desiccation in Cement Pastes and Mortars." Cement and Concrete Research, 31(7), 1075-1085.
Bentz, D. P., Halleck, P. M., Grader, A. S., and Roberts, J. W. (2006). "Water Movement during Internal Curing." Concrete International, 28(10), 39-45.
Bentz, D. P., and Jensen, O. M. (2004). "Mitigation strategies for autogenous shrinkage cracking." Cement and Concrete Composites, 26(6), 677-685.
Bentz, D. P., Lura, P., and Roberts, J. W. (2005). "Mixture Proportioning for Internal Curing." Concrete International, 27(02), 35-40.
Bentz, D. P., and Snyder, K. A. (1999). "Protected Paste Volume in Concrete: Extension to Internal Curing Using Saturated Lightweight Fine Aggregate." Cement and Concrete Research, 29(11), 1863-1867.
Berke, N. S., Dallaire, M. P., Hicks, M. C., and Kerkar, A. (1997). "New Developments in Shrinkage-Reducing Admixtures." Fifth CANMET/ACI International Conference on Superplasticizers and Other Chemical Admixtures in Concrete SP-173, 973-1000.
Berke, N. S., Li, L., Hicks, M. C., and Bae, J. (2003). "Improving Concrete Performance with Shrinkage-Reducing Admixtures." ACI, SP-217, 37-50.
Bishnoi, S. (2009). "Automated Chemical Shrinkage Test and Shrinkage Suite Software."
Bissonnette, B., Pierre, P., and Pigeon, M. (1999). "Influence of Key Parameters on Drying Shrinkage of Cementitious Materials." Cement and Concrete Research, 29(10), 1655-1662.
Boivin, S., Acker, P., Rigaud, S., and Clavaud, B. "Experimental Assessment of Cemical Shrinkage of Hydrating Cement Paste." Proc., Autoshrink '98 Proceedings of the International Workshop on Autogenous Shrinkage of Concrete, 77-88.
Bouasker, M., Mounanga, P., Turcry, P., Loukili, A., and Khelidj, A. (2008). "Chemical Shrinkage of Cement Pastes and Mortars at Very Early Age: Effect of Limestone Filler and Granular Inclusions." Cement and Concrete Composites, 30(1), 13-22.
Bunke, D. (1988). "ODOT Experience with Silica-Fume Concrete." Transportation Research Record(No. 1204), 27-35.
Castro, J., Keiser, L., Golias, M., and Weiss, J. (2011). "Absorption and desorption properties of fine lightweight aggregate for application to internally cured concrete mixtures." Cement and Concrete Composites, 33(10), 1001-1008.
82
Chen, P.-W., and Chung, D. D. L. (1996). "Low-Drying-Shrinkage Concrete Containing Carbon Fibers." Composites Part B: Engineering, 27(3-4), 269-274.
Chern, J.-C., and Young, C.-H. (1990). "Factors Influencing the Drying Shrinkage of Steel Fiber Reinforced Concrete." ACI Materials Journal, 87(2), 123-139.
Cope, B. L., and Ramey, G. E. (2001). "Reducing Drying Shrinkage of Bridge-Deck Concrete." Concrete International, 23(8), 76-82.
Costoya, M. (2008). "Effect of Particle Size on the Hydration Kinetics and Microstructural Development of Tricalcium Silicate." Doctoral Thesis, Thesis No 4102, EPFL, Lausanne, Switzerland.
Cusson, D. (2008). "Effect of Blended Cements on Effectiveness of Internal Curing of HPC." ACI, SP-256, 105-120.
Cusson, D., and Hoogeveen, T. (2008). "Internal Curing of High-Performance Concrete with Pre-soaked Fine Lightweight Aggregate for Prevention of Autogenous Shrinkage Cracking." Cement and Concrete Research, 38(6), 757-765.
De la Varga, I., Castro, J., Bentz, D., and Weiss, J. (2012). "Application of internal curing for mixtures containing high volumes of fly ash." Cement and Concrete Composites, 34(9), 1001-1008.
Durán-Herrera, A., Petrov, N., Bonneau, O., Khayat, K., and Aïtcin, P.-C. (2008). "Autogenous Control of Autogenous Shrinkage." ACI, SP-256, 1-12.
Espinoza-Hijazin, G., and Lopez, M. (2010). "Extending internal curing to concrete mixtures with W/C higher than 0.42." Construction and Building Materials.
Feldman, R., Prudencio, L. R., and Chan, G. (1999). "Rapid Chloride Permeability Test on Blended Cement and Other Concretes: Correlations Between Charge, Initial Current and Conductivity." Construction and Building Materials, 13, 149-154.
Folliard, K., Smith, C., Sellers, G., Brown, M., and Breen, J. E. (2003). "Evaluation of Alternative Materials to Control Drying-Shrinkage Cracking in Concrete Bridge Decks."Report No. FHWA/TX-04/0-4098-4, .
Folliard, K. J., and Berke, N. S. (1997). "Properties of high-performance concrete containing shrinkage-reducing admixture." Cement and Concrete Research, 27(9), 1357-1364.
Friggle, T., and Reeves, D. (2008). "Internal Curing of Concrete Paving: Laboratory and Field Experience." ACI, SP-256, 71-80.
Fu, T. (2011). "Autogenous Deformation and Chemical Shrinkage of High Performance Cementitious Systems." Oregon State University, Corvallis, OR.
83
Fu, T., Deboodt, T., and Ideker, J. H. (2012). "A Simple Procedure on Determining Long-Terms Chemical Shrinkage for Cementitious Systems Using Improved Chemical Shrinkage Test." ASCE Journal of Materials, 24(8).
Geiker, M. R., Bentz, D. P., and Jensen, O. M. (2002). "Mitigating Autogenous Shrinkage by Interal Curing." High Performance Structural Lightweight Concrete, SP-218, 143-154.
Grotheer, S. J., and Peterman, R. (2009). "Development and Implementation of Lightweight Concrete Mixes for KDOT Bridge Applications." Kansas Department of Transportation, FHWA-KS-08-10, Kansas State University, Manhattan, KS, 171.
Gruner, P. W., and Plain, G. A. (1993). "Type K Shrinkage-Compensating Cement in Bridge Deck Concrete." Concrete International, 15(10), 44-47.
Hammer, T. A. (1992). "High Strength LWFA Concrete with Silica Fume – Effect of Water Content in the LWFA on Mechanical Properties." Supplementary Papers of the 4th CANMET/ACI International Conference on Fly Ash, Silica Fume, Slag and Natural Pozzolans in Concrete, 314-330.
Henkensiefken, R., Bentz, D., Nantung, T., and Weiss, J. (2009). "Volume change and cracking in internally cured mixtures made with saturated lightweight aggregate under sealed and unsealed conditions." Cement and Concrete Composites, 31(7), 427-437.
Henkensiefken, R., Briatka, P., Bentz, D. P., Nantung, T., and Weiss, J. (2010). "Plastic Shrinkage Cracking in Internally Cured Mixtures." Concrete International, 32(02), 49-54.
Henkensiefken, R., Castro, J., Kim, H., Bentz, D., and Weiss, J. (2009). "Internal Curing Improves Concrete Performance throughout its Life." Concrete InFocus, 22-30.
Holt, E. E. (2001). "Early-Age Autogenous Shrinkage of Concrete." Technical Research Centre of Finland, VTT Publications, No. 446.
Huo, X., and Wong, L. U. (2000). "Early-Age Shrinkage of HPC Decks under Different Curing Methods." 103, 168-168.
Ideker, J. H. (2008). "Early-Age Behavior of Calcium Aluminate Cement Systems." Thesis(PhD), University of Texas, Austin.
Jaouadi, I. (2008). "Etude numérique et expérimentale du retrait endogène de la pâte de ciment au jeune âge." Ph.D. Dissertation EPFL, Lausanne, Switzerland.
Jensen, O. (1996). "Dilatometer-Further Development." Building Materials Laboratory, The Technical University of Denmark Lyngby, Denmark, .
Jensen , O. M., and Hansen, P. F. (1996). "Autogenous Deformation and Change of Relative Humidity in Silica Fume Modified Cement Paste." ACI Materials Journal, 28(6), 539-543.
84
Jensen, O. M., and Hansen, P. F. (2001). "Autogenous Deformation and RH-Change in Perspective." Cement and Concrete Research, 31(12), 1859-1865.
Jun, Z., Dongwei, H., and Haoyu, C. (2011). "Experimental and Theoretical Studies on Autogenous Shrinkage of Concrete at Early Ages." Journal of Materials in Civil Engineering, 23(3), 312-320.
Justnes, H., Clemmens, F., Depuydt, P., Van Gemert, D., and Sellevold, E. J. "Correlating the Deviation Point Between Extrenal and Total Chemical Shrinakge with Setting Time and Other Characteristics of Cement Pastes." Proc., Shrinkage 2000 - International RILEM Workshop on Shrinkage of Concrete, 57-73.
Klieger, P., and Hanson, J. A. (1961). "Freezing and Thawing Tests of Lightweight Aggregate Concrete." ACI Journal, Proceedings, 57(7), 779-796.
Kosmatka, S. H. (2008). Design and Control of Concrete Mixtures, Portland Cement Association, Skokie, Illinois.
Kovler, K., and Jensen, O. M. (2005). "Novel Techniques for Concrete Curing." Concrete International, 27(09), 39-42.
Kumar, B., Tike, G. K., and Nanda, P. K. (2007). "Evaluation of Properties of High-Volume Fly-Ash Concrete for Pavements." Journal of Materials in Civil Engineering, 19(10), 906-911.
La Chatelier, H. (1900). "Sur les Changements de Volume qui Accompagent le durcissement des Ciments." Bulletin Societe de l'Encouragement pour l'Industrie Nationale, Seme Serie(Tome 5).
Liu, S., and Fang, K. (2006). "Study on Autogenous Deformation of Concrete Incorporating MgO as Expansive Agent." Key Engineering Materials, 302-303, 155-161.
Lopez, M., Kahn, L. F., and Kurtis, K. E. (2008). "Effect of Internally Stored Water on Creep of High-Performance Concrete." ACI Materials Journal, 105(3), 265-273.
Lura, P. (2003). Autogenous Deformation and Internal Curing of Concrete, DUP Science, Delft.
Lura, P., Couch, J., Jensen, O. M., and Weiss, J. (2009). "Early-age Acoustic Emission Measurements in Hydrating Cement Paste: Evidence for Cavitation During Solidification due to Self-Desiccation." Cement and Concrete Research, 39(10), 861-867.
Lura, P., and Jensen, O. (2007). "Measuring Techniques for Autogenous Strain of Cement Paste." Materials and Structures, 40(4), 431-440.
Lura, P., and Jensen, O. M. (2005). "Volumetric Measurement in Water Bath - An Inappropriate Method to Measure Autogenous Strain of Cement Paste." PCA R&D Serial No. 2925.
MacInnis, C., and Beaudoin, J. J. (1968). "Effect of degree of saturation on the frost resistance of mortar mixes." Journal of the American Concrete Institute, 65, 203-207.
85
Mehta, P. K., and Monteiro, P. J. M. (2006). Concrete: Microstructure, Properties, and Materials, McGraw-Hill, New York.
Mindess, S., Young, J. F., and Darwin, D. (2003). Concrete, Pearson Education, Inc., Upper Saddle River.
Mohr, B. J., and Hood, K. L. (2010). "Influence of bleed water reabsorption on cement paste autogenous deformation." Cement and Concrete Research, 40(2), 220-225.
Nilson, A. H., Darwin, D., and Dolan, C. W. (2004). Design of Concrete Structures 13th Edition, McGraw Hill, New York.
ODOT (2008). "Oregon Standard and Specifications for Construction." Oregon Department of Transportation, 814.
Paul, A., and Lopez, M. (2011). "Assessing Lightweight Aggregate Efficiency for Maximizing Internal Curing Performance." ACI Materials Journal, 108(4), 385-393.
Peethamparan, S., Weissinger, E., Vocaturo, J., Zhang, J., and Scherer, G. (2010). "Monitoring Chemical Shrinkage Using Pressure Sensors." SP-270-7, ACI, 77-88.
Pfeifer, D. W. (1967). "Sand Replacement in Structural Lightweight Concrete - Freezing and Thawing Tests." ACI Journal, Proceedings, 64(11), 735-743.
Philleo, R. E. (1991). "Concrete Science and Reality." Materials Science of Concrete II, J. Skalny, S. Mindess, and eds., eds., American Ceramic Society, 1-8.
Phillips, M. V., Ramey, G. E., and Pittman, D. W. (1997). "Bridge Deck Construction Using Type K Cement." Journal of Bridge Engineering(November 1997), 176-182.
Powers, T. C. (1935). "Absorption of Water by Portland Cement Paste During the Hardening Process." Industrial and Engineering Chemistry, 27(7), 790-794.
Powers, T. C. (1958). "The Physical Structure and Engineering Properties of Concrete, Bulletin 90." P. C. Association, ed.Skokie, IL.
Powers, T. C., and Brownyard, T. L. (1944). "Studies of the physical properties of hardened portland cement paste, Bulletin 22." P. C. Association, ed.Skokie, IL.
Powers, T. C., and Helmuth, R. A. (1953). "Theory of volume changes in hardened Porltand cement paste during freezing, Bulletin 46." P. C. Association, ed.Skokie, IL.
Qiao, P., McLean, D., and Zhuang, J. (2010). "Mitigation Strategies for Early-Age Shrinkage Cracking in Bridge Decks."Washingon DOT Research Report No. WA-RD 747.1, April
Radlinska, A., Rajabipour, F., Bucher, B., Henkensiefken, R., Sant, G., and Weiss, J. (2008). "Shrinkage Mitigation Strategies in Cementitious Systems: A Closer Look at Differences in
86
Sealed and Unsealed Behavior." Transportation Research Record: Journal of the Transportation Research Board, 2070(-1), 59-67.
Rajabipour, F., Sant, G., and Weiss, J. (2008). "Interactions between shrinkage reducing admixtures (SRA) and cement paste's pore solution." Cement and Concrete Research, 38(5), 606-615.
Ramniceanu, A., Weyers, R. E., Mokarem, D. W., and Sprinkel, M. M. (2010). "Bridge Deck Concrete Volume Change."Charlottesville, VA. Virginia Transportation Research Council, Report No. VTRC 10-CR5, February
RILEM Committee 119 (1998). Prevention of Thermal Cracking in Concrete at Early Ages, E & FN Spon, London and New York.
Roberts, J. W. (2004). "Internal Curing in Pavements, Bridge Decks and Parking Structures, Using Absorptive Aggregates to Provide Water to Hydrate Cement not Hydrated by Mixing Water." Proceedings of the 83rd Annual Meeting of the Transportation Research Board.
Rongbing, B., and Jian, S. (2005). "Synthesis and Evaluation of Shrinkage-Reducing Admixture for Cementitious Materials." Cement and Concrete Research, 35(3), 445-448.
Sant, G., Bentz, D., and Weiss, J. (2011). "Capillary porosity depercolation in cement-based materials: Measurement techniques and factors which influence their interpretation." Cement and Concrete Research, 41(8), 854-864.
Sant, G., Lura, P., and Weiss, J. (2006). "Measurements of Volume Change in Cementitious Materials at Early Ages: Review of Testing Protocols and Interpretation of Results." Transportation Research Record: Journal of the Transportation Research Board(1979), 21-29.
Schemmel, J. J., Ray, J. C., and Kuss, M. L. (1999). "A Shrinkage Reducing Admixtures Influence on the Air Void System in Concrete." Proceedings of the ACI Symposium on High Performance Concrete.
Schlitter, J., Henkensiefken, R., Castro, J., Raoufi, K., Weiss, J., and Nantung, T. (2010). "Development of Internally Cured Concrete for Increased Service Life." INDOT Division of Research, SPR-3211, , Purdue University, West Lafayette, IN, 285.
See, H. T., Attiogbe, E. K., and Miltenberger, M. A. (2004). "Potential for Restrained Shrinkage Cracking of Concrete and Mortar." Cement, Concrete and Aggregates, 26(2), 123-130.
Setter, N., and Roy, D. M. (1978). "Mechanical Features of Chemical Shrinkage of Cement Paste." Cement and Concrete Research, 8(5), 623-634.
Shah, S. P., Karaguler, M. E., and Sarigaphuti, M. (1992). "Effects of Shrinkage-Reducing Admixtures on Restrained Shrinkage Cracking of Concrete." ACI Materials Journal, 89(May - June 1992), 289 - 295.
87
Slatnick, S., Riding, K. A., Folliard, K. J., Juenger, M. C. G., and Schindler, A. K. (2011). "Evaluation of Autogenous Deformation of Concrete at Early Ages." ACI Materials Journal, 108(1), 21-28.
Sleiman, H., Perrot, A., and Amziane, S. (2010). "A New Look at the Measurement of Cementitious Paste Setting by Vicat Test." Cement and Concrete Research, 40(5), 681-686.
Tazawa, E.-i., and Miyazawa, S. (1995). "Influence of cement and admixture on autogenous shrinkage of cement paste." Cement and Concrete Research, 25(2), 281-287.
Tazawa, E. (1999). Autogenous Shrinkage of Concrete : Proceedings of the International Workshop, Organized by JCI (Japan Concrete Institute), Hiroshima, June 13-14, 1998, Routledge, New York.
Termkhajornkit, P., Nawa, T., Nakai, M., and Saito, T. (2005). "Effect of Fly Ash on Autogenous Shrinkage." Cement and Concrete Research, 35(3), 473-482.
Thomas, M., Wilson, M., and Wiese, D. (2002). Supplementary Cementing Materials for Use in Concrete, Skokie, Illinoise.
Thomas, M. D. A. (2006). "Chloride Diffusion in High-Performance Lightweight Aggregate Concrete." 7th CANMET/ACI International Conference on Durability of Concrete, SP-234, 797-812.
Tishmack, J. K., Olek, J., and Diamond, S. (1999). "Characterization of High-Calcium Fly Ashes and Their Potential Influence on Ettringite Formation in Cementitious Systems." Cement, Concrete and Aggregates, 21(1), 82-92.
Troxell, G. E., and Davis, H. E. (1956). Composition and Properties of Concrete, MacGraw-Hill Book Co., New York.
Trtik, P., Münch, B., Weiss, W. J., Kaestner, A., Jerjen, I., Josic, L., Lehmann, E., and Lura, P. (2011). "Release of internal curing water from lightweight aggregates in cement paste investigated by neutron and X-ray tomography." Nuclear Instruments and Methods in Physics Research Section A: Accelerators, Spectrometers, Detectors and Associated Equipment, 651(1), 244-249.
Villarreal, V. H. (2008). "Internal Curing - Real Word Ready Mix Production and Applications: A Practical Approach to Lightweight Modified Concrete." ACI SP-256, 45-56.
Wang, F., Zhou, Y., Peng, B., Liu, Z., and Hu, S. (2009). "Autogenous Shrinkage of Concrete with Super-Absorbent Polymer." ACI Materials Journal(March-April 2009), 123-127.
Weber, S., and Reinhardt, H. W. (1997). "A New Generation of High Performance Concrete: Concrete with Autogenous Curing." Advanced Cement Based Materials, 6(2), 59-68.
Weiss, W. J. (1999). "Prediction of Early-Age Shrinkage Cracking in Concrete Elements."PhD Dissertation, Northwestern University, Evanston, IL.
88
Whiting, D. A., Detwiler, R. J., and Lagergren, E. S. (2000). "Cracking Tendency and Drying Shrinkage of Silica Fume Concrete for Bridge Deck Applications." ACI Materials Journal, 97(1), 71-78.
Xiao, K. T., Yang, H. Q., and Dong, Y. (2009). "Study on the Influence of Admixture on Chemical Shrinkage of Cement Based Materials." Key Engineering Materials, 405-406, 226-233.
Zhang, J., Weissinger, E. A., Peethamparan, S., and Scherer, G. W. (2010). "Early hydration and setting of oil well cement." Cement and Concrete Research, 40(7), 1023-1033.
Zhang, M.-H., and Gjorv, O. E. (1991). "Permeability of High-Strength Lightweight Concrete." ACI Materials Journal, 88(5), 463-469.
Zhang, M.-H., Li, L., and Paramasivam, P. (2005). "Shrinkage of High-Strength Lightweight Aggregate Concrete Exposed to Dry Environment." ACI Materials Journal, 102(2), 86-92.
89

APPENDIX A: DRYING SHRINKAGE

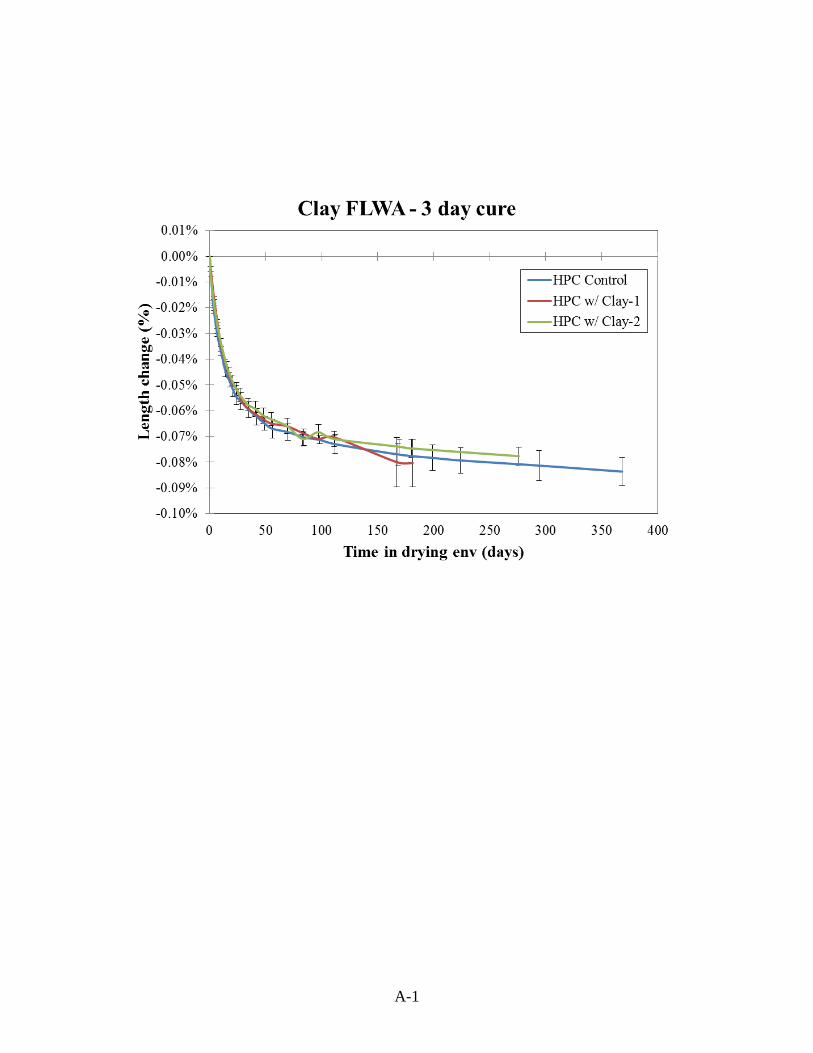
A-1
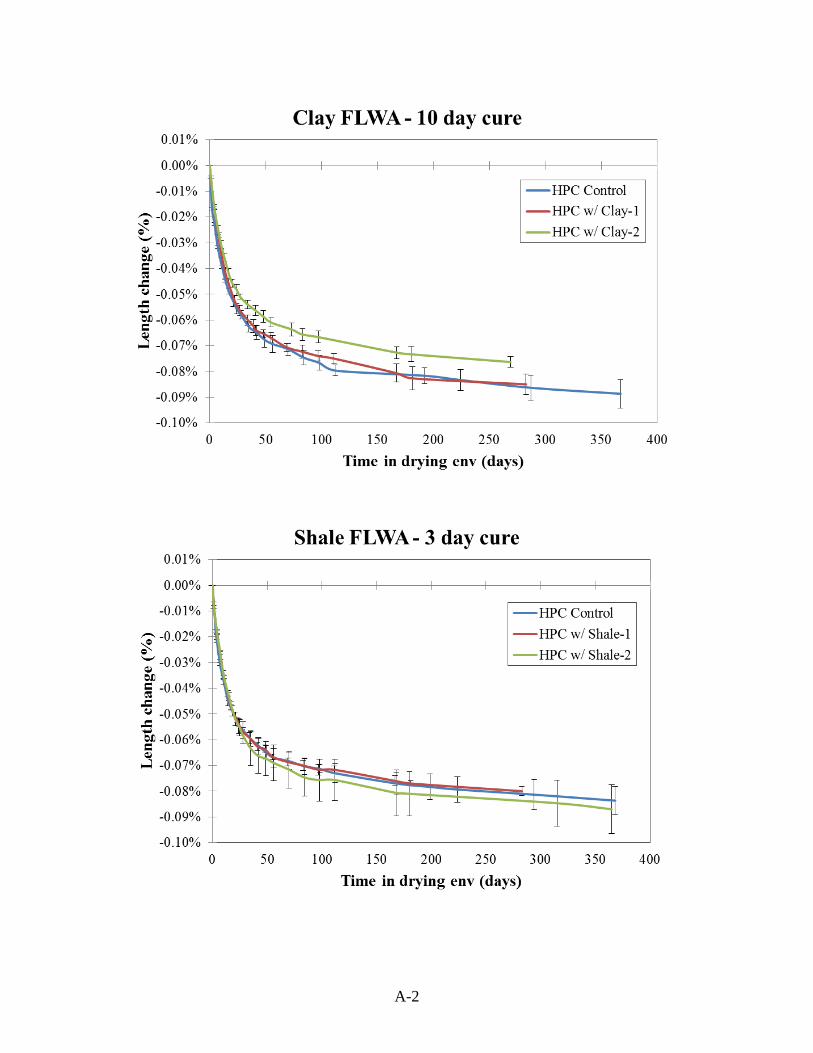
A-2
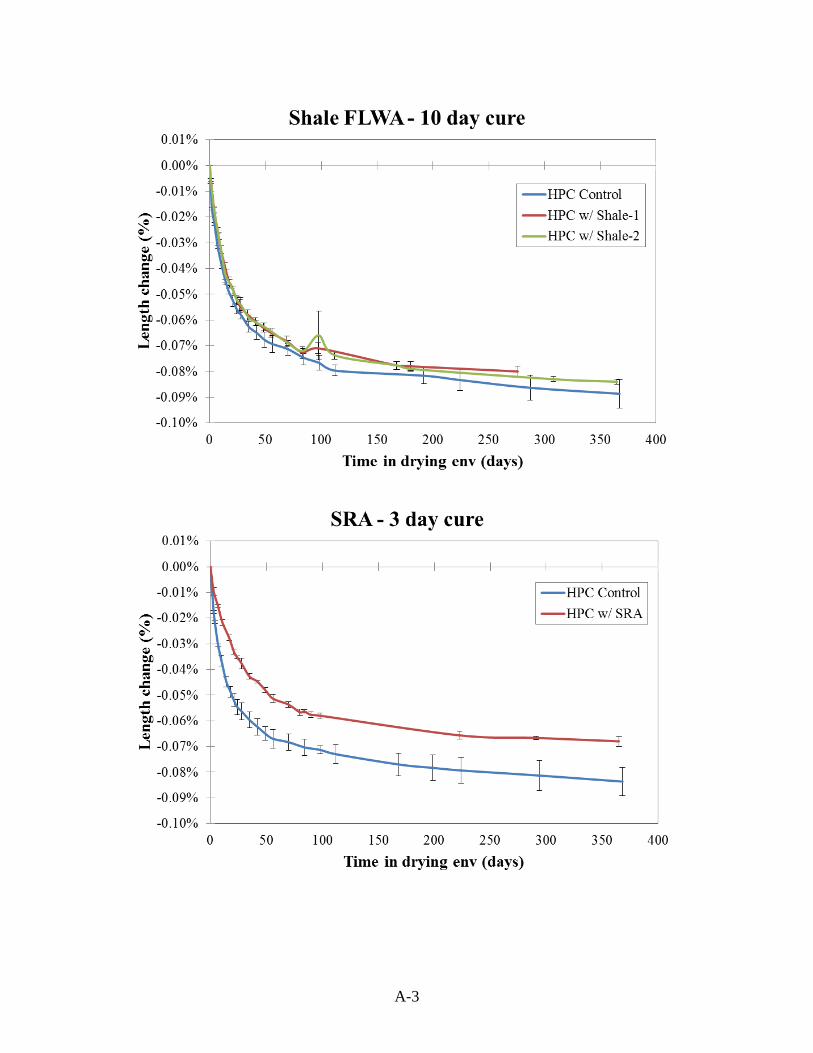
A-3
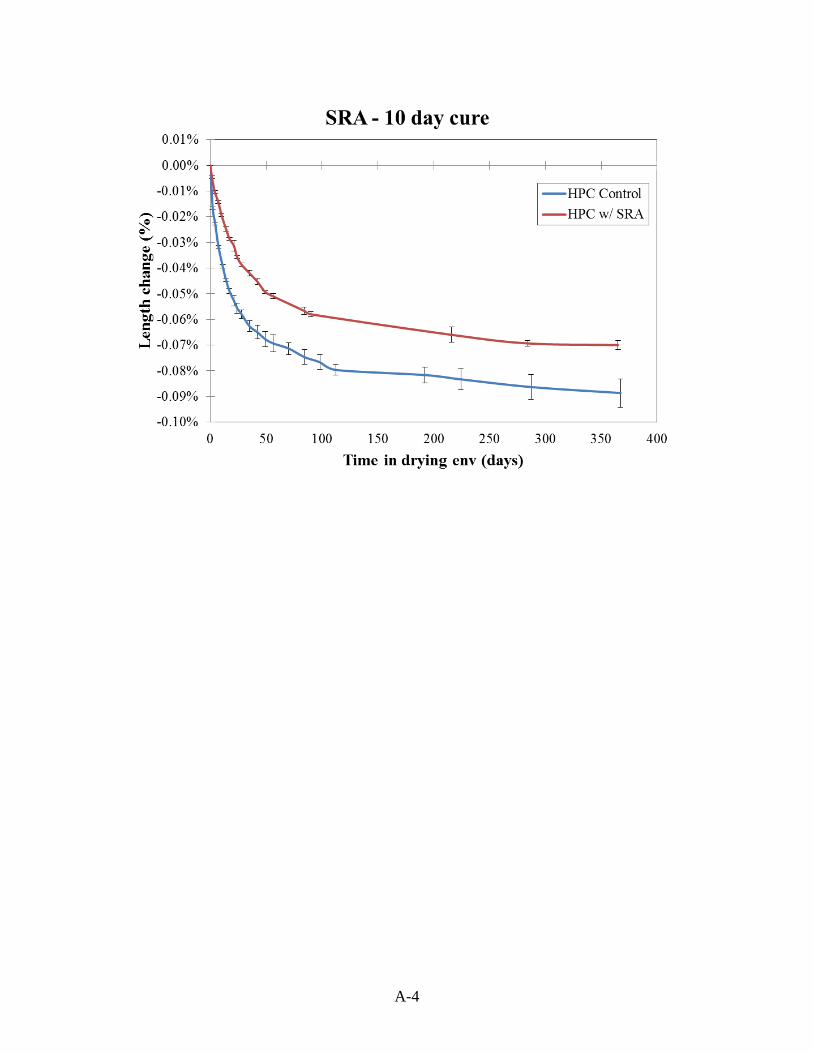
A-4
APPENDIX B: MASS LOSS

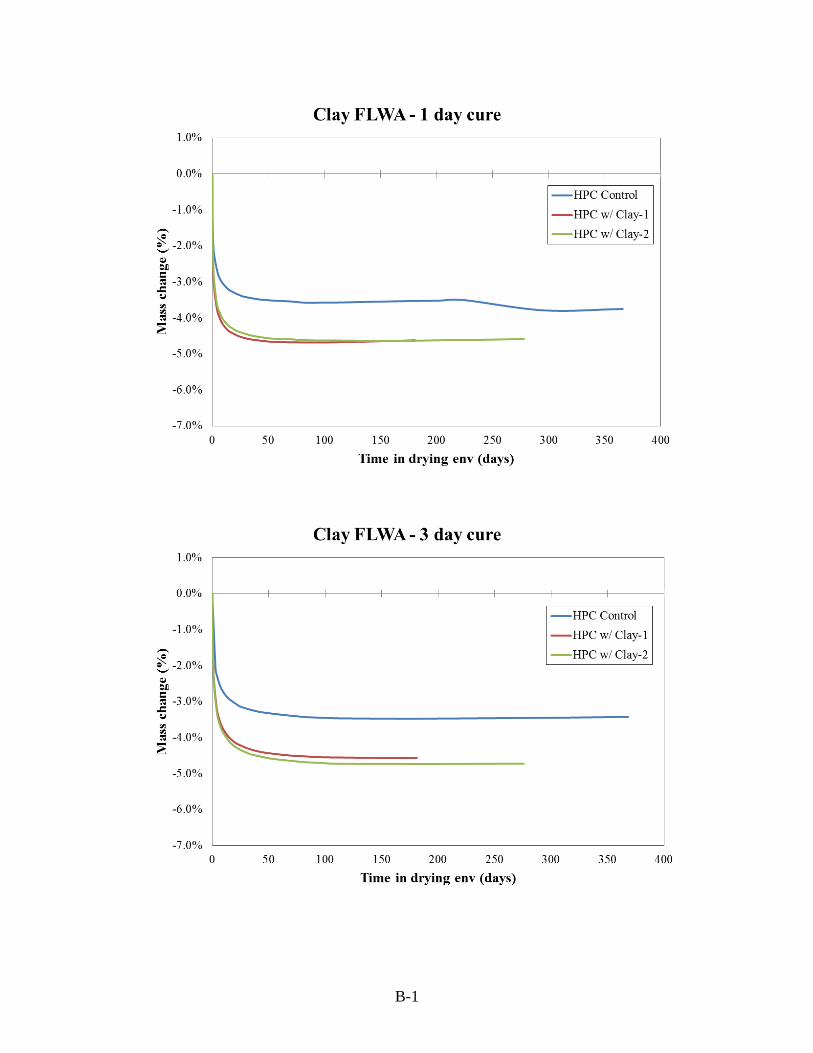
B-1
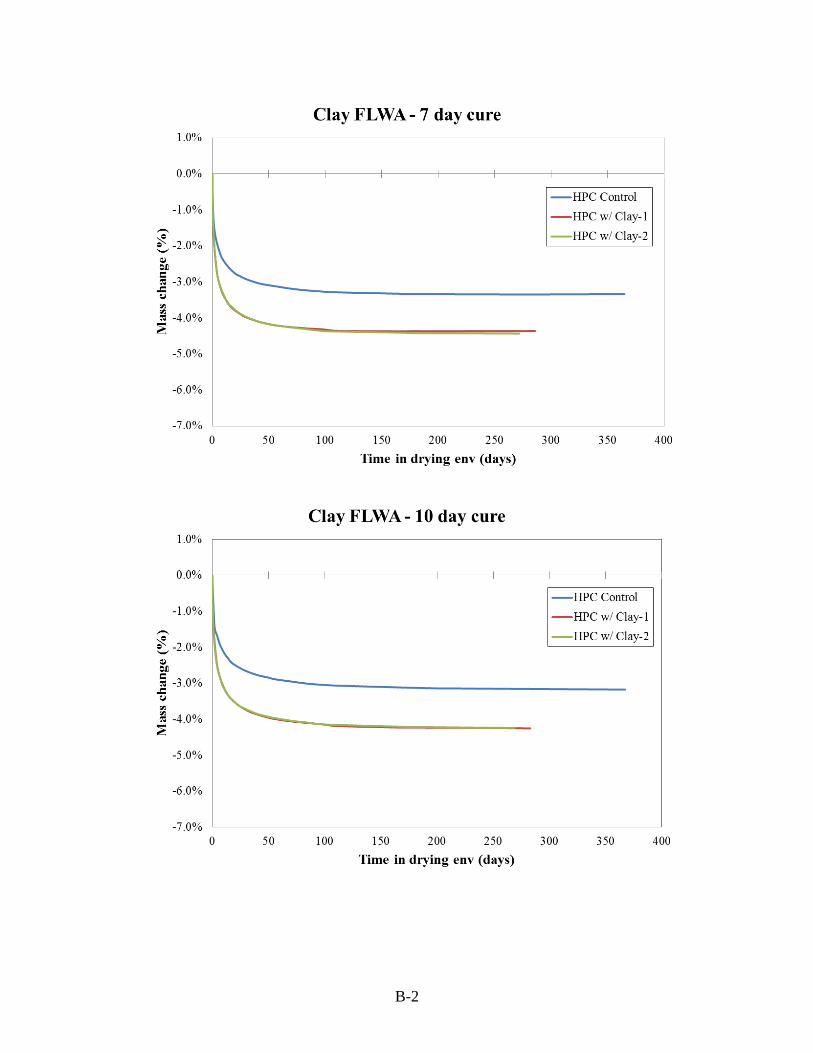
B-2
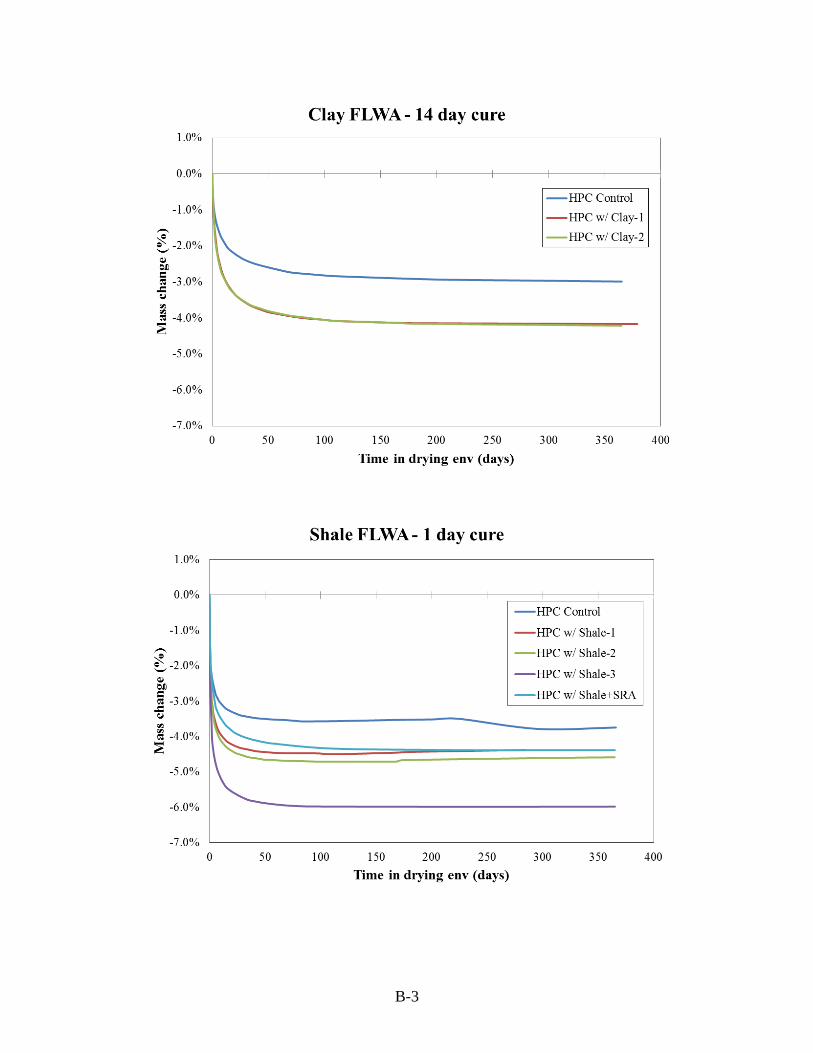
B-3
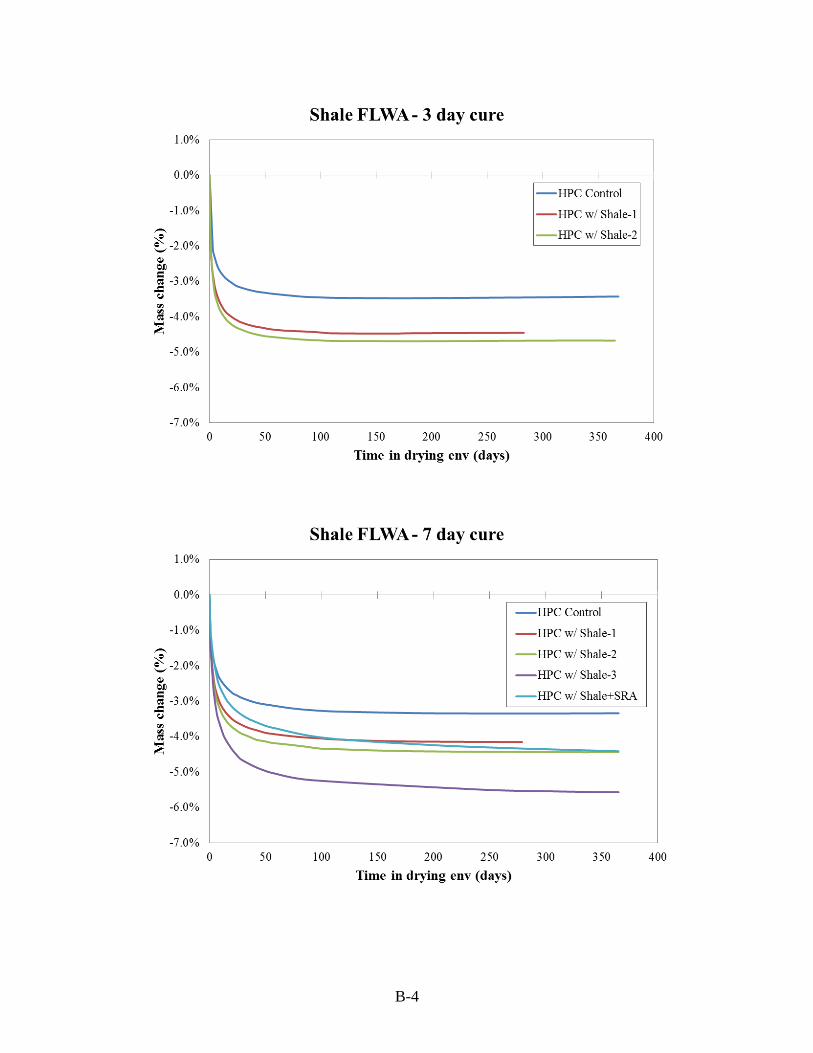
B-4
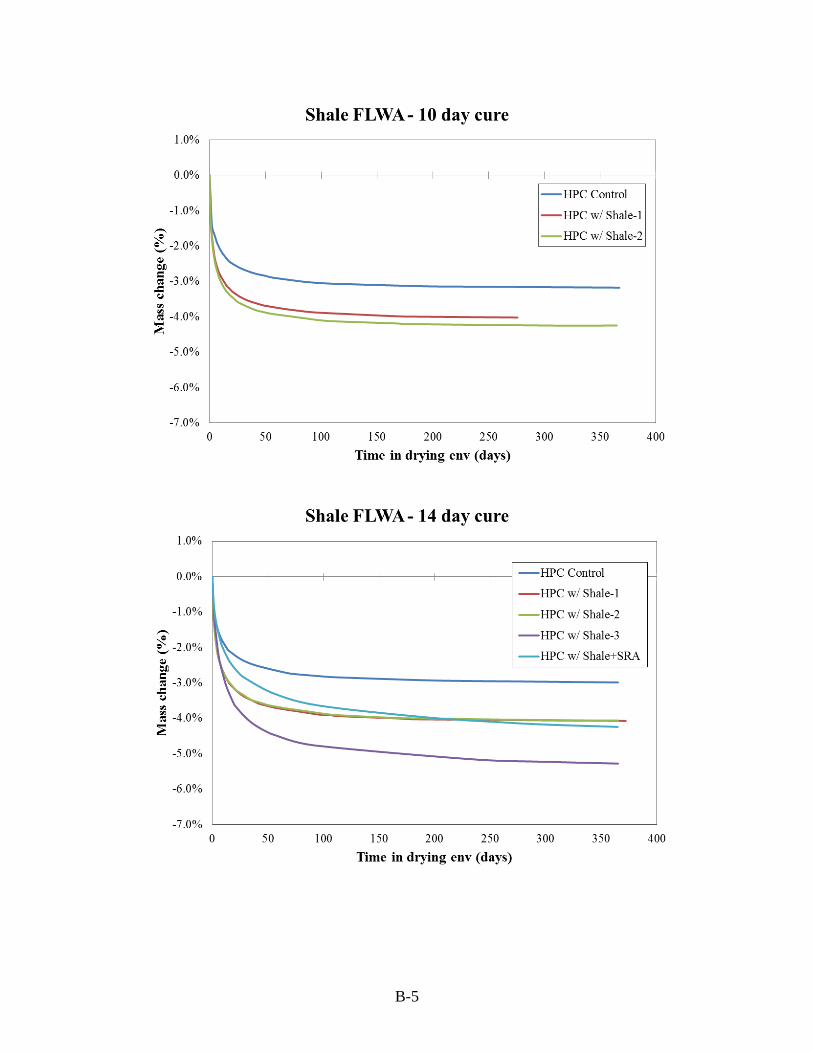
B-5
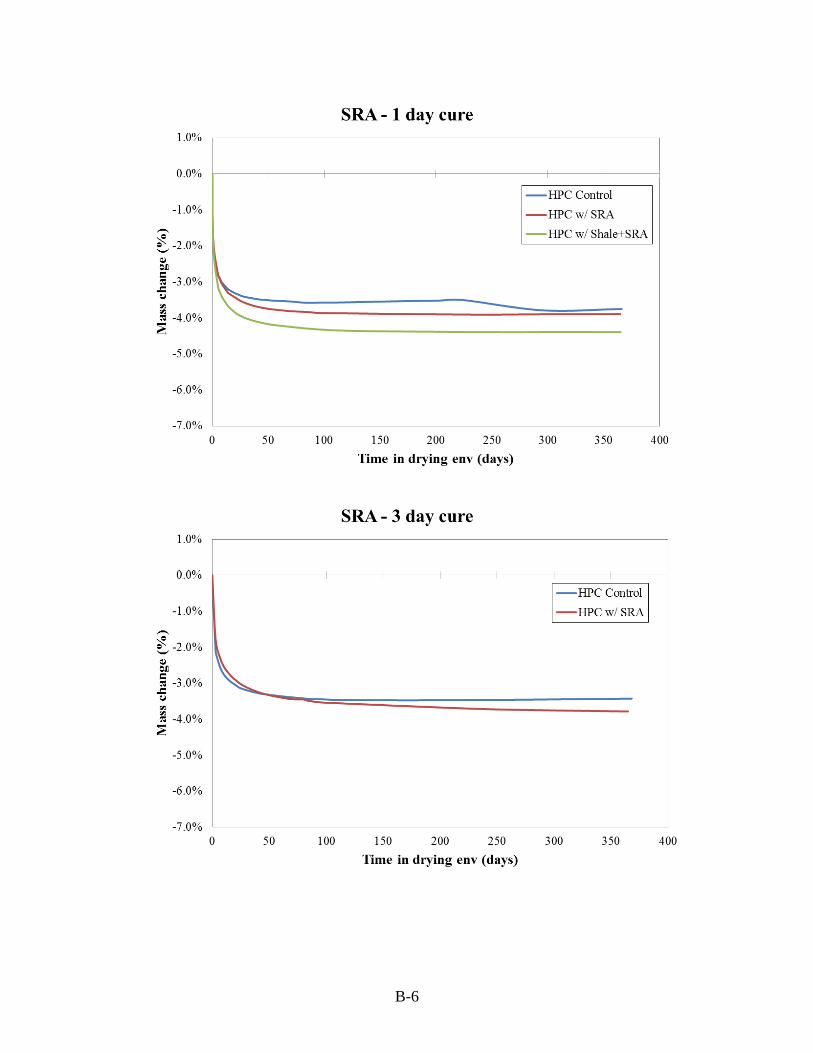
B-6
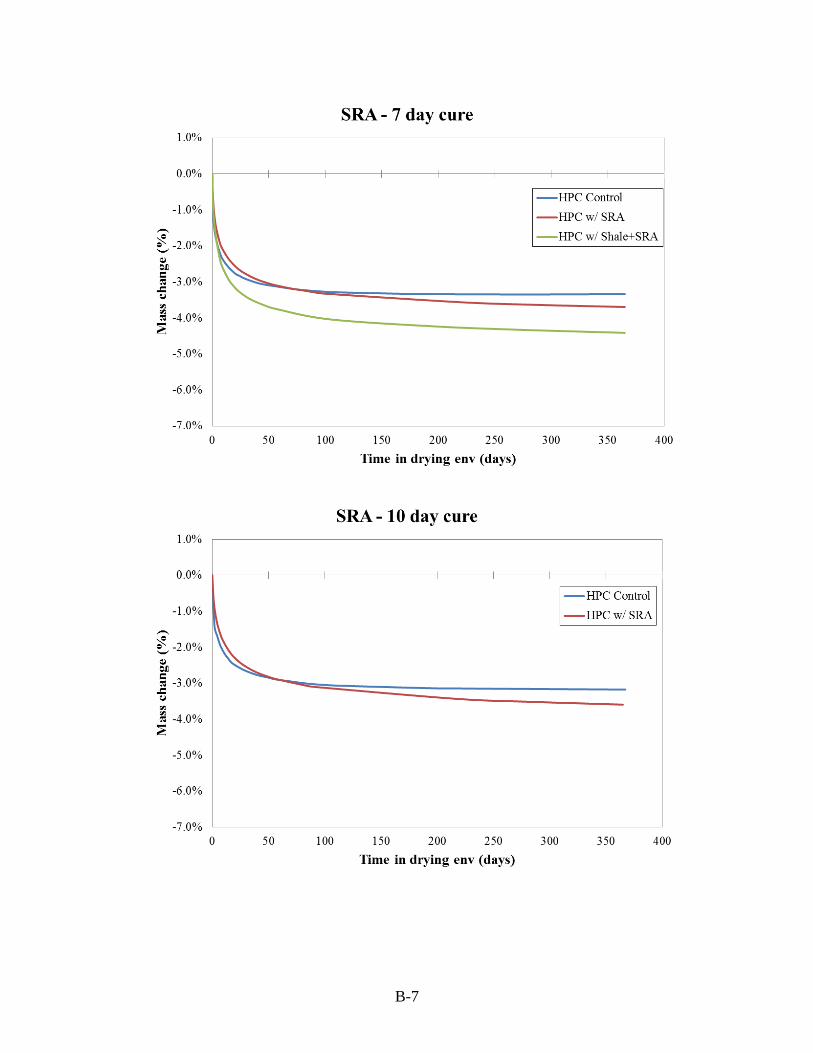
B-7
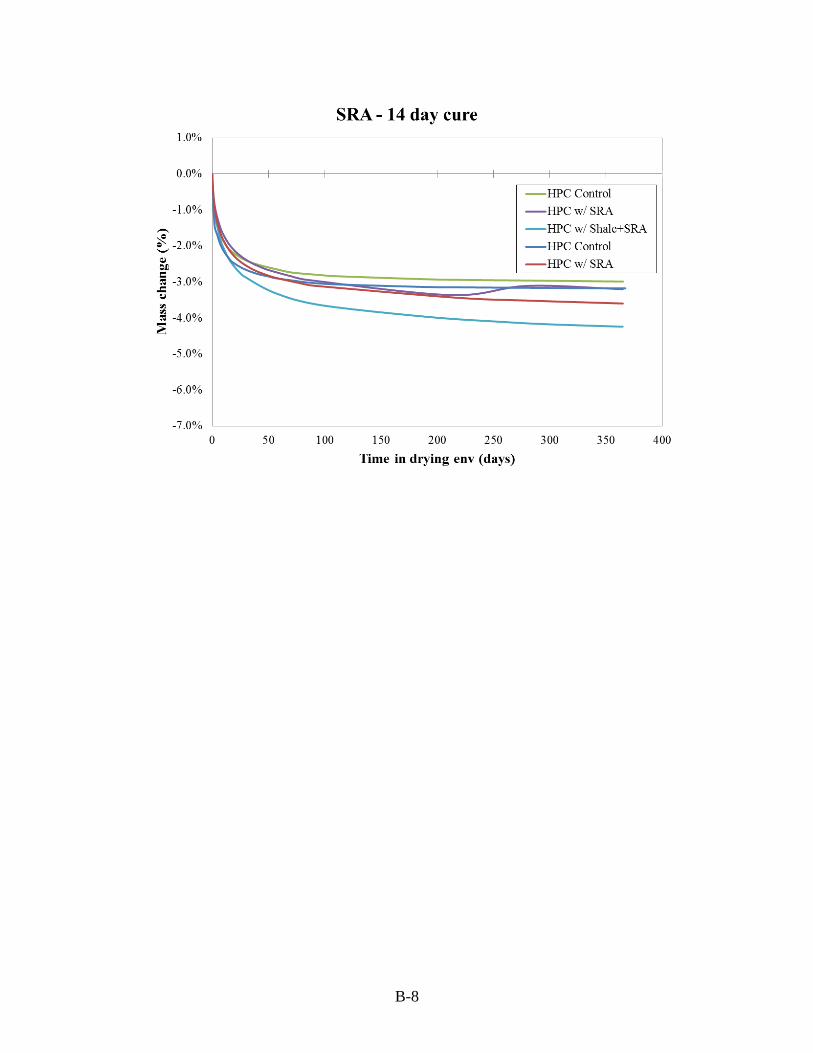
B-8
APPENDIX C: TABULATED VALUES FOR DRYING SHRINKAGE

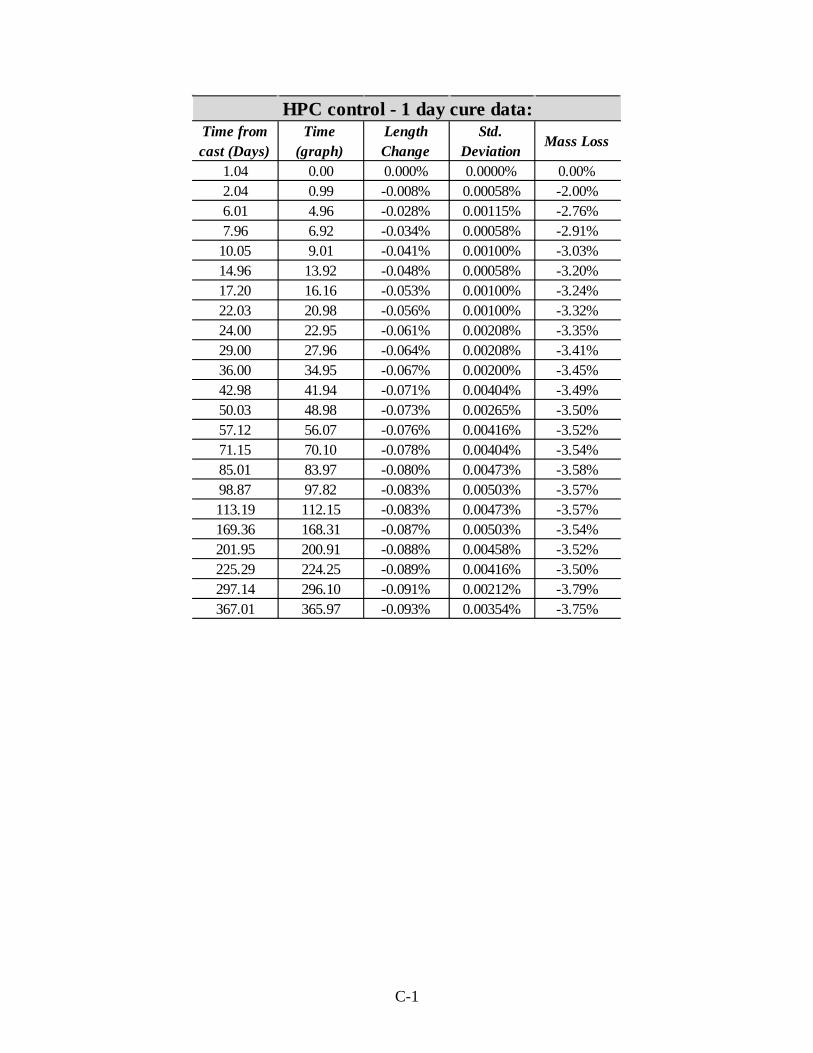
Time from cast (Days)
Time (graph)
Length Change
Std. Deviation
Mass Loss
1.04 0.00 0.000% 0.0000% 0.00%2.04 0.99 -0.008% 0.00058% -2.00%6.01 4.96 -0.028% 0.00115% -2.76%7.96 6.92 -0.034% 0.00058% -2.91%
10.05 9.01 -0.041% 0.00100% -3.03%14.96 13.92 -0.048% 0.00058% -3.20%17.20 16.16 -0.053% 0.00100% -3.24%22.03 20.98 -0.056% 0.00100% -3.32%24.00 22.95 -0.061% 0.00208% -3.35%29.00 27.96 -0.064% 0.00208% -3.41%36.00 34.95 -0.067% 0.00200% -3.45%42.98 41.94 -0.071% 0.00404% -3.49%50.03 48.98 -0.073% 0.00265% -3.50%57.12 56.07 -0.076% 0.00416% -3.52%71.15 70.10 -0.078% 0.00404% -3.54%85.01 83.97 -0.080% 0.00473% -3.58%98.87 97.82 -0.083% 0.00503% -3.57%113.19 112.15 -0.083% 0.00473% -3.57%169.36 168.31 -0.087% 0.00503% -3.54%201.95 200.91 -0.088% 0.00458% -3.52%225.29 224.25 -0.089% 0.00416% -3.50%297.14 296.10 -0.091% 0.00212% -3.79%367.01 365.97 -0.093% 0.00354% -3.75%
HPC control - 1 day cure data:
C-1
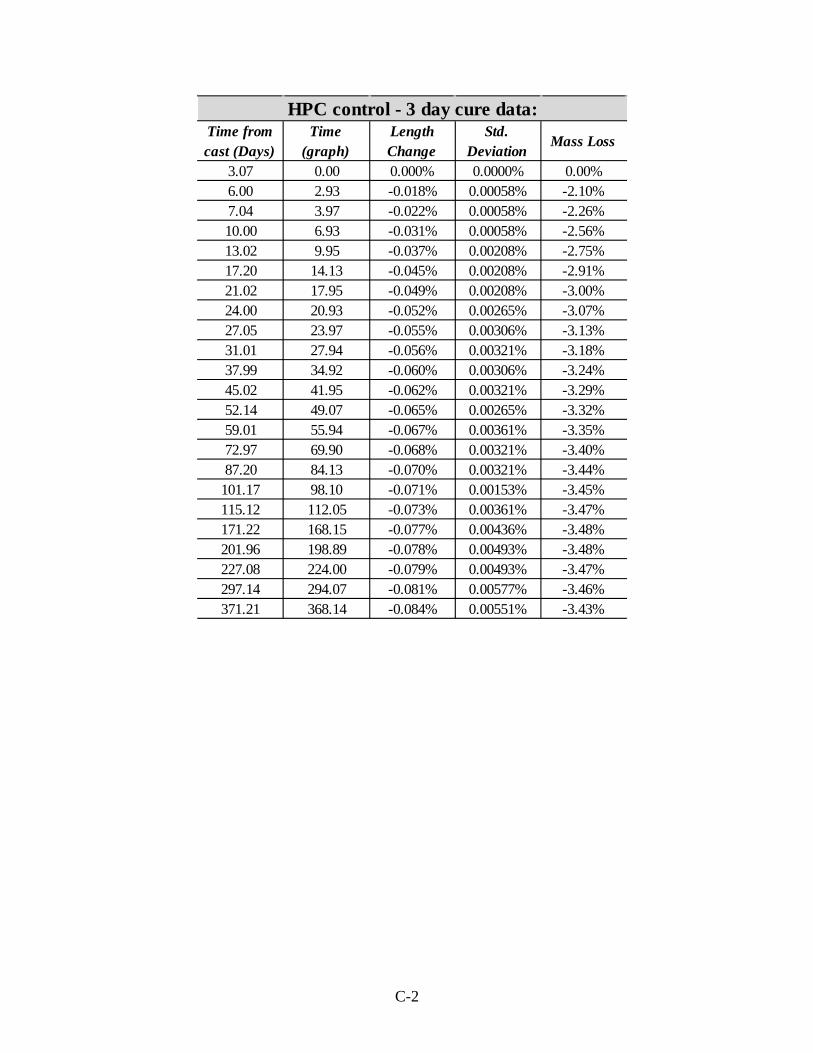
Time from cast (Days)
Time (graph)
Length Change
Std. Deviation
Mass Loss
3.07 0.00 0.000% 0.0000% 0.00%6.00 2.93 -0.018% 0.00058% -2.10%7.04 3.97 -0.022% 0.00058% -2.26%10.00 6.93 -0.031% 0.00058% -2.56%13.02 9.95 -0.037% 0.00208% -2.75%17.20 14.13 -0.045% 0.00208% -2.91%21.02 17.95 -0.049% 0.00208% -3.00%24.00 20.93 -0.052% 0.00265% -3.07%27.05 23.97 -0.055% 0.00306% -3.13%31.01 27.94 -0.056% 0.00321% -3.18%37.99 34.92 -0.060% 0.00306% -3.24%45.02 41.95 -0.062% 0.00321% -3.29%52.14 49.07 -0.065% 0.00265% -3.32%59.01 55.94 -0.067% 0.00361% -3.35%72.97 69.90 -0.068% 0.00321% -3.40%87.20 84.13 -0.070% 0.00321% -3.44%
101.17 98.10 -0.071% 0.00153% -3.45%115.12 112.05 -0.073% 0.00361% -3.47%171.22 168.15 -0.077% 0.00436% -3.48%201.96 198.89 -0.078% 0.00493% -3.48%227.08 224.00 -0.079% 0.00493% -3.47%297.14 294.07 -0.081% 0.00577% -3.46%371.21 368.14 -0.084% 0.00551% -3.43%
HPC control - 3 day cure data:
C-2

Time from cast (Days)
Time (graph)
Length Change
Std. Deviation
Mass Loss
6.99 0.00 0.000% 0.0000% 0.00%7.97 0.98 -0.010% 0.00058% -1.18%10.06 3.07 -0.019% 0.00100% -1.77%14.27 7.28 -0.031% 0.00058% -2.24%17.21 10.22 -0.038% 0.00058% -2.42%21.04 14.06 -0.044% 0.00115% -2.58%24.00 17.02 -0.048% 0.00100% -2.67%28.00 21.01 -0.052% 0.00100% -2.79%31.01 24.02 -0.054% 0.00058% -2.83%35.01 28.02 -0.056% 0.00115% -2.90%41.96 34.98 -0.060% 0.00100% -2.98%49.00 42.01 -0.063% 0.00153% -3.05%56.00 49.01 -0.064% 0.00115% -3.09%63.18 56.19 -0.066% 0.00173% -3.12%77.20 70.21 -0.069% 0.00115% -3.19%91.29 84.30 -0.071% 0.00173% -3.24%
105.22 98.24 -0.074% 0.00153% -3.27%119.37 112.38 -0.075% 0.00153% -3.29%175.30 168.32 -0.078% 0.00208% -3.33%201.96 194.97 -0.078% 0.00208% -3.34%231.23 224.24 -0.080% 0.00231% -3.34%297.14 290.16 -0.081% 0.00208% -3.35%372.08 365.09 -0.084% 0.00231% -3.34%
HPC control - 7 day cure data:
C-3
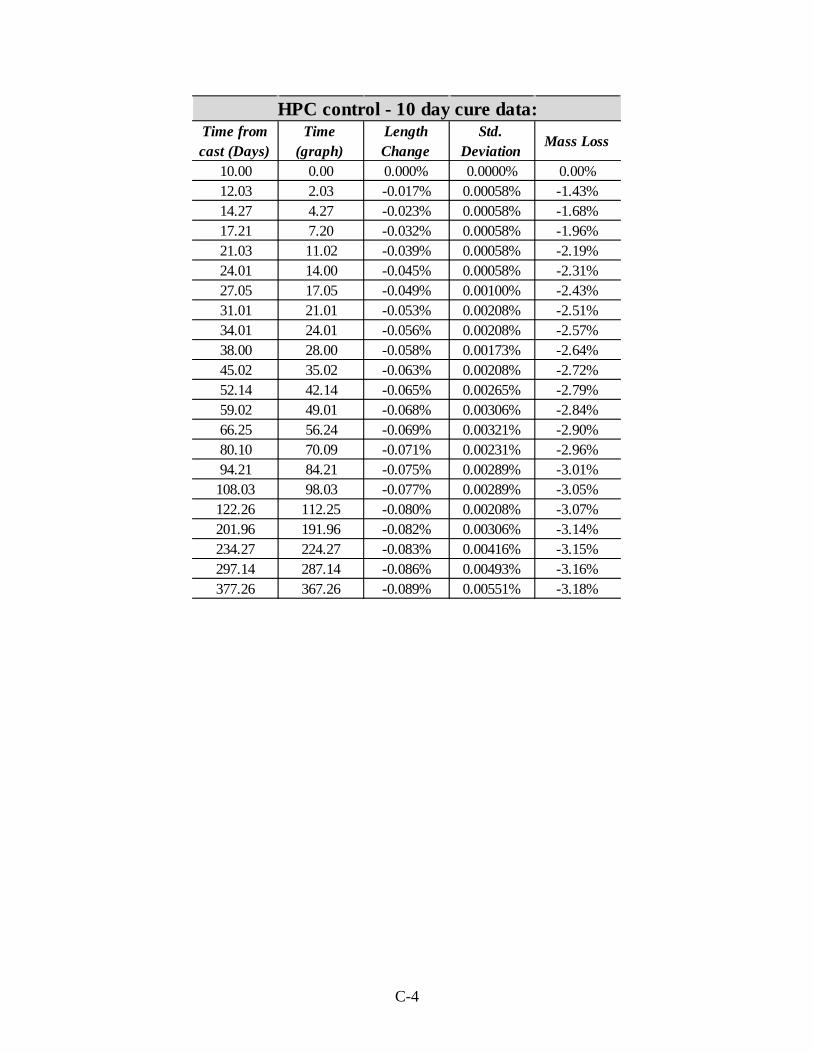
Time from cast (Days)
Time (graph)
Length Change
Std. Deviation
Mass Loss
10.00 0.00 0.000% 0.0000% 0.00%12.03 2.03 -0.017% 0.00058% -1.43%14.27 4.27 -0.023% 0.00058% -1.68%17.21 7.20 -0.032% 0.00058% -1.96%21.03 11.02 -0.039% 0.00058% -2.19%24.01 14.00 -0.045% 0.00058% -2.31%27.05 17.05 -0.049% 0.00100% -2.43%31.01 21.01 -0.053% 0.00208% -2.51%34.01 24.01 -0.056% 0.00208% -2.57%38.00 28.00 -0.058% 0.00173% -2.64%45.02 35.02 -0.063% 0.00208% -2.72%52.14 42.14 -0.065% 0.00265% -2.79%59.02 49.01 -0.068% 0.00306% -2.84%66.25 56.24 -0.069% 0.00321% -2.90%80.10 70.09 -0.071% 0.00231% -2.96%94.21 84.21 -0.075% 0.00289% -3.01%
108.03 98.03 -0.077% 0.00289% -3.05%122.26 112.25 -0.080% 0.00208% -3.07%201.96 191.96 -0.082% 0.00306% -3.14%234.27 224.27 -0.083% 0.00416% -3.15%297.14 287.14 -0.086% 0.00493% -3.16%377.26 367.26 -0.089% 0.00551% -3.18%
HPC control - 10 day cure data:
C-4

Time from cast (Days)
Time (graph)
Length Change
Std. Deviation
Mass Loss
14.08 0.00 0.000% 0.0000% 0.00%14.97 0.89 -0.010% 0.00231% -0.75%17.21 3.13 -0.020% 0.00231% -1.29%21.05 6.97 -0.030% 0.00265% -1.68%24.01 9.94 -0.036% 0.00231% -1.86%28.00 13.93 -0.043% 0.00208% -2.06%31.01 16.94 -0.046% 0.00200% -2.14%35.01 20.93 -0.050% 0.00231% -2.24%38.00 23.92 -0.052% 0.00208% -2.30%41.96 27.89 -0.054% 0.00200% -2.37%49.00 34.93 -0.058% 0.00153% -2.46%56.00 41.92 -0.061% 0.00200% -2.53%63.18 49.10 -0.063% 0.00208% -2.59%70.03 55.95 -0.066% 0.00200% -2.64%84.02 69.94 -0.069% 0.00200% -2.74%98.21 84.13 -0.072% 0.00200% -2.78%
112.27 98.19 -0.070% 0.00153% -2.82%126.06 111.98 -0.074% 0.00200% -2.84%201.96 187.88 -0.078% 0.00173% -2.92%238.03 223.95 -0.081% 0.00208% -2.94%297.15 283.07 -0.082% 0.00153% -2.96%379.21 365.13 -0.085% 0.00153% -2.99%
HPC control - 14 day cure data:
C-5
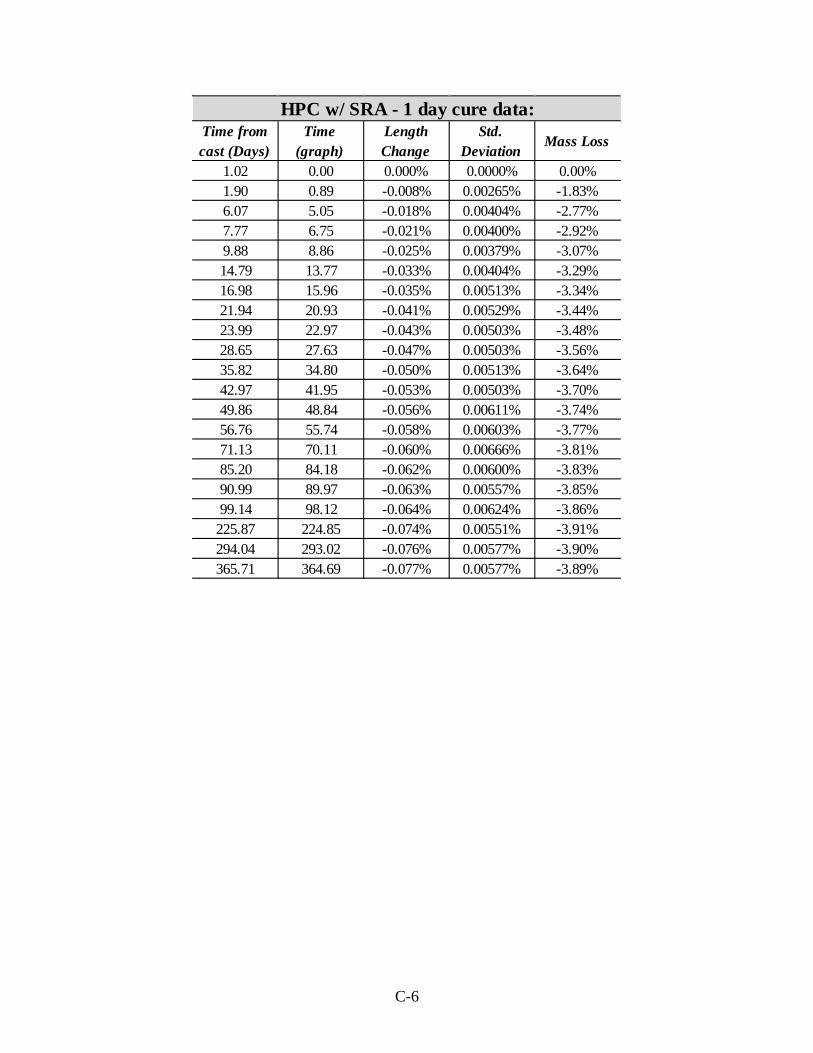
Time from cast (Days)
Time (graph)
Length Change
Std. Deviation
Mass Loss
1.02 0.00 0.000% 0.0000% 0.00%1.90 0.89 -0.008% 0.00265% -1.83%6.07 5.05 -0.018% 0.00404% -2.77%7.77 6.75 -0.021% 0.00400% -2.92%9.88 8.86 -0.025% 0.00379% -3.07%14.79 13.77 -0.033% 0.00404% -3.29%16.98 15.96 -0.035% 0.00513% -3.34%21.94 20.93 -0.041% 0.00529% -3.44%23.99 22.97 -0.043% 0.00503% -3.48%28.65 27.63 -0.047% 0.00503% -3.56%35.82 34.80 -0.050% 0.00513% -3.64%42.97 41.95 -0.053% 0.00503% -3.70%49.86 48.84 -0.056% 0.00611% -3.74%56.76 55.74 -0.058% 0.00603% -3.77%71.13 70.11 -0.060% 0.00666% -3.81%85.20 84.18 -0.062% 0.00600% -3.83%90.99 89.97 -0.063% 0.00557% -3.85%99.14 98.12 -0.064% 0.00624% -3.86%
225.87 224.85 -0.074% 0.00551% -3.91%294.04 293.02 -0.076% 0.00577% -3.90%365.71 364.69 -0.077% 0.00577% -3.89%
HPC w/ SRA - 1 day cure data:
C-6
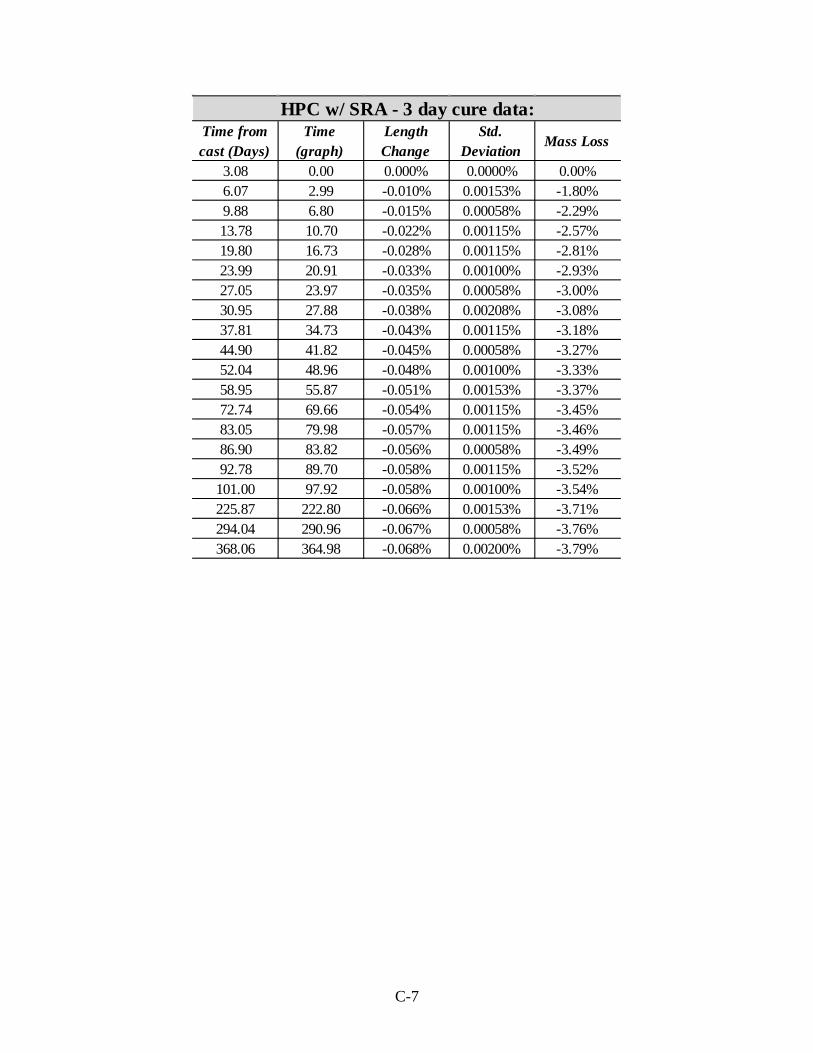
Time from cast (Days)
Time (graph)
Length Change
Std. Deviation
Mass Loss
3.08 0.00 0.000% 0.0000% 0.00%6.07 2.99 -0.010% 0.00153% -1.80%9.88 6.80 -0.015% 0.00058% -2.29%13.78 10.70 -0.022% 0.00115% -2.57%19.80 16.73 -0.028% 0.00115% -2.81%23.99 20.91 -0.033% 0.00100% -2.93%27.05 23.97 -0.035% 0.00058% -3.00%30.95 27.88 -0.038% 0.00208% -3.08%37.81 34.73 -0.043% 0.00115% -3.18%44.90 41.82 -0.045% 0.00058% -3.27%52.04 48.96 -0.048% 0.00100% -3.33%58.95 55.87 -0.051% 0.00153% -3.37%72.74 69.66 -0.054% 0.00115% -3.45%83.05 79.98 -0.057% 0.00115% -3.46%86.90 83.82 -0.056% 0.00058% -3.49%92.78 89.70 -0.058% 0.00115% -3.52%
101.00 97.92 -0.058% 0.00100% -3.54%225.87 222.80 -0.066% 0.00153% -3.71%294.04 290.96 -0.067% 0.00058% -3.76%368.06 364.98 -0.068% 0.00200% -3.79%
HPC w/ SRA - 3 day cure data:
C-7
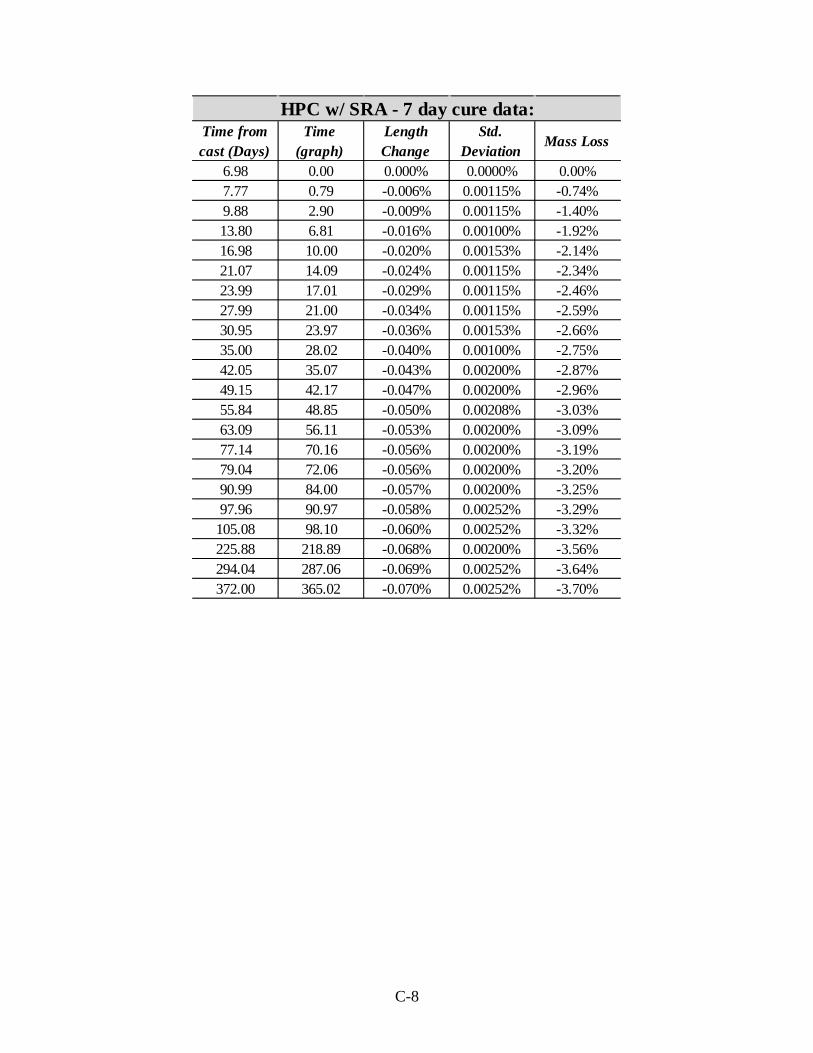
Time from cast (Days)
Time (graph)
Length Change
Std. Deviation
Mass Loss
6.98 0.00 0.000% 0.0000% 0.00%7.77 0.79 -0.006% 0.00115% -0.74%9.88 2.90 -0.009% 0.00115% -1.40%13.80 6.81 -0.016% 0.00100% -1.92%16.98 10.00 -0.020% 0.00153% -2.14%21.07 14.09 -0.024% 0.00115% -2.34%23.99 17.01 -0.029% 0.00115% -2.46%27.99 21.00 -0.034% 0.00115% -2.59%30.95 23.97 -0.036% 0.00153% -2.66%35.00 28.02 -0.040% 0.00100% -2.75%42.05 35.07 -0.043% 0.00200% -2.87%49.15 42.17 -0.047% 0.00200% -2.96%55.84 48.85 -0.050% 0.00208% -3.03%63.09 56.11 -0.053% 0.00200% -3.09%77.14 70.16 -0.056% 0.00200% -3.19%79.04 72.06 -0.056% 0.00200% -3.20%90.99 84.00 -0.057% 0.00200% -3.25%97.96 90.97 -0.058% 0.00252% -3.29%
105.08 98.10 -0.060% 0.00252% -3.32%225.88 218.89 -0.068% 0.00200% -3.56%294.04 287.06 -0.069% 0.00252% -3.64%372.00 365.02 -0.070% 0.00252% -3.70%
HPC w/ SRA - 7 day cure data:
C-8
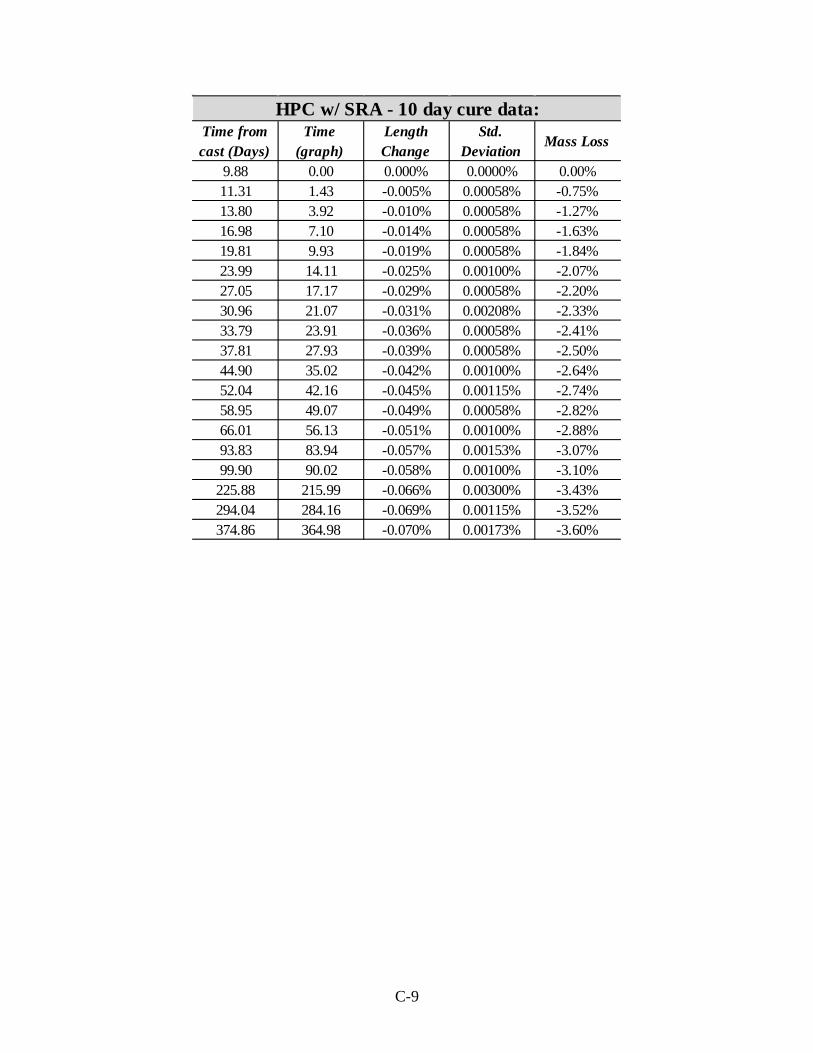
Time from cast (Days)
Time (graph)
Length Change
Std. Deviation
Mass Loss
9.88 0.00 0.000% 0.0000% 0.00%11.31 1.43 -0.005% 0.00058% -0.75%13.80 3.92 -0.010% 0.00058% -1.27%16.98 7.10 -0.014% 0.00058% -1.63%19.81 9.93 -0.019% 0.00058% -1.84%23.99 14.11 -0.025% 0.00100% -2.07%27.05 17.17 -0.029% 0.00058% -2.20%30.96 21.07 -0.031% 0.00208% -2.33%33.79 23.91 -0.036% 0.00058% -2.41%37.81 27.93 -0.039% 0.00058% -2.50%44.90 35.02 -0.042% 0.00100% -2.64%52.04 42.16 -0.045% 0.00115% -2.74%58.95 49.07 -0.049% 0.00058% -2.82%66.01 56.13 -0.051% 0.00100% -2.88%93.83 83.94 -0.057% 0.00153% -3.07%99.90 90.02 -0.058% 0.00100% -3.10%
225.88 215.99 -0.066% 0.00300% -3.43%294.04 284.16 -0.069% 0.00115% -3.52%374.86 364.98 -0.070% 0.00173% -3.60%
HPC w/ SRA - 10 day cure data:
C-9
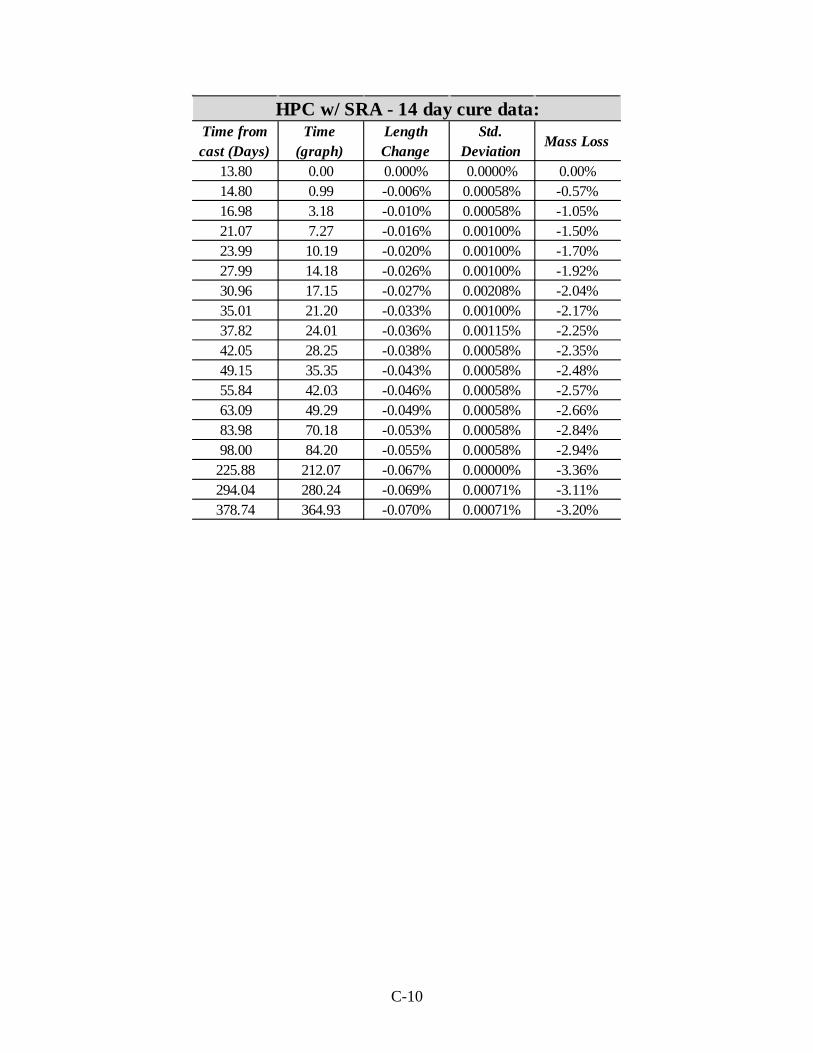
Time from cast (Days)
Time (graph)
Length Change
Std. Deviation
Mass Loss
13.80 0.00 0.000% 0.0000% 0.00%14.80 0.99 -0.006% 0.00058% -0.57%16.98 3.18 -0.010% 0.00058% -1.05%21.07 7.27 -0.016% 0.00100% -1.50%23.99 10.19 -0.020% 0.00100% -1.70%27.99 14.18 -0.026% 0.00100% -1.92%30.96 17.15 -0.027% 0.00208% -2.04%35.01 21.20 -0.033% 0.00100% -2.17%37.82 24.01 -0.036% 0.00115% -2.25%42.05 28.25 -0.038% 0.00058% -2.35%49.15 35.35 -0.043% 0.00058% -2.48%55.84 42.03 -0.046% 0.00058% -2.57%63.09 49.29 -0.049% 0.00058% -2.66%83.98 70.18 -0.053% 0.00058% -2.84%98.00 84.20 -0.055% 0.00058% -2.94%
225.88 212.07 -0.067% 0.00000% -3.36%294.04 280.24 -0.069% 0.00071% -3.11%378.74 364.93 -0.070% 0.00071% -3.20%
HPC w/ SRA - 14 day cure data:
C-10

Time from cast (Days)
Time (graph)
Length Change
Std. Deviation
Mass Loss
1.07 0.00 0.000% 0.0000% 0.00%2.07 1.00 -0.007% 0.00000% -2.79%5.04 3.97 -0.022% 0.00173% -3.71%8.05 6.98 -0.032% 0.00231% -4.02%11.00 9.93 -0.039% 0.00231% -4.20%15.02 13.95 -0.048% 0.00252% -4.34%18.07 17.00 -0.052% 0.00252% -4.40%22.06 20.99 -0.056% 0.00252% -4.47%25.08 24.01 -0.058% 0.00300% -4.51%30.17 29.10 -0.061% 0.00265% -4.56%36.01 34.94 -0.064% 0.00252% -4.60%42.96 41.89 -0.067% 0.00252% -4.63%49.98 48.92 -0.068% 0.00252% -4.65%57.00 55.93 -0.069% 0.00265% -4.66%71.03 69.96 -0.070% 0.00300% -4.68%85.24 84.17 -0.071% 0.00252% -4.68%99.23 98.16 -0.075% 0.00306% -4.68%
113.05 111.98 -0.074% 0.00351% -4.67%169.26 168.19 -0.079% 0.00361% -4.63%182.01 180.94 -0.081% 0.00379% -4.62%
HPC w/ Clay-1 - 1 day cure data:
C-11
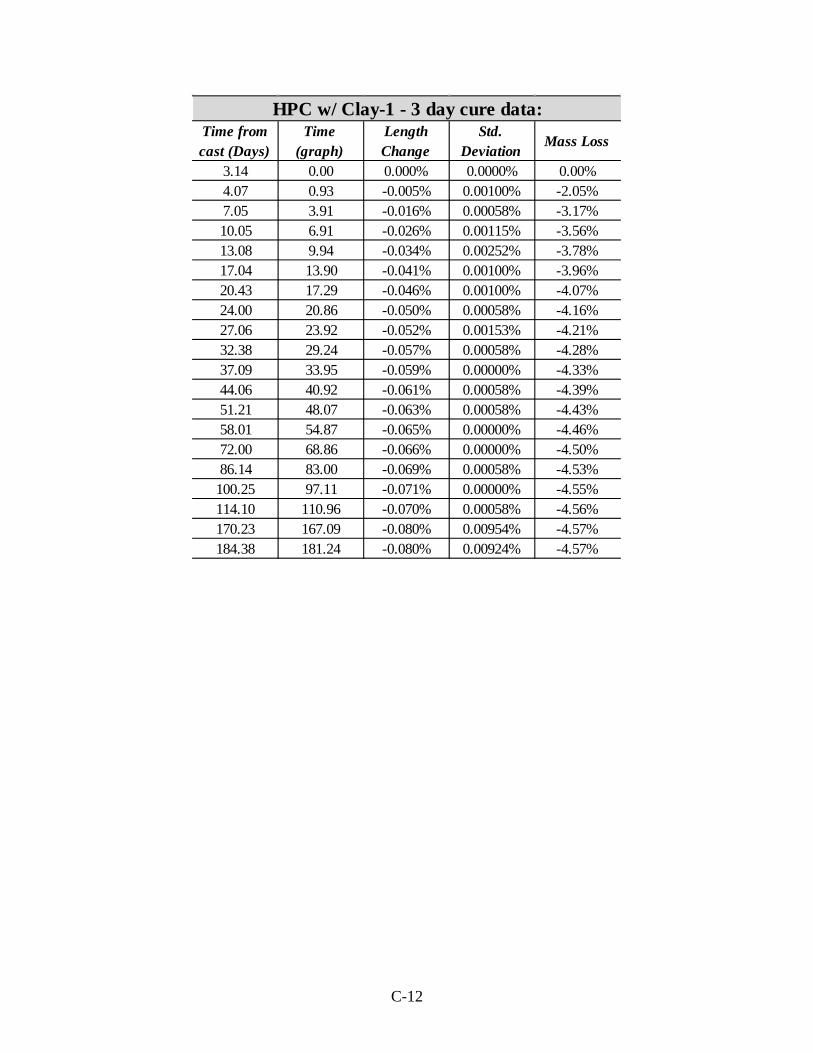
Time from cast (Days)
Time (graph)
Length Change
Std. Deviation
Mass Loss
3.14 0.00 0.000% 0.0000% 0.00%4.07 0.93 -0.005% 0.00100% -2.05%7.05 3.91 -0.016% 0.00058% -3.17%10.05 6.91 -0.026% 0.00115% -3.56%13.08 9.94 -0.034% 0.00252% -3.78%17.04 13.90 -0.041% 0.00100% -3.96%20.43 17.29 -0.046% 0.00100% -4.07%24.00 20.86 -0.050% 0.00058% -4.16%27.06 23.92 -0.052% 0.00153% -4.21%32.38 29.24 -0.057% 0.00058% -4.28%37.09 33.95 -0.059% 0.00000% -4.33%44.06 40.92 -0.061% 0.00058% -4.39%51.21 48.07 -0.063% 0.00058% -4.43%58.01 54.87 -0.065% 0.00000% -4.46%72.00 68.86 -0.066% 0.00000% -4.50%86.14 83.00 -0.069% 0.00058% -4.53%
100.25 97.11 -0.071% 0.00000% -4.55%114.10 110.96 -0.070% 0.00058% -4.56%170.23 167.09 -0.080% 0.00954% -4.57%184.38 181.24 -0.080% 0.00924% -4.57%
HPC w/ Clay-1 - 3 day cure data:
C-12
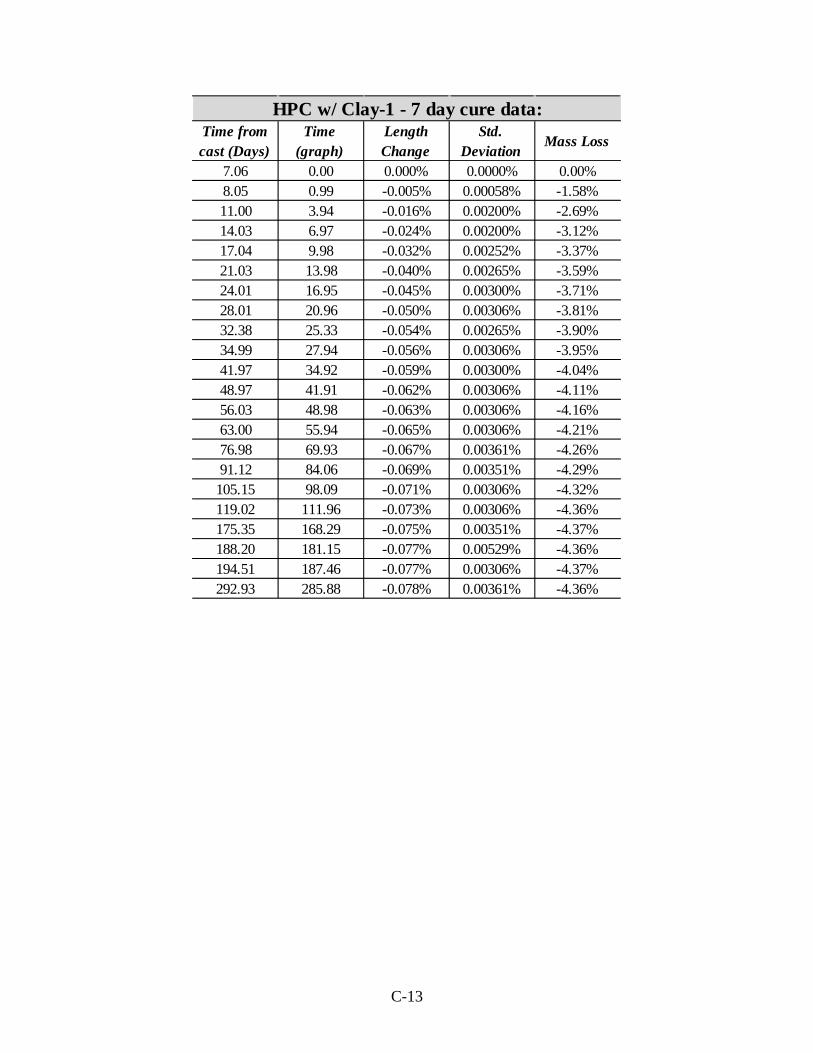
Time from cast (Days)
Time (graph)
Length Change
Std. Deviation
Mass Loss
7.06 0.00 0.000% 0.0000% 0.00%8.05 0.99 -0.005% 0.00058% -1.58%11.00 3.94 -0.016% 0.00200% -2.69%14.03 6.97 -0.024% 0.00200% -3.12%17.04 9.98 -0.032% 0.00252% -3.37%21.03 13.98 -0.040% 0.00265% -3.59%24.01 16.95 -0.045% 0.00300% -3.71%28.01 20.96 -0.050% 0.00306% -3.81%32.38 25.33 -0.054% 0.00265% -3.90%34.99 27.94 -0.056% 0.00306% -3.95%41.97 34.92 -0.059% 0.00300% -4.04%48.97 41.91 -0.062% 0.00306% -4.11%56.03 48.98 -0.063% 0.00306% -4.16%63.00 55.94 -0.065% 0.00306% -4.21%76.98 69.93 -0.067% 0.00361% -4.26%91.12 84.06 -0.069% 0.00351% -4.29%
105.15 98.09 -0.071% 0.00306% -4.32%119.02 111.96 -0.073% 0.00306% -4.36%175.35 168.29 -0.075% 0.00351% -4.37%188.20 181.15 -0.077% 0.00529% -4.36%194.51 187.46 -0.077% 0.00306% -4.37%292.93 285.88 -0.078% 0.00361% -4.36%
HPC w/ Clay-1 - 7 day cure data:
C-13
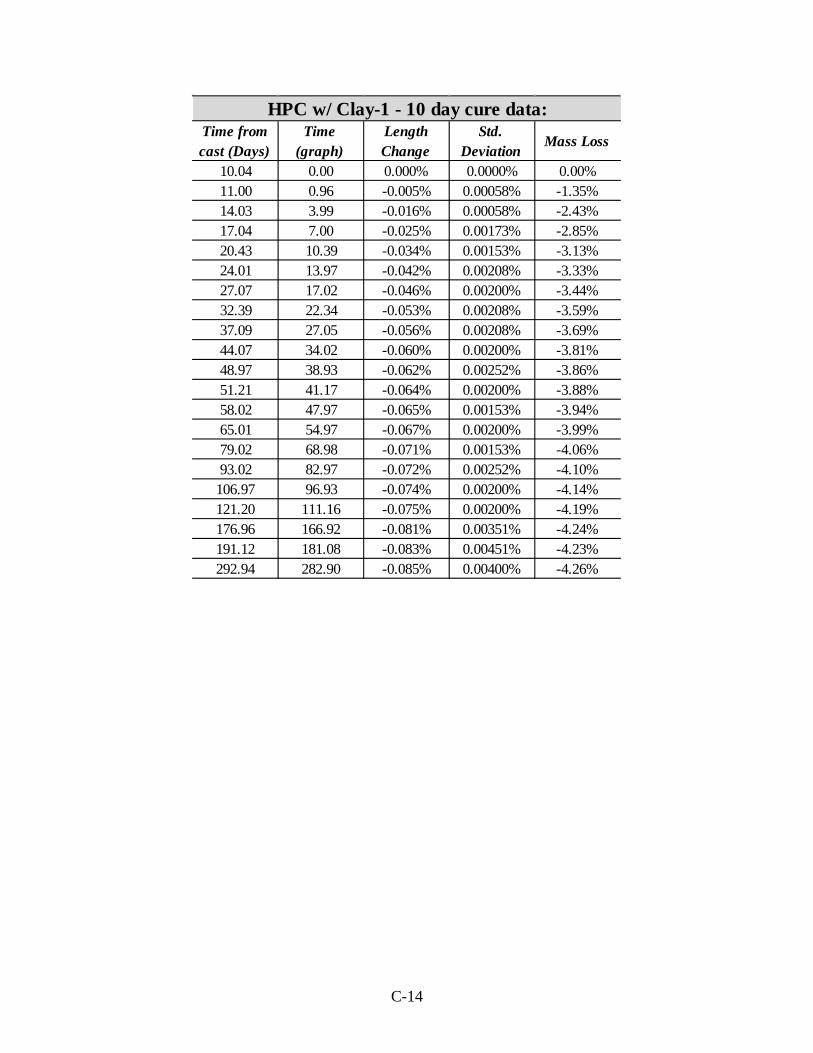
Time from cast (Days)
Time (graph)
Length Change
Std. Deviation
Mass Loss
10.04 0.00 0.000% 0.0000% 0.00%11.00 0.96 -0.005% 0.00058% -1.35%14.03 3.99 -0.016% 0.00058% -2.43%17.04 7.00 -0.025% 0.00173% -2.85%20.43 10.39 -0.034% 0.00153% -3.13%24.01 13.97 -0.042% 0.00208% -3.33%27.07 17.02 -0.046% 0.00200% -3.44%32.39 22.34 -0.053% 0.00208% -3.59%37.09 27.05 -0.056% 0.00208% -3.69%44.07 34.02 -0.060% 0.00200% -3.81%48.97 38.93 -0.062% 0.00252% -3.86%51.21 41.17 -0.064% 0.00200% -3.88%58.02 47.97 -0.065% 0.00153% -3.94%65.01 54.97 -0.067% 0.00200% -3.99%79.02 68.98 -0.071% 0.00153% -4.06%93.02 82.97 -0.072% 0.00252% -4.10%
106.97 96.93 -0.074% 0.00200% -4.14%121.20 111.16 -0.075% 0.00200% -4.19%176.96 166.92 -0.081% 0.00351% -4.24%191.12 181.08 -0.083% 0.00451% -4.23%292.94 282.90 -0.085% 0.00400% -4.26%
HPC w/ Clay-1 - 10 day cure data:
C-14
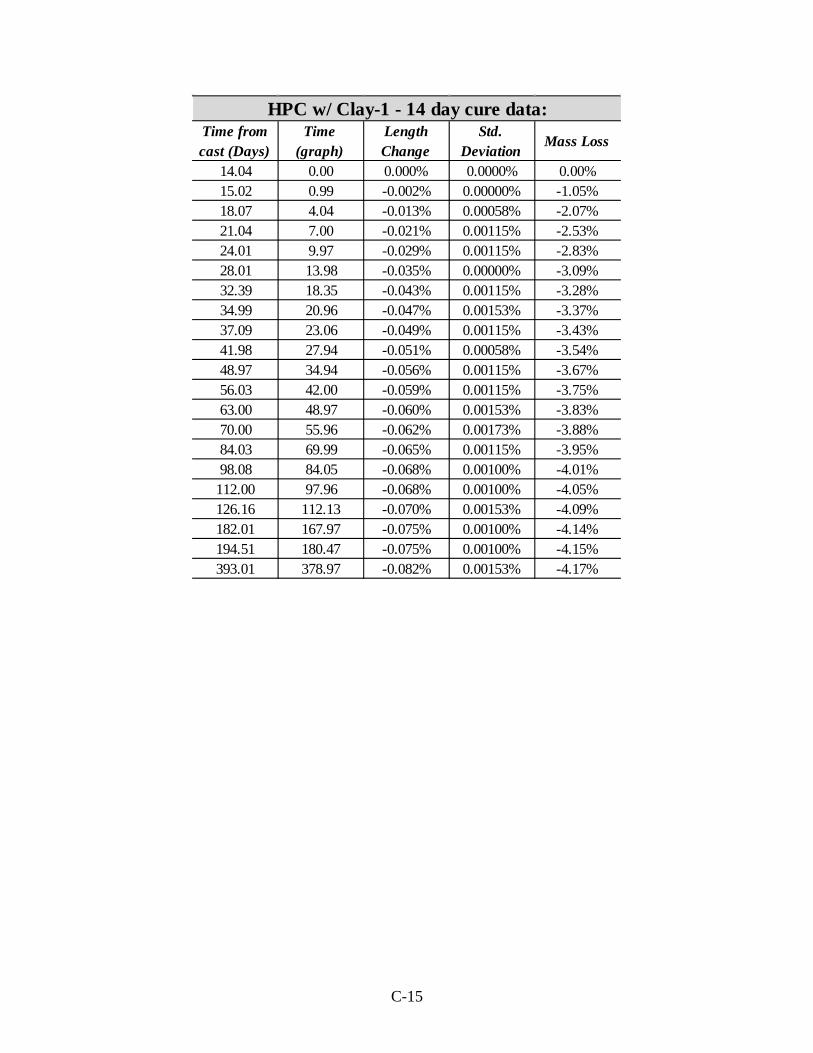
Time from cast (Days)
Time (graph)
Length Change
Std. Deviation
Mass Loss
14.04 0.00 0.000% 0.0000% 0.00%15.02 0.99 -0.002% 0.00000% -1.05%18.07 4.04 -0.013% 0.00058% -2.07%21.04 7.00 -0.021% 0.00115% -2.53%24.01 9.97 -0.029% 0.00115% -2.83%28.01 13.98 -0.035% 0.00000% -3.09%32.39 18.35 -0.043% 0.00115% -3.28%34.99 20.96 -0.047% 0.00153% -3.37%37.09 23.06 -0.049% 0.00115% -3.43%41.98 27.94 -0.051% 0.00058% -3.54%48.97 34.94 -0.056% 0.00115% -3.67%56.03 42.00 -0.059% 0.00115% -3.75%63.00 48.97 -0.060% 0.00153% -3.83%70.00 55.96 -0.062% 0.00173% -3.88%84.03 69.99 -0.065% 0.00115% -3.95%98.08 84.05 -0.068% 0.00100% -4.01%
112.00 97.96 -0.068% 0.00100% -4.05%126.16 112.13 -0.070% 0.00153% -4.09%182.01 167.97 -0.075% 0.00100% -4.14%194.51 180.47 -0.075% 0.00100% -4.15%393.01 378.97 -0.082% 0.00153% -4.17%
HPC w/ Clay-1 - 14 day cure data:
C-15
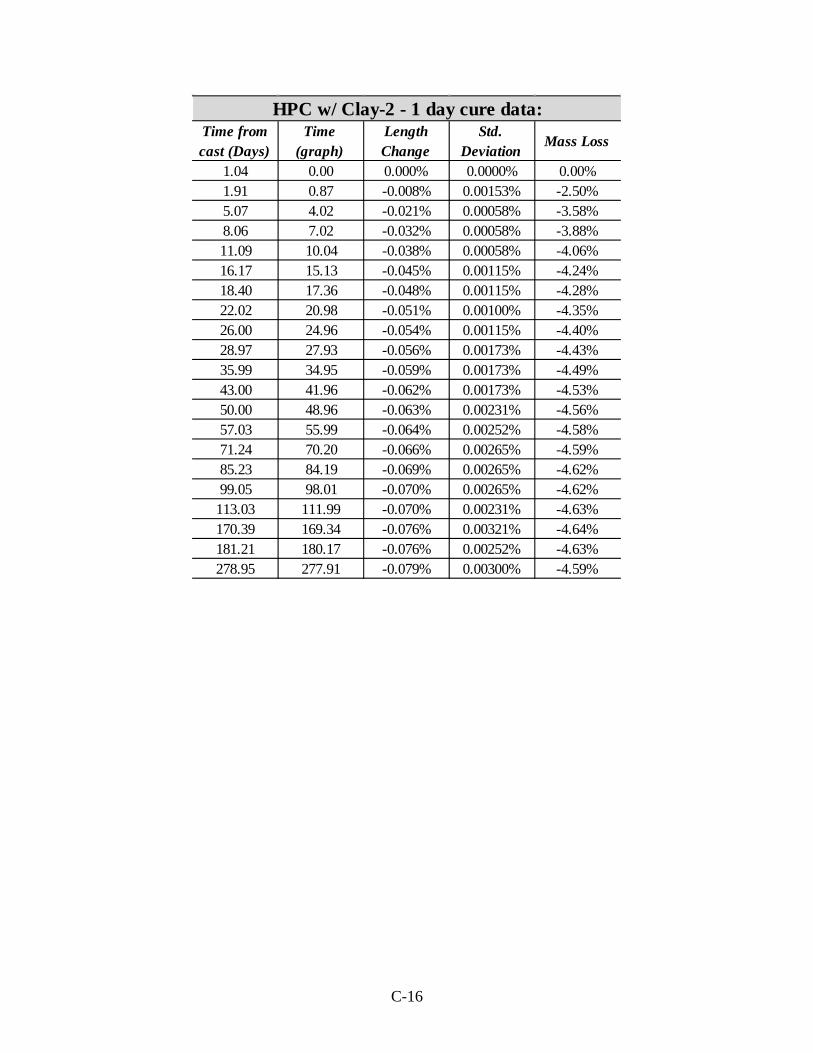
Time from cast (Days)
Time (graph)
Length Change
Std. Deviation
Mass Loss
1.04 0.00 0.000% 0.0000% 0.00%1.91 0.87 -0.008% 0.00153% -2.50%5.07 4.02 -0.021% 0.00058% -3.58%8.06 7.02 -0.032% 0.00058% -3.88%11.09 10.04 -0.038% 0.00058% -4.06%16.17 15.13 -0.045% 0.00115% -4.24%18.40 17.36 -0.048% 0.00115% -4.28%22.02 20.98 -0.051% 0.00100% -4.35%26.00 24.96 -0.054% 0.00115% -4.40%28.97 27.93 -0.056% 0.00173% -4.43%35.99 34.95 -0.059% 0.00173% -4.49%43.00 41.96 -0.062% 0.00173% -4.53%50.00 48.96 -0.063% 0.00231% -4.56%57.03 55.99 -0.064% 0.00252% -4.58%71.24 70.20 -0.066% 0.00265% -4.59%85.23 84.19 -0.069% 0.00265% -4.62%99.05 98.01 -0.070% 0.00265% -4.62%
113.03 111.99 -0.070% 0.00231% -4.63%170.39 169.34 -0.076% 0.00321% -4.64%181.21 180.17 -0.076% 0.00252% -4.63%278.95 277.91 -0.079% 0.00300% -4.59%
HPC w/ Clay-2 - 1 day cure data:
C-16
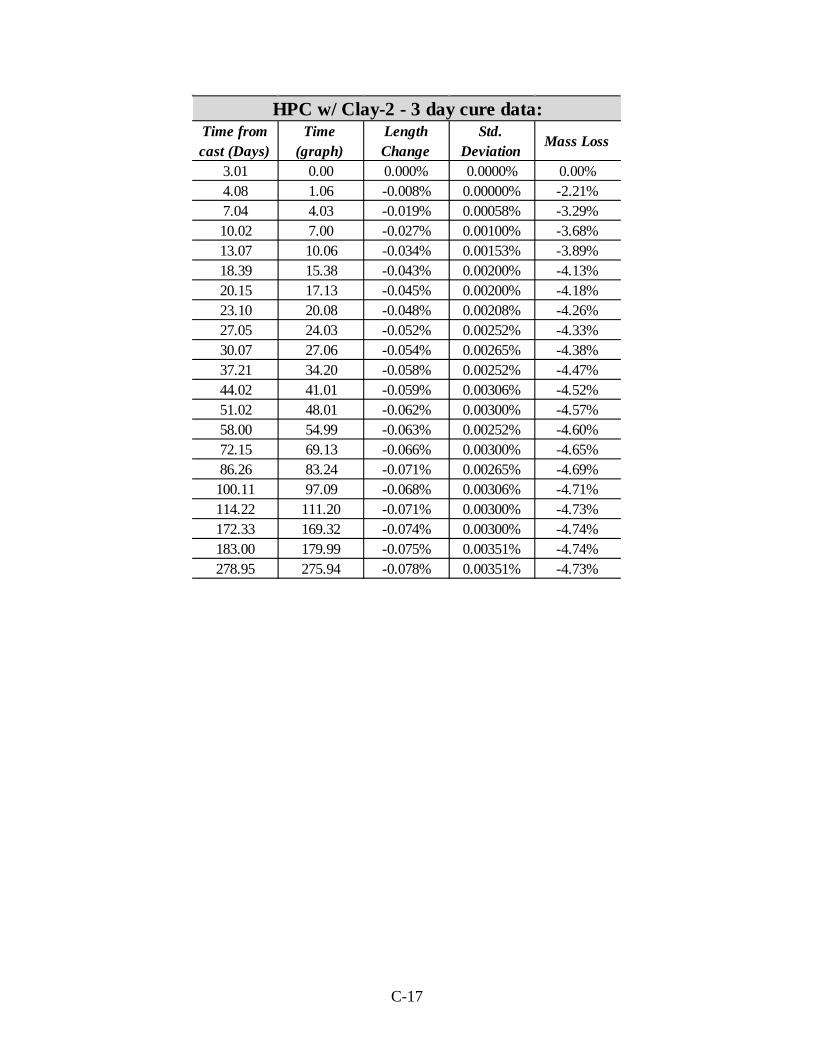
Time from cast (Days)
Time (graph)
Length Change
Std. Deviation
Mass Loss
3.01 0.00 0.000% 0.0000% 0.00%4.08 1.06 -0.008% 0.00000% -2.21%7.04 4.03 -0.019% 0.00058% -3.29%10.02 7.00 -0.027% 0.00100% -3.68%13.07 10.06 -0.034% 0.00153% -3.89%18.39 15.38 -0.043% 0.00200% -4.13%20.15 17.13 -0.045% 0.00200% -4.18%23.10 20.08 -0.048% 0.00208% -4.26%27.05 24.03 -0.052% 0.00252% -4.33%30.07 27.06 -0.054% 0.00265% -4.38%37.21 34.20 -0.058% 0.00252% -4.47%44.02 41.01 -0.059% 0.00306% -4.52%51.02 48.01 -0.062% 0.00300% -4.57%58.00 54.99 -0.063% 0.00252% -4.60%72.15 69.13 -0.066% 0.00300% -4.65%86.26 83.24 -0.071% 0.00265% -4.69%
100.11 97.09 -0.068% 0.00306% -4.71%114.22 111.20 -0.071% 0.00300% -4.73%172.33 169.32 -0.074% 0.00300% -4.74%183.00 179.99 -0.075% 0.00351% -4.74%278.95 275.94 -0.078% 0.00351% -4.73%
HPC w/ Clay-2 - 3 day cure data:
C-17

Time from cast (Days)
Time (graph)
Length Change
Std. Deviation
Mass Loss
6.96 0.00 0.000% 0.0000% 0.00%8.06 1.10 -0.006% 0.00058% -1.60%11.09 4.13 -0.017% 0.00058% -2.72%14.01 7.05 -0.025% 0.00058% -3.12%18.39 11.43 -0.034% 0.00058% -3.45%21.00 14.03 -0.039% 0.00115% -3.61%23.10 16.13 -0.042% 0.00115% -3.66%27.98 21.01 -0.048% 0.00115% -3.80%30.08 23.11 -0.050% 0.00153% -3.85%34.98 28.01 -0.053% 0.00100% -3.94%42.04 35.07 -0.057% 0.00100% -4.03%49.01 42.04 -0.059% 0.00153% -4.11%56.00 49.04 -0.062% 0.00153% -4.16%62.99 56.02 -0.063% 0.00100% -4.20%77.13 70.16 -0.066% 0.00100% -4.26%91.15 84.19 -0.068% 0.00100% -4.31%
105.02 98.06 -0.071% 0.00153% -4.36%118.87 111.90 -0.073% 0.00058% -4.38%175.42 168.46 -0.074% 0.00100% -4.41%188.18 181.21 -0.075% 0.00153% -4.42%278.95 271.99 -0.078% 0.00058% -4.43%
HPC w/ Clay-2 - 7 day cure data:
C-18

Time from cast (Days)
Time (graph)
Length Change
Std. Deviation
Mass Loss
10.03 0.00 0.000% 0.0000% 0.00%11.09 1.06 -0.005% 0.00058% -1.50%14.01 3.98 -0.016% 0.00100% -2.47%18.39 8.36 -0.027% 0.00100% -3.00%20.15 10.12 -0.031% 0.00153% -3.12%23.10 13.07 -0.036% 0.00153% -3.29%27.05 17.02 -0.042% 0.00200% -3.44%30.08 20.05 -0.046% 0.00153% -3.54%34.28 24.25 -0.048% 0.00208% -3.64%37.21 27.19 -0.051% 0.00100% -3.68%44.02 33.99 -0.054% 0.00173% -3.78%51.02 40.99 -0.056% 0.00208% -3.87%58.01 47.98 -0.059% 0.00231% -3.92%65.02 55.00 -0.061% 0.00173% -3.97%83.18 73.15 -0.064% 0.00252% -4.06%92.97 82.95 -0.066% 0.00231% -4.09%
107.21 97.18 -0.067% 0.00231% -4.15%177.12 167.10 -0.073% 0.00231% -4.21%190.13 180.10 -0.073% 0.00289% -4.22%278.95 268.93 -0.076% 0.00208% -4.25%
HPC w/ Clay-2 - 10 day cure data:
C-19
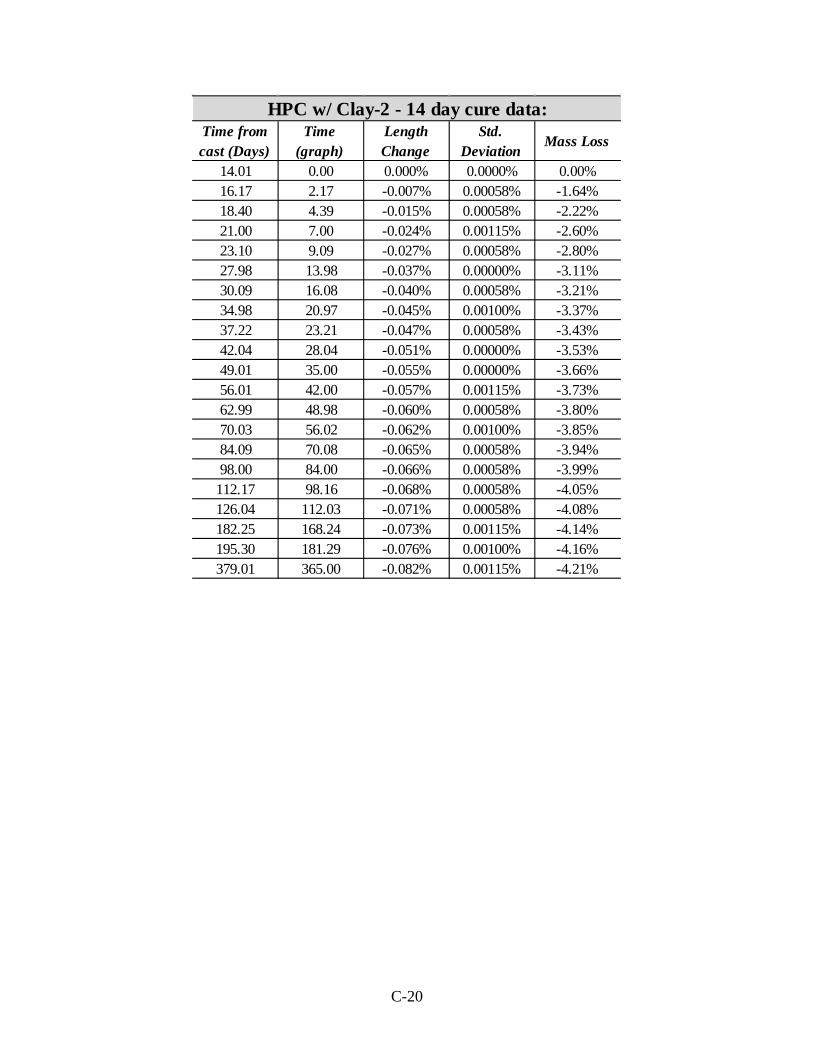
Time from cast (Days)
Time (graph)
Length Change
Std. Deviation
Mass Loss
14.01 0.00 0.000% 0.0000% 0.00%16.17 2.17 -0.007% 0.00058% -1.64%18.40 4.39 -0.015% 0.00058% -2.22%21.00 7.00 -0.024% 0.00115% -2.60%23.10 9.09 -0.027% 0.00058% -2.80%27.98 13.98 -0.037% 0.00000% -3.11%30.09 16.08 -0.040% 0.00058% -3.21%34.98 20.97 -0.045% 0.00100% -3.37%37.22 23.21 -0.047% 0.00058% -3.43%42.04 28.04 -0.051% 0.00000% -3.53%49.01 35.00 -0.055% 0.00000% -3.66%56.01 42.00 -0.057% 0.00115% -3.73%62.99 48.98 -0.060% 0.00058% -3.80%70.03 56.02 -0.062% 0.00100% -3.85%84.09 70.08 -0.065% 0.00058% -3.94%98.00 84.00 -0.066% 0.00058% -3.99%
112.17 98.16 -0.068% 0.00058% -4.05%126.04 112.03 -0.071% 0.00058% -4.08%182.25 168.24 -0.073% 0.00115% -4.14%195.30 181.29 -0.076% 0.00100% -4.16%379.01 365.00 -0.082% 0.00115% -4.21%
HPC w/ Clay-2 - 14 day cure data:
C-20
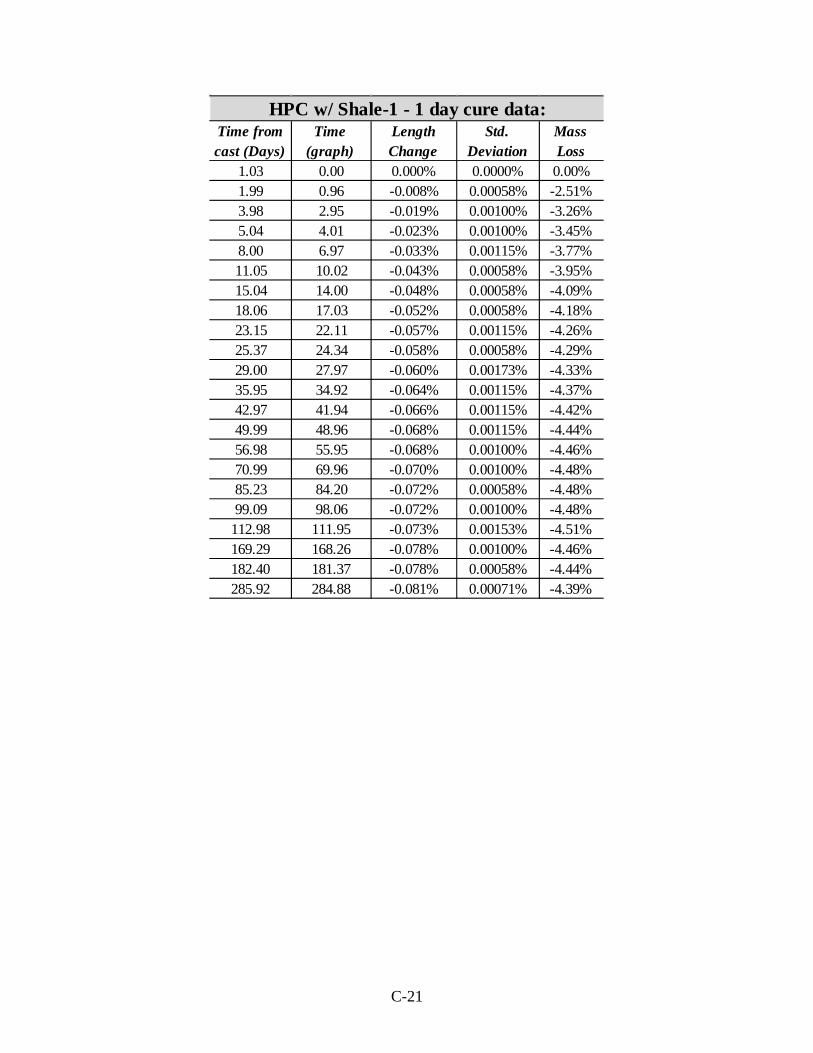
Time from cast (Days)
Time (graph)
Length Change
Std. Deviation
Mass Loss
1.03 0.00 0.000% 0.0000% 0.00%1.99 0.96 -0.008% 0.00058% -2.51%3.98 2.95 -0.019% 0.00100% -3.26%5.04 4.01 -0.023% 0.00100% -3.45%8.00 6.97 -0.033% 0.00115% -3.77%11.05 10.02 -0.043% 0.00058% -3.95%15.04 14.00 -0.048% 0.00058% -4.09%18.06 17.03 -0.052% 0.00058% -4.18%23.15 22.11 -0.057% 0.00115% -4.26%25.37 24.34 -0.058% 0.00058% -4.29%29.00 27.97 -0.060% 0.00173% -4.33%35.95 34.92 -0.064% 0.00115% -4.37%42.97 41.94 -0.066% 0.00115% -4.42%49.99 48.96 -0.068% 0.00115% -4.44%56.98 55.95 -0.068% 0.00100% -4.46%70.99 69.96 -0.070% 0.00100% -4.48%85.23 84.20 -0.072% 0.00058% -4.48%99.09 98.06 -0.072% 0.00100% -4.48%
112.98 111.95 -0.073% 0.00153% -4.51%169.29 168.26 -0.078% 0.00100% -4.46%182.40 181.37 -0.078% 0.00058% -4.44%285.92 284.88 -0.081% 0.00071% -4.39%
HPC w/ Shale-1 - 1 day cure data:
C-21
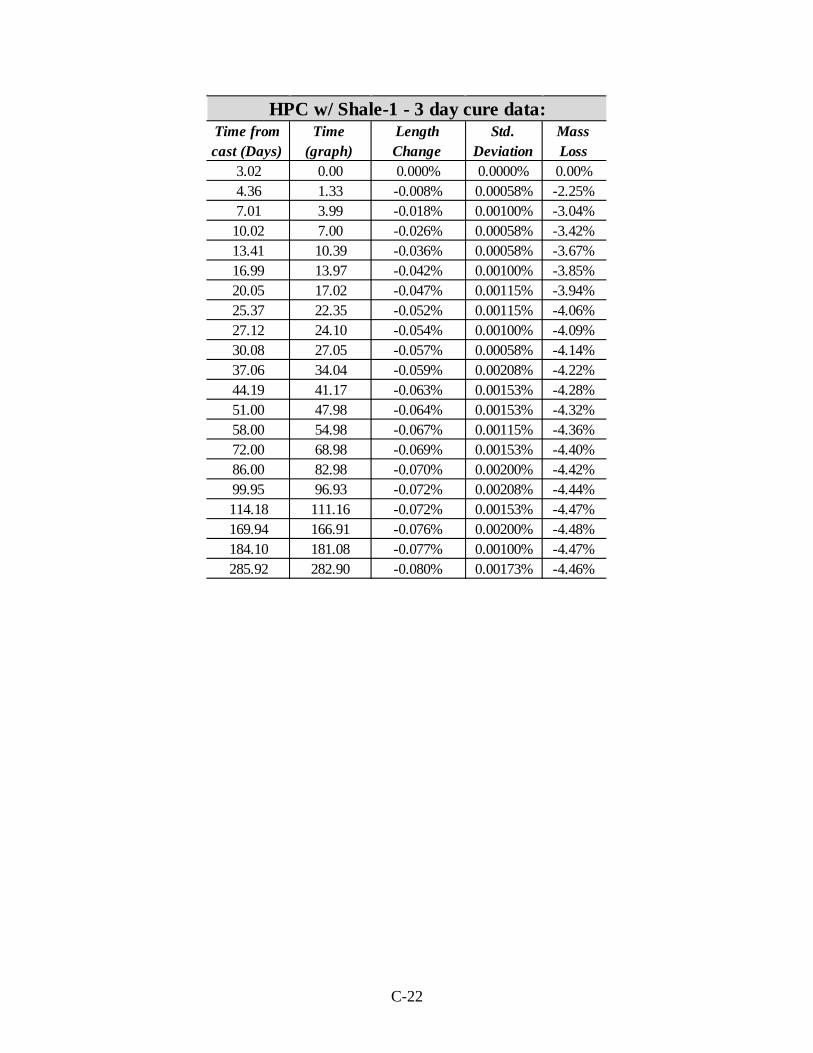
Time from cast (Days)
Time (graph)
Length Change
Std. Deviation
Mass Loss
3.02 0.00 0.000% 0.0000% 0.00%4.36 1.33 -0.008% 0.00058% -2.25%7.01 3.99 -0.018% 0.00100% -3.04%
10.02 7.00 -0.026% 0.00058% -3.42%13.41 10.39 -0.036% 0.00058% -3.67%16.99 13.97 -0.042% 0.00100% -3.85%20.05 17.02 -0.047% 0.00115% -3.94%25.37 22.35 -0.052% 0.00115% -4.06%27.12 24.10 -0.054% 0.00100% -4.09%30.08 27.05 -0.057% 0.00058% -4.14%37.06 34.04 -0.059% 0.00208% -4.22%44.19 41.17 -0.063% 0.00153% -4.28%51.00 47.98 -0.064% 0.00153% -4.32%58.00 54.98 -0.067% 0.00115% -4.36%72.00 68.98 -0.069% 0.00153% -4.40%86.00 82.98 -0.070% 0.00200% -4.42%99.95 96.93 -0.072% 0.00208% -4.44%114.18 111.16 -0.072% 0.00153% -4.47%169.94 166.91 -0.076% 0.00200% -4.48%184.10 181.08 -0.077% 0.00100% -4.47%285.92 282.90 -0.080% 0.00173% -4.46%
HPC w/ Shale-1 - 3 day cure data:
C-22
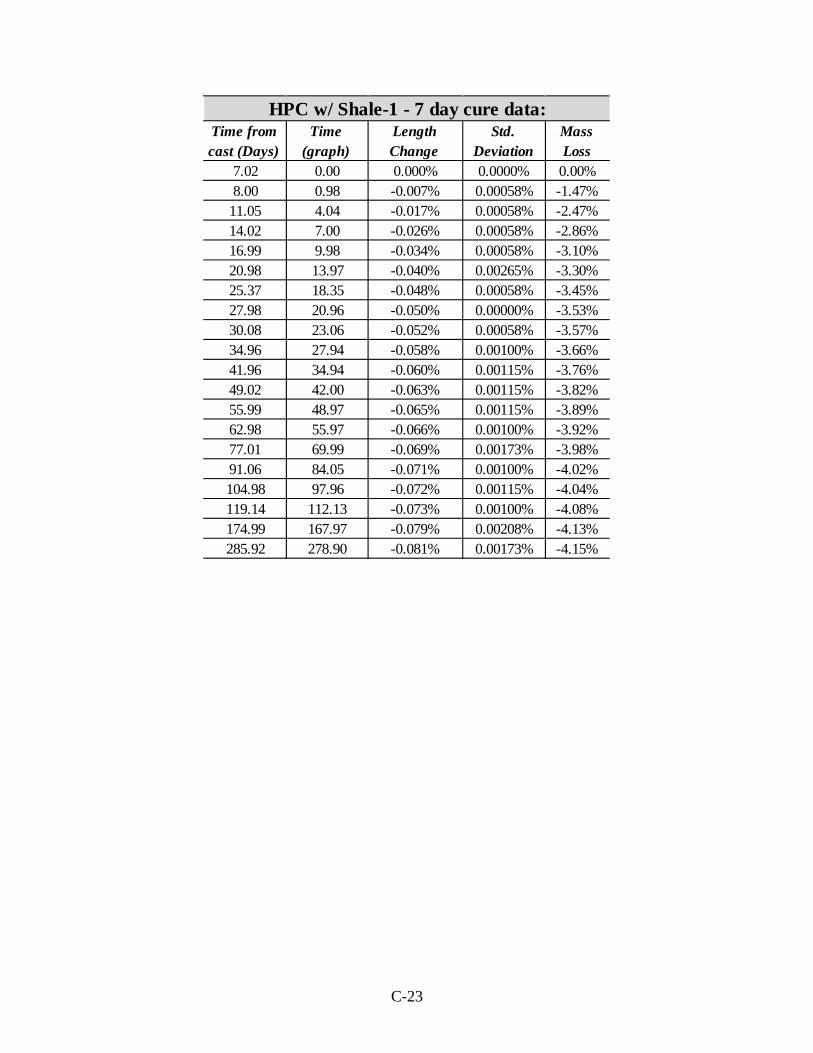
Time from cast (Days)
Time (graph)
Length Change
Std. Deviation
Mass Loss
7.02 0.00 0.000% 0.0000% 0.00%8.00 0.98 -0.007% 0.00058% -1.47%
11.05 4.04 -0.017% 0.00058% -2.47%14.02 7.00 -0.026% 0.00058% -2.86%16.99 9.98 -0.034% 0.00058% -3.10%20.98 13.97 -0.040% 0.00265% -3.30%25.37 18.35 -0.048% 0.00058% -3.45%27.98 20.96 -0.050% 0.00000% -3.53%30.08 23.06 -0.052% 0.00058% -3.57%34.96 27.94 -0.058% 0.00100% -3.66%41.96 34.94 -0.060% 0.00115% -3.76%49.02 42.00 -0.063% 0.00115% -3.82%55.99 48.97 -0.065% 0.00115% -3.89%62.98 55.97 -0.066% 0.00100% -3.92%77.01 69.99 -0.069% 0.00173% -3.98%91.06 84.05 -0.071% 0.00100% -4.02%104.98 97.96 -0.072% 0.00115% -4.04%119.14 112.13 -0.073% 0.00100% -4.08%174.99 167.97 -0.079% 0.00208% -4.13%285.92 278.90 -0.081% 0.00173% -4.15%
HPC w/ Shale-1 - 7 day cure data:
C-23
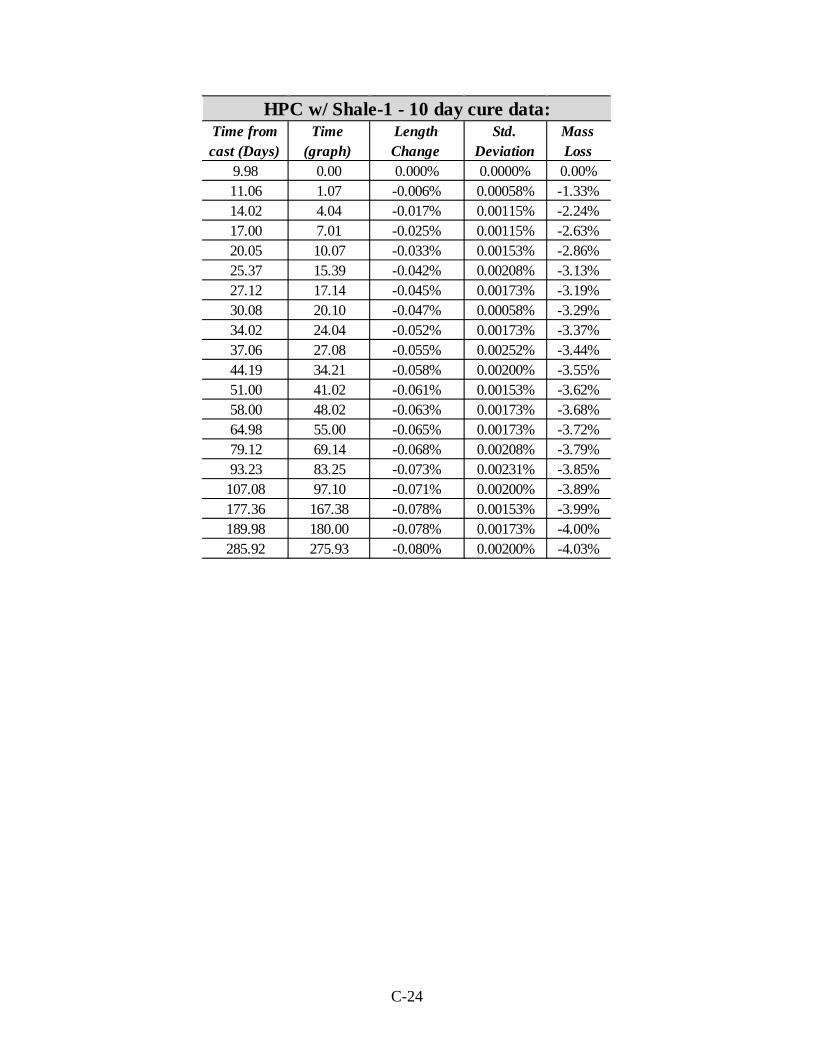
Time from cast (Days)
Time (graph)
Length Change
Std. Deviation
Mass Loss
9.98 0.00 0.000% 0.0000% 0.00%11.06 1.07 -0.006% 0.00058% -1.33%14.02 4.04 -0.017% 0.00115% -2.24%17.00 7.01 -0.025% 0.00115% -2.63%20.05 10.07 -0.033% 0.00153% -2.86%25.37 15.39 -0.042% 0.00208% -3.13%27.12 17.14 -0.045% 0.00173% -3.19%30.08 20.10 -0.047% 0.00058% -3.29%34.02 24.04 -0.052% 0.00173% -3.37%37.06 27.08 -0.055% 0.00252% -3.44%44.19 34.21 -0.058% 0.00200% -3.55%51.00 41.02 -0.061% 0.00153% -3.62%58.00 48.02 -0.063% 0.00173% -3.68%64.98 55.00 -0.065% 0.00173% -3.72%79.12 69.14 -0.068% 0.00208% -3.79%93.23 83.25 -0.073% 0.00231% -3.85%
107.08 97.10 -0.071% 0.00200% -3.89%177.36 167.38 -0.078% 0.00153% -3.99%189.98 180.00 -0.078% 0.00173% -4.00%285.92 275.93 -0.080% 0.00200% -4.03%
HPC w/ Shale-1 - 10 day cure data:
C-24
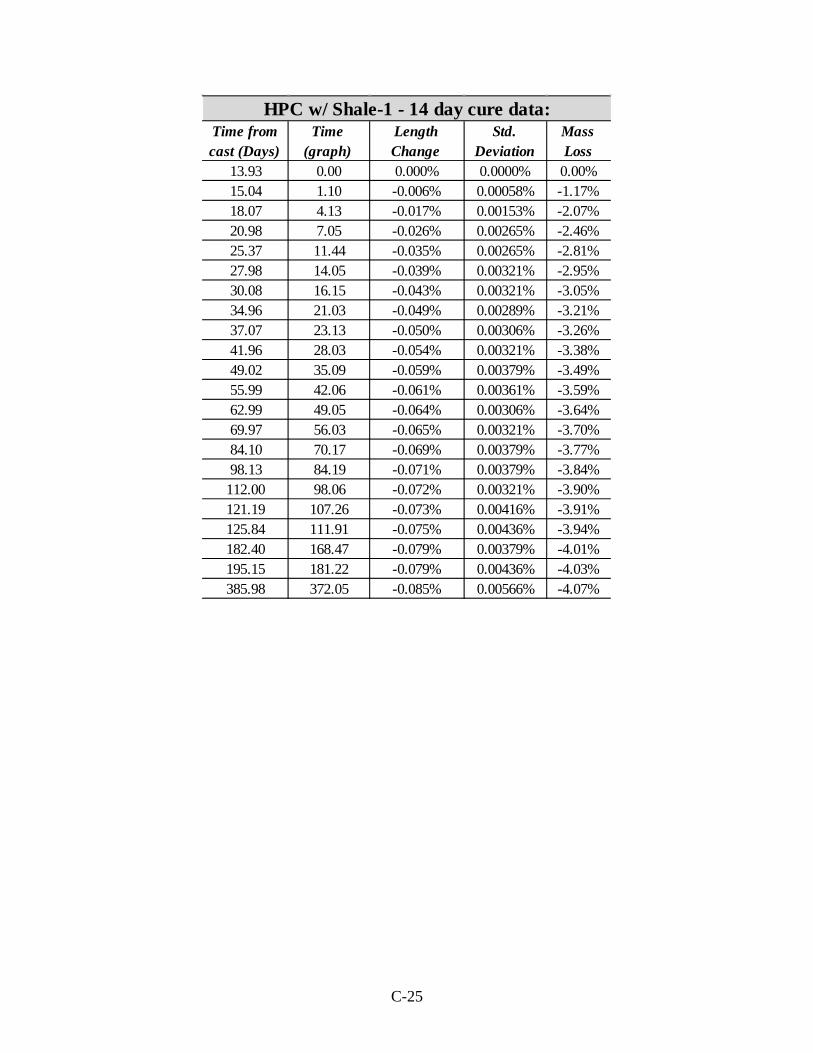
Time from cast (Days)
Time (graph)
Length Change
Std. Deviation
Mass Loss
13.93 0.00 0.000% 0.0000% 0.00%15.04 1.10 -0.006% 0.00058% -1.17%18.07 4.13 -0.017% 0.00153% -2.07%20.98 7.05 -0.026% 0.00265% -2.46%25.37 11.44 -0.035% 0.00265% -2.81%27.98 14.05 -0.039% 0.00321% -2.95%30.08 16.15 -0.043% 0.00321% -3.05%34.96 21.03 -0.049% 0.00289% -3.21%37.07 23.13 -0.050% 0.00306% -3.26%41.96 28.03 -0.054% 0.00321% -3.38%49.02 35.09 -0.059% 0.00379% -3.49%55.99 42.06 -0.061% 0.00361% -3.59%62.99 49.05 -0.064% 0.00306% -3.64%69.97 56.03 -0.065% 0.00321% -3.70%84.10 70.17 -0.069% 0.00379% -3.77%98.13 84.19 -0.071% 0.00379% -3.84%
112.00 98.06 -0.072% 0.00321% -3.90%121.19 107.26 -0.073% 0.00416% -3.91%125.84 111.91 -0.075% 0.00436% -3.94%182.40 168.47 -0.079% 0.00379% -4.01%195.15 181.22 -0.079% 0.00436% -4.03%385.98 372.05 -0.085% 0.00566% -4.07%
HPC w/ Shale-1 - 14 day cure data:
C-25
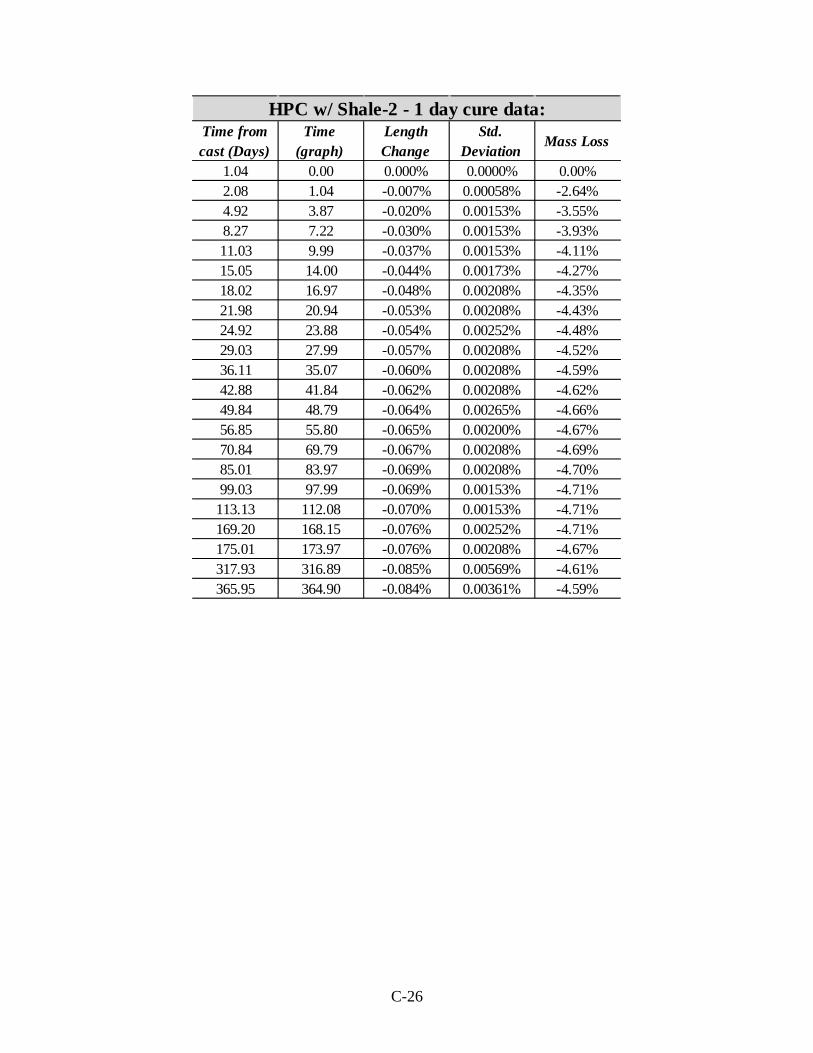
Time from cast (Days)
Time (graph)
Length Change
Std. Deviation
Mass Loss
1.04 0.00 0.000% 0.0000% 0.00%2.08 1.04 -0.007% 0.00058% -2.64%4.92 3.87 -0.020% 0.00153% -3.55%8.27 7.22 -0.030% 0.00153% -3.93%11.03 9.99 -0.037% 0.00153% -4.11%15.05 14.00 -0.044% 0.00173% -4.27%18.02 16.97 -0.048% 0.00208% -4.35%21.98 20.94 -0.053% 0.00208% -4.43%24.92 23.88 -0.054% 0.00252% -4.48%29.03 27.99 -0.057% 0.00208% -4.52%36.11 35.07 -0.060% 0.00208% -4.59%42.88 41.84 -0.062% 0.00208% -4.62%49.84 48.79 -0.064% 0.00265% -4.66%56.85 55.80 -0.065% 0.00200% -4.67%70.84 69.79 -0.067% 0.00208% -4.69%85.01 83.97 -0.069% 0.00208% -4.70%99.03 97.99 -0.069% 0.00153% -4.71%
113.13 112.08 -0.070% 0.00153% -4.71%169.20 168.15 -0.076% 0.00252% -4.71%175.01 173.97 -0.076% 0.00208% -4.67%317.93 316.89 -0.085% 0.00569% -4.61%365.95 364.90 -0.084% 0.00361% -4.59%
HPC w/ Shale-2 - 1 day cure data:
C-26
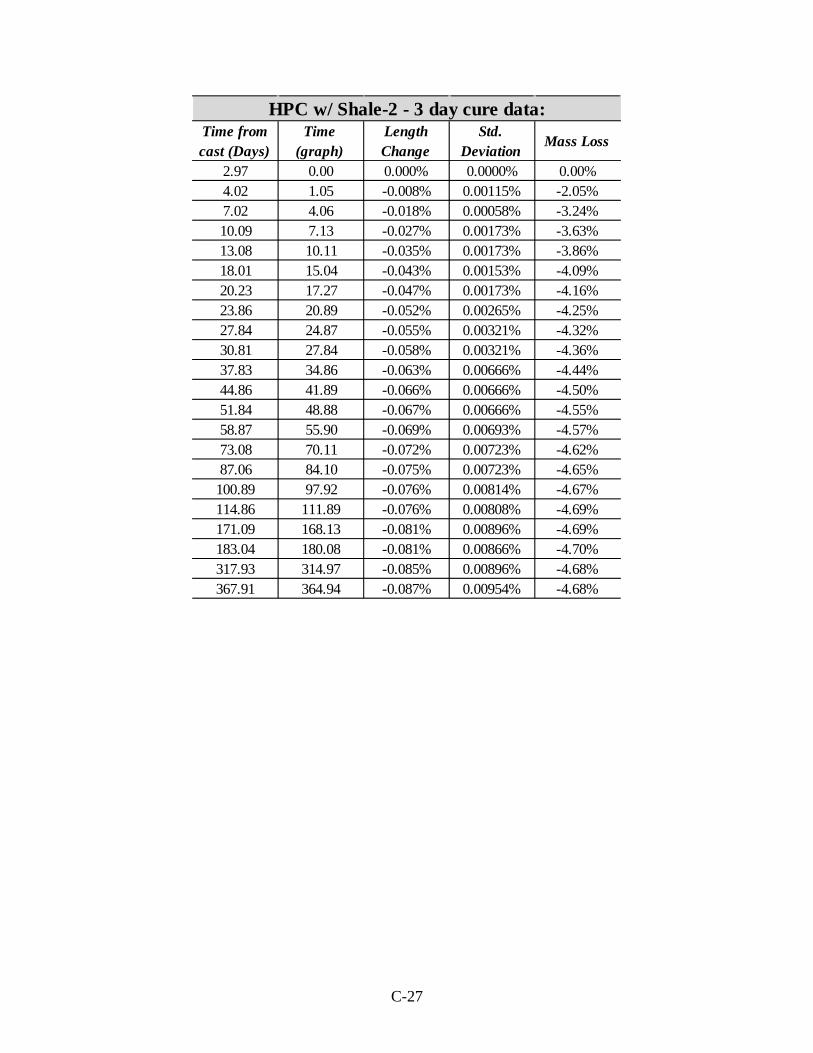
Time from cast (Days)
Time (graph)
Length Change
Std. Deviation
Mass Loss
2.97 0.00 0.000% 0.0000% 0.00%4.02 1.05 -0.008% 0.00115% -2.05%7.02 4.06 -0.018% 0.00058% -3.24%10.09 7.13 -0.027% 0.00173% -3.63%13.08 10.11 -0.035% 0.00173% -3.86%18.01 15.04 -0.043% 0.00153% -4.09%20.23 17.27 -0.047% 0.00173% -4.16%23.86 20.89 -0.052% 0.00265% -4.25%27.84 24.87 -0.055% 0.00321% -4.32%30.81 27.84 -0.058% 0.00321% -4.36%37.83 34.86 -0.063% 0.00666% -4.44%44.86 41.89 -0.066% 0.00666% -4.50%51.84 48.88 -0.067% 0.00666% -4.55%58.87 55.90 -0.069% 0.00693% -4.57%73.08 70.11 -0.072% 0.00723% -4.62%87.06 84.10 -0.075% 0.00723% -4.65%
100.89 97.92 -0.076% 0.00814% -4.67%114.86 111.89 -0.076% 0.00808% -4.69%171.09 168.13 -0.081% 0.00896% -4.69%183.04 180.08 -0.081% 0.00866% -4.70%317.93 314.97 -0.085% 0.00896% -4.68%367.91 364.94 -0.087% 0.00954% -4.68%
HPC w/ Shale-2 - 3 day cure data:
C-27
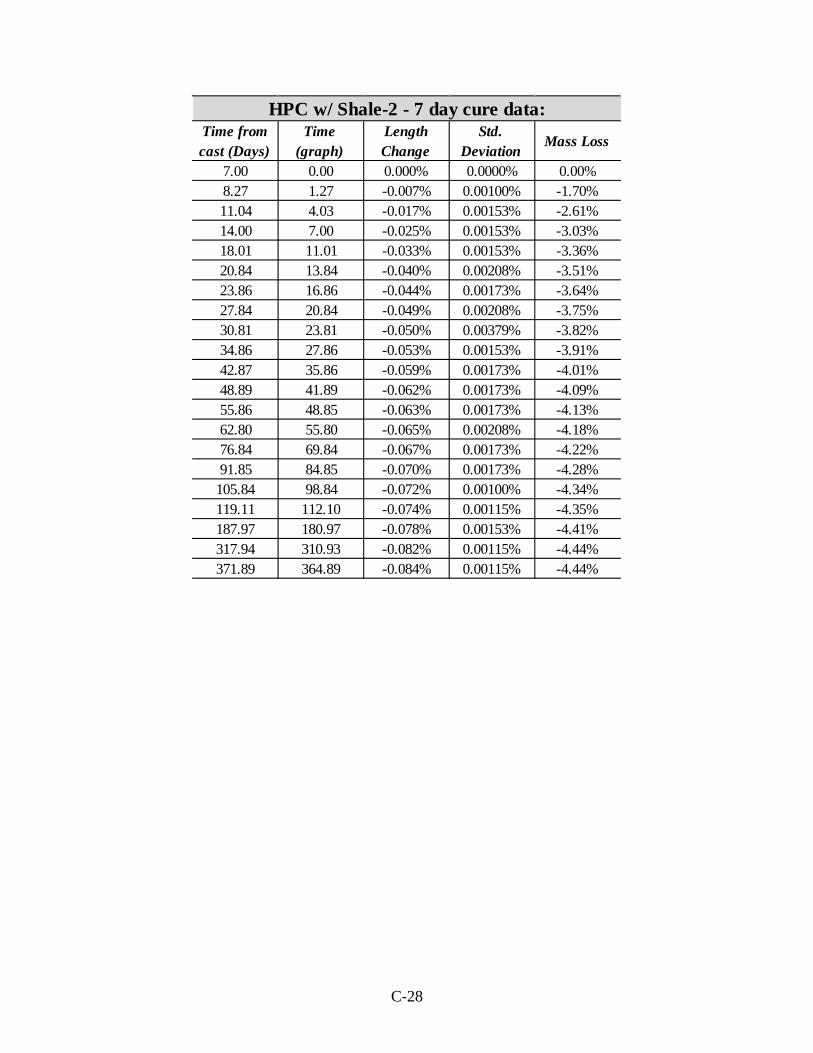
Time from cast (Days)
Time (graph)
Length Change
Std. Deviation
Mass Loss
7.00 0.00 0.000% 0.0000% 0.00%8.27 1.27 -0.007% 0.00100% -1.70%11.04 4.03 -0.017% 0.00153% -2.61%14.00 7.00 -0.025% 0.00153% -3.03%18.01 11.01 -0.033% 0.00153% -3.36%20.84 13.84 -0.040% 0.00208% -3.51%23.86 16.86 -0.044% 0.00173% -3.64%27.84 20.84 -0.049% 0.00208% -3.75%30.81 23.81 -0.050% 0.00379% -3.82%34.86 27.86 -0.053% 0.00153% -3.91%42.87 35.86 -0.059% 0.00173% -4.01%48.89 41.89 -0.062% 0.00173% -4.09%55.86 48.85 -0.063% 0.00173% -4.13%62.80 55.80 -0.065% 0.00208% -4.18%76.84 69.84 -0.067% 0.00173% -4.22%91.85 84.85 -0.070% 0.00173% -4.28%
105.84 98.84 -0.072% 0.00100% -4.34%119.11 112.10 -0.074% 0.00115% -4.35%187.97 180.97 -0.078% 0.00153% -4.41%317.94 310.93 -0.082% 0.00115% -4.44%371.89 364.89 -0.084% 0.00115% -4.44%
HPC w/ Shale-2 - 7 day cure data:
C-28

Time from cast (Days)
Time (graph)
Length Change
Std. Deviation
Mass Loss
10.02 0.00 0.000% 0.0000% 0.00%11.04 1.02 -0.006% 0.00100% -1.36%14.00 3.98 -0.017% 0.00153% -2.33%18.01 7.99 -0.027% 0.00153% -2.85%20.23 10.21 -0.033% 0.00153% -3.02%23.86 13.84 -0.042% 0.00436% -3.23%27.84 17.82 -0.046% 0.00153% -3.38%30.82 20.80 -0.048% 0.00153% -3.47%34.85 24.82 -0.053% 0.00153% -3.58%37.83 27.81 -0.054% 0.00265% -3.63%44.85 34.83 -0.059% 0.00100% -3.74%51.85 41.83 -0.061% 0.00100% -3.82%58.87 48.85 -0.063% 0.00153% -3.88%65.85 55.83 -0.065% 0.00153% -3.92%80.09 70.07 -0.069% 0.00100% -3.98%93.95 83.93 -0.072% 0.00100% -4.04%
107.84 97.82 -0.066% 0.00954% -4.10%121.83 111.81 -0.074% 0.00153% -4.13%177.96 167.94 -0.078% 0.00153% -4.19%190.06 180.03 -0.079% 0.00100% -4.21%317.94 307.92 -0.083% 0.00100% -4.25%374.90 364.88 -0.084% 0.00100% -4.25%
HPC w/ Shale-2 - 10 day cure data:
C-29
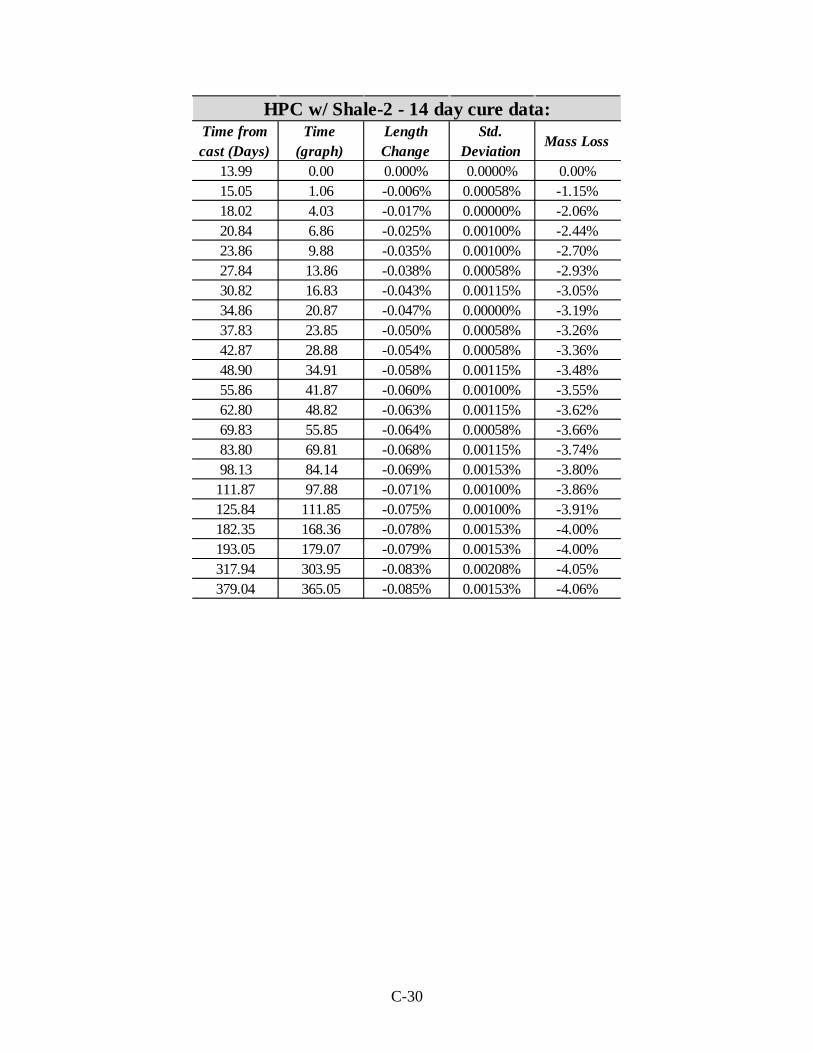
Time from cast (Days)
Time (graph)
Length Change
Std. Deviation
Mass Loss
13.99 0.00 0.000% 0.0000% 0.00%15.05 1.06 -0.006% 0.00058% -1.15%18.02 4.03 -0.017% 0.00000% -2.06%20.84 6.86 -0.025% 0.00100% -2.44%23.86 9.88 -0.035% 0.00100% -2.70%27.84 13.86 -0.038% 0.00058% -2.93%30.82 16.83 -0.043% 0.00115% -3.05%34.86 20.87 -0.047% 0.00000% -3.19%37.83 23.85 -0.050% 0.00058% -3.26%42.87 28.88 -0.054% 0.00058% -3.36%48.90 34.91 -0.058% 0.00115% -3.48%55.86 41.87 -0.060% 0.00100% -3.55%62.80 48.82 -0.063% 0.00115% -3.62%69.83 55.85 -0.064% 0.00058% -3.66%83.80 69.81 -0.068% 0.00115% -3.74%98.13 84.14 -0.069% 0.00153% -3.80%
111.87 97.88 -0.071% 0.00100% -3.86%125.84 111.85 -0.075% 0.00100% -3.91%182.35 168.36 -0.078% 0.00153% -4.00%193.05 179.07 -0.079% 0.00153% -4.00%317.94 303.95 -0.083% 0.00208% -4.05%379.04 365.05 -0.085% 0.00153% -4.06%
HPC w/ Shale-2 - 14 day cure data:
C-30
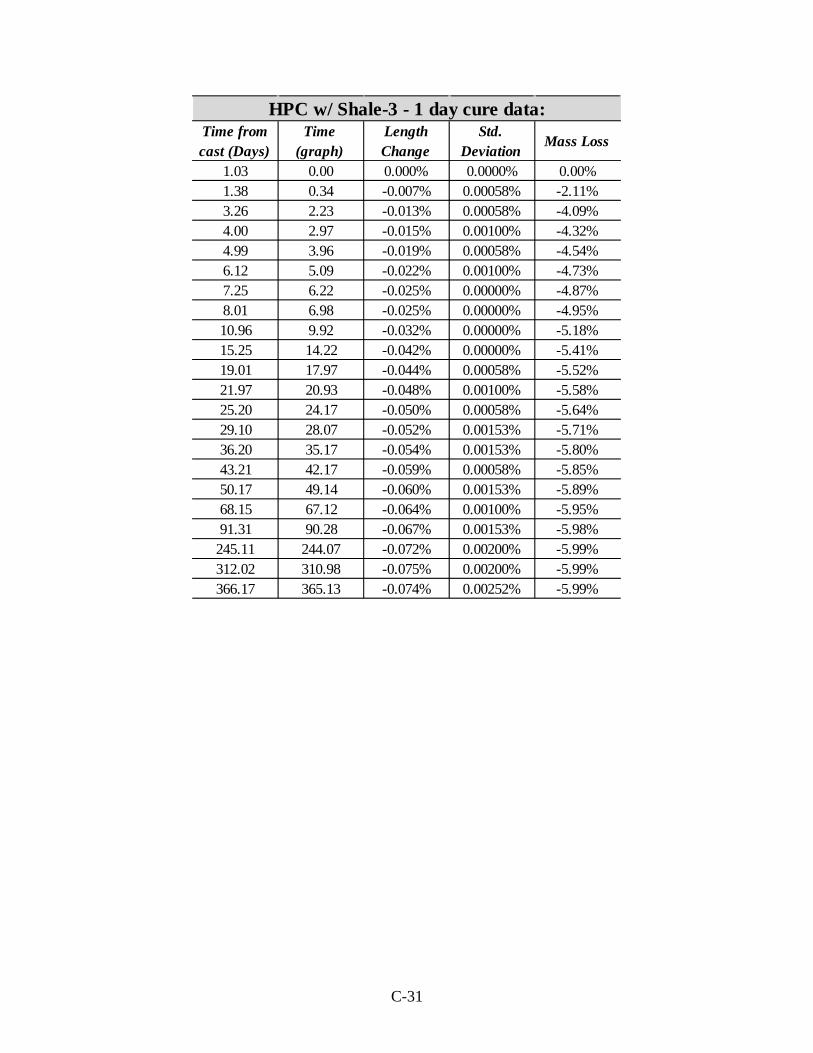
Time from cast (Days)
Time (graph)
Length Change
Std. Deviation
Mass Loss
1.03 0.00 0.000% 0.0000% 0.00%1.38 0.34 -0.007% 0.00058% -2.11%3.26 2.23 -0.013% 0.00058% -4.09%4.00 2.97 -0.015% 0.00100% -4.32%4.99 3.96 -0.019% 0.00058% -4.54%6.12 5.09 -0.022% 0.00100% -4.73%7.25 6.22 -0.025% 0.00000% -4.87%8.01 6.98 -0.025% 0.00000% -4.95%10.96 9.92 -0.032% 0.00000% -5.18%15.25 14.22 -0.042% 0.00000% -5.41%19.01 17.97 -0.044% 0.00058% -5.52%21.97 20.93 -0.048% 0.00100% -5.58%25.20 24.17 -0.050% 0.00058% -5.64%29.10 28.07 -0.052% 0.00153% -5.71%36.20 35.17 -0.054% 0.00153% -5.80%43.21 42.17 -0.059% 0.00058% -5.85%50.17 49.14 -0.060% 0.00153% -5.89%68.15 67.12 -0.064% 0.00100% -5.95%91.31 90.28 -0.067% 0.00153% -5.98%
245.11 244.07 -0.072% 0.00200% -5.99%312.02 310.98 -0.075% 0.00200% -5.99%366.17 365.13 -0.074% 0.00252% -5.99%
HPC w/ Shale-3 - 1 day cure data:
C-31
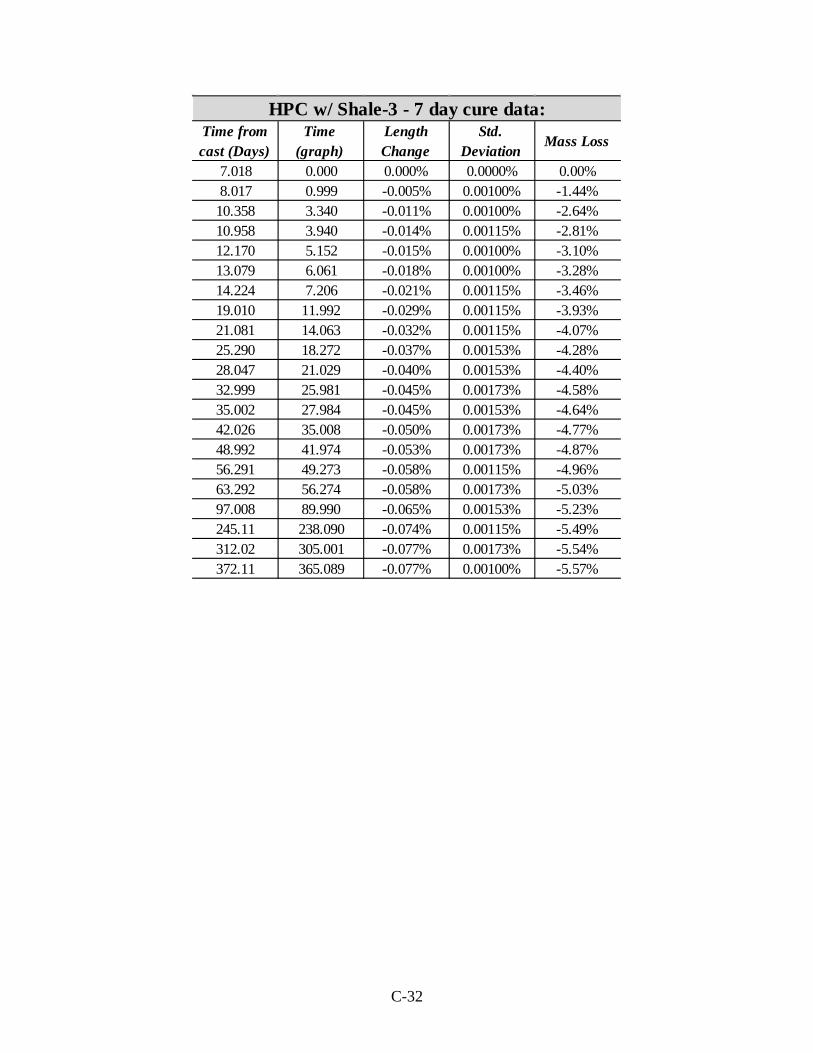
Time from cast (Days)
Time (graph)
Length Change
Std. Deviation
Mass Loss
7.018 0.000 0.000% 0.0000% 0.00%8.017 0.999 -0.005% 0.00100% -1.44%
10.358 3.340 -0.011% 0.00100% -2.64%10.958 3.940 -0.014% 0.00115% -2.81%12.170 5.152 -0.015% 0.00100% -3.10%13.079 6.061 -0.018% 0.00100% -3.28%14.224 7.206 -0.021% 0.00115% -3.46%19.010 11.992 -0.029% 0.00115% -3.93%21.081 14.063 -0.032% 0.00115% -4.07%25.290 18.272 -0.037% 0.00153% -4.28%28.047 21.029 -0.040% 0.00153% -4.40%32.999 25.981 -0.045% 0.00173% -4.58%35.002 27.984 -0.045% 0.00153% -4.64%42.026 35.008 -0.050% 0.00173% -4.77%48.992 41.974 -0.053% 0.00173% -4.87%56.291 49.273 -0.058% 0.00115% -4.96%63.292 56.274 -0.058% 0.00173% -5.03%97.008 89.990 -0.065% 0.00153% -5.23%245.11 238.090 -0.074% 0.00115% -5.49%312.02 305.001 -0.077% 0.00173% -5.54%372.11 365.089 -0.077% 0.00100% -5.57%
HPC w/ Shale-3 - 7 day cure data:
C-32
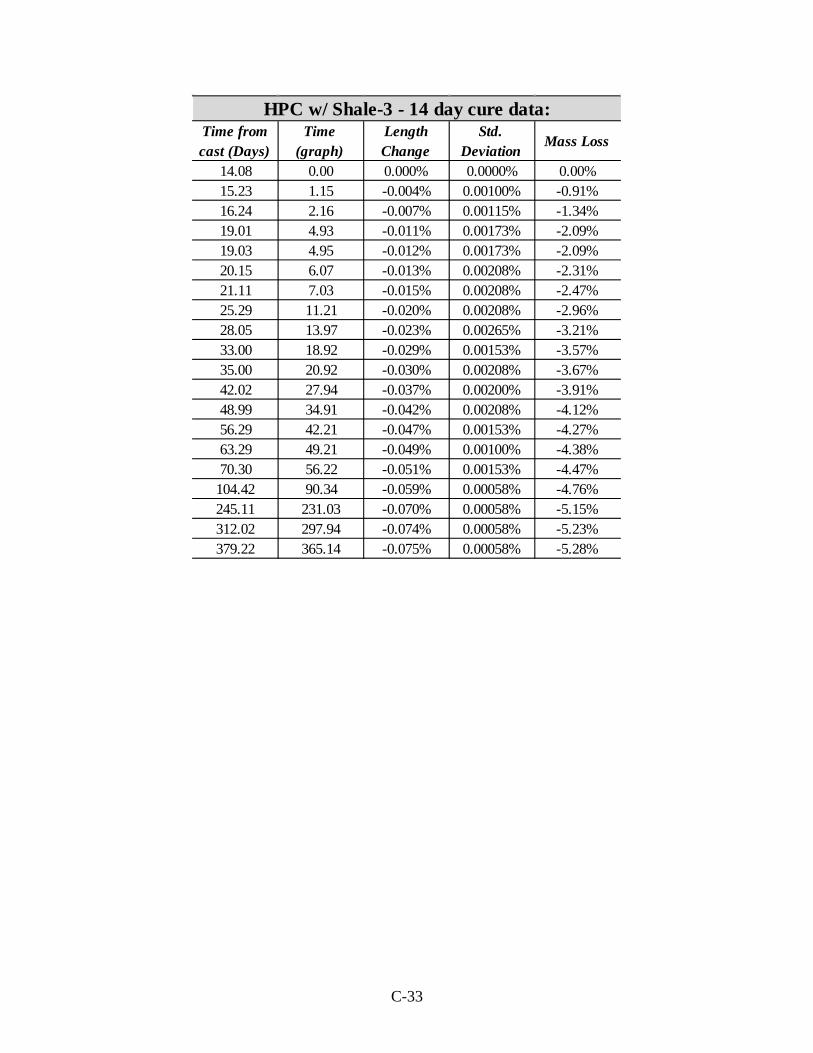
Time from cast (Days)
Time (graph)
Length Change
Std. Deviation
Mass Loss
14.08 0.00 0.000% 0.0000% 0.00%15.23 1.15 -0.004% 0.00100% -0.91%16.24 2.16 -0.007% 0.00115% -1.34%19.01 4.93 -0.011% 0.00173% -2.09%19.03 4.95 -0.012% 0.00173% -2.09%20.15 6.07 -0.013% 0.00208% -2.31%21.11 7.03 -0.015% 0.00208% -2.47%25.29 11.21 -0.020% 0.00208% -2.96%28.05 13.97 -0.023% 0.00265% -3.21%33.00 18.92 -0.029% 0.00153% -3.57%35.00 20.92 -0.030% 0.00208% -3.67%42.02 27.94 -0.037% 0.00200% -3.91%48.99 34.91 -0.042% 0.00208% -4.12%56.29 42.21 -0.047% 0.00153% -4.27%63.29 49.21 -0.049% 0.00100% -4.38%70.30 56.22 -0.051% 0.00153% -4.47%
104.42 90.34 -0.059% 0.00058% -4.76%245.11 231.03 -0.070% 0.00058% -5.15%312.02 297.94 -0.074% 0.00058% -5.23%379.22 365.14 -0.075% 0.00058% -5.28%
HPC w/ Shale-3 - 14 day cure data:
C-33
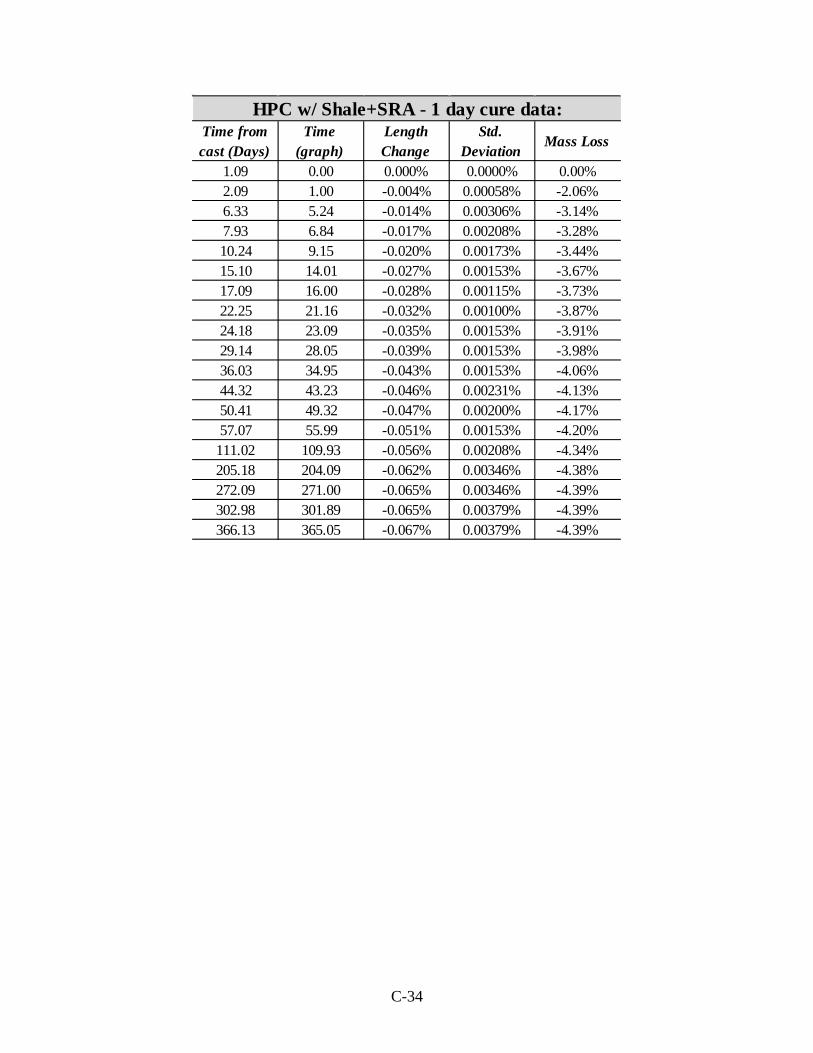
Time from cast (Days)
Time (graph)
Length Change
Std. Deviation
Mass Loss
1.09 0.00 0.000% 0.0000% 0.00%2.09 1.00 -0.004% 0.00058% -2.06%6.33 5.24 -0.014% 0.00306% -3.14%7.93 6.84 -0.017% 0.00208% -3.28%10.24 9.15 -0.020% 0.00173% -3.44%15.10 14.01 -0.027% 0.00153% -3.67%17.09 16.00 -0.028% 0.00115% -3.73%22.25 21.16 -0.032% 0.00100% -3.87%24.18 23.09 -0.035% 0.00153% -3.91%29.14 28.05 -0.039% 0.00153% -3.98%36.03 34.95 -0.043% 0.00153% -4.06%44.32 43.23 -0.046% 0.00231% -4.13%50.41 49.32 -0.047% 0.00200% -4.17%57.07 55.99 -0.051% 0.00153% -4.20%
111.02 109.93 -0.056% 0.00208% -4.34%205.18 204.09 -0.062% 0.00346% -4.38%272.09 271.00 -0.065% 0.00346% -4.39%302.98 301.89 -0.065% 0.00379% -4.39%366.13 365.05 -0.067% 0.00379% -4.39%
HPC w/ Shale+SRA - 1 day cure data:
C-34
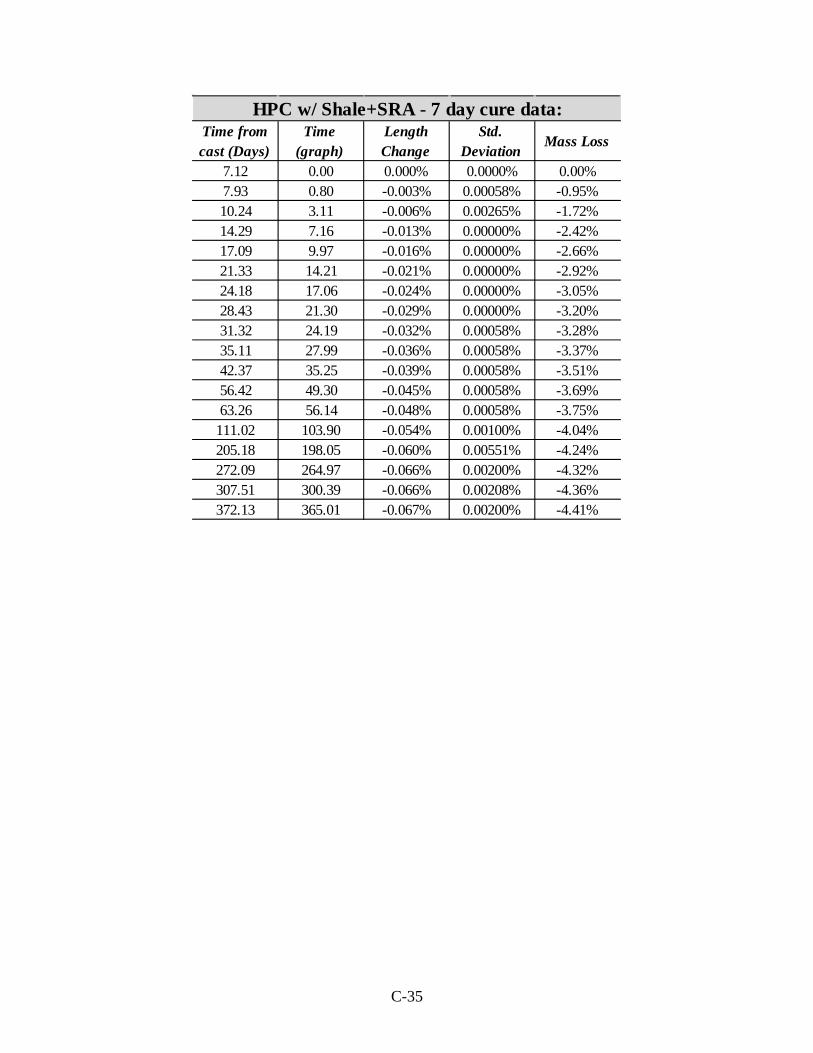
Time from cast (Days)
Time (graph)
Length Change
Std. Deviation
Mass Loss
7.12 0.00 0.000% 0.0000% 0.00%7.93 0.80 -0.003% 0.00058% -0.95%10.24 3.11 -0.006% 0.00265% -1.72%14.29 7.16 -0.013% 0.00000% -2.42%17.09 9.97 -0.016% 0.00000% -2.66%21.33 14.21 -0.021% 0.00000% -2.92%24.18 17.06 -0.024% 0.00000% -3.05%28.43 21.30 -0.029% 0.00000% -3.20%31.32 24.19 -0.032% 0.00058% -3.28%35.11 27.99 -0.036% 0.00058% -3.37%42.37 35.25 -0.039% 0.00058% -3.51%56.42 49.30 -0.045% 0.00058% -3.69%63.26 56.14 -0.048% 0.00058% -3.75%
111.02 103.90 -0.054% 0.00100% -4.04%205.18 198.05 -0.060% 0.00551% -4.24%272.09 264.97 -0.066% 0.00200% -4.32%307.51 300.39 -0.066% 0.00208% -4.36%372.13 365.01 -0.067% 0.00200% -4.41%
HPC w/ Shale+SRA - 7 day cure data:
C-35
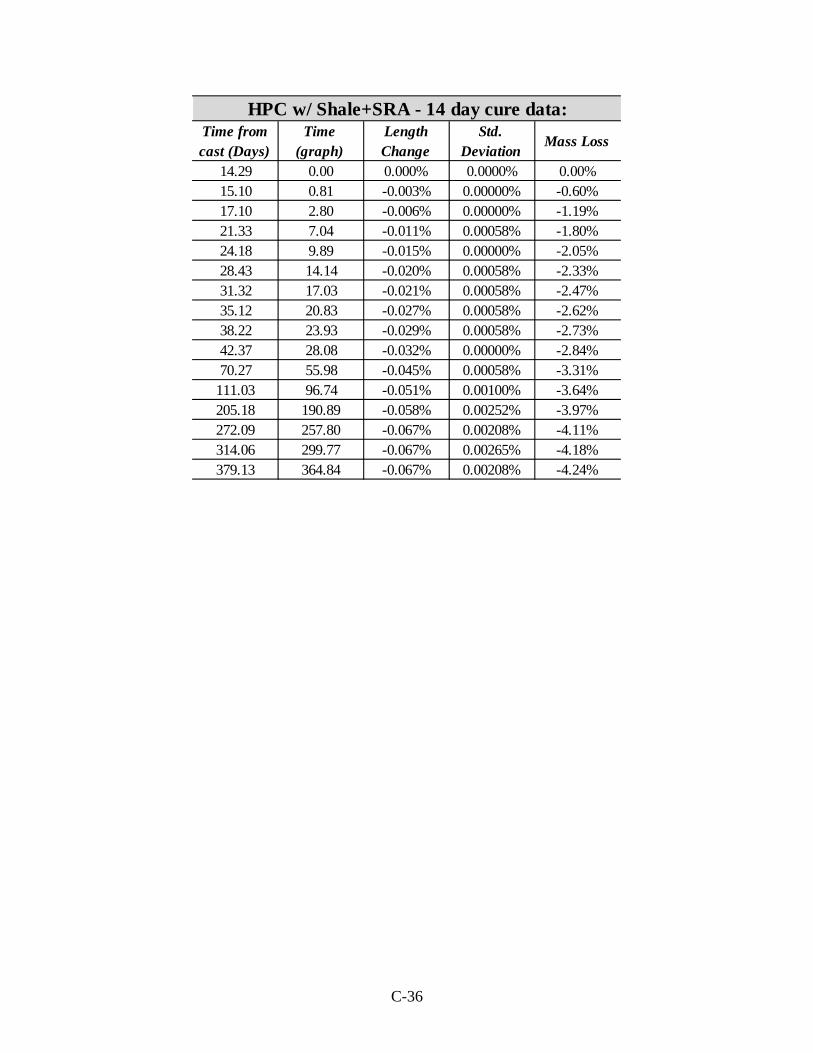
Time from cast (Days)
Time (graph)
Length Change
Std. Deviation
Mass Loss
14.29 0.00 0.000% 0.0000% 0.00%15.10 0.81 -0.003% 0.00000% -0.60%17.10 2.80 -0.006% 0.00000% -1.19%21.33 7.04 -0.011% 0.00058% -1.80%24.18 9.89 -0.015% 0.00000% -2.05%28.43 14.14 -0.020% 0.00058% -2.33%31.32 17.03 -0.021% 0.00058% -2.47%35.12 20.83 -0.027% 0.00058% -2.62%38.22 23.93 -0.029% 0.00058% -2.73%42.37 28.08 -0.032% 0.00000% -2.84%70.27 55.98 -0.045% 0.00058% -3.31%
111.03 96.74 -0.051% 0.00100% -3.64%205.18 190.89 -0.058% 0.00252% -3.97%272.09 257.80 -0.067% 0.00208% -4.11%314.06 299.77 -0.067% 0.00265% -4.18%379.13 364.84 -0.067% 0.00208% -4.24%
HPC w/ Shale+SRA - 14 day cure data:
C-36