internal combustion industrial forklift trucks from japan · internal combustion industrial...
TRANSCRIPT

Internal Combustion Industrial ForkliftTrucks From Japan
Investigation No. 731-TA-377 (Second Review)
Publication 3831 December 2005
U.S. International Trade Commission
Robert A. RogowskyDirector of Operations
COMMISSIONERS
Address all communications toSecretary to the Commission
United States International Trade CommissionWashington, DC 20436
Staff assigned
Cynthia Trainor, InvestigatorKatherine Linton, Industry AnalystLinda White, Industry AnalystGerald Benedick, EconomistChand Mehta, AccountantDavid Goldfine, AttorneyLemuel Shields, Statistician
Douglas Corkran, Supervisory Investigator
Jennifer A. HillmanDeanna Tanner Okun, Vice Chairman
Stephen Koplan, Chairman
Charlotte R. Lane
Daniel R. PearsonShara L. Aranoff

U.S. International Trade CommissionWashington, DC 20436
December 2005
www.usitc.gov
Publication 3831
Internal Combustion Industrial ForkliftTrucks From Japan
Investigation No. 731-TA-377 (Second Review)

U.S. International Trade Commission
Internal Combustion IndustrialForklift Trucks from Japan
Investigation No. 731-TA-377 (Second Review)
Publication 3831 December 2005
Washington, DC 20436

U.S. International Trade Commission
COMMISSIONERS
Stephen Koplan, ChairmanDeanna Tanner Okun, Vice Chairman
Jennifer A. HillmanCharlotte R. LaneDaniel R. PearsonShara L. Aranoff
Robert A. RogowskyDirector of Operations
Staff assigned
Cynthia Trainor, InvestigatorKatherine Linton, Industry Analyst
Linda White, Industry AnalystGerald Benedick, Economist
Chand Mehta, AccountantDavid Goldfine, Attorney
Lemuel Shields, Statistician
Douglas Corkran, Supervisory Investigator
Address all communications toSecretary to the Commission
United States International Trade CommissionWashington, DC 20436

U.S. International Trade CommissionWashington, DC 20436
www.usitc.gov
Internal Combustion IndustrialForklift Trucks from Japan
Investigations No. 731-TA-377 (Second Review)
Publication 3831 December 2005


i
CONTENTS
Page
Determination . . . . . . . . . . . . . . . . . . . . . . . . . . . . . . . . . . . . . . . . . . . . . . . . . . . . . . . . . . . . . . . . . . 1Views of the Commission . . . . . . . . . . . . . . . . . . . . . . . . . . . . . . . . . . . . . . . . . . . . . . . . . . . . . . . . . 3Part I: Introduction and overview . . . . . . . . . . . . . . . . . . . . . . . . . . . . . . . . . . . . . . . . . . . . . . . . . I-1
Background . . . . . . . . . . . . . . . . . . . . . . . . . . . . . . . . . . . . . . . . . . . . . . . . . . . . . . . . . . . . . . . . . . I-1The original investigation . . . . . . . . . . . . . . . . . . . . . . . . . . . . . . . . . . . . . . . . . . . . . . . . . . . . . . . I-1The first five-year review . . . . . . . . . . . . . . . . . . . . . . . . . . . . . . . . . . . . . . . . . . . . . . . . . . . . . . . I-2Summary data . . . . . . . . . . . . . . . . . . . . . . . . . . . . . . . . . . . . . . . . . . . . . . . . . . . . . . . . . . . . . . . . I-3Statutory criteria and organization of the report . . . . . . . . . . . . . . . . . . . . . . . . . . . . . . . . . . . . . . I-6Administrative reviews . . . . . . . . . . . . . . . . . . . . . . . . . . . . . . . . . . . . . . . . . . . . . . . . . . . . . . . . . I-7Commerce’s results of expedited review . . . . . . . . . . . . . . . . . . . . . . . . . . . . . . . . . . . . . . . . . . . I-8Continued Dumping and Subsidy Offset Act . . . . . . . . . . . . . . . . . . . . . . . . . . . . . . . . . . . . . . . . I-9The subject merchandise . . . . . . . . . . . . . . . . . . . . . . . . . . . . . . . . . . . . . . . . . . . . . . . . . . . . . . . I-10
Commerce’s scope . . . . . . . . . . . . . . . . . . . . . . . . . . . . . . . . . . . . . . . . . . . . . . . . . . . . . . . . . . I-10U.S. tariff treatment . . . . . . . . . . . . . . . . . . . . . . . . . . . . . . . . . . . . . . . . . . . . . . . . . . . . . . . . . I-11Definition of production in the original investigation . . . . . . . . . . . . . . . . . . . . . . . . . . . . . . . I-12Definition of production in the initial and second reviews . . . . . . . . . . . . . . . . . . . . . . . . . . . I-13Manufacturing processes . . . . . . . . . . . . . . . . . . . . . . . . . . . . . . . . . . . . . . . . . . . . . . . . . . . . . I-15
Domestic like product issues . . . . . . . . . . . . . . . . . . . . . . . . . . . . . . . . . . . . . . . . . . . . . . . . . . . . I-17ICI forklift trucks with lifting capacities over 15,000 pounds . . . . . . . . . . . . . . . . . . . . . . . . . I-18Electric powered industrial forklift trucks . . . . . . . . . . . . . . . . . . . . . . . . . . . . . . . . . . . . . . . . I-18
U.S. market participants . . . . . . . . . . . . . . . . . . . . . . . . . . . . . . . . . . . . . . . . . . . . . . . . . . . . . . . . I-21U.S. producers . . . . . . . . . . . . . . . . . . . . . . . . . . . . . . . . . . . . . . . . . . . . . . . . . . . . . . . . . . . . . I-21U.S. importers . . . . . . . . . . . . . . . . . . . . . . . . . . . . . . . . . . . . . . . . . . . . . . . . . . . . . . . . . . . . . I-28U.S. purchasers . . . . . . . . . . . . . . . . . . . . . . . . . . . . . . . . . . . . . . . . . . . . . . . . . . . . . . . . . . . . I-28
Apparent U.S. consumption and market shares . . . . . . . . . . . . . . . . . . . . . . . . . . . . . . . . . . . . . . I-29Part II: Conditions of competition in the U.S. market . . . . . . . . . . . . . . . . . . . . . . . . . . . . . . . . II-1
Channels of distribution and market characteristics . . . . . . . . . . . . . . . . . . . . . . . . . . . . . . . . . . . II-1Supply and demand considerations . . . . . . . . . . . . . . . . . . . . . . . . . . . . . . . . . . . . . . . . . . . . . . . . II-3
U.S. supply . . . . . . . . . . . . . . . . . . . . . . . . . . . . . . . . . . . . . . . . . . . . . . . . . . . . . . . . . . . . . . . II-3U.S. demand . . . . . . . . . . . . . . . . . . . . . . . . . . . . . . . . . . . . . . . . . . . . . . . . . . . . . . . . . . . . . . II-9Substitute products . . . . . . . . . . . . . . . . . . . . . . . . . . . . . . . . . . . . . . . . . . . . . . . . . . . . . . . . . II-10Cost share . . . . . . . . . . . . . . . . . . . . . . . . . . . . . . . . . . . . . . . . . . . . . . . . . . . . . . . . . . . . . . . . II-14Foreign demand . . . . . . . . . . . . . . . . . . . . . . . . . . . . . . . . . . . . . . . . . . . . . . . . . . . . . . . . . . . . II-14
Substitutability issues . . . . . . . . . . . . . . . . . . . . . . . . . . . . . . . . . . . . . . . . . . . . . . . . . . . . . . . . . . II-16Factors affecting purchases . . . . . . . . . . . . . . . . . . . . . . . . . . . . . . . . . . . . . . . . . . . . . . . . . . . II-17Comparisons of the U.S.-produced and imported ICI forklift trucks . . . . . . . . . . . . . . . . . . . II-18
Elasticity estimates . . . . . . . . . . . . . . . . . . . . . . . . . . . . . . . . . . . . . . . . . . . . . . . . . . . . . . . . . . . . II-23U.S. supply elasticity . . . . . . . . . . . . . . . . . . . . . . . . . . . . . . . . . . . . . . . . . . . . . . . . . . . . . . . . II-23U.S. demand elasticity . . . . . . . . . . . . . . . . . . . . . . . . . . . . . . . . . . . . . . . . . . . . . . . . . . . . . . . II-23Substitution elasticity . . . . . . . . . . . . . . . . . . . . . . . . . . . . . . . . . . . . . . . . . . . . . . . . . . . . . . . II-23
Part III: Condition of the U.S. industry . . . . . . . . . . . . . . . . . . . . . . . . . . . . . . . . . . . . . . . . . . . . III-1U.S. producers’ capacity, production, and capacity utilization . . . . . . . . . . . . . . . . . . . . . . . . . . III-1U.S. producers’ domestic shipments, company transfers, and export shipments . . . . . . . . . . . . . III-3U.S. producers’ inventories . . . . . . . . . . . . . . . . . . . . . . . . . . . . . . . . . . . . . . . . . . . . . . . . . . . . . III-6U.S. producers’ purchases . . . . . . . . . . . . . . . . . . . . . . . . . . . . . . . . . . . . . . . . . . . . . . . . . . . . . . III-6U.S. producers’ imports . . . . . . . . . . . . . . . . . . . . . . . . . . . . . . . . . . . . . . . . . . . . . . . . . . . . . . . . III-6U.S. producers’ employment, wages, and productivity . . . . . . . . . . . . . . . . . . . . . . . . . . . . . . . . III-7
ii
CONTENTS
Page
Part III: Condition of the U.S. industry – ContinuedFinancial condition of the U.S. industry . . . . . . . . . . . . . . . . . . . . . . . . . . . . . . . . . . . . . . . . . . . . III-8
Background . . . . . . . . . . . . . . . . . . . . . . . . . . . . . . . . . . . . . . . . . . . . . . . . . . . . . . . . . . . . . . . III-8Operations on ICI forklift trucks . . . . . . . . . . . . . . . . . . . . . . . . . . . . . . . . . . . . . . . . . . . . . . . III-8Investment in capital expenditures and research and development expenses . . . . . . . . . . . . . III-15Assets and return on investment . . . . . . . . . . . . . . . . . . . . . . . . . . . . . . . . . . . . . . . . . . . . . . . III-16
Part IV: U.S. imports and the foreign industry . . . . . . . . . . . . . . . . . . . . . . . . . . . . . . . . . . . . . . IV-1U.S. imports . . . . . . . . . . . . . . . . . . . . . . . . . . . . . . . . . . . . . . . . . . . . . . . . . . . . . . . . . . . . . . . . . IV-1U.S. importers’ inventories . . . . . . . . . . . . . . . . . . . . . . . . . . . . . . . . . . . . . . . . . . . . . . . . . . . . . . IV-3Subject country producers . . . . . . . . . . . . . . . . . . . . . . . . . . . . . . . . . . . . . . . . . . . . . . . . . . . . . . IV-3
Sumitomo NACCO . . . . . . . . . . . . . . . . . . . . . . . . . . . . . . . . . . . . . . . . . . . . . . . . . . . . . . . . . IV-4Komatsu Japan . . . . . . . . . . . . . . . . . . . . . . . . . . . . . . . . . . . . . . . . . . . . . . . . . . . . . . . . . . . . . IV-4Toyota Japan . . . . . . . . . . . . . . . . . . . . . . . . . . . . . . . . . . . . . . . . . . . . . . . . . . . . . . . . . . . . . . IV-5Mitsubishi Japan . . . . . . . . . . . . . . . . . . . . . . . . . . . . . . . . . . . . . . . . . . . . . . . . . . . . . . . . . . . IV-5Nissan Japan . . . . . . . . . . . . . . . . . . . . . . . . . . . . . . . . . . . . . . . . . . . . . . . . . . . . . . . . . . . . . . IV-6TCM Japan . . . . . . . . . . . . . . . . . . . . . . . . . . . . . . . . . . . . . . . . . . . . . . . . . . . . . . . . . . . . . . . IV-6
Subject country capacity, production, capacity utilization, domestic shipments, export shipments, and inventories . . . . . . . . . . . . . . . . . . . . . . . . . . . . . . . . . . . . . . . . . . . . . . . . . . . IV-7
The global market . . . . . . . . . . . . . . . . . . . . . . . . . . . . . . . . . . . . . . . . . . . . . . . . . . . . . . . . . . . . . IV-7The Japanese market . . . . . . . . . . . . . . . . . . . . . . . . . . . . . . . . . . . . . . . . . . . . . . . . . . . . . . . . IV-7Global demand . . . . . . . . . . . . . . . . . . . . . . . . . . . . . . . . . . . . . . . . . . . . . . . . . . . . . . . . . . . . . IV-10
Part V: Pricing and related information . . . . . . . . . . . . . . . . . . . . . . . . . . . . . . . . . . . . . . . . . . . . V-1Factors affecting pricing . . . . . . . . . . . . . . . . . . . . . . . . . . . . . . . . . . . . . . . . . . . . . . . . . . . . . . . . V-1
Raw material costs . . . . . . . . . . . . . . . . . . . . . . . . . . . . . . . . . . . . . . . . . . . . . . . . . . . . . . . . . . V-1Tariff rates and transportation costs to the U.S. market . . . . . . . . . . . . . . . . . . . . . . . . . . . . . V-2U.S. inland transportation costs . . . . . . . . . . . . . . . . . . . . . . . . . . . . . . . . . . . . . . . . . . . . . . . . V-3Internet reverse auctions (IRAs) . . . . . . . . . . . . . . . . . . . . . . . . . . . . . . . . . . . . . . . . . . . . . . . V-3Exchange rates . . . . . . . . . . . . . . . . . . . . . . . . . . . . . . . . . . . . . . . . . . . . . . . . . . . . . . . . . . . . . V-4
Pricing practices . . . . . . . . . . . . . . . . . . . . . . . . . . . . . . . . . . . . . . . . . . . . . . . . . . . . . . . . . . . . . . V-5Financial support programs . . . . . . . . . . . . . . . . . . . . . . . . . . . . . . . . . . . . . . . . . . . . . . . . . . . V-5Other pricing practices . . . . . . . . . . . . . . . . . . . . . . . . . . . . . . . . . . . . . . . . . . . . . . . . . . . . . . . V-6
Price data . . . . . . . . . . . . . . . . . . . . . . . . . . . . . . . . . . . . . . . . . . . . . . . . . . . . . . . . . . . . . . . . . . . V-8Questionnaire price data . . . . . . . . . . . . . . . . . . . . . . . . . . . . . . . . . . . . . . . . . . . . . . . . . . . . . V-8Price trends . . . . . . . . . . . . . . . . . . . . . . . . . . . . . . . . . . . . . . . . . . . . . . . . . . . . . . . . . . . . . . . V-12
Appendixes
A. Federal Register notices and the Commission’s statement on adequacy . . . . . . . . . . . . . . . . . . A-1B. Calendar of the public hearing . . . . . . . . . . . . . . . . . . . . . . . . . . . . . . . . . . . . . . . . . . . . . . . . . . B-1C. Summary data . . . . . . . . . . . . . . . . . . . . . . . . . . . . . . . . . . . . . . . . . . . . . . . . . . . . . . . . . . . . . . . C-1D. U.S. producers’, U.S. importers’, U.S. purchasers’, and foreign producers’ comments
regarding the effects of the order and the likely effects of revocation . . . . . . . . . . . . . . . . . D-1E. Domestic value added for producers’ largest volume sales model of ICI forklift trucks . . . . . . E-1F. Net U.S. F.O.B. selling prices reported by individual U.S. producers of ICI forklift trucks . . . F-1
Note.–Information that would reveal confidential operations of individual concerns may not bepublished and therefore has been deleted from this report. Such deletions are indicated by asterisks.
1 The record is defined in sec. 207.2(f) of the Commission’s Rules of Practice and Procedure (19 CFR § 207.2(f)).
UNITED STATES INTERNATIONAL TRADE COMMISSION
Investigation No. 731-TA-377 (Second Review)
INTERNAL COMBUSTION INDUSTRIAL FORKLIFT TRUCKS FROM JAPAN
DETERMINATION
On the basis of the record1 developed in the subject five-year review, the United StatesInternational Trade Commission (Commission) determines, pursuant to section 751(c) of the Tariff Act of1930 (19 U.S.C. § 1675(c)) (the Act), that revocation of the antidumping duty order on internalcombustion industrial forklift trucks from Japan would not be likely to lead to continuation or recurrenceof material injury to an industry in the United States within a reasonably foreseeable time.
BACKGROUND
The Commission instituted this review on March 1, 2005 (70 F.R. 9971) and determined on June 6, 2005 that it would conduct a full review (70 F.R. 36657, June 24, 2005). Notice of the schedulingof the Commission’s review and of a public hearing to be held in connection therewith was given byposting copies of the notice in the Office of the Secretary, U.S. International Trade Commission,Washington, DC, and by publishing the notice in the Federal Register on July 7, 2005 (70 F.R. 39333). The hearing was held in Washington, DC, on November 1, 2005, and all persons who requested theopportunity were permitted to appear in person or by counsel.

1 In the first review, the Commission excluded the U.S. subsidiaries of Japanese producers from the domesticindustry as related parties. The Commission further made an affirmative determination of likely material injury tothe domestic industry consisting of the three domestic producers that were not owned by Japanese companies. ViceChairman Okun dissented with respect to the findings on related parties and likely material injury.
3
VIEWS OF THE COMMISSION
Based on the record in this five-year review, we determine under section 751(c) of the Tariff Actof 1930, as amended (“the Act”), that revocation of the antidumping duty order on internal combustionindustrial forklift trucks from Japan is not likely to lead to continuation or recurrence of material injury toan industry in the United States within a reasonably foreseeable time.
I. SUMMARY
The Commission’s determination in the original investigation in 1988 focused on the evidencethat the domestic industry had been materially injured by reason of the significant and increasing volumeof forklift trucks from Japan, the high import penetration throughout the period of investigation, theconsistent pattern of price undercutting by those imports, and the continuing and increasing operatinglosses of the domestic industry.
Substantial changes in the U.S. market and industry have taken place since the issuance of theantidumping duty order in June 1988. By 1990, all of the Japanese producers had shifted from exportingsubject product to the United States to serving the U.S. market through U.S. production from subsidiariesor joint ventures that they had obtained or established in the United States. Since the first review in1998,1 Japanese-owned production subsidiaries have made over *** in capital expenditures in their U.S.operations. The Japanese-owned firms accounted for an overwhelming share of domestic production offorklift trucks in 2004.
We consider all six domestic producers – Komatsu, Mitsubishi, NACCO, Nissan, TCM, andToyota – to be part of the domestic industry and do not exclude any producers as related parties. Theproductive capacity of the domestic industry more than tripled between 1987 and 2004. Domesticproduction in 2004 was nearly *** times greater than that of 1987. Subject imports from Japan now arevirtually non-existent.
We find that revoking the order will not result in a significant volume of subject imports fromJapan. We summarize here several of the main reasons for this conclusion. First, there have beenvirtually no imports of subject forklifts since 1997. Second, the U.S. market is served primarily by thelongstanding and substantial U.S. production facilities owned by Japanese producers. Whereas only oneJapanese company had established U.S. production facilities at the time of the original investigation, noweach Japanese producer has a counterpart in the United States. The financial commitment and combinedlevels of production by these Japanese-affiliated producers in the United States has grown substantially. Thus, just as NACCO and NACCO-Sumitomo do not encroach on one another’s territories, the otherJapanese producers and their U.S. subsidiaries also are likely to do the same. Third, while the industry inJapan is large, it now has limited excess production capacity. Fourth, while Japanese producers areexport oriented, they have a number of longstanding and viable export markets outside the United Statesincluding Australia, Europe, Asia, and Africa, with global demand projected to rise. There are no knownbarriers to exports of forklift trucks from Japan in any of these regions. Thus, Japanese producers have alimited ability or incentive to increase exports to the United States simply by increasing production orshifting exports.
We find it unlikely that revocation of the order will prompt any of the Japanese producers toshutter their U.S. operations and replace that production with imports from Japan. Several of theJapanese producers lack unused capacity in Japan sufficient to make up for the closure of their U.S.

4
counterparts. All of these producers have demonstrated their intent to remain in the U.S. market throughsubstantial and continuing investment. The potential duty savings from importing completed forklifttrucks from Japan instead of importing components from Japan and completing the trucks in the UnitedStates do not appear sufficient to lead to a closure of U.S. facilities in favor of importing trucks fromJapan. While the duty on finished trucks is zero percent, the duties on major components currentlyimported by the U.S. subsidiaries to make finished forklift trucks in the United States are either zero or atmodest levels. Finally, to a significant degree, the Japanese producers, like U.S. producer NACCO, haveadopted the corporate strategy of locating production facilities for forklift trucks in regions throughout theworld to supply their host country and nearby markets.
Similarly, we do not find it likely that the larger affiliated producers such as Toyota andMitsubishi would rationalize production between their U.S. and Japanese production facilities to such anextent as to produce a significant net shift in the volumes of forklift trucks produced in the United Statesversus Japan. These firms have made continuing and significant investment in U.S. facilities and haveindicated that revocation of the order would not significantly affect the nature of their substantial U.S.operations.
Given the dominant presence of producers in the U.S. market that are affiliated with Japanesemanufacturers, we find it unlikely that, absent the order, any resulting Japanese subject imports would besold at prices likely to have significant adverse effects on these domestic producers. In light of thesubstantial market share of their U.S. affiliates and their minimal excess capacity in Japan, there is noincentive for Japanese producers to engage in aggressive pricing practices with regard to exports to theU.S. market if the order is revoked.
In the absence of significant volume or price effects by subject imports, we find that revocation ofthe order will not have a significant negative impact on the domestic industry. While the data on therecent performance of the domestic industry are somewhat mixed, overall we do not find that these datashow the industry to be in a weakened condition.
Finally, we note that in this review we have altered our definition of the domestic like productfrom the definition adopted by the Commission in the original investigation and first review. In theoriginal investigation the Commission defined the like product to include only trucks of the specified typeand size (i.e., operator-riding internal combustion industrial forklift trucks with a weight-lift capacitybetween 2,000 and 15,000 pounds) that contained a frame made in the United States. In the first review,in the absence of any issue raised concerning the domestic like product, we again included this U.S.-frame limitation. In the current review, as urged by NACCO, we have defined the domestic like productwithout limitation as to the origin of the frame. As described below, frame production has become a lesssignificant part of the overall production of forklift trucks. The practical effect of this shift is that we willnot exclude from our consideration the forklift truck production that incorporates imported frames ofNACCO and one other domestic producer.

2 Internal Combustion Engine Forklift Trucks from Japan, Inv. No. 731-TA-377 (Final), USITC Pub. 2082 (June1988). 3 53 Fed. Reg. 20882 (June 7, 1988). 4 64 Fed. Reg. 15786 (April 1, 1999). 5 Internal Combustion Industrial Forklift Trucks from Japan, Inv. No. 731-TA-377 (Review), USITC Pub. 3287(April 2000) (Chairman Bragg and Commissioners Askey and Okun dissenting). The statute deems a tie-vote to bean affirmative determination. See 19 U.S.C. §1677(11) (including determinations under §1675). 6 70 Fed. Reg. 9971 (March 1, 2005). 7 Vice Chairman Okun determined that the domestic interested party group response was inadequate. In the firstfive-year review, Vice Chairman Okun defined the domestic industry to include more firms than the Commissionmajority because she determined that appropriate circumstances did not exist to exclude any firm producing thedomestic like product from the domestic industry as a related party. See USITC Pub. 3287 at 23-24. Based onNACCO’s share of U.S. production of the domestic like product during the first review and estimated share of thelarger industry during the adequacy phase of this review, Vice Chairman Okun determined that NACCO’s responsein this second review did not constitute an adequate domestic industry party group response. Vice Chairman Okun,however, voted to conduct a full review for the aforementioned reasons.
5
II. BACKGROUND
In May 1988, the Commission determined that an industry in the United States was beingmaterially injured by reason of imports of internal combustion industrial forklift trucks from Japan thatwere being sold at less than fair value.2 On June 7, 1988, Commerce issued an antidumping duty order onimports of internal combustion industrial forklift trucks from Japan.3
On April 1, 1999, the Commission instituted its first five-year review pursuant to section 751(c)of the Act in order to determine whether revocation of the antidumping duty order on internal combustionindustrial forklift trucks would likely lead to continuation or recurrence of material injury.4 In a three-to-three vote, the Commission determined that revocation of the subject order was likely to lead tocontinuation or recurrence of material injury.5
The Commission instituted this second five-year review on March 1, 2005.6 The Commissionreceived one substantive response to the notice of institution, filed by domestic producer NACCOMaterials Handling Group, Inc. (“NACCO”). The Commission determined that NACCO’s response wasindividually adequate. Based upon NACCO’s representation that it accounted for a substantialpercentage of U.S. production of the domestic like product, the Commission determined that NACCO’sresponse constituted an adequate domestic interested party group response. Because it did not receiveany response to the notice of institution from any Japanese respondent interested party, the Commissiondetermined that the Japanese respondent interested party group response was inadequate. TheCommission, however, determined that circumstances, including possible changes in the domesticindustry’s production levels since the first review and the involvement of U.S. subsidiaries or jointventures of Japanese producers in the production of the domestic like product, warranted conducting afull review.7
All of the domestic producers of the like product and three out of six Japanese producers of thesubject merchandise responded to the Commission’s questionnaires; only domestic producer NACCOfiled briefs and provided testimony at the Commission’s hearing.
8 19 U.S.C. § 1677(4)(A). 9 19 U.S.C. § 1677(10). See Nippon Steel Corp. v. United States, 19 CIT 450, 455 (1995); Timken Co. v. UnitedStates, 913 F. Supp. 580, 584 (Ct. Int’l Trade 1996); Torrington Co. v. United States, 747 F. Supp. 744, 748-49 (Ct.Int’l Trade 1990), aff’d, 938 F.2d 1278 (Fed. Cir. 1991). See also S. Rep. No. 249, 96th Cong., 1st Sess. 90-91(1979). The Commission generally considers the following factors: (1) physical characteristics and uses; (2)interchangeability; (3) channels of distribution; (4) common manufacturing facilities, production processes andproduction employees; (5) customer or producer perceptions; and, when appropriate, (6) price. See Timken Co. v.United States, 913 F. Supp. 580, 584 (Ct. Int’l Trade 1996). 10 70 F.R. 58373 (Oct. 6, 2005). 11 CR at I-26; PR at I-19.
6
III. DOMESTIC LIKE PRODUCT AND INDUSTRY
A. Domestic Like Product
In making its determination under section 751(c), the Commission defines the “domestic likeproduct” and the “industry.”8 The Act defines the “domestic like product” as “a product which is like, orin the absence of like, most similar in characteristics and uses with, the article subject to an investigationunder this subtitle.”9 The Commission’s practice in five-year reviews is to look to the like productdefinitions from the original investigations and any previous review and consider whether the recordindicates any reason to revisit that definition.
In this second review, Commerce has defined the scope of the antidumping duty order onJapanese subject merchandise exactly as it defined the scope in the original investigation and first reviewas follows:
certain internal-combustion, industrial forklift trucks, with liftingcapacity of 2,000 to 15,000 pounds. The products covered aredescribed as follows: assembled, not assembled, and less thancomplete, finished and not finished, operator-riding forklift truckspowered by gasoline, propane, or diesel fuel internal-combustionengines of off-the-highway types used in factories, warehouses, ortransportation terminals for short-distance transport, towing, orhandling of articles. Less than complete forklift trucks are defined asimports which include a frame by itself or a frame assembled with oneor more component parts. Component parts of the subject forklifttrucks which are not assembled with a frame are not covered by thisorder.10
Forklift trucks are operator-riding, self-propelled work trucks with platforms that can be raisedand lowered for insertion under a load to be lifted or transported. These trucks are used for generalmaterials handling, and stacking and retrieving. Forklift trucks typically are powered either by internalcombustion engines using gasoline, diesel, or liquified petroleum gas (“LPG”), or by an electric motor. Internal combustion (“IC”) engine forklift trucks, which are the subject merchandise, normally are used inoutdoor and/or well-ventilated indoor operations when continuous operation is important or when rampsor other heavy-duty applications are involved.11
There are a variety of basic types of operator-riding forklift trucks, including counterbalanced,narrow aisle, sideloader, orderpicker, and turret. Most internal combustion forklift trucks are rider trucksof the counterbalanced lift type, powered by LPG engines, with a lifting capacity of 2,000 to 15,000

12 CR at I-27; PR at I-19. 13 CR at I-21 to I-22; PR at I-16 to I-17. 14 USITC Pub. 2082 at 17. 15 The Commission “determine[d] not to include forklift trucks with lifting capacities greater than 15,000 poundsbecause the end uses and applications of such trucks and the manufacturing processes by which they are producedare different from those of the standard-lift IC’s.” USITC Pub. 2082 at 5-6. The Commission also determined not toinclude electric forklift trucks in its definition because the evidence “suggests that in the three key respects . . .physical characteristics, applications and end uses, and production processes – there are more than ‘minordifferences’ between Class 1 and Class 2 electric forklifts, and Class 4 and Class 5 IC forklifts.” Id. at 9. 16 Id. at 9-17. 17 Id. at 10. 18 Id. 19 Id. at 10-11.
7
pounds.12 There are two basic fabrication processes involved in the production of internal combustionforklift trucks before assembly, namely the production of the frame and the production of the mast. Forklift trucks are finished with customer-specified options.13
In the original investigation, the Commission defined the domestic like product as industrial,operator-riding internal combustion engine forklift trucks with a weight-lift capacity of between 2,000and 15,000 pounds (inclusive), with a U.S.-produced frame.14 In reaching this like product definition, theCommission addressed two principal issues: (1) whether forklift trucks with a weight lift capacity greaterthan 15,000 pounds should be included in the definition; and (2) whether forklift trucks powered by otherthan an internal combustion engine, particularly electric powered trucks, should be included in thedefinition. The Commission determined in the original investigation that neither the forklift trucks withlifting capacities greater than 15,000 pounds nor those with electric powertrains should be included in thedefinition.15
In the original investigation, the Commission also considered another issue which it characterizedas “concerning the definition of the domestic like product and the domestic industry,” namely whetherdomestic production of forklift trucks should be defined on the basis of a U.S.-produced frame or acertain minimum level of U.S. value added.16 The Commission explained that in order to resolve thisissue it
must define as part of its like product definition, what constitutes a U.S.-produced IC forklift truck. Put another way, the Commission must decidewhat component(s) of any given model of IC forklift must be manufacturedin the United States, or what the nature and extent of the domesticmanufacturing activities related to that model must be, for that model to beconsidered a U.S. produced IC forklift.17
The Commission noted that it previously had “never been called upon to make a like product-domesticindustry determination in this manner: that is, to use either a pure value-added approach or a purecomponent-based (i.e., frame) approach to determine which specific models of a product (in this case, ICforklifts) should be considered ‘domestically produced.’”18 The Commission further observed that “[t]heeffect of applying either the value added approach or the frame-based approach will be to exclude datarelating to certain IC forklift models not because these models are dissimilar in characteristics and uses toother models, but because they are not ‘U.S.-produced.’”19
The Commission ultimately decided to use frame production as a proxy for domestic production. The Commission explained that it had decided “to adopt the frame approach: i.e., to define domestic
20 Id. at 15-16. 21 Id. at 16. 22 Id. at 16-17. 23 Id. at 17. 24 USITC Pub. 3287 at 5-6. 25 NACCO’s Prehearing Br. at 4. 26 Hearing Tr. at 32-33. 27 Id. at 23. 28 NACCO’s Prehearing Br. at 7.
8
production of the like product as an IC forklift with a U.S.-produced frame. . . . [because the] frameapproach most fully incorporates consideration of such practical indicia of U.S. production activity as thelevel of research and development expenses (including design and engineering expenses), capitalinvestment in plant and equipment, and labor activity related to the production of standard-lift IC’s.”20 The Commission further explained that it had decided to use the frame-approach rather than the value-added approach because “no standard-lift IC with a U.S.-produced frame contains less than 35 percentU.S. value added, the minimum threshold proposed. . . . [and that for] several of the largest U.S.producers . . . the share of U.S. value added for standard-lift IC’s with a U.S. produced frame wassignificantly greater than 50 percent.”21 The Commission added that “the frame approach ensures that asignificant portion of the total manufacturing operations on any single truck are produced in the UnitedStates.”22 Based upon the above analysis, the Commission found a single domestic like product, namelyindustrial, operator-riding internal combustion engine forklift trucks with a weight-lift capacity ofbetween 2,000 and 15,000 pounds (inclusive), with a U.S. produced frame.23
In the first review, NACCO indicated that it agreed with the Commission’s domestic like productdefinition in the original investigation and therefore it did not argue for any changes to that definition. On the record of that review and absent any contrary argument, the Commission defined the domestic likeproduct in the first review as it had in the original investigation: industrial, operator-riding internalcombustion engine forklift trucks with a weight-lift capacity of between 2,000 and 15,000 pounds, with aU.S.-produced frame.24
In this second review, however, NACCO urges the Commission to change the like productdefinition used in the original investigation and the first review. NACCO contends that the Commissionshould eliminate from the like product definition the “requirement that the frame be produced in theUnited States.”25 No other party presented arguments on the definition of the domestic like product.
The decline in importance of frame production indicates that it can no longer be used as a validproxy for domestic forklift truck production. NACCO’s Vice President, Mr. Gregory Dawe, stated at thehearing that “frame production now has become highly automated and no longer represents the epicenterof our production operations . . . the principal manufacturing operations now center around mastfabrication and the major truck assembly process.”26 Mr. Dawe also stated that “most of NACCO’s laborand capital investment is now concentrated in the assembly operations for its forklift trucks as opposed tothe production of the frame.”27
Frame production is also less significant in this second review for two additional reasons. First,whereas frame production represented approximately 10 to 15 percent of total manufacturing costs forforklift trucks during the original investigation and first review, it now accounts for as little as 3 percentof total manufacturing costs.28 Second, whereas in the original investigation forklift trucks with U.S.frames had a substantially higher domestic value added by U.S. producers than those trucks with imported

29 Compare CR/PR at Table I-5 with Original Investigation Staff Report Tables C-4, C-5, & C-6. 30 There is no argument and no basis in the record for re-examining the Commission’s determination in theoriginal investigation that neither forklift trucks with lifting capacities greater than 15,000 pounds nor those withelectric powertrains should be included in the domestic like product definition. 31 19 U.S.C. § 1677(4)(A). In defining the domestic industry, the Commission’s general practice has been toinclude in the industry producers of all domestic production of the like product, whether toll-produced, captivelyconsumed, or sold in the domestic merchant market, provided that adequate production-related activity is conductedin the United States. See United States Steel Group v. United States, 873 F. Supp. 673, 682-83 (Ct. Int’l Trade1994), aff’d, 96 F.3d 1352 (Fed. Cir. 1996). 32 CR at I-30 to I-31; PR at I-21 to I-22. 33 Consistent with our domestic like product definition, we find one domestic industry, consisting of all domesticproducers of internal combustion industrial forklift trucks with a weight-lift capacity of between 2,000 and 15,000pounds, inclusive.
9
frames, on the current record there is no longer such a relationship.29 For example, despite using importedframes for most of its U.S. production, NACCO had among the highest overall domestic value added ofU.S. producers. Accordingly, we eliminate any reference to frame production in the domestic likeproduct definition and find a single domestic like product consisting of all industrial, operator-ridinginternal combustion engine forklift trucks with a weight-lift capacity of between 2,000 and 15,000pounds, coextensive with Commerce’s scope.30
B. Domestic Industry and Related Parties
Section 771(4)(A) of the Act defines the relevant domestic industry as the “producers as a wholeof a domestic like product, or those producers whose collective output of a domestic like productconstitutes a major proportion of the total domestic production of the product.”31 Currently, there are sixfirms producing forklift trucks in the United States: Komatsu Forklift USA, Inc. (“Komatsu USA”),Mitsubishi Caterpillar Forklift America, Inc. (“Mitsubishi USA”), NACCO, Nissan Forklift Corp. NorthAmerica (“Nissan USA”), TCM Manufacturing USA, Inc. (“TCM USA”), and Toyota IndustrialEquipment Manufacturing, Inc. (“Toyota USA”).32
In this second review, NACCO argues that the domestic industry should be defined as domesticproducers of the like product, but advocates that the Commission should exclude all Japanese-ownedcompanies as related parties. We address the following two domestic industry issues: (1) whether theU.S. subsidiaries of Japanese forklift truck producers have sufficient production-related activities in theUnited States to be included in the domestic industry, and (2) whether appropriate circumstances exist toexclude any related parties.33
34 In so doing, the Commission stated as follows:
In determining whether a firm’s operations involve sufficient U.S. production-relatedactivity to qualify as domestic production of the like product, the Commission often hasanalyzed the overall nature and extent of a firm’s production-related activity in theUnited States. See, e.g., Certain Cut-to-Length Steel Plate from France, India,Indonesia, Italy, Japan, and Korea, Inv. Nos. 701-TA-387-391 and 731-TA-816-821(Final), USITC Pub. 3273 at 8-9 (Jan. 2000). The U.S. subsidiaries of the Japaneseproducers have made substantial investments in the United States for the production offorklift trucks, ranging from an estimated ***. Nissan USA’s and TCM USA’squestionnaire responses. Each firm to varying degrees uses a substantial percentage of domestic components and adds domestic value comparable to the other U.S. producersin the production of their models with the highest volume of sales. Employment levelsfor production and related workers at Mitsubishi USA and Toyota USA are substantiallyless than at NACCO USA, which produced about the same number of forklift trucks in1998. Moreover, unlike NACCO USA, none of these subsidiaries undertakes substantialresearch and development in the United States. On balance, however, we find that thesefirms fall within the range of domestic production-related activities that the Commissionhas considered adequate to qualify as a domestic producer and define Mitsubishi USA,Toyota USA, Nissan USA, Komatsu USA, and TCM USA as domestic producers.
USITC Pub. 3287 at 7-8 n.28.The dissent, however, did not include Komatsu USA in the domestic industry because it produced forklift
trucks ***. Id. at 23-24. 35 At the hearing, NACCO acknowledged that “. . . in this case, what you’ll find is certainly NACCO andvirtually all of the transplants, would be considered to be, in terms of value added, legitimate U.S. producers, notnecessarily when you look at things like research and development and other indicia that you look at, but certainlymost of them have enough value added.” Hearing Tr. at 80-81 (Rosenthal). Although the Commission at thehearing specifically requested NACCO’s counsel in its posthearing brief to address the issue of whether the U.S.subsidiaries of the Japanese producers qualify as domestic producers under the Commission’s six-factor test,NACCO failed to do so. Thus, NACCO effectively concedes that the U.S. subsidiaries are engaged in sufficientproduction-related activities to qualify as domestic producers under section 774(a) of the Act. 36 In deciding whether a firm qualifies as a domestic producer, the Commission generally has analyzed the overallnature of a firm's production-related activities in the United States and generally considers six factors:
(1) source and extent of the firm’s capital investment;(2) technical expertise involved in U.S. production activities;(3) value added to the product in the United States;(4) employment levels;(5) quantity and type of parts sourced in the United States; and (6) any other costs and activities in the United States directly leading to production of the likeproduct.
(continued...)
10
1. Sufficient-Production Related Activities
In the first review, the Commission rejected NACCO’s argument that the U.S. subsidiaries of theJapanese producers did not engage in sufficient production-related activities to qualify as domesticproducers.34 NACCO has not specifically raised that argument in this second review.35
Based on the substantial nature of their U.S. operations, we find that each of the U.S. subsidiariesof the Japanese producers qualifies as a domestic producer under the six-factor test used by theCommission.36 As discussed below, in its production of forklift truck models with the highest volume of
36 (...continued)No single factor is determinative and the Commission may consider any other factors it deems relevant inlight of the specific facts of any investigation. 37 CR/PR at Table I-5. 38 CR/PR at Table I-6. 39 See NACCO’s Posthearing Br. at 10. 40 CR/PR at Tables III-16 & 17. 41 CR/PR at Table I-4; see also, Toyota USA’s Producers’ Questionnaire, section II-11a. 42 CR/PR at Tables I-5 & E-8. 43 Id. 44 CR/PR at Tables III-12a, III-12b & III-13. 45 CR/PR at Table I-6. 46 See NACCO’s Posthearing Br. at 10. 47 CR/PR at Tables III-16 and III-17. 48 Id. 49 CR/PR at Table I-4; see also, Mitsubishi USA’s Producers’ Questionnaire, section II-11a. 50 CR/PR at Tables I-5 & E-3.
11
sales in 2004, each firm uses a substantial percentage of domestic components and/or adds significantdomestic value.37 We examine each of these firms in turn.
Toyota USA. Toyota USA accounted for *** percent of domestic production in 2004.38 Theoriginal cost of Toyota USA’s property, plant, and equipment is *** with a *** book value in FY 2004.39 Toyota USA’s total assets ranged from *** to *** during the period examined. Toyota USA’s majorcapital investments were approximately *** between 1999 and 2004. Toyota USA’s total capitalexpenditures were approximately *** between 1999 and 2004, and were approximately *** in interim2005. Toyota USA identified *** as the source of its capital.40 In 2004, Toyota USA’s employment wasapproximately *** production and related workers (“PRWs”), who worked approximately *** hours.41 In2004, *** percent of Toyota USA’s component costs for its model forklift truck with the highest salesvolume were attributed to products sourced domestically while foreign components accounted for ***percent of component costs.42 Domestic value added excluding component costs and sales, general, andadministrative (“SG&A”) costs accounted for *** percent of total costs.43 During the period examined,domestic components ranged from *** percent to *** of Toyota USA’s raw material costs for producingforklift trucks while raw material costs attributed to foreign components ranged from *** percent to ***percent.44
Mitsubishi USA. Mitsubishi USA accounted for *** percent of domestic production in 2004.45 The original cost of Mitsubishi USA’s property, plant, and equipment is ***, with a *** book value inFY 2004.46 Mitsubishi USA’s total assets ranged from *** to *** during the period examined. Mitsubishi USA’s major capital investments totaled approximately *** between 1999 and 2004. Thecompany’s total capital expenditures were approximately *** between 1999 and 2004, and wereapproximately *** in interim 2005.47 Mitsubishi USA identified *** as the source of its capital.48 In2004, Mitsubishi USA employment was approximately *** PRWs, who worked approximately ***hours.49 In 2004, *** percent of Mitsubishi USA’s component costs for its forklift truck with the highestsales volume were attributed to products sourced domestically while foreign components accounted for*** percent of component costs.50 Domestic value added excluding component costs and SG&A
51 Id. 52 CR/PR at Tables III-12a, III-12b & III-13. 53 CR/PR at Table I-6. 54 NACCO’s Posthearing Br. at 10. 55 Nissan USA’s major capital investments totaled approximately ***. Nissan USA’s capital expenditures totaledapproximately *** from 1999 until 2004, and were *** in interim 2005. CR/PR at Tables III-16 & III-17. 56 CR/PR at Table III-17. 57 CR/PR at Table III-16. 58 CR/PR Table I-4; CR at I-38; PR at I-27. 59 CR/PR at Tables I-5 & E-6. 60 Id. 61 CR/PR at Table III-12b. In its U.S. producers’ questionnaire response, Nissan USA reported that ***.” NissanUSA’s Producers’ Questionnaire, section II-17. 62 CR at I-20 n.22; PR at I-15 n.22. 63 CR/PR at Table I-6. 64 NACCO’s Posthearing Br. at 10. 65 CR/PR at Table III-17. 66 Id. 67 Komatsu USA’s Producers’ Questionnaire, section II-11a.
12
accounted for *** percent of total costs.51 During the period examined, domestic components rangedfrom *** percent to *** percent of Mitsubishi USA’s raw material costs for producing forklift trucks while raw material costs attributed to foreign components ranged from *** to *** percent.52
Nissan USA. In 2004, Nissan USA accounted for *** percent of domestic production of forklifttrucks.53 In 1988, Nissan USA’s Japanese parent firm purchased Barrett Industrial Trucks, Inc. ofIllinois, expanded its existing manufacturing facilities, and began producing internal combustionindustrial forklift trucks in the United States. A second facility was opened in Illinois in 1995 to meetincreased demand for forklift trucks in the United States and Canada. The original cost of Nissan USA’sproperty, plant, and equipment is *** with a *** book value in FY 2004.54 Nissan USA’s total assetsranged from *** to *** during the period examined.55 Nissan USA’s annual capital expenditures rangedfrom *** to *** during the period examined.56 Nissan USA identified *** as the source of its capital.57 In 2004, Nissan employed approximately *** PRWs, who worked approximately *** hours.58 In 2004,*** percent of Nissan USA’s component costs for its model forklift truck with the highest sales volumewere attributed to products sourced domestically while foreign components accounted for *** percent ofcomponent costs.59 Domestic value added excluding component costs and SG&A accounted for ***percent of total costs.60 During the period examined, domestic components ranged from *** percent to*** percent of Nissan USA’s total raw material costs for producing forklift trucks while foreigncomponents ranged from *** percent to *** percent of such raw material costs.61 Customizationoperations have represented approximately *** percent of net revenues for Nissan USA in recent years.62
Komatsu USA. In 2004, Komatsu USA accounted for *** percent of domestic production offorklift trucks.63 The original cost of Komatsu USA’s property, plant, and equipment is *** with a ***book value in FY 2004.64 Komatsu USA’s total assets ranged from *** to *** during the periodexamined.65 Komatsu USA’s annual capital expenditures ranged from *** to *** during the periodexamined.66 In 2004, Komatsu USA employed approximately *** PRWs, who worked approximately*** hours.67 In 2004, domestically sourced products accounted for *** percent of component costs forthe highest sales volume Komatsu USA forklift truck model while foreign components accounted for ***

68 CR/PR at Tables I-5 & E-2. 69 Id. 70 CR/PR at Table III-12b. In its questionnaire response, Komatsu USA reported “***.” Komatsu USA’sProducers’ Questionnaire, section II-17. 71 CR at I-20 n.22; PR at I-15 n.22. 72 CR/PR at Table I-6. 73 NACCO’s Posthearing Br. at 10. 74 TCM USA’s major capital investments during the period examined totaled approximately ***. TCM USA’scapital expenditures totaled approximately *** from 1999 until 2004, and were *** in interim 2005. CR/PR atTables III-16 & III-17. 75 CR/PR at Table III-17. 76 TCM USA’s Producers’ Questionnaire, section II-11a. 77 CR/PR at Tables I-5 & E-7. 78 Id. 79 CR/PR at Table III-12b. 80 CR/PR at Table III-16.
13
percent of those component costs.68 Domestic value added excluding component costs and SG&Aaccounted for *** percent of total costs.69 During the period examined, domestic components accountedfor *** percent of Komatsu USA’s raw material costs for producing forklift trucks while foreigncomponents accounted for approximately *** percent of such raw material costs.70 Customizationoperations accounted for approximately *** percent of the value of the trucks produced by KomatsuUSA.71
TCM USA. In 2004, TCM USA accounted for *** percent of domestic production of forklifttrucks.72 In September 1988, TCM USA purchased a manufacturing facility in South Carolina and beganU.S. production of forklift trucks in January 1989. The original cost of TCM USA’s property, plant, andequipment is *** with a *** book value in FY 2004.73 TCM USA’s total assets ranged from *** to ***during the period examined.74 TCM USA’s annual capital expenditures ranged from *** to *** duringthe period examined.75 In 2004, TCM USA employed approximately *** PRWs, who workedapproximately *** hours.76 In 2004, domestically sourced products accounted for *** percent of thecomponent costs for the highest sales volume TCM USA forklift truck model while foreign componentsaccounted for *** percent of those component costs.77 Domestic value added excluding component costsand SG&A accounted for *** percent of total costs.78 During the period examined, domestic componentsranged from *** percent to *** percent of TCM USA’s raw material costs for producing forklift truckswhile foreign components accounted for approximately *** percent to *** percent of such raw materialcosts.79
Based upon the record in this second review, we find that each of the U.S. subsidiaries of theJapanese producers qualifies as a domestic producer of the domestic like product using the Commission’ssix-factor test. As to the first factor, i.e., source and extent of the firm’s capital investment, Toyota USAand Mitsubishi USA have made substantial investments in the United States in the production of forklifttrucks, while Nissan USA, TCM USA, and Komatsu USA have invested to a lesser but not insignificantdegree in their U.S. operations. Moreover, these firms generally identified the United States or their ownoperations as the source of their capital.80 As to the second factor, i.e., technical expertise involved inU.S. production activities, most of the firms reported that some degree of technical expertise was involved

81 CR at I-17 to I-19; PR at I-14 to I-15. 82 In 2004, domestically sourced products accounted for *** percent of component costs for the highest salesvolume NACCO forklift truck model while foreign components accounted for *** percent of those component costs. CR/PR at Table I-5. 83 During the period examined, domestic components accounted for *** percent to *** of NACCO’s raw materialcosts for producing forklift trucks while foreign components accounted for *** percent to *** percent of such rawmaterial costs. CR/PR at Table III-12b. 84 CR at I-20 n.22; PR at I-15 n.22. 85 USITC Pub. 2082 at 18-20. 86 The Commission found that appropriate circumstances existed to exclude these firms from the domesticindustry under the related parties provision for two reasons. First, the Commission noted that “[w]ith the exceptionof Komatsu, USA, each of the U.S. manufacturing subsidiaries of the Japanese producers was established after the
(continued...)
14
in their U.S. production activities, and the level of technical expertise did not differ significantly from thatreported by NACCO.81
As to the third factor, i.e., value added to the product in the United States, each of the Japanesetransplants added significant domestic value in the production of their models with the highest volume ofsales in 2004, with several adding value only to a slightly lesser degree than did NACCO.82 As to thefourth factor, i.e., employment levels, Mitsubishi USA and Toyota USA employed the most substantialnumber of PRWs who worked ***; Nissan USA, Komatsu USA, and TCM USA employed a lesser butnot an insignificant number of PRWs during the period examined. As to the fifth factor, i.e., quantityand type of parts sourced in the United States, each of the U.S. subsidiaries of the Japanese producersuses predominantly domestic components in the production of its highest sales volume forklift truckmodel, and *** than does NACCO.83 As to the sixth factor, i.e., any other costs and activities in theUnited States directly leading to production of the like product, unlike NACCO, none of the Japanesetransplants undertakes substantial research and development in the United States. On the other hand, theJapanese transplants reported that customization operations accounted for *** percent of the value of theirfinished forklift trucks, while for NACCO customization added only *** percent of the final value.84
In our view, five out of six factors – the source and extent of the firm’s capital investment, valueadded to the product in the United States, quantity and type of parts sourced in the United States,employment levels, and technical expertise involved in U.S. production activities – weigh in favor offinding that each of the U.S. subsidiaries of the Japanese producers qualifies as a domestic producer. Evidence as to the remaining factor (i.e., other costs and activities directly leading to the production of thelike product) is mixed. On balance, we find that each of the U.S. subsidiaries of the Japanese producersengages in adequate domestic production-related activities to qualify as a domestic producer. Wetherefore define Toyota USA, Mitsubishi USA, Nissan USA, Komatsu USA, and TCM USA, along withNACCO, as domestic producers.
2. Related Parties
In the original investigation, there were no related party issues before the Commission regardingU.S. subsidiaries of the Japanese producers. The Commission did, however, consider whether twodomestic producers, which imported subject product, should be excluded as related parties, and found thatappropriate circumstances to do so did not exist.85
In the first review, the Commission found that each of the U.S. subsidiaries of the Japaneseproducers were related parties because they were wholly or majority owned by Japanese producers of thesubject merchandise and that appropriate circumstances existed to exclude these firms from the domesticindustry.86

86 (...continued)imposition of the antidumping duty order apparently to participate in the U.S. market without incurring antidumpingduties.” Second, the Commission observed “that the Japanese producers, free from the restraining effects of theorder, would be likely to rationalize their U.S. and Japanese production operations, and supply the U.S. market byboth importation and U.S. production, or importation alone.” USITC Pub. 3287 at 8-9.
Vice Chairman Okun dissented and found that appropriate circumstances did not exist to exclude any firmfrom the domestic industry under the related parties provision. See Dissenting Views of Chairman Lynn M. Braggand Commissioners Thelma J. Askey and Deanna Tanner Okun, Internal Combustion Industrial Forklift Trucks fromJapan, Inv. No. 731-TA-377 (Review), USITC Pub. 3287 (April 2000) at 23-24. 87 The primary factors the Commission has examined in deciding whether appropriate circumstances exist toexclude a related party include:
(1) the percentage of domestic production attributable to the importing producer;(2) the reason the U.S. producer has decided to import the product subject to investigation,
i.e., whether the firm benefits from the LTFV sales or subsidies or whether the firm mustimport in order to enable it to continue production and compete in the U.S. market, and
(3) the position of the related producer vis-a-vis the rest of the industry, i.e., whetherinclusion or exclusion of the related party will skew the data for the rest of the industry.
See, e.g., Torrington Co. v. United States, 790 F. Supp. 1161 (Ct. Int’l Trade 1992), aff’d without opinion, 991 F.2d809 (Fed. Cir. 1993). The Commission has also considered the ratio of import shipments to U.S. production forrelated producers and whether the primary interest of the related producer lies in domestic production or importation. See, e.g., Open-End Spun Rayon Singles Yarn from Austria, Inv. No. 731-TA-751 (Preliminary), USITC Pub. 2999at 7 n.39 (October 1996). These latter two considerations were cited as appropriate factors as well in Allied MineralProducts, Inc. v. United States, —Fed. Supp. 2d.—, Slip Op. 04-139 (Ct. Int’l Trade November 12, 2004) at 6; Sandvik AB v. United States, 721 F. Supp. 1322, 1331-32 (Ct. Int’l Trade 1989) (upholding a Commission decisionto exclude a related party even when the reason the subsidiary imported from its subject parent company was to“obtain sizes and grades which are unavailable from other sources” noting, with approval as “the exact scenario ofthe instant case” the statement from the 1979 legislative history of the statute concerning a subject foreign parentdirecting exports to the U.S. so as not to compete with its related U.S. producer).
In the present review, NAACO argues that the Commission should exclude the U.S. subsidiaries ofJapanese producers from the domestic industry. NAACO asserts that the primary interest of the U.S. subsidiaries isnot in domestic production but in avoiding antidumping duties. While we generally view the issue as whether aproducer’s primary interest is in domestic production or importation, in any event we do not concur with NAACOthat the U.S. subsidiaries would halt or substantially reduce U.S. production upon revocation of the order, for thereasons explained in section IV.B.1 of these views. 88 NACCO’s Prehearing Brief at 10-14. At the hearing, however, NACCO’s counsel stated that “I really don’tthink it matters what you do to related parties in this case, to be honest with you.” Hearing Tr. at 187 (Rosenthal). 89 In Japan, NACCO has a 50-percent-owned joint venture with the Japanese conglomerate Sumitomo HeavyIndustries Ltd. (“Sumitomo”). Hearing Tr. at 130 (Eklund). This joint venture entity is known as Sumitomo-NACCO Materials Handling Co., Ltd. (“Sumitomo-NACCO”). CR/PR at Table I-7. No party has argued thatNACCO is a related party nor does the record establish whether NACCO directly or indirectly controls a foreign
(continued...)
15
In this second review, NACCO argues that all of the Japanese-owned subsidiaries should beexcluded from the domestic industry because (1) their primary interest lies in avoiding the imposition ofthe antidumping duties and not in domestic production,87 and (2) their inclusion will severely skew theanalysis of the impact of revocation.88
Each of the U.S. subsidiaries of the Japanese producers is wholly or majority owned, and thusdirectly controlled, by Japanese manufacturers and/or exporters of the subject merchandise. As a result oftheir corporate relationship with subject manufacturers/exporters, Toyota USA, Mitsubishi USA, NissanUSA, Komatsu USA, and TCM USA each satisfy the statutory definition of a related party.89

89 (...continued)exporter as a result of NACCO’s 50/50 joint venture with Sumitomo.
We find it unnecessary to determine whether NACCO qualifies as a related party under the statute because,in either event, appropriate circumstances do not exist to exclude it from the domestic industry. In 2004, NACCOaccounted for *** percent of domestic production and over the period examined it invested considerable sums in itsproductive capacity. CR/PR Table I-6; CR at I-34 and PR at I-24. NACCO has not imported subject merchandiseduring the period examined, nor has Sumitomo- NACCO exported subject merchandise to the United States. CR atI-34 and IV-3, PR at I-24 and IV-1, foreign producer questionnaire responses. Given NAACO’s investment in itsU.S. operations, and the relatively small size of its Japanese joint venture, we do not find that Sumitomo-NACCOwould export significantly increased volumes of subject merchandise to the United States if the order were revoked. See Sumitomo-NACCO foreign producer questionnaire response, NACCO Posthearing brief at 30, CR at IV-5, PRat IV-4. Nor would NACCO be shielded from the impact of subject imports, given that there are several Japaneseproducers of forklift trucks other than Sumitomo-NACCO. Finally, in terms of financial returns, NACCO generally***, indicating that it did not derive a significant benefit from its joint-venture in Japan. CR/PR at Table III-11b. 90 As noted above, Nissan USA, Komatsu USA, and TCM USA have invested to a lesser degree in their U.S.forklift truck operations than Toyota USA and Mitsubishi USA. 91 CR at I-40; PR at I-28. 92 CR/PR at Table IV-1. 93 We also note that three firms – including *** – have taken no position regarding continuation of the order inthis review, although two firms *** oppose continuation of the order. CR/PR at Table I-6. 94 CR/PR at Table III-11b. 95 ***’s ratio of operating income to net sales was *** percent in 1999, *** percent in 2000, *** percent in 2001,*** percent in 2002, *** percent in 2003, *** percent in 2004, and *** percent in interim period 2005. CR/PR at
(continued...)
16
We therefore turn to the issue of whether appropriate circumstances exist to exclude any of theserelated party domestic producers from the domestic industry. Each of these firms now has beenestablished in the United States for at least fifteen years – four out of the five firms were establishedshortly after the original antidumping duty order became effective, while Komatsu USA was establishedin 1987, before the order was issued. As noted above, each of these firms has made substantialinvestments in its U.S. operations during the past fifteen years.90 As a result of these significantinvestments, the U.S. subsidiaries of the Japanese producers accounted for *** percent of domesticproduction of forklift trucks in 2004. Accordingly, the exclusion of all of these firms from the domesticindustry would result in the exclusion of a substantial majority of U.S. production.
The five related party producers did not import the subject merchandise into the United Statesduring the period examined.91 Similarly, their Japanese parent corporations did not export subjectmerchandise to the United States during the period examined, with the exception of minimal volumes in1999 and 2000.92 Moreover, as discussed further below, we find it unlikely that subject imports willincrease by any significant amount within the reasonably foreseeable future. Even if the antidumpingduty order were revoked, the record does not establish that any of the U.S. subsidiaries of the Japaneseproducers would be insulated from the effects of any renewed subject imports. Rather, the fact that thereare multiple U.S. subsidiaries of Japanese producers indicates that each U.S. subsidiary of the Japaneseproducers would still face competition in the U.S. market from any renewed subject imports.93
In terms of financial performance, *** – performed below the industry average for much of theperiod examined, which suggests that these firms did not derive any significant benefit from theirrelationships with their Japanese parents in a way that would skew the data for the industry.94 While ***outperformed the U.S. industry average in terms of its financial performance during the period examined,there is no basis on this record to attribute *** financial performance in significant part to its relationshipwith its Japanese parent firm.95
95 (...continued)Table III-11b. 96 19 U.S.C. § 1675a(a). 97 SAA, H.R. Rep. No. 103-316, vol. I, at 883-84 (1994). The SAA states that “[t]he likelihood of injury standardapplies regardless of the nature of the Commission’s original determination (material injury, threat of material injury,or material retardation of an industry). Likewise, the standard applies to suspended investigations that were nevercompleted.” SAA at 883. 98 While the SAA states that “a separate determination regarding current material injury is not necessary,” itindicates that “the Commission may consider relevant factors such as current and likely continued depressedshipment levels and current and likely continued [sic] prices for the domestic like product in the U.S. market inmaking its determination of the likelihood of continuation or recurrence of material injury if the order is revoked.” SAA at 884. 99 See NMB Singapore Ltd. v. United States, 288 F. Supp. 2d 1306, 1352 (Ct. Int’l Trade 2003) (“‘likely’ meansprobable within the context of 19 U.S.C. § 1675(c) and 19 U.S.C. § 1675a(a)”); Nippon Steel Corp. v. United States,Slip Op. 02-153 at 7-8 (Ct. Int’l Trade Dec. 24, 2002) (same); Usinor Industeel, S.A. v. United States, Slip Op. 02-152 at 4 n.3 & 5-6 n.6 (Ct. Int’l Trade Dec. 20, 2002) (“more likely than not” standard is “consistent with the court’sopinion”; “the court has not interpreted ‘likely’ to imply any particular degree of ‘certainty’”); Indorama Chemicals(Thailand) Ltd. v. United States, Slip Op. 02-105 at 20 (Ct. Int’l Trade Sept. 4, 2002) (“standard is based on alikelihood of continuation or recurrence of injury, not a certainty”); Usinor v. United States, Slip Op. 02-70 at 43-44(Ct. Int’l Trade July 19, 2002) (“‘likely’ is tantamount to ‘probable,’ not merely ‘possible’”). 100 Vice Chairman Deanna Tanner Okun notes that, consistent with her dissenting views in Pressure SensitivePlastic Tape from Italy, Inv. No. AA1921-167 (Second Review), USITC Pub. 3698 (June 2004) at 15-17, she doesnot concur with the U.S. Court of International Trade’s interpretation of “likely” to mean “probable.” See UsinorIndusteel, S.A. et al v. United States, No. 01-00006, Slip Op. 02-39 at 13 (Ct. Int’l Trade April 29, 2002). However,she will apply the Court’s standard in this review and all subsequent reviews until either Congress clarifies themeaning or the U.S. Court of Appeals for the Federal Circuit addresses the issue. See also Additional Views of ViceChairman Deanna Tanner Okun Concerning the “Likely” Standard in Certain Seamless Carbon and Alloy SteelStandard, Line and Pressure Pipe from Argentina, Brazil, Germany, and Italy, Inv. Nos. 731-TA-707-709
(continued...)
17
Thus, in light of the substantial portion of domestic production accounted for by the relatedparties, the lack of evidence of any significant benefit to the U.S. subsidiaries due specifically to theirrelationships with their Japanese corporate parents, and the lack of any imports of subject merchandise bythe related parties during the period examined, we decline to exclude any of these firms from the domesticindustry. Accordingly, we define the domestic industry to include Toyota USA, Mitsubishi USA, NissanUSA, Komatsu USA, TCM USA, and NACCO.
IV. LIKELIHOOD OF CONTINUATION OR RECURRENCE OF MATERIAL INJURYIF THE ANTIDUMPING DUTY ORDER IS REVOKED
In a five-year review conducted under section 751(c) of the Act, Commerce will revoke anantidumping duty order unless: (1) it makes a determination that dumping is likely to continue or recur,and (2) the Commission makes a determination that revocation of the antidumping duty order “would belikely to lead to continuation or recurrence of material injury within a reasonably foreseeable time.”96 The SAA states that “under the likelihood standard, the Commission will engage in a counter-factualanalysis; it must decide the likely impact in the reasonably foreseeable future of an important change inthe status quo – the revocation or termination of a proceeding and the elimination of its restraining effectson volumes and prices of imports.”97 Thus, the likelihood standard is prospective in nature.98 The U.S.Court of International Trade has found that “likely,” as used in the sunset review provisions of the Act,means “probable,” and the Commission applies that standard in five-year reviews.99 100 101

100 (...continued)(Review)(Remand), USITC Pub. 3754 (Feb. 2005). 101 Commissioner Lane notes that, consistent with her views in Pressure Sensitive Plastic Tape from Italy, Inv.No. AA1921-167 (Second Review), USITC Pub. 3698 (June 2004) at 15-17, she does not concur with the U.S. Courtof International Trade’s interpretation of “likely” but she will apply the Court’s standard in this review and allsubsequent reviews until either Congress clarifies the meaning or the U.S. Court of Appeals for the Federal Circuitaddresses the issue. 102 19 U.S.C. § 1675a(a)(5). 103 SAA at 887. Among the factors that the Commission should consider in this regard are “the fungibility ordifferentiation within the product in question, the level of substitutability between the imported and domesticproducts, the channels of distribution used, the methods of contracting (such as spot sales or long-term contracts),and lead times for delivery of goods, as well as other factors that may only manifest themselves in the longer term,such as planned investment and the shifting of production facilities.” SAA at 887. 104 In analyzing what constitutes a reasonably foreseeable time, Chairman Koplan examines all the current andlikely conditions of competition in the relevant industry. He defines “reasonably foreseeable time” as the length oftime it is likely to take for the market to adjust to a revocation or termination. In making this assessment, heconsiders all factors that may accelerate or delay the market adjustment process including any lags in response byforeign producers, importers, consumers, domestic producers, or others due to: lead times; methods of contracting;the need to establish channels of distribution; product differentiation; and any other factors that may only manifestthemselves in the longer term. In other words, this analysis seeks to define “reasonably foreseeable time” byreference to current and likely conditions of competition, but also seeks to avoid unwarranted speculation that mayoccur in predicting events into the more distant future. 105 19 U.S.C. § 1675a(a)(1). 106 19 U.S.C. § 1675a(a)(1). There have been no duty absorption findings by Commerce with respect to the orderunder review. CR at I-11; PR at I-9. The statute further provides that the presence or absence of any factor that theCommission is required to consider shall not necessarily give decisive guidance with respect to the Commission’sdetermination. 19 U.S.C. § 1675a(a)(5). While the Commission must consider all factors, no one factor isnecessarily dispositive. SAA at 886.
18
The statute states that “the Commission shall consider that the effects of revocation or terminationmay not be imminent, but may manifest themselves only over a longer period of time.”102 According tothe SAA, a “‘reasonably foreseeable time’ will vary from case-to-case, but normally will exceed the‘imminent’ timeframe applicable in a threat of injury analysis [in antidumping investigations].”103 104
Although the standard in a five-year review is not the same as the standard applied in an originalantidumping investigation, it contains some of the same fundamental elements. The statute provides thatthe Commission is to “consider the likely volume, price effect, and impact of imports of the subjectmerchandise on the industry if the orders are revoked or the suspended investigation is terminated.”105 Itdirects the Commission to take into account its prior injury determination, whether any improvement inthe state of the industry is related to the order or the suspension agreement under review, whether theindustry is vulnerable to material injury if the orders are revoked or the suspension agreement isterminated, and any findings by Commerce regarding duty absorption pursuant to 19 U.S.C. § 1675(a)(4).106
107 19 U.S.C. § 1675a(a)(4). 108 USITC Pub. 3287 at 11. 109 Id. 110 Id. at 11-12. 111 Id. at 12. Vice Chairman Okun found separate conditions of competition. See Dissenting Views of ChairmanLynn M. Bragg and Commissioners Thelma J. Askey and Deanna Tanner Okun, Internal Combustion IndustrialForklift Trucks from Japan, Inv. No. 731-TA-377 (Review), USITC Pub. 3287 (April 2000) at 27-28. 112 CR at II-14; PR at II-9. 113 CR/PR at Table I-1. 114 Apparent U.S. consumption increased from *** forklift trucks in 1999 to *** forklift trucks in 2004. CR/PRat Table I-11. We note that the U.S. apparent consumption data in the original investigation and first review werebased upon the like product definition used in those previous determinations, which included forklift trucks withU.S.-produced frames only. However, the apparent U.S. consumption data in this second review is based upon thedifferent like product definition adopted here, namely forklift trucks with “all frames.” We are cognizant of thedifferences between the apparent U.S. consumption data in the original investigation, first review, and secondreview, and take those differences fully into account in reaching our determination here. 115 Apparent U.S. consumption also increased from *** forklift trucks in interim 2004 to *** forklift trucks ininterim 2005. CR/PR at Table I-11.
19
A. Conditions of Competition
In evaluating the likely impact of the subject imports on the domestic industry, the statute directsthe Commission to consider all relevant economic factors “within the context of the business cycle andconditions of competition that are distinctive to the affected industry.”107 The following conditions ofcompetition are relevant to our determination.
In the first review, the Commission majority identified four major conditions of competition. First, it highlighted an important change in the composition of the domestic industry, most notably thatfour Japanese forklift truck producers had established U.S. subsidiaries soon after the originalantidumping duty order took effect.108 Second, it observed that demand for internal combustion industrialforklift trucks had remained strong since the end of the original investigation and throughout the periodexamined in the first review.109 Third, it noted that the technology for producing forklift trucks hadremained essentially unchanged since the original investigation.110 Fourth, it found that nonsubjectimports continued to account for a significant share of the U.S. market as they did during the originalinvestigation.111
1. U.S. Demand
In the current review, we observe that while demand for forklift trucks in the United States hasgrown substantially since the time of the original investigation, it also fluctuates in tandem with theperformance of the general economy and manufacturing sector.112 Between the original investigation andthe first review, apparent U.S. consumption of the domestic like product almost doubled, increasing from46,152 forklift trucks in 1987 to 85,747 forklift trucks in 1998.113 Apparent U.S. consumption of thedomestic like product increased irregularly during the period examined in the current review. ApparentU.S. consumption was only slightly lower in 1999 and 2000 than in 1998, it fell sharply to *** forklifttrucks in 2001, and it continued to fall to *** forklift trucks in 2002.114 Apparent U.S. consumption thenincreased to *** forklift trucks in 2003, and it increased further to *** forklift trucks in 2004.115
By NACCO’s own account, some of these declines in U.S. demand for forklift trucks – mostnotably in 2001 and 2002 – reflected the recession experienced by the U.S. economy and the

116 Hearing Tr. at 106. 117 CR/PR at Table I-11; CR at II-14 to II-15; PR at II-9. 118 CR/PR at Table C-1. 119 CR at II-14; PR at II-9. 120 Only NACCO predicted a slight correction in U.S. demand for forklift trucks in 2008. CR at II-14; PR at II-9;NACCO’s Posthearing Br., Exh. 1 at 29. 121 CR at II-22; PR at II-14. 122 CR at IV-15; PR at IV-10. 123 Id. 124 CR/PR at Tables IV-3 and IV-4; CR at II-23; PR at II-14. 125 Id. 126 Id. at II-24; PR at II-15. 127 CR at II-25; PR at II-15. 128 CR at II-23 to II-25; PR at II-14 to II-16; NACCO Posthearing Br., Exh. 1 at 29.
20
manufacturing sector.116 With the recent U.S. economic recovery, apparent U.S. consumption forforklift trucks rebounded in 2004 and surpassed U.S. demand at the beginning of the period in 1999.117 This positive trend continued between interim 2004 and interim 2005 with apparent U.S. consumption*** percent higher in the latter period.118 Four domestic forklift truck producers (including ***) reportedexpected increases in U.S. demand for forklift trucks through at least 2007.119 Three domestic producerspredicted increases in U.S. demand for forklift trucks through 2010.120
2. Global Demand
The United States is the largest market in the world for internal combustion industrial forklifttrucks followed by China, Japan, Europe, Latin America, and Canada.121 As in the U.S. market, demandfor forklift trucks in these foreign markets is cyclical and has fluctuated with the general strength of theeconomies of these nations. Global demand for forklift trucks exceeded expectations in 2004 and stronggrowth is expected in 2005. According to World Industrial Truck Statistics, worldwide shipments of ICIforklift trucks (Classes 4 and 5) increased by *** percent from 2003 to 2004. The Americas and Asia ledgrowth in 2004, with increased shipments of *** percent and *** percent, respectively.122 Globalshipments for forklift trucks during the first six months of 2005 were *** percent higher than during thecomparable period of 2004.123
Demand for forklift trucks in Japan reportedly was stagnant between 1999 and 2003 with somegrowth between 2004 and 2005.124 Demand for forklift trucks in China has increased dramaticallybetween 1999 and 2004 and this trend is expected to continue.125 Demand for forklift trucks in Europehas been relatively stable with some slow growth between 1999 and 2004.126 Between 1999 and 2004,demand for forklift trucks in Latin America and Canada grew along with real GDP in those markets.127
Future growth in Japanese demand for forklift trucks is expected to be slow. European growthalso is expected to be positive but slow, driven by demand from Eastern Europe. Continued stronggrowth in demand for forklift trucks in China is expected through 2009. Similarly, growing demand isprojected in Latin America and Canada.128

129 In 1987, U.S. producers had sufficient capacity to produce only *** forklift trucks. Apparent U.S.consumption in 1987 was 46,152 forklift trucks. CR/PR at Table I-1. 130 Original Confidential Report at A-14, A-17, and A-69; Original Determination at 9, 11. 131 CR/PR at Tables I-1 (1987) and C-1 (2004). Data for 2004 are based on U.S. operations on forklift trucks withimported or domestic frames. 132 CR/PR at Tables I-1 (1987) and C-1 (2004). 133 CR/PR at Table I-1. 134 CR/PR at Tables I-1 (1987 and 1998) and I-11 (2004). NACCO’s imports ***. CR/PR at Tables III-7 and IV-1. 135 Original Staff Report at A-13. 136 Id.
21
3. U.S. Supply
During the original investigation, Japan was an important source of imported forklift trucks forthe U.S. market, at a time when U.S. demand exceeded U.S. capacity by more than *** percent.129 During that period, U.S. producers themselves accounted for a large share of U.S. imports of forklifttrucks from Japan and virtually all imports of forklift trucks from countries other than Japan. Indeed, in1987, Yale Materials Handling Corp. (now part of the corporate structure of domestic interested partyNACCO) ***.130
While U.S. apparent consumption has nearly *** since the original investigation, the size of thedomestic industry has increased at an even faster rate. Domestic production capacity more than ***between 1987 and 2004, while domestic production in 2004 was nearly *** times greater than that of1987.131 Exports by the domestic industry in 2004 were more than *** times the level of exports in1987.132
Imports of subject forklift trucks from Japan have been virtually non-existent since at least1997.133 Instead, as discussed more fully below, Japanese producers have chosen to participate in the U.S.market through production by U.S. affiliates, which now account for the vast majority of domesticproduction of forklift trucks.
Nonsubject imports account for a significant share of the U.S. market as they did in the originalinvestigation and first review. Nonsubject imports accounted for *** percent of apparent U.S.consumption in 1987, 21.9 percent of apparent U.S. consumption in 1998, and *** percent of apparentU.S. consumption in 2004.134
4. Domestic Industry Restructuring
As the domestic industry expanded, it also underwent a significant change in composition. Duringthe original investigation, there were eight domestic producers of forklift trucks: AC Materials HandlingCorp., Caterpillar Industrial Inc., Clark Equipment Co., Hyster Co., Komatsu Forklift (USA), Inc., TaylorMachine Works, White Lift Truck and Parts Mfg. Co., and Yale Materials Handling Corp.135 Three firms,– Hyster, Caterpillar, and Clark – accounted for more than *** percent of U.S. production in 1987.136 Only one of these firms – Komatsu USA – remains unchanged in the industry today. Hyster and Yalewere acquired by NACCO, Caterpillar Industries, Inc. formed a joint venture with

137 CR at I-33 to I-37, and IV-1 n.5; PR at I-24 to I-26 and IV-1 n.5. 138 These U.S. subsidiaries were established as a result of the Japanese parent forming a joint venture(Mitsubishi), purchasing an existing manufacturing facility (Nissan and TCM), or building a new facility in theUnited States (Toyota and Komatsu). CR at I-33 to I-39; PR at I-24 to I-27; Original Investigation Staff Report at A-20. Sumitomo-NACCO is a joint venture subsidiary of domestic producer NACCO. CR at I-34; PR at I-24. NACCO does not import subject product from its joint venture. 139 CR at I-35 to I-36; PR at I-25. 140 CR/PR at Table I-6; CR at I-3; PR at I-3. 141 CR/PR at Table I-6; First Review CR/PR at Table I-6; Original Investigation CR/PR at Table 1. We note thatthe U.S. market share data in the original investigation and first review were based upon the like product definitionused in those previous determinations, which included forklift trucks with U.S.-produced frames only; however, theU.S. market share data in this second review is based upon the different like product definition adopted here, namelyforklift trucks with “all frames.” We are cognizant of the differences between the U.S. market share data in theoriginal investigation, first review, and second review, and take those differences fully into account in reaching ourdetermination here. 142 CR/PR at Table I-7; CR at I-34, PR at I-24. 143 CR/PR at Table I-7; CR at IV-6, PR at IV-5. 144 CR/PR at Table I-7; CR at IV-5 to IV-8, PR at IV-4 to IV-6 (Komatsu, Mitsubishi, Nissan, TCM). 145 The U.S. industry exports principally to *** CR at III-6, PR at III-5. In 2004, Japan’s top export markets wereAustralia (14.7 percent), Malaysia (6.1 percent), Thailand (5.2) percent, Russia (5.1) percent, South Africa (5.0percent), and Taiwan (4.8 percent). CR at IV-14, PR at IV-9. Because these export figures are based on shipmentsthat include ICI forklift trucks with a lift capacity exceeding 15,000 pounds, the actual figures for the subjectmerchandise may differ somewhat. As noted, exports of subject ICI forklift trucks from Japan to the United Stateswere minimal during the period examined. CR/PR at Table IV-1.
22
Japanese-owned Mitsubishi USA, Clark was acquired by a South Korean company, and the remainingoriginal domestic producers have exited the market.137 While several original producers have exited the market, the remaining Japaneseproducers/exporters of forklift trucks established U.S. forklift truck manufacturing operations (Toyota,Mitsubishi, Nissan, and TCM). All six of the Japanese producers have now virtually ceased exports tothe United States. Rather, they are serving the U.S. market through domestic production.138 As notedearlier, the other U.S. subsidiary of a Japanese producer – Komatsu USA – was established before theantidumping duty order.139 At present, the domestic industry consists of NACCO and the five U.S.subsidiaries of the Japanese producers.140 As a result of the developments described above, the U.S. subsidiaries of the Japanese producersnow account for the bulk of the domestic industry. Whereas U.S. subsidiaries of the Japanese producersaccounted for one of eight domestic producers in the original investigation, they accounted for five ofeight domestic producers in the first review, and five of six producers in this second review. The U.S.subsidiaries of the Japanese producers accounted for less than *** percent of domestic production in1988, but accounted for *** percent of domestic production in 1998, and *** percent of domesticproduction in 2004.141
The investments of the Japanese producers in U.S. capacity appear consistent with a general trendtoward the creation of regional production facilities. NACCO, for example, has manufacturing andassembly facilities in the Americas (the United States, Mexico, and Brazil), Europe (Ireland andScotland), and Asia (Japan and China).142 Toyota has manufacturing facilities not only in the UnitedStates and Japan but in France and Sweden as well.143 The other domestic producers also have facilitiesin third-country markets.144 These regional production facilities primarily serve the market in which theyare situated, but also third-country markets in those regions.145
146 Hearing Tr. at 76 (Dawe); CR at I-34 and III-2; PR at I-24 and III-2. 147 CR at I-34; PR at I-24. 148 Id. 149 Id. 150 Hearing Tr. at 31-32 (Dawe); CR at I-34; PR at I-24. 151 Hearing Tr. at 15-16 (Eklund); CR at I-34; PR at I-24. 152 CR at I-20 and I-23; PR at I-15 and I-17. 153 CR at I-22; PR at I-17. 154 CR at I-20; PR at I-15. 155 For the period examined, domestic producers reported shipping *** percent of the total quantity ofdomestically produced forklift trucks with all frames directly to U.S. dealers, *** percent directly to national accountend users, and the remaining *** percent to distributors. CR/PR at II-1. 156 CR/PR at II-1. 157 CR at II-2; PR at II-1.
23
Another condition of competition that we consider is the substantial reorganization undergone bydomestic producer NACCO. NACCO moved the vast majority of its frame production operations outsidethe United States beginning in 1999 to a facility with approximately 350 employees in Saltillo, Mexico.146 In 2002, NACCO phased out assembly operations in Danville, Illinois limiting that facility to partsdistribution.147 In 2003, NACCO shut down its facility in Lenior, North Carolina where it formerlymanufactured truck masts and cylinders.148 With this restructuring, NACCO now assembles forklifttrucks primarily at its facilities in Berea, Kentucky, while it produces parts at its Sulligent, Alabamafacility.149 It has another production facility in Greenville, North Carolina and research and developmentoperations in Portland, Oregon.150 During the period examined, NACCO cites investments of over $130million in research and development, capital tooling, and manufacturing and marketing in order to replaceits entire forklift truck production line which will culminate in ***.151
5. Customization
Forklift trucks are differentiated by type of tire (cushion or pneumatic), type of engine (gasoline,LPG, or diesel), lift-capacity, and front-end equipment. U.S. producers manufacture standard forklifttrucks on assembly lines and customize each order to provide whichever combination of the wide varietyof available features that their customers desire.152 For example, NACCO manufactures approximately1,400 different mast variations made to custom order.153 Domestic producers reported that customization accounts for between *** percent to *** percent of a forklift truck’s value, with the majority of domesticproducers reporting that customization accounts for *** percent to *** percent of a forklift truck’svalue.154
6. Channels of Distribution
During the period examined, the primary distribution channels for forklift trucks were dealersfollowed by national account end users, with the remainder shipped to distributors.155 Distributorstypically sell to dealers, and dealers sell or lease most of their forklift trucks to end users, while a few aremaintained as short-term rental units.156 Domestic forklift truck producers rely heavily on extensivedealer networks to market their forklift trucks nationwide to end users; each dealer is assigned ageographic region by its supplier and is required to achieve a certain market share in that region.157 Mostdealers typically carry a single producer’s forklift truck brand, although some dealers carry two or three
158 CR at II-2 to II-3; PR at II-1 to II-2. 159 According to NACCO, the profit margins on the parts aftermarket are much greater than profit margins in theforklift trucks market. As a result, NACCO indicated that it is important for a producer to introduce as many of itsforklift trucks into the market as possible in order to support the parts business. NACCO sells all of its parts directlyto dealers, who, in turn, sell those parts directly to their customers or use them to do the service work on the forklifttruck. NACCO has a $300 million parts business at its facility in Danville, Illinois. CR at II-3 n.16; PR at II-2 n.16. 160 CR at II-3; PR at II-2. 161 CR at II-4; PR at II-2. 162 Id. 163 19 U.S.C. § 1675a(a)(2). 164 19 U.S.C. § 1675a(a)(2)(A-D).
24
different brands. Brand loyalty is important in the U.S. forklift trucks industry. Thus, dealers and othercustomers almost never change suppliers. This customer loyalty may be partially explained by the factthat domestic forklift truck producers provide extensive technical, service, and financial support to theirdealers.158
The end-user customers of domestic forklift truck producers, called national-account end users,negotiate directly with domestic producers for the price and quantity of forklift trucks that they purchase.National-account end users typically receive lower prices than other end users that purchase from dealersand distributors. Two domestic producers (***) reported that they pursue the national accounts businessfor volume, potential aftermarket parts business,159 and market share.160 While the quantity requiredvaries from year to year, each domestic producer also requires its national account customers to havemultiple locations, either nationally or in regions of two or more dealers, and to maintain a minimumpurchase quantity ranging from *** forklift trucks for *** to *** forklift trucks for ***.161 Pricesnegotiated with national account end users depend on a number of factors, including but not limited toquantity purchased, competitive pressures, incumbent supplier, type of product being purchased, potentialsize of the customer’s forklift truck fleet, and length of contract.162
B. Revocation of the Order on Subject Imports from Japan Is Not Likely to Lead toContinuation or Recurrence of Material Injury Within a Reasonably ForeseeableTime
1. Likely Volume of Subject Imports
In evaluating the likely volume of imports of subject merchandise if the antidumping duty orderis revoked, the Commission is directed to consider whether the likely volume of imports would besignificant either in absolute terms or relative to production or consumption in the United States.163 Indoing so, the Commission must consider “all relevant economic factors,” including four enumeratedfactors: (1) any likely increase in production capacity or existing unused production capacity in theexporting country; (2) existing inventories of the subject merchandise, or likely increases in inventories;(3) the existence of barriers to the importation of the subject merchandise into countries other than theUnited States; and (4) the potential for product shifting if production facilities in the foreign country,which can be used to produce the subject merchandise, are currently being used to produce otherproducts.164
In the original investigation, the Commission found that the volume of subject imports and theincrease in their market share were significant. It noted that the volume of subject imports from Japanincreased in both value and volume terms, albeit modestly, during each year of the period of

165 USITC Pub. 2082 at 25. 166 Id. at 25-26. 167 USITC Pub. 3287 at 13-14. 168 Id. at 14. 169 Id. at 14-15. 170 Id. at 15-16. Vice Chairman Okun disagreed and concluded that absent the order, subject imports likely wouldnot increase to a significant level, nor regain a significant share of the U.S. market. See Dissenting Views ofChairman Lynn M. Bragg and Commissioners Thelma J. Askey and Deanna Tanner Okun, Internal CombustionIndustrial Forklift Trucks from Japan, Inv. No. 731-TA-377 (Review), USITC Pub. 3287 (April 2000) at 28-31. 171 CR/PR at Table I-1. 172 CR at IV-5; PR at IV-4. 173 In 2004, Toyota Japan accounted for approximately *** percent of Japanese production, Komatsu Japanaccounted for approximately *** percent of Japanese production, and Sumitomo-NACCO accounted forapproximately *** percent of Japanese production. CR at IV-5 to IV-7; PR at IV-4 to IV-5. 174 NACCO urges the Commission to rely upon data from the Japanese Industrial Vehicle Association (“JIVA”)rather than upon questionnaire responses for purposes of determining the Japanese producers’ capacity and capacityutilization. According to NACCO, the JIVA data indicates that the overall capacity utilization rate for the Japaneseproducers was approximately *** percent in 2004. See NACCO’s Prehearing Br. at 20-22.
We focus our attention on questionnaire data rather than JIVA data for four reasons. First, theCommission’s questionnaire data at issue provides good coverage of the Japanese forklift trucks industry’soperations on the subject merchandise for the period examined in this second review. As discussed above, the three
(continued...)
25
investigation.165 The Commission also found that the market share of subject imports from Japan wassignificant throughout and increased slightly during the period examined.166
In the first review, the Commission concluded that subject import volume was likely to besignificant for four reasons if the antidumping duty order was revoked. First, the Commission observedthat the Japanese producers had substantial excess capacity in Japan.167 Second, the Commission notedthat the Japanese producers had relatively high inventory levels compared to their domestic counterparts,including NACCO.168 Third, the Commission noted that the United States is the largest market in theworld for forklift trucks, Japanese producers depended on exports for more than half of their shipments offorklift trucks, and home market shipments of forklift trucks in Japan had declined during the periodexamined.169 Fourth, the Commission reasoned that, if the antidumping duty order were revoked, theresponse by the U.S. subsidiaries of the Japanese producers – especially given their varying sizes andlevel of investments – would range from “complete repatriation of production, where U.S. production ishalted and all production returned to Japan with the U.S. market completely supplied by imports fromJapan to rationalization of the U.S. and Japanese production operations to avoid duplication and improveproduction economies of scale.”170 We now turn to the facts of this second review. Imports of subject forklift trucks from Japanhave been virtually non-existent since at least 1997.171 Instead, as discussed above, Japanese producershave chosen to participate in the U.S. market through production by U.S. affiliates, which now accountfor the vast majority of domestic production of forklift trucks.
In addition, while the industry in Japan is large, it has relatively limited excess productioncapacity. The Commission received questionnaire responses from three out of six Japanese forklift truckproducers, namely Toyota Japan, Komatsu Japan, and Sumitomo-NACCO.172 These three firmsaccounted for the large majority of Japanese forklift production during the period examined, representingapproximately *** percent of total production of ICI forklift trucks in Japan in 2004.173 Based upon thequestionnaire responses from these three reporting firms,174 the data (as adjusted by staff175) reflect that

174 (...continued)reporting firms accounted for the overwhelming share of Japanese forklift truck production in 2004, approximately*** percent. CR at IV-5; PR at IV-4. Second, Commission staff contacted JIVA seeking to collect data regardingthe production capacity of the Japanese forklift truck producers for the period examined in this second review. JIVA, however, informed Commission staff that it did not collect or maintain any capacity data. Rather, it collectsonly production data. See Email correspondence from *** dated 11/20/05. Third, the JIVA data are overbroadbecause they apparently also cover nonsubject product (i.e., large forklift trucks outside Commerce’s scope). Fourth, the data proffered by NACCO are too remote in time. NACCO acknowledges that its capacity estimatesactually were based upon 1991 production figures from JIVA used as a basis for extrapolating the Japaneseproducers’ 2004 capacity utilization. Exhibit 5 (attached to NACCO’s Posthearing Brief) also suggests that therehave been reductions in the Japanese producers’ forklift truck production capacity since 1991. In any event, evenbased upon the JIVA data submitted by NACCO regarding the Japanese producers’ excess capacity, it is doubtfulthat the Japanese producers would be able to absorb the production of their U.S. subsidiaries to any significantdegree. Compare NACCO’s Prehearing Br. at 21-22 with CR/PR at Tables III-4 & III-11b. 175 CR/PR at Table IV-3. Commission staff used the capacity data submitted by Sumitomo-NACCO and KomatsuJapan, but adjusted the capacity data submitted by Toyota Japan. Accordingly, Toyota Japan’s annual capacityreflects its highest level of annual production during the period for which the data were collected in this secondreview ***. We find that using Toyota’s *** production data reported to the Commission is preferable to using1991 JIVA production data as proposed by NACCO because the *** data reported to the Commission pertains to theperiod under review and is limited to the types of forklift trucks included in the scope of the order. CR/PR at TableIV-3 n.2.
Moreover, two of the Japanese producers that did not submit questionnaire responses in this review didsubmit responses in the first review. The combined data of these two producers – Nissan and TCM – and the smallproducer Sumitomo-NACCO showed a relatively high utilization rate (*** percent) and relatively modest availablecapacity (*** trucks) in 1998, the last full year of review. Memorandum INV-X-049 (March 2, 2000) at Table IV-4. While Mitsubishi Japan did not supply a questionnaire response in either the prior or current review, JIVA datasubmitted by NACCO show Mitsubishi to have the smallest difference between its production in 1991 (NACCO’sproxy for capacity) and its production in 2004 of any of the Japanese producers. See NACCO Posthearing Br. at 7. 176 CR/PR at Table IV-3. NACCO urges the Commission in this second review to draw adverse inferencesagainst the Japanese forklift truck producers, including against two Japanese producers (Toyota USA and KomatsuUSA) who responded to the Commission’s questionnaires. Presumably, NACCO would make an exception for itsJapanese affiliate, Sumitomo-NACCO. NACCO emphasizes that only the three Japanese producers (Sumitomo-NACCO, Komatsu-Japan, and Toyota-Japan) have submitted questionnaire responses in this second review whilethree others have failed to submit questionnaire responses. NACCO argues that the capacity data submitted byToyota USA and Komatsu USA are wholly inadequate and suspect. NACCO urges the Commission to drawadverse inferences against the Japanese producers by finding that the Japanese forklift truck producers havesubstantial excess capacity to sell subject imports into the United States. See NACCO’s Final Comments at 3-7.
We decline to draw adverse inferences against any of the Japanese forklift truck producers in this secondreview. While the three Japanese producers responding to the Commission’s questionnaires in the first review (i.e.,TCM Japan, Nissan Japan, and Sumitomo-NACCO) accounted for only an estimated *** percent of Japaneseproduction of forklift trucks in 1998 (based on older data and estimates), the three Japanese producers responding tothe Commission’s questionnaires in this second review (Sumitomo-NACCO, Komatsu-Japan, and Toyota-Japan)accounted for *** percent of Japanese production of forklift trucks in 2004. See First Review Views at 18; CR atIV-5; PR at IV-4. Moreover, Komatsu Japan’s questionnaire responses were adequate despite NACCO’sprotestations to the contrary. Similarly, Toyota Japan’s questionnaire responses were made in good faith and alsowere adequate, albeit after the adjustments discussed above made by Commission staff to Toyota Japan’s productioncapacity data for the period examined.
26
capacity utilization for Japanese forklift truck producers increased from *** percent in 1999 to ***percent in 2004, and was *** percent in interim 2005, compared to *** percent in interim 2004.176 Thus,Japanese producers have a limited ability to increase exports to the United States simply by increasing

177 In any event, we note that the U.S. affiliates of Japanese producers generally produce a wide range of forklifttrucks in the United States. CR at I-27 n.44; PR at I-19 n.44. NACCO does not allege, and we do not find, thatJapanese producers would be likely to increase exports to the United States to fill in gaps in their product offeringsin the U.S. market. 178 CR/PR at Table IV-3. 179 Id. 180 CR at IV-14 to IV-16; PR at IV-9 to IV-10; CR/PR at Table IV-4. 181 NACCO’s Prehearing Br. at 24-30. 182 Id. at 26. 183 Id. at 27. 184 Komatsu Japan’s unused capacity for 2004 was derived by subtracting its production (*** units) from itscapacity (*** units). See Komatsu Japan’s foreign producer questionnaire (section II-7a) and Komatsu USA’sproducer questionnaire (section II-11a).
27
production.177 Similarly, Japanese forklift truck producers had only relatively modest existing inventoriesduring the period examined, peaking at *** percent of total shipments in 2004.178
Japanese producers are export oriented, exporting between *** percent and *** percent ofshipments during the period of review.179 Japanese forklift truck producers have a number oflongstanding and viable export markets outside the United States including Australia, Europe, Asia, andAfrica, with global demand projected to rise.180 There are no known barriers to exports of forklift trucksfrom Japan in third country markets.
These basic facts – the lack of recent subject imports, the longstanding and substantial U.S.production facilities owned by Japanese producers, relatively limited available capacity and inventories inJapan, and the absence of import barriers in other markets – support a finding that subject imports fromJapan are not likely to increase to a significant level if the order were revoked. NACCO argues that thevolume of subject imports from Japan is likely to increase if the order is revoked because, according toNACCO, the three smallest U.S. subsidiaries of Japanese producers (Nissan USA, Komatsu USA, TCMUSA) will repatriate operations to Japan while the two largest U.S. subsidiaries of Japanese producers,Toyota USA and Mitsubishi USA, will rationalize production between their U.S. and Japanesefacilities.181 We address NACCO's repatriation and rationalization arguments below.
Repatriation
NACCO claims that the three smallest U.S. subsidiaries of the Japanese producers – KomatsuUSA, Nissan USA, and TCM USA – would cease operations in the United States and repatriate theirforklift truck production operations to Japan resulting in a substantial increase in the likely volume ofsubject imports if the antidumping duty were revoked. According to NACCO, these three firms haveonly “skeletal operations in the United States” and are “struggling financially.”182 NACCO claims thatgiven the low profit margins for these three firms their Japanese corporate parents have a “strongincentive to cease production operations in the United States, while maintaining basic depot operations,similar to the operations before the imposition of the order.”183 While this argument reflects theCommission majority’s decision in our last review, we find that the record developed in this review nolonger supports NACCO’s repatriation argument.
First, neither Komatsu nor Nissan has unused capacity in Japan sufficient to make up for the lossof its U.S. counterpart. In 2004, Komatsu Japan had approximately *** units of unused capacity, whilethe capacity of Komatsu USA was *** higher at *** units.184 The record points to the same conclusionas to Nissan. Nissan USA’s production capacity of *** units in 2004 is considerable compared to the

185 Nissan USA’s production capacity is reported in its producer questionnaire response. Nissan Japan’sproduction capacity is taken from NACCO’s Posthearing Brief at 30. As explained elsewhere in these views, wehave certain reservations about using the capacity data submitted by NACCO, and we have relied on alternative datawhere they are available. 186 NACCO’s Posthearing Br. at 30. 187 CR/PR at Table IV-4; CR at IV-15; PR at IV-10. 188 CR at II-24; PR at II-15. 189 Total exports for Japanese forklift truck producers increased irregularly from *** in 1999 forklift trucks to ***units in 2004. Japanese producers reported only minimal exports to the United States during 1999-2004 (*** forklifttrucks in 1999, *** forklift trucks in 2000, and *** exports to the United States between 2001 and 2004). CR/PR atTable IV-3. 190 CR/PR at Table III-16; CR at I-39; PR at I-27; First Review Staff Report at Table III-10. 191 CR/PR at Appendix D-3. Nissan’s Foreign-Trade Zones (“FTZ”) application does not support NACCO’sargument that this U.S. subsidiary would rationalize significant production with its Japanese corporate parent if theantidumping duty order is revoked. In its FTZ application, Nissan USA stated that it was forced to move themanufacturing of one pneumatic forklift truck model outside the United States to one of its underutilized facilities inMexico in 2004 due to price pressures and higher costs associated with U.S. production, even without any subjectimports from Japan. CR at III-3 n.2; PR at III-2 n.2; NACCO’s Prehearing Br., Exh. 1, Executive Summary at 2. Nissan USA also stated in its FTZ application that if it cannot become more competitive, it will consider movingsome unspecified amount of additional production to underutilized production facilities in Spain or other locations in2006. Id. Nissan USA nowhere specifically indicated in its FTZ application that it would consider movingsignificant production from its U.S. operations to Japan within the reasonably foreseeable future. Rather, theapplication represents a significant effort to maintain U.S. production operations and its willingness to invest more inits U.S. operations.
28
estimated ***-unit capacity for its Japanese facility.185 According to these figures, Nissan could make upfor the closure of its U.S. facility only if its capacity utilization rate in Japan were lower than *** percent. NACCO, however, estimates Nissan Japan’s capacity utilization rate to be substantially higher, at ***percent.186
Second, repatriation is unlikely because the Japanese industry has long-standing third-countrymarkets in which demand is projected to grow.187 Japanese producers also dominated their home marketaccounting for virtually all forklift trucks sold in Japan during the period examined.188 Reported exportsto third countries by Japanese producers increased slightly during the period 1999-2004, as there are noreported antidumping duty orders in place against Japanese forklift truck producers except in the UnitedStates.189
Third, as we previously noted, the level of investments in the U.S. production facilities by each ofthe U.S. producers with Japanese corporate parents is significant, therefore making repatriation unlikelyin the reasonably foreseeable future. Komatsu USA began production before the entry of the originalantidumping duty order and it has been in the U.S. market for eighteen years; meanwhile, Toyota USA,Nissan USA, and TCM USA have been established in the U.S. market for more than fifteen years. Indeed, Toyota USA opened a greenfield facility in 1990, made substantial investments during the firstreview, and continues to invest during the present review.190 As discussed above, although Nissan USA,Komatsu USA, and TCM have invested in their U.S. forklift truck production facilities to a lesser degreethan Toyota USA and Mitsubishi USA, these investments are nonetheless significant. In theirquestionnaire response in this second review, each of these three firms indicated that it did not anticipateany significant changes in its production operations or organizational structure if the antidumping dutyorder were revoked.191 Fourth, it is unclear that the U.S. subsidiaries of the Japanese producers will repatriate becausetheir U.S. operations have not been profitable. Although *** was by far the most profitable of the U.S.

192 CR/PR at Table III-11b. 193 CR at II-14; PR at II-9. 194 NAACO offered no evidence to support its bare assertion that social costs affiliated with downsizing and plantclosings are higher in Japan than in the United States. As *** noted, these assertions appear based on generalizedand outdated views of Japan that may not currently apply to the forklift trucks industry. See, e.g., CR at II-11, PR atII-7; Hearing Tr. at 170-172 (Dawe). 195 NACCO’s Prehearing Br., Exh. 1 at App. D (64-73); Posthearing Br., Ex. 7; CR at I-13. While Nissan USA’sapplication for a foreign trade zone represents an effort to avoid tariffs on components, tariffs on many majorcomponents range from 2 percent to 7 percent. For example, engines are the most significant item imported fromJapan by the U.S. subsidiaries of the Japanese producers. Of the *** in components from Japan imported by theU.S. subsidiaries of the Japanese producers in fiscal year 2004, *** percent, or ***, were engines. CR/PR at TableIII-13. Engines, however, are imported at duty rates between 0 and 2.5 percent. NACCO’s Prehearing Br. at App.D. Tariffs on all items are less than 10 percent. Id. 196 NACCO’s Posthearing Brief at 3-5. We note that, despite extensive discussion of the repatriation issue at theCommission’s hearing, NACCO did not provide information or argument concerning the EU’s VER until itsposthearing brief even though it was asked why Japanese producers located production facilities in the EU absent anantidumping duty order. Hearing Tr. at 136-137.
29
subsidiaries, *** was profitable throughout the period examined, and *** was profitable for more thanhalf of the period examined.192 Only *** showed operating losses for most of the period examined. Moreover, the drop in U.S. demand for forklift trucks which began in 2001 adversely, but temporarily,affected the profitability of these operations as fixed costs were spread over fewer units sold. ApparentU.S. consumption increased at the end of the period examined, was higher in interim 2005 than in interim2004, and is expected to continue to increase through at least 2007 and likely until 2010.193 Accordingly,the adverse demand conditions which suppressed profitability earlier in the period examined are not likelyto prevail in the reasonably foreseeable future. Fifth, it is also not clear that repatriation by the U.S. subsidiaries to Japan is likely because thereare higher social costs associated with downsizing and closing plants in Japan than in the United States asargued by NACCO.194 In any event, even if social costs associated with downsizing and plant closingswere higher to some degree in Japan than in the United States, this does not establish that the U.S.subsidiaries would likely repatriate to Japan, especially when viewed in light of the other evidence in therecord suggesting that repatriation is unlikely to occur within a reasonably foreseeable time if theantidumping duty order is revoked (e.g., growing worldwide demand suggests that no facilities wouldneed to close and high capacity utilization rates in Japan suggest that Japanese producers do not havesufficient capacity to absorb production from U.S. operations).
Sixth, the record does not support NACCO’s claim that repatriation will result in significant dutysavings for the Japanese producers. NACCO claimed that because the duty on finished trucks (0 percent)was below the duty on parts and components, the Japanese producers would have a strong incentive torepatriate production to Japan and ship completed trucks, rather than parts, to the United States. However,the record reflects that the U.S. subsidiaries of the Japanese producers generally pay modest tariffs onmajor components imported from Japan and procure more components domestically than from Japan andother sources.195
Seventh, contrary to NACCO’s argument, we do not find that the experience of Japanese forklifttruck producers with respect to the European Union market after a Voluntary Export Restraint (“VER”)was lifted in 1994 supports a finding of likely repatriation.196 Regardless of whether the Japaneseproducers increased their exports to the EU after the VER was lifted, there is no evidence in the record toshow that the Japanese producers actually reduced their EU production by any amount, much less thatthey repatriated their EU forklift truck operations to Japan or another market. Japanese producers’affiliates producing forklift trucks in the EU are apparently fewer and smaller than their affiliates in the

197 CR/PR at Table I-7 (only Nissan and Toyota have subsidiaries producing ICI forklift trucks in the EU). 198 We note that NACCO acknowledges that the European operations of Japanese transplants differ from theiroperations in either Japan or the United States. NACCO’s Posthearing Br. at 1. 199 CR at IV-6; PR at IV-5. 200 NACCO’s Prehearing Br. at 22-23. 201 CR at I-34; PR at I-24. 202 CR at II-8 to II-9; PR at II-5 to II-6. *** of the U.S. subsidiaries of the Japanese producers reported exportingforklift trucks during the period examined, with Canada and Mexico cited most frequently as export markets. ***. CR at II-8 n.32; PR at II-5 n.32. 203 NACCO’s Prehearing Br. at 29. 204 NACCO’s Prehearing Br. at 30; NACCO’s Posthearing Br. at 10. 205 CR/PR at Appendix D-3.
30
United States;197 thus it is not clear that the EU experience is probative of what is likely to occur in theUnited States in the event of revocation.198 Moreover, Toyota Japan acquired an additional EU producerin 2000, contrary to the suggestion that repatriation would ensue.199
Eighth and finally, NACCO asserts that the Japanese producers would realize economies of scaleand cost efficiencies by repatriating their U.S. operations to a single supply source and therefore would doso.200 Indeed, NACCO’s own business model belies this assertion, as it has multiple forklift truckmanufacturing and assembly facilities, including facilities in the United States, Japan, China, Brazil, andthe United Kingdom serving these different regional markets, rather than a single production source.201 Similarly, there is evidence in the record demonstrating the importance of regionalized rather than singlesource production for the U.S. subsidiaries of the Japanese producers and their Japanese corporateparents.202
Rationalization
In this second review, NACCO also argues that Toyota USA and Mitsubishi USA wouldrationalize specific product lines to Japan if the antidumping duty order is revoked. According toNACCO, these two firms have made “substantial investments” in their U.S. operations so that, if the orderwere revoked, rather than shut down their U.S. operations entirely, they will “likely rationalize their U.S.and Japanese production operations, and supply the U.S. market by both importation and U.S.production.”203 NACCO argues that Toyota USA and Mitsubishi USA would rationalize production insuch a manner that the higher volume pneumatic trucks would be repatriated to Japan while cushion-tiretrucks and more specialized pneumatic-tire trucks would continue to be produced at their U.S.-ownedfacilities.204
While the record does not demonstrate that no rationalization is possible, we find no evidence ofrecord indicating that such a change is likely on a significant scale, that it is likely to occur within areasonably foreseeable time, or that it would necessarily result in a net loss of U.S. production. BothToyota USA and Mitsubishi USA have made substantial and ongoing investments in their U.S.production facilities, contrary to the suggestion that they would idle a substantial part of their U.S.capacity in favor of production in Japan. There is no evidence of record that either firm has evenconsidered rationalizing production if the order is revoked, much less taken any steps to do so. In theirquestionnaire responses, both Toyota USA and Mitsubishi USA indicated ***.205 Moreover, as discussedabove, the record does not establish that the companies would achieve greater economies of scale or thatcultural or social considerations favor production in one country over the other. In addition, animpediment to a significant net transfer of production is that the United States and Japan impose differing
206 CR at II-12 & II-32 n.109; PR at II-8 and II-21 n.109. 207 CR at II-8 to II-9; PR at II-5 to II-6. 208 CR at II-13; PR at II-6. 209 19 U.S.C. § 1675a(a)(3). The SAA states that “[c]onsistent with its practice in investigations, in consideringthe likely price effects of imports in the event of revocation and termination, the Commission may rely oncircumstantial, as well as direct, evidence of the adverse effects of unfairly traded imports on domestic prices.” SAAat 886.
31
industry, safety, and emission standards.206 As noted previously, *** ships particular products toAustralia and New Zealand from its U.S. production facilities, even though its Japanese productionfacilities are actually closer to these markets, because those markets require certain forklift truckspecifications which *** produces in the United States but not in Japan.207 Based on the foregoing, weconclude that any rationalization efforts undertaken by Toyota USA and Mitsubishi USA in thereasonably foreseeable future are not likely to lead to a significant increase in the volume of subjectimports.
In addition to NACCO’s arguments on repatriation and rationalization, we also have consideredwhether it is likely that Japanese producers would switch production facilities and equipment currentlyused for other products to the production of subject forklift trucks. Japanese producers responding to ourquestionnaires indicated an inability to shift from production of other products to production of ICIforklift trucks using the same equipment.208 Finally, there is no basis to conclude, and NACCO has notclaimed, that subject producers are likely to switch forklift trucks currently destined for its home or third-country markets to the U.S. market in the event of revocation.
Nor do we find other indications that the likely volume of subject imports would be significantupon revocation. The record indicates that the volume of subject imports during the period examined inthis review was minimal. Inventories kept by Japanese forklift truck producers were low, and barriers toentry for Japanese forklift truck producers in other markets outside the United States were also low. Japanese producers do not have substantial excess capacity, and they already have a substantial presencein the U.S. forklift trucks market via their U.S. subsidiaries. On these bases, we conclude that, absent theorder, subject imports likely would not increase to a significant level, nor regain a significant share of theU.S. market within a reasonably foreseeable time.
2. Likely Price Effects of Subject Imports
In evaluating the likely price effects of subject imports if the antidumping duty order is revoked,the Commission is directed to consider whether there is likely to be significant underselling by the subjectimports as compared to domestic like products and whether the subject imports are likely to enter theUnited States at prices that otherwise would have a significant depressing or suppressing effect on theprice of the domestic like products.209
In the original determination, the Commission found that prices of subject imports had adverselyaffected prices of domestic forklift trucks. The evidence showed that in 18 out of 20 price comparisonsinvolving U.S.-produced subject forklifts rejected in favor of Japanese trucks, the price of the purchasedJapanese truck was lower than the price of the rejected U.S. truck, with margins of underselling rangingfrom 0.3 to 21.8 percent. Based upon this evidence, the Commission concluded that there was aconsistent pattern of price underselling by subject imports. The Commission also found that subjectimports had a significant price suppressing effect on the prices of forklift trucks in the United States basedon evidence that domestic producers’ net unit values for forklift trucks either fell or remained flat during

210 USITC Pub. 2082 at 26. 211 USITC Pub. 3287 at 18. 212 Id. Vice Chairman Okun disagreed and found no likely significant price effects within the reasonablyforeseeable future if the order were revoked. See Dissenting Views of Chairman Lynn M. Bragg andCommissioners Thelma J. Askey and Deanna Tanner Okun, Internal Combustion Industrial Forklift Trucks fromJapan, Inv. No. 731-TA-377 (Review), USITC Pub. 3287 (April 2000) at 31-32. 213 NACCO’s Prehearing Br. at 35. 214 Id. at 34. 215 Id. 216 Id. at 35-36. 217 CR/PR at Table II-3.
32
the original investigation while the domestic industry experienced operating losses during the periodexamined.210
In the first review, the Commission found that revocation of the antidumping duty order wouldlikely lead to significant underselling by the subject imports of the domestic like product, as well assignificant price depression and suppression, within a reasonably foreseeable time. Based on the limitedpricing data available, the Commission concluded “that the Japanese producers would revert to thepricing behavior evidenced during the original investigation and would undersell the domestic likeproduct” if the order was revoked.211 Moreover, the Commission found that “in rationalizing their U.S.and Japanese production operations, these Japanese entities would achieve production efficiencies andeconomies of scale which would enable them to price the models exported to the United States moreaggressively than the current prices offered by their U.S. subsidiaries, while at the same time largelyshielding their subsidiaries from adverse price effects.”212
In this second review, NACCO argues that subject imports from Japan are likely to have anegative impact on domestic industry prices if the order is revoked. First, NACCO contends that giventhe significant underselling by the subject imports during the original investigation, it is likely that suchunderselling would reoccur if the antidumping duty order was revoked and cause price suppression in thedomestic market.213 Second, NACCO claims that the record in this second review establishes that theJapanese transplants have significantly undersold NACCO in virtually every quarter for which pricecomparisons were possible.214 NACCO contends that underselling by the Japanese transplants during theperiod examined in this review “has caused pressure on domestic prices, such that U.S. prices aresensitive to renewed price suppression or depression from unfairly traded imports.”215 Third, NACCOemphasizes that questionnaire responses by purchasers also indicate that revocation of the order wouldcause price depression, not just price suppression.216
Because all of the Japanese manufacturers have U.S. affiliates engaged in forklift truckproduction operations, but have had little or no importation, the record in this review contains pricing datafor the U.S. market that is limited to the prices of domestic producers. The price trends vary somewhat byproduct type; however, our price data generally show relatively steady prices from 1999 through 2001,some fluctuations in 2002 and 2003, and generally rising prices in 2004 and interim 2005. As describedabove, U.S. demand for forklift trucks is expected to continue to increase, which will likely result inupward pressure on domestic forklift truck prices within the reasonably foreseeable future.
The information in the record suggests that, while price is an important factor for purchasers,competition also is based on a number of other factors including availability, quality, technical support,dealer relationships, product range, discounts offered, and brand loyalty. Purchasers frequently considerthe first three factors (availability, quality, and technical support) to be more important than price.217
Given the dominant presence of producers in the U.S. market that are affiliated with Japanesemanufacturers, we find it unlikely that, absent the order, any resulting Japanese subject imports would be

218 We note that while the U.S.-product prices of *** were generally below NACCO’s prices, *** prices werefrequently higher than NACCO’s. CR/PR at Appendix F. It is not clear whether these data reflect true apples-to-apples price comparisons given the great variety of product-specific features and options. For the same reason,evidence of Japanese pricing behavior in third-country markets is not necessarily indicative of the likely prices ofexports of subject products to the United States. 219 19 U.S.C. § 1675a(a)(4). 220 19 U.S.C. § 1675a(a)(4). Section 752(a)(6) of the Act states that “the Commission may consider the magnitudeof the margin of dumping” in making its determination in a five-year review. 19 U.S.C. § 1675a(a)(6). The statutedefines the “magnitude of the margin of dumping” to be used by the Commission in five-year reviews as “thedumping margin or margins determined by the administering authority under section 1675a(c)(3) of this title.” 19U.S.C. § 1677(35)(C)(iv). See also SAA at 887. Commerce determined likely dumping margins ranging from 13.65 percent to 56.81 percent. CR at I-10. Commercehas not made any duty absorption findings with respect to the subject antidumping duty order. 221 The SAA states that in assessing whether the domestic industry is vulnerable to injury if the order is revoked,the Commission “considers, in addition to imports, other factors that may be contributing to overall injury. Whilethese factors, in some cases, may account for the injury to the domestic industry, they may also demonstrate that anindustry is facing difficulties from a variety of sources and is vulnerable to dumped or subsidized imports.” SAA at885.
33
sold at prices likely to have significant adverse effects on these domestic producers, and also unlikely thatthere will be significant volumes of subject imports absent the order. Especially in light of the substantialmarket share of their U.S. affiliates and their minimal excess capacity in Japan, there is no incentive forJapanese producers to engage in aggressive pricing practices with regard to exports to the U.S. market ifthe order is revoked.
Contrary to NACCO’s claim, we do not find that the prices of forklift trucks made in the UnitedStates by affiliates of Japanese producers are necessarily indicative of the likely prices of exports offorklift trucks from Japan. The prices of these affiliates are U.S.-product prices. Given the wide varietyof models and features of forklift trucks, there is no basis to conclude that any likely imports from Japanwould be priced the same as those currently made in the United States.218 In addition, the establishmentof the U.S. affiliates and their continued operation over the last 15 years is a fundamental shift inconditions of competition such that the underselling that occurred during the original investigation is notnecessarily probative of likely import pricing in the reasonably foreseeable future. Thus, we find thatrevocation of the antidumping duty order likely would not lead to significant underselling by the subjectimports of the domestic like product, or to significant price depression or suppression, within a reasonablyforeseeable time.
3. Likely Impact of Subject Imports
In evaluating the likely impact of imports of subject merchandise if the antidumping duty ordersare revoked, the Commission is directed to consider all relevant economic factors that are likely to have abearing on the state of the industry in the United States, including but not limited to: (1) likely declines inoutput, sales, market share, profits, productivity, return on investments, and utilization of capacity; (2)likely negative effects on cash flow, inventories, employment, wages, growth, ability to raise capital, andinvestment; and (3) likely negative effects on the existing development and production efforts of theindustry, including efforts to develop a derivative or more advanced version of the domestic likeproduct.219 All relevant economic factors are to be considered within the context of the business cycleand the conditions of competition that are distinctive to the industry.220 As instructed by the statute, wehave considered the extent to which any improvement in the state of the domestic industry is related tothe order at issue and whether the industry is vulnerable to material injury if the orders are revoked.221
222 USITC Pub. 2082 at 28-29. 223 USITC Pub. 3287 at 19. 224 Id. at 20. 225 Id. Vice Chairman Okun disagreed and found that if the antidumping duty order were revoked, subjectimports from Japan would not be likely to have a significant adverse impact on the domestic industry within areasonably foreseeable time. See Dissenting Views of Chairman Lynn M. Bragg and Commissioners Thelma J.Askey and Deanna Tanner Okun, Internal Combustion Industrial Forklift Trucks from Japan, Inv. No. 731-TA-377(Review), USITC Pub. 3287 (April 2000) at 32-34. 226 As a ratio to net sales, the domestic industry’s operating income was *** percent in 1999, *** percent in 2000,*** percent in 2001, *** percent in 2002, *** percent in 2003, *** percent in 2003, *** percent in interim 2004,and *** percent in interim 2005. CR/PR at Table III-9b. 227 NACCO reported operating expenses for rationalization and restructuring of *** in 2001 and 2002, whereasthe industry’s operating losses in those two years totaled $13.1 million. CR/PR at Table III-9b. 228 See, e.g., Hearing Tr. at 102 (Rosenthal) (“highly competitive market” and “relatively low profitability of theindustry”), 89 (Wilson) (“This is a very price-competitive market. We measure differences in prices in tenths of apercent. Tenths of a percent have significant impacts on profitability. If we were to lose one percent of price acrossour product range on everything we sold, it would cost us $10 million, and if you’ve seen the financials of NACCOMaterials Handling Group, that would have a material impact on our profitability”), 107 (Rosenthal) (“You can seethat nobody, and this is public knowledge, is doing particularly well in this market given the nature of thecompetition”); CR/PR at Table I-1; CR at II-3 n.13; PR at II-2 n.13 (competitive pressures) and n.16 (NACCOstating that volume of forklift trucks is important because the margin structure on the parts side of the business ismuch greater), CR/PR at Table III-11b.
34
In the original investigation, the Commission found that the domestic industry had beenmaterially injured by reason of the significant and increasing volume of forklift trucks from Japan, thehigh import penetration throughout the period of investigation, the consistent pattern of price undercuttingby those imports, and the continuing and increasing operating losses of the domestic industry.222
In the first review, the Commission found that if the antidumping duty order was revoked, subjectimports from Japan would be likely to have a significant adverse impact on the domestic industry within areasonably foreseeable time. At the outset, the Commission explained that it had considered the impactthat revocation of the order would have on the domestic industry defined to exclude the related U.S.subsidiaries of Japanese producers since these subsidiaries would be largely shielded from the effects ofthe renewed subject imports.223 Given what it viewed as the weak and declining financial performance ofthe domestic industry, the Commission concluded that the domestic industry was in a weakened state andwas vulnerable to material injury if the order were revoked.224 The Commission reasoned that thesignificant volume and price effects of subject imports would likely have a significant adverse impact onthe production, shipments, sales, market share, and revenues of the domestic industry, particularly givenits vulnerable condition.225
In the current review, NACCO argues that the domestic industry is in a weakened and vulnerablestate, citing its own financial performance as well as the financial performance of the transplantcompanies. However, the record in this second review is mixed regarding the financial performance ofthe domestic industry. Although the domestic industry showed relatively small operating losses in 2001,2002, and interim 2004, the domestic industry was profitable in 1999, 2000, 2003, 2004, and in interim2005.226 Moreover, most of the domestic industry’s operating losses occurred in 2001 and 2002 whendomestic demand was lower following the economic downturn in 2001, and while NACCO was incurringsignificant restructuring costs.227 Finally, the U.S. forklift trucks market is highly competitive, and,consequently, profit margins in this industry traditionally have been modest.228
As discussed previously, apparent U.S. consumption has increased significantly since the originalinvestigation, and, after a drop in demand beginning in 2001, demand increased late in the period
229 In addition, both the volume and value of domestic producers’ export shipments have grown substantially. Export shipments increased from *** units in 1987 to 6,841 units in 1998 to *** units in 2004. The average unitvalues of these shipments increased from *** in 1987 to $19,189 in 1998 to *** in 2004. CR/PR at Tables I-1 & C-1.
As noted above, the U.S. shipment data in the original investigation and first review were based upon thelike product definition used in those previous determinations, which included forklift trucks with U.S.-producedframes only; however, the U.S. shipment data in this second review is based upon the different like productdefinition adopted here, namely forklift trucks with “all frames.” 230 CR/PR at Tables I-1 and C-1. 231 The domestic industry employed *** PRWs in 1987, 2,559 PRWs in 1998, and *** PRWs in 2004. Employees for the domestic industry worked *** PRW hours in 1987, 6.17 million PRW hours in 1998, and ***PRW hours in 2004. CR/PR at Tables I-1 & C-1. 232 CR/PR at Tables I-1 & C-1.
35
examined, and it was projected to increase further through at least 2007. The quantity of U.S. shipmentsof forklift trucks manufactured in the United States has increased substantially overall since the originalinvestigation, rising from *** units in 1987 to *** units in 1998, and falling only slightly to *** units in2004.229 Similarly, the reported market share held by domestic forklift trucks manufactured in the UnitedStates has more than tripled since the original investigation, rising from *** percent in 1987 to 78.1percent in 1998, and to *** percent in 2004.230 The number of PRWs employed by the domestic industryhas grown significantly along with hours worked since the original investigation.231 While substantialinvestments have contributed to increased capacity, sharply higher production means that the domesticindustry’s capacity utilization rates have risen from 47.3 percent in 1987 to 78.3 percent in 1998, beforedropping slightly to *** percent in 2004.232
Based on the foregoing, we conclude that the domestic industry is not in a weakened state, ascontemplated by the vulnerability criterion of the statute.
We also do not find it likely that revocation of the order would result in a significant increase inthe volume of subject imports. While we do not rule out the possibility of a small increase in the volumeof subject merchandise in the event of revocation, we do not find it likely that any reasonably foreseeableincrease in the volume of subject imports would depress or suppress the domestic industry’s pricessignificantly, or have a significant adverse impact on the production, shipments, sales, employment, andrevenue levels of the domestic industry. Any marginal reduction in the domestic industry’s production,shipments, sales, employment, and revenue levels would not have a direct adverse impact on the domesticindustry’s profitability or its ability to raise capital and make and maintain necessary capital investments. Accordingly, based on the record in this review, we conclude that, in the event of revocation of the order,subject imports from Japan likely would not have a significant adverse impact on the domestic industrywithin a reasonably foreseeable time.
CONCLUSION
For the above-stated reasons, we determine that revocation of the antidumping duty order oninternal combustion industrial forklift trucks from Japan would not be likely to lead to continuation orrecurrence of material injury to an industry in the United States within a reasonably foreseeable time.

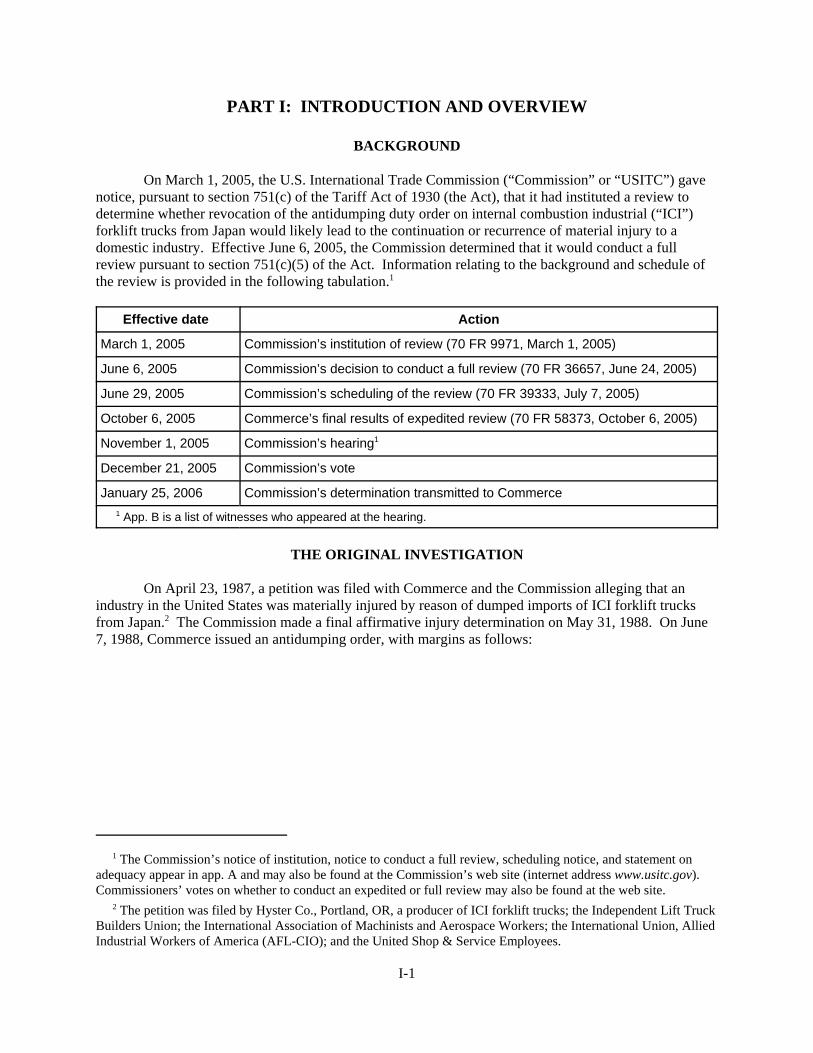
1 The Commission’s notice of institution, notice to conduct a full review, scheduling notice, and statement onadequacy appear in app. A and may also be found at the Commission’s web site (internet address www.usitc.gov). Commissioners’ votes on whether to conduct an expedited or full review may also be found at the web site. 2 The petition was filed by Hyster Co., Portland, OR, a producer of ICI forklift trucks; the Independent Lift TruckBuilders Union; the International Association of Machinists and Aerospace Workers; the International Union, AlliedIndustrial Workers of America (AFL-CIO); and the United Shop & Service Employees.
I-1
PART I: INTRODUCTION AND OVERVIEW
BACKGROUND
On March 1, 2005, the U.S. International Trade Commission (“Commission” or “USITC”) gavenotice, pursuant to section 751(c) of the Tariff Act of 1930 (the Act), that it had instituted a review todetermine whether revocation of the antidumping duty order on internal combustion industrial (“ICI”)forklift trucks from Japan would likely lead to the continuation or recurrence of material injury to adomestic industry. Effective June 6, 2005, the Commission determined that it would conduct a fullreview pursuant to section 751(c)(5) of the Act. Information relating to the background and schedule ofthe review is provided in the following tabulation.1
Effective date Action
March 1, 2005 Commission’s institution of review (70 FR 9971, March 1, 2005)
June 6, 2005 Commission’s decision to conduct a full review (70 FR 36657, June 24, 2005)
June 29, 2005 Commission’s scheduling of the review (70 FR 39333, July 7, 2005)
October 6, 2005 Commerce’s final results of expedited review (70 FR 58373, October 6, 2005)
November 1, 2005 Commission’s hearing1
December 21, 2005 Commission’s vote
January 25, 2006 Commission’s determination transmitted to Commerce
1 App. B is a list of witnesses who appeared at the hearing.
THE ORIGINAL INVESTIGATION
On April 23, 1987, a petition was filed with Commerce and the Commission alleging that anindustry in the United States was materially injured by reason of dumped imports of ICI forklift trucksfrom Japan.2 The Commission made a final affirmative injury determination on May 31, 1988. On June7, 1988, Commerce issued an antidumping order, with margins as follows:

I-2
Manufacturer/producer/exporter Weighted-average margin (percent)1
Toyota Motor 17.29
Nissan Motor 51.33
Komatsu Forklift 47.50
Sumitomo-Yale 51.33
TCM2 51.33
Sanki Industrial 13.65
Kasagi Forklift 56.81
Mitsubishi (3)
All others 39.45
1 Internal Combustion Industrial Forklift Trucks from Japan; Antidumping Duty Order and Amendment to Final Determination ofSales at Less Than Fair Value, 53 FR 20882, June 7, 1988. Subsequent to the publication of the Department of Commerce’sfinal determination, Komatsu Forklift made allegations that certain clerical errors had been made. After review, Commerceamended its final determination to correct these errors and changed Komatsu Forklifts’ weighted average dumping margin from47.73 percent to 47.50 percent and the “all others” rate from 39.50 percent to 39.45 percent. 2 TCM was formerly named Toyo Umpanki Co., Ltd. 3 Mitsubishi did not initially receive a separate margin. As part of Commerce’s first annual review of the order, however, thecompany received a margin of 39.45 percent.
Source: 53 FR 20882, June 7, 1988.
THE FIRST FIVE-YEAR REVIEW
The Commission instituted its first review of the subject order on April 1, 1999. On July 2, 1999,the Commission determined that a full sunset review of the antidumping duty order on ICI forklift trucksfrom Japan should proceed. On August 5, 1999, the Commission received the final results ofCommerce’s expedited sunset review. Commerce determined that dumping was likely to continue if theantidumping duty order on ICI forklift trucks was revoked, and estimated the likely margins of dumpingas follows:
Manufacturer/producer/exporter Weighted-average margin (percent)
Toyota Motor 47.79
Nissan Motor 51.33
Komatsu Forklift 47.50
Sumitomo-Yale 51.33
TCM 51.33
Sanki Industrial 13.65
Kasagi Forklift 56.81
Mitsubishi 39.45
All others 39.45
Source: 64 FR 42662, August 5, 1999.
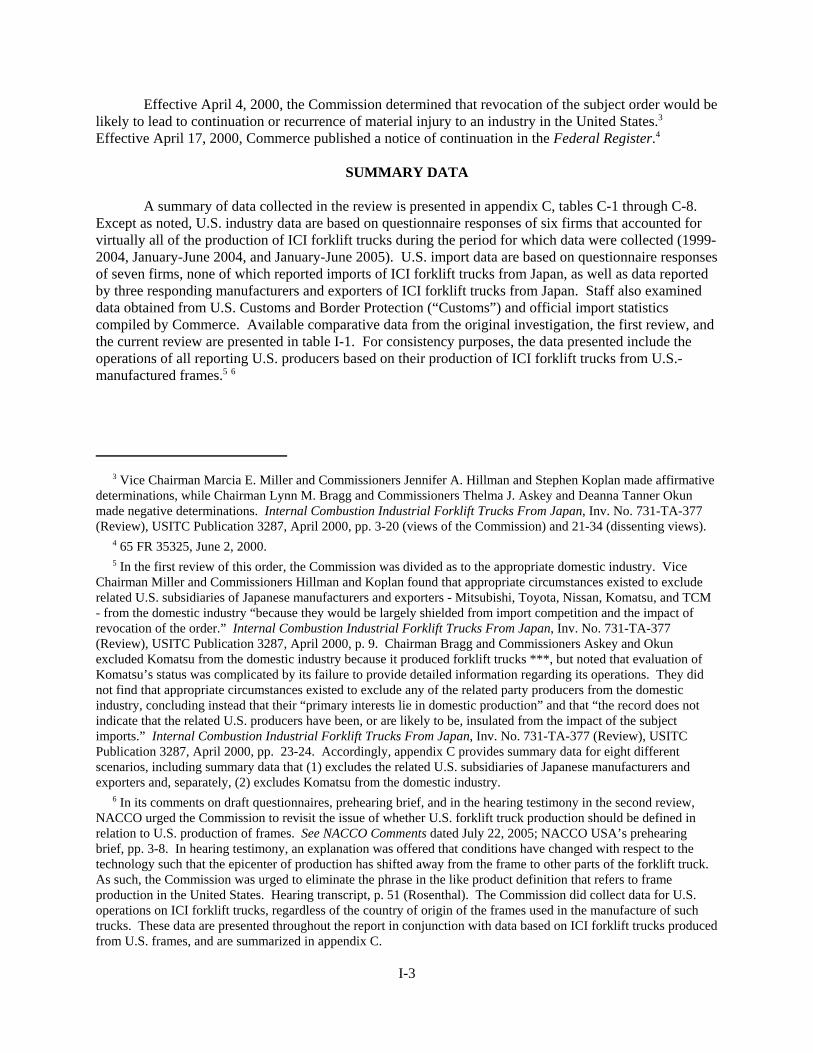
3 Vice Chairman Marcia E. Miller and Commissioners Jennifer A. Hillman and Stephen Koplan made affirmativedeterminations, while Chairman Lynn M. Bragg and Commissioners Thelma J. Askey and Deanna Tanner Okunmade negative determinations. Internal Combustion Industrial Forklift Trucks From Japan, Inv. No. 731-TA-377(Review), USITC Publication 3287, April 2000, pp. 3-20 (views of the Commission) and 21-34 (dissenting views). 4 65 FR 35325, June 2, 2000. 5 In the first review of this order, the Commission was divided as to the appropriate domestic industry. ViceChairman Miller and Commissioners Hillman and Koplan found that appropriate circumstances existed to excluderelated U.S. subsidiaries of Japanese manufacturers and exporters - Mitsubishi, Toyota, Nissan, Komatsu, and TCM- from the domestic industry “because they would be largely shielded from import competition and the impact ofrevocation of the order.” Internal Combustion Industrial Forklift Trucks From Japan, Inv. No. 731-TA-377(Review), USITC Publication 3287, April 2000, p. 9. Chairman Bragg and Commissioners Askey and Okunexcluded Komatsu from the domestic industry because it produced forklift trucks ***, but noted that evaluation ofKomatsu’s status was complicated by its failure to provide detailed information regarding its operations. They didnot find that appropriate circumstances existed to exclude any of the related party producers from the domesticindustry, concluding instead that their “primary interests lie in domestic production” and that “the record does notindicate that the related U.S. producers have been, or are likely to be, insulated from the impact of the subjectimports.” Internal Combustion Industrial Forklift Trucks From Japan, Inv. No. 731-TA-377 (Review), USITCPublication 3287, April 2000, pp. 23-24. Accordingly, appendix C provides summary data for eight differentscenarios, including summary data that (1) excludes the related U.S. subsidiaries of Japanese manufacturers andexporters and, separately, (2) excludes Komatsu from the domestic industry. 6 In its comments on draft questionnaires, prehearing brief, and in the hearing testimony in the second review,NACCO urged the Commission to revisit the issue of whether U.S. forklift truck production should be defined inrelation to U.S. production of frames. See NACCO Comments dated July 22, 2005; NACCO USA’s prehearingbrief, pp. 3-8. In hearing testimony, an explanation was offered that conditions have changed with respect to thetechnology such that the epicenter of production has shifted away from the frame to other parts of the forklift truck. As such, the Commission was urged to eliminate the phrase in the like product definition that refers to frameproduction in the United States. Hearing transcript, p. 51 (Rosenthal). The Commission did collect data for U.S.operations on ICI forklift trucks, regardless of the country of origin of the frames used in the manufacture of suchtrucks. These data are presented throughout the report in conjunction with data based on ICI forklift trucks producedfrom U.S. frames, and are summarized in appendix C.
I-3
Effective April 4, 2000, the Commission determined that revocation of the subject order would belikely to lead to continuation or recurrence of material injury to an industry in the United States.3 Effective April 17, 2000, Commerce published a notice of continuation in the Federal Register.4
SUMMARY DATA
A summary of data collected in the review is presented in appendix C, tables C-1 through C-8. Except as noted, U.S. industry data are based on questionnaire responses of six firms that accounted forvirtually all of the production of ICI forklift trucks during the period for which data were collected (1999-2004, January-June 2004, and January-June 2005). U.S. import data are based on questionnaire responsesof seven firms, none of which reported imports of ICI forklift trucks from Japan, as well as data reportedby three responding manufacturers and exporters of ICI forklift trucks from Japan. Staff also examineddata obtained from U.S. Customs and Border Protection (“Customs”) and official import statisticscompiled by Commerce. Available comparative data from the original investigation, the first review, andthe current review are presented in table I-1. For consistency purposes, the data presented include theoperations of all reporting U.S. producers based on their production of ICI forklift trucks from U.S.-manufactured frames.5 6

I-4
Table I-1ICI forklift trucks: Summary data from the original investigation, the first review, and the current review,1985-87 and 1997-20041
(Quantity in number of trucks; value in 1,000 dollars; unit values, unit labor costs,and unit financial data are per truck)
Item 1985 1986 1987 1997 1998 1999 2000 2001 2002 2003 2004
U.S. consumption quantity:Amount 43,293 44,376 46,152 69,590 85,747 62,739 66,210 48,763 40,600 46,484 56,837
Producers’ share2 *** *** *** 76.2 78.1 80.8 78.9 78.7 78.1 74.6 74.1
Importer’s share:
Japan2 51.3 49.6 51.4 0.1 (3) *** *** 0.0 0.0 0.0 0.0
All other countries2 *** *** *** 23.7 21.9 *** *** 21.3 21.9 25.4 25.9
Total imports2 *** *** *** 23.8 21.9 19.2 21.1 21.3 21.9 25.4 25.9
U.S. consumption value:Amount 587,624 607,285 629,340 1,174,709 1,476,009 1,213,424 1,246,257 955,332 783,390 903,459 1,156,961
Producers’ share2 *** *** *** 82.7 81.3 80.9 78.5 78.2 76.6 73.3 73.3
Importer’s share:
Japan2 42.3 42.1 46.3 0.1 (3) *** *** 0.0 0.0 0.0 0.0
All other countries2 *** *** *** 17.2 18.7 *** *** 21.8 23.4 26.7 26.7
Total imports2 *** *** *** 17.3 18.7 19.1 21.5 21.8 23.4 26.7 26.7
U.S. imports from--Japan:
Quantity 22,191 21,999 23,730 84 18 *** *** 0 0 0 0
Value 248,465 255,938 291,442 979 243 *** *** 0 0 0 0
Unit value $11,197 $11,634 $12,282 $11,653 $13,693 $*** $*** (4) (4) (4) (4)
All other countries:
Quantity *** *** *** 16,500 18,766 *** *** 10,388 8,899 11,818 14,699
Value *** *** *** 202,255 275,514 *** *** 208,453 183,674 241,199 308,419
Unit value *** *** *** $12,258 $14,682 $*** $*** $20,067 $20,640 $20,409 $20,982
All countries:
Quantity *** *** *** 16,584 18,784 12,027 13,969 10,388 8,899 11,818 14,699
Value *** *** *** 203,234 275,757 231,829 267,608 208,453 183,674 241,199 308,419
Unit value *** *** *** $12,255 $14,681 $19,276 $19,157 $20,067 $20,640 $20,409 $20,982Table continued on next page.
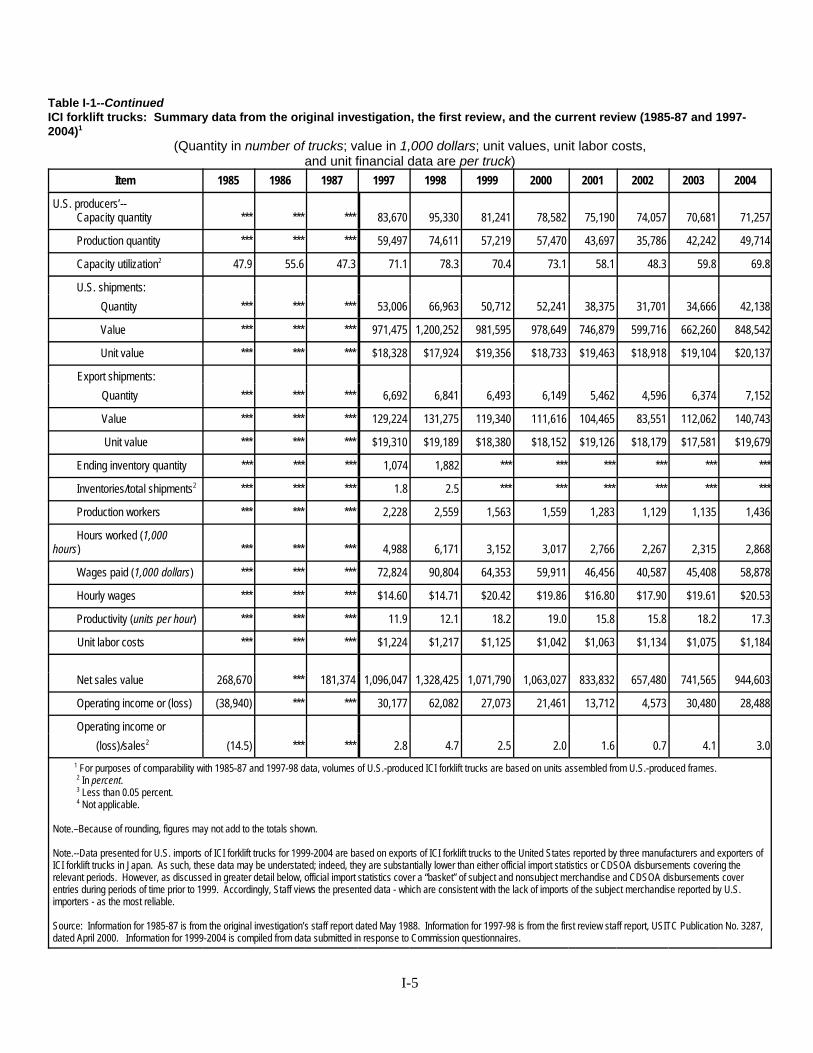
I-5
Table I-1--ContinuedICI forklift trucks: Summary data from the original investigation, the first review, and the current review (1985-87 and 1997-2004)1
(Quantity in number of trucks; value in 1,000 dollars; unit values, unit labor costs,and unit financial data are per truck)
Item 1985 1986 1987 1997 1998 1999 2000 2001 2002 2003 2004
U.S. producers’--Capacity quantity *** *** *** 83,670 95,330 81,241 78,582 75,190 74,057 70,681 71,257
Production quantity *** *** *** 59,497 74,611 57,219 57,470 43,697 35,786 42,242 49,714
Capacity utilization2 47.9 55.6 47.3 71.1 78.3 70.4 73.1 58.1 48.3 59.8 69.8
U.S. shipments:
Quantity *** *** *** 53,006 66,963 50,712 52,241 38,375 31,701 34,666 42,138
Value *** *** *** 971,475 1,200,252 981,595 978,649 746,879 599,716 662,260 848,542
Unit value *** *** *** $18,328 $17,924 $19,356 $18,733 $19,463 $18,918 $19,104 $20,137
Export shipments:
Quantity *** *** *** 6,692 6,841 6,493 6,149 5,462 4,596 6,374 7,152
Value *** *** *** 129,224 131,275 119,340 111,616 104,465 83,551 112,062 140,743
Unit value *** *** *** $19,310 $19,189 $18,380 $18,152 $19,126 $18,179 $17,581 $19,679
Ending inventory quantity *** *** *** 1,074 1,882 *** *** *** *** *** ***
Inventories/total shipments2 *** *** *** 1.8 2.5 *** *** *** *** *** ***
Production workers *** *** *** 2,228 2,559 1,563 1,559 1,283 1,129 1,135 1,436
Hours worked (1,000hours) *** *** *** 4,988 6,171 3,152 3,017 2,766 2,267 2,315 2,868
Wages paid (1,000 dollars) *** *** *** 72,824 90,804 64,353 59,911 46,456 40,587 45,408 58,878
Hourly wages *** *** *** $14.60 $14.71 $20.42 $19.86 $16.80 $17.90 $19.61 $20.53
Productivity (units per hour) *** *** *** 11.9 12.1 18.2 19.0 15.8 15.8 18.2 17.3
Unit labor costs *** *** *** $1,224 $1,217 $1,125 $1,042 $1,063 $1,134 $1,075 $1,184
Net sales value 268,670 *** 181,374 1,096,047 1,328,425 1,071,790 1,063,027 833,832 657,480 741,565 944,603
Operating income or (loss) (38,940) *** *** 30,177 62,082 27,073 21,461 13,712 4,573 30,480 28,488
Operating income or
(loss)/sales2 (14.5) *** *** 2.8 4.7 2.5 2.0 1.6 0.7 4.1 3.0
1 For purposes of comparability with 1985-87 and 1997-98 data, volumes of U.S.-produced ICI forklift trucks are based on units assembled from U.S.-produced frames.2 In percent.3 Less than 0.05 percent.4 Not applicable.
Note.–Because of rounding, figures may not add to the totals shown.
Note.--Data presented for U.S. imports of ICI forklift trucks for 1999-2004 are based on exports of ICI forklift trucks to the United States reported by three manufacturers and exporters ofICI forklift trucks in Japan. As such, these data may be understated; indeed, they are substantially lower than either official import statistics or CDSOA disbursements covering therelevant periods. However, as discussed in greater detail below, official import statistics cover a “basket” of subject and nonsubject merchandise and CDSOA disbursements coverentries during periods of time prior to 1999. Accordingly, Staff views the presented data - which are consistent with the lack of imports of the subject merchandise reported by U.S.importers - as the most reliable.
Source: Information for 1985-87 is from the original investigation’s staff report dated May 1988. Information for 1997-98 is from the first review staff report, USITC Publication No. 3287,dated April 2000. Information for 1999-2004 is compiled from data submitted in response to Commission questionnaires.

I-6
STATUTORY CRITERIA AND ORGANIZATION OF THE REPORT
Section 751(c) of the Act requires Commerce and the Commission to conduct a review no laterthan five years after the issuance of an antidumping or countervailing duty order or the suspension of aninvestigation to determine whether revocation of the order or termination of the suspended investigation“would be likely to lead to continuation or recurrence of dumping or a countervailable subsidy (as thecase may be) and of material injury.”
Section 752(a) of the Act provides that in making its determination of likelihood of continuationor recurrence of material injury–
(1) IN GENERAL.-- . . . the Commission shall determine whether revocation ofan order, or termination of a suspended investigation, would be likely to lead tocontinuation or recurrence of material injury within a reasonably foreseeable time. TheCommission shall consider the likely volume, price effect, and impact of imports of thesubject merchandise on the industry if the order is revoked or the suspended investigationis terminated. The Commission shall take into account--
(A) its prior injury determinations, including the volume, priceeffect, and impact of imports of the subject merchandise on the industrybefore the order was issued or the suspension agreement was accepted,
(B) whether any improvement in the state of the industry isrelated to the order or the suspension agreement,
(C) whether the industry is vulnerable to material injury if theorder is revoked or the suspension agreement is terminated, and
(D) in an antidumping proceeding . . ., (Commerce’s findings)regarding duty absorption . . ..
(2) VOLUME.--In evaluating the likely volume of imports of the subjectmerchandise if the order is revoked or the suspended investigation is terminated, theCommission shall consider whether the likely volume of imports of the subjectmerchandise would be significant if the order is revoked or the suspended investigation isterminated, either in absolute terms or relative to production or consumption in theUnited States. In so doing, the Commission shall consider all relevant economic factors,including--
(A) any likely increase in production capacity or existing unusedproduction capacity in the exporting country,
(B) existing inventories of the subject merchandise, or likelyincreases in inventories,
(C) the existence of barriers to the importation of suchmerchandise into countries other than the United States, and
(D) the potential for product-shifting if production facilities inthe foreign country, which can be used to produce the subjectmerchandise, are currently being used to produce other products.
(3) PRICE.--In evaluating the likely price effects of imports of the subjectmerchandise if the order is revoked or the suspended investigation is terminated, theCommission shall consider whether--
(A) there is likely to be significant price underselling by importsof the subject merchandise as compared to domestic like products, and

7 No U.S. importer reported importing the subject merchandise from Japan during the period for which data werecollected in this second review, nor did ***. Only ***.
I-7
(B) imports of the subject merchandise are likely to enter theUnited States at prices that otherwise would have a significantdepressing or suppressing effect on the price of domestic like products.
(4) IMPACT ON THE INDUSTRY.--In evaluating the likely impact of imports ofthe subject merchandise on the industry if the order is revoked or the suspendedinvestigation is terminated, the Commission shall consider all relevant economic factorswhich are likely to have a bearing on the state of the industry in the United States,including, but not limited to--
(A) likely declines in output, sales, market share, profits,productivity, return on investments, and utilization of capacity,
(B) likely negative effects on cash flow, inventories, employment,wages, growth, ability to raise capital, and investment, and
(C) likely negative effects on the existing development andproduction efforts of the industry, including efforts to develop aderivative or more advanced version of the domestic like product.
The Commission shall evaluate all such relevant economic factors . . . within the contextof the business cycle and the conditions of competition that are distinctive to the affectedindustry.
Section 752(a)(6) of the Act states further that in making its determination, “the Commission mayconsider the magnitude of the margin of dumping or the magnitude of the net countervailable subsidy. Ifa countervailable subsidy is involved, the Commission shall consider information regarding the nature ofthe countervailable subsidy and whether the subsidy is a subsidy described in Article 3 or 6.1 of theSubsidies Agreement.”
Information obtained during the course of this second review that relates to the above factors ispresented throughout this report. U.S. industry data are based on questionnaire responses of six producersthat accounted for virtually all of U.S. production of ICI forklift trucks during 2004. U.S. import data arebased on questionnaire data provided by U.S. importers (for imports from nonsubject countries) and fromdata provided by three of the Japanese manufacturers and exporters (for subject imports from Japan).7 Responses by U.S. producers, importers, and purchasers of ICI forklift trucks and producers of theproduct in Japan to a series of questions concerning the significance of the existing antidumping dutyorder and the likely effects of its revocation are presented in appendix D.
ADMINISTRATIVE REVIEWS
Pursuant to section 751(a) of the Tariff Act of 1930, at least once during each 12-month periodbeginning on the anniversary date of an antidumping order, Commerce is to conduct an administrativereview of the order upon request. Since the imposition of this order, there have been four administrative

8 See Internal Combustion Industrial Forklift Trucks from Japan; Final Results of Antidumping DutyAdministrative Review, 57 FR 3167, January 28, 1992, as amended by 60 FR 21499, May 2, 1995 (rectifyingtypographical error and correcting Mitsubishi’s margin to read 39.45 percent from its original 39.15 percent), and 60FR 30518, June 9, 1995 (adjustment of Nissan Motor, TCM, and Toyota Motor margins after remands from theCourt of International Trade in Toyota Motor Sales, U.S.A., Inc. v. United States; Toyo Umpanki Co., Ltd. v. UnitedStates; and Hyster Co. v. United States); Internal Combustion Industrial Forklift Trucks from Japan; Final Results ofAntidumping Duty Administrative Review, 59 FR 1374, January 10, 1994; Internal Combustion Industrial ForkliftTrucks from Japan; Final Results of Antidumping Duty Administrative Review, 62 FR 34216, June 25, 1997; andInternal Combustion Industrial Forklift Trucks from Japan; Final Results of Antidumping Duty AdministrativeReview, 62 FR 5592, February 6, 1997. 9 Commerce’s notice is presented in app. A.
I-8
reviews,8 in which all the respondents subject to those reviews were found to have continued dumping. Table I-2 presents a summary of specific margins as adjusted by administrative reviews.
Table I-2ICI forklift trucks: LTFV margins as determined by the U.S. Department of Commerceadministrative reviews (percent)
ItemToyotaMotor
NissanMotor
KomatsuForklift
Sumitomo-Yale TCM1
SankiIndustrial
KasagiForklift Mitsubishi
Allothers
First administrative reviewNovember 24, 1987, to May 31, 19892 13.75 7.39 (3) (3) 6.74 (3) (3) 39.45 (3)
Second administrative reviewJune 1, 1989, to May 31, 19904 6.87 (3) (3) (3) 4.48 (3) (3) (3) (3)
Third administrative review June1, 1993, to May 31, 19945 31.58 7.36 (3) (3) 4.48 (3) (3) (3) (3)
Fourth administrative reviewJune 1, 1994, to May 31, 19956 47.79 7.36 (3) (3) 4.48 (3) (3) (3) (3) 1 TCM was formerly named Toyo Umpanki Co., Ltd. 2 57 FR 3167, January, 28, 1992, as amended by 60 FR 21499, May 2, 1995 (rectifying typographical error and correcting Mitsubishi’s margin to read 39.45 percentfrom its original 39.15 percent) and 60 FR 30518, June 9, 1995 (adjustment of Nissan Motor, TCM, and Toyota Motor margins after remands from the Court ofInternational Trade in Toyota Motor Sales, U.S.A., Inc. v. United States; Toyo Umpanki Co., Ltd. v. United States; and Hyster Co. v. United States). 3 Not applicable. 4 59 FR 1374, January 10, 1994. 5 62 FR 34216, June 25, 1997. 6 62 FR 5592, February 6, 1997 as amended by 62 FR 12598, March 17, 1997 (correction of clerical error altering Toyota Motor’s margin from 50.34 percent to47.79 percent).
Source: Federal Register notices of the U.S. Department of Commerce.
COMMERCE’S RESULTS OF EXPEDITED REVIEW
On September 27, 2005, Commerce found that revocation of the antidumping duty order on ICIforklift trucks from Japan would likely lead to continuation or recurrence of dumping as follows:9

I-9
Manufacturer/producer/exporter Weighted-average margin (percent)
Toyota Motor Corp. 47.79
Nissan Motor Co., Ltd. 51.33
Komatsu Forklift Co., Ltd. 47.50
Sumitomo-Yale Co., Ltd. 51.33
TCM1 51.33
Sanki Industrial Co., Ltd 13.65
Kasagi Forklift, Inc. 56.81
Mitsubishi (2)
All others 39.45
1 TCM was formerly named Toyo Umpanki Co., Ltd. 2 Mitsubishi did not receive a separate margin; therefore, the “all others” margin of 39.45 percent applies.
Source: 70 FR 58373, October 6, 2005.
Commerce has not issued a duty absorption finding with respect to this order.
CONTINUED DUMPING AND SUBSIDY OFFSET ACT
Table I-3 presents available data from Customs concerning the actual duties disbursed pursuant tothe antidumping duty order on ICI forklift trucks from Japan since fiscal year 2001.
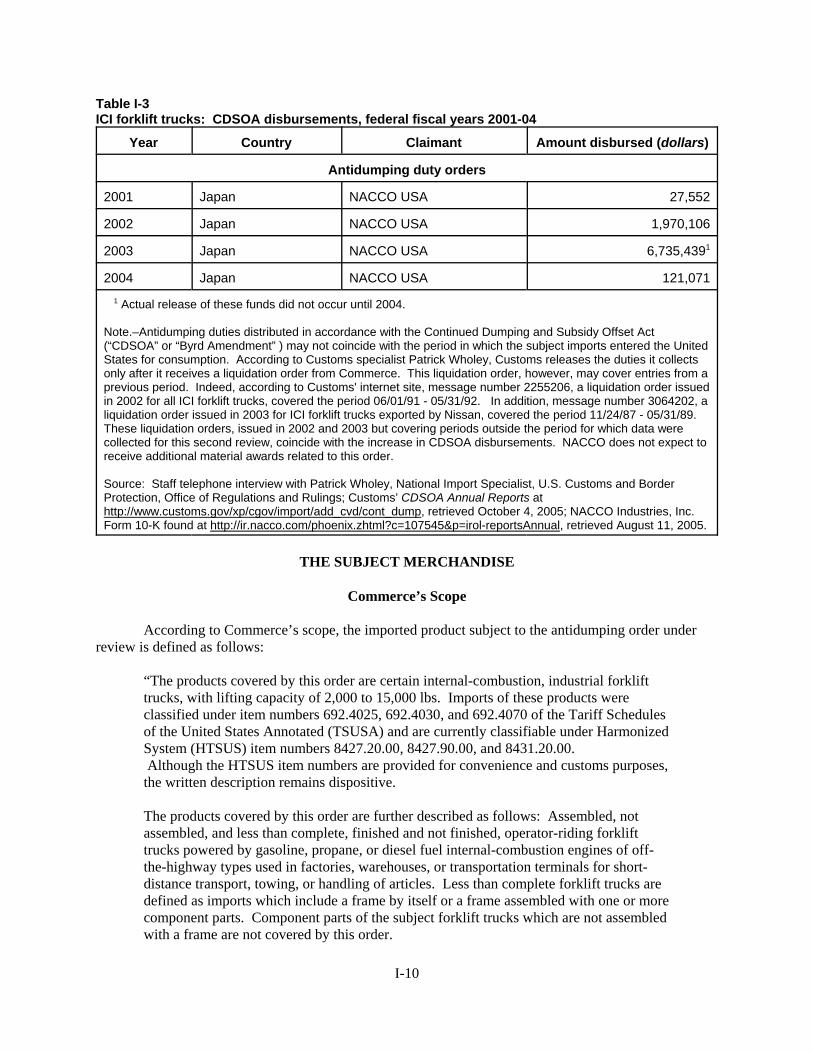
I-10
Table I-3ICI forklift trucks: CDSOA disbursements, federal fiscal years 2001-04
Year Country Claimant Amount disbursed (dollars)
Antidumping duty orders
2001 Japan NACCO USA 27,552
2002 Japan NACCO USA 1,970,106
2003 Japan NACCO USA 6,735,4391
2004 Japan NACCO USA 121,071
1 Actual release of these funds did not occur until 2004.
Note.–Antidumping duties distributed in accordance with the Continued Dumping and Subsidy Offset Act(“CDSOA” or “Byrd Amendment” ) may not coincide with the period in which the subject imports entered the UnitedStates for consumption. According to Customs specialist Patrick Wholey, Customs releases the duties it collectsonly after it receives a liquidation order from Commerce. This liquidation order, however, may cover entries from aprevious period. Indeed, according to Customs' internet site, message number 2255206, a liquidation order issuedin 2002 for all ICI forklift trucks, covered the period 06/01/91 - 05/31/92. In addition, message number 3064202, aliquidation order issued in 2003 for ICI forklift trucks exported by Nissan, covered the period 11/24/87 - 05/31/89. These liquidation orders, issued in 2002 and 2003 but covering periods outside the period for which data werecollected for this second review, coincide with the increase in CDSOA disbursements. NACCO does not expect toreceive additional material awards related to this order.
Source: Staff telephone interview with Patrick Wholey, National Import Specialist, U.S. Customs and BorderProtection, Office of Regulations and Rulings; Customs’ CDSOA Annual Reports athttp://www.customs.gov/xp/cgov/import/add_cvd/cont_dump, retrieved October 4, 2005; NACCO Industries, Inc.Form 10-K found at http://ir.nacco.com/phoenix.zhtml?c=107545&p=irol-reportsAnnual, retrieved August 11, 2005.
THE SUBJECT MERCHANDISE
Commerce’s Scope
According to Commerce’s scope, the imported product subject to the antidumping order underreview is defined as follows:
“The products covered by this order are certain internal-combustion, industrial forklifttrucks, with lifting capacity of 2,000 to 15,000 lbs. Imports of these products wereclassified under item numbers 692.4025, 692.4030, and 692.4070 of the Tariff Schedulesof the United States Annotated (TSUSA) and are currently classifiable under HarmonizedSystem (HTSUS) item numbers 8427.20.00, 8427.90.00, and 8431.20.00. Although the HTSUS item numbers are provided for convenience and customs purposes,the written description remains dispositive.
The products covered by this order are further described as follows: Assembled, notassembled, and less than complete, finished and not finished, operator-riding forklifttrucks powered by gasoline, propane, or diesel fuel internal-combustion engines of off-the-highway types used in factories, warehouses, or transportation terminals for short-distance transport, towing, or handling of articles. Less than complete forklift trucks aredefined as imports which include a frame by itself or a frame assembled with one or morecomponent parts. Component parts of the subject forklift trucks which are not assembledwith a frame are not covered by this order.

10 70 FR 58373, October 6, 2005.
I-11
Products not covered by this order are genuinely used forklifts. For the purposes of thisantidumping duty order, we consider any forklift to be used if, at the time of entry intothe United States, the importer can demonstrate to the satisfaction of the U.S. Customsand Border Protection (CBP) that the forklift was manufactured in a calendar year at leastthree years prior to the year of entry into the United States. The importer must showdocumentation from industrial publications that reconcile the serial number and year ofmanufacture of the forklift. If the calendar year of manufacture is at least three yearsprior to its year of entry into the United States, it will not be subject to the suspension ofliquidation or any assessment of antidumping duties. For example, if a forklift is enteredor withdrawn from warehouse, for consumption in June 1988 and if the importerdemonstrates through industrial publications that the forklift was manufactured in orbefore calendar year 1985, that forklift will not be covered by this order.”10
U.S. Tariff Treatment
Imports of these products are classifiable under Harmonized Tariff Schedule of the United States(HTS) subheadings 8427.20, 8427.90, and 8431.20 as set forth in the following tabulation:
General1 Special2 Column 23
HTS provision Article description Rates (percent ad valorem)8427
8427.20
8427.20.40
8427.20.80
8427.90.00
8431
8431.20.00
Forklift trucks; other works trucks fitted with liftingor handling equipment:
Other self-propelled trucks:
Rider-type, counterbalanced forklift trucks
Other
Other trucks
Parts suitable for use solely or principally with themachinery of headings 8425 to 8430:
Of machinery heading 8427
Free
Free
Free
Free
Free
(2) 35.0
35.0
35.0
35.0
35.01 Normal trade relations, formerly known as the most-favored-nation duty rate.2 No special rates apply to imports of ICI forklift trucks from certain trading partners to the United States.3 Applies to imports from a small number of countries that do not enjoy normal trade relations duty status.
Source: Harmonized Tariff Schedule of the United States (2005).

11 Nonsubject products covered by these tariff classifications include, e.g., pallet jacks, telehandlers, constructionand mining equipment, cranes and crane parts, horse trailers, manure spreaders, electric forklift trucks, rough terrainforklift trucks, and ICI forklift trucks with over 15,000 pound lift capacity. A range of individual parts oraccessories for ICI forklift trucks entering under additional tariff classifications of HTS Chapters 4, 6, 7, 8, and 9,with duty ranges from zero to 9 percent ad valorem, have been identified by NACCO. These articles or accessoriesinclude, e.g., spark-ignition reciprocating or rotary internal combustion piston engines, liquid pumps or elevators, airor vacuum pumps, air or other gas compressors and fans, and transmission shafts (including camshafts, crankshafts,and cranks; bearing housings, gears and gearing, gear boxes and other speed changers, flywheels and pulleys,clutches and shaft couplings). NACCO USA’s prehearing brief, app. D, pp. 66-73. 12 Essentially, once a good presented to Customs as a “truck” has over 50 percent by value of production of thecharacter of the finished product and such content is attributable to the country claiming origin, origin is conferred. Staff telephone interview with Patrick Wholey, National Import Specialist, U.S. Customs and Border Protection,Office of Regulations and Rulings, November 15, 2005. According to the Code of Federal Regulations: CustomsDuties, origin is conferred by “a change to subheading 8425.11 through 8430.69 from any other subheading,including another subheading within that group.” Code of Federal Regulations: Customs Duties, 19 USC § 102.20,as revised April 1, 2004. 13 The Commission reasoned that “value added calculations necessarily involve the allocation of both U.S. andforeign costs. As the Commission has noted, performing such calculations is a difficult process in any context andone that can result in the derivation of less reliable data. . . Due to the globalized nature of production in thestandard-lift IC (internal combustion) forklift industry, neither the frame approach nor the value added approach islikely to provide a perfect description of U.S. production. However, in light of the factors discussed above, theframe approach in this investigation provides the better picture.” Internal Combustion Industrial Forklift TrucksFrom Japan, Inv. No. 731-TA-377 (Final), USITC Publication 2082, May 1988, pp. 15 and 17.
I-12
These tariff classifications contain subject and nonsubject products.11 Imports under thesesubheadings from Japan and other nations with normal trade relations status are free of duty, whileimports from nations without normal trade relations (column 2) are charged a 35-percent ad valoremtariff.
Country of origin of a product is conferred when a substantial transformation of one article into anew and different article of commerce occurs. With reference to ICI forklift trucks assembled from bothdomestic and imported parts, origin is conferred when a partially finished truck has the essential characterof a finished truck by a subjective quantitative analysis on a case-by-case basis.12 The treatment ofunfinished goods is controlled by HTS general interpretive rule 2(a), which includes as “finished” anunfinished or incomplete good having the essential character of the finished good.
Definition of Production in the Original Investigation
In the original investigation, Commerce and the Commission determined that the frame of thetruck was the identifying feature and its principal component part. Commerce defined “less-than-complete” forklift trucks by the country of origin of the frame to identify the product from Japan underinvestigation. Similarly, the Commission, in the original investigation, used the country of origin of theframe to determine U.S. production. The Commission determined that the frame approach to definingdomestic production would be superior to a value-added approach because an examination of frameproduction was a practical indicator of U.S. production activity due to the amount of research anddevelopment costs, capital investment in plant and equipment, and labor activity related to forklift frameproduction. The Commission found that during the original period of investigation, forklift frameproduction accounted for a significant share of both total research and development and labor costs, andthat frame fabrication accounted for as much as 80 to 90 percent of the investment in plant andequipment. Moreover, the Commission used the frame approach rather than the value-added approachbecause it appeared to be the more practical indicator of domestic production13 and noted that it found nosubject product with a U.S.-produced frame that contained less than 35 percent value added in the United

14 Ibid., p. 6. 15 The Commission found that evidence on the record of the initial five-year review did not suggest a reason forrevisiting the Commission’s original determination of the domestic like product and defined the domestic industry asthe domestic producers of the domestic like product (internal combustion industrial forklift trucks with a weight-liftcapacity of between 2,000 and 15,000 pounds and with a U.S.-produced frame), such as NACCO, Clark, and Drexel. Internal Combustion Industrial Forklift Trucks From Japan, Inv. No. 731-TA-377 (Review), USITC Publication3287, April 2000, pp. 4-9 and 22-23. 16 See NACCO Comments dated July 22, 2005. See also NACCO USA’s prehearing brief, pp. 3-8; hearingtranscript (Mr. Dawe), pp. 22-24. The Commission did collect data for U.S. operations on ICI forklift trucks,regardless of the country of origin of the frames used in the manufacture of such trucks. These data are presentedthroughout the report in conjunction with data based on ICI forklift trucks produced from U.S. frames, and aresummarized in appendix C. 17 ***.
I-13
States, the minimum threshold proposed by the proponents of the value-added approach in the originalinvestigation. Further, the Commission noted that the “the share of U.S. value added for standard lift ICswith a U.S.-produced frame was significantly greater than 50 percent” for “several of the largest U.S.producers.”14
Definition of Production in the Initial and Second Reviews
Absent argument to the contrary, the Commission concluded in the initial review that there wereno facts that contradicted the original definition of production.15 In this second review, however,beginning with its comments on draft questionnaires, NACCO has urged the Commission to revisit theissue of whether U.S. forklift truck production should be defined in relation to U.S. production offrames.16 In determining whether a company qualifies as a domestic producer, the Commission mayemploy a six-factor test to determine whether the company engages in “sufficient-production relatedactivities” in the United States. Under that approach, the Commission looks at the following factors: (1) source and extent of capital investment, (2) technical expertise involved in U.S. production activities,(3) value added to the product in the United States, (4) employment levels, (5) quantity and type of partssourced in the United States, and (6) any other costs and activities in the United States directly leading toproduction of the like product. Information on these six factors may be found as follows:
Source and extent of capital investment Part III, tables III-16 and III-17
Technical expertise involved in U.S. production activities Part I, pages 14-15; Part III, table III-17
Value added to the product in the United States Part I, table I-5; appendix E
Employment levels Part I, table I-4; Part III, table III-8
Quantity and type of parts sourced in the United States Part III, table III-13
Any other costs and activities in the United States directlyleading to production of the like product
Part III, tables III-12a, 12b, III-16, andappendix E
Data submitted by U.S. producers in this second review show that a wide range exists in theamount of labor and resources allocated to frame production as some producers (***) have ***. Moreover, technological advances in recent years have attempted to render frame production less laborintensive. For example, ***.17

18 “PRWs” are production and related workers, including supervisors and all nonsupervisory workers (includinggroup leaders and trainees) engaged in fabricating, processing, assembling, inspecting, receiving, storage, handling,packing, warehousing, shipping, trucking, hauling, maintenance, repair, janitorial and guard services, productdevelopment, auxiliary production for plant’s own use (e.g., power plant), recordkeeping, and other services closelyassociated with the above production operations. 19 See Internal Combustion Industrial Forklift Trucks From Japan, Inv. No. 731-TA-377 (Review), USITC StaffReport, March 2, 2000, p. I-12. 20 This information is compiled from responses to the producers’ questionnaire, question II-17. 21 Kanban (a Japanese term for “signal”) is one of the primary tools of just in time (“JIT”) systems. It signals acycle of replenishment for production and materials and maintains an orderly and efficient flow of materials
(continued...)
I-14
Table I-4 shows the share of production and related worker (“PRW”)18 labor hours U.S. producersallocated to frame construction relative to complete ICI forklift truck production in 2004.
Table I-4ICI forklift trucks: Total hours worked by PRWs and labor hours allocated to frame production in2004, by firms
U.S. producer
Total PRW hoursto produce
complete ICIforklift trucks(1,000 hours)
Frame production
Allocated PRWhours (1,000
hours)Share of total
(percent)
Komatsu USA (1) (1) (1)
Mitsubishi USA *** *** ***
NACCO USA *** *** ***
Nissan USA *** *** ***
TCM USA (1) (1) (1)
Toyota USA *** *** ***
Total *** *** ***
1 Not available. In the case of Komatsu, the company ***. In the case of TCM USA, the company ***.
Source: Compiled from data submitted in response to Commission questionnaires.
In comparison to the first review, total PRW hours to produce complete ICI forklift trucks fellfrom *** hours in 1998 to *** hours in 2004. This decrease may be attributed to decreases by ***. Total PRW hours allocated to frame production rose from *** hours in 1998 to *** hours in 2004,however; ***’s PRW hours allocated to frame production fell from *** in 1998 to *** in 2004 (***percent decrease) and from *** hours in 1998 to *** hours in 2004 (*** percent decrease), respectively. The overall rise in PRW hours allocated to frame production may primarily be attributed to *** allocationof PRW hours to frame production for 2004 in the second review vis-a-vis ***.19
The Commission asked U.S. producers to describe the level of expertise required by, and thedegree of value added, in their U.S. assembly operations.20 NACCO USA reported ***. NACCO USAfurther reported that the company employs kanban techniques to manage the delivery of material to eachwork station.21 ***.
21 (...continued)throughout an entire manufacturing process. The signal is usually a printed card that contains specific informationsuch as a part name, description, quantity, etc. ***, NACCO USA, e-mail November 21, 2005. Kanban isessentially a pull manufacturing system used by NACCO USA to indicate an impending shortage of a component ata station by signaling back to either a central store area that draws automatically material to keep the linereplenished. Kanban is also applied to NACCO’s supplier base such that they are sent signals when components arerequired. Deliveries of components could be daily or weekly in response to a kanban signal. Hearing transcript (Mr.Dawe), pp. 102-104. 22 U.S. producers’ responses were as follows: Komatsu USA responded that customization accounts for ***percent of truck value; Mitsubishi USA responded that customization accounts for *** percent of net sales; NACCOUSA responded that customization accounts for approximately *** percent of the value added and truck value forproduct produced in the Berea, KY plant; Nissan USA responded that customization (including available options andspecial engineered modifications) accounted for approximately *** percent of the net revenues of Nissan USA eachyear for the past couple of years; TCM USA ***; Toyota USA responded that customization represents, on average,approximately *** percent of ICI forklift truck value. E-mails from: ***, Komatsu USA, November 17, 2005; ***,Mitsubishi USA, November 22, 2005; ***, NACCO USA, November 15, 2005; ***, Nissan USA, November 21,2005; and ***, Toyota USA, November 17, 2005.
I-15
***.***.***.***.***.***. Table I-5 shows the percentage of the value of domestic and foreign components, as well as the
domestic value added for U.S. producers’ highest volume model in 2004.
Table I-5ICI forklift trucks: Ratio of the value of foreign components, domestic components, and domesticvalue added for U.S. producers’ highest volume model in 2004, by firms
* * * * * * *
U.S. producers were additionally requested to estimate the contribution of customization to ICIforklift truck value and value added. Their responses indicated that customization accounts for between*** percent and *** percent of a forklift truck’s value, with the majority responding in the *** percentrange.22
Manufacturing Processes
The components of an ICI forklift truck (Class 5) are identified in the following schematic:

23 Staff telephone interview with ***, September 28, 2005. 24 *** producers’ questionnaire response, section III-7b. 25 *** producers’ questionnaire response, section III-13; *** producers’ questionnaire response, section II-17.
I-16
The production of the frame and the mast, with their related components, are the two mostimportant fabrication processes involved in the production of ICI forklift trucks before assembly. Theframe is the base upon which the truck sits. The frame provides the structure for the truck; it is over-engineered to tolerate heavy use and to be long-lasting.23 The frame also includes the overhead guard orcanopy that protects the driver from falling objects. The frame and the canopy are produced from steelplate that is cut to the desired shape and washed, dried, cleaned, rustproofed and then formed to shape bybending. These pieces are then welded to each other to form the completed frame. Finished frames arecleaned and sprayed with a primer coat of paint.
Since 1999, U.S. producer NACCO has been transferring the production of most of its subjectproduct frames to its plant in Saltillo, Mexico. ***.24 ***.25
The production process for the mast of a forklift truck is similar to that of the frame. Channelsteel is cut to length, washed, dried and cleaned. Pieces cut from steel plate are welded to this length, twochannels are welded with cross-pieces and the whole assembly is washed, dried, cleaned, rustproofed andsprayed with a primer coat of paint. The inner and outer rails are then mated, with the number of innerrails determined by the desired extension range, up to four stages, of the mast. Hydraulics, sprockets,chains or cylinders are added to provide lifting capacity. The carriage, the metal piece that is attached tothe mast to hold the forks, may have different shapes depending on the application. The size of the loadbackrest and the forks, as well as the number of forks, also may be selected by the customer based on thenature of the application.

26 NACCO USA’s producers’ questionnaire response, section III-13. 27 Staff plant trip notes, NACCO, Berea, KY, August 23, 2005, p. 10; NACCO USA’s producers’ questionnaireresponse, att. 3, “NMHG Berea, Kentucky”. 28 Toyota USA’s and Nissan USA’s producers’ questionnaire responses, section III-13; TCM USA’s producers’questionnaire response, section III-7b (value added for largest model produced). 29 Mitsubishi USA’s producers’ questionnaire response, section III-13. 30 NACCO USA’s producers’ questioner response, att. 3. 31 ***. 32 ***. 33 The Commission also considered whether domestically produced forklift trucks should be defined as those thatcontain a U.S.-produced frame or a certain minimum level of U.S. value added, and opted for the former approach.
I-17
In 2004, *** percent of the value of NACCO’s ICI truck masts resulted from domesticproduction.26 NACCO asserts that mast production ***.27 In 2004, ***.28 Mitsubishi reported that ***.29
When the frame and related weldments are completed, the frame is taken to a separate productionline where the truck’s engine/transmission combination is mated to the frame. The cowl or dash and thedrive and steering axles are then sub-assembled and fitted. The hydraulic system is added as are theengine and steering controls. When all of the truck’s motive and control systems have been sub-assembled and installed, the mast and counterweight are added. The truck’s engine, steering,transmission, hydraulics and brake systems are then tested for proper operation and leaks. The truck alsois tested for lift capacity, for the range of the upright tilt, and for drift and brakes. When the testing iscompleted, and no fault is detected, the truck is taken to an area for any additional customer-specifiedoptions. When all options have been installed and tested, the truck is sprayed with its final coat of paint.
According to NACCO, *** percent of the ICI forklift trucks it produces at its Berea, KY, facilitycontain special products engineering design – that is, engineering and design services necessary to meetthe customer’s particular needs.30 ***. Truck production at NACCO requires an average of ***throughput time, which does not include lead time; the current backlog for new orders is approximately***.31
The subject product is produced primarily on assembly lines. Production processes for thesubject product have become more technologically advanced since the original investigation and evensince the first review. ***.32
DOMESTIC LIKE PRODUCT ISSUES
The Commission’s determination regarding the appropriate domestic products that are “like” thesubject imported product is based on a number of factors, including (1) physical characteristics and uses;(2) common manufacturing facilities and production employees; (3) interchangeability; (4) customer and producer perceptions; (5) channels of distribution; and, where appropriate, (6) price. In the originalinvestigation, the Commission considered two domestic like product issues: (1) whether internalcombustion forklift trucks with a weight lift capacity of greater than 15,000 pounds should be includedwithin the definition of the domestic like product, and (2) whether trucks powered by other than aninternal combustion engine – in particular, electric motor rider and electric motor narrow-aisle trucks –should be considered within the definition of the domestic like product.33 The Commission did notexpand the domestic like product in either the original investigation or in the first review of this order. NACCO, the only party that responded to the Commission’s notice of institution in this second review,did not ask the Commission to revisit the domestic like product issue with respect to electric forklifttrucks nor with respect to ICI forklift trucks with a lift capacity of greater than 15,000 pounds. However,as noted above, beginning with its comments on draft questionnaires in the second review, NACCO has

34 See, e.g., NACCO Comments dated July 22, 2005. This issue was discussed previously in the section entitled“Definition of Production.” 35 Internal Combustion Industrial Forklift Trucks from Japan, Investigation No. 731-TA-377 (Final), USITCPublication 2082, May 1988, p. 6. 36 ***. 37 ***. 38 Internal Combustion Industrial Forklift Trucks from Japan, Investigation No. 731-TA-377 (Final), USITCPublication 2082, May 1988, pp. 7-9. 39 Electric forklift trucks are powered by batteries, which serve as a significant part of the counterweightnecessary to offset the payload. ICI forklift trucks use a counterweight situated near the rear of the truck’s frame toprevent tipping.
I-18
urged the Commission to revisit the issue of whether U.S. forklift truck production should be defined inrelation to U.S. production of frames.34
ICI Forklift Trucks With Lifting Capacities Over 15,000 Pounds
With regard to trucks with lifting capacity of greater than 15,000 pounds, the Commissiondetermined in the original investigation not to include these trucks within the definition of the domesticlike product.35 The Commission reasoned that the end uses and the manufacturing process of these trucksdiffered from those of standard lift internal combustion forklift trucks with a lifting capacity of 2,000 to15,000 pounds. The Commission cited differing assembly lines and component parts used in theproduction of the two classes of trucks as well as the fact that trucks with capacities greater than 15,000pounds tend to be used by heavy industries with specialized industrial machinery needs such as steel andtimber.
By contrast with the automated production of the subject product, trucks with a lifting capacity ofmore than 15,000 pounds are more likely to be produced one truck at a time in a separate area or “bay”and to use less automated production processes. ***.36 Heavy-lift internal combustion forklifts usecomponentry designed for heavy-duty over-the-road trucks, whereas the standard ICI forklifts use manyautomotive components. There is no indication that these distinctions between the uses andmanufacturing processes for standard and heavy capacity lift trucks have changed since the originalinvestigation.37
Electric Powered Industrial Forklift Trucks
With regard to the second like product issue, in the original investigation the Commissiondetermined that electric powered forklift trucks should not be included in the definition of the domesticlike product because of distinct physical characteristics between electric and internal combustion enginepowered forklift trucks.38 The Commission cited the different component parts and frame design of thetwo types of trucks, which are necessary to accommodate the distinctive power trains.39 Thesedistinctions, the Commission noted, also necessitated a separate assembly line and workers trained indistinctive skilled areas.
Finally, the Commission stated that the two types of trucks had distinct end-user applications. The Commission found that electric powered trucks were used primarily in warehouses and in otherenclosed areas such as refrigerated areas in food processing, meat packaging operations, and publicshowrooms, where it would be impractical, due to exhaust emissions, to use internal combustion enginepowered forklift trucks. In contrast, the Commission found that internal combustion engine poweredforklift trucks are primarily used in outdoor operations where exhaust and air quality concerns are lessthan in indoor operations. Also, it found that because internal combustion engine powered trucks do not
40 Internal Combustion Industrial Forklift Trucks From Japan, Inv. No. 731-TA-377 (Review), USITCPublication 3287, April 2000, p. 6. 41 Unless otherwise indicated, this discussion of physical characteristics and uses and manufacturing processesrelies on that information contained in the Commission’s first review of the subject order. Internal CombustionIndustrial Forklift Trucks from Japan, Inv. No. 731-TA-377 (Review), USITC Publication 3287, April 2000, pp. I-10-12. 42 The ITA’s seven classes of trucks are: Class 1: electric motor rider trucks; Class 2: electric motor narrow aisletrucks; Class 3: electric motorized hand trucks; Class 4: internal combustion engine cushion tire trucks; Class 5:internal combustion engine pneumatic tire trucks; Class 6: electric and internal combustion engine tractors; andClass 7: rough terrain lift trucks. Forklift Trucks and Related Vehicles, USITC Publication 2954, April 1996, p. 1. 43 Pneumatic tires are more suited to varied terrain, as they offer better traction and resiliency in dirt or on asphalt. Cushion tires are rubber tires with a cushioning material woven into the center. Cushion tires are more desirable ontrucks that are primarily used indoors. Ibid., p. 2. 44 U.S. producers’ responses were as follows: Komatsu USA responded that it sold ICI forklift trucks with liftingcapacities ranging from *** pounds to *** pounds; Mitsubishi USA responded that it sold ICI forklift trucks withlifting capacities ranging from *** pounds to *** pounds, ***; NACCO USA responded that it sold ICI forklift
(continued...)
I-19
require their batteries to be charged, they are better suited for continuous use or uses involving steepgrades or long distances.
In the first review, the Commission found that the evidence on the record did not suggest a reasonfor revisiting the Commission’s original determination of the domestic like product. Accordingly, theCommission defined the domestic like product to be industrial, operator-riding internal combustionengine forklift trucks with a weight-lift-capacity of between 2,000 and 15,000 pounds (inclusive) with aU.S.-produced frame.40
The Commission has collected additional information on this issue in this second review. Adiscussion of physical characteristics and uses and manufacturing processes appears below. Informationreceived concerning interchangeability, customer and producer perceptions, channels of distribution, andprices are presented in Part II and Part V.
Physical Characteristics and Uses41
Forklift trucks are self-propelled work trucks with platforms that can be raised and lowered forinsertion under loads to be lifted or transported. The platform is elevated with a hydraulic system. Thesetrucks are used for general materials handling, stacking, and retrieving. Forklift trucks typically arepowered by internal combustion engines using gasoline, diesel, or liquefied petroleum gas (LPG), or byan electric motor. ICI forklift trucks normally are used in outdoor and/or well-ventilated indoorenvironments when continuous operation is important or when ramps or other heavy-duty applications areinvolved.
Operator-riding (rider) forklift trucks are used to reduce operator fatigue. The counterbalancedrider truck is the most widely used for general industrial duty. The Industrial Truck Association (“ITA”),the U.S. industry’s primary trade association, separates forklift trucks and related vehicles into sevenclasses, based primarily on their configuration, motive power, and the type of tires used.42 Classes 4 and5 consist of internal combustion engine counterbalanced forklift trucks with solid rubber “cushion” (Class4) or pneumatic (Class 5) tires.43 Lift capacities for ICI forklift trucks in Classes 4 and 5 range from2,000 to 120,000 pounds. The most popular classes of ICI forklift trucks are those with a lifting capacityof 2,000 to 15,000 pounds, the subject product.
U.S. producers were asked to describe the ICI forklift truck product mix at each company. Theirresponses indicated that although, in general, ICI forklift trucks with lift capacities ranging from 3,000pounds to 15,000 pounds were offered, the largest market is in the 5,000 pound to 6,000 pound ICIforklift trucks which are known throughout the industry as the “heart of the line.”44
44 (...continued)trucks with lifting capacities ranging from *** pounds to *** pounds; Nissan USA responded that it sold ICI forklifttrucks with lifting capacities ranging from *** pounds to *** pounds, ***; TCM USA ***; Toyota USA respondedthat it sold ICI forklift trucks with lifting capacities ranging from *** pounds to *** pounds, with the largestpercentage of ICI forklift trucks *** in the *** pound lift capacity range. E-mails from: ***, Komatsu USA,November 17, 2005; ***, Mitsubishi USA, November 22, 2005; ***, NACCO USA, November 15, 2005; ***,Nissan USA, November 21, 2005; and ***, Toyota USA, November 17, 2005. 45 According to the ITA, in 1988, 27 percent of U.S. factory shipments of forklift trucks were electric riders and46 percent were internal combustion engines (the remainder were motorized hand trucks). In 2004, 28 percent of total shipments were electric rider and 45 percent were internal combustion engine trucks. Industrial TruckAssociation, United States Factory Shipments Table, http://www.indtrk.org/docs/USshipments_table.doc, retrieved September 23, 2005. 46 *** purchasers’ questionnaire response and attached EPA Emissions Standards for New Nonroad Engines. 47 Drickhammer, David, “New and Improved: Today’s Lift Trucks,” Material Handling Management (June 2005).
I-20
The end use for which a forklift truck is intended is a major consideration in whether an internalcombustion or electric-powered forklift truck is selected. When heavy-duty usage is required, customersmore often select ICI forklift trucks because electric trucks with batteries must be recharged periodically,thus taking the unit temporarily out of service during the charging or changing of batteries. Also, ICIforklift trucks are the likely choice when long traveling distances, varied terrain, or the need to climb anddescend ramps are considerations. Although some industry sources have anticipated a shift in demandtowards electric-powered and away from internal combustion engine trucks, the U.S. market shares of thetwo have remained virtually unchanged since the original investigation in 1988.45
Improvements have been made to the motive power of electric and ICI forklift trucks sold in theUnited States since the original investigation and first review. With respect to ICI forklift trucks, in 2002,the U.S. Environmental Protection Agency (“EPA”) adopted two tiers of new emissions standards fornon-road engines including engines over 25 horsepower, those that are contained in the subject product. The first tier of the emissions standards went into effect in 2004 and apply to all new engines sold in theUnited States and any imported engines manufactured after 2004. The 2004 EPA standards are the sameas those adopted earlier by the California Air Resources Board for engines used in California. A secondtier of more stringent standards will go into effect in 2007. Both tiers limit nitrogen, hydrocarbon, andcarbon monoxide emissions and are expected to reduce air pollution and improve the work environmentfor operators of ICI forklift trucks and other workers.46 Improvements to electric forklift trucks includeAC-powered drive and lift systems. AC power reportedly delivers more runtime per battery charge andlower maintenance costs.47
Common Manufacturing Facilities and Production Employees
All of the domestic producers of ICI forklift trucks also produce electric forklift trucks in theUnited States. When asked whether or not each firm anticipated producing, in the future, other productson the same equipment and machinery used in the production of ICI forklift trucks and/or using the sameproduction and related workers employed to produce ICI forklift trucks, the responses were as follows:
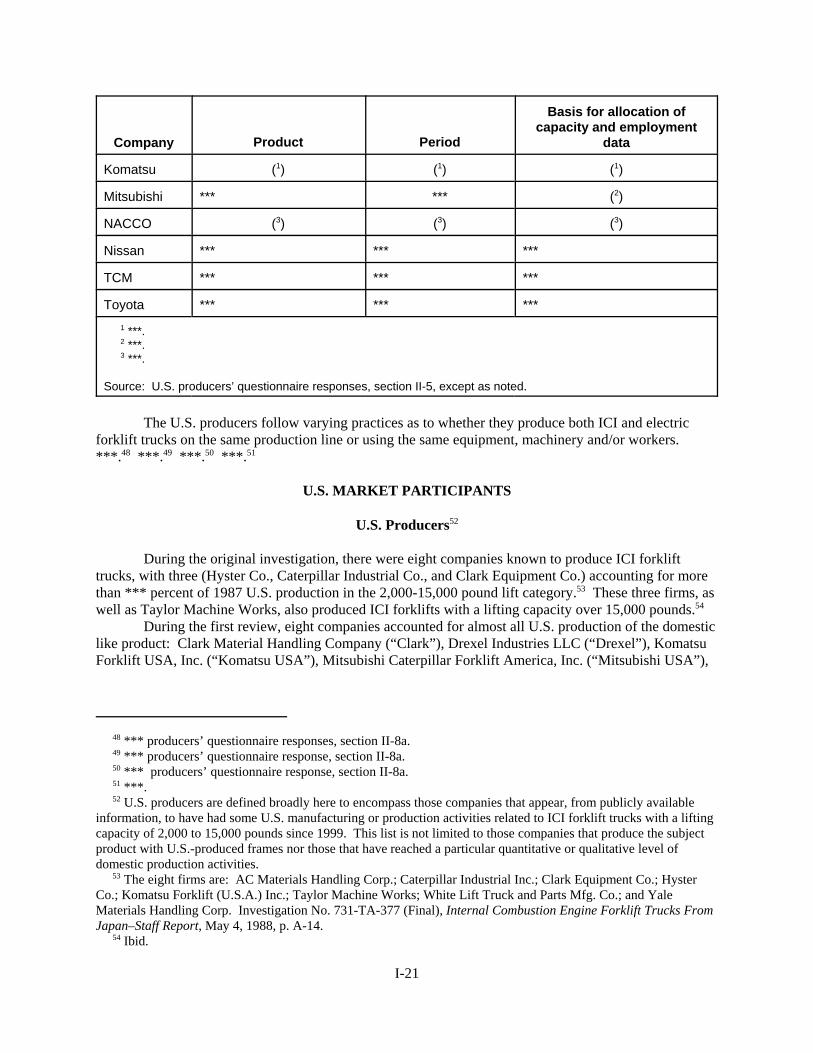
48 *** producers’ questionnaire responses, section II-8a. 49 *** producers’ questionnaire response, section II-8a. 50 *** producers’ questionnaire response, section II-8a. 51 ***. 52 U.S. producers are defined broadly here to encompass those companies that appear, from publicly availableinformation, to have had some U.S. manufacturing or production activities related to ICI forklift trucks with a liftingcapacity of 2,000 to 15,000 pounds since 1999. This list is not limited to those companies that produce the subjectproduct with U.S.-produced frames nor those that have reached a particular quantitative or qualitative level ofdomestic production activities. 53 The eight firms are: AC Materials Handling Corp.; Caterpillar Industrial Inc.; Clark Equipment Co.; HysterCo.; Komatsu Forklift (U.S.A.) Inc.; Taylor Machine Works; White Lift Truck and Parts Mfg. Co.; and YaleMaterials Handling Corp. Investigation No. 731-TA-377 (Final), Internal Combustion Engine Forklift Trucks FromJapan–Staff Report, May 4, 1988, p. A-14. 54 Ibid.
I-21
Company Product Period
Basis for allocation ofcapacity and employment
data
Komatsu (1) (1) (1)
Mitsubishi *** *** (2)
NACCO (3) (3) (3)
Nissan *** *** ***
TCM *** *** ***
Toyota *** *** ***
1 ***. 2 ***. 3 ***. Source: U.S. producers’ questionnaire responses, section II-5, except as noted.
The U.S. producers follow varying practices as to whether they produce both ICI and electricforklift trucks on the same production line or using the same equipment, machinery and/or workers. ***.48 ***.49 ***.50 ***.51
U.S. MARKET PARTICIPANTS
U.S. Producers52
During the original investigation, there were eight companies known to produce ICI forklifttrucks, with three (Hyster Co., Caterpillar Industrial Co., and Clark Equipment Co.) accounting for morethan *** percent of 1987 U.S. production in the 2,000-15,000 pound lift category.53 These three firms, aswell as Taylor Machine Works, also produced ICI forklifts with a lifting capacity over 15,000 pounds.54
During the first review, eight companies accounted for almost all U.S. production of the domesticlike product: Clark Material Handling Company (“Clark”), Drexel Industries LLC (“Drexel”), KomatsuForklift USA, Inc. (“Komatsu USA”), Mitsubishi Caterpillar Forklift America, Inc. (“Mitsubishi USA”),

55 ***, according to the company’s importers’ questionnaire response, section I-3; *** letter to staff, September28, 2005.
I-22
NACCO Materials Handling Group, Inc. (“NACCO USA”), Nissan Forklift Corp. North America(“Nissan USA”), TCM Manufacturing USA, Inc. (“TCM USA”), and Toyota Industrial EquipmentManufacturing, Inc. (“Toyota USA”). Following the cessation of U.S. production by Clark and Drexel,55 the remaining six companies from the first review continue to account for virtually all U.S. production ofICI forklift trucks.
All six domestic producers reported data used in the compilation of this report. U.S. producers,their plant locations, their positions on continuation of the antidumping duty order, and their shares of2004 U.S. production are set forth in table I-6.
Table I-6ICI forklift trucks: U.S. producers, plant locations, positions on continuation of the antidumpingduty order, and shares of U.S. production in 2004
Firm Plant locationsPosition oncontinuation
Share of 2004 U.S. production1
(percent)
Share of 2004 U.S. production2
(percent)
Komatsu USA Covington, GA *** *** ***
Mitsubishi USA Houston, TX *** *** ***
NACCO USA Berea, KYGreenville, NCSulligent, AL *** *** ***
Nissan USA Marengo, IL *** *** ***
TCM USA West Columbia, SC *** *** ***
Toyota USA Columbus, IN *** *** ***
1 U.S. production includes only ICI forklift trucks made with the firms’ U.S.-produced frames or purchased U.S.-produced frames. 1 U.S. production includes ICI forklift trucks made with all frames, imported frames, U.S.-produced frames, andpurchased U.S.-produced frames.
Source: Compiled from data submitted in response to Commission questionnaires.
All six of the U.S. producers have foreign affiliate(s). The country of their affiliate’s productionand the nature of the affiliation are set forth in table I-7.
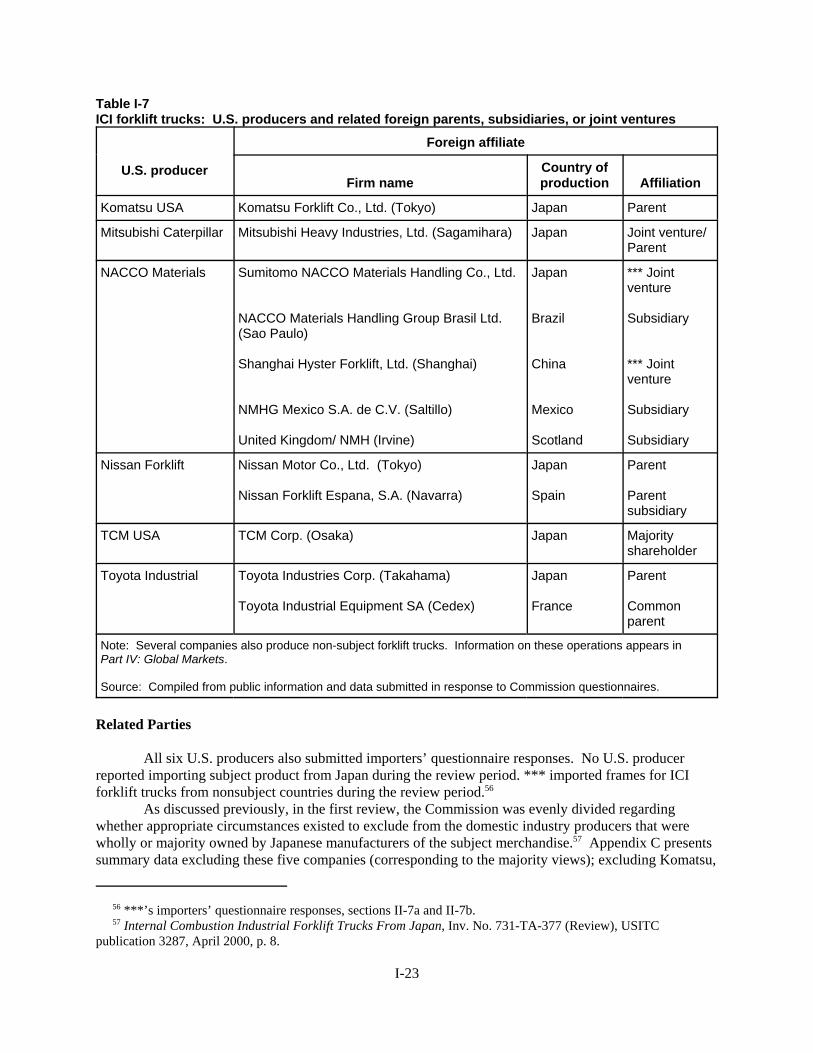
56 ***’s importers’ questionnaire responses, sections II-7a and II-7b. 57 Internal Combustion Industrial Forklift Trucks From Japan, Inv. No. 731-TA-377 (Review), USITCpublication 3287, April 2000, p. 8.
I-23
Table I-7ICI forklift trucks: U.S. producers and related foreign parents, subsidiaries, or joint ventures
U.S. producer
Foreign affiliate
Firm nameCountry ofproduction Affiliation
Komatsu USA Komatsu Forklift Co., Ltd. (Tokyo) Japan Parent
Mitsubishi Caterpillar Mitsubishi Heavy Industries, Ltd. (Sagamihara) Japan Joint venture/Parent
NACCO Materials Sumitomo NACCO Materials Handling Co., Ltd.
NACCO Materials Handling Group Brasil Ltd. (Sao Paulo)
Shanghai Hyster Forklift, Ltd. (Shanghai)
NMHG Mexico S.A. de C.V. (Saltillo)
United Kingdom/ NMH (Irvine)
Japan
Brazil
China
Mexico
Scotland
*** Jointventure
Subsidiary
*** Jointventure
Subsidiary
Subsidiary
Nissan Forklift Nissan Motor Co., Ltd. (Tokyo)
Nissan Forklift Espana, S.A. (Navarra)
Japan
Spain
Parent
Parentsubsidiary
TCM USA TCM Corp. (Osaka) Japan Majorityshareholder
Toyota Industrial Toyota Industries Corp. (Takahama)
Toyota Industrial Equipment SA (Cedex)
Japan
France
Parent
Commonparent
Note: Several companies also produce non-subject forklift trucks. Information on these operations appears in Part IV: Global Markets.
Source: Compiled from public information and data submitted in response to Commission questionnaires.
Related Parties
All six U.S. producers also submitted importers’ questionnaire responses. No U.S. producer reported importing subject product from Japan during the review period. *** imported frames for ICIforklift trucks from nonsubject countries during the review period.56
As discussed previously, in the first review, the Commission was evenly divided regardingwhether appropriate circumstances existed to exclude from the domestic industry producers that werewholly or majority owned by Japanese manufacturers of the subject merchandise.57 Appendix C presentssummary data excluding these five companies (corresponding to the majority views); excluding Komatsu,
58 NACCO USA’s producers’ questionnaire response, section II-10a; hearing transcript, pp. 99-100 (Wilson). 59 Sumitomo-NACCO was formerly called Sumitomo-Yale Co., Ltd. 60 ***. 61 Nacco Industries, Inc.’s Materials Handling Group to Phase out its Danville, Illinois, Assembly Operations,2001 PR Newswire (January 2, 2001). 62 Lift Truck Manufacturer to Shrink Plants, Modern Materials Handling (Jan. 2003). 63 *** producers’ questionnaire response, section II-22. 64 NACCO’s Comments on Commission’s Draft Questionnaires at 2 (July 22, 2005). 65 ***’s producers’ questionnaire response, section I-7; the Hyster website, found at http://www.hyster.com,retrieved August 2, 2005. 66 NACCO Industries, Inc. Form 10-K found athttp://ir.nacco.com/phoenix.zhtml?c=107545&p=irol-reportsAnnual retrieved August 11, 2005.
I-24
Nissan, and TCM (identified by domestic interested parties as the producers most likely to repatriateoperations to Japan); and excluding Komatsu only (corresponding to the dissenting views), from thedomestic industry.
NACCO USA
NACCO USA is a wholly owned subsidiary of NACCO Industries, Inc. of Mayfield Heights,OH. NACCO USA manufactures and sells forklift trucks under the Hyster, Yale, and Sumitomo-Yalebrand names. Hyster and Yale brand trucks are produced on the same assembly lines. NACCO USA hasfacilities in Berea, KY, Greenville, NC, Sulligent, AL, and Portland, OR. NACCO USA employs ***production related workers at its Berea, KY facility. NACCO USA estimates that approximately 2,000employees in all of its U.S. facilities support ICI forklift truck products.58 In Japan, NACCO Materials has a 50-percent-owned joint venture with the Japaneseconglomerate, Sumitomo Heavy Industries, Ltd. (Sumitomo), which is known as Sumitomo-NACCOMaterials Handling Co., Ltd. (Sumitomo-NACCO).59 This joint venture designs and produces forklifttrucks and components in Obu, Japan, which it markets in Japan under the brand name “Sumitomo-Yale”and which are exported for sale by the joint venture to the United States, Europe, and Asia. ******.
NACCO USA has carried out various reorganizations of its production facilities since the firstreview. Currently, the Berea and Greenville plants assemble ICI and electric forklift trucks andmanufacture component parts. The Sulligent facility manufactures component parts for forklift trucks.60 In 2002, NACCO phased out lift truck assembly operations in Danville, IL, limiting that facility to partsdistribution.61 In 2003, NACCO USA shut down its facility in Lenoir, NC, where it manufactured lifttruck masts and cylinders.62 ***.63 NACCO USA also reported that it has “moved much of its frameproduction to its plant in Saltillo, Mexico.”64
NACCO USA operates ICI forklift truck manufacturing and assembly facilities worldwide with plants in the Americas, Europe and the Asia-Pacific region, including in Mexico, Brazil, Ireland,Scotland, Japan, and China.65 NACCO USA does not currently import for sale in the United States anylift trucks or component parts from Sumitomo NACCO, its joint venture operation in Japan, that aresubject to the antidumping duty order.66
NACCO’s worldwide shipments of electric and ICI forklift trucks in 2004 increased byapproximately 10 percent to 77,493 trucks compared with 70,406 trucks in 2003. Due to increased globaldemand, the company’s backlog level increased from 19,100 units in December of 2003 to 25,700 units

67 Ibid. 68 O’Neill, Jeff. Top 20 Lift Truck Suppliers, Modern Materials Handling (August 1, 2005); Forger, Gary. LiftTruck Giants, Modern Materials Handling (August 1, 2004); Top 20 Lift Truck Suppliers, Modern MaterialsHandling (August 1, 2003); and Top 20 Lift Truck Suppliers, Modern Materials Handling (August 1, 2002). 69 Clark plans new facility, more jobs, found at http://www.clarkmhc.com/HL%20Release.pdf, retrieved July 20,2005. 70 ***’s importers’ questionnaire response, sections II-7a and II-7b. 71 Clark plans new facility, more jobs, found at http://www.clarkmhc.com/HL%20Release.pdf, retrieved July 20,2005. 72 O’Neill, Jeff. Top 20 Lift Truck Suppliers, Modern Materials Handling (August 1, 2005); Forger, Gary. LiftTruck Giants, Modern Materials Handling (August 1, 2004); Top 20 Lift Truck Suppliers, Modern MaterialsHandling (August 1, 2003); and Top 20 Lift Truck Suppliers, Modern Materials Handling (August 1, 2002). 73 O’Neill, Jeff. Top 20 Lift Truck Suppliers, Modern Materials Handling (August 1, 2005). 74 Komatsu’s producers’ questionnaire response, sections II-11a and II11b; Komatsu Factbook 2005, found athttp://www.komatsu.com/CompanyInfo/profile/factbook/ retrieved August 1, 2005. 75 Inv. No. 731-TA-377 (Review), Internal Combustion Industrial Forklift Trucks From Japan–Staff Report, March 2, 2000, p. I-25. 76 Ibid. 77 Kalmar’s operations outside the United States and those under its parent firm in Finland were unaffected by thepurchase. In fact, Kalmar Industries Corp. has recently begun manufacturing heavy-capacity forklifts (with liftingcapacities of more than 30,000 pounds) in the United States Kalmar to Assemble Forklifts in the U.S., found athttp://www.forkliftaction.com/newsletter/archive/0218.htm, retrieved July 22, 2005.
I-25
in December of 2004.67 NACCO ranked fourth based on global sales in 2004 and its worldwide holdingshad estimated revenues on ICI and electric global forklift sales of $1.9 billion in 2004, compared to $1.78billion in 2003, $1.6 billion in 2002, and $1.5 billion in 2001.68
Clark
Clark declared bankruptcy in 2000. It completed reorganization and emerged from bankruptcy in2003, with its purchase by Young An Hat of South Korea.69 In January 2005, Clark announced the re-opening of its North American headquarters in Lexington, KY. The 100,000 square foot facility housessales & marketing, customer service engineering, service & support, finance, purchasing, research &development, ISD, as well as a ***.70 Clark anticipates increasing its work force to approximately 150 inthe new facility, with most of the new jobs in research, development and engineering.71 Clark hadestimated worldwide ICI and electric forklift sales revenues of $237 million in 2004, compared torevenues of $237 million in 2003, $207 million in 2002, and $329 million in 2001.72 Clark rankedfourteenth based on global sales in 2004.73
Komatsu USA
Komatsu USA is a wholly owned subsidiary of Komatsu Forklift Co., Ltd (“Komatsu Japan”). Komatsu USA is engaged in the manufacture, import/export and sale of ICI and electric-powered forklifttrucks in the U.S. market, with approximately *** employees at its Covington, GA facility.74 Komatsuestablished initial operations in the United States in 1987. In 1994, Komatsu USA established a newmanufacturing facility located in Covington, GA, which has an annual production capacity ofapproximately ***.75 This facility began production in 1996 using purchased frames from third parties inthe United States and Indonesia.76 In 1999, Komatsu USA purchased Kalmar AC, Inc., the U.S.subsidiary of a Finnish corporation.77 Komatsu USA currently manufactures and sells forklifts under theKomatsu and Kalmar AC brand names ***. In 2004, Komatsu USA accounted for *** percent of theU.S. production of ICI forklift trucks from U.S.-produced frames. Komatsu USA also manufactures
78 Komatsu’s producers’ questionnaire response, sections II-10a, II-10b, II-11a, and II-11b; Komatsu’s importers’questionnaire response, sections II-7a and II-7b; Companies Making News, Material Handling Management, Vol. 56(August 2001). 79 ***, letter to staff, September 28, 2005. 80 O’Neill, Jeff. Top 20 Lift Truck Suppliers, Modern Materials Handling (August 1, 2005). 81 ***. Mitsubishi’s producers’ questionnaire response, section I-4; Roper, Akil Salim, Mitsubishi Venture Looksfor Circles, Private Placement Letter Vol. 18 Issue 23 p. 2 (June 5, 2000). 82 Business & Co. Resource Center, Mitsubishi Caterpillar Forklift America Inc. Company Profile, retrieved July26, 2005; ***’s producers’ questionnaire response, section II-11b. 83 ***. Nissan USA’s producers’ questionnaire response, section I-4. 84 Although NACCO began proceedings to purchase Nissan Forklift in 1999, the negotiations ended without adeal in 2000. See Internal Combustion Industrial Forklift Trucks from Japan, Inv. No. 731-TA-377 (Review) (April2000), p. I-18.
I-26
forklifts for the German company, Linde Lift Truck, for distribution in the United States, Canada, andMexico.78
Landoll
Landoll, located in Marysville, KS, manufactures and sells agriculture, transportation andmaterials handling products. In 2003, Landoll acquired the assets of Drexel of Horsham, PA. Drexel formerly produced *** of subject trucks that were specially designed and sold in small niche markets. Landoll specializes in ***.79 In 2004, Landoll had estimated worldwide sales revenues of $25 million onits forklift products and ranked nineteenth based on global sales.80
Mitsubishi USA
Mitsubishi USA is a joint venture between Mitsubishi Japan and Caterpillar Industrial, Inc. (“Caterpillar”), a subsidiary of Caterpillar, Inc. of Peoria, IL. Mitsubishi Japan holds the majority stake inthe venture and Caterpillar a minority stake.81 Headquartered in Houston, TX, Mitsubishi USAmanufactures and distributes ICI forklifts under the Mitsubishi and Caterpillar brand names. Thecompany has grown since its inception under Mitsubishi from 15 employees in 1988, to the joint venturewith Caterpillar in 1992, to approximately *** ICI forklift truck production workers at Mitsubishi USAtoday.82 In 2004, Mitsubishi USA accounted for *** percent of U.S. production of ICI forklift trucksfrom U.S.-produced frames.
Nissan USA
Nissan USA is a subsidiary of Nissan Motor Co., Ltd. of Tokyo (“Nissan Japan”).83 In 1988,Nissan purchased Barrett Industrial Trucks, Inc. of Marengo, IL, expanded its manufacturing facilitiesand began producing the subject product in the United States (prior to 1988 a Nissan affiliate conductedsales, marketing and distribution for forklifts produced in Japan).84 In 1993, Nissan Motor consolidatedBarrett and Nissan Industrial into its present Nissan USA corporate form. In 1995, a second facility wasopened in Marengo, IL, to meet increased demand for forklift trucks in the United States and Canada.
On May 17, 1999, Nissan Forklift’s parent company announced that it had signed a memorandumof understanding with NACCO regarding a possible sale of Nissan Forklift to NACCO

85 ***. 86 NACCO Announces Termination of Discussions on Nissan’s Global Forklift Truck Business, January 24, 2000,press release by NACCO. 87 ***’s producers’ questionnaire response, section II-10a. 88 ***’s producers’ questionnaire response, section I-8. 89 About Us, TCM USA website, found at: http://www.tcmforklifts.com/about.asp, retrieved July 21, 2005; ***’sproducers’ questionnaire response, section II-11a. 90 About Us, TCM USA website, found at: http://www.tcmforklifts.com/about.asp, retrieved July 21, 2005. 91 ***. Toyota USA’s producers’ questionnaire response, section I-4. 92 Toyota Industrial Equipment Manufacturing Produces Its 200,000th Lift Truck and Expands ManufacturingFacility, found at http://www.toyotaforklift.com/about_us/news/press_releases/0070.aspx, retrieved July 21, 2005;***’s producers’ questionnaire response, section II-10a. 93 About Us, Toyota Material Handling USA website, found at http://www.toyotaforklift.com/about_us retrievedJuly 21, 2005. 94 About Us, Production Plants, Toyota Industrial Equipment Europe website, found athttp://www.toyota-tiee.com/C1256B900060FD0B/PermLink/FXME-5MABQP?OpenDocument, retrieved August16, 2005.
I-27
Materials.85 However, on January 24, 2000, NACCO announced that it was unable to reach an agreementwith Nissan Motor and terminated the original memorandum of understanding. No further negotiationshave been announced.86
Nissan USA had approximately *** ICI forklift truck production workers in 2004.87 Nissan USAreports ***.88 In 2004, Nissan USA accounted for approximately *** percent of the U.S. production ofICI forklift trucks from U.S.-produced frames.
TCM USA
TCM USA was established as a subsidiary of TCM Corp., Tokyo, Japan (“TCM Japan”) inSeptember 1988 with the purchase of a facility in West Columbia, SC, and began U.S. production inJanuary 1989. Subsequent to the commencement of TCM USA operations in West Columbia, its parent,TCM Japan, ***. With approximately *** ICI forklift truck production workers, TCM USA produces ICcushion and pneumatic tire and electric forklift trucks primarily for the North American market.89 Thefacility has the capacity to manufacture over 5,000 lift trucks annually.90 In 2004, TCM USA accountedfor *** percent of the U.S. production of ICI forklift trucks from U.S.-produced frames.
Toyota USA
Toyota USA, located in Columbus, IN, is the U.S. manufacturing plant for Toyota MaterialHandling USA (Torrance, CA), an affiliate of Toyota Material Handling in Japan, which is in turn adivision of Toyota Industries Co. of Japan (Toyota).91 Subsequent to the imposition of the antidumpingduty order, Toyota opened a $60 million U.S. manufacturing facility in Columbus, IN, in 1990. As theToyota Industrial facility began production, it supplanted Toyota Motor’s exports of the subject productfrom Japan. In 2004-05, the facility expanded from 750,223 to 859,023 square feet and employsapproximately *** ICI forklift truck production workers.92 Toyota reports that “more than 99 percent ofthe lift trucks sold in the United States are manufactured in North America.”93 In 2004, Toyota USAaccounted for *** percent of U.S. production of ICI forklift trucks from U.S.-produced frames. ToyotaUSA also exports ICI forklift trucks to South America, Australia, and Europe.94

95 Internal Combustion Industrial Forklift Trucks From Japan, Inv. No. 731-TA-377 (Final), USITC Staff Report,May 4, 1988, pp. A-23, A-63, and A-69. 96 Nonsubject importers identified at the hearing include: Linde Group (Germany), Daewoo (now DoosanInfracore America Corp.), and Clark (Korea). Hearing transcript, pp. 163-165 (Mr. Wilson). 97 These 16 firms were ***. 98 ICI forklft trucks were described as having a 3-stage life cycle of about 15 years. “The first life is the first fiveyears” when it doesn’t break down under intense usage. As the vehicle becomes less reliable at 8,000 to 10,000hours of operation or about five years, companies look to replace trucks. These used ICI forklift trucks go to asecond market, lighter duty application of approximately 500 hours per year, where a breakdown does not halt aproduction or warehousing operation. Then they go into a third life of very occasional use, for example, liftingabout four loads a week. Hearing transcript, pp. 193-194 (Wilson). 99 These firms and the source of their imports were: ***. 100 Direct sales to end users usually took place when a large, national or multinational customer was involved,while dealer sales accounted for territorial sales to smaller accounts.
I-28
U.S. Importers
In the original investigation, Japan was the largest foreign supplier of ICI forklift trucks to theUnited States, accounting for about 70 percent of total imports during 1985-87. The United Kingdomwas the second largest supplier, accounting for an estimated 15 percent, followed by Korea at about 10percent. U.S. affiliates of the principal Japanese manufacturers accounted for the major portion of subjectimports from Japan. Three U.S. producers imported ICI forklift trucks from Japan during this period with*** accounting for the vast majority of such imports. Imports by the three largest U.S. producers (Hyster,Caterpillar, and Clark) came from countries other than Japan. Caterpillar and Clark *** and Hyster ***.95
There were no known importers of subject ICI forklift trucks from Japan during 2001-04 and onlya limited number of importers of ICI forklift trucks from other countries.96 The Commission sentquestionnaires to 38 firms that included all U.S. producers plus firms identified in U.S. Customs data asimporting product classified in the basket HTS subheadings that included internal combustion engineindustrial forklift trucks. Of the 23 responding firms, *** reported imports of new ICI forklift trucksfrom Japan. Thirteen firms stated that they did not import ICI forklift trucks as defined by theCommission. Further, three firms stated that although they imported forklift trucks within the specifiedlift requirements from Japan since the imposition of the order, these forklifts were “genuinely used”trucks three years or older, which are explicitly excluded from the scope of the original order.97 98 Sevenimporters provided usable questionnaire data regarding their imports of ICI forklift trucks fromnonsubject countries.99 These firms imported ICI forklift trucks from China, Germany, Mexico,Indonesia, South Korea, and the United Kingdom.
U.S. Purchasers
The Commission sent questionnaires to 84 firms that were believed to be purchasers of ICIforklift trucks since 1999. Usable responses were received from 23 purchasers. The geographicaldistribution of the respondents was as follows: California (5), Florida, Illinois, Kentucky, Massachusetts,New Jersey, North Carolina, Ohio (3), Pennsylvania (2), Texas (5), Tennessee, and Utah.
In the original investigation, trucks were either sold directly to end users by the manufacturer,after a successful bid on delivery of a specified truck, or through a dealer network, which either orderedtrucks for inventory, or to a customer’s specification. In 1987 approximately *** percent of a U.S.manufacturers’ shipments were made to dealers.100 Similarly, authorized distribution of imported ICIforklift trucks was made in two ways, either with the foreign company selling directly to domesticaccounts, or with sales being generated entirely independent sales agents. Importers of Japanese-

101 Internal Combustion Industrial Forklift Trucks From Japan, Inv. No. 731-TA-377 (Final), USITC StaffReport, May 4, 1988, p. A-23.
I-29
produced ICI forklift trucks sold primarily to dealers (over *** percent), but also supplied nationalaccounts.101 As discussed in greater detail in Part II of this report, the purchasers responsible for thelargest volumes of U.S.-produced and imported ICI forklift trucks during January 1999-June 2005continued to be U.S. dealers.
APPARENT U.S. CONSUMPTION AND MARKET SHARES
Tables I-8 and I-9 present apparent U.S. consumption for the period for which data were collected(1999-2004, January-June 2004, and January-June 2005). Tables I-10 and I-11 present U.S. marketshares for the same period.
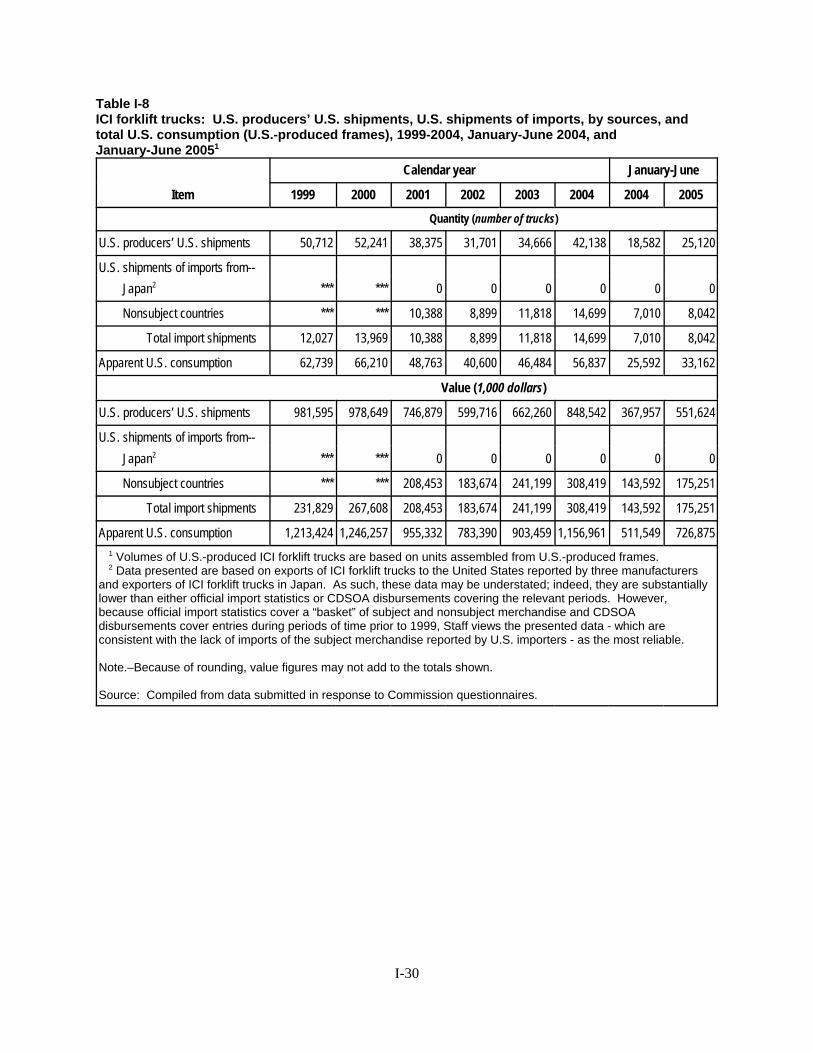
I-30
Table I-8ICI forklift trucks: U.S. producers’ U.S. shipments, U.S. shipments of imports, by sources, andtotal U.S. consumption (U.S.-produced frames), 1999-2004, January-June 2004, and January-June 20051
Item
Calendar year January-June
1999 2000 2001 2002 2003 2004 2004 2005
Quantity (number of trucks)
U.S. producers’ U.S. shipments 50,712 52,241 38,375 31,701 34,666 42,138 18,582 25,120
U.S. shipments of imports from--
Japan2 *** *** 0 0 0 0 0 0
Nonsubject countries *** *** 10,388 8,899 11,818 14,699 7,010 8,042
Total import shipments 12,027 13,969 10,388 8,899 11,818 14,699 7,010 8,042
Apparent U.S. consumption 62,739 66,210 48,763 40,600 46,484 56,837 25,592 33,162
Value (1,000 dollars)
U.S. producers’ U.S. shipments 981,595 978,649 746,879 599,716 662,260 848,542 367,957 551,624
U.S. shipments of imports from--
Japan2 *** *** 0 0 0 0 0 0
Nonsubject countries *** *** 208,453 183,674 241,199 308,419 143,592 175,251
Total import shipments 231,829 267,608 208,453 183,674 241,199 308,419 143,592 175,251
Apparent U.S. consumption 1,213,424 1,246,257 955,332 783,390 903,459 1,156,961 511,549 726,875
1 Volumes of U.S.-produced ICI forklift trucks are based on units assembled from U.S.-produced frames. 2 Data presented are based on exports of ICI forklift trucks to the United States reported by three manufacturersand exporters of ICI forklift trucks in Japan. As such, these data may be understated; indeed, they are substantiallylower than either official import statistics or CDSOA disbursements covering the relevant periods. However,because official import statistics cover a “basket” of subject and nonsubject merchandise and CDSOAdisbursements cover entries during periods of time prior to 1999, Staff views the presented data - which areconsistent with the lack of imports of the subject merchandise reported by U.S. importers - as the most reliable.
Note.–Because of rounding, value figures may not add to the totals shown.
Source: Compiled from data submitted in response to Commission questionnaires.

I-31
Table I-9ICI forklift trucks: U.S. producers’ U.S. shipments, U.S. shipments of imports, by sources, andtotal U.S. consumption (all frames), 1999-2004, January-June 2004, and January-June 20051
Item
Calendar year January-June
1999 2000 2001 2002 2003 2004 2004 2005
Quantity (number of trucks)
U.S. producers’ U.S. shipments *** *** *** *** *** *** *** ***
U.S. shipments of imports from--Japan2 *** *** 0 0 0 0 0 0
Nonsubject countries *** *** 10,388 8,899 11,818 14,699 7,010 8,042
Total import shipments 12,027 13,969 10,388 8,899 11,818 14,699 7,010 8,042
Apparent U.S. consumption *** *** *** *** *** *** *** ***
Value (1,000 dollars)
U.S. producers’ U.S. shipments *** *** *** *** *** *** *** ***
U.S. shipments of imports from--Japan2 *** *** 0 0 0 0 0 0
Nonsubject countries *** *** 208,453 183,674 241,199 308,419 143,592 175,251
Total import shipments 231,829 267,608 208,453 183,674 241,199 308,419 143,592 175,251
Apparent U.S. consumption *** *** *** *** *** *** *** ***
1 Volumes of U.S.-produced ICI forklift trucks are based on units assembled from all frames. 2 Data presented are based on exports of ICI forklift trucks to the United States reported by three manufacturers andexporters of ICI forklift trucks in Japan. As such, these data may be understated; indeed, they are substantially lowerthan either official import statistics or CDSOA disbursements covering the relevant periods. However, because officialimport statistics cover a “basket” of subject and nonsubject merchandise and CDSOA disbursements cover entriesduring periods of time prior to 1999, Staff views the presented data - which are consistent with the lack of imports of thesubject merchandise reported by U.S. importers - as the most reliable.
Note.–Because of rounding, value figures may not add to the totals shown.
Source: Compiled from data submitted in response to Commission questionnaires.

I-32
Table I-10ICI forklift trucks: U.S. consumption and market shares (U.S.-produced frames), 1999-2004January-June 2004, and January-June 20051
Item
Calendar year January-June
1999 2000 1998 2002 2003 2004 2004 2005
Quantity (number of trucks)
Apparent U.S. consumption 62,739 66,210 48,763 40,600 46,484 56,837 25,592 33,162
Value (1,000 dollars)
Apparent U.S. consumption 1,213,424 1,246,257 955,332 783,390 903,459 1,156,961 511,549 726,875
Share of quantity (percent)
U.S. producers’ U.S. shipments 80.8 78.9 78.7 78.1 74.6 74.1 72.6 75.7
U.S. shipments of imports from--
Japan2 *** *** 0.0 0.0 0.0 0.0 0.0 0.0
Nonsubject countries *** *** 21.3 21.9 25.4 25.9 27.4 24.3
Total import shipments 19.2 21.1 21.3 21.9 25.4 25.9 27.4 24.3
Share of value (percent)
U.S. producers’ U.S. shipments 80.9 78.5 78.2 76.6 73.3 73.3 71.9 75.9
U.S. shipments of imports from--
Japan2 *** *** 0.0 0.0 0.0 0.0 0.0 0.0
Nonsubject countries *** *** 21.8 23.4 26.7 26.7 28.1 24.1
Total import shipments 19.1 21.5 21.8 23.4 26.7 26.7 28.1 24.1
1 Volumes of U.S.-produced ICI forklift trucks are based on units assembled from U.S.-produced frames. 2 Data presented are based on exports of ICI forklift trucks to the United States reported by three manufacturersand exporters of ICI forklift trucks in Japan. As such, these data may be understated; indeed, they are substantiallylower than either official import statistics or CDSOA disbursements covering the relevant periods. However,because official import statistics cover a “basket” of subject and nonsubject merchandise and CDSOAdisbursements cover entries during periods of time prior to 1999, Staff views the presented data - which areconsistent with the lack of imports of the subject merchandise reported by U.S. importers - as the most reliable. 3 Less than 0.05 percent
Note.–Because of rounding, figures may not add to the totals shown.
Source: Compiled from data submitted in response to Commission questionnaires.
Table I-11ICI forklift trucks: U.S. consumption and market shares (all frames), 1999-2004 January-June 2004,and January-June 2005
* * * * * * *

1 U.S. producer questionnaire responses of ***, section II-10. Of these six producers, only *** reported selling***. Smaller U.S. producers of ICI forklift trucks (e.g. ***) and importers of some other brands of ICI forklifttrucks reportedly sell to independent distributors, rather than use a dealer network or sell directly to end users; U.S.distributors of ICI forklift trucks unrelated to their suppliers reportedly account for less than 5 percent of U.S. marketvolume (staff telephone interview with ***). 2 *** (staff telephone interview with ***). The staff treated *** (staff telephone interview with ***). *** (e-mail from ***). 3 The countries of origin were Germany, Great Britain, and Korea. In addition, a seventh importer, ***. 4 U.S. importer questionnaire responses of ***, section II-7. 5 U.S. importer questionnaire responses of ***, section II-7. 6 These U.S. producers also produce several other types of material handling equipment, including, but notlimited to, electric forklift trucks and ICI forklift trucks with lift capacities exceeding 15,000 pounds. The producerssell this other equipment directly to their dealers that handle their ICI forklift trucks and directly to national-accountend users. 7 Staff telephone interview with ***.
II-1
PART II: CONDITIONS OF COMPETITION IN THE U.S. MARKET
CHANNELS OF DISTRIBUTION AND MARKET CHARACTERISTICS
Based on questionnaire responses of the six responding U.S. producers, U.S.-produced ICIforklift trucks were shipped in the U.S. market primarily to U.S. dealers, secondarily to U.S. national-account end users, and the remainder to U.S. distributors during January 1999-June 2005. U.S. producersreported shipping 81.6 percent of the total quantity of their U.S.-produced forklift trucks with domesticframes directly to U.S. dealers, 14.0 percent directly to U.S. national-account end users, and theremaining 4.4 percent to U.S. distributors during this period.1 2 Based on combined shipments of U.S.-produced ICI forklift trucks with domestic and imported frames, U.S. producers reported shipping ***percent directly to U.S. dealers, *** percent directly to national-account end users, and the remaining ***percent to distributors during this period. The dealers sell or lease most of their ICI forklift trucks to endusers and rent the remainder, while distributors typically sell to dealers.
Based on questionnaire responses of the six responding U.S. importers of new ICI forklift trucks,all of which involved imported forklift trucks from nonsubject countries,3 56.0 percent of the totalquantity of their imported ICI forklift trucks were shipped to U.S. dealers, 13.2 percent were shippeddirectly to end users, and the remaining 30.8 percent to U.S. distributors during January 1999-June 2005.4 Based on questionnaire responses of the two responding U.S. importers of used ICI forklift trucks fromJapan (at least 3 years old), the total quantity of the imported used products were shipped directly to U.S.end users during January 1999-June 2005.5
The five major U.S. producers of ICI forklift trucks – *** (in descending order) – supply thepredominant share of ICI forklift trucks to the U.S. market.6 All the major U.S. producers rely heavily onextensive dealer networks to market their ICI forklift trucks nationwide to end users; each dealer isassigned a geographic region by its supplier and is required to achieve a certain market share in thatregion.7 Most dealers are unrelated by ownership to the U.S. producers and typically carry a single
8 Twenty of 21 responding U.S. dealers of ICI forklift trucks reported purchasing from a single U.S. producer,and the lone remaining dealer reported purchasing from two suppliers (U.S. purchaser questionnaire responses,section III-20). 9 According to ***, if a dealer carries more than one brand of ICI forklift truck, it generally does not carrycompeting brands. For instance, if a dealer carries *** ICI forklift trucks, it would not carry *** brand, becausethese products are similar and compete with each other (staff telephone interview with ***). 10 U.S. purchaser questionnaire responses, section III-22. 11 Staff telephone interview with ***. 12 U.S. producer questionnaire responses, section IV-A. 13 *** asserted that competitive pressures, with Japanese-owned producers nearly always prominent, often resultin continual erosion of pricing to levels leaving little margin for the manufacturers (U.S. producer questionnaireresponse, section IV-B-4). On the other hand, *** noted that some U.S. producers sell a higher proportion of theirICI forklift trucks to national accounts and asserted that *** sells directly its *** ICI forklift trucks only to nationalaccounts to achieve high volume with low pricing (staff telephone interview with ***). 14 U.S. producer questionnaire responses, section IV-A. *** (U.S. producer questionnaire response, section IV-A). 15 U.S. producer questionnaire response, section IV-A. 16 According to NACCO, the margin structure on the parts side is much greater. As a result, NACCO indicatedthat it is important to get as many ICI forklift trucks into the market to drive the parts business. NACCO sells all ofits parts directly to its dealers, who, in turn, sell those parts directly to their customers or use them to do the servicework on the lift truck. Witnesses reported that NACCO does about $300 million worth of parts business out of itsparts depot in Danville, IL. Hearing transcript, p. 59 (Eklund) and pp. 195-196 (Wilson). 17 U.S. producer questionnaire response, section IV-A. According to ***, its typical contract with a national-account end user will cover *** years.
II-2
producer’s forklift truck brand,8 although some dealers carry two or three brands of forklift trucks.9 Seventeen of 20 responding U.S. purchasers, all dealers, reported that they have not changed suppliers ofICI forklift trucks since 1999, while two dealers reported adding the *** brand and the remaining dealerreported dropping the *** product line.10 *** asserted that the major U.S. producers of ICI forklift trucksprovide extensive technical, service, marketing, and financial support to their dealers,11 which may at leastpartially explain why dealers typically do not shift among brands of ICI forklift trucks.
The end-user customers of the U.S. producers, called national-account end users, negotiatedirectly with the producers for the price and quantity of ICI forklift trucks that they purchase.12 National-account end users typically receive lower prices than other end users that purchase from dealers anddistributors,13 and as a result, many end users want to become national accounts.14 Five of the respondingU.S. producers reported selling to national-account end users and four of these producers (***) suppliedinformation in their questionnaire responses regarding this type of customer.15 The following discussionregarding national-account end users is based on responses of these four U.S. producers.
According to ***, most producers pursue the national account business for volume, potentialaftermarket parts business,16 and market share. All four of these U.S. producers reported that quantitywas a necessary, but not a sufficient, condition to qualify as a national account. While the quantityrequired varies from producer to producer, ranging from a minimum purchase of *** trucks per year for*** to *** trucks per year for ***, each producer also requires the national account to have multiplelocations, either nationally or in regions of two or more dealers, and maintain a minimum fleet sizeranging from *** trucks for *** to *** trucks for ***. Prices negotiated with national-account end usersdepend on a number of factors, including but not necessarily limited to, quantity purchased, competitivepressures, incumbent supplier, type of product being purchased, potential size of the customer’s ICIforklift truck fleet, and length of contract.17

18 Supply, demand, and substitution responses in this section refer to changes that could occur within 12 months,unless otherwise indicated. 19 U.S. producers’ production capacity may change with different production runs, as some ICI forklift trucksrequire more hand welding and additional features/accessories than others, which require longer production times. 20 U.S. purchaser questionnaire responses, section I-7. 21 *** reported importing a total of *** ICI forklift trucks from *** during January 1999-June 2005, of which ***percent were shipped to U.S. dealers, *** percent were exported, and *** percent were held in U.S. inventory (U.S.importer questionnaire responses, section II-7). 22 U.S. importer questionnaire responses, section II-6. 23 Staff telephone interview with ***. 24 Hearing transcript, pp. 173-174 (Dawe).
II-3
SUPPLY AND DEMAND CONSIDERATIONS18
U.S. Supply
U.S. Production
Based on available information, U.S. producers had the ability to respond to changes in demandwith changes in the quantity of shipments of U.S.-produced ICI forklift trucks to the U.S. market duringJanuary 1999-June 2005. This supply responsiveness, however, was greater with ICI forklift trucks builtwith just domestic frames than total ICI forklift trucks built with domestic and imported frames, becausethose built with just domestic frames had lower levels of capacity utilization than total ICI forklifttrucks.19 *** were the only two U.S. producers that reported importing frames for their U.S.-producedICI forklift trucks, although both firms also used some U.S.-produced frames. *** its share of U.S.-produced ICI forklift trucks with imported frames during January 1999-June 2005, as its U.S. productionof frames decreased and its imports of frames increased.
Twenty-two U.S. purchasers (20 dealers, 1 end user, and 1 purchasing U.S. producer) commentedon whether they knew where the frames were produced for the ICI forklift trucks they purchased fromU.S. producers. Twelve purchasers did not know and the remaining 10 purchasers knew whether theframes were produced domestically or imported, but of these latter 10 purchasers, 5 indicated that thisinformation was not important to them, 3 indicated that it was important, and the remaining 2 purchasersdid not comment.20
*** was the only U.S. producer reporting that it also imported ICI forklift trucks, and explainedthat it imported ***,21 which is its single source ***, allowing the firm to maximize economies of scale.22 Although *** reported that it had not imported ICI forklift trucks from Japan in years and that it would bethe only firm importing the *** brand,23 *** reported exporting a total of *** ICI forklift trucks to theUnited States during 1999-2000, but none during January 2001-June 2005.
Production costs of the various U.S. ICI forklift producers may differ as they purchase varyingamounts and types of components and produce other components for their U.S.-produced ICI forklifttrucks. NACCO reported that it must work through third-party suppliers for some of the technology ofcomponent parts that it purchases to produce its U.S.-produced ICI forklift trucks, such as the engine,whereas Mitsubishi, Toyota, and Nissan can leverage a lot of the component parts technology, used intheir U.S.-produced forklift trucks, from their automotive sectors.24 NACCO reported that it purchases its

25 NACCO reported that some of its engines are imported and some are produced in the United States. Hearingtranscript, pp. 157-158 (Dawe). 26 Hearing transcript, p. 134 (Dawe). 27 Hearing transcript, pp. 115-116 (Eklund). 28 U.S. producer questionnaire responses of ***, section IV-C-8. 29 U.S. producer questionnaire responses of ***, section IV-C-9. 30 U.S. producer questionnaire responses of ***, section II-6.
II-4
ICI forklift truck engines from Cummins, Yanmare, General Motors, and Mazda,25 whereas Mitsubishi,Toyota, and Nissan make their own forklift truck engines out of their automotive sector.26
Industry capacity
U.S. producers’ reported capacity utilization in the production of ICI forklift trucks with justdomestic frames and in the production of ICI forklift trucks with domestic and imported frames combinedfluctuated but decreased from 1999 to period lows by 2002, and then increased through 2004 and duringthe interim periods of January-June 2004-05. Capacity utilization in the production of ICI forklift truckswith just domestic frames decreased irregularly from 70.4 percent during 1999 to a period low of 48.3percent in 2002, then increased to 69.8 percent by 2004, and reached 82.3 percent during January-June2005. Capacity utilization in the production of ICI forklift trucks with both domestic and importedframes decreased irregularly from *** percent during 1999 to a period low of *** percent during 2002,then increased to *** percent by 2004, and reached *** percent during January-June 2005. NACCOindicated that covering fixed costs was “incredibly” important in the U.S. industry producing ICI forklifttrucks.27 The substantial fixed costs suggest that low output levels could lead to increased unit costs, suchthat U.S. producers may lower prices to maintain production during a downturn in demand for theirproduct.
Four U.S. producers reported the cost and time required to construct a new ICI forklift truck plantin the United States and two U.S. producers reported the cost and time required to add extra productioncapacity to their existing plants. The estimated costs for a new plant ranged from $21 million to $80million and would require from 18 months to more than three years to build, depending on the annualcapacity,28 while adding capacity was estimated to cost from almost $7 million to $17 million and requirefrom 12 to 18 months to complete, depending on the additional annual capacity.29 *** both reported thatthey would also be able to expand production from their current capacity with their current facilities byadding employees and, for ***.30 As a result, it appears U.S. producers could increase production in theshort run in response to an increase in demand by increasing capacity utilization and by increasingcapacity through more intensive use of their current facilities.
Inventory levels
U.S. producers’ total quantity of reported U.S. end-of-period inventories of ICI forklift trucksbuilt with domestic frames, as a share of total shipments of such products, fluctuated during January1999-June 2005 between a low of *** percent during 2000 to a high of *** percent during 2004. U.S.producers’ total reported U.S. end-of-period inventories of ICI forklift trucks built with domestic andimported frames, as a share of total shipments of such products, fluctuated during January 1999-June2005 between a low of *** percent during 2000 to a high of *** percent during 2003. U.S. producers

31 Based on the four responding U.S. producers, *** percent of their total U.S. shipments of ICI forklift trucksduring 2004 was shipped from U.S. production and the remaining *** percent was shipped from inventory (U.S.producer questionnaire responses of ***, section IV-B-7. 32 If export supply agreements are one year or greater in duration or the export products were unacceptable in theU.S. market, the ability to shift would be reduced. Only one of the responding five U.S. producers which answered aquestion about shifting sales between the U.S. and alternative country markets directly addressed the issue of supplyagreements (U.S. producers’ questionnaire responses, section IV-C-1). This firm, ***, commented that its dealeragreements commit the firm to provide trucks to dealers and, combined with capacity limitations, would make itdifficult to shift sales. Another of the responding U.S. producers, ***, reported that it would be difficult to shiftsales due to differences in standards, regulations, applications, and customer preferences in different parts of theworld. ***, another responding U.S. producer, reported that it had no plans to shift sales outside of its current salesareas of North America, Central and South America, and Caribbean regions. ***, another responding U.S. producer,reported that it did not know how difficult it would be to shift sales; whereas ***, the fifth responding U.S. producer,did not specifically address how easily it could shift sales, although it indicated that it distributes its products on aglobal basis. In addition, all four of the U.S. producers responding to the question regarding long-term (more thanone year) and short-term (typically one year) contracts, reported that *** percent of their domestic sales of U.S.-produced ICI forklift trucks (with domestic and imported frames) during 2004 involved these types of contracts(U.S. producer questionnaire responses, section IV-B-1). 33 U.S. producer questionnaire responses, section II-11. 34 Ibid. 35 U.S. importer questionnaire responses, section II-6.
II-5
reported that the majority of their production is produced to order,31 such that at least some portion ofthese inventories may already be committed. These data indicate that U.S. producers had a limited abilityto use inventories to increase shipments of their ICI forklift trucks to the U.S. market during this period.
Export markets
U.S. producers’ total quantity of reported exports of their U.S.-produced ICI forklift trucks builtwith domestic frames and those built with domestic and imported frames both decreased during 1999-2002, then increased through 2004, and continued to increase during the interim periods of January-June2004-05. The total quantity of exports of U.S. producers’ ICI forklift trucks built with domestic framesaveraged 12.9 percent of their total shipments of such products during January 1999-June 2005, while thetotal quantity of exports of U.S. producers’ ICI forklift trucks built with domestic and imported framesaveraged *** percent of their total shipments of such products during this period. These data indicate thatU.S. producers may have had an ability to increase shipments of their ICI forklift trucks to the U.S.market during this period by diverting their exports to the U.S. market.32
All six responding U.S. producers reported exporting some of their U.S.-produced ICI forklifttrucks during January 1999-June 2005, with Canada and Mexico cited most frequently as exportmarkets.33 *** reported the most diverse export market shipments. *** reported shipping its U.S.-produced ICI forklift trucks to Africa, Europe, Latin America and the Middle East, while *** reportedshipping its U.S.-produced ICI forklift trucks to Australia, Canada, Mexico, New Zealand, and GreatBritain.34 Both producers find it advantageous to ship to the more distant markets from their U.S.production, even though they each have offshore production of ICI forklift trucks that is closer to some ofthese markets, such as *** production facilities in *** and *** production facilities in ***. *** reportedthat global manufacturing utilization, economics, currency, and product demand, by geographic market,were major factors it considered in choosing where to produce certain series of ICI forklift trucks.35 ***

36 E-mail from ***. 37 U.S. producer questionnaire responses, section IV-C-6. 38 *** indicated that many used forklift trucks (5 to 10 years old) are exported from the United States to LatinAmerican markets. Hearing transcript, p. 162 (Wilson). 39 ***’s posthearing brief, p. 14 and exhibit 10. 40 In addition the Argentine prices were f.o.b. the United States and Japan. 41 U.S. producer questionnaire responses, section II-8. 42 According to ***, *** is the market leader in Japan for ICI forklift trucks with about *** percent of thedomestic market, followed by *** with about *** percent, whereas each of the other Japanese producers accountsfor less than *** percent of the Japanese market (foreign producer questionnaire response, section III-21).
II-6
reported that *** have a need for ICI forklift specifications that it produces in the United States but not in***.36
Two U.S. producers provided useable information about prices of ICI forklift trucks in the UnitedStates and other countries.37 *** asserted that prices in Asia Pacific and Latin America tend to besignificantly below those offered in the United States.38 According to ***, many Japanese producers tendto use these markets to “absorb” excess production, and seem to be willing to take prices which are wellbelow those in their “protected” home market. *** asserted that, while not precise indicators, customsdata for select countries and *** internal sales comparisons indicate that Japanese competitors aregenerally pricing lower than *** in Latin American countries. *** also asserted that recent Argentinepricing data reveal that ***, while in Thailand ***, delivered, including freight and duty, compared tocurrent Japanese street pricing of almost ***.39 These price comparisons were for selected ICI forklifttruck models based on list prices, without specifying any volumes, options and features of the Japaneseproduced products, contract terms, or specified time periods.40 *** asserted that its prices are slightlylower in Canada and Latin America compared with the United States due to competitive pricing in thoseforeign markets.
Production alternatives
*** reported that they could shift production between electric and ICI forklift trucks as demandchanges; whereas *** indicated it was not practical for the firm to do so; *** reported that it could notshift production; and *** indicated that it does not produce electric and ICI forklift trucks in the samefacilities, such that it would have to retool and train the labor force in any such switch.41 Based on theseresponses, it is likely that at least two U.S. producers would be able to shift their U.S. production of ICIforklift trucks to or from any other products; any ability to switch production among alternative productswould enhance the domestic producers’ supply response to a change in price.
Japan
Based on available information, the three responding producers of ICI forklift trucks in Japan,***,42 have the ability to respond to changes in the price of ICI forklift trucks with changes in the quantityof shipments of the Japanese ICI forklift trucks to the U.S. market due to the existence of alternatemarkets; this degree of responsiveness may be somewhat constrained by the reported high capacityutilization rates and reported inability to shift production of ICI forklift trucks to or from other products.

43 NACCO estimated that total Japanese capacity utilization for ICI forklift trucks was about 74 percent during2004, based on 1991 capacity figures and production of ICI forklift trucks that included subject and nonsubjectproducts (NACCO’s prehearing brief, pp. 19 and 21 and exhibit 3; and posthearing brief p. 6 and exhibit 5). 44 Hearing transcript, pp. 170-172 (Dawe). 45 E-mail from ***, November 4, 2005. 46 Ibid. 47 The three responding Japanese producers reported that they have not maintained U.S. inventories of theirJapanese-produced ICI forklift trucks since 1999 (foreign producer questionnaire responses, section II-12), and therewere no reported U.S. inventories of the Japanese products held by U.S. importers.
II-7
Industry capacity
Available data for the three responding Japanese producers indicated that total capacity utilizationrates to produce ICI forklift trucks fluctuated but increased from a period low of *** percent during 1999to *** percent during 2004,43 and then reached a period high of *** percent during January-June 2005. During this period, annual capacity of the three responding Japanese ICI forklift producers fluctuatedfrom a low of *** trucks in 2002 to a high of *** trucks in 2004. The reported data indicate that therewas capacity for the Japanese producers to expand production of ICI forklift trucks for sale in the U.S.market during 1999-2004, but *** unused capacity during January-June 2005.
NACCO asserted that it would be very costly and difficult for Toyota Japan to downsize or shutdown a factory in Japan due to social and cultural constraints, such that the firm could more easilydownsize its U.S. production and increase production in Japan to reduce alleged excess capacity inJapan.44 Toyota asserted that it has consistently fully utilized its U.S. facilities in Columbus, IN,producing ICI forklift trucks since it opened in 1988 and expanded the facility on numerous occasions;the firm reported that it has no plans to decrease Toyota production or employment in its U.S. facilitiesregardless of the outcome of the current review.45 Toyota also asserted that the alleged Japanese socialand cultural constraints were misconceptions based on decades-old stereotypes.46
Inventory levels
Available data indicated that the quantity of end-of-period inventories of ICI forklift trucks inJapan for the three responding Japanese producers, as a share of their total shipments of these products,averaged less than *** percent during 1999-2002, was *** percent during 2003, increased to *** percentduring 2004, and was *** during January-June 2005.47 These data indicate that the three respondingJapanese producers had a limited ability to use their Japanese inventory of ICI forklift trucks to increaseshipments of ICI forklift trucks to the U.S. market during 1999-2004, and *** ability during January-June2005.
Alternate markets
The three responding Japanese producers sold their ICI forklift trucks principally to their homemarket, secondarily to third-country export markets, thirdly through internal consumption/transfers, andthe remaining few trucks (***) to the U.S. market during January 1999-June 2005. During the period ofreview, the three responding Japanese producers’ total quantity of their home market shipments averaged*** percent of their total shipments; exports to third-country markets averaged *** percent of the total;internal consumption/transfers exports averaged *** percent of the total; and the few ICI forklift trucksshipped to the U.S. market averaged less than *** percent of the total. Total exports of ICI forklift trucksof the responding Japanese producers as a share of their total shipments of such products remained

48 Foreign producer questionnaire responses, sections III-9, III-10, and III-14. 49 NACCO indicated that the primary difference would be engine emissions in Japan versus the United States,which it asserted could be solved within 6 to 12 months (hearing transcript, p. 133 (Taylor)). 50 This flexibility may be restrained to the extent that the responding Japanese producers have sales agreementslonger than 12 months with customers in their home market and third-country markets. Only two Japaneseproducers responded to a question about shifting sales between the U.S. and alternative country markets (Foreignproducers’ questionnaire responses, section III-8). *** reported that it had no plans to shift sales, and *** reportedthat this question was not applicable to them, because the firm does not sell the subject products to the United States. 51 Foreign producer questionnaire responses, sections II-8 and II-11. 52 Of the total 23 responding purchasers, 21 were dealers, 1 was an end user, and the remaining firm, ***, was a***.
II-8
relatively stable during 1999-2002, between *** percent and *** percent, but then increased to ***percent in 2003, to *** percent in 2004, and to *** percent in January-June 2005.
The three responding Japanese producers commented on differences in ICI forklift trucks sold inthe Japanese market and those sold in the U.S. market.48 *** reported that ICI forklift trucks in theUnited States are mainly sold with cushion tires, while those in Japan are sold mainly with pneumatictires. In addition, *** indicated that the specifications of ICI forklift trucks sold in the United States areUL certified, while those sold in Japan are not. *** reported that there were no significant differences inthe ICI forklift trucks sold in the United States and in Japan.49 All three responding Japanese producersdid not expect any changes in the product mix of ICI forklift trucks in Japan, the United States, or third-country markets.
The data indicate that the responding Japanese producers may have had the flexibility to shiftshipments of ICI forklift trucks among alternate markets to increase or decrease shipments to the U.S.market in response to price changes in the United States during January 1999-June 2005.50
Production alternatives
All three responding Japanese producers of ICI forklift trucks reported that, since 1999, they havenot produced other products on the equipment used to produce ICI forklift trucks; they do not anticipateproducing other products on this equipment in the future; and they are not able to switch productionbetween ICI forklift trucks and other products.51 Based on these responses, Japanese producers areconstrained in their ability to shift their domestic production of ICI forklift trucks to or from any otherproducts; any ability to switch production among alternative products would enhance the Japaneseproducers’ supply response to a change in price.
Nonsubject Imports
Based on available information from importer questionnaire responses, U.S. imports of ICIforklift trucks from nonsubject countries averaged 99 percent of the quantity of total U.S. imports of ICIforklift trucks during January 1999-June 2005. Based on information from the 23 U.S. purchasers (all buttwo were dealers) responding to a question about new suppliers of ICI forklift trucks in the United Statessince 1999,52 11 reported that there were no new suppliers, while the remaining 12 firms reported

53 U.S. purchaser questionnaire responses, section III-23. 54 Ibid. 55 U.S. producer questionnaire responses, sections II-8 and IV-C-4. 56 U.S. producer questionnaire responses, section IV-C-4. NACCO also indicated that during the 1990s thebusiness cycle for ICI forklift trucks showed an upturn for a period approaching nine years. Hearing transcript, pp.191-192 (Taylor). 57 U.S. producer questionnaire responses, section IV-C-5. 58 U.S. producer questionnaire response, section IV-C-4. 59 U.S. producer questionnaire response, section II-8.
II-9
new firms supplying ICI forklift trucks from China, Germany, Great Britain, and Korea.53 In addition, 11of 23 responding purchasers reported that they did not expect any new suppliers, while the remaining 12expected new suppliers. Ten of these latter 12 mentioned China as the expected new source, 1 mentionedGermany, and the remaining purchaser did not comment on the country of origin.54
U.S. Demand
U.S. demand for ICI forklift trucks reportedly is highly cyclical, consistent with the cycle of theoverall economy in general and with manufacturing in particular.55 According to ***, U.S. demand forICI forklift trucks grew during 1999, then declined during January-March 2000 through January-March2002, then remained relatively flat through July-September 2003, before increasing during October-December 2003 through the present period.56 *** expects continued growth in U.S. demand for ICIforklift trucks through 2007, with a cyclical correction in 2008-09, while the three other U.S. producersresponding to this question expect continued growth in U.S. demand for ICI forklift trucks through 2010,with two of these latter producers expecting growth at about 2.0 percent annually during this period.57
U.S. demand for ICI forklift trucks (produced with both domestic and imported frames), asmeasured by annual apparent U.S. consumption quantity, increased from *** trucks in 1999 to *** trucksin 2000, or by *** percent; then decreased to a period low of *** trucks in 2002, or by *** percent; andthen increased to *** trucks in 2004, or by *** percent. Apparent U.S. consumption continued toincrease during the interim periods, from *** trucks in January-June 2004 to *** trucks in January-June2005, or by *** percent.
U.S. real gross domestic product (GDP) increased (at varying rates) annually throughout 1999-2004 and is expected to increase during 2005 and 2006, while total annual U.S. industrial productionincreased and decreased during the historical period, but is expected to increase during 2005 and 2006(table II-1). During 1999-2004, U.S. real GDP increased annually, by a high of 4.5 percent during 1999and a low of 0.8 percent during 2001, while total annual U.S. industrial production increased during1999-2000 and 2004, but decreased during 2001-03. U.S. real GDP is forecast to increase by 3.5 percentin 2005 and 3.3 percent in 2006, while industrial production is forecast to increase by 3.0 percent in 2005and 3.1 percent in 2006. *** asserted that when GDP growth is around 3 percent or higher, the firmtypically sees growth in demand for ICI forklift trucks.58 *** asserted that downturns in demand for ICIforklift trucks typically occur six months following the initial drop in the economy, while upturns indemand for ICI forklift trucks follow the economic recovery by six months.59

60 Staff telephone interview with ***. 61 Staff telephone interview with ***.
II-10
Table II-1U.S. economic trends: Changes in U.S. real gross domestic product and total industrialproduction, by years, 1999-2004 and forecasts for 2005-06
PeriodU.S. real gross domestic product1
(percentage)
U.S. total industrialproduction2
(percentage)
1999 4.5 4.5
2000 3.7 4.4
2001 0.8 -1.0
2002 1.9 -0.3
2003 3.0 -0.1
2004 4.4 4.1
Forecasts:
2005 3.5 3.0
2006 3.3 3.1
1 Based on gross domestic product in 2000 dollars. 2 Based on an index of total industrial production, 1997=100.
Note: Percentage changes are from the previous period.
Sources: Historical period--Economic Report of the President, U.S. Government Printing Office, Transmitted tothe Congress, February 2005, pp. 213 and 271; Forecast period–Blue Chip Economic Indicators, AspenPublishers, Inc., Vol. 30, No. 11, November 10, 2005, pp. 2-3.
Substitute Products
ICI forklift trucks are used for a variety of material handling applications and, therefore, are usedby a number of different industries. The wide variety of material handling applications and working conditions has been accompanied by the production of a number of different types of equipment,including ICI forklift trucks, electric forklift trucks, narrow-aisle forklift trucks, as well as otherequipment. While many responding U.S. producers, importers, and purchasers reported no substitutesexisted, electric forklift trucks were cited most frequently by some U.S. producers, importers ofnonsubject forklift trucks, and U.S. purchasers as substitutable for ICI forklift trucks. Conveyors andconstruction equipment were each cited by single firms as other possible substitutes. Used ICI forklifttrucks may also substitute for new ICI forklift trucks. Dealers typically display new ICI and electricforklift trucks together on their showroom floors,60 but keep their used ICI forklift trucks in a separatebuilding.61

62 In addition, the two responding U.S. producers asserted that prices of any substitute products have not affectedthe price of ICI forklift trucks since 1999 (U.S. producer questionnaire responses, section IV-B-12). The threeresponding U.S. producers asserted that there have been no changes in the types of products that can be substitutedfor ICI forklift trucks since 1999 (U.S. producer questionnaire responses, section IV-B-13). All five responding U.S.producers did not anticipate any change in substitutability of other products for ICI forklift trucks in the future (U.S.producer questionnaire responses, section IV-B-14). 63 In addition, the seven responding purchasers providing useable responses indicated that prices of any substituteproducts have not affected the price of ICI forklift trucks since 1999 (U.S. purchaser questionnaire responses, sectionIII-7). Twenty of 21 responding purchasers asserted that there have been no changes in the types of products thatcan be substituted for ICI forklift trucks since 1999 (U.S. purchaser questionnaire responses, section III-8). Twenty-one of 22 responding purchasers did not anticipate any change in substitutability of other products for ICI forklifttrucks in the future, whereas the remaining firm, ***, asserted that electric forklift trucks would become moresubstitutable for ICI forklift trucks in the future (U.S. purchaser questionnaire responses, section III-9). 64 These five importers did not anticipate any change in substitutability of other products for ICI forklift trucks inthe future (U.S. importer questionnaire responses, section III-B-14). 65 U.S. producer questionnaire responses, section IV-B-12; U.S. purchaser questionnaire responses, section III-7;and U.S. importer questionnaire responses, section III-B-12. 66 ***. 67 ***. In addition, three of these purchasers noted that the electric forklift trucks were used primarily indoors,such as in warehouses (U.S. purchaser questionnaire responses, section III-7). 68 ***. This importer indicated that such substitution would occur in distribution and warehousing, where ICIforklift trucks are used. In addition, *** asserted that, although changes in prices of electric forklift trucks have notaffected the prices of ICI forklift trucks in the U.S. market since 1999, technology advancement, particularly in thedevelopment of electric motors, now enable electric forklift trucks to compete at or near the same performance as ICIforklift trucks. *** also asserted that as technology improves and component prices decrease, electric forklift trucksshould become more commonplace alternatives (U.S. importer questionnaire responses, sections III-B-12 throughIII-B-14). 69 *** indicated that in limited applications construction equipment and farm tractors with special attachments canbe used, primarily in outdoor, rough-terrain, applications (U.S. producer questionnaire response, section IV-B-12). 70 *** indicated that conveyors are being used to transport and stage product that lift trucks have done in the past(U.S. purchaser questionnaire response, section III-7). In addition, *** asserted that computer-operated conveyorshave decreased in price since 1999 and have become more efficient and reliable (U.S. purchaser questionnaireresponse, section III-8).
II-11
Two of five responding U.S. producers,62 16 of 21 responding purchasers (all dealers),63 and fiveof six responding importers of nonsubject products (comprising used ICI forklift trucks from Japangreater than three years old,64 and new ICI forklift trucks and forklift truck frames from nonsubjectcountries) asserted that no substitutes exist for ICI forklift trucks.65 On the other hand, the remainingthree responding U.S. producers,66 four of the remaining five purchasers,67 and the one remainingimporter asserted that electric-powered forklift trucks may substitute for ICI forklift trucks;68 one of thethree producers, ***, also asserted that construction equipment may substitute for ICI forklift trucks,69
and the lone remaining purchaser, ***, an ICI forklift dealer, asserted that conveyors may substitute forICI forklift trucks.70
Electric Forklift Trucks
In addition to identifying substitutes, the responding U.S. producers detailed the applications andend uses where electric forklift trucks may substitute for ICI forklift trucks. *** reported that in light-duty use, with limited-use cycles, electric counter-balanced forklift trucks may be substituted, although
71 Staff telephone interview with ***. 72 According to ***, another difficulty in switching from ICI to electric forklift trucks is that end users are morefamiliar with the ICI forklift trucks, which have mechanical and hydraulic systems, and have the staff to servicethem, whereas the electric forklift trucks have, in addition, several electric motors, and mechanics able to servicesuch motors are not as plentiful as those able to service internal combustion engines (staff telephone interview with***). 73 E-mail from ***. In addition, *** asserts that electric forklift trucks generally are equipped with cushion tiresand have lift capacities ranging from 3,000-12,000 pounds. Electric forklift trucks use different steel frames than ICIforklift trucks, but both types of forklift trucks can use the same mast, fork, and tires (staff telephone interview with***). 74 E-mail from ***. 75 Ibid. 76 Staff telephone interview with ***. 77 *** asserts that the economic life of an ICI forklift truck is 10,000-12,000 operating hours (Staff telephoneinterview with ***). *** asserts that the product life of an ICI forklift truck is 3-5 years by heavy end users and thisis typical of national-account end users, but can last more than 20 years for light users. *** commented that theeconomic life of an ICI forklift truck ends when maintenance costs exceed the cost of a new ICI forklift truck (stafftelephone interview with ***). 78 Moreover, based on costs of fuel and service, *** asserts that even the operating costs of electric forklift trucksare greater than such costs for ICI forklift trucks (staff telephone interview with ***).
II-12
both acquisition cost and cost of operation remain significant barriers. *** asserted that the 2004 share ofICI forklift trucks of the total U.S. lift industry, at 47 percent, is unchanged from that in 1999. *** alsoasserts that sales of electric forklift trucks tend to be less cyclical (typically used in warehouses,distribution facilities, and food processing, where fumes are a problem) than ICI forklift trucks (typicallyused in manufacturing, foundries, and outside such as in docks and lumber yards).71 ***, as both aresponding U.S. producer and purchaser, reported that electric cushion-tired forklift trucks of similarcapacity as ICI forklift trucks would perform well in all applications except for pushing, excessive ramplevel, and around-the-clock use. According to ***, electric forklift trucks could be used for trailerloading/unloading, load movement and positioning, and general duty. *** reported that electric forklifttrucks may be substituted in environmentally sensitive applications such as food preparation anddistribution. According to ***, however, even in these applications the additional infrastructure cost(e.g., charging stations) to switch to electric must be overcome.72 *** provided a comparison of costs (atthe dealer level) between the same lift capacity and comparably equipped electric and ICI forklift trucks,both with cushion tires (table II-2).73 The comparison ICI forklift truck is powered by liquid petroleumgas. According to ***, this comparison is difficult to make because including the costs of additionalbatteries and a crane (for battery change-outs) depends on whether the end user is running multiple shiftsor not.74 For a single shift, the end user just needs a single battery and a charger, otherwise additionalbatteries and battery removal equipment should be added. *** explained that end users can buy theirbatteries, chargers, and LPG fuel from suppliers other than the forklift dealer, and end users generallycontract locally for the LPG fuel and may rent tanks.75
Based on *** cost comparisons, the initial cost of an electric forklift truck can cost an additional$*** (for single-shift use) to $*** (for multiple-shift use) over that of a comparable ICI forklift truck(table II-2). Although *** asserts that operating costs of the electric forklift truck are lower than those ofthe ICI forklift truck,76 it is not clear whether these reported lower operating costs are sufficient toovercome the higher initial cost of the electric forklift truck over the economic life of 7-8 years77 for aforklift truck, especially for a multiple-shift end user.78

79 U.S. producer questionnaire responses of ***, section IV-B-21. *** reported that it did not know the effect ofused ICI forklift trucks on the new truck market. 80 U.S. importer questionnaire responses of ***, section III-B-20. 81 U.S. importer questionnaire responses of ***, section III-B-20. 82 These agencies regulate standards for emissions of internal combustion engines, including ICI forklift trucks. The emission standards reportedly have become increasingly more strict since 1999; CARB will require its nextlevel of improved emissions for ICI forklift trucks in 2007 (staff telephone interview with ***; and e-mail from ***). 83 *** imports new ICI forklift trucks from Germany and Great Britain.
II-13
Table II-2Cost comparison of electric forklift truck to ICI forklift truck, cushion-tired vehicles
* * * * * * *
Used ICI Forklift Trucks
Four U.S. producers of new ICI forklift trucks,79 two U.S. importers of used ICI forklift trucksfrom Japan,80 and two U.S. importers of new ICI forklift trucks from nonsubject countries81 providedcomments in their questionnaires regarding the impact of used ICI forklift trucks on new products in theU.S. market. The following discussion is based on these questionnaire responses.
*** indicated that U.S. shipments of new ICI forklift trucks dropped significantly in 2001, largelydue to the recession. A secondary, although reportedly minor, cause was customers who chose to keeptheir leased units and rent them after the initial lease contract expired, rather than purchase new ICIforklift trucks. According to ***, this secondary reason accounted for less than *** percent of thevolume drop in 2001. *** asserted that there were no other major effects from the prices and volume ofused units on new units, and the firm did not expect this to change in the future. *** reported it believesthat an increase in quantities of used equipment has more downward pressure on the used ICI forklifttruck market than the new truck market. *** asserted that the majority of customers prefer either new orused ICI forklift trucks and do not frequently mix the two, and the firm did not expect this to change inthe future. *** asserted that the quality and durability of ICI forklift trucks have improved, leading tolonger life and greater value of used equipment, but this increase has not been significant. *** alsoasserted that the requirements of CARB (California Air Resource Board) in California and the FederalEPA will lessen the demand for used, “non-compliant” ICI forklift trucks in the future.82
Three of the four responding importers asserted that the price of used ICI forklift trucks does notaffect the price or quantity of new ICI forklift trucks. The remaining importer, ***,83 asserted that a largeused ICI forklift truck market has created an alternative for new truck buyers, thereby, lowering the pricemargin and production of new ICI forklift trucks sold to dealers.
84 Hearing transcript, p. 194 (Wilson). 85 U.S. producer questionnaire responses, sections IV-C-1, IV-C-4, IV-C-5, and IV-C-10. 86 On the supply side, *** estimates that Chinese production of ICI forklift trucks equals about 79 percent of U.S.production, Japanese production is about 68 percent, European production is about 70 percent, and Latin Americanand Canadian production combined is about 20-25 percent of U.S. production. 87 *** also indicated that when GDP growth is around 3 percent or higher, it sees a growing demand for ICIforklift trucks. 88 During 1999-2004, annual growth in Chinese real GDP is estimated to have ranged from a low of 7.1 percent in1999 to a high of 9.5 percent in 2003 and 2004; Chinese real GDP is expected to grow by 9.4 percent in 2005 and8.3 percent in 2006 (Blue Chip Economic Indicators, Aspen Publishers, Inc., Vol. 26/No. 11 (November 10, 2001),Vol 28/No. 9 (September 10, 2003), Vol. 29/No. 11 (November 10, 2004), and Vol. 30/No. 11 (November 10, 2005),p. 7 all issues). 89 ***. 90 *** also reported that Australia recently eliminated all duties on imported forklift trucks, allowing the producerto more cost effectively compete with its U.S.-produced product in the Australian market. 91 During 1999-2004, annual growth in Japanese real GDP is estimated to have ranged from a low of -0.3 percentin 2002 to a high of 2.6 percent in 2004; Japanese real GDP is expected to grow by 2.0 percent in 2005 and 1.9percent in 2006 (Blue Chip Economic Indicators, Aspen Publishers, Inc., Vol. 26/No. 11 (November 10, 2001), Vol28/No. 9 (September 10, 2003), Vol. 29/No. 11 (November 10, 2004), and Vol. 30/No. 11 (November 10, 2005), p. 6
(continued...)
II-14
Cost Share
NACCO asserted that the initial cost of a ICI forklift truck is less than 10 percent of the combinedpurchase price and operating costs of the forklift truck over a five-year period; operating costs includecosts such as those for an operator, repair parts, and service.84
Foreign Demand
Two U.S. producers, primarily *** and to a lesser extent ***, provided useable information intheir questionnaire responses regarding demand for ICI forklift trucks outside of the United States;85 thefollowing discussion is based on these questionnaire comments. According to ***, the United States isthe largest market for ICI forklift trucks followed in descending order by China, Japan, Europe, and LatinAmerica and Canada combined.86 *** indicated that demand for ICI forklift trucks in these foreigncountries is largely a function of GDP growth and industrial production,87 while *** indicated that ICIforklift truck demand is cyclical and has fluctuated with the general strength of the countries’ economies.
According to ***, Chinese ICI forklift truck demand has increased by a total of 320 percentduring 1999-2004, while its economy has experienced dramatic growth and modernization.88 ***indicated that Chinese production of ICI forklift trucks has also increased substantially during this period,or by a total of 220 percent, and reportedly accounts for 85-95 percent of Chinese demand. *** assertsthat no foreign producer of ICI forklift trucks has been able to gain significant market share in China;NACCO and European producers reportedly have a small presence in China. *** expects that futureincreases in Chinese demand for ICI forklift trucks will largely be satisfied by very low-cost Chineseproducers. According to ***, several Asian countries impose duties on ICI forklift trucks including 10.8-30.0 percent for China,89 1 percent for the Philippines, and 10 percent for Taiwan.90
*** indicated that Japan has experienced stagnant demand for ICI forklift trucks during 1999-2003, with some small growth in demand during 2004-05, while its economy has experienced negative orvery low GDP growth.91 According to ***, Japanese ICI forklift truck demand during 1999-2004 ranged

91 (...continued)all issues). 92 During 1999-2004, annual growth in real GDP in the Euro zone (countries that use the euro as their currency) isestimated to have ranged from a low of 0.5 percent in 2003 to a high of 3.4 percent in 2000; Euro zone real GDP isexpected to grow by 1.3 percent in 2005 and 1.7 percent in 2006 (Blue Chip Economic Indicators, Aspen Publishers,Inc., Vol. 26/No. 11 (November 10, 2001), Vol 28/No. 9 (September 10, 2003), Vol. 29/No. 11 (November 10,2004), and Vol. 30/No. 11 (November 10, 2005), p. 7 all issues). 93 *** indicated that the European industry is comprised of more than 20 countries, each with its own language,culture, and distribution system. 94 During 1999-2004, annual growth in real GDP in Mexico is estimated to have ranged from a low of -0.3percent in 2001 to a high of 6.9 percent in 1999; Mexican real GDP is expected to grow by 3.3 percent in 2005 and3.4 percent in 2006. During 1999-2004, annual growth in real GDP in Brazil is estimated to have ranged from a lowof 0.5 percent in 2003 to a high of 5.2 percent in 2004; Brazilian real GDP is expected to grow by 3.3 percent in2005 and 3.7 percent in 2006. During 1999-2004, annual growth in real GDP in Canada is estimated to have rangedfrom a low of 1.5 percent in 2001 to a high of 5.1 percent in 1999; Canadian real GDP is expected to grow by 2.9percent in 2005 and 3.0 percent in 2006. (Blue Chip Economic Indicators, Aspen Publishers, Inc., Vol. 26/No. 11(November 10, 2001), Vol 28/No. 9 (September 10, 2003), Vol. 29/No. 11 (November 10, 2004), and Vol. 30/No. 11
(continued...)
II-15
from a low of 36,640 trucks in 2002 to a high of 41,303 trucks in 2004. The reportedly stagnant Japanesedemand for ICI forklift trucks occurred as, according to ***, heavy manufacturing and other industrialproduction moved offshore and has not been replaced by other Japanese economic activity that wouldrequire the use of ICI forklift trucks. *** asserts that no foreign producer of ICI forklift trucks has beenable to gain significant market share in Japan, where five Japanese producers reportedly hold more than96 percent of the Japanese market and Sumitomo-NACCO has the remaining 4-percent market share. ***expects slow future growth in Japanese demand for ICI forklift trucks. *** reported that, beginningSeptember 1, 2005, Japan imposed a 15-percent import duty on U.S.-produced forklift trucks, resultingfrom the U.S.-WTO dispute involving the Continued Dumping and Subsidy Offset Act.
*** reported that European demand for ICI forklift trucks has been relatively stable with someslow growth during 1999-2004, while European GDP has been stable or has grown slowly.92 Accordingto ***, most of the growth in European demand for ICI forklift trucks has been from Eastern Europe,where industrial production has expanded, whereas Western Europe has moved to a more service anddistribution-based economy, increasing demand for electric forklift trucks and decreasing demand for ICIforklift trucks. According to ***, the European ICI forklift truck industry is dominated by Germanproducers, which have close to a 50-percent market share, while *** has around a 15-percent marketshare. Although in total the European market for ICI forklift trucks is significant and *** expects slowbut steady growth in European demand for ICI forklift trucks, it asserts that cultural, distribution, tariff,and non-tariff barriers make any additional sales growth for *** a challenge.93 *** indicated that theEuropean Union (EU) imposes a 4.5-percent tariff on imported ICI forklift trucks, while EasternEuropean countries impose tariffs as high as 15 percent (Romania). During 2004, *** reported that theEU imposed retaliatory duties (in addition to the regular 4.5-percent duty) on imports of U.S.-producedICI forklift trucks starting at 12 percent and increasing by 2 percentage points per month throughDecember 2004. Although these retaliatory duties were recently suspended, they may be reinstatedsubject to a resolution of the U.S.-WTO dispute involving the Continued Dumping and Subsidy OffsetAct.
*** reported that the Latin America and Canadian markets are relatively open to U.S. distributionof ICI forklift trucks due to geographic proximity and/or cultural similarities. Although *** indicatedthat it has a significant presence in these markets, the relatively small size of these markets for ICI forklifttrucks reportedly limits the amount of additional business that the firm can gain.94 For Mexico and
94 (...continued)(November 10, 2005), pp. 6-7 all issues). 95 Hearing transcript, p. 162 (Wilson). 96 Based on responses of 22 purchasers for new ICI forklift trucks, 20 dealers reported purchasing from only asingle producer, another dealer, ***, reported purchasing from its two producer suppliers, and an end user, ***,reported that, when it is negotiating for a multi-year contract it considers 10 suppliers, but after the agreement is inplace, it purchases from only the two or three contracted suppliers (purchaser questionnaire responses, section III-20). *** reported that the participation of multiple competitors is often the largest influence on price and that onmany occasions the firm must agree to pricing limitations and concessions to meet a competitor’s offering (U.S.producer questionnaire response, sections IV-B-3 and IV-B-4). 97 Based on responses of 23 purchasers (21 dealers, 1 U.S. producer, and 1 end user), 17 purchasers reported thatthey always make purchase decisions based on the producer of the ICI forklift trucks, 3 purchasers usually purchasedthe product based on the producer identity, and 3 purchasers sometimes purchased the product based on produceridentity, but only 3 purchasers made the purchase decisions based on the country of origin of the products theypurchased, 2 purchasers usually made their purchases based on the country identity, and 18 purchasers sometimes ornever made purchases based on the country identity. The same 21 dealers and 1 purchasing U.S. producer reportedthe same information for their end-user customers. Two of these purchasers reported that their customers alwaysmade purchase decisions based on the producer of the ICI forklift trucks that they purchased, 6 purchasers reportedthat their customers usually made purchases based on the producer identity, and 14 purchasers reported that theircustomers sometimes or never made purchases based on the producer identity. One of the 21 dealers reported that itscustomers usually made purchase decisions based on the country origin of the ICI forklift trucks they purchased,while the other 20 dealers and the 1 purchasing U.S. producer reported that their customers sometimes or never madepurchases based on the country identity.
II-16
Canada the import duty rate was zero for imports of U.S.-produced ICI forklift trucks, under the NAFTACanada/Mexico Preference. *** indicated that import duties on U.S.-produced ICI forklift trucks were 14percent in Brazil, 5 percent in Colombia, and 6 percent in Venezuela. *** indicated that Brazil andColombia prohibit the importation of used machinery, including used ICI forklift trucks, to protect localproduction and because of concerns with quality and safety. On the other hand, NACCO indicated thatused ICI forklift trucks were frequently exported from the United States to Latin America.95
SUBSTITUTABILITY ISSUES
The degree of substitution in demand between ICI forklift trucks produced in the United Statesand those imported from Japan depends upon such factors as relative prices, types of customers,conditions of sales, technical support/service, and product differentiation. Product differentiation dependson factors such as the range of products, quality, availability, reliability of supply, and the marketperception of these latter three factors. Performance characteristics of ICI forklift trucks reportedly canplay a significant role in demand and are related to one or more of the aforementioned factors. Based on the reported information in this review, which included only a relatively few imports of ICI forklift trucksfrom Japan, there appears to be substitutability in demand between the ICI forklift trucks produceddomestically and those imported from Japan.
The questionnaire responses suggested strong producer-dealer relationships and a high degree ofcompetition among the various U.S. producers.96 In addition, the dealers reported that they and theircustomers were more frequently aware of the supplying producer than the country of origin of the ICIforklift trucks that they purchased, which suggests a high degree of brand recognition by these firms.97

98 Hearing transcript, pp. 85 and 184 (Wilson). 99 Hearing transcript, pp. 86 and 183-184 (Wilson). 100 U.S. purchaser questionnaire responses, section III-27. 101 Of the two remaining purchasers, one was an end user and one was a purchasing U.S. producer. 102 Eighteen of 19 responding U.S. purchasers (18 dealers and 1 purchasing U.S. producer) reported that since1999 their U.S. and foreign producer suppliers have not lost their approved status with the firms. The singleremaining firm, *** (a dealer), reported that *** had lost supplier status with the firm due to lack of marketacceptance (U.S. purchaser questionnaire responses, section III-26). 103 Ibid. 104 U.S. purchaser questionnaire responses, section III-28.
II-17
NACCO indicated that it has a very strong relationship with its dealers and that its end-user customers areloyal to the manufacturer, but the latter reportedly exhibit less loyalty than 10 years ago.98 NACCO asserted that the strong dealer loyalty could be more tenuous if the firm could not offer competitive pricesand a level of dealer support that is currently offered by NACCO.99
Factors Affecting Purchases
U.S. purchasers of ICI forklift trucks were requested in their questionnaires to rank 15 specifiedpurchase factors as very important, somewhat important, or not important. Twenty purchasers respondedand their responses are summarized in table II-3 for each purchase factor. Product consistency was listedas very important most frequently (19 firms), followed by both product quality equals standard andreliable supply (each 18 firms), and then by technical support (15 firms).
U.S. purchasers were also requested in their questionnaires to list the top three purchase factorsthat they consider when deciding from whom to purchase ICI forklift trucks. Eighteen purchasersresponded, but nine of these firms explicitly reported that their purchases were based on their currentdealership arrangements.100 Sixteen of the 18 purchasers were dealers,101 all of whom have long-timerelationships with their suppliers and generally have not changed suppliers since 1999.102 As a result,these dealers’ purchase decisions were made several years ago. The lone responding end user, ***, alsocited pre-arranged contracts and reported that its purchase contracts for ICI forklift trucks extend ***years. In addition to firms citing current contracts, other firms identified a variety of descriptions ofpurchase factors, which made it difficult to group the responses by factors. Taking into consideration therange of responses, quality was ranked most frequently as the first and as the second most importantpurchase factor, and price was reported most frequently as the third most important purchase factor.103
Purchasers also were asked to identify characteristics that they consider when determining thequality of ICI forklift trucks. Seventeen purchasers provided useable responses. Quality characteristicscited included the following: service, downtime for customers, reliability, availability of replacementparts, durability, warranty, maintenance costs, product consistency, dependability, product quality andreliability, repair history, overall construction, weld quality, quality components, fit and finish, andperformance.104
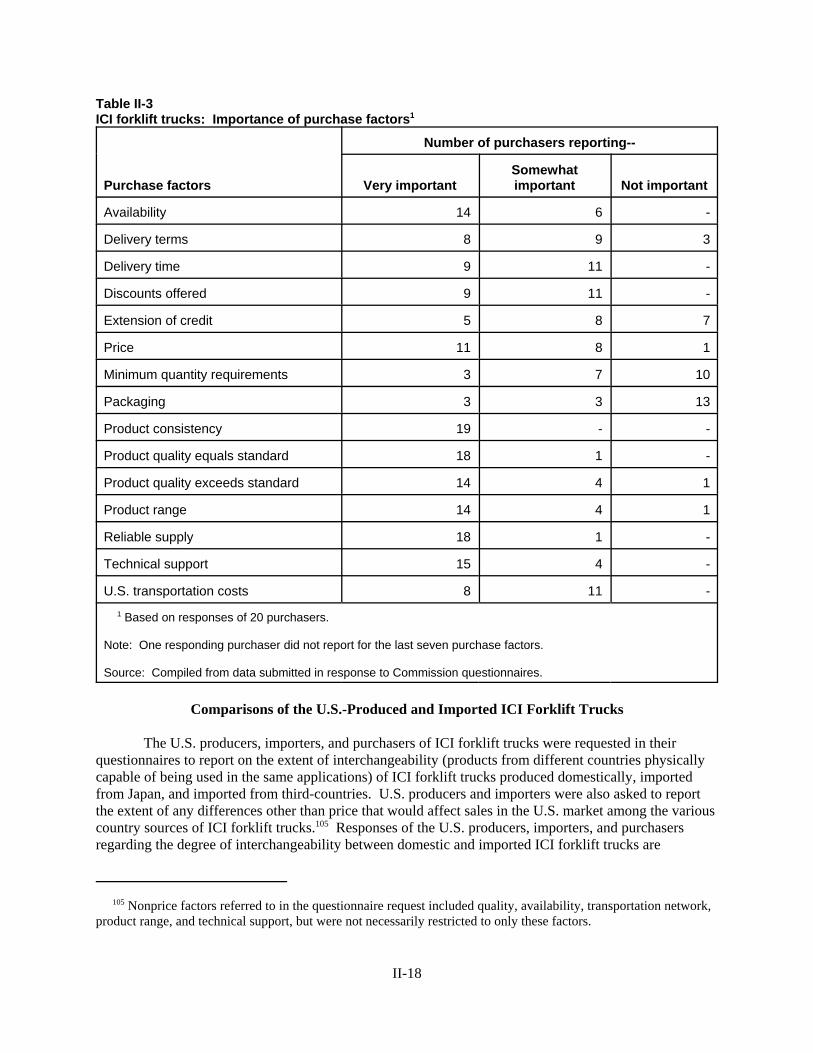
105 Nonprice factors referred to in the questionnaire request included quality, availability, transportation network,product range, and technical support, but were not necessarily restricted to only these factors.
II-18
Table II-3ICI forklift trucks: Importance of purchase factors1
Purchase factors
Number of purchasers reporting--
Very importantSomewhatimportant Not important
Availability 14 6 -
Delivery terms 8 9 3
Delivery time 9 11 -
Discounts offered 9 11 -
Extension of credit 5 8 7
Price 11 8 1
Minimum quantity requirements 3 7 10
Packaging 3 3 13
Product consistency 19 - -
Product quality equals standard 18 1 -
Product quality exceeds standard 14 4 1
Product range 14 4 1
Reliable supply 18 1 -
Technical support 15 4 -
U.S. transportation costs 8 11 -
1 Based on responses of 20 purchasers.
Note: One responding purchaser did not report for the last seven purchase factors.
Source: Compiled from data submitted in response to Commission questionnaires.
Comparisons of the U.S.-Produced and Imported ICI Forklift Trucks
The U.S. producers, importers, and purchasers of ICI forklift trucks were requested in theirquestionnaires to report on the extent of interchangeability (products from different countries physicallycapable of being used in the same applications) of ICI forklift trucks produced domestically, importedfrom Japan, and imported from third-countries. U.S. producers and importers were also asked to reportthe extent of any differences other than price that would affect sales in the U.S. market among the variouscountry sources of ICI forklift trucks.105 Responses of the U.S. producers, importers, and purchasersregarding the degree of interchangeability between domestic and imported ICI forklift trucks are
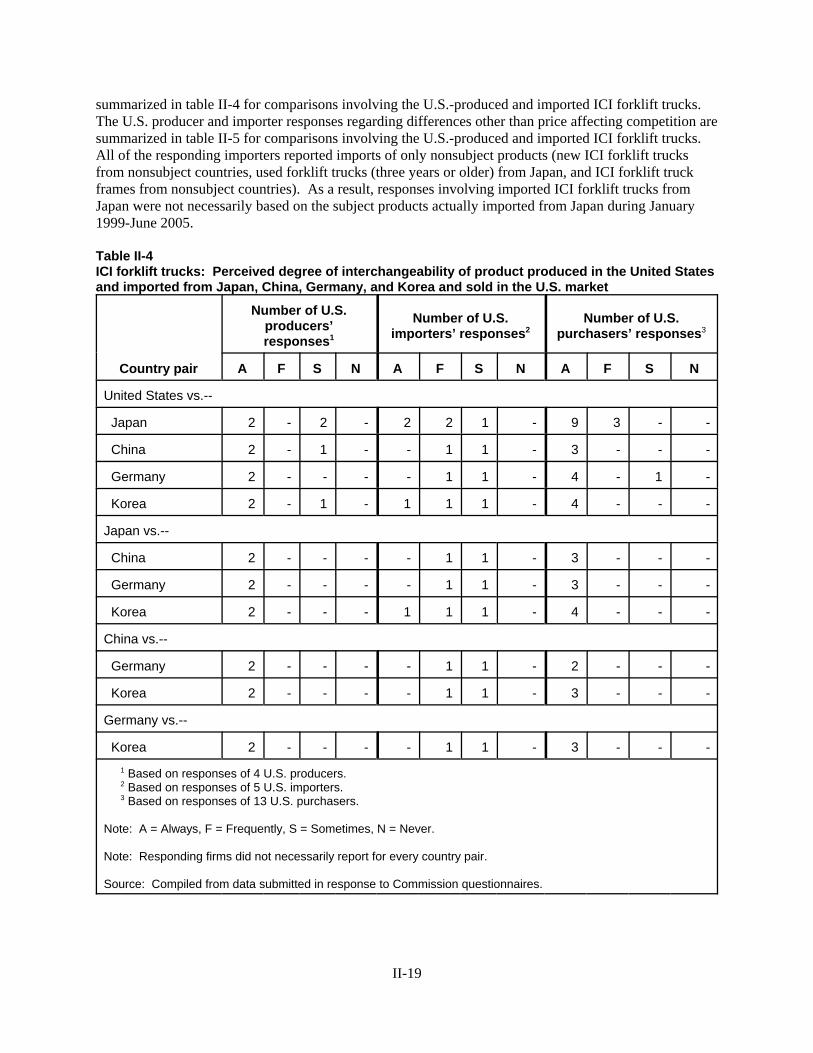
II-19
summarized in table II-4 for comparisons involving the U.S.-produced and imported ICI forklift trucks. The U.S. producer and importer responses regarding differences other than price affecting competition aresummarized in table II-5 for comparisons involving the U.S.-produced and imported ICI forklift trucks. All of the responding importers reported imports of only nonsubject products (new ICI forklift trucksfrom nonsubject countries, used forklift trucks (three years or older) from Japan, and ICI forklift truckframes from nonsubject countries). As a result, responses involving imported ICI forklift trucks fromJapan were not necessarily based on the subject products actually imported from Japan during January1999-June 2005.
Table II-4ICI forklift trucks: Perceived degree of interchangeability of product produced in the United Statesand imported from Japan, China, Germany, and Korea and sold in the U.S. market
Country pair
Number of U.S.producers’responses1
Number of U.S.importers’ responses2
Number of U.S.purchasers’ responses3
A F S N A F S N A F S N
United States vs.--
Japan 2 - 2 - 2 2 1 - 9 3 - -
China 2 - 1 - - 1 1 - 3 - - -
Germany 2 - - - - 1 1 - 4 - 1 -
Korea 2 - 1 - 1 1 1 - 4 - - -
Japan vs.--
China 2 - - - - 1 1 - 3 - - -
Germany 2 - - - - 1 1 - 3 - - -
Korea 2 - - - 1 1 1 - 4 - - -
China vs.--
Germany 2 - - - - 1 1 - 2 - - -
Korea 2 - - - - 1 1 - 3 - - -
Germany vs.--
Korea 2 - - - - 1 1 - 3 - - -
1 Based on responses of 4 U.S. producers. 2 Based on responses of 5 U.S. importers. 3 Based on responses of 13 U.S. purchasers.
Note: A = Always, F = Frequently, S = Sometimes, N = Never.
Note: Responding firms did not necessarily report for every country pair.
Source: Compiled from data submitted in response to Commission questionnaires.

106 U.S. producer questionnaire responses, section IV-B-19. 107 U.S. importer questionnaire responses, section III-B-18. These U.S. importers did not report any imports ofnew ICI forklift trucks from Japan; two importers reported importing used (three years or older) ICI forklift trucksfrom Japan, two reported importing new ICI forklift trucks from Korea, and one importer reported importing newICI forklift trucks from Germany and Great Britain.
II-20
Table II-5ICI forklift trucks: Perceived importance of differences in factors other than price between productproduced in the United States and that imported from Japan, China, Germany, and Korea and soldin the U.S. market
Country pair
Number of U.S. producers’responses1
Number of U.S. importers’responses2
A F S N A F S N
United States vs.--
Japan - - 2 2 - 2 2 -
China - - 3 - - - 1 -
Germany - - 1 1 - 1 1 -
Korea - - 3 - - - 2 -
Japan vs.--
China - - 2 - - - 1 -
Germany - - 1 1 - 1 1 -
Korea - - 2 - - - 1 -
China vs.--
Germany - - 2 - - - 1 -
Korea - - 2 - - - 1 -
Germany vs.--
Korea - - 2 - - - 1 -
1 Based on responses of 4 U.S. producers. 2 Based on responses of 4 U.S. importers.
Note: A = Always, F = Frequently, S = Sometimes, N = Never.
Note: Responding firms did not necessarily report for every country pair.
Source: Compiled from data submitted in response to Commission questionnaires.
For responses regarding the degree of interchangeability among U.S.-produced and imported ICIforklift trucks, 4 U.S. producers,106 5 U.S. importers,107 and 13 U.S. purchasers of ICI forklift trucks

108 U.S. purchaser questionnaire responses, section IV-2. All the responding purchasers were dealers of ICIforklift trucks. 109 ***, two U.S. producers, and ***, an importer, asserted that the domestic and imported Japanese ICI forklifttrucks were sometimes interchangeable; these firms provided additional comments as requested. *** indicated thatthe following standards can potentially affect the interchangeability of products from these countries: (1) EPA andCARB (California Air Resource Board) compliance, (2) UL requirements, and (3) OSHA requirements (both localand state). *** asserted that ICI forklift trucks from Japan are mostly pneumatic-tired, whereas the U.S. market ismostly cushion-tired. *** identified fuel type, lift capacity, and design as features that differentiated the domesticand imported Japanese products. 110 U.S. producer questionnaire responses, section IV-B-19. 111 U.S. importer questionnaire responses, section III-B-18. These U.S. importers did not report any imports ofnew ICI forklift trucks from Japan; two importers reported importing used (three years or older) ICI forklift trucksfrom Japan, two reported importing new ICI forklift trucks from Korea, and one importer reported importing newICI forklift trucks from Germany and Great Britain. 112 U.S. purchaser questionnaire responses, section IV-2. All the responding purchasers were dealers of ICIforklift trucks. 113 ***, the two U.S. importers of used ICI forklift trucks from Japan, asserted that nonprice factors are frequentlysignificant for sales of the U.S.-produced and imported Japanese ICI forklift trucks; *** provided additionalcomments as requested. *** reported importing used pneumatic-tire forklift trucks from Japan to supplement thehigh U.S. demand for used pneumatic-tire models in the U.S. secondary wholesale market. 114 U.S. purchaser questionnaire responses, section IV-6; all nine responding purchasers were dealers of ICIforklift trucks.
II-21
replied,108 but not necessarily for every country comparison (table II-4). Responses of U.S. producers andpurchasers generally indicated that the U.S.-produced ICI forklift trucks and those imported from Japan,China, Germany, and Korea were always or frequently interchangeable with each other. On the otherhand, responses of U.S. importers indicated more instances where the U.S.-produced and importedproducts were sometimes interchangeable with each other.109
For responses regarding differences in factors other than price affecting competition among U.S.-produced and imported ICI forklift trucks, four U.S. producers110 and four U.S. importers111 replied,112 butnot necessarily for every country comparison (table II-5). Responses of U.S. producers and importers generally indicated that differences in nonprice factors among the U.S.-produced and imported ICIforklift trucks from Japan, China, Germany and Korea were sometimes or never significant among salesof the domestic and imported products (table II-5).113
U.S. purchasers were also requested in their questionnaire to make country-of-origin comparisonsamong the U.S.-produced and imported ICI forklift trucks in terms of the 15 specified purchase factorsdiscussed earlier and indicate for each factor whether product from one country was superior, comparable,or inferior to product from another country. The purchaser responses are shown in table II-6 forcomparisons between the U.S.-produced and imported ICI forklift trucks.
For purchaser responses regarding comparisons of countries-of-origin for the U.S.-produced andimported ICI forklift trucks, a total of nine U.S. purchasers replied, but not for every country comparison(table II-6).114 The responding purchasers asserted that U.S.-produced ICI forklift trucks were generallycomparable with those imported from Japan, China, and Germany, but the responses comparing the U.S.-produced and imported Korean products were mixed, with a generally similar number of responsesshowing that the U.S.-produced products were superior or comparable to the imported Korean products. A notable exception involved the purchase factor, price, where the purchasers generally ranked the U.S.-produced ICI forklift trucks inferior (i.e., higher priced) to those imported from Japan and China, butsuperior (i.e., lower priced) to those imported from Germany.

II-22
Table II-6ICI forklift trucks: Comparisons of U.S.-produced ICI forklift trucks with those imported from Japan, China, Germany, and Korea1
Purchase factors
Number of purchasers’ responses comparing the UnitedStates with--
Japan China Germany Korea
S C I S C I S C I S C I
Availability 2 4 - - 1 - 1 3 - 1 1 -
Delivery terms 1 5 - - 1 - 1 3 - 1 1 -
Delivery time 2 4 - - 1 - 2 2 - 1 1 -
Discounts offered - 3 3 - - 1 1 3 - - - 2
Extension of credit 1 4 1 - 1 - - 4 - 1 1 -
Price - 1 5 - - 1 3 1 - - 1 1
Minimum quantity requirements - 6 - - 1 - - 4 - - 2 -
Packaging - 6 - - 1 - - 4 - - 2 -
Product consistency 1 3 2 - 1 - 1 2 1 1 1 -
Product quality equals standard 1 3 2 - 1 - - 3 1 1 1 -
Product quality exceeds standard 2 2 2 - 1 - 1 2 1 1 1 -
Product range 3 3 - 1 - - 1 3 - 2 - -
Reliable supply 1 4 1 - 1 - 1 3 - 1 1 -
Technical support 2 3 1 1 - - 2 2 - 2 - -
U.S. transportation costs 1 5 - - 1 - 2 2 - 1 1 -
1 Based on responses of nine purchasers.
Note: S=superior, C=comparable, and I=inferior.
Note: Responding purchasers did not necessarily report for every country pair.
Source: Compiled from data submitted in response to Commission questionnaires.

115 The suggested ranges for the various elasticities were presented below in the prehearing report for purposes ofdiscussion in the prehearing briefs, hearing testimony, and/or posthearing briefs; no parties provided a discussion ofthe elasticities. The elasticity responses in this section refer to changes that could occur within 12 months, unlessotherwise indicated. 116 Domestic supply response is generally assumed to be symmetrical for both an increase and a decrease indemand for the domestic product. Exceptions to this assumption occur when the supply response is restricted whendemand increases (e.g., the domestic firm(s) operate near or at full capacity and any likely expansion in capacitywould take more than 12 months to complete), or, more rarely, when demand decreases (e.g., the domestic firm(s)must operate at or near full capacity due to very high fixed costs). 117 The substitution elasticity measures the responsiveness of the relative U.S. consumption levels of the subjectimports and the U.S. domestic like product to changes in their relative prices. This reflects how easily purchasersswitch from the U.S. product to the subject imported product (or vice versa) when prices change.
II-23
ELASTICITY ESTIMATES115
U.S. Supply Elasticity
The domestic supply elasticity for ICI forklift trucks measures the sensitivity of the quantitysupplied by the U.S. producer to a change in the U.S. market price of ICI forklift trucks. The elasticity ofdomestic supply depends on several factors including the U.S. producer’s level of excess capacity, theease with which the U.S. producer can alter its productive capacity, the existence of inventories, and theavailability of alternate markets for U.S.-produced ICI forklift trucks.116 Analysis of these factorsindicates that, overall, the U.S. producers had flexibility in the short run to alter their supply of ICIforklift trucks to the U.S. market in response to relative changes in the demand for its products; thus, thedomestic elasticity of supply is estimated to be in the range of 3-5 for ICI forklift trucks built withdomestic frames and 1-3 for total ICI forklift trucks built with both domestic and imported frames.
U.S. Demand Elasticity
The U.S. price elasticity of demand for ICI forklift trucks measures the sensitivity of the overallquantity demanded for this product to changes in the U.S. market price of ICI forklift trucks. The priceelasticity of demand depends on the substitutability of other equipment or used forklift trucks for new ICIforklift trucks and, because it is a durable good, its replacement can be postponed by repairing/refurbishing the current ICI forklift trucks. Based on available information, the demand elasticity for ICIforklift trucks is estimated to be in the range of -.5 to -1.5.
Substitution Elasticity117
The elasticity of substitution largely depends upon the degree to which there is an overlap ofcompetition between U.S.-produced and imported ICI forklift trucks, and the extent of productdifferentiation. Product differentiation, in turn, depends on such factors as physical characteristics (e.g.,grades and quality) and conditions of sale (e.g., delivery lead times, reliability of supply, technicalsupport/service, etc.). Based on available information discussed earlier, the elasticity of substitutionbetween domestic ICI forklift trucks and the ICI forklift trucks that might be imported from Japan isestimated to be in the range of 3-5.


III-1
PART III: CONDITION OF THE U.S. INDUSTRY
Information in this section is based on the questionnaire responses of six firms that are believed toaccount for virtually all of the U.S. production of ICI forklift trucks in 2004. Separate information withregard to the one responding domestic producer without a parent company in Japan, i.e., NACCO USA, ispresented in appendix C, tables C-3 and C-4.
U.S. PRODUCERS’ CAPACITY, PRODUCTION, AND CAPACITY UTILIZATION
NACCO USA, Toyota USA, and Mitsubishi USA together accounted for *** percent of total ICIforklift truck capacity and *** percent of total ICI forklift truck production in 2004. Table III-1 presentsU.S. capacity, production, and capacity utilization for ICI forklift truck frames, trucks (U.S.-producedframes), and trucks (all frames).
Table III-1ICI forklift truck frames, trucks from U.S.-produced frames, and trucks from all frames: U.S.capacity, production, and capacity utilization, 1999-2004, January-June 2004, and January-June2005
Item
Calendar year January-June
1999 2000 2001 2002 2003 2004 2004 2005
Frames:
Capacity (number of frames) 72,241 69,582 66,190 62,332 61,681 62,257 31,012 31,535
Production (number of frames) 56,664 56,902 43,155 35,164 41,688 48,972 21,962 29,262
Capacity utilization (percent) 78.4 81.8 65.2 56.4 67.6 78.7 70.8 92.8
Trucks (U.S.-produced frames)
Capacity (number of trucks) 81,241 78,582 75,190 74,057 70,681 71,257 35,512 36,035
Production (number of trucks) 57,219 57,470 43,697 35,786 42,242 49,714 22,333 29,650
Capacity utilization (percent) 70.4 73.1 58.1 48.3 59.8 69.8 62.9 82.3
Trucks (all frames)
Capacity (number of trucks) *** *** *** *** *** *** *** ***
Production (number of trucks) *** *** *** *** *** *** *** ***
Capacity utilization (percent) *** *** *** *** *** *** *** ***
Note: ***’s annual capacity reflects its highest level of production during the period for which data were collected (***).
Source: Compiled from data submitted in response to Commission questionnaires.
1 The other four U.S. producers did not report capacity increases during the period for which data were collected. ***’s capacity remained constant at *** trucks, respectively; while ***’s capacity decreased irregularly, by ***trucks or *** percent, from *** trucks in 1999 to *** trucks in 2004. ***’s capacity decreased by *** trucks or ***percent, from *** trucks for interim 2004 to *** trucks for interim 2005. *** did not report capacity data. ***’sannual capacity reflects its highest level of production during the period for which data were collected (***). U.S.producers’ questionnaire responses, sections II-11a and II-11b, except as noted. 2 On June 8, 2005, the Greater Rockford Airport Authority requested special-purpose subzone status for the threeIllinois manufacturing facilities of Nissan USA that produce rider type, forklift trucks (Class I through Class V)powered by gasoline, propane, or electric motors (up to 15,000 units annually) primarily destined for the NorthAmerican market. The three proposed special purpose subzone sites would accommodate Nissan USA’smanufacturing facilities as well as its distribution and warehousing operations.
Nissan USA stated that its manufacturing facility has seen a 25 percent decrease in its workforce since1995, and that subzone status will not only allow Nissan USA to retain existing employees, but will also allow thepossibility of increasing employment as well as capital investment. Nissan USA further stated that subzone statuswill help Nissan USA’s facilities lower operating costs and thereby assist in maintaining its ability to contributesignificantly to the region’s economy. Nissan USA will finance any costs associated its Zone operations.
Nissan USA stated that its profit margins have been severely squeezed by low-cost overseas forkliftmanufacturers that not only enjoy lower production and net material costs, but can import the finished manufacturedforklifts into the United States at a duty rate of “Free,” while Nissan USA must pay duty on much of its importedraw material and components. The forklift manufacturing industry is also seeing increases in the price of steel,logistics, fuel, and labor and benefits for employees. Nissan USA stated that it seeks relief from the “inverted tariff”relationships that currently exist with its imported components and raw materials versus the finished products inorder to compete effectively and maintain its production at current and planned levels. FTZ procedures wouldexempt Nissan USA from duty payments on the foreign components used in export production. On its domesticsales and exports to NAFTA markets, the company would be able to choose the duty rate that applies to finishedfork-lift trucks (duty free) for the foreign-sourced inputs. Duties would be deferred or reduced on foreign productionequipment admitted to the proposed subzone until which time it becomes operational.
Nissan USA stated that it was forced to move the manufacturing of one pneumatic forklift truck modeloutside the United States to one of its underutilized facilities in 2004 due to price pressures and higher costsassociated with production in the United States, e.g. design, material costs and duty expenses, while imported forklifttrucks enter the United States with a duty rate of Free. Nissan USA further stated that if it can not become morecompetitive, it will be forced to consider relocating the manufacturing of another model in 2006 and may have toconsider moving the entire plant to underutilized facilities in Spain and other locations.
Nissan USA stated that manufacturing companies in China pose a threat to the company due to theavailability of inexpensive labor and material. With the growth of China’s forklift production capabilities, lower-priced Chinese forklift truck imports into the United States are expected to grow significantly once China’s domesticdemand is met. Nissan USA also noted the price advantage of manufacturers in Korea and Taiwan. Nissan USAstated that foreign-trade subzone status is necessary to reduce the cost of production at the Nissan USA facilities,allowing the facilities to be more competitive in both domestic and overseas markets. Nissan USA stated that ifsubzone status is granted, its product manufacturing costs will drop, the possibility of moving the pneumatic lineback to the United States will increase, and Nissan USA will reconsider moving additional manufacturing overseas.
(continued...)
III-2
Two of the U.S. producers reported an increase in overall capacity since January 1, 1999.1 ***. In 1999, NACCO Materials began sourcing Mexican-produced forklift frames from its Saltillo, Mexicomanufacturing facility. ***. ***.
*** increased its U.S. capacity in 2000 by *** trucks, an increase of *** percent over its 1999level. ***.
The ICI forklift truck industry exhibited an overall irregular increase in capacity of *** trucks (allframes) or (*** percent) for the calendar years of the period for which data were collected.
There is no known U.S. production of ICI forklift trucks under tolling arrangements. Similarly,there is no reported in-bond production nor production in foreign trade zones, although Nissan USA’sproduction facilities are the subject of a request for special-purpose subzone status.2
2 (...continued)The application is currently under review at the FFTZ Board and guidelines state that Nissan must have a
response by 8 months from the date of publication of the announcement in the Federal register, which would be mid-February 2006. See 70 FR 34742; NACCO USA’s prehearing brief, exh. 1; staff telephone interview with ***,Nissan USA, November 14, 2005.
III-3
U.S. PRODUCERS’ DOMESTIC SHIPMENTS, COMPANY TRANSFERS,AND EXPORT SHIPMENTS
Producers were asked to provide separate trade data with regard to their activities concerning“frames only.” In light of the Commission’s original definition of the domestic like product as consistingof a forklift truck with a U.S.-produced frame, these data were collected to determine where forkliftframes were being manufactured and whether an import or third party merchant market for framesexisted. Of the six responding U.S. producers, most-***-stated that they produced frames in the UnitedStates and internally consumed their entire production. *** reported purchasing forklift frames fromthird-party sources in the United States and ***. In 1999, *** began to ***. Under the Commission’sdefinition of the domestic like product in the original investigation, forklift trucks built upon *** frameswould not be considered U.S.-produced trucks, regardless of the value added in the United States.
Tables III-2, III-3, and III-4 present U.S. producers’ domestic shipments, company transfers, andexport shipments for ICI forklift truck frames, ICI forklift trucks assembled with U.S.-produced frames,and ICI forklift trucks assembled with all frames, regardless of origin, respectively.
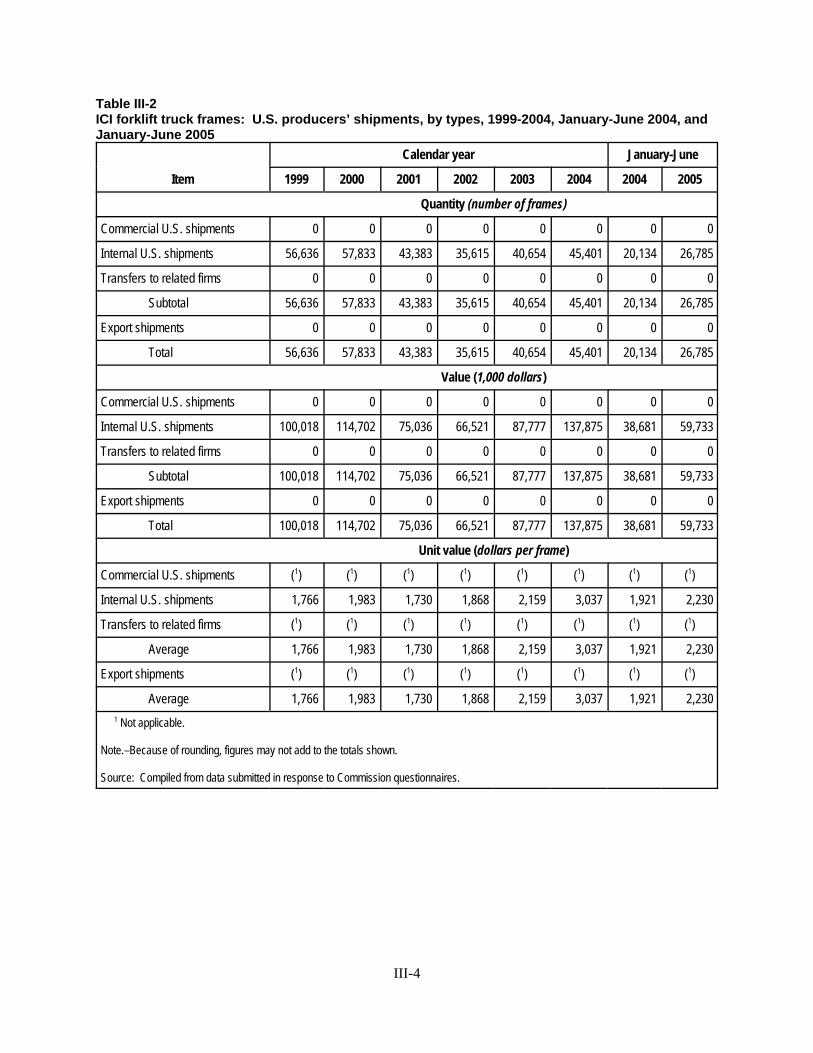
III-4
Table III-2ICI forklift truck frames: U.S. producers’ shipments, by types, 1999-2004, January-June 2004, andJanuary-June 2005
Item
Calendar year January-June
1999 2000 2001 2002 2003 2004 2004 2005
Quantity (number of frames)
Commercial U.S. shipments 0 0 0 0 0 0 0 0
Internal U.S. shipments 56,636 57,833 43,383 35,615 40,654 45,401 20,134 26,785
Transfers to related firms 0 0 0 0 0 0 0 0
Subtotal 56,636 57,833 43,383 35,615 40,654 45,401 20,134 26,785
Export shipments 0 0 0 0 0 0 0 0
Total 56,636 57,833 43,383 35,615 40,654 45,401 20,134 26,785
Value (1,000 dollars)
Commercial U.S. shipments 0 0 0 0 0 0 0 0
Internal U.S. shipments 100,018 114,702 75,036 66,521 87,777 137,875 38,681 59,733
Transfers to related firms 0 0 0 0 0 0 0 0
Subtotal 100,018 114,702 75,036 66,521 87,777 137,875 38,681 59,733
Export shipments 0 0 0 0 0 0 0 0
Total 100,018 114,702 75,036 66,521 87,777 137,875 38,681 59,733
Unit value (dollars per frame)
Commercial U.S. shipments (1) (1) (1) (1) (1) (1) (1) (1)
Internal U.S. shipments 1,766 1,983 1,730 1,868 2,159 3,037 1,921 2,230
Transfers to related firms (1) (1) (1) (1) (1) (1) (1) (1)
Average 1,766 1,983 1,730 1,868 2,159 3,037 1,921 2,230
Export shipments (1) (1) (1) (1) (1) (1) (1) (1)
Average 1,766 1,983 1,730 1,868 2,159 3,037 1,921 2,230
1 Not applicable.
Note.–Because of rounding, figures may not add to the totals shown.
Source: Compiled from data submitted in response to Commission questionnaires.
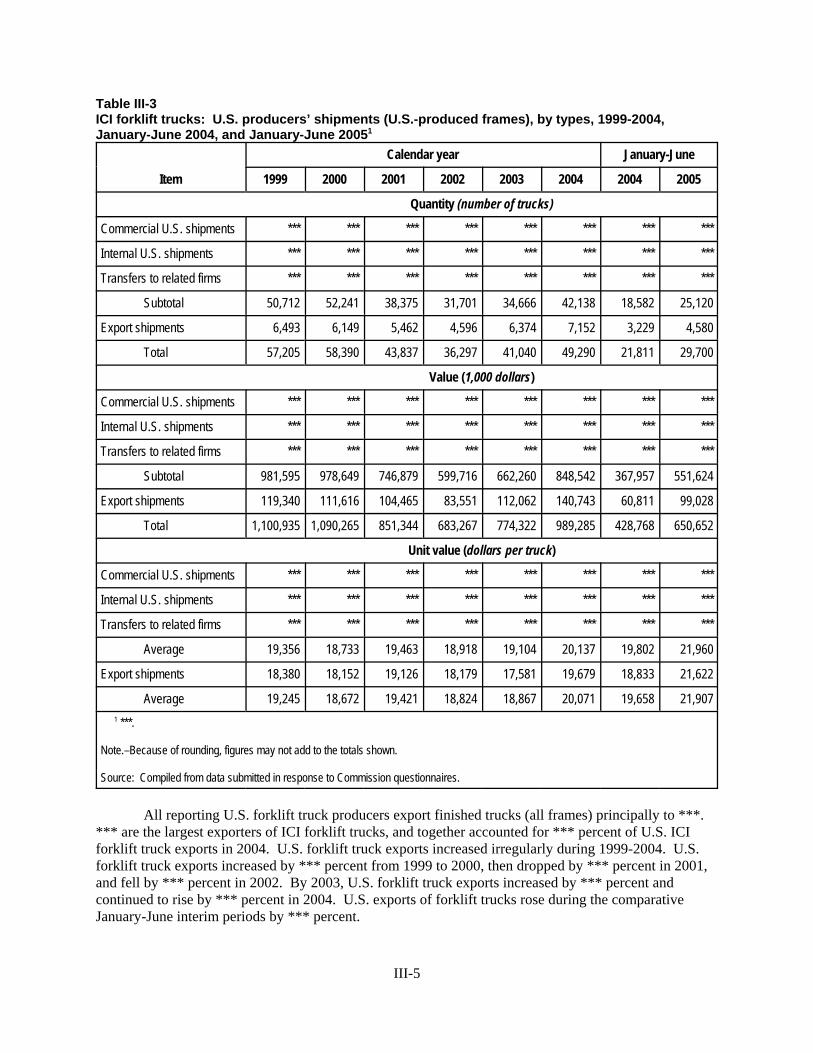
III-5
Table III-3ICI forklift trucks: U.S. producers’ shipments (U.S.-produced frames), by types, 1999-2004,January-June 2004, and January-June 20051
Item
Calendar year January-June
1999 2000 2001 2002 2003 2004 2004 2005
Quantity (number of trucks)
Commercial U.S. shipments *** *** *** *** *** *** *** ***
Internal U.S. shipments *** *** *** *** *** *** *** ***
Transfers to related firms *** *** *** *** *** *** *** ***
Subtotal 50,712 52,241 38,375 31,701 34,666 42,138 18,582 25,120
Export shipments 6,493 6,149 5,462 4,596 6,374 7,152 3,229 4,580
Total 57,205 58,390 43,837 36,297 41,040 49,290 21,811 29,700
Value (1,000 dollars)
Commercial U.S. shipments *** *** *** *** *** *** *** ***
Internal U.S. shipments *** *** *** *** *** *** *** ***
Transfers to related firms *** *** *** *** *** *** *** ***
Subtotal 981,595 978,649 746,879 599,716 662,260 848,542 367,957 551,624
Export shipments 119,340 111,616 104,465 83,551 112,062 140,743 60,811 99,028
Total 1,100,935 1,090,265 851,344 683,267 774,322 989,285 428,768 650,652
Unit value (dollars per truck)
Commercial U.S. shipments *** *** *** *** *** *** *** ***
Internal U.S. shipments *** *** *** *** *** *** *** ***
Transfers to related firms *** *** *** *** *** *** *** ***
Average 19,356 18,733 19,463 18,918 19,104 20,137 19,802 21,960
Export shipments 18,380 18,152 19,126 18,179 17,581 19,679 18,833 21,622
Average 19,245 18,672 19,421 18,824 18,867 20,071 19,658 21,907
1 ***.
Note.–Because of rounding, figures may not add to the totals shown.
Source: Compiled from data submitted in response to Commission questionnaires.
All reporting U.S. forklift truck producers export finished trucks (all frames) principally to ***. *** are the largest exporters of ICI forklift trucks, and together accounted for *** percent of U.S. ICIforklift truck exports in 2004. U.S. forklift truck exports increased irregularly during 1999-2004. U.S.forklift truck exports increased by *** percent from 1999 to 2000, then dropped by *** percent in 2001,and fell by *** percent in 2002. By 2003, U.S. forklift truck exports increased by *** percent andcontinued to rise by *** percent in 2004. U.S. exports of forklift trucks rose during the comparativeJanuary-June interim periods by *** percent.
3 ***’s U.S. producers’ questionnaire response, section II-18. 4 ***’s U.S. producers’ questionnaire response, section II-18. 5 NACCO USA’s importers’ questionnaire response, sections II-7a and II-7b and hearing transcript, pp. 94-95. 6 ***’s importers’ questionnaire response, sections II-7a and II-7b.
III-6
Table III-4ICI forklift trucks: U.S. producers’ shipments (all frames), by types, 1999-2004, January-June 2004,and January-June 2005
* * * * * * *
U.S. PRODUCERS’ INVENTORIES
Table III-5 presents U.S. producers’ inventories of ICI forklift truck frames, ICI forklift trucks assembled with U.S.-produced frames, and all ICI forklift trucks, regardless of frame origin.
Table III-5ICI forklift truck frames, trucks (U.S.-produced frames), and trucks (all frames): U.S. producers’end-of-period inventories, 1999-2004, January-June 2004, and January-June 2005
* * * * * * *
U.S. PRODUCERS’ PURCHASES
During the period for which data were collected, *** purchased forklift truck frames from third-party sources in the United States ***.3 Other than direct imports, *** purchased complete ICI forklifttrucks since January 1, 1999. From 2001 onward, ***.4
Table III-6ICI forklift trucks: U.S. producers’ purchases of U.S.-produced and imported frames, completetrucks, and ratios of purchases to production of ICI forklift trucks, 1999-2004, January-June 2004,and January-June 2005
* * * * * * *
U.S. PRODUCERS’ IMPORTS
*** U.S. producers directly imported ICI forklift truck frames and *** imported complete trucksduring the period for which data were collected. NACCO USA imported frames from its wholly ownedMexican subsidiary, NACCO Materials Handling Group S.A. de C.V., located in Saltillo, Mexico.5 ***imported complete trucks from ***.
*** directly imported frames from ***.6 The *** trucks produced by *** are built uponimported frames.
Table III-7ICI forklift trucks: U.S. producers’ imports of frames, and ratios of imports to production of ICIforklift trucks, 1999-2004, January-June 2004, and January-June 2005
* * * * * * *

7 NACCO USA plant trip notes, Berea, KY (August 23, 2005), pp. 2-3.
III-7
U.S. PRODUCERS’ EMPLOYMENT, WAGES, AND PRODUCTIVITY
The number of production and related workers (PRWs) dedicated to both the production offrames and to the production of trucks assembled with U.S.-produced frames decreased irregularly from1999 to 2004, largely due to ***. However, the total number of PRWs increased irregularly during theperiod for which data were gathered largely due to the irregular increase in ***.7
Table III-8ICI forklift truck frames, trucks (U.S.-produced frames), and trucks (all frames): Average number ofproduction and related workers, hours worked, wages paid, hourly wages, productivity, and unitlabor costs, 1999-2004, January-June 2004, and January-June 2005
Item
Calendar year January-June
1999 2000 2001 2002 2003 2004 2004 2005
Frames:
PRWs (number) 379 377 278 247 255 329 256 266
Hours worked by PRWs (1,000 hours) 730 701 539 444 467 607 224 257
Wages paid to PRWs (1,000 dollars) 14,562 13,901 9,974 8,380 9,499 12,649 4,854 6,096
Hourly wages $19.95 $19.83 $18.50 $18.87 $20.34 $20.84 $21.67 $23.72
Productivity (frames per 1,000 hours) 77.6 81.2 80.1 79.2 89.3 80.7 98.0 113.9
Unit labor costs (per frame) $257 $244 $231 $238 $228 $258 $221 $208
Trucks (U.S.-produced frames):
PRWs (number) 1,563 1,559 1,283 1,129 1,135 1,436 1,374 1,407
Hours worked by PRWs (1,000 hours) 3,152 3,017 2,766 2,267 2,315 2,868 1,349 1,522
Wages paid to PRWs (1,000 dollars) 64,353 59,911 46,456 40,587 45,408 58,878 27,173 33,400
Hourly wages $20.42 $19.86 $16.80 $17.90 $19.61 $20.53 $20.14 $21.94
Productivity (trucks per 1,000 hours) 18.2 19.0 15.8 15.8 18.2 17.3 16.6 19.5
Unit labor costs (per truck) $1,125 $1,042 $1,063 $1,134 $1,075 $1,184 $1,217 $1,126
Trucks (all frames):
PRWs (number) *** *** *** *** *** *** *** ***
Hours worked by PRWs (1,000 hours) *** *** *** *** *** *** *** ***
Wages paid to PRWs (1,000 dollars) *** *** *** *** *** *** *** ***
Hourly wages *** *** *** *** *** *** *** ***
Productivity (trucks per 1,000 hours) *** *** *** *** *** *** *** ***
Unit labor costs (per truck) *** *** *** *** *** *** *** ***
Source: Compiled from data submitted in response to Commission questionnaires.

8 U.S. producers of ICI forklift trucks and their fiscal year ends are Komatsu (March 31), Mitsubishi (December31), NACCO (December 31), Nissan (December 31), TCM (March 31), and Toyota (March 31). 9 Response of NACCO to question II-2 of the producers’ questionnaire.
III-8
FINANCIAL CONDITION OF THE U.S. INDUSTRY
Background
Six producers8 of ICI forklift trucks, accounting for an estimated 90 percent or more of sales ofU.S.-produced ICI forklift trucks in 2004, supplied financial data. Tables for value added data for thelargest volume sales model of ICI forklift trucks produced by each firm during their 2004 fiscal year arepresented in appendix E. These large-volume models accounted for between 9 and 66 percent ofproducers’ net sales value in 2004.
NACCO completed the phase-out of its Danville, IL, manufacturing operation and transferredspecific models of ICI forklift trucks in the *** from Danville to its Berea, KY, operation during the firstquarter of 2002. This project required nearly $*** of capital investment, and more than $*** in one-timeoperational expenses to improve its competitiveness, and required nearly two years to complete. NACCOclosed its Lenoir, NC, plant to further adjust its manufacturing structural costs to address the competitiveICI forklift truck business during the second quarter of 2004. It moved *** from the Lenoir operation toits Berea, KY, Greenville, NC, and Sulligent, AL, operations. This project took 18 months to completeand required more than $*** in new equipment and tooling as well as more than $*** in one-timeoperational expenses.9
Operations on ICI Forklift Trucks
Income-and-loss data for U.S. producers on their ICI forklift truck (U.S.-produced frames only)operations are presented in table III-9a, average unit values per truck are shown in table III-10a, and selected financial data, by firms, are presented in table III-11a. Income-and-loss data for U.S. producerson their ICI forklift truck (all frames) operations are presented in table III-9b, average unit values pertruck are shown in table III-10b, and selected financial data, by firms, are presented in table III-11b.
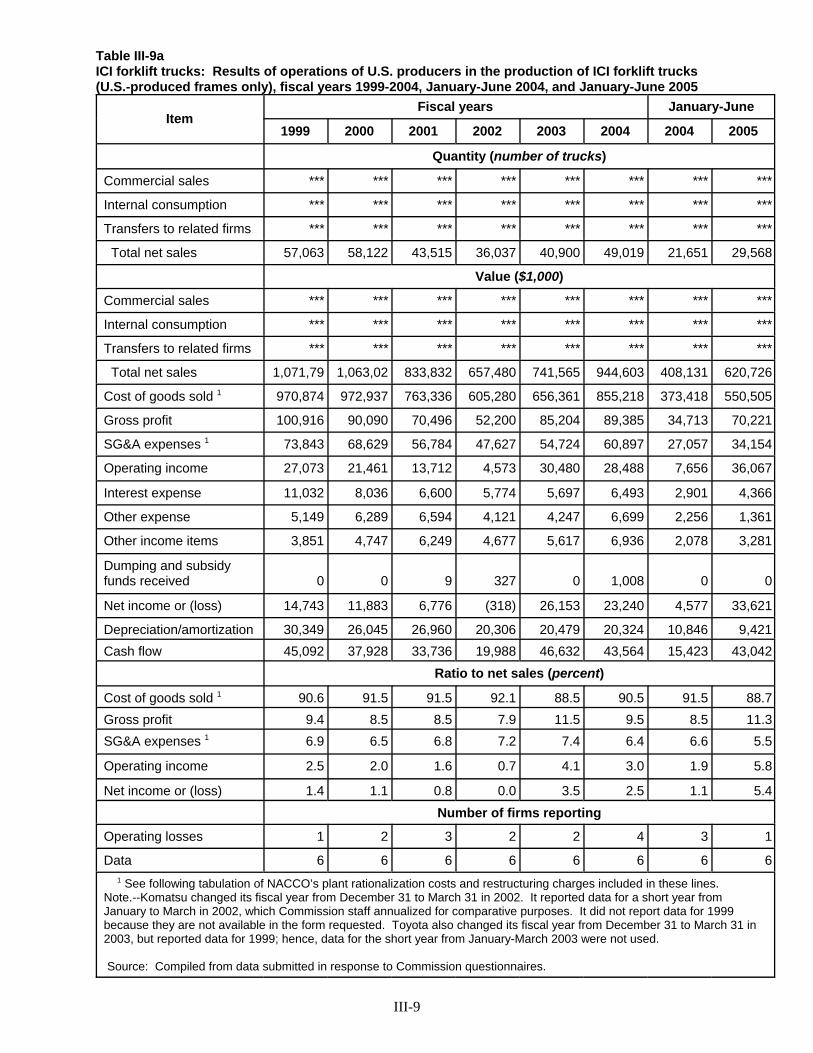
III-9
Table III-9aICI forklift trucks: Results of operations of U.S. producers in the production of ICI forklift trucks(U.S.-produced frames only), fiscal years 1999-2004, January-June 2004, and January-June 2005
ItemFiscal years January-June
1999 2000 2001 2002 2003 2004 2004 2005
Quantity (number of trucks)
Commercial sales *** *** *** *** *** *** *** ***
Internal consumption *** *** *** *** *** *** *** ***
Transfers to related firms *** *** *** *** *** *** *** ***
Total net sales 57,063 58,122 43,515 36,037 40,900 49,019 21,651 29,568
Value ($1,000)
Commercial sales *** *** *** *** *** *** *** ***
Internal consumption *** *** *** *** *** *** *** ***
Transfers to related firms *** *** *** *** *** *** *** ***
Total net sales 1,071,79 1,063,02 833,832 657,480 741,565 944,603 408,131 620,726
Cost of goods sold 1 970,874 972,937 763,336 605,280 656,361 855,218 373,418 550,505
Gross profit 100,916 90,090 70,496 52,200 85,204 89,385 34,713 70,221
SG&A expenses 1 73,843 68,629 56,784 47,627 54,724 60,897 27,057 34,154
Operating income 27,073 21,461 13,712 4,573 30,480 28,488 7,656 36,067
Interest expense 11,032 8,036 6,600 5,774 5,697 6,493 2,901 4,366
Other expense 5,149 6,289 6,594 4,121 4,247 6,699 2,256 1,361
Other income items 3,851 4,747 6,249 4,677 5,617 6,936 2,078 3,281
Dumping and subsidyfunds received 0 0 9 327 0 1,008 0 0
Net income or (loss) 14,743 11,883 6,776 (318) 26,153 23,240 4,577 33,621
Depreciation/amortization 30,349 26,045 26,960 20,306 20,479 20,324 10,846 9,421Cash flow 45,092 37,928 33,736 19,988 46,632 43,564 15,423 43,042
Ratio to net sales (percent)
Cost of goods sold 1 90.6 91.5 91.5 92.1 88.5 90.5 91.5 88.7Gross profit 9.4 8.5 8.5 7.9 11.5 9.5 8.5 11.3SG&A expenses 1 6.9 6.5 6.8 7.2 7.4 6.4 6.6 5.5
Operating income 2.5 2.0 1.6 0.7 4.1 3.0 1.9 5.8
Net income or (loss) 1.4 1.1 0.8 0.0 3.5 2.5 1.1 5.4Number of firms reporting
Operating losses 1 2 3 2 2 4 3 1
Data 6 6 6 6 6 6 6 6
1 See following tabulation of NACCO’s plant rationalization costs and restructuring charges included in these lines.Note.--Komatsu changed its fiscal year from December 31 to March 31 in 2002. It reported data for a short year fromJanuary to March in 2002, which Commission staff annualized for comparative purposes. It did not report data for 1999because they are not available in the form requested. Toyota also changed its fiscal year from December 31 to March 31 in2003, but reported data for 1999; hence, data for the short year from January-March 2003 were not used.
Source: Compiled from data submitted in response to Commission questionnaires.

III-10
Table III-9bICI forklift trucks: Results of operations of U.S. producers in the production of ICI forklift trucks(all frames), fiscal years 1999-2004, January-June 2004, and January-June 2005
* * * * * * *
NACCO’s plant rationalization costs and restructuring charges included in the data reported intable III-9a and table III-9b are shown in the following tabulation ($1,000):
* * * * * * *
Table III-10aICI forklift trucks: Per-unit results of operations of U.S. producers in the production of ICI forklifttrucks (U.S.-produced frames only), fiscal years 1999-2004, January-June 2004, and January-June2005
ItemFiscal years January-June
1999 2000 2001 2002 2003 2004 2004 2005
Value (dollars per truck)
Net sales 18,783 18,290 19,162 18,245 18,131 19,270 18,850 20,993
Cost of goods sold 17,014 16,740 17,542 16,796 16,048 17,447 17,247 18,618
Gross profit 1,769 1,550 1,620 1,449 2,083 1,823 1,603 2,375
SG&A expenses 1,294 1,181 1,305 1,322 1,338 1,242 1,250 1,155
Operating income 474 369 315 127 745 581 354 1,220
Net income or (loss) 258 204 156 (9) 639 474 211 1,137
Source: Compiled from data submitted in response to Commission questionnaires.
Table III-10bICI forklift trucks: Per-unit results of operations of U.S. producers in the production of ICI forklifttrucks (all frames), fiscal years 1999-2004, January-June 2004, and January-June 2005
* * * * * * *
Table III-11aICI forklift trucks: Selected results of operations of U.S. producers in the production of ICI forklifttrucks (U.S.-produced frames only), by firms, fiscal years 1999-2004, January-June 2004, andJanuary-June 2005
* * * * * * *
Table III-11bICI forklift trucks: Selected results of operations of U.S. producers in the production of ICI forklifttrucks (all frames), by firms, fiscal years 1999-2004, January-June 2004, and January-June 2005
* * * * * * *

10 E-mail from ***. 11 E-mail from ***. 12 Ibid. 13 E-mail from ***. 14 E-mail from ***.
III-11
U.S.-Produced Frames
Based on operations on ICI forklift trucks with U.S.-produced frames only, U.S. producers’average operating income margin of 2.5 percent of total net sales in 1999 decreased steadily to 0.7 percentby 2002, and then increased to 4.1 percent in 2003 and 3.0 percent in 2004. The operating income marginrose to its highest level of 5.8 percent in January-June 2005 compared to 1.9 percent in January-June2004. Out of six firms, only one firm reported operating losses in 1999 and January-June 2005, two firmsduring 2000 and 2002-03, three firms during 2001 and January-June 2004, and four firms in 2004.
The quantity of total net sales decreased irregularly by about 14 percent from 1999 to 2004. Thequantity of total net sales increased by about 2 percent from 1999 to 2000, decreased by about 25 percentin 2001, declined by about 17 percent in 2002, increased by about 13 percent in 2003, and then rose byabout 20 percent in 2004. The quantity of total net sales increased by about 37 percent in January-June2005 compared with January-June 2004.
Operating income steadily declined by all measures from 1999 to 2002 as unit revenues declinedfaster than unit operating costs (in 2000 and 2002) or unit operating costs increased more than unitrevenues (2001). The steady decline in operating results ended in 2003, as net sales values and allmeasures of operating income increased. Despite a large increase in net sales values in 2004 (fueledprincipally by a large increase in net sales quantities), operating income declined marginally. Everymeasure of the producers' results was higher in January-June 2005 compared to January-June 2004 data,as very large increases in sales quantities and values more than offset increases in cost, and operatingincome rose much higher.
Komatsu reported ***. The quantity sold by Komatsu was ***, accounting for *** during theperiod examined.
Mitsubishi, currently the *** producer, accounting for *** percent of net sales volume in 2004,was the ***, accounting for *** percent of net sales volume in 1999. With respect to ***, Mitsubishistated that:
***.10
NACCO is the *** producer, accounting for *** percent of net sales volume in 2004, ***. NACCO reported the ***. With respect to ***, NACCO identified two causes:
***.11
With respect to ***, NACCO indicated that:***.12
Nissan reported ***. Nissan is the ***, accounting for *** percent of net sales volume in 2004,as opposed to *** percent in 1999. With respect to ***, Nissan indicated that:
***.13
TCM reported ***. Toyota reported the ***.14 Toyota was ***, accounting for *** percent of net sales volume,
after being the ***, accounting for *** percent in 1999.

III-12
All Frames
Based on operations on ICI forklift trucks with both U.S.-produced and imported frames, U.S.producers’ average operating income margin of *** percent of total net sales in 1999 decreased to anegative *** percent in 2001 and a negative *** percent in 2002, and then increased to *** percent in2003 and only *** percent in 2004. The operating income margin rose to its highest level of *** percentin January-June 2005 compared to a negative *** percent in January-June 2004. Out of six firms, onlyone firm reported operating losses in 1999 and 2000, two firms in January-June 2005, three firms during2001-03 and January-June 2004, and four firms in 2004.
The operating income margins for ICI forklift truck (all frames) operations are lower than thosefor ICI forklift truck (U.S.-produced frames only) operations.
*** was the ***, accounting for *** percent of net sales volume in 1999 for all framesoperations. *** was the ***, accounting for *** percent and *** was the ***, accounting for *** percentin 1999.
*** was the ***, accounting for *** percent of net sales volume in 2004 for all framesoperations. *** was the ***, accounting for *** percent and *** was the ***, accounting for *** percentin 2004.
NACCO reported the ***.
Cost of Goods Sold
The distribution of cost of goods sold (U.S.-produced frames only) into the major components ofcost is presented in the following tabulation (in percent):
ItemFiscal years January-June
1999 2000 2001 2002 2003 2004 2004 2005
Raw materials:
Imported 27.1 28.9 31.1 30.3 29.3 31.5 33.0 29.5
Domestic 51.5 51.9 49.4 49.4 51.7 48.6 47.4 50.3
Total 78.5 80.8 80.4 79.8 80.9 80.1 80.4 79.8
Direct labor 6.0 6.3 6.0 7.7 7.4 7.4 7.7 6.8
Other factory costs 15.5 12.9 13.6 12.5 11.7 12.5 11.9 13.5
Total cost of goods 100.0 100.0 100.0 100.0 100.0 100.0 100.0 100.0
Source: Compiled from data submitted in response to Commission questionnaires.
The distribution of cost of goods sold (all frames) into the major components of cost is presentedin the following tabulation (in percent):
* * * * * * *
The distribution of total raw material costs into imported and domestic components, by firms, isshown in table III-12a for U.S.-produced frames only and in table III-12b for all frames. ***.
15 Voice mail from ***. 16 E-mail from ***.
III-13
Table III-12aICI forklift trucks: Distribution of raw material costs of U.S. producers of ICI forklift trucks (U.S.-produced frames only), by firms, fiscal years 1999-2004, January-June 2004, and January-June2005
* * * * * * *
Table III-12bICI forklift trucks: Distribution of raw material costs of U.S. producers of ICI forklift trucks (allframes), by firms, fiscal years 1999-2004, January-June 2004, and January-June 2005
* * * * * * *
Table III-13 shows major domestically produced and foreign-sourced components used in theproduction of ICI forklift trucks (all frames) during fiscal year 2004 for each firm. *** acquired morecomponents from Japan compared to other producers. ***.15 ***.16
Table III-13ICI forklift trucks: Major domestically produced and foreign-sourced components used in theproduction of ICI forklift trucks (all frames) during fiscal year 2004, by firms
* * * * * * *
Variance Analysis
The variance analysis for the six U.S. producers of ICI forklift trucks (U.S.-produced framesonly) is presented in table III-14a and (for all frames) in table III-14b. The information for this varianceanalysis is derived from table III-9a and table III-9b, respectively. The variance analysis provides anassessment of changes in profitability as related to changes in pricing, cost, and volume. This analysis ismore effective when the product involved is a homogeneous product with no variation in product mixwithin a firm and between firms. The analysis, for U.S.-produced frames only, shows that the increase inoperating income from 1999 to 2004 was attributable to the higher favorable price variance which wasmostly offset by unfavorable net cost/expense variance and the smaller unfavorable net volume variance. From January-June 2004 to January-June 2005, the increase in operating income was attributable mainlyto the favorable price variance and smaller favorable net volume variances, which were partly offset bythe unfavorable net cost/expense variance.
The analysis for all frames shows that the decrease in operating income from 1999 to 2004 wasattributable to the higher unfavorable net cost/expense variance which was mostly offset by favorableprice variance and the smaller favorable net volume variance. From January-June 2004 to January-June2005, the increase in operating income was attributable mainly to the favorable price variance which waspartly offset by the unfavorable net cost/expense variance and smaller unfavorable net volume variances.
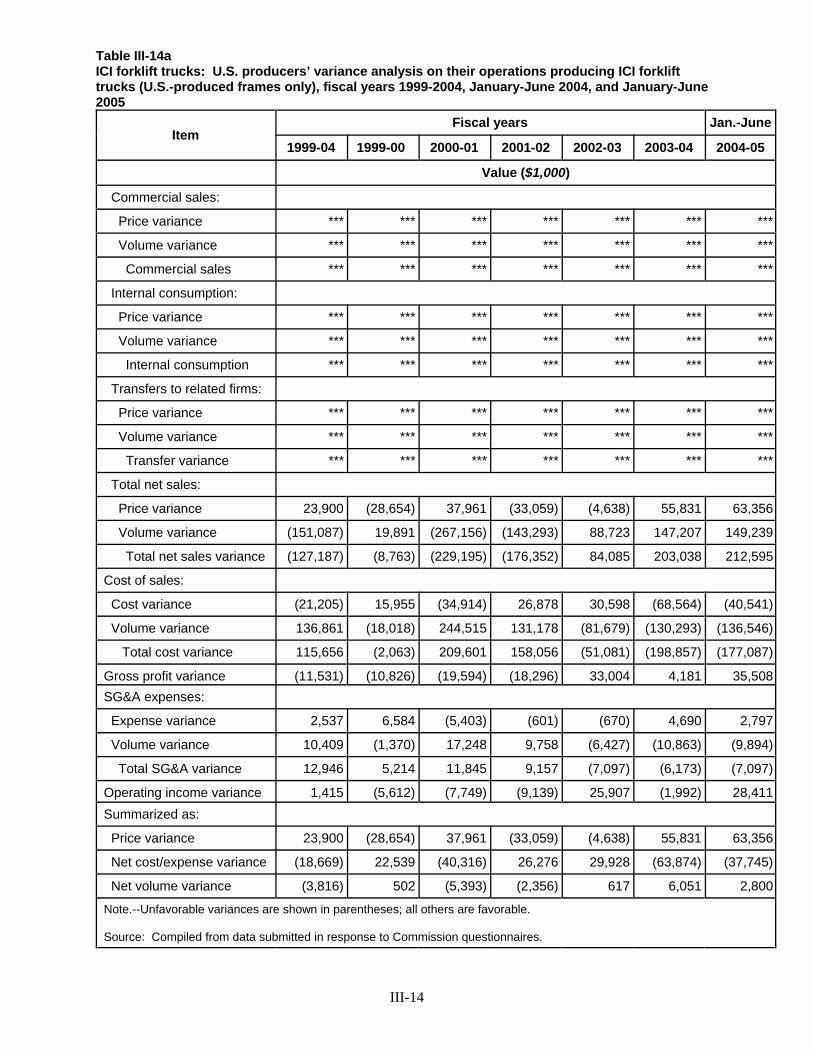
III-14
Table III-14aICI forklift trucks: U.S. producers’ variance analysis on their operations producing ICI forklifttrucks (U.S.-produced frames only), fiscal years 1999-2004, January-June 2004, and January-June2005
ItemFiscal years Jan.-June
1999-04 1999-00 2000-01 2001-02 2002-03 2003-04 2004-05
Value ($1,000)
Commercial sales:
Price variance *** *** *** *** *** *** ***
Volume variance *** *** *** *** *** *** ***
Commercial sales *** *** *** *** *** *** ***
Internal consumption:
Price variance *** *** *** *** *** *** ***
Volume variance *** *** *** *** *** *** ***
Internal consumption *** *** *** *** *** *** ***
Transfers to related firms:
Price variance *** *** *** *** *** *** ***
Volume variance *** *** *** *** *** *** ***
Transfer variance *** *** *** *** *** *** ***
Total net sales:
Price variance 23,900 (28,654) 37,961 (33,059) (4,638) 55,831 63,356
Volume variance (151,087) 19,891 (267,156) (143,293) 88,723 147,207 149,239
Total net sales variance (127,187) (8,763) (229,195) (176,352) 84,085 203,038 212,595
Cost of sales:
Cost variance (21,205) 15,955 (34,914) 26,878 30,598 (68,564) (40,541)
Volume variance 136,861 (18,018) 244,515 131,178 (81,679) (130,293) (136,546)
Total cost variance 115,656 (2,063) 209,601 158,056 (51,081) (198,857) (177,087)
Gross profit variance (11,531) (10,826) (19,594) (18,296) 33,004 4,181 35,508SG&A expenses:
Expense variance 2,537 6,584 (5,403) (601) (670) 4,690 2,797
Volume variance 10,409 (1,370) 17,248 9,758 (6,427) (10,863) (9,894)
Total SG&A variance 12,946 5,214 11,845 9,157 (7,097) (6,173) (7,097)
Operating income variance 1,415 (5,612) (7,749) (9,139) 25,907 (1,992) 28,411Summarized as:
Price variance 23,900 (28,654) 37,961 (33,059) (4,638) 55,831 63,356
Net cost/expense variance (18,669) 22,539 (40,316) 26,276 29,928 (63,874) (37,745)
Net volume variance (3,816) 502 (5,393) (2,356) 617 6,051 2,800
Note.--Unfavorable variances are shown in parentheses; all others are favorable.
Source: Compiled from data submitted in response to Commission questionnaires.
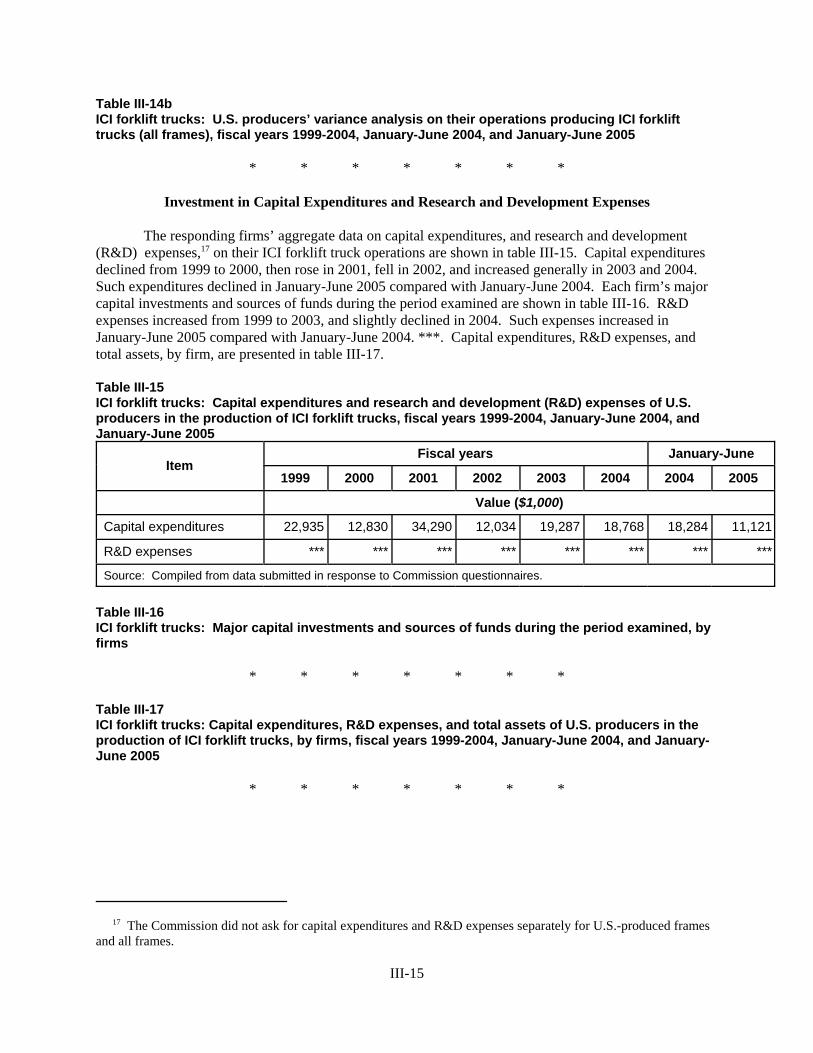
17 The Commission did not ask for capital expenditures and R&D expenses separately for U.S.-produced framesand all frames.
III-15
Table III-14bICI forklift trucks: U.S. producers’ variance analysis on their operations producing ICI forklifttrucks (all frames), fiscal years 1999-2004, January-June 2004, and January-June 2005
* * * * * * *
Investment in Capital Expenditures and Research and Development Expenses
The responding firms’ aggregate data on capital expenditures, and research and development(R&D) expenses,17 on their ICI forklift truck operations are shown in table III-15. Capital expendituresdeclined from 1999 to 2000, then rose in 2001, fell in 2002, and increased generally in 2003 and 2004. Such expenditures declined in January-June 2005 compared with January-June 2004. Each firm’s majorcapital investments and sources of funds during the period examined are shown in table III-16. R&Dexpenses increased from 1999 to 2003, and slightly declined in 2004. Such expenses increased inJanuary-June 2005 compared with January-June 2004. ***. Capital expenditures, R&D expenses, andtotal assets, by firm, are presented in table III-17.
Table III-15ICI forklift trucks: Capital expenditures and research and development (R&D) expenses of U.S.producers in the production of ICI forklift trucks, fiscal years 1999-2004, January-June 2004, andJanuary-June 2005
ItemFiscal years January-June
1999 2000 2001 2002 2003 2004 2004 2005
Value ($1,000)
Capital expenditures 22,935 12,830 34,290 12,034 19,287 18,768 18,284 11,121
R&D expenses *** *** *** *** *** *** *** ***
Source: Compiled from data submitted in response to Commission questionnaires.
Table III-16ICI forklift trucks: Major capital investments and sources of funds during the period examined, byfirms
* * * * * * *
Table III-17ICI forklift trucks: Capital expenditures, R&D expenses, and total assets of U.S. producers in theproduction of ICI forklift trucks, by firms, fiscal years 1999-2004, January-June 2004, and January-June 2005
* * * * * * *

18 The Commission did not ask for total assets separately for U.S.-produced frames and all frames.
III-16
Assets and Return on Investment
The Commission’s questionnaire requested data on total assets18 used in the production,warehousing, and sale of ICI forklift trucks to compute return on investment (ROI). Although ROI can becomputed in many different ways, a commonly used method is income divided by total assets. Therefore,ROI is calculated as operating income divided by total assets used in the production, warehousing, andsale of ICI forklift trucks.
Data on the U.S. ICI forklift trucks producers’ total assets and their ROI are presented in table III-18. The total assets utilized in the production, warehousing, and sales of ICI forklift trucks decreasedfrom 1999 to 2001, and then increased thereafter.

III-17
Table III-18ICI forklift trucks: Value of assets and return on investment of U.S. producers in the production ofICI forklift trucks, fiscal years 1999-2004, January-June 2004, and January-June 2005
ItemFiscal years
1999 2000 2001 2002 2003 2004
Value ($1,000)
Value of assets:
Current assets:
Cash and equivalents 21,974 30,320 16,027 4,208 6,474 8,295
Accounts receivable, net 118,844 112,727 81,173 110,823 102,449 127,994
Inventories 165,458 160,873 149,082 163,193 208,721 273,358
Other current assets 19,978 19,262 29,756 67,767 83,224 82,448
Total current assets 326,254 323,182 276,038 345,991 400,868 492,095
Property, plant and equipment:
Original cost 251,494 254,029 278,467 290,092 305,909 321,334
Less: Accumulated Depreciation 109,123 114,970 132,432 152,173 165,681 175,393
Book value 142,371 139,059 146,035 137,919 140,228 145,941
Other non-current assets 151,496 148,018 148,038 183,837 180,392 185,554
Total assets 620,121 610,259 570,111 667,747 721,488 823,590
Operating income or (loss) forU.S.-produced frames only 27,073 21,461 13,712 4,573 30,480 28,488
Operating income or (loss) for allframes *** *** *** *** *** ***
Ratio of operating income to total assets (percent)
Return on investment for U.S.-produced frames only 4.4 3.5 2.4 0.7 4.2 3.5
Return on investment for allframes *** *** *** *** *** ***
Source: Compiled from data submitted in response to Commission questionnaires.
The domestic industry’s ROI for U.S.-produced frames declined from 4.4 percent in 1999 to 0.7percent in 2002, and then increased to 4.2 percent in 2003 and fell to 3.5 percent in 2004. The domesticindustry’s ROI for all frames declined from *** percent in 1999 to a negative *** percent in 2001 and anegative *** percent in 2002, and then increased to *** percent in 2003 and then declined to *** percentin 2004.

1 For example, internal combustion forklift trucks with lifting capacities of more than 15,000 pounds are included,as are forklift truck component parts. 2 Official import statistics for the three HTS subheadings identified in Commerce’s scope contain entries fromJapan of $26 million - $46 million per year (including both components and finished vehicles). CDSOA receipts,however, are substantially lower even though, as noted in Part I of this report, such data are believed to reflectentries prior to 1999. In contrast, no U.S. importer reported any imports of subject merchandise from Japan duringthe period for which data were collected, nor did any U.S. producer affiliated with a Japanese manufacturer orexporter. 3 The importing firms included: ***. 4 Investigation No. 731-TA-377: Internal Combustion Industrial Forklift Trucks from Japan – Staff Report, p. A-22. 5 The stock of Yale Materials was acquired at various times and by 1985, 97 percent of Yale was owned byNACCO. The remaining 3 percent was acquired thereafter. On January 1, 1994, Yale Materials Handling Corp.was merged into Hyster Co., a Delaware Corp. and the corporation’s name was changed to NACCO MaterialsHandling Group, Inc. (referred to in this report as NACCO USA). Hyster Co. was acquired by NACCO Industries,Inc., the parent company of NACCO USA through a single transaction, in May 1989. ***. NACCO USA’s 198910K, p. 2; ***, e-mail November 18, 2004; NACCO USA’s U.S. producers’ questionnaire response, section I-7;***, e-mail November 21, 2005. 6 Investigation No. 731-TA-377: Internal Combustion Industrial Forklift Trucks from Japan – Staff Report, p. A-63. 7 *** reported that it imported *** from Japan. Investigation No. 731-TA-377 (Review): Internal CombustionIndustrial Forklift Trucks from Japan – Staff Report, p. I-28.
IV-1
PART IV: U.S. IMPORTS AND THE FOREIGN INDUSTRY
U.S. IMPORTS
Data contained in this section are derived from seven importer questionnaire responses thatcontained usable data. Because the HTS subheadings that provide for ICI forklift trucks and parts containboth subject and nonsubject1 product, official statistics are not believed to reflect accurately imports ofICI forklift trucks as defined by the scope of the subject order.2 Accordingly, the Commission staff reliedon questionnaire responses for imports from countries other than Japan3 and estimated imports from Japanusing data obtained from the three responding manufacturers and exporters of ICI forklift trucks fromJapan. These data are presented in table IV-1.
During the period examined for the original investigation (1985-87), the major portion of importsof the subject ICI forklift trucks from Japan were accounted for by the U.S. affiliates of the majorJapanese producers,4 with Yale (now NACCO USA),5 accounting for *** of such imports.6 During theperiod examined for the initial review (January 1997-September 1999) *** reported imports of thesubject ICI forklift trucks from Japan.7 *** firms reported imports of the subject ICI forklift trucks fromJapan during the period for which data were gathered for this second review (January 1999-June 2005),although modest volumes reportedly were exported from Japan to the United States in 1999 and 2000.
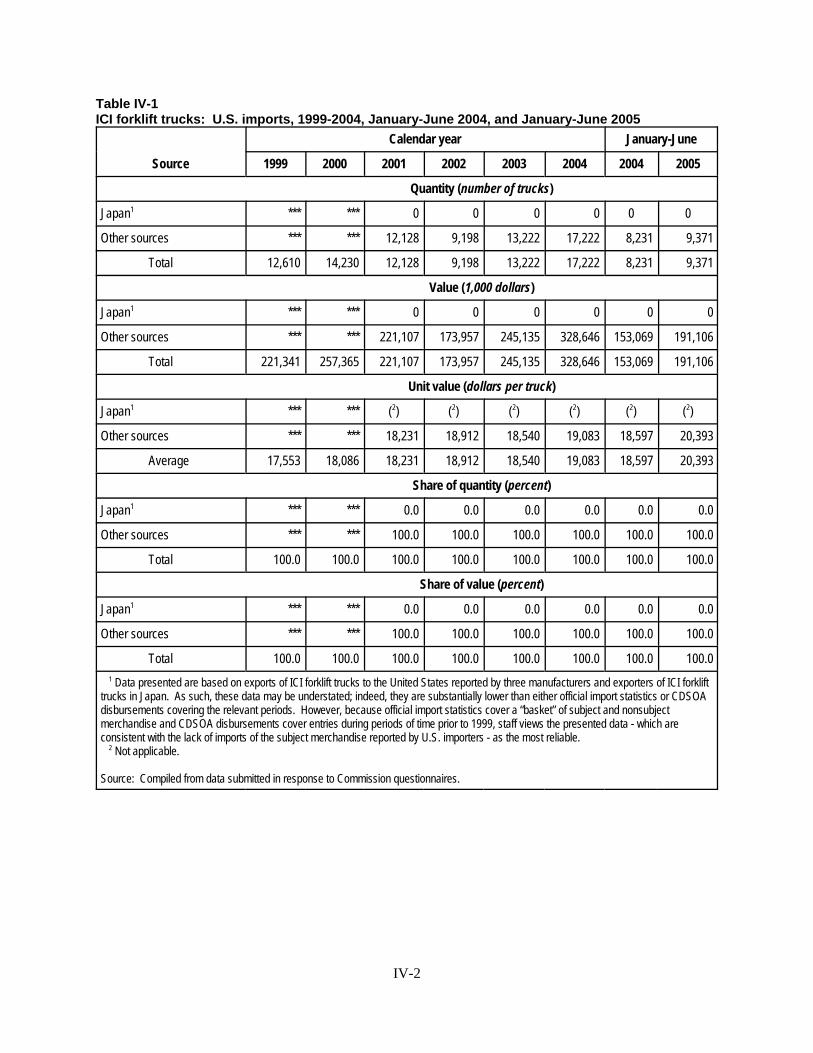
IV-2
Table IV-1ICI forklift trucks: U.S. imports, 1999-2004, January-June 2004, and January-June 2005
Source
Calendar year January-June
1999 2000 2001 2002 2003 2004 2004 2005
Quantity (number of trucks)
Japan1 *** *** 0 0 0 0 0 0
Other sources *** *** 12,128 9,198 13,222 17,222 8,231 9,371
Total 12,610 14,230 12,128 9,198 13,222 17,222 8,231 9,371
Value (1,000 dollars)
Japan1 *** *** 0 0 0 0 0 0
Other sources *** *** 221,107 173,957 245,135 328,646 153,069 191,106
Total 221,341 257,365 221,107 173,957 245,135 328,646 153,069 191,106
Unit value (dollars per truck)
Japan1 *** *** (2) (2) (2) (2) (2) (2)
Other sources *** *** 18,231 18,912 18,540 19,083 18,597 20,393
Average 17,553 18,086 18,231 18,912 18,540 19,083 18,597 20,393
Share of quantity (percent)
Japan1 *** *** 0.0 0.0 0.0 0.0 0.0 0.0
Other sources *** *** 100.0 100.0 100.0 100.0 100.0 100.0
Total 100.0 100.0 100.0 100.0 100.0 100.0 100.0 100.0
Share of value (percent)
Japan1 *** *** 0.0 0.0 0.0 0.0 0.0 0.0
Other sources *** *** 100.0 100.0 100.0 100.0 100.0 100.0
Total 100.0 100.0 100.0 100.0 100.0 100.0 100.0 100.0
1 Data presented are based on exports of ICI forklift trucks to the United States reported by three manufacturers and exporters of ICI forklifttrucks in Japan. As such, these data may be understated; indeed, they are substantially lower than either official import statistics or CDSOAdisbursements covering the relevant periods. However, because official import statistics cover a “basket” of subject and nonsubjectmerchandise and CDSOA disbursements cover entries during periods of time prior to 1999, staff views the presented data - which areconsistent with the lack of imports of the subject merchandise reported by U.S. importers - as the most reliable. 2 Not applicable.
Source: Compiled from data submitted in response to Commission questionnaires.

8 In 1993, NACCO, already the parent corporation of Yale, acquired Hyster Co., the petitioner in the originalinvestigation. Investigation No. 731-TA-377 (Review): Internal Combustion Industrial Forklift Trucks from Japan– Staff Report, p. I-23. 9 Investigation No. 731-TA-377: Internal Combustion Industrial Forklift Trucks from Japan – Staff Report, p. A-69. 10 Investigation No. 731-TA-377 (Review): Internal Combustion Industrial Forklift Trucks from Japan – StaffReport, pp. IV-1 and IV-2. 11 Ibid., p. IV-2.
IV-3
During the original investigation, imports by ***8 *** came from countries other than Japan. ***imported primarily from Korea and *** imported from *** in the United Kingdom.9 During the initialreview, ***.10 Also, in 1999, ***.11
Of the importers’ responses received by the Commission in this second review, ***. Aspreviously stated, ***.
U.S. IMPORTERS’ INVENTORIES
No importers reported imports of the subject merchandise from Japan. Accordingly, there are noreported U.S. inventories of subject product from Japan. In light of the estimated number of subjecttrucks being imported into the United States from Japan, inventories, if any, are believed to be minimal(table IV-2).
Table IV-2ICI forklift trucks: U.S. importers’ end-of-period inventories from Japan and other countries, 1999-2004, January-June 2004, and January-June 2005
Item
Calendar year January-June
1999 2000 2001 2002 2003 2004 2004 2005
Imports from Japan
Inventories (number of trucks) (1) (1) (1) (1) (1) (1) (1) (1)
Ratio to imports (percent) (1) (1) (1) (1) (1) (1) (1) (1)
Ratio to U.S. shipments of imports (percent) (1) (1) (1) (1) (1) (1) (1) (1)
Imports from other countries
Inventories (number of trucks) 2,524 2,083 2,811 1,901 1,890 2,287 2,206 2,266
Ratio to imports (percent) *** *** 23.2 20.7 14.3 13.3 13.4 12.1
Ratio to U.S. shipments of imports (percent) *** *** 27.1 21.4 16.0 15.6 15.7 14.1
1 No U.S. importer reported either imports or inventories of the subject merchandise during the period for which data were collected.
Source: Compiled from data submitted in response to Commission questionnaires.
SUBJECT COUNTRY PRODUCERS
The Commission sent questionnaires to the six primary internal combustion industrial forklifttruck manufacturers in Japan. These six firms, Komatsu Forklift Co., Ltd. (“Komatsu Japan”), MitsubishiHeavy Industries, Ltd. (“Mitsubishi Japan”), Nissan Motor Co., Ltd. (“Nissan Japan”), SumitomoNACCO Materials Handling Co., Ltd. (“Sumitomo NACCO”), TCM Corp. (“TCM Japan”), and Toyota

12 Foreign producers’ questionnaire responses, section II-17a. 13 NACCO Industries, Inc. Form 10-K found athttp://ir.nacco.com/phoenix.zhtml?c=107545&p=irol-reportsAnnual, retrieved August 11, 2005. 14 Gottlieb, Mark. Going it Together (November 5, 2003) found athttp://www.industryweek.com/CurrentArticles/Asp/articles.asp?ArticleId=1519, retrieved August 2, 2005. 15 Sumitomo NACCO’s foreign producers’ questionnaire response, sections II-17a and II-17b; NACCO USA’sposthearing brief, p. 30. 16 Komatsu, Komatsu and Linde Agree to Transform Komatsu Forklift into Joint-Venture Company (July 11,2005) found at http://www.komatsu.com/CompanyInfo/ir/, retrieved August 1, 2005. 17 O’Neill, Jeff. Top 20 Lift Truck Suppliers, Modern Materials Handling (August 1, 2005); Forger, Gary. LiftTruck Giants, Modern Materials Handling (August 1, 2004); Top 20 Lift Truck Suppliers, Modern MaterialsHandling (August 1, 2003); and Top 20 Lift Truck Suppliers, Modern Materials Handling (August 1, 2002). 18 Komatsu Japan’s foreign producers’ questionnaire response, sections II-17a and II-17b. NACCO USAestimates Komatsu Japan’s percentage of Japanese production of subject ICI forklift trucks at 20.3 percent. NACCOUSA’s posthearing brief, p. 30.
IV-4
Industries Corp. (“Toyota Japan”), account for virtually all of the production of ICI forklift trucks inJapan. Of these six primary foreign producers, only three, Sumitomo NACCO, Komatsu Japan, andToyota Japan, submitted data to the Commission. The three responding producers, however, areestimated to account for *** percent of Japanese production in 2004.12
Sumitomo NACCO
Sumitomo NACCO is a 50/50 joint venture between Sumitomo of Japan and NACCO USA ofPortland, OR, formed in 1970 to manufacture and distribute forklifts in Japan. Sumitomo NACCO’soperations are supported by five facilities: headquarters in Obu, Japan where there are also assembly anddistribution capabilities; a facility in the Philippines for the manufacture of frames; and three dealershipsin Japan.13 The joint venture manufactures forklifts and components that it markets under the name“Sumitomo-Yale” and under the Hyster and Yale brand names, for sale inside and outside of Japan.14 In2004, Sumitomo NACCO accounted for *** percent of Japanese production of the subject product andheld 5.3 percent of the market for ICI forklift trucks in Japan.15
Komatsu Japan
Komatsu Japan is a wholly owned subsidiary of Komatsu, Ltd. of Japan. Komatsu Japan hasforklift manufacturing plants in Japan, the United States, and China. In May 2000, Komatsu Japan signedan agreement for cooperative relations with Linde AG of Germany. The two companies entered into ajoint venture agreement in 2002, under which Linde would acquire 35 percent of the shares of KomatsuJapan (the lift truck unit of Komatsu, Ltd.) by 2003, with plans to increase its ratio up to 48 percent in2005. Pursuant to this alliance, Komatsu Japan and Linde jointly produce and market forklift trucks inChina, the United States, Europe, and Japan.16 Komatsu had estimated global ICI and electric forkliftsales of $1.03 billion in 2004, compared to $938 million in 2003, $769 million in 2002, and $676million in 2001. Komatsu ranked seventh based on global sales in 2004.17 Komatsu Japan reportedly hada ***-percent share of Japanese production of subject ICI forklift trucks in 2004.18

19 Toyota Japan’s foreign producers’ questionnaire response, sections II-17a and II-17b. 20 About Us, Production Plants, Toyota Industrial Equipment Europe website, found athttp://www.toyota-tiee.com/C1256B900060FD0B/PermLink/FXME-5MABQP?OpenDocument, retrieved August16, 2005. 21 Toyota Industrial Equipment to Form Independent U.S. Corporation., PR Newswire (March 1, 2001), retrievedJuly 21, 2005. 22 Toyota Industries Corporation, Financial Summary FY 2005, Business Results and Financial Position, found athttp://www.toyota-industries.com/ir/library/briefnote2005/termend.html, retrieved August 3, 2005. 23 O’Neill, Jeff. Top 20 Lift Truck Suppliers, Modern Materials Handling (August 1, 2005); Forger, Gary. LiftTruck Giants, Modern Materials Handling (August 1, 2004); Top 20 Lift Truck Suppliers, Modern MaterialsHandling (August 1, 2003); and Top 20 Lift Truck Suppliers, Modern Materials Handling (August 1, 2002). 24 Toyota Japan’s foreign producers’ questionnaire response, sections II-17a and II-17b; NACCO USA estimatesToyota’s percentage of Japanese production of subject ICI forklift trucks in Japan at 41.2 percent. NACCO USA’sposthearing brief, p. 30. 25 Mitsubishi Monitor, Cleaner Lifting found at http://www.mitsubishi.or.jp/e/monitor/0310/NP.html, retrievedAugust 15, 2005.
IV-5
Toyota Japan
Toyota Japan has three forklift production plants in Japan, the United States, and Europe. TheJapanese plant, built in 1970, produces forklifts for the Asian market and for export to Europe (***), Asia(***), and other markets (***).19 The plant in France produces solely for the European market.20 In2000, Toyota acquired BT Industries, the Swedish manufacturer of Raymond and BT Prime Moverforklift brands, and it is now a subsidiary.21 In 2005, Toyota Japan reported that materials handlingequipment industry sales increased substantially over fiscal 2004, with strong sales in the Japanese marketand brisk sales in overseas markets. Toyota Japan sold 103,000 Toyota-brand ICI and electric forklifttrucks globally in 2004, an increase of 23 percent over 2003. Toyota Japan reportedly held a 42.6-percentshare of the overall Japanese forklift market in 2004, the same percentage as in 2003.22 Toyota hadestimated revenues on global ICI and electric forklift sales of $4.89 billion in 2004, compared to $4.23billion in 2003, $3.1 billion in 2002, and $2.7 billion in 2001. The worldwide Toyota operations rankedfirst based on global sales in 2004.23 In 2004, Toyota Japan accounted for an estimated *** percent ofJapanese production of subject ICI forklift trucks in Japan.24
Mitsubishi Japan
Mitsubishi Japan produces the subject product in its industrial machinery division in Japan. Subsequent to the imposition of the order, Mitsubishi USA, a joint venture operation between MitsubishiJapan and Caterpillar Industrial, Inc., was established to produce the subject product in Houston, TX. Mitsubishi Japan and Nissan have also cooperated to develop and market forklift trucks and products forthe Japanese market.25 Overseas, Mitsubishi Japan and Caterpillar have joint venture operations for themanufacture and sale of forklifts in the Netherlands (Mitsubishi Caterpillar Forklift Europe) andSingapore (Mitsubishi Caterpillar Forklift Asia). Mitsubishi Japan is the dominant stakeholder in theseventures and also provides research and design coordination services for the joint venture operations. Mitsubishi/Caterpillar had estimated global electric and ICI forklift truck sales of $1.30 billion in 2004,compared to $1.04 billion in 2003, $704 million in 2002, and $1.0 billion in 2001. Mitsubishi/Caterpillar

26 O’Neill, Jeff. Top 20 Lift Truck Suppliers, Modern Materials Handling (August 1, 2005); Forger, Gary. LiftTruck Giants, Modern Materials Handling (August 1, 2004); Top 20 Lift Truck Suppliers, Modern MaterialsHandling (August 1, 2003); and Top 20 Lift Truck Suppliers, Modern Materials Handling (August 1, 2002). 27 NACCO USA’s posthearing brief, p. 30. 28 Nissan 2003-2004 Fact File Forklift Business (July 2004) found athttp://www.nissan-global.com/EN/IR/LIBRARY/FF/index.html, retrieved August 15, 2005. 29 O’Neill, Jeff. Top 20 Lift Truck Suppliers, Modern Materials Handling (August 1, 2005); Forger, Gary. LiftTruck Giants, Modern Materials Handling (August 1, 2004); Top 20 Lift Truck Suppliers, Modern MaterialsHandling (August 1, 2003); and Top 20 Lift Truck Suppliers, Modern Materials Handling (August 1, 2002). 30 NACCO USA’s posthearing brief, p. 30. 31 TCM Overseas Operations, found at http://www.tcmglobal.net/company/main03.html, retrieved July 21, 2005. 32 Hitachi Turns TCM into a Consolidated Subsidiary, Forklift Action Newsletter #209, found athttp://www.forkliftaction.com/news/newsdisplay.asp?nwid=2330, retrieved July 22, 2005. 33 O’Neill, Jeff. Top 20 Lift Truck Suppliers, Modern Materials Handling (August 1, 2005); Forger, Gary. LiftTruck Giants, Modern Materials Handling (August 1, 2004); Top 20 Lift Truck Suppliers, Modern MaterialsHandling (August 1, 2003); and Top 20 Lift Truck Suppliers, Modern Materials Handling (August 1, 2002). 34 NACCO USA’s posthearing brief, p. 30.
IV-6
ranked fifth based on global sales in 2004.26 In Japan, Mitsubishi reportedly has a 10.5-percent share ofthe market for subject ICI forklift trucks.27
Nissan Japan
Worldwide, Nissan has dedicated forklift manufacturing plants in Japan, Spain, and the UnitedStates. In 2003, these facilities together produced 27,500 electric and ICI forklift trucks: 9,500 in Japanand 18,000 in Spain and the United States. Of the 9,500 units produced in Japan, 5,500 were for thedomestic market and 4,000 were exported.28 Nissan had estimated revenues on global forklift sales of$828 million in 2004, compared to $650 million in 2003, $700 million in 2002, and $705 million in 2001. Nissan ranked eighth based on global sales in 2004.29 In 2004, Nissan Japan accounted for an estimated9.6-percent share of Japanese production of ICI forklift trucks.30
TCM Japan
Headquartered in Japan with a forklift manufacturing plant in the Shiga Prefecture, TCM Japanhas overseas operations in the United States, Belgium, and two manufacturing plants in China. TheChinese forklift and parts manufacturing plants are joint ventures between TCM Japan and a Chinesenational forklift company.31 In 2005, TCM Japan became a consolidated subsidiary of HitachiConstruction Machinery Co., Ltd., its largest single shareholder.32 TCM had estimated revenues onglobal ICI and electric forklift sales of $759 million in 2004, compared to $672 million in 2003, $600million in 2002, and $600 million in 2001. TCM ranked ninth based on global forklift truck sales in2004.33 In 2004, TCM Japan accounted for an estimated 13 percent of Japanese production of ICI forklifttrucks.34

35 ***’s foreign producers’ questionnaire response, section II-15. 36 Foreign producers’ questionnaire responses, section II-11. 37 Ibid., section II-13. 38 NACCO USA’s posthearing brief, exh. 2. 39 U.S. Embassy, Tokyo, Japan: Forklift Truck Industry Overview, International Market Insight Reports (May 29,1997).
IV-7
SUBJECT COUNTRY CAPACITY, PRODUCTION, CAPACITY UTILIZATION,DOMESTIC SHIPMENTS, EXPORT SHIPMENTS, AND INVENTORIES
As shown in table IV-3, reported Japanese capacity for ICI forklift trucks increased, largely dueto *** in 2004. In 1999 and 2000, *** continued minimal exports of ICI forklift trucks to the UnitedStates, before complete cessation of such exports in 2001.
Table IV-3ICI forklift trucks: Japanese producers’ capacity, production, inventories, and shipments, 1999-2004, January-June 2004, and January-June 2005
* * * * * * *
In addition to the complete ICI forklift truck Japanese industry data presented in table IV-3, ***incomplete ICI forklift trucks to the United States in 1999. Prior to the imposition of the antidumpingorder, *** was engaged in supplying less than complete forklifts to *** in the United States. This waschanged to the supply of part kits for forklifts to be assembled in the United States by ***. Over time, thevolume of part kits exports was reduced as *** forklifts from the ***. *** phased out the supply of partkits for forklifts to the United States in 2005.35
*** reported being able to switch production between ICI forklift trucks and other products inresponse to a relative price change in the price of ICI forklift trucks vis-a-vis the price of other products,using the same equipment and labor.36
*** reported that its exports of ICI forklift trucks were subject to unspecified tariff or non-tariffbarriers in China and a 4.5-percent tariff, imposed in 1987, in the EU.37 In addition, voluntary exportrestraints (“VERs”) on forklift trucks from Japan to the European Community (“EC”) were imposed onJapanese forklift manufacturers by Japan’s Ministry of International Trade and Industry (“MITI”) onDecember 17, 1986. These VERs were later “strengthened” on December 9, 1989 to restrict exports bythose outside the forklift export cartel, whose members had already curbed exports under the law. Monthly export quotas, based upon previous shipment records of individual companies, were establishedfor each manufacturer. These VERs were eliminated at the end of 1994.38
THE GLOBAL MARKET
The Japanese Market
Because the Commission received less than complete information regarding production,shipments, and the potential for product shifting, this section of the report presents data regarding totalforklift truck production as well as production and shipment data for ICI forklift trucks, broadly defined.The Japanese forklift industry peaked in 1990, with the production of a record 160,162 units (domesticshipments plus exports).39 The most recent production figures are lower, with total production in 2004 of

40 Statistics compiled by the Japan Industrial Vehicle Association (JIVA), www.jiva.or.jp, and provided by theCommercial Specialist, U.S. Foreign Commercial Service, American Embassy, Tokyo (August 2005).
IV-8
123,453 units, of which 80,795 units (or 65 percent) were powered by internal combustion engines.40 Japanese production data for ICI forklifts for 1999-2004 are set forth below (figure IV-1).
Figure IV-1Japanese production of ICI forklift trucks, 1999-2004
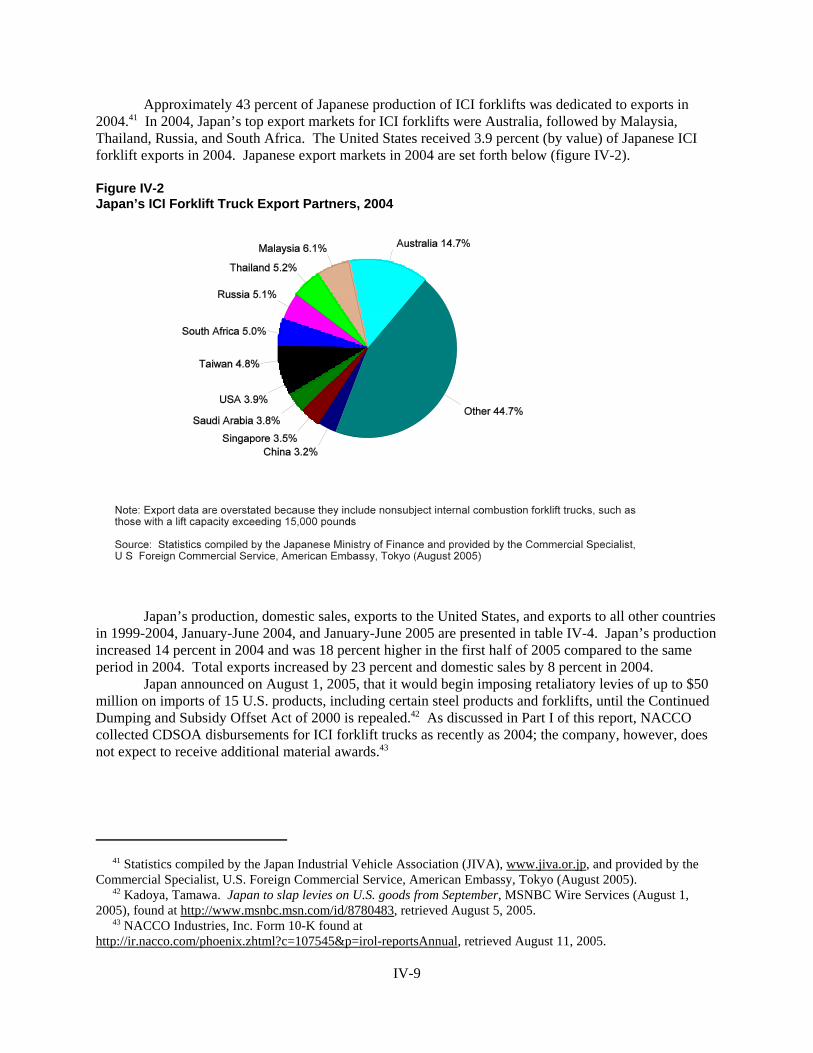
41 Statistics compiled by the Japan Industrial Vehicle Association (JIVA), www.jiva.or.jp, and provided by theCommercial Specialist, U.S. Foreign Commercial Service, American Embassy, Tokyo (August 2005). 42 Kadoya, Tamawa. Japan to slap levies on U.S. goods from September, MSNBC Wire Services (August 1,2005), found at http://www.msnbc.msn.com/id/8780483, retrieved August 5, 2005. 43 NACCO Industries, Inc. Form 10-K found athttp://ir.nacco.com/phoenix.zhtml?c=107545&p=irol-reportsAnnual, retrieved August 11, 2005.
IV-9
Approximately 43 percent of Japanese production of ICI forklifts was dedicated to exports in2004.41 In 2004, Japan’s top export markets for ICI forklifts were Australia, followed by Malaysia,Thailand, Russia, and South Africa. The United States received 3.9 percent (by value) of Japanese ICIforklift exports in 2004. Japanese export markets in 2004 are set forth below (figure IV-2).
Figure IV-2Japan’s ICI Forklift Truck Export Partners, 2004
Japan’s production, domestic sales, exports to the United States, and exports to all other countriesin 1999-2004, January-June 2004, and January-June 2005 are presented in table IV-4. Japan’s productionincreased 14 percent in 2004 and was 18 percent higher in the first half of 2005 compared to the sameperiod in 2004. Total exports increased by 23 percent and domestic sales by 8 percent in 2004.
Japan announced on August 1, 2005, that it would begin imposing retaliatory levies of up to $50million on imports of 15 U.S. products, including certain steel products and forklifts, until the ContinuedDumping and Subsidy Offset Act of 2000 is repealed.42 As discussed in Part I of this report, NACCOcollected CDSOA disbursements for ICI forklift trucks as recently as 2004; the company, however, doesnot expect to receive additional material awards.43
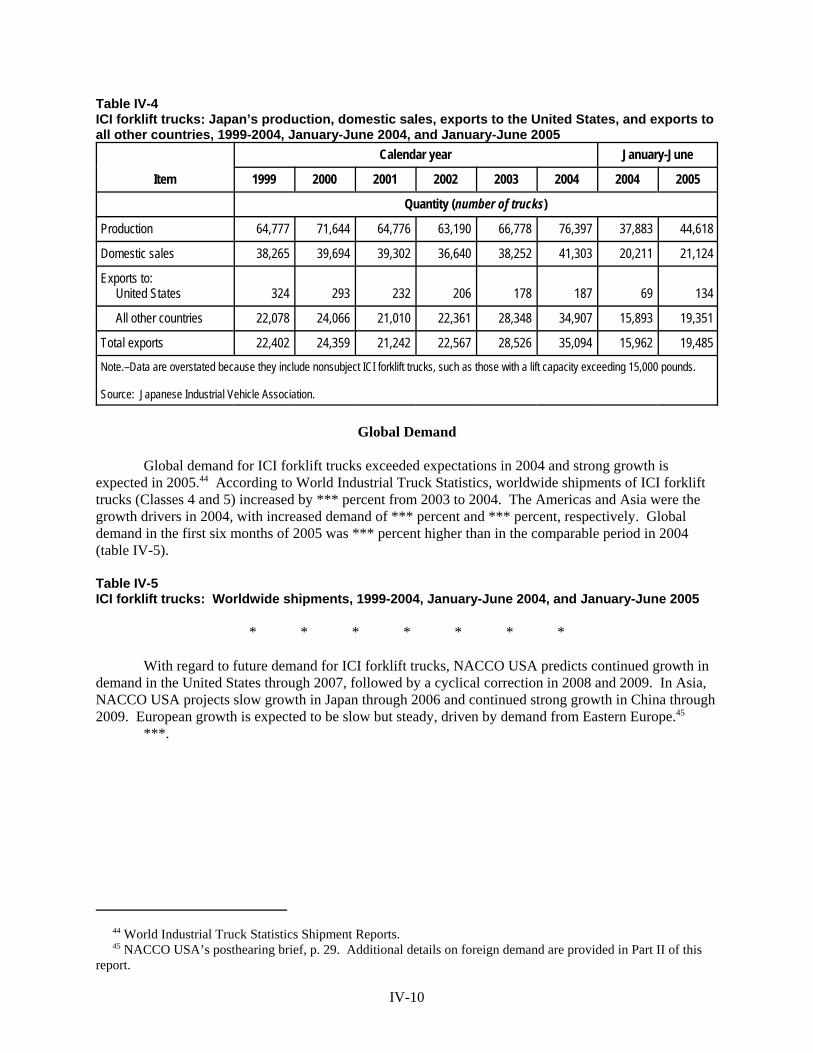
44 World Industrial Truck Statistics Shipment Reports. 45 NACCO USA’s posthearing brief, p. 29. Additional details on foreign demand are provided in Part II of thisreport.
IV-10
Table IV-4ICI forklift trucks: Japan’s production, domestic sales, exports to the United States, and exports toall other countries, 1999-2004, January-June 2004, and January-June 2005
Item
Calendar year January-June
1999 2000 2001 2002 2003 2004 2004 2005
Quantity (number of trucks)
Production 64,777 71,644 64,776 63,190 66,778 76,397 37,883 44,618
Domestic sales 38,265 39,694 39,302 36,640 38,252 41,303 20,211 21,124
Exports to: United States 324 293 232 206 178 187 69 134
All other countries 22,078 24,066 21,010 22,361 28,348 34,907 15,893 19,351
Total exports 22,402 24,359 21,242 22,567 28,526 35,094 15,962 19,485
Note.–Data are overstated because they include nonsubject ICI forklift trucks, such as those with a lift capacity exceeding 15,000 pounds.
Source: Japanese Industrial Vehicle Association.
Global Demand
Global demand for ICI forklift trucks exceeded expectations in 2004 and strong growth isexpected in 2005.44 According to World Industrial Truck Statistics, worldwide shipments of ICI forklifttrucks (Classes 4 and 5) increased by *** percent from 2003 to 2004. The Americas and Asia were thegrowth drivers in 2004, with increased demand of *** percent and *** percent, respectively. Globaldemand in the first six months of 2005 was *** percent higher than in the comparable period in 2004(table IV-5).
Table IV-5ICI forklift trucks: Worldwide shipments, 1999-2004, January-June 2004, and January-June 2005
* * * * * * *
With regard to future demand for ICI forklift trucks, NACCO USA predicts continued growth indemand in the United States through 2007, followed by a cyclical correction in 2008 and 2009. In Asia,NACCO USA projects slow growth in Japan through 2006 and continued strong growth in China through2009. European growth is expected to be slow but steady, driven by demand from Eastern Europe.45
***.
1 Most of the discussion in Part V is based on U.S. producer and purchaser questionnaire responses, andsupplemental information based on telephone interviews with U.S. producers; responding importers reported importsof only nonsubject ICI forklift trucks. Unless otherwise indicated, the discussion of “Factors Affecting Prices” and“Pricing Practices” is based on U.S.-produced forklift trucks built with U.S.-produced frames and with importedframes. Only *** reported producing ICI forklift trucks in the United States with imported frames.
2 Different fueling systems, such as gasoline, diesel, and LPG (propane, butane, methane, etc.), also may lead todifferent selling prices.
3 U.S. producer questionnaire responses of ***, section IV-B-15.
V-1
PART V: PRICING AND RELATED INFORMATION1
FACTORS AFFECTING PRICING
Prices of ICI forklift trucks can fluctuate based on demand factors such as the general businesscycle and replacement cycles of end users. On the supply side, prices of ICI forklift trucks can also differby the size of an order and a number of product features, including, but not restricted to, the types/sizes offrames and masts, tires, engines,2 and lift capacity.
Raw Material Costs
Although U.S. producers of ICI forklift trucks produce some parts of their ICI forklift trucks, they purchase many components and subassemblies. As a result, a significant share of the raw material inputsused in forklift trucks may be purchased and fabricated upstream from the actual production of thecompleted forklift trucks. The following discussion of raw material costs is based on U.S. producerquestionnaire responses of the four responding U.S. producers.3
According to ***, raw material prices were generally flat during 1999-2003, but beginning inearly 2004, the world economy experienced significant increases in demand for commodities and otherraw materials, driven by the recovery in global demand and the emergence of China as a significantconsumer. Of particular importance to the manufacture of ICI forklift trucks, according to ***, has beenthe increase in prices of key raw materials, particularly steel and rubber, as well as fuel used in theconversion of these materials to finished goods. *** asserts that the increases in prices of some types ofsteel were unprecedented, more than doubling over a 9-month period.
During 1999-2003, price increases for ICI forklift trucks achieved by *** reportedly averagedless than *** percent. During the second half of 2004 and into 2005, *** reported that it has been forcedto try and recover the increases in material costs with increased prices for its finished goods. *** assertsthat competitive pressure has kept the price increases achieved well below the costs it has absorbed, asprice increases by most manufacturers, particularly the Japanese, have lagged behind ***. According to***, its gross margins deteriorated significantly between 2004 and 2005, and only recently have shown asmall recovery.
As suppliers of raw materials react to increased pricing, *** expects additional supply to come online, and some reduction in material prices from the peaks experienced in late 2004 and early 2005. ***,however, does not expect to see returns to the levels experienced in the early 2000's, and, according to thefirm, will be forced to continue to “claw back” the shortfalls it has experienced to bring its gross marginsback in line with those achieved in 2001-02, to achieve an acceptable return on the company’sinvestment.
*** reported that ***, primarily due to the increase in the cost of steel and to a lesser extent dueto the increase in cost of rubber.
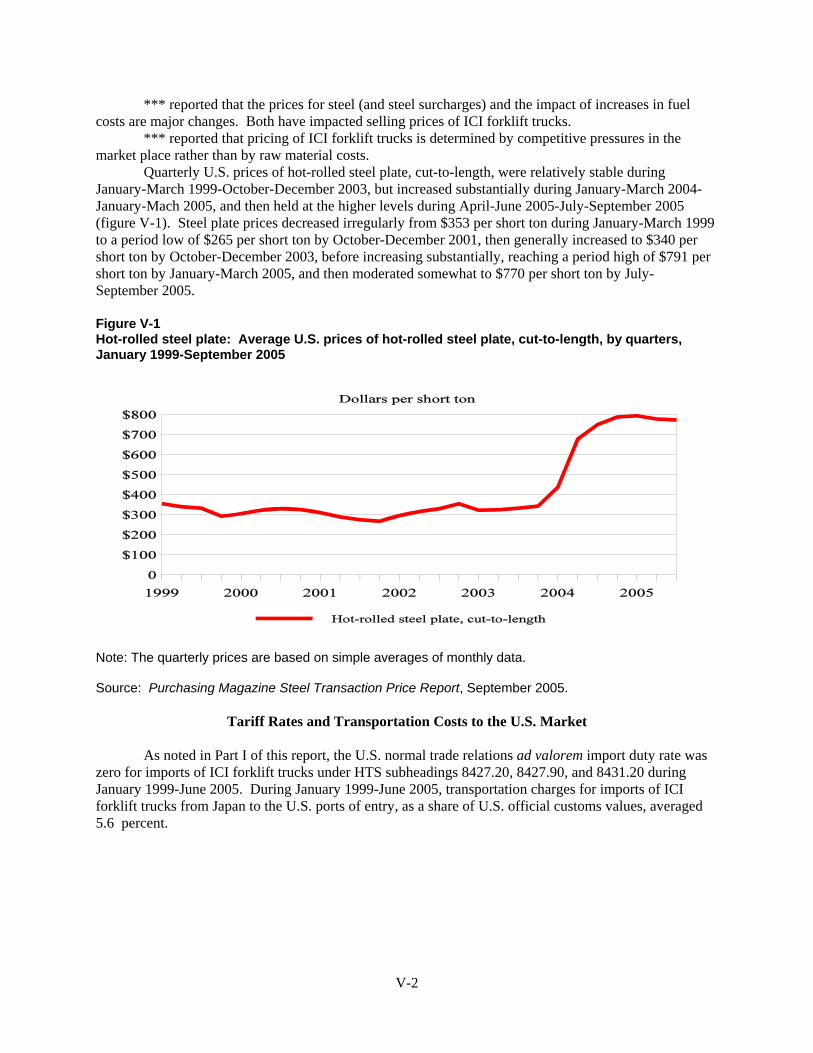
V-2
*** reported that the prices for steel (and steel surcharges) and the impact of increases in fuelcosts are major changes. Both have impacted selling prices of ICI forklift trucks.
*** reported that pricing of ICI forklift trucks is determined by competitive pressures in themarket place rather than by raw material costs.
Quarterly U.S. prices of hot-rolled steel plate, cut-to-length, were relatively stable duringJanuary-March 1999-October-December 2003, but increased substantially during January-March 2004-January-Mach 2005, and then held at the higher levels during April-June 2005-July-September 2005(figure V-1). Steel plate prices decreased irregularly from $353 per short ton during January-March 1999to a period low of $265 per short ton by October-December 2001, then generally increased to $340 pershort ton by October-December 2003, before increasing substantially, reaching a period high of $791 pershort ton by January-March 2005, and then moderated somewhat to $770 per short ton by July-September 2005.
Figure V-1Hot-rolled steel plate: Average U.S. prices of hot-rolled steel plate, cut-to-length, by quarters,January 1999-September 2005
Note: The quarterly prices are based on simple averages of monthly data.
Source: Purchasing Magazine Steel Transaction Price Report, September 2005.
Tariff Rates and Transportation Costs to the U.S. Market
As noted in Part I of this report, the U.S. normal trade relations ad valorem import duty rate waszero for imports of ICI forklift trucks under HTS subheadings 8427.20, 8427.90, and 8431.20 duringJanuary 1999-June 2005. During January 1999-June 2005, transportation charges for imports of ICIforklift trucks from Japan to the U.S. ports of entry, as a share of U.S. official customs values, averaged5.6 percent.

4 Producer questionnaire responses, section IV-B-8.
5 Producer questionnaire responses, section IV-B-9.
6 Producer questionnaire responses, section IV-B-8.
7 Hearing transcript, pp. 111-112 (Eklund).
8 Hearing transcript, pp. 112-113 (Wilson), and NACCO’s posthearing brief, exhibit 1, pp. 20-21.
9 *** U.S. producer questionnaire response, section IV-B-4, and staff telephone interview with ***.
10 *** U.S. producer questionnaire response, section IV-B-4.
11 Purchaser questionnaire responses, section III-33. Nineteen of the 20 responding purchasers were dealers andone, ***, was an end user.
12 U.S. producer questionnaire responses, section IV-B-4 and 5.
13 U.S. producer questionnaire responses, section IV-B-4.
V-3
U.S. Inland Transportation Costs
The four responding U.S. producers reported in their questionnaire responses that U.S.-inlandfreight costs averaged 3.0 percent or less of delivered selling prices to their U.S. customers,4 and that theyshipped their ICI forklift trucks nationally.5 The responding U.S. producers reported shipping an averageof 3.7 percent of their domestic sales of their U.S.-produced ICI forklift trucks to U.S. customers locatedwithin 100 miles of their U.S. plants, 66.4 percent between 101 and 1,000 miles, and 29.9 percent over1,000 miles.6 Although NACCO indicated that there were no U.S.-inland freight advantages between theU.S.-produced and imported Japanese ICI forklift trucks,7 the firm indicated that ocean freight per forklifttruck from Japan to the U.S. west coast was at least $2,000 less than U.S.-inland freight costs fromNACCO's Berea, KY, facilities to the west coast.8
Internet Reverse Auctions (IRAs)
Some large end users reportedly have been increasingly using internet reverse auctions topurchase their ICI forklift trucks.9 According to ***, the participation of multiple competitors is often thelargest influence on pricing, with IRAs becoming an increasingly prevalent method for buyers to securereduced pricing. These IRAs result in minute-by-minute competitive price pressures. Multiple rounds ofbidding continue to force prices lower.10 Nineteen of 20 responding purchasers reported that they did notpurchase ICI forklift trucks on the internet, while the remaining firm, ***, reported purchasing usedforklift trucks on the internet.11 In addition, U.S. producers reported that they did not sell their ICI forklifttrucks on the internet and did not expect this to change in the future.12
*** provided the following discussion of IRAs.13 Prior to 1999, IRAs were non-existent. ***reported that it now participates in about *** per year, covering about *** units of all classes of forklifttrucks, of which the subject merchandise represents about *** units. This medium for bidding startedaround 2001, and has been increasing since that period. The typical internet reverse auction is conductedby large national-account end users, and the participating suppliers are generally the major producers(including NACCO, Toyota, Nissan, Mitsubishi, and Komatsu). The buyer generally issues invitations tosuppliers to participate and these invitations tend to be sent to major producers. While this size of auctionis typical, IRAs are also conducted for smaller quantity purchases. Purchasers typically do not specifywhere the product supplied must be produced and, therefore, both U.S.-produced and imported productsare offered. While the lowest-priced supplier varies from auction to auction, *** reported that Japanese-owned producers are often among the lowest-priced bidders. Bidders are not identified through the
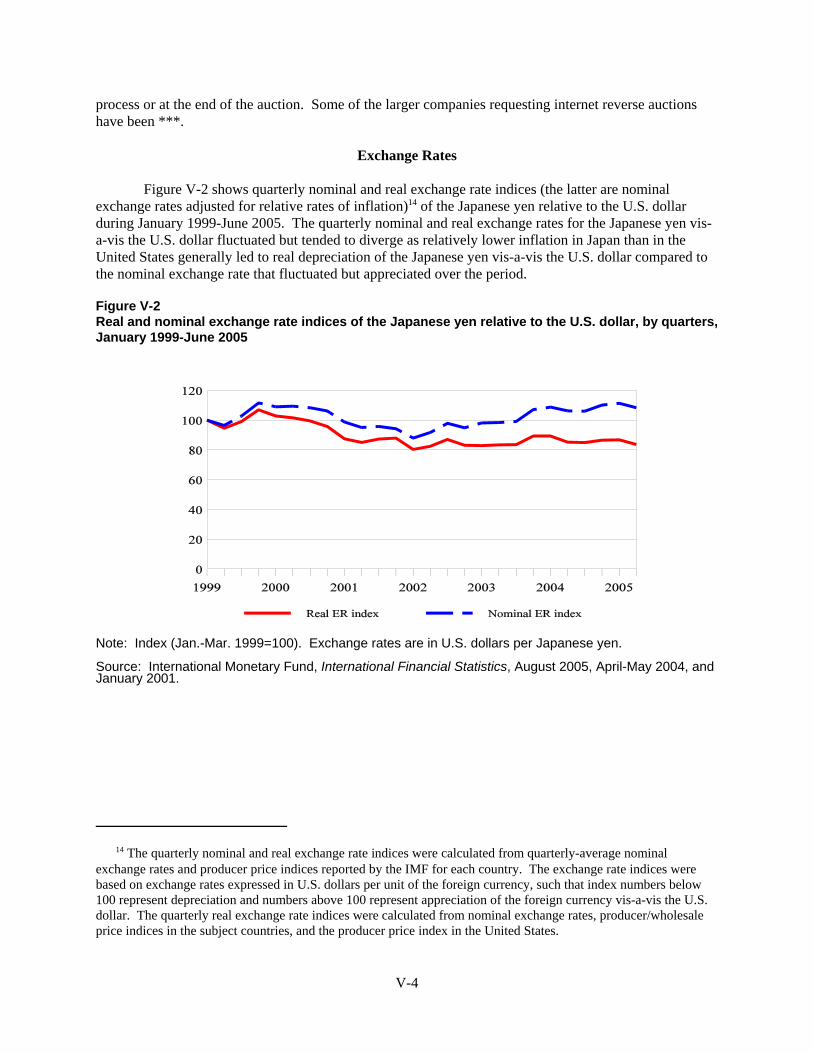
14 The quarterly nominal and real exchange rate indices were calculated from quarterly-average nominalexchange rates and producer price indices reported by the IMF for each country. The exchange rate indices werebased on exchange rates expressed in U.S. dollars per unit of the foreign currency, such that index numbers below100 represent depreciation and numbers above 100 represent appreciation of the foreign currency vis-a-vis the U.S.dollar. The quarterly real exchange rate indices were calculated from nominal exchange rates, producer/wholesaleprice indices in the subject countries, and the producer price index in the United States.
V-4
process or at the end of the auction. Some of the larger companies requesting internet reverse auctionshave been ***.
Exchange Rates
Figure V-2 shows quarterly nominal and real exchange rate indices (the latter are nominalexchange rates adjusted for relative rates of inflation)14 of the Japanese yen relative to the U.S. dollarduring January 1999-June 2005. The quarterly nominal and real exchange rates for the Japanese yen vis-a-vis the U.S. dollar fluctuated but tended to diverge as relatively lower inflation in Japan than in theUnited States generally led to real depreciation of the Japanese yen vis-a-vis the U.S. dollar compared to the nominal exchange rate that fluctuated but appreciated over the period.
Figure V-2Real and nominal exchange rate indices of the Japanese yen relative to the U.S. dollar, by quarters,January 1999-June 2005
Note: Index (Jan.-Mar. 1999=100). Exchange rates are in U.S. dollars per Japanese yen.
Source: International Monetary Fund, International Financial Statistics, August 2005, April-May 2004, andJanuary 2001.

15 U.S. producer responses of ***, section II-10.
16 In addition, end users purchase or lease the ICI forklift trucks from U.S. dealers, which are typically financedthrough U.S. producer-related finance companies or third-party finance companies. Various leasing arrangementsare offered by U.S. producers, their related financing companies, and third-party financing companies. Some leasesresult in the purchaser taking ownership at the end of the lease, while other leases result in the financing companytaking ownership at the end of the lease.
17 U.S. producer questionnaire responses, section IV-B-23.
18 U.S. producer questionnaire response, section IV-B-22, of ***.
19 U.S. producer questionnaire response, section IV-B-22.
V-5
The quarterly nominal value of the Japanese yen initially appreciated against the U.S. dollar by11.5 percent during January 1999-December 1999, then generally depreciated against the U.S. dollarthrough January-March 2002 by 21.2 percent, and thereafter generally appreciated against the U.S. dollarthrough April-June 2005 by 23.2 percent (figure V-2). The quarterly real value of the yen also initiallyappreciated against the U.S. dollar, by 6.9 percent during January 1999-December 1999, then generallydepreciated against the U.S. dollar through January-March 2002 by 24.9 percent, and thereafter fluctuatedbut appreciated somewhat against the U.S. dollar through April-June 2005 by 4.1 percent.
PRICING PRACTICES
In the U.S. market, U.S. producers reported selling 81.6 percent of the quantity of their U.S.-produced forklift trucks with domestic frames to U.S. dealers, 14.0 percent to U.S. national-account endusers, and 4.4 percent to U.S. distributors during January 1999-June 2005.15 Based on combinedshipments of U.S.-produced ICI forklift trucks with domestic and imported frames, U.S. producersreported selling *** percent to U.S. dealers, *** percent to U.S. national-account end users, and ***percent to distributors during this period. U.S. dealers, national account end users, and distributorsgenerally purchase and own the ICI forklift trucks that they purchase, but some national account end userslease the products.16 The only three U.S. producers – *** – responding to a request for shipments thatwere sold or leased reported that, in 2004, 80.0 percent of the total quantity of their U.S. shipments ofU.S.-produced ICI forklift trucks to national-account end users were outright sales and 20.0 percent wereleased.17
Financial Support Programs
U.S. ICI forklift producers provide a number of financial support programs primarily to theirdealers and secondarily to their dealers’ end-user customers; the latter support is usually in the form ofbelow-market interest rates on end users’ financing of their purchased or leased forklift trucks. The U.S.producers’ financial support programs do not reduce the invoice prices of their forklift trucks, but lowerthe producers’ net sales values and, hence, their sales profit. Three U.S. producers provided the requestedtotal expenditure figures for their financial support programs on their ICI forklift trucks during the mostrecent two years, which showed such expenditures increasing from $10.8 million in 2003 to $12.1 millionin 2004, or by 12.0 percent.18 Such expenditures during 2004 represented 1.7 percent of these three U.S.producers’ total value of U.S. commercial shipments of their ICI forklift trucks during this period.
Four U.S. producers – *** – identified and described their financial support programs offered todealers of their ICI forklift trucks in their questionnaire responses.19 The following five types of financialsupport programs were identified–floorplans, co-op advertising, rental program, subsidized financing, andsalesperson incentives. All four reporting firms offered floorplans, whereby the producer pays interest

20 *** (*** U.S. producer questionnaire response, section IV-B-22).
21 *** (*** U.S. producer questionnaire response, section IV-B-22).
22 Producer questionnaire responses, section IV-B-1. Spot sales are usually one-time delivery, within 30 days ofthe purchase agreement; short-term sales are for multiple deliveries for up to 12 months after the purchaseagreement; and long-term sales are for multiple deliveries for more than 12 months after the purchase agreement.
23 U.S. producers also reported that *** percent of their total U.S. sales quantity of U.S.-produced ICI forklifttrucks with domestic and imported frames combined during 2004 was on a spot basis, *** percent was on a short-term basis, and *** percent was on a long-term basis (U.S. producer questionnaire responses, section IV-B-1).
24 Producer questionnaire responses, section IV-B-2 and 3.
25 *** (staff telephone interview with ***).
26 According to ***, indicative quantities are generally provided by the customer when negotiating the contract,but are not typically part of the contract. If a customer buys significantly fewer than they had indicated or *** hadcommunicated, the contract would be reviewed upon renewal, with reductions in discounts likely. (Producerquestionnaire response, section IV-B-2.)
27 The three producers are ***. ***. (Producer questionnaire response, sections IV-B-2 and 3.)
28 Producer questionnaire responses, sections IV-B-2 and 3.
V-6
carrying costs of its dealers for their purchased ICI forklift trucks for up to 90 days.20 Co-op advertising,wherein the U.S. producers pay a portion of approved advertising marketing efforts of their dealers, wasoffered by ***. Such marketing can include Yellow Page ads, mailers, trade shows, and promotionalbrochures.21 Rental programs, wherein the U.S. producers offered additional discounts and/or subsidizedfinancing to dealers for new ICI forklift trucks to be used by the dealers as rental equipment to theircustomers, were offered by ***. This program is designed to assist dealers to offer an adequate numberof new ICI forklift trucks to their rental customers and helps promote new products to prospectivecustomers. Subsidized financing was offered by ***. U.S. producers use this program to offer customersof their dealers a below market interest rate, primarily to leasing customers, which, according to *** isused to match low rates offered by other producers. Salesperson incentives were offered by ***. Thisprogram is offered to dealer salespeople or dealer sales managers and provides free travel trips or cashincentives to increase sales in particular dealer regions.
Other Pricing Practices
U.S. producers reported that 54.3 percent of their total U.S. sales quantity of U.S.-produced ICIforklift trucks with domestic frames during 2004 was on a spot basis, 9.0 percent was on a short-termbasis, and 36.6 percent was on a long-term basis.22 23 The U.S. producers reported that short-term salesare typically for 12 months, while long-term agreements generally range from 2-3 years, but can extendfor longer periods.24 Both types of latter sales agreements generally fix price, but this can vary bycontract,25 whereas quantity is generally not fixed,26 although this also can vary by contract. Three of thefour responding U.S. producers reported that short-term and long-term contracts can include a meet-or-release provision,27 whereas *** reported that its sales contracts do not contain this provision.28
For spot, short-term, and long-term sales, the U.S. producers reported that prices are typicallynegotiated when the transaction involves large quantities and intense competition; this is typically thesituation with national-account end users and with some sales to dealers. When transactions with dealers
29 These standard discounts, which typically differ by product, are considered confidential and not shown onprice sheets but are communicated to the customer when a contract has been agreed to (U.S. producer questionnaireresponse, section IV-B-4 and 5). These standard discounts may be applied differently by the U.S. producers. ***(U.S. producer questionnaire response, section IV-B-5).
30 U.S. producer questionnaire response, section IV-B-4.
31 Purchaser questionnaire responses, section III-21.
32 Ibid.
33 U.S. producer questionnaire responses, section IV-B-6.
34 U.S. producer questionnaire responses, section IV-B-8.
35 U.S. producer questionnaire responses, section IV-B-6.
36 U.S. producer questionnaire responses, section IV-B-7.
37 Ibid.
38 Purchaser questionnaire responses, section III-30.
39 The responding purchasers frequently cited more than one firm as a price leader.
V-7
involve smaller quantities or less competition, dealers are quoted standard discounts from list prices.29 Additional discounts may be offered to dealers based on competitive situations. *** indicated that thetotal discount for any given sale may be different depending upon the specific transaction includingquantity, type of customer and application, competitive environment, etc.30
Eleven of 22 responding U.S. purchasers reported that their purchase prices of ICI forklift truckswere established through negotiations with their suppliers, while 11 firms indicated that suppliers set theprice.31 Eleven of 21 responding purchasers reported that they did mention competing prices to theirsuppliers when obtaining a price for ICI forklift trucks, while the remaining 10 firms indicated that theydid not mention competing prices.32
U.S. producers reported selling their U.S.-produced ICI forklift trucks on an f.o.b. plant orwarehouse basis, except for ***, who sold their ICI forklift trucks to their national-account end users on adelivered basis during January 1999-June 2005.33 Regardless of how prices are quoted, f.o.b. ordelivered, the U.S. producers reported arranging transportation of the ICI forklift trucks to their U.S.customers.34 Payment terms of net 30 days were offered by ***, while *** offered 1 percent net 30 and*** offered 2 percent net 30.35
U.S. producers reported that 94.6 percent of the quantity of their domestic sales of the U.S.-produced ICI forklift trucks are produced to order and typically require an average of 108 days from thetime the order is placed to when the product is delivered.36 U.S. producers reported that the remaining 5.4percent of their U.S. sales of ICI forklift trucks are shipped from inventory and require an average of 10days from the time the order is placed to when the product is delivered.37
Fifteen of 19 responding U.S. purchasers identified price leaders of ICI forklift trucks in the U.S.market during January 1999-June 2005, while the remaining four firms indicated that there were no priceleaders.38 Toyota was cited by 14 purchasers as a price leader, NACCO was cited by 10 firms as a priceleader, Mitsubishi was cited by seven firms, Daewoo was cited by two firms, and Hyundai, Nissan, andTaylor were each cited by a single firm as price leaders.39 Toyota was cited by seven purchasers asleading prices up and by two purchasers as leading prices down; NACCO was cited by two purchasers asleading prices up and by three others as leading prices down; Mitsubishi was cited by two firms as
40 Purchaser questionnaire responses, section III-30 and 31.
41 Purchaser questionnaire responses, section III-29.
42 The product descriptions were based on comments regarding the draft questionnaires submitted by *** as wellas ***, which had not previously indicated a willingness to participate in this review.
V-8
leading prices up and by two others as leading prices down; Daewoo was cited by two firms as leadingprices down; and Hyundai was cited by one firm as leading prices down.40
Fourteen of 19 responding U.S. purchasers, all dealers, reported that they never purchased ICIforklift trucks at the lowest price, while four firms reported that they sometimes purchased ICI forklifttrucks at the lowest price, and the remaining firm reported that it always purchased ICI forklift trucks atthe lowest price.41 Factors cited by the 18 firms that never or sometimes purchased ICI forklift trucks atthe lowest price included exclusive dealer, quality, availability, reliability, technical support, and partsavailability.
PRICE DATA
Questionnaire Price Data
U.S. selling value and quantity data were requested for sales to U.S. customers for the followingsix products for ICI forklift trucks produced in the United States and imported from Japan:42
Product 1.–New internal combustion engine forklift truck, cushion tires, 3,000 poundbasic lift capacity, liquid petroleum gas (propane, butane, methane, etc.) system, powershift (automatic) transmission, and a three-stage mast with a maximum lift height of165-200 inches.
Product 2.–New internal combustion engine forklift truck, pneumatic tires, 3,000pound basic lift capacity, liquid petroleum gas (propane, butane, methane, etc.) system,power shift (automatic) transmission, and a three-stage mast with a maximum liftheight of 165-200 inches.
Product 3.–New internal combustion engine forklift truck, cushion tires, 5,000 poundbasic lift capacity, liquid petroleum gas (propane, butane, methane, etc.) system, powershift (automatic) transmission, and a three-stage mast with a maximum lift height of165-200 inches.
Product 4.–New internal combustion engine forklift truck, pneumatic tires, 5,000pound basic lift capacity, gasoline engine, power shift (automatic) transmission, and athree-stage mast with a maximum lift height of 165-200 inches.
Product 5.–New internal combustion engine forklift truck, pneumatic tires, 8,000pound basic lift capacity, gasoline engine, power shift (automatic) transmission, and athree-stage mast with a maximum lift height of 165-200 inches.
Product 6.–New internal combustion engine forklift truck, pneumatic tires, 8,000pound basic lift capacity, liquid petroleum gas (propane, butane, methane, etc.) system,power shift (automatic) transmission, and a three-stage mast with a maximum liftheight of 165-200 inches.

43 The five U.S. producers reporting price data were ***. Responding importers reported imports of ICI forklifttrucks only from nonsubject countries.
44 *** (E-mail from ***). On the other hand, *** (*** U.S. producer questionnaire response, section IV-B-22and staff telephone interview with ***).
45 This quantity represented *** percent of their total reported U.S. shipments of the U.S.-produced ICI forklifttrucks with imported frames during this period.
46 The price data for national-account end users based on sales and leases were combined because all fourresponding U.S. producers reported that their selling prices of the U.S.-produced ICI forklift trucks did not differbetween sales and lease transactions (U.S. producer questionnaire responses, section IV-B-23).
V-9
The price data were requested from the U.S. producers and importers for their quarterlyshipments of the specified ICI forklift truck products during January 1999-June 2005 that were producedin the United States and imported from Japan. The requested price data were based on net U.S. f.o.b.selling price data for shipments to U.S. customers unrelated to the suppliers. The responding firms wererequested to report the price data separately for sales to U.S. dealers and to national-account end users. Inaddition, the price data for national-account end users were requested separately for sales and for leases. Five U.S. producers of the ICI forklift trucks provided selling price data,43 but not necessarily forall products, types of customers, or periods requested.44 The U.S. producers reported total U.S. salesquantities of the U.S.-produced ICI forklift trucks with domestic frames for pricing purposes duringJanuary 1999-June 2005 that amounted to 73,549 ICI forklift trucks, or 26.7 percent of their total reportedU.S. shipments of the U.S.-produced ICI forklift trucks with domestic frames during this period. Theresponding U.S. producers also reported total U.S. sales quantities of the U.S.-produced ICI forklift truckswith imported frames for pricing purposes during January 1999-June 2005 that amounted to *** ICIforklift trucks.45 The combined reported total U.S. sales quantities for pricing purposes of the U.S.-produced ICI forklift trucks with domestic and imported frames amounted to *** ICI forklift trucks, or*** percent of the U.S. producers’ total reported U.S. shipments of U.S.-produced ICI forklift trucks withdomestic and imported frames during January 1999-June 2005. Reported price data for U.S.-producedICI forklift trucks with domestic frames involved 67,974 trucks shipped to U.S. dealers, or 24.7 percent oftheir total reported U.S. shipments of the U.S.-produced ICI forklift trucks with domestic frames duringthis period, and 5,575 trucks shipped to national-account end users, or 2.0 percent of the total. Reportedprice data for U.S.-produced ICI forklift trucks with domestic and imported frames involved *** trucksshipped to U.S. dealers, or *** percent of the total reported U.S. shipments of the U.S.-produced ICIforklift trucks with domestic and imported frames during this period, and *** trucks shipped to national-account end users, or *** percent of the total.
Quarterly weighted-average prices and quarterly shipments of the domestic ICI forklift truckproducts are based on the reported U.S. net f.ob. selling price data reported by the U.S. producers and areshown by products for sales to U.S. dealers in table V-1a for the U.S.-produced products with domesticframes and in table V-1b for the U.S.-produced products with domestic and with imported framescombined. These price data for sales to dealers are also shown by products in figures V-3 through V-8. In addition, quarterly price data are shown by products for sales to U.S. national-account end users intable V-2a for the U.S.-produced products with domestic frames and in table V-2b for the U.S.-producedproducts with domestic and imported frames combined.46 These price data for sales to national-accountend users are also shown by products in figures V-9 through V-14. In addition, reported prices of U.S.-produced forklift trucks are shown by responding U.S. producers in appendix F.

V-10
Table V-1aICI forklift trucks: U.S. weighted-average net f.o.b. selling prices and quantities of U.S.-producedICI forklift trucks with U.S.-produced frames sold to U.S. dealers, by products and by quarters,January 1999-June 2005
* * * * * * *
Table V-1bICI forklift trucks: U.S. weighted-average net f.o.b. selling prices and quantities of U.S.-producedICI forklift trucks with U.S.-produced and imported frames sold to U.S. dealers, by products and byquarters, January 1999-June 2005
* * * * * * *
Table V-2aICI forklift trucks: U.S. weighted-average net f.o.b. selling prices and quantities of U.S.-producedICI forklift trucks with U.S.-produced frames sold to U.S. national account end users, by productsand by quarters, January 1999-June 2005
* * * * * * *
Table V-2bICI forklift trucks: U.S. weighted-average net f.o.b. selling prices and quantities of U.S.-producedICI forklift trucks with U.S.-produced and imported frames sold to U.S. national account end users,by products and by quarters, January 1999-June 2005
* * * * * * *
Figure V-3ICI forklift trucks: U.S. weighted-average net f.o.b. selling prices and quantities of U.S.-producedICI forklift truck product 1 sold to U.S. dealers, by quarters, January 1999-June 2005
* * * * * * *
Figure V-4ICI forklift trucks: U.S. weighted-average net f.o.b. selling prices and quantities of U.S.-producedICI forklift truck product 2 sold to U.S. dealers, by quarters, January 1999-June 2005
* * * * * * *
Figure V-5ICI forklift trucks: U.S. weighted-average net f.o.b. selling prices and quantities of U.S.-producedICI forklift truck product 3 sold to U.S. dealers, by quarters, January 1999-June 2005
* * * * * * *
Figure V-6ICI forklift trucks: U.S. weighted-average net f.o.b. selling prices and quantities of U.S.-producedICI forklift trucks product 4 sold to U.S. dealers, by quarters, January 1999-June 2005
* * * * * * *

V-11
Figure V-7ICI forklift trucks: U.S. weighted-average net f.o.b. selling prices and quantities of U.S.-producedICI forklift trucks product 5 sold to U.S. dealers, by quarters, January 1999-June 2005
* * * * * * *
Figure V-8ICI forklift trucks: U.S. weighted-average net f.o.b. selling prices and quantities of U.S.-producedICI forklift trucks product 6 sold to U.S. dealers, by quarters, January 1999-June 2005
* * * * * * *
Figure V-9ICI forklift trucks: U.S. weighted-average net f.o.b. selling prices and quantities of U.S.-producedICI forklift trucks product 1 sold to U.S. national account end users, by quarters, January 1999-June 2005
* * * * * * *
Figure V-10ICI forklift trucks: U.S. weighted-average net f.o.b. selling prices and quantities of U.S.-producedICI forklift trucks product 2 sold to U.S. national account end users, by quarters, January 1999-June 2005
* * * * * * *
Figure V-11ICI forklift trucks: U.S. weighted-average net f.o.b. selling prices and quantities of U.S.-producedICI forklift trucks product 3 sold to U.S. national account end users, by quarters, January 1999-June 2005
* * * * * * *
Figure V-12ICI forklift trucks: U.S. weighted-average net f.o.b. selling prices and quantities of U.S.-producedICI forklift trucks product 4 sold to U.S. national account end users, by quarters, January 1999-June 2005
* * * * * * *
Figure V-13ICI forklift trucks: U.S. weighted-average net f.o.b. selling prices and quantities of U.S.-producedICI forklift trucks product 5 sold to U.S. national account end users, by quarters, January 1999-June 2005
* * * * * * *
Figure V-14ICI forklift trucks: U.S. weighted-average net f.o.b. selling prices and quantities of U.S.-producedICI forklift trucks product 6 sold to U.S. national account end users, by quarters, January 1999-June 2005
* * * * * * *
47 *** provided the requested price lists in their U.S. producer questionnaire responses, section IV-B-4.
48 NACCO reported that the firm measures differences in prices in tenths of a percent (hearing transcript, p. 89(Wilson)). On a $20,000 ICI forklift truck, such price differences would translate to less than $200 per truck, suchthat differences in options and accessories could affect price comparisons among otherwise similar ICI forklifttrucks.
49 U.S. producer questionnaire response, section IV-C-4.
50 Hearing transcript, pp. 116-117 (Rosenthal).
V-12
Three U.S. producers also provided requested price lists for their ICI forklift trucks,47 whichshowed that a number of environmental and hydraulic options and a number of accessories can beincluded with a forklift truck that would increase the price of the forklift truck by hundreds to thousandsof dollars.48 Each specified pricing product was defined based on lift capacity, engine system, fuel type,mast construction, lift height, and tire types, after consulting with ***. The specified pricing products donot, however, limit the number of options or accessories that can be added. Because price can also beaffected by the quantity sold, changes in the composition of customers from quarter-to-quarter couldresult from varying mixes of contracts involving different quantities and, accordingly, different pricelevels. As a result, price trends involving the reported U.S. net f.o.b. selling prices should be viewed withsome caution, because, within the product categories, product mix and the mix of contracts may shiftfrom quarter to quarter and vary among firms, especially for sales to national-account end users.
Price Trends
The weighted-average quarterly selling prices of the specified ICI forklift truck productsproduced domestically with U.S.-produced frames and the U.S.-produced products with domestic andimported frames combined fluctuated during January 1999-June 2005, generally without clear trends. Quarterly selling prices for sales to U.S. national-account end users tended to fluctuate more than pricesto U.S. dealers. Price trends and price levels of the two categories of U.S.-produced ICI forklifttrucks–those produced with domestic frames and those with domestic and imported frames combined,whether sold to dealers or to national-account end users, tended to be similar to each other. Prices ofU.S.-produced ICI forklift truck products 1-6 (with just domestic frames or combined with importedframes) sold to U.S. dealers typically remained relatively stable during January 1999-December 2003 andthen generally increased during January 2004-June 2005. Prices of U.S.-produced ICI forklift truckproducts 1, 2, and 4 (with just domestic frames or with domestic and imported frames combined) sold toU.S. national-account end users fluctuated, but generally trended up during January 2004-June 2005,while selling prices of products 3, 5, and 6 sold to national-account end users showed no clear trends. Selling prices of U.S.-produced products 1, 2, 5, and 6 (with just domestic frames and with domestic andimported frames) sold to national-account end users decreased somewhat during April-June 2005 fromthe previous quarter’s price levels. *** asserted that although there has been an increase in demand overthe past 6 quarters, prices have not risen commensurate with raw material costs and, therefore, the firm isstill experiencing a cost-price squeeze.49 NACCO contends that U.S. prices for ICI forklift trucks havebeen in essentially rough equilibrium at relatively competitive and low levels for a long time, but,according to NACCO, pricing could get worse if the antidumping order is revoked, because the orderreportedly has been a tremendous restraint on the Japanese pricing behavior.50
A-1
APPENDIX A
FEDERAL REGISTER NOTICES AND THECOMMISSION’S STATEMENT ON ADEQUACY

9971Federal Register / Vol. 70, No. 39 / Tuesday, March 1, 2005 / Notices
1 No response to this request for information is required if a currently valid Office of Management and Budget (OMB) number is not displayed; the OMB number is 3117–0016/USITC No. 05–5–114, expiration date June 30, 2005. Public reporting burden for the request is estimated to average 7 hours per response. Please send comments regarding the accuracy of this burden estimate to the Office of Investigations, U.S. International Trade Commission, 500 E Street, SW., Washington, DC 20436.
in this review by providing information requested by the Commission.
(4) A statement of the likely effects of the revocation of the antidumping duty order on the Domestic Industry in general and/or your firm/entity specifically. In your response, please discuss the various factors specified in section 752(a) of the Act (19 U.S.C. 1675a(a)) including the likely volume of subject imports, likely price effects of subject imports, and likely impact of imports of Subject Merchandise on the Domestic Industry.
(5) A list of all known and currently operating U.S. producers of the Domestic Like Product. Identify any known related parties and the nature of the relationship as defined in section 771(4)(B) of the Act (19 U.S.C. 1677(4)(B)).
(6) A list of all known and currently operating U.S. importers of the Subject Merchandise and producers of the Subject Merchandise in the Subject Country that currently export or have exported Subject Merchandise to the United States or other countries after 1990.
(7) If you are a U.S. producer of the Domestic Like Product, provide the following information on your firm’s operations on that product during calendar year 2004 (report quantity data in units and value data in U.S. dollars, f.o.b. plant). If you are a union/worker group or trade/business association, provide the information, on an aggregate basis, for the firms in which your workers are employed/which are members of your association.
(a) Production (quantity) and, if known, an estimate of the percentage of total U.S. production of the Domestic Like Product accounted for by your firm’s(s’) production;
(b) the quantity and value of U.S. commercial shipments of the Domestic Like Product produced in your U.S. plant(s); and
(c) the quantity and value of U.S. internal consumption/company transfers of the Domestic Like Product produced in your U.S. plant(s).
(8) If you are a U.S. importer or a trade/business association of U.S. importers of the Subject Merchandise from the Subject Country, provide the following information on your firm’s(s’) operations on that product during calendar year 2004 (report quantity data in units and value data in U.S. dollars). If you are a trade/business association, provide the information, on an aggregate basis, for the firms which are members of your association.
(a) The quantity and value (landed, duty-paid but not including antidumping duties) of U.S. imports
and, if known, an estimate of the percentage of total U.S. imports of Subject Merchandise from the Subject Country accounted for by your firm’s(s’) imports;
(b) the quantity and value (f.o.b. U.S. port, including antidumping duties) of U.S. commercial shipments of Subject Merchandise imported from the Subject Country; and
(c) the quantity and value (f.o.b. U.S. port, including antidumping duties) of U.S. internal consumption/company transfers of Subject Merchandise imported from the Subject Country.
(9) If you are a producer, an exporter, or a trade/business association of producers or exporters of the Subject Merchandise in the Subject Country, provide the following information on your firm’s(s’) operations on that product during calendar year 2004 (report quantity data in units and value data in thousands of U.S. dollars, landed and duty-paid at the U.S. port but not including antidumping duties). If you are a trade/business association, provide the information, on an aggregate basis, for the firms which are members of your association.
(a) Production (quantity) and, if known, an estimate of the percentage of total production of Subject Merchandise in the Subject Country accounted for by your firm’s(s’) production; and
(b) the quantity and value of your firm’s(s’) exports to the United States of Subject Merchandise and, if known, an estimate of the percentage of total exports to the United States of Subject Merchandise from the Subject Country accounted for by your firm’s(s’) exports.
(10) Identify significant changes, if any, in the supply and demand conditions or business cycle for the Domestic Like Product that have occurred in the United States or in the market for the Subject Merchandise in the Subject Country after 1990, and significant changes, if any, that are likely to occur within a reasonably foreseeable time. Supply conditions to consider include technology; production methods; development efforts; ability to increase production (including the shift of production facilities used for other products and the use, cost, or availability of major inputs into production); and factors related to the ability to shift supply among different national markets (including barriers to importation in foreign markets or changes in market demand abroad). Demand conditions to consider include end uses and applications; the existence and availability of substitute products; and the level of competition among the Domestic Like Product produced in the United States, Subject
Merchandise produced in the Subject Country, and such merchandise from other countries.
(11) (OPTIONAL) A statement of whether you agree with the above definitions of the Domestic Like Product and Domestic Industry; if you disagree with either or both of these definitions, please explain why and provide alternative definitions.
Authority: This review is being conducted under authority of title VII of the Tariff Act of 1930; this notice is published pursuant to § 207.61 of the Commission’s rules.
Issued: February 23, 2005.By order of the Commission.
Marilyn R. Abbott, Secretary to the Commission.[FR Doc. 05–3947 Filed 2–28–05; 8:45 am] BILLING CODE 7020–02–P
INTERNATIONAL TRADE COMMISSION
[Investigation No. 731–TA–377 (Second Review)]
Internal Combustion Industrial Forklift Trucks From Japan
AGENCY: International Trade Commission.ACTION: Institution of a five-year review concerning the antidumping duty order on internal combustion industrial forklift trucks from Japan.
SUMMARY: The Commission hereby gives notice that it has instituted a review pursuant to section 751(c) of the Tariff Act of 1930 (19 U.S.C. 1675(c)) (the Act) to determine whether revocation of the antidumping duty order on internal combustion industrial forklift trucks from Japan would be likely to lead to continuation or recurrence of material injury. Pursuant to section 751(c)(2) of the Act, interested parties are requested to respond to this notice by submitting the information specified below to the Commission; 1 to be assured of consideration, the deadline for responses is April 20, 2005. Comments on the adequacy of responses may be filed with the Commission by May 16, 2005. For further information concerning the conduct of this review and rules of general application, consult
VerDate jul<14>2003 14:21 Feb 28, 2005 Jkt 205001 PO 00000 Frm 00062 Fmt 4703 Sfmt 4703 E:\FR\FM\01MRN1.SGM 01MRN1

9972 Federal Register / Vol. 70, No. 39 / Tuesday, March 1, 2005 / Notices
the Commission’s Rules of Practice and Procedure, part 201, subparts A through E (19 CFR part 201), and part 207, subparts A, D, E, and F (19 CFR part 207).EFFECTIVE DATE: March 1, 2005.FOR FURTHER INFORMATION CONTACT: Mary Messer (202) 205–3193, Office of Investigations, U.S. International Trade Commission, 500 E Street, SW., Washington, DC 20436. Hearing-impaired persons can obtain information on this matter by contacting the Commission’s TDD terminal on (202) 205–1810. Persons with mobility impairments who will need special assistance in gaining access to the Commission should contact the Office of the Secretary at (202) 205–2000. General information concerning the Commission may also be obtained by accessing its Internet server (http://www.usitc.gov). The public record for this review may be viewed on the Commission’s electronic docket (EDIS) at http://edis.usitc.gov.SUPPLEMENTARY INFORMATION:
Background.—On June 7, 1988, the Department of Commerce issued an antidumping duty order on imports of internal combustion industrial forklift trucks from Japan (53 FR 20882). Following five-year reviews by Commerce and the Commission, effective April 17, 2000, Commerce issued a continuation of the antidumping duty order on imports of internal combustion industrial forklift trucks from Japan (65 FR 35323, June 2, 2000). The Commission is now conducting a second review to determine whether revocation of the order would be likely to lead to continuation or recurrence of material injury to the domestic industry within a reasonably foreseeable time. It will assess the adequacy of interested party responses to this notice of institution to determine whether to conduct a full review or an expedited review. The Commission’s determination in any expedited review will be based on the facts available, which may include information provided in response to this notice.
Definitions.—The following definitions apply to this review:
(1) Subject Merchandise is the class or kind of merchandise that is within the scope of the five-year review, as defined by the Department of Commerce.
(2) The Subject Country in this review is Japan.
(3) The Domestic Like Product is the domestically produced product or products which are like, or in the absence of like, most similar in characteristics and uses with, the
Subject Merchandise. In its original determination and its full five-year review determination, the Commission found a single Domestic Like Product: industrial, operator-riding internal combustion engine forklift trucks with a weight-lift capacity of between 2,000 and 15,000 pounds (inclusive), with a U.S.-produced frame.
(4) The Domestic Industry is the U.S. producers as a whole of the Domestic Like Product, or those producers whose collective output of the Domestic Like Product constitutes a major proportion of the total domestic production of the product. In its original determination and its full five-year review determination, the Commission defined the Domestic Industry as U.S. producers of industrial, operator-riding internal combustion engine forklift trucks with a weight-lift capacity of between 2,000 and 15,000 pounds (inclusive), with a U.S.-produced frame. However, in its full five-year review determination, the Commission excluded from the Domestic Industry Mitsubishi Caterpillar, Toyota Industrial, Nissan Forklift, Komatsu USA, and TCM USA under the related parties provision. Certain Commissioners defined the Domestic Industry differently in the full five-year review determination.
(5) An Importer is any person or firm engaged, either directly or through a parent company or subsidiary, in importing the Subject Merchandise into the United States from a foreign manufacturer or through its selling agent.
Participation in the review and public service list.—Persons, including industrial users of the Subject Merchandise and, if the merchandise is sold at the retail level, representative consumer organizations, wishing to participate in the review as parties must file an entry of appearance with the Secretary to the Commission, as provided in section 201.11(b)(4) of the Commission’s rules, no later than 21 days after publication of this notice in the Federal Register. The Secretary will maintain a public service list containing the names and addresses of all persons, or their representatives, who are parties to the review.
Former Commission employees who are seeking to appear in Commission five-year reviews are reminded that they are required, pursuant to 19 CFR 201.15, to seek Commission approval if the matter in which they are seeking to appear was pending in any manner or form during their Commission employment. The Commission is seeking guidance as to whether a second transition five-year review is the ‘‘same particular matter’’ as the underlying
original investigation for purposes of 19 CFR 201.15 and 18 U.S.C. 207, the post employment statute for Federal employees. Former employees may seek informal advice from Commission ethics officials with respect to this and the related issue of whether the employee’s participation was ‘‘personal and substantial.’’ However, any informal consultation will not relieve former employees of the obligation to seek approval to appear from the Commission under its rule 201.15. For ethics advice, contact Carol McCue Verratti, Deputy Agency Ethics Official, at (202) 205–3088.
Limited disclosure of business proprietary information (BPI) under an administrative protective order (APO) and APO service list.—Pursuant to section 207.7(a) of the Commission’s rules, the Secretary will make BPI submitted in this review available to authorized applicants under the APO issued in the review, provided that the application is made no later than 21 days after publication of this notice in the Federal Register. Authorized applicants must represent interested parties, as defined in 19 U.S.C. 1677(9), who are parties to the review. A separate service list will be maintained by the Secretary for those parties authorized to receive BPI under the APO.
Certification.—Pursuant to section 207.3 of the Commission’s rules, any person submitting information to the Commission in connection with this review must certify that the information is accurate and complete to the best of the submitter’s knowledge. In making the certification, the submitter will be deemed to consent, unless otherwise specified, for the Commission, its employees, and contract personnel to use the information provided in any other reviews or investigations of the same or comparable products which the Commission conducts under Title VII of the Act, or in internal audits and investigations relating to the programs and operations of the Commission pursuant to 5 U.S.C. Appendix 3.
Written submissions.—Pursuant to section 207.61 of the Commission’s rules, each interested party response to this notice must provide the information specified below. The deadline for filing such responses is April 20, 2005. Pursuant to section 207.62(b) of the Commission’s rules, eligible parties (as specified in Commission rule 207.62(b)(1)) may also file comments concerning the adequacy of responses to the notice of institution and whether the Commission should conduct an expedited or full review. The deadline for filing such comments is May 16,
VerDate jul<14>2003 14:21 Feb 28, 2005 Jkt 205001 PO 00000 Frm 00063 Fmt 4703 Sfmt 4703 E:\FR\FM\01MRN1.SGM 01MRN1

9973Federal Register / Vol. 70, No. 39 / Tuesday, March 1, 2005 / Notices
2005. All written submissions must conform with the provisions of sections 201.8 and 207.3 of the Commission’s rules and any submissions that contain BPI must also conform with the requirements of sections 201.6 and 207.7 of the Commission’s rules. The Commission’s rules do not authorize filing of submissions with the Secretary by facsimile or electronic means, except to the extent permitted by section 201.8 of the Commission’s rules, as amended, 67 FR 68036 (November 8, 2002). Also, in accordance with sections 201.16(c) and 207.3 of the Commission’s rules, each document filed by a party to the review must be served on all other parties to the review (as identified by either the public or APO service list as appropriate), and a certificate of service must accompany the document (if you are not a party to the review you do not need to serve your response).
Inability to provide requested information.—Pursuant to section 207.61(c) of the Commission’s rules, any interested party that cannot furnish the information requested by this notice in the requested form and manner shall notify the Commission at the earliest possible time, provide a full explanation of why it cannot provide the requested information, and indicate alternative forms in which it can provide equivalent information. If an interested party does not provide this notification (or the Commission finds the explanation provided in the notification inadequate) and fails to provide a complete response to this notice, the Commission may take an adverse inference against the party pursuant to section 776(b) of the Act in making its determination in the review.
Information to be Provided in Response to this Notice of Institution: As used below, the term ‘‘firm’’ includes any related firms.
(1) The name and address of your firm or entity (including World Wide Web address if available) and name, telephone number, fax number, and e-mail address of the certifying official.
(2) A statement indicating whether your firm/entity is a U.S. producer of the Domestic Like Product, a U.S. union or worker group, a U.S. importer of the Subject Merchandise, a foreign producer or exporter of the Subject Merchandise, a U.S. or foreign trade or business association, or another interested party (including an explanation). If you are a union/worker group or trade/business association, identify the firms in which your workers are employed or which are members of your association.
(3) A statement indicating whether your firm/entity is willing to participate
in this review by providing information requested by the Commission.
(4) A statement of the likely effects of the revocation of the antidumping duty order on the Domestic Industry in general and/or your firm/entity specifically. In your response, please discuss the various factors specified in section 752(a) of the Act (19 U.S.C. 1675a(a)) including the likely volume of subject imports, likely price effects of subject imports, and likely impact of imports of Subject Merchandise on the Domestic Industry.
(5) A list of all known and currently operating U.S. producers of the Domestic Like Product. Identify any known related parties and the nature of the relationship as defined in section 771(4)(B) of the Act (19 U.S.C. 1677(4)(B)).
(6) A list of all known and currently operating U.S. importers of the Subject Merchandise and producers of the Subject Merchandise in the Subject Country that currently export or have exported Subject Merchandise to the United States or other countries after 1998.
(7) If you are a U.S. producer of the Domestic Like Product, provide the following information on your firm’s operations on that product during calendar year 2004 (report quantity data in number of trucks and value data in U.S. dollars, f.o.b. plant). If you are a union/worker group or trade/business association, provide the information, on an aggregate basis, for the firms in which your workers are employed/which are members of your association.
(a) Production (quantity) and, if known, an estimate of the percentage of total U.S. production of the Domestic Like Product accounted for by your firm’s(s’) production;
(b) The quantity and value of U.S. commercial shipments of the Domestic Like Product produced in your U.S. plant(s); and
(c) The quantity and value of U.S. internal consumption/company transfers of the Domestic Like Product produced in your U.S. plant(s).
(8) If you are a U.S. importer or a trade/business association of U.S. importers of the Subject Merchandise from the Subject Country, provide the following information on your firm’s(s’) operations on that product during calendar year 2004 (report quantity data in number of trucks and value data in U.S. dollars). If you are a trade/business association, provide the information, on an aggregate basis, for the firms which are members of your association.
(a) The quantity and value (landed, duty-paid but not including antidumping duties) of U.S. imports
and, if known, an estimate of the percentage of total U.S. imports of Subject Merchandise from the Subject Country accounted for by your firm’s(s’) imports;
(b) The quantity and value (f.o.b. U.S. port, including antidumping duties) of U.S. commercial shipments of Subject Merchandise imported from the Subject Country; and
(c) The quantity and value (f.o.b. U.S. port, including antidumping duties) of U.S. internal consumption/company transfers of Subject Merchandise imported from the Subject Country.
(9) If you are a producer, an exporter, or a trade/business association of producers or exporters of the Subject Merchandise in the Subject Country, provide the following information on your firm’s(s’) operations on that product during calendar year 2004 (report quantity data in number of trucks and value data in thousands of U.S. dollars, landed and duty-paid at the U.S. port but not including antidumping duties). If you are a trade/business association, provide the information, on an aggregate basis, for the firms which are members of your association.
(a) Production (quantity) and, if known, an estimate of the percentage of total production of Subject Merchandise in the Subject Country accounted for by your firm’s(s’) production; and
(b) The quantity and value of your firm’s(s’) exports to the United States of Subject Merchandise and, if known, an estimate of the percentage of total exports to the United States of Subject Merchandise from the Subject Country accounted for by your firm’s(s’) exports.
(10) Identify significant changes, if any, in the supply and demand conditions or business cycle for the Domestic Like Product that have occurred in the United States or in the market for the Subject Merchandise in the Subject Country after 1998, and significant changes, if any, that are likely to occur within a reasonably foreseeable time. Supply conditions to consider include technology; production methods; development efforts; ability to increase production (including the shift of production facilities used for other products and the use, cost, or availability of major inputs into production); and factors related to the ability to shift supply among different national markets (including barriers to importation in foreign markets or changes in market demand abroad). Demand conditions to consider include end uses and applications; the existence and availability of substitute products; and the level of competition among the Domestic Like Product
VerDate jul<14>2003 14:21 Feb 28, 2005 Jkt 205001 PO 00000 Frm 00064 Fmt 4703 Sfmt 4703 E:\FR\FM\01MRN1.SGM 01MRN1

9974 Federal Register / Vol. 70, No. 39 / Tuesday, March 1, 2005 / Notices
regarding the accuracy of this burden estimate to the Office of Investigations, U.S. International Trade Commission, 500 E Street, SW., Washington, DC 20436.
produced in the United States, Subject Merchandise produced in the Subject Country, and such merchandise from other countries.
(11) (Optional) A statement of whether you agree with the above definitions of the Domestic Like Product and Domestic Industry; if you disagree with either or both of these definitions, please explain why and provide alternative definitions.
Authority: This review is being conducted under authority of title VII of the Tariff Act of 1930; this notice is published pursuant to section 207.61 of the Commission’s rules.
By order of the Commission.Issued: February 23, 2005.
Marilyn R. Abbott, Secretary to the Commission.[FR Doc. 05–3949 Filed 2–28–05; 8:45 am] BILLING CODE 7020–02–P
SUMMARY: The Commission hereby gives notice that it has instituted reviews pursuant to section 751(c) of the Tariff Act of 1930 (19 U.S.C. 1675(c)) (the Act) to determine whether revocation of the antidumping duty orders on porcelain-on-steel cooking ware from China and Taiwan and the countervailing and antidumping duty orders on top-of-the-stove stainless steel cooking ware from Korea and Taiwan would be likely to lead to continuation or recurrence of material injury. Pursuant to section 751(c)(2) of the Act, interested parties are requested to respond to this notice by submitting the information specified below to the Commission; 1 to be
assured of consideration, the deadline for responses is April 20, 2005. Comments on the adequacy of responses may be filed with the Commission by May 16, 2005. For further information concerning the conduct of these reviews and rules of general application, consult the Commission’s Rules of Practice and Procedure, part 201, subparts A through E (19 CFR part 201), and part 207, subparts A, D, E, and F (19 CFR part 207).DATES: Effective Date: March 1, 2005.FOR FURTHER INFORMATION CONTACT: Mary Messer (202) 205–3193, Office of Investigations, U.S. International Trade Commission, 500 E Street, SW., Washington, DC 20436. Hearing-impaired persons can obtain information on this matter by contacting the Commission’s TDD terminal on (202) 205–1810. Persons with mobility impairments who will need special assistance in gaining access to the Commission should contact the Office of the Secretary at (202) 205–2000. General information concerning the Commission may also be obtained by accessing its Internet server (http://www.usitc.gov). The public record for these reviews may be viewed on the Commission’s electronic docket (EDIS) at http://edis.usitc.gov.SUPPLEMENTARY INFORMATION:
Background. On December 2, 1986, the Department of Commerce issued antidumping duty orders on imports of porcelain-on-steel cooking ware from China and Taiwan (51 FR 43414). On January 20, 1987, Commerce issued antidumping and countervailing duty orders on imports of top-of-the-stove stainless steel cooking ware from Korea and Taiwan (52 FR 2138). Following five-year reviews by Commerce and the Commission, effective April 14, 2000, Commerce issued a continuation of the antidumping duty orders on porcelain-on-steel cooking ware from China and Taiwan (65 FR 20136 and 21504) and, effective April 18, 2000, Commerce issued a continuation of the countervailing and antidumping duty orders on top-of-the-stove stainless steel cooking ware from Korea and Taiwan (65 FR 20801). The Commission is now conducting second reviews to determine whether revocation of the orders would be likely to lead to continuation or recurrence of material injury to the domestic industry within a reasonably foreseeable time. It will assess the adequacy of interested party responses to this notice of institution to determine
whether to conduct full reviews or expedited reviews. The Commission’s determinations in any expedited reviews will be based on the facts available, which may include information provided in response to this notice.
Definitions. The following definitions apply to these reviews:
(1) Subject Merchandise is the class or kind of merchandise that is within the scope of the five-year reviews, as defined by the Department of Commerce.
(2) The Subject Countries in these reviews are China, Korea, and Taiwan.
(3) The Domestic Like Product is the domestically produced product or products which are like, or in the absence of like, most similar in characteristics and uses with, the Subject Merchandise. In its original determinations and its full five-year review determinations concerning porcelain-on-steel cooking ware from China and Taiwan, the Commission defined the Domestic Like Product as all porcelain-on-steel cooking ware, including teakettles. One Commissioner defined the Domestic Like Product differently in the original determinations concerning porcelain-on-steel cooking ware from China and Taiwan. In the original antidumping and countervailing duty determinations and the full five-year review determinations concerning top-of-the-stove stainless steel cooking ware from Korea and Taiwan, the Commission defined the Domestic Like Product to correspond with the Subject Merchandise, that is, all top-of-the-stove stainless steel cooking ware, excluding teakettles, ovenware, and kitchen ware.
(4) The Domestic Industry is the U.S. producers as a whole of the Domestic Like Product, or those producers whose collective output of the Domestic Like Product constitutes a major proportion of the total domestic production of the product. In its original determinations and its full five-year review determinations concerning porcelain-on-steel cooking ware from China and Taiwan, the Commission defined the Domestic Industry as producers of porcelain-on-steel cooking ware, including teakettles. One Commissioner defined the Domestic Industry differently in the original determinations concerning porcelain-on-steel cooking ware from China and Taiwan. In the original antidumping and countervailing duty determinations and full five-year review determinations concerning top-of-the-stove stainless steel cooking ware from Korea and Taiwan, the Commission defined the
VerDate jul<14>2003 14:21 Feb 28, 2005 Jkt 205001 PO 00000 Frm 00065 Fmt 4703 Sfmt 4703 E:\FR\FM\01MRN1.SGM 01MRN1
36657Federal Register / Vol. 70, No. 121 / Friday, June 24, 2005 / Notices
1 Vice Chairman Deanna Tanner Okun dissenting. 2 Chairman Stephen Koplan dissenting.
INTERNATIONAL TRADE COMMISSION
[Investigation No. 731–TA–377 (Second Review)]
Internal Combustion Industrial Forklift Trucks From Japan
AGENCY: United States International Trade Commission.ACTION: Notice of Commission determination to conduct a full five-year review concerning the antidumping duty order on internal combustion industrial forklift trucks from Japan.
SUMMARY: The Commission hereby gives notice that it will proceed with a full review pursuant to section 751(c)(5) of the Tariff Act of 1930 (19 U.S.C. 1675(c)(5)) to determine whether revocation of the antidumping duty order on internal combusion industrial forklift trucks from Japan would be likely to lead to continuation or recurrence of material injury within a reasonably foreseeable time. A schedule for the review will be established and announced at a later date. For further information concerning the conduct of this review and rules of general application, consult the Commission’s Rules of Practice and Procedure, part 201, subparts A through E (19 CFR part 201), and part 207, subparts A, D, E, and F (19 CFR part 207).DATES: Effective date: June 6, 2005.FOR FURTHER INFORMATION CONTACT: Mary Messer (202–205–3193), Office of Investigations, U.S. International Trade Commission, 500 E Street SW., Washington, DC 20436. Hearing-impaired persons can obtain information on this matter by contacting the Commission’s TDD terminal on 202–205–1810. Persons with mobility impairments who will need special assistance in gaining access to the Commission should contact the Office of the Secretary at 202–205–2000. General information concerning the Commission may also be obtained by accessing its Internet server (http://www.usitc.gov). The public record for this review may be viewed on the Commission’s electronic docket (EDIS) at http://edis.usitc.gov.SUPPLEMENTARY INFORMATION: On June 6, 2005, the Commission determined that it should proceed to a full review in the subject five-year review pursuant to section 751(c)(5) of the Act. The Commission found that the domestic interested party group response to its notice of institution (70 FR 9971, March 1, 2005) was adequate 1 and that the
respondent interested party group response was inadequate. The Commission also found that other circumstances warranted conducting a full review.2 A record of the Commissioners’ votes, the Commission’s statement on adequacy, and any individual Commissioner’s statements will be available from the Office of the Secretary and at the Commission’s Web site.
Authority: This review is being conducted under authority of title VII of the Tariff Act of 1930; this notice is published pursuant to section 207.62 of the Commission’s rules.
Issued: June 17, 2005.By order of the Commission
Marilyn R. Abbott, Secretary to the Commission.[FR Doc. 05–12480 Filed 6–23–05; 8:45 am] BILLING CODE 7020–02–M
INTERNATIONAL TRADE COMMISSION
[Investigation No. NAFTA–103–012]
Probable Effect of Certain Modifications to the North American Free Trade Agreement Rules of Origin
AGENCY: United States International Trade Commission.ACTION: Institution of investigation and request for written submissions.
39333Federal Register / Vol. 70, No. 129 / Thursday, July 7, 2005 / Notices
States Postal Service, to the National Register of Historic Places, National Park Service, 1849 C St. NW., 2280, Washington, DC 20240; by all other carriers, National Register of Historic Places, National Park Service,1201 Eye St. NW., 8th floor, Washington, DC 20005; or by fax, (202) 371–6447. Written or faxed comments should be submitted by July 22, 2005.
John W. Roberts, Acting Chief, National Register/National Historic Landmarks Program.
IDAHO
Latah County
Moscow Downtown Historic District, Generally bounded by 1st St., 6th St., Washington St., and the alley bet. Main and Jackson, Moscow, 05000710
MICHIGAN
Marquette County
Vista Theater, 218 Iron St., Megaunee, 05000714
Oakland County
Indian Lake Road Stone Arch Bridge, Indian Lake Rd., E of M24, Orion, 05000712
Sanilac County
Roach, W.R., Cannery Warehouse and Office Building, 89 E. Sanborn, Croswell, 05000717
Washtenaw County
Sutherland, Langford and Lydia McMichael, Farmstead, 797 Textile Rd., Pittsfield Charter Township, 05000711
Wayne County
Alger Theater, 16451 E. Warren Ave., Detroit, 05000719
Detroit—Leland Hotel, 400 Bagley Ave., Detroit, 05000718
General Motors Research Laboratory, 485–495 Milwaukee, Detroit, 05000713
Mellus Newspapers Building, 1661 Fort St., Lincoln Park, 05000716
Woodhouse, John T., House, 33 Old Brook Ln., Grosse Pointe Farms, 05000715
MONTANA
Broadwater County
Toston Bridge, Spanning the Missouri R, on abandoned segment of old U.S. 287, at Toston, Toston, 05000720
NEBRASKA
Adams County
Hastings Municipal Airport Hangar—Building No. 1, 3100 E. Twelfth St., Hastings, 05000722
Douglas County
Dundee—Happy Hollow Historic District, Roughly Hamilton on N. JE George and Happy Hollow on W. Leavemworth on S, 48th on E, Omaha, 05000726
Logan, The, 1804 Dodge, Omaha, 05000721
Fillmore County Ohiowa Public School, (School Buildings in
Nebraska MPS) 202 S. Main St., Ohiowa, 05000725
Howard County Columbia Hall, Jct. of NE 58 and W. Roger
Wetsch Ave., Dannebrog, 05000724
Otoe County Harmony School, School District #53,
(School Buildings in Nebraska MPS) Address Restricted, Nebraska City, 05000723
TENNESSEE
Knox County Candoro Marble Company Showroom and
Garage, 681 Maryville Pike, Knoxville, 05000709
Warren County Martin—Miller Farm, (Historic Family Farms
in Middle Tennessee MPS) 1597 Old Rock Island Rd., Rowland Station, 05000727 A Request for removal has been made for
the following resource:
Iowa
Scott County Heinz, Bonaventura, House (First),
(Davenport MRA), 1128 W. 5th St., Davenport, 84001435
[FR Doc. 05–13308 Filed 7–6–05; 8:45 am] BILLING CODE 4312–51–P
INTERNATIONAL TRADE COMMISSION
[Investigation No. 731–TA–377 (Second Review)]
Internal Combustion Industrial Forklift Trucks From Japan
AGENCY: United States International Trade Commission.ACTION: Scheduling of a full five-year review concerning the antidumping duty order on internal combustion industrial forklift trucks from Japan.
SUMMARY: The Commission hereby gives notice of the scheduling of a full review pursuant to section 751(c)(5) of the Tariff Act of 1930 (19 U.S.C. 1675(c)(5)) (the Act) to determine whether revocation of the antidumping duty order on internal combustion industrial forklift trucks from Japan would be likely to lead to continuation or recurrence of material injury within a reasonably foreseeable time. For further information concerning the conduct of this review and rules of general application, consult the Commission’s Rules of Practice and Procedure, part 201, subparts A through E (19 CFR part 201), and part 207, subparts A, D, E, and F (19 CFR part 207).EFFECTIVE DATE: June 29, 2005.
FOR FURTHER INFORMATION CONTACT: Cynthia Trainor (202–205–3354), Office of Investigations, U.S. International Trade Commission, 500 E Street SW., Washington, DC 20436. Hearing-impaired persons can obtain information on this matter by contacting the Commission’s TDD terminal on 202–205–1810. Persons with mobility impairments who will need special assistance in gaining access to the Commission should contact the Office of the Secretary at 202–205–2000. General information concerning the Commission may also be obtained by accessing its internet server (http://www.usitc.gov). The public record for this review may be viewed on the Commission’s electronic docket (EDIS) at http://edis.usitc.gov.SUPPLEMENTARY INFORMATION:
Background. On June 6, 2005, the Commission determined that responses to its notice of institution of the subject five-year review were such that a full review pursuant to section 751(c)(5) of the Act should proceed (70 F.R. 36657, June 24, 2005). A record of the Commissioner’s votes, the Commission’s statement on adequacy, and any individual Commissioner’s statements are available from the Office of the Secretary and at the Commission’s web site.
Participation in the review and public service list. Persons, including industrial users of the subject merchandise and, if the merchandise is sold at the retail level, representative consumer organizations, wishing to participate in this review as parties must file an entry of appearance with the Secretary to the Commission, as provided in section 201.11 of the Commission’s rules, by 45 days after publication of this notice. A party that filed a notice of appearance following publication of the Commission’s notice of institution of the review need not file an additional notice of appearance. The Secretary will maintain a public service list containing the names and addresses of all persons, or their representatives, who are parties to the review.
Limited disclosure of business proprietary information (BPI) under an administrative protective order (APO) and BPI service list. Pursuant to section 207.7(a) of the Commission’s rules, the Secretary will make BPI gathered in this review available to authorized applicants under the APO issued in the review, provided that the application is made by 45 days after publication of this notice. Authorized applicants must represent interested parties, as defined by 19 U.S.C. 1677(9), who are parties to the review. A party granted access to
VerDate jul<14>2003 19:31 Jul 06, 2005 Jkt 205001 PO 00000 Frm 00101 Fmt 4703 Sfmt 4703 E:\FR\FM\07JYN1.SGM 07JYN1
39334 Federal Register / Vol. 70, No. 129 / Thursday, July 7, 2005 / Notices
1 The record is defined in sec. 207.2(f) of the Commission’s Rules of Practice and Procedure (19 CFR 207.2(f)).
2 Commissioner Daniel R. Pearson made negative determinations with respect to all subject countries.
BPI following publication of the Commission’s notice of institution of the review need not reapply for such access. A separate service list will be maintained by the Secretary for those parties authorized to receive BPI under the APO.
Staff report. The prehearing staff report in the review will be placed in the nonpublic record on October 12, 2005, and a public version will be issued thereafter, pursuant to section 207.64 of the Commission’s rules.
Hearing. The Commission will hold a hearing in connection with the review beginning at 9:30 a.m. on November 1, 2005, at the U.S. International Trade Commission Building. Requests to appear at the hearing should be filed in writing with the Secretary to the Commission on or before October 25, 2005. A nonparty who has testimony that may aid the Commission’s deliberations may request permission to present a short statement at the hearing. All parties and nonparties desiring to appear at the hearing and make oral presentations should attend a prehearing conference to be held at 9:30 a.m. on October 27, 2005, at the U.S. International Trade Commission Building. Oral testimony and written materials to be submitted at the public hearing are governed by sections 201.6(b)(2), 201.13(f), 207.24, and 207.66 of the Commission’s rules. Parties must submit any request to present a portion of their hearing testimony in camera no later than 7 days prior to the date of the hearing.
Written submissions. Each party to the review may submit a prehearing brief to the Commission. Prehearing briefs must conform with the provisions of section 207.65 of the Commission’s rules; the deadline for filing is October 21, 2005. Parties may also file written testimony in connection with their presentation at the hearing, as provided in section 207.24 of the Commission’s rules, and posthearing briefs, which must conform with the provisions of section 207.67 of the Commission’s rules. The deadline for filing posthearing briefs is November 10, 2005; witness testimony must be filed no later than three days before the hearing. In addition, any person who has not entered an appearance as a party to the review may submit a written statement of information pertinent to the subject of the review on or before November 10, 2005. On December 7, 2005, the Commission will make available to parties all information on which they have not had an opportunity to comment. Parties may submit final comments on this information on or before December 9, 2005, but such final comments must not contain new factual
information and must otherwise comply with section 207.68 of the Commission’s rules. All written submissions must conform with the provisions of section 201.8 of the Commission’s rules; any submissions that contain BPI must also conform with the requirements of sections 201.6, 207.3, and 207.7 of the Commission’s rules. The Commission’s rules do not authorize filing of submissions with the Secretary by facsimile or electronic means, except to the extent permitted by section 201.8 of the Commission’s rules, as amended, 67 FR 68036 (November 8, 2002). Even where electronic filing of a document is permitted, certain documents must also be filed in paper form, as specified in II (C) of the Commission’s Handbook on Electronic Filing Procedures, 67 FR 68168, 68173 (November 8, 2002).
Additional written submissions to the Commission, including requests pursuant to section 201.12 of the Commission’s rules, shall not be accepted unless good cause is shown for accepting such submissions, or unless the submission is pursuant to a specific request by a Commissioner or Commission staff.
In accordance with sections 201.16(c) and 207.3 of the Commission’s rules, each document filed by a party to the review must be served on all other parties to the review (as identified by either the public or BPI service list), and a certificate of service must be timely filed. The Secretary will not accept a document for filing without a certificate of service.
Authority: This review is being conducted under authority of title VII of the Tariff Act of 1930; this notice is published pursuant to section 207.62 of the Commission’s rules.
By order of the Commission.Issued: July 1, 2005.
Marilyn R. Abbot, Secretary to the Commission.[FR Doc. 05–13397 Filed 7–6–05; 8:45 am] BILLING CODE 7020–02–M
58373 Federal Register / Vol. 70, No. 193 / Thursday, October 6, 2005 / Notices
PROPOSED FY 2007 ANNUAL MATERIALS PLAN—Continued
Material Unit Quantity Footnote
Notes: 1. Actual quantity will be limited to remaining inventory.
[FR Doc. 05–20044 Filed 10–5–05; 8:45 am] BILLING CODE 3510–33–P
DEPARTMENT OF COMMERCE
International Trade Administration
(A–588–703)
Internal–Combustion Forklift Trucks from Japan; Final Results of the Expedited Sunset Review of the Antidumping Duty Order
AGENCY: Import Administration, International Trade Administration, Department of Commerce. SUMMARY: On March 1, 2005, the Department of Commerce (‘‘the Department’’) initiated a sunset review of the antidumping duty order on internal–combustion forklift trucks from
Japan pursuant to section 751(c) of the Tariff Act of 1930, as amended (‘‘the Act’’). The Department conducted an expedited (120-day) sunset review of this order. As a result of this sunset review, the Department finds that revocation of the antidumping duty order would be likely to lead to continuation or recurrence of dumping. The dumping margins are identified in the Final Results of Review section of this notice.
EFFECTIVE DATE: October 6, 2005.
FOR FURTHER INFORMATION CONTACT: David Layton or David Goldberger, AD/ CVD Operations, Office 1, Import Administration, International Trade Administration, U.S. Department of Commerce, 14th Street & Constitution Avenue, NW, Washington, DC 20230;
telephone: (202) 482–0371 and (202) 482–0182, respectively.
SUPPLEMENTARY INFORMATION:
Background:
On March 1, 2005, the Department published the notice of initiation of the second sunset review of the antidumping duty order covering internal–combustion forklift trucks from Japan pursuant to section 751(c) of the Act. See Initiation of Five-year (Sunset) Reviews, 70 FR 9919 (March 1, 2005). On May 16, 2005, the Department extended the period of time for making its determination by 90 days pursuant to section 751(c)(5)(B) of the Act. See Extension of Time Limits for the Final Results of Sunset Reviews of Antidumping and Countervailing Duty Orders, 70 FR 25808 (May 16, 2005).
VerDate Aug<31>2005 19:52 Oct 05, 2005 Jkt 208001 PO 00000 Frm 00004 Fmt 4703 Sfmt 4703 E:\FR\FM\06OCN1.SGM 06OCN1

58374 Federal Register / Vol. 70, No. 193 / Thursday, October 6, 2005 / Notices
The Department received the Notice of Intent to Participate from NACCO Materials Handling Group, Inc. (NMHG), a domestic interested party, within the deadline specified in section 351.218(d)(1)(i) of the Department’s regulations (Sunset Regulations). NMHG claimed interested party status under section 771(9)(C) of the Act, as a manufacturer of the domestic like product in the United States.
We received complete substantive responses from NMHG within the 30- day deadline specified in 19 CFR 351.218(d)(3)(i). We received no responses from the respondent interested parties. As a result, pursuant to section 751(c)(3)(B) of the Act and 19 CFR 351.218(e)(1)(ii)(C)(2), the Department conducted an expedited (120-day) sunset review of this order.
Scope of the Order The products covered by this order
are certain internal–combustion, industrial forklift trucks, with lifting capacity of 2,000 to 15,000 lbs. Imports of these products were classified under item numbers 692.4025, 692.4030, and 692.4070 of the Tariff Schedules of the United States Annotated (TSUSA) and are currently classifiable under Harmonized System (HTSUS) item numbers 8427.20.00, 8427.90.00, and 8431.20.00. Although the HTSUS item numbers are provided for convenience and customs purposes, the written description remains dispositive.
The products covered by this order are further described as follows: Assembled, not assembled, and less than complete, finished and not finished, operator–riding forklift trucks powered by gasoline, propane, or diesel fuel internal–combustion engines of off– the-highway types used in factories, warehouses, or transportation terminals for short–distance transport, towing, or handling of articles. Less than complete forklift trucks are defined as imports which include a frame by itself or a frame assembled with one or more component parts. Component parts of the subject forklift trucks which are not assembled with a frame are not covered by this order.
Products not covered by this order are genuinely used forklifts. For the purposes of this antidumping duty order, we consider any forklift to be used if, at the time of entry into the United States, the importer can demonstrate to the satisfaction of the U.S. Customs and Border Protection (CBP) that the forklift was manufactured in a calendar year at least three years prior to the year of entry into the United States. The importer must show documentation from industrial
publications that reconcile the serial number and year of manufacture of the forklift. If the calendar year of manufacture is at least three years prior to its year of entry into the United States, it will not be subject to the suspension of liquidation or any assessment of antidumping duties. For example, if a forklift is entered or withdrawn from warehouse, for consumption in June 1988 and if the importer demonstrates through industrial publications that the forklift was manufactured in or before calendar year 1985, that forklift will not be covered by this order.
Analysis of Comments Received All issues raised in this review are
addressed in the Issues and Decision Memorandum for the Expedited Sunset Review of the Antidumping Duty Order on Internal–Combustion Forklift Trucks from Japan Final Results (Decision Memo) from Barbara E. Tillman, Acting Deputy Assistant Secretary for Import Administration, to Holly A. Kuga, Acting Assistant Secretary for Import Administration, dated September 27, 2005, which is hereby adopted by this notice. The issues discussed in the Decision Memo include the likelihood of continuation or recurrence of dumping and the magnitude of the margins likely to prevail if the order were to be revoked. Parties can find a complete discussion of all issues raised in these reviews and the corresponding recommendations in this public memorandum which is on file in room B–099 of the main Commerce building.
In addition, a complete version of the Decision Memo can be accessed directly on the Web at http://ia.ita.doc.gov/frn. The paper copy and electronic version of the Decision Memo are identical in content.
Final Results of Review We determine that revocation of the
antidumping duty order on internal– combustion forklift trucks from Japan would be likely to lead to continuation or recurrence of dumping at the following weighted–average percentage margins:
Manufacturers/Exporters/Pro-ducers
Weighted Average Margin
(percent)
Toyota Motor Corp ..................... 47.79 Nissan Motor Co., Ltd ................ 51.33 Komatsu Forklift Co., Ltd ............ 47.50 Sumitomo–Yale Co., Ltd ............ 51.33 Toyo Umpanki Co., Ltd .............. 51.33 Sanki Industrial Co., Ltd ............. 13.65 Kasagi Forklift, Inc ...................... 56.81 All Others .................................... 39.45
This notice also serves as the only reminder to parties subject to administrative protective orders (‘‘APO’’) of their responsibility concerning the return or destruction of proprietary information disclosed under APO in accordance with 19 CFR 351.305 of the Department’s regulations. Timely notification of the return or destruction of APO materials or conversion to judicial protective orders is hereby requested. Failure to comply with the regulations and terms of an APO is a violation which is subject to sanction.
We are issuing and publishing the results and notice in accordance with sections 751(c), 752, and 777(i)(1) of the Act.
Dated: September 27, 2005. Holly A. Kuga, Acting Assistant Secretary for Import Administration. [FR Doc. E5–5517 Filed 10–5–05; 8:45 am] BILLING CODE 3510–DS–S
DEPARTMENT OF COMMERCE
International Trade Administration
[A–533–843, A–560–818 and A–570–901]
Initiation of Antidumping Duty Investigations: Certain Lined Paper Products From India, Indonesia, and the People’s Republic of China
AGENCY: Import Administration, International Trade Administration, Department of Commerce. DATES: Effective October 6, 2005. FOR FURTHER INFORMATION CONTACT: Christopher Hargett (India), Brandon Farlander (Indonesia), or Charles Riggle (People’s Republic of China), AD/CVD Operations, Import Administration, International Trade Administration, U.S. Department of Commerce, 14th Street and Constitution Avenue, NW., Washington, DC 20230; telephone: (202) 482–4161, (202) 482–0182 and (202) 482–0650, respectively.
Initiation of Investigations
The Petitions On September 9, 2005, the
Department of Commerce (‘‘the Department’’) received Petitions (‘‘the Petitions’’) concerning imports of certain lined paper products (‘‘CLPP’’) from India, Indonesia, and the People’s Republic of China (‘‘PRC’’) filed in proper form by the Association of American School Paper Suppliers and its individual members (MeadWestvaco Corporation; Norcom, Inc.; and Top Flight, Inc.) (‘‘Petitioner’’) on behalf of the domestic industry and workers
VerDate Aug<31>2005 19:52 Oct 05, 2005 Jkt 208001 PO 00000 Frm 00005 Fmt 4703 Sfmt 4703 E:\FR\FM\06OCN1.SGM 06OCN1

1 Chairman Koplan voted to conduct an expedited review, based on the inadequaterespondent interested party group responses. Chairman Koplan joins only the second and thirdparagraphs of this statement.
2 Vice Chairman Okun determined that the domestic interested party group response wasinadequate. In the first five-year review, Vice Chairman Okun defined the domestic industry toinclude more firms than the Commission majority because she determined that appropriatecircumstances did not exist to exclude any firm producing the domestic like product from thedomestic industry as a related party. See USITC Pub. 3287 at 23-24. Based on NAACO’s shareof U.S. production of the domestic like product during the first review, Vice Chairman Okundetermined that NAACO’s response in this second review did not constitute an adequatedomestic industry party group response. Vice Chairman Okun joins this statement in its entiretyexcept for the last sentence in the second paragraph.
EXPLANATION OF COMMISSION DETERMINATION ON ADEQUACYin
Internal Combustion Industrial Forklift Trucks From Japan,Inv. No. 731-TA-377 (Second Review)
On June 6, 2005, the Commission determined that it should proceed to a full review inthe subject five-year review pursuant to section 751(c)(5) of the Tariff Act of 1930, as amended,19 U.S.C. § 1675(c)(5).1
After issuing the notice of institution, the Commission received a single response filed bydomestic producer, NAACO Materials Handling Group, Inc. (“NAACO”). The Commissiondetermined that NAACO’s response was individually adequate. Based upon NAACO’srepresentation that it accounted for a substantial percentage of U.S. production of the domesticlike product, the Commission determined that NAACO’s response constituted an adequatedomestic interested party group response.2
The Commission did not receive a response from any respondent interested party. Consequently, the Commission determined that the respondent interested party group responsewas inadequate.
The Commission further determined that circumstances warranted conducting a fullreview, including possible changes in the domestic industry’s production levels since the firstreview and the involvement of U.S. subsidiaries or joint ventures of Japanese producers in theproduction of the domestic like product.
Therefore, the Commission did not exercise its discretion to conduct an expedited review,but instead determined to conduct a full review. A record of the Commission’s votes is availablefrom the Office of the Secretary and the Commission’s web site (http://www.usitc.gov).

B-1
APPENDIX B
CALENDAR OF THE PUBLIC HEARING


B-3
CALENDAR OF PUBLIC HEARING
Those listed below appeared as witnesses at the United States International TradeCommission’s hearing:
Subject: Internal Combustion Industrial Forklift Trucks from Japan
Inv. No.: 731-TA-377 (Second Review)
Date and Time: November 1, 2005 - 9:30 a.m.
Sessions were held in connection with this review in the Main Hearing Room (room 101),500 E Street, SW, Washington, D.C.
OPENING REMARKS:
In Support of Continuation of Orders (Paul C. Rosenthal,Collier Shannon Scott, PLLC)
In Support of the Continuation of the Antidumping Duty Order:
Collier Shannon Scott, PLLCWashington, D.C.on behalf of
NACCO Materials Handling Group, Inc.
Reginald R. Eklund, President and Chief ExecutiveOfficer, NACCO Materials Handling Group, Inc.
Colin Wilson, Chief Operating Officer, NACCOMaterials Handling Group, Inc.
Gregory J. Dawe, Vice President, Manufacturing,NACCO Materials Handling Group, Inc.
B-4
In Support of the Continuation of the Antidumping Duty Order (continued):
Jon C. Taylor, Director, Corporate Strategy andPlanning, NACCO Materials Handling Group, Inc.
Brad Hudgens, Economist, Georgetown EconomicServices, LLC
Paul C. Rosenthal )Mary T. Staley ) – OF COUNSELGrace W. Kim )
CLOSING REMARKS:
In Support of Continuation of Orders (Paul C. Rosenthal,Collier Shannon Scott, PLLC)
C-1
APPENDIX C
SUMMARY DATA

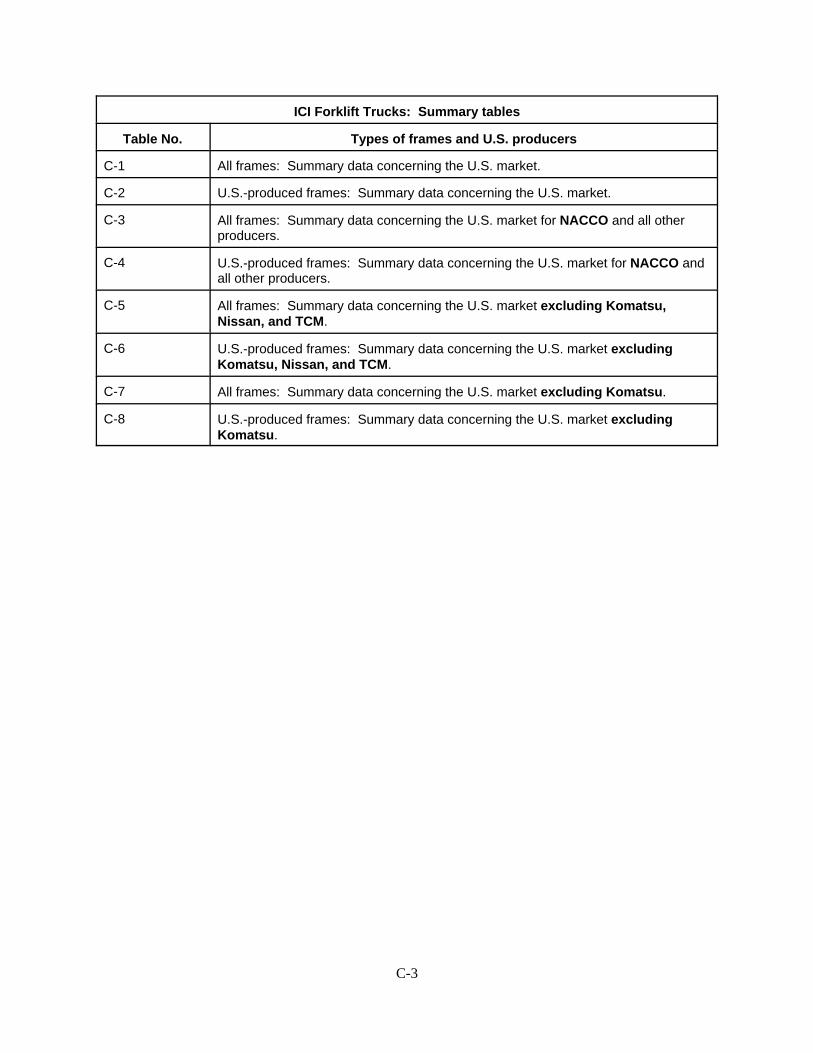
C-3
ICI Forklift Trucks: Summary tables
Table No. Types of frames and U.S. producers
C-1 All frames: Summary data concerning the U.S. market.
C-2 U.S.-produced frames: Summary data concerning the U.S. market.
C-3 All frames: Summary data concerning the U.S. market for NACCO and all otherproducers.
C-4 U.S.-produced frames: Summary data concerning the U.S. market for NACCO andall other producers.
C-5 All frames: Summary data concerning the U.S. market excluding Komatsu,Nissan, and TCM.
C-6 U.S.-produced frames: Summary data concerning the U.S. market excludingKomatsu, Nissan, and TCM.
C-7 All frames: Summary data concerning the U.S. market excluding Komatsu.
C-8 U.S.-produced frames: Summary data concerning the U.S. market excludingKomatsu.


Table C-1ICI forklift trucks (all frames): Summary data concerning the U.S. market, 1999-2004, January-June 2004, and January-June 2005
(Quantity=number of trucks, value=1,000 dollars, unit values, unit labor costs, and unit expenses are per truck; period changes=percent, except where noted)Reported data Period changes
January-June Jan.-JuneItem 1999 2000 2001 2002 2003 2004 2004 2005 1999-04 1999-00 2000-01 2001-02 2002-03 2003-04 2004-05
U.S. consumption quantity: Amount . . . . . . . . . . . . . . . . . . . *** *** *** *** *** *** *** *** *** *** *** *** *** *** *** Producers' share (1) . . . . . . . . . *** *** *** *** *** *** *** *** *** *** *** *** *** *** *** Importers' share (1): Japan . . . . . . . . . . . . . . . . . . . . *** *** *** *** *** *** *** *** *** *** *** *** *** *** *** All other sources . . . . . . . . . . . *** *** *** *** *** *** *** *** *** *** *** *** *** *** *** Total imports . . . . . . . . . . . . . *** *** *** *** *** *** *** *** *** *** *** *** *** *** ***
U.S. consumption value: Amount . . . . . . . . . . . . . . . . . . . *** *** *** *** *** *** *** *** *** *** *** *** *** *** *** Producers' share (1) . . . . . . . . . *** *** *** *** *** *** *** *** *** *** *** *** *** *** *** Importers' share (1): Japan . . . . . . . . . . . . . . . . . . . . *** *** *** *** *** *** *** *** *** *** *** *** *** *** *** All other sources . . . . . . . . . . . *** *** *** *** *** *** *** *** *** *** *** *** *** *** *** Total imports . . . . . . . . . . . . . *** *** *** *** *** *** *** *** *** *** *** *** *** *** ***
U.S. shipments of imports from: Japan: Quantity . . . . . . . . . . . . . . . . . . *** *** 0 0 0 0 0 0 *** *** *** (3) (3) (3) (3) Value . . . . . . . . . . . . . . . . . . . . *** *** 0 0 0 0 0 0 *** *** *** (3) (3) (3) (3) Unit value . . . . . . . . . . . . . . . . . *** *** (3) (3) (3) (3) (3) (3) *** *** *** (3) (3) (3) (3) Ending inventory quantity . . . . . 0 0 0 0 0 0 0 0 (3) (3) (3) (3) (3) (3) (3) All other sources: Quantity . . . . . . . . . . . . . . . . . . *** *** 10,388 8,899 11,818 14,699 7,010 8,042 *** *** *** -14.3 32.8 24.4 14.7 Value . . . . . . . . . . . . . . . . . . . . *** *** 208,453 183,674 241,199 308,419 143,592 175,251 *** *** *** -11.9 31.3 27.9 22.0 Unit value . . . . . . . . . . . . . . . . . *** *** $20,067 $20,640 $20,409 $20,982 $20,484 $21,792 *** *** *** 2.9 -1.1 2.8 6.4 Ending inventory quantity . . . . . 2,524 2,083 2,811 1,901 1,890 2,287 2,206 2,266 -9.4 -17.5 34.9 -32.4 -0.6 21.0 2.7 All sources: Quantity . . . . . . . . . . . . . . . . . . 12,027 13,969 10,388 8,899 11,818 14,699 7,010 8,042 22.2 16.1 -25.6 -14.3 32.8 24.4 14.7 Value . . . . . . . . . . . . . . . . . . . . 231,829 267,608 208,453 183,674 241,199 308,419 143,592 175,251 33.0 15.4 -22.1 -11.9 31.3 27.9 22.0 Unit value . . . . . . . . . . . . . . . . . $19,276 $19,157 $20,067 $20,640 $20,409 $20,982 $20,484 $21,792 8.9 -0.6 4.7 2.9 -1.1 2.8 6.4 Ending inventory quantity . . . . . 2,524 2,083 2,811 1,901 1,890 2,287 2,206 2,266 -9.4 -17.5 34.9 -32.4 -0.6 21.0 2.7
U.S. producers': Average capacity quantity . . . . . *** *** *** *** *** *** *** *** *** *** *** *** *** *** *** Production quantity . . . . . . . . . . *** *** *** *** *** *** *** *** *** *** *** *** *** *** *** Capacity utilization (1) . . . . . . . . *** *** *** *** *** *** *** *** *** *** *** *** *** *** *** U.S. shipments: Quantity . . . . . . . . . . . . . . . . . . *** *** *** *** *** *** *** *** *** *** *** *** *** *** *** Value . . . . . . . . . . . . . . . . . . . . *** *** *** *** *** *** *** *** *** *** *** *** *** *** *** Unit value . . . . . . . . . . . . . . . . . *** *** *** *** *** *** *** *** *** *** *** *** *** *** *** Export shipments: Quantity . . . . . . . . . . . . . . . . . . *** *** *** *** *** *** *** *** *** *** *** *** *** *** *** Value . . . . . . . . . . . . . . . . . . . . *** *** *** *** *** *** *** *** *** *** *** *** *** *** *** Unit value . . . . . . . . . . . . . . . . . *** *** *** *** *** *** *** *** *** *** *** *** *** *** *** Ending inventory quantity . . . . . . *** *** *** *** *** *** *** *** *** *** *** *** *** *** *** Inventories/total shipments (1) . . *** *** *** *** *** *** *** *** *** *** *** *** *** *** *** Production workers . . . . . . . . . . *** *** *** *** *** *** *** *** *** *** *** *** *** *** *** Hours worked (1,000s) . . . . . . . *** *** *** *** *** *** *** *** *** *** *** *** *** *** *** Wages paid ($1,000s) . . . . . . . . *** *** *** *** *** *** *** *** *** *** *** *** *** *** *** Hourly wages . . . . . . . . . . . . . . . *** *** *** *** *** *** *** *** *** *** *** *** *** *** *** Productivity (units/1,000 hours) . *** *** *** *** *** *** *** *** *** *** *** *** *** *** *** Unit labor costs . . . . . . . . . . . . . *** *** *** *** *** *** *** *** *** *** *** *** *** *** *** Net sales (4): Quantity . . . . . . . . . . . . . . . . . . *** *** *** *** *** *** *** *** *** *** *** *** *** *** *** Value . . . . . . . . . . . . . . . . . . . . *** *** *** *** *** *** *** *** *** *** *** *** *** *** *** Unit value . . . . . . . . . . . . . . . . . *** *** *** *** *** *** *** *** *** *** *** *** *** *** *** Cost of goods sold (COGS) . . . . *** *** *** *** *** *** *** *** *** *** *** *** *** *** *** Gross profit or (loss) . . . . . . . . . *** *** *** *** *** *** *** *** *** *** *** *** *** *** *** SG&A expenses . . . . . . . . . . . . *** *** *** *** *** *** *** *** *** *** *** *** *** *** *** Operating income or (loss) . . . . *** *** *** *** *** *** *** *** *** *** *** *** *** *** *** Capital expenditures . . . . . . . . . *** *** *** *** *** *** *** *** *** *** *** *** *** *** *** Unit COGS . . . . . . . . . . . . . . . . . *** *** *** *** *** *** *** *** *** *** *** *** *** *** *** Unit SG&A expenses . . . . . . . . . *** *** *** *** *** *** *** *** *** *** *** *** *** *** *** Unit operating income or (loss) . *** *** *** *** *** *** *** *** *** *** *** *** *** *** *** COGS/sales (1) . . . . . . . . . . . . . *** *** *** *** *** *** *** *** *** *** *** *** *** *** *** Operating income or (loss)/ sales (1) . . . . . . . . . . . . . . . . . . *** *** *** *** *** *** *** *** *** *** *** *** *** *** ***
(1) "Reported data" are in percent and "period changes" are in percentage points. (2) Less than 0.05 percent. (3) Not applicable. (4) Non-lease operations.
Note.--Financial data are reported on a fiscal year basis and may not necessarily be comparable to data reported on a calendar year basis. Because of rounding, figures may not add to the totals shown.Unit values and shares are calculated from the unrounded figures.
Source: Compiled from data submitted in response to Commission questionnaires.
C-5
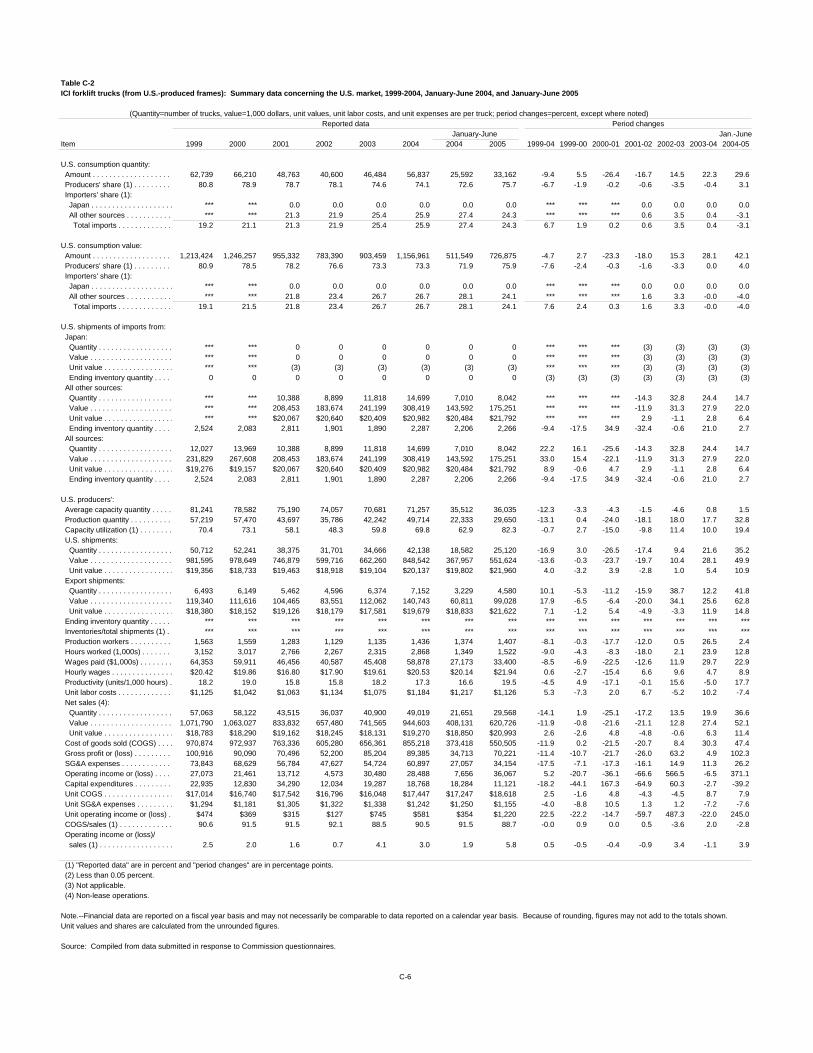
Table C-2ICI forklift trucks (from U.S.-produced frames): Summary data concerning the U.S. market, 1999-2004, January-June 2004, and January-June 2005
(Quantity=number of trucks, value=1,000 dollars, unit values, unit labor costs, and unit expenses are per truck; period changes=percent, except where noted)Reported data Period changes
January-June Jan.-JuneItem 1999 2000 2001 2002 2003 2004 2004 2005 1999-04 1999-00 2000-01 2001-02 2002-03 2003-04 2004-05
U.S. consumption quantity: Amount . . . . . . . . . . . . . . . . . . . 62,739 66,210 48,763 40,600 46,484 56,837 25,592 33,162 -9.4 5.5 -26.4 -16.7 14.5 22.3 29.6 Producers' share (1) . . . . . . . . . 80.8 78.9 78.7 78.1 74.6 74.1 72.6 75.7 -6.7 -1.9 -0.2 -0.6 -3.5 -0.4 3.1 Importers' share (1): Japan . . . . . . . . . . . . . . . . . . . . *** *** 0.0 0.0 0.0 0.0 0.0 0.0 *** *** *** 0.0 0.0 0.0 0.0 All other sources . . . . . . . . . . . *** *** 21.3 21.9 25.4 25.9 27.4 24.3 *** *** *** 0.6 3.5 0.4 -3.1 Total imports . . . . . . . . . . . . . 19.2 21.1 21.3 21.9 25.4 25.9 27.4 24.3 6.7 1.9 0.2 0.6 3.5 0.4 -3.1
U.S. consumption value: Amount . . . . . . . . . . . . . . . . . . . 1,213,424 1,246,257 955,332 783,390 903,459 1,156,961 511,549 726,875 -4.7 2.7 -23.3 -18.0 15.3 28.1 42.1 Producers' share (1) . . . . . . . . . 80.9 78.5 78.2 76.6 73.3 73.3 71.9 75.9 -7.6 -2.4 -0.3 -1.6 -3.3 0.0 4.0 Importers' share (1): Japan . . . . . . . . . . . . . . . . . . . . *** *** 0.0 0.0 0.0 0.0 0.0 0.0 *** *** *** 0.0 0.0 0.0 0.0 All other sources . . . . . . . . . . . *** *** 21.8 23.4 26.7 26.7 28.1 24.1 *** *** *** 1.6 3.3 -0.0 -4.0 Total imports . . . . . . . . . . . . . 19.1 21.5 21.8 23.4 26.7 26.7 28.1 24.1 7.6 2.4 0.3 1.6 3.3 -0.0 -4.0
U.S. shipments of imports from: Japan: Quantity . . . . . . . . . . . . . . . . . . *** *** 0 0 0 0 0 0 *** *** *** (3) (3) (3) (3) Value . . . . . . . . . . . . . . . . . . . . *** *** 0 0 0 0 0 0 *** *** *** (3) (3) (3) (3) Unit value . . . . . . . . . . . . . . . . . *** *** (3) (3) (3) (3) (3) (3) *** *** *** (3) (3) (3) (3) Ending inventory quantity . . . . . 0 0 0 0 0 0 0 0 (3) (3) (3) (3) (3) (3) (3) All other sources: Quantity . . . . . . . . . . . . . . . . . . *** *** 10,388 8,899 11,818 14,699 7,010 8,042 *** *** *** -14.3 32.8 24.4 14.7 Value . . . . . . . . . . . . . . . . . . . . *** *** 208,453 183,674 241,199 308,419 143,592 175,251 *** *** *** -11.9 31.3 27.9 22.0 Unit value . . . . . . . . . . . . . . . . . *** *** $20,067 $20,640 $20,409 $20,982 $20,484 $21,792 *** *** *** 2.9 -1.1 2.8 6.4 Ending inventory quantity . . . . . 2,524 2,083 2,811 1,901 1,890 2,287 2,206 2,266 -9.4 -17.5 34.9 -32.4 -0.6 21.0 2.7 All sources: Quantity . . . . . . . . . . . . . . . . . . 12,027 13,969 10,388 8,899 11,818 14,699 7,010 8,042 22.2 16.1 -25.6 -14.3 32.8 24.4 14.7 Value . . . . . . . . . . . . . . . . . . . . 231,829 267,608 208,453 183,674 241,199 308,419 143,592 175,251 33.0 15.4 -22.1 -11.9 31.3 27.9 22.0 Unit value . . . . . . . . . . . . . . . . . $19,276 $19,157 $20,067 $20,640 $20,409 $20,982 $20,484 $21,792 8.9 -0.6 4.7 2.9 -1.1 2.8 6.4 Ending inventory quantity . . . . . 2,524 2,083 2,811 1,901 1,890 2,287 2,206 2,266 -9.4 -17.5 34.9 -32.4 -0.6 21.0 2.7
U.S. producers': Average capacity quantity . . . . . 81,241 78,582 75,190 74,057 70,681 71,257 35,512 36,035 -12.3 -3.3 -4.3 -1.5 -4.6 0.8 1.5 Production quantity . . . . . . . . . . 57,219 57,470 43,697 35,786 42,242 49,714 22,333 29,650 -13.1 0.4 -24.0 -18.1 18.0 17.7 32.8 Capacity utilization (1) . . . . . . . . 70.4 73.1 58.1 48.3 59.8 69.8 62.9 82.3 -0.7 2.7 -15.0 -9.8 11.4 10.0 19.4 U.S. shipments: Quantity . . . . . . . . . . . . . . . . . . 50,712 52,241 38,375 31,701 34,666 42,138 18,582 25,120 -16.9 3.0 -26.5 -17.4 9.4 21.6 35.2 Value . . . . . . . . . . . . . . . . . . . . 981,595 978,649 746,879 599,716 662,260 848,542 367,957 551,624 -13.6 -0.3 -23.7 -19.7 10.4 28.1 49.9 Unit value . . . . . . . . . . . . . . . . . $19,356 $18,733 $19,463 $18,918 $19,104 $20,137 $19,802 $21,960 4.0 -3.2 3.9 -2.8 1.0 5.4 10.9 Export shipments: Quantity . . . . . . . . . . . . . . . . . . 6,493 6,149 5,462 4,596 6,374 7,152 3,229 4,580 10.1 -5.3 -11.2 -15.9 38.7 12.2 41.8 Value . . . . . . . . . . . . . . . . . . . . 119,340 111,616 104,465 83,551 112,062 140,743 60,811 99,028 17.9 -6.5 -6.4 -20.0 34.1 25.6 62.8 Unit value . . . . . . . . . . . . . . . . . $18,380 $18,152 $19,126 $18,179 $17,581 $19,679 $18,833 $21,622 7.1 -1.2 5.4 -4.9 -3.3 11.9 14.8 Ending inventory quantity . . . . . . *** *** *** *** *** *** *** *** *** *** *** *** *** *** *** Inventories/total shipments (1) . . *** *** *** *** *** *** *** *** *** *** *** *** *** *** *** Production workers . . . . . . . . . . 1,563 1,559 1,283 1,129 1,135 1,436 1,374 1,407 -8.1 -0.3 -17.7 -12.0 0.5 26.5 2.4 Hours worked (1,000s) . . . . . . . 3,152 3,017 2,766 2,267 2,315 2,868 1,349 1,522 -9.0 -4.3 -8.3 -18.0 2.1 23.9 12.8 Wages paid ($1,000s) . . . . . . . . 64,353 59,911 46,456 40,587 45,408 58,878 27,173 33,400 -8.5 -6.9 -22.5 -12.6 11.9 29.7 22.9 Hourly wages . . . . . . . . . . . . . . . $20.42 $19.86 $16.80 $17.90 $19.61 $20.53 $20.14 $21.94 0.6 -2.7 -15.4 6.6 9.6 4.7 8.9 Productivity (units/1,000 hours) . 18.2 19.0 15.8 15.8 18.2 17.3 16.6 19.5 -4.5 4.9 -17.1 -0.1 15.6 -5.0 17.7 Unit labor costs . . . . . . . . . . . . . $1,125 $1,042 $1,063 $1,134 $1,075 $1,184 $1,217 $1,126 5.3 -7.3 2.0 6.7 -5.2 10.2 -7.4 Net sales (4): Quantity . . . . . . . . . . . . . . . . . . 57,063 58,122 43,515 36,037 40,900 49,019 21,651 29,568 -14.1 1.9 -25.1 -17.2 13.5 19.9 36.6 Value . . . . . . . . . . . . . . . . . . . . 1,071,790 1,063,027 833,832 657,480 741,565 944,603 408,131 620,726 -11.9 -0.8 -21.6 -21.1 12.8 27.4 52.1 Unit value . . . . . . . . . . . . . . . . . $18,783 $18,290 $19,162 $18,245 $18,131 $19,270 $18,850 $20,993 2.6 -2.6 4.8 -4.8 -0.6 6.3 11.4 Cost of goods sold (COGS) . . . . 970,874 972,937 763,336 605,280 656,361 855,218 373,418 550,505 -11.9 0.2 -21.5 -20.7 8.4 30.3 47.4 Gross profit or (loss) . . . . . . . . . 100,916 90,090 70,496 52,200 85,204 89,385 34,713 70,221 -11.4 -10.7 -21.7 -26.0 63.2 4.9 102.3 SG&A expenses . . . . . . . . . . . . 73,843 68,629 56,784 47,627 54,724 60,897 27,057 34,154 -17.5 -7.1 -17.3 -16.1 14.9 11.3 26.2 Operating income or (loss) . . . . 27,073 21,461 13,712 4,573 30,480 28,488 7,656 36,067 5.2 -20.7 -36.1 -66.6 566.5 -6.5 371.1 Capital expenditures . . . . . . . . . 22,935 12,830 34,290 12,034 19,287 18,768 18,284 11,121 -18.2 -44.1 167.3 -64.9 60.3 -2.7 -39.2 Unit COGS . . . . . . . . . . . . . . . . . $17,014 $16,740 $17,542 $16,796 $16,048 $17,447 $17,247 $18,618 2.5 -1.6 4.8 -4.3 -4.5 8.7 7.9 Unit SG&A expenses . . . . . . . . . $1,294 $1,181 $1,305 $1,322 $1,338 $1,242 $1,250 $1,155 -4.0 -8.8 10.5 1.3 1.2 -7.2 -7.6 Unit operating income or (loss) . $474 $369 $315 $127 $745 $581 $354 $1,220 22.5 -22.2 -14.7 -59.7 487.3 -22.0 245.0 COGS/sales (1) . . . . . . . . . . . . . 90.6 91.5 91.5 92.1 88.5 90.5 91.5 88.7 -0.0 0.9 0.0 0.5 -3.6 2.0 -2.8 Operating income or (loss)/ sales (1) . . . . . . . . . . . . . . . . . . 2.5 2.0 1.6 0.7 4.1 3.0 1.9 5.8 0.5 -0.5 -0.4 -0.9 3.4 -1.1 3.9
(1) "Reported data" are in percent and "period changes" are in percentage points. (2) Less than 0.05 percent. (3) Not applicable. (4) Non-lease operations.
Note.--Financial data are reported on a fiscal year basis and may not necessarily be comparable to data reported on a calendar year basis. Because of rounding, figures may not add to the totals shown.Unit values and shares are calculated from the unrounded figures.
Source: Compiled from data submitted in response to Commission questionnaires.
C-6

C-7
Table C-3ICI forklift trucks (all frames): Summary data concerning the U.S. market for NACCO, all otherproducers, and U.S. importers, 1999-2004, January-June 2004, and January-June 2005
* * * * * * *
Table C-4ICI forklift trucks (from U.S.-produced frames): Summary data concerning the U.S. market forNACCO, all other producers, and U.S. importers, 1999-2004, January-June 2004, and January-June 2005
* * * * * * *
Table C-5ICI forklift trucks (all frames): Summary data concerning the U.S. market excluding Komatsu,Nissan, and TCM, 1999-2004, January-June 2004, and January-June 2005
* * * * * * *
Table C-6ICI forklift trucks (from U.S.-produced frames): Summary data concerning the U.S. marketexcluding Komatsu, Nissan, and TCM, 1999-2004, January-June 2004, and January-June 2005
* * * * * * *
Table C-7ICI forklift trucks (all frames): Summary data concerning the U.S. market excluding Komatsu, 1999-2004, January-June 2004, and January-June 2005
* * * * * * *
Table C-8ICI forklift trucks (U.S.-produced frames): Summary data concerning the U.S. market excludingKomatsu, 1999-2004, January-June 2004, and January-June 2005
* * * * * * *


D-1
APPENDIX D
U.S. PRODUCERS’, U.S. IMPORTERS’, U.S. PURCHASERS’, AND FOREIGNPRODUCERS’ COMMENTS REGARDING THE EFFECTS OF THE ORDER
AND THE LIKELY EFFECTS OF REVOCATION


D-3
U.S. PRODUCERS’ COMMENTS REGARDING THE EFFECTS OF THE ORDER AND THELIKELY EFFECTS OF REVOCATION
U.S. producers were asked whether they anticipated any changes in the character of theiroperations or organization relating to the production of ICI forklift trucks in the future if the antidumpingduty order on ICI forklift trucks from Japan were to be revoked. Their responses were as follows:
NACCO Material Handling Group, Inc.
***
TCM Manufacturing U.S.A., Inc.
***
Nissan Forklift Corp. North America
***
Komatsu Forklift USA, Inc.
***
Mitsubishi Caterpillar Forklift America, Inc.
***
Toyota Industrial Equipment Manufacturing, Inc.
***
U.S. producers were asked whether they anticipated any changes in their production capacity,production, U.S. shipments, purchases, employment, revenues, costs, profits, cash flow, capitalexpenditures, research and development expenditures, or asset values relating to the production of ICI forklift trucks in the future if the antidumping duty order were to be revoked. Their responses were asfollows:
NACCO Material Handling Group, Inc.
***
***
TCM Manufacturing U.S.A., Inc.
***

D-4
Nissan Forklift Corp. North America
***
Komatsu Forklift USA, Inc.
***
Mitsubishi Caterpillar Forklift America, Inc.
***
Toyota Industrial Equipment Manufacturing, Inc.
***
U.S. producers were asked to describe the significance of the existing antidumping duty order covering ICI forklift trucks from Japan in terms of its effects on their production capacity, production,U.S. shipments, inventories, purchases, employment, revenues, costs, profits, cash flow, capitalexpenditures, research and development expenditures, and asset values. Their responses were as follows:
NACCO Material Handling Group, Inc.
***
TCM Manufacturing U.S.A., Inc.
***
Nissan Forklift Corp. North America
***
Komatsu Forklift USA, Inc.
***
Mitsubishi Caterpillar Forklift America, Inc.
***
Toyota Industrial Equipment Manufacturing, Inc.
***

D-5
U.S. IMPORTERS’ COMMENTS REGARDING THE EFFECTS OF THE ORDER AND THELIKELY EFFECTS OF REVOCATION
U.S. importers were asked whether they anticipated any changes in the character of theiroperations or organization relating to the importation of ICI forklift trucks in the future if the antidumpingduty order were to be revoked. Their responses were as follows:
***
“See our producers questionnaire at Question II-23"
***
“No.”
***
“No.”
***
“Yes. Would allow us to import used equipment less than 3 years old.”
***
***
***
“No.”
***
“No.”
***
“No.”
U.S. importers were asked whether they anticipated any changes in their imports, U.S. shipmentsof imports, or inventories of ICI forklift trucks in the future if the antidumping duty order were to berevoked. Their responses were as follows:
***
“See our producers questionnaire at Question II-22.”

D-6
***
“No.”
***
“No.”
***
“No. + Yes. Really Yes and No: It would only allow us to add units less than 3 years old to our importingactivity of used forklifts from Japan.”
***
“No.”
***
“No.”
***
“No.”
***
“No.”
U.S. importers were asked to describe the significance of the existing antidumping duty ordercovering ICI forklift trucks from Japan in terms of its effects on their imports, U.S. shipments of imports,and inventories. Their responses were as follows: ***
“See our producers questionnaire at Question II-22.”
***
“None. The Japanese firms have established assembly operations in the United States.”
***
No answer.
***
“We only purchase used forklifts from Japan. Once the order was imposed, it restricted us to importingunits that are 3 years old or older.”

D-7
***
“We did not import prior to anti-dumping suit, therefore cannot compare.”
***
“*** is not a significant competitor in the ICI market in the US. However, the importation of lessexpensive ICI trucks from Japan would create further competition for our electric forklift products.”
***
“No significance at all.”
***
“No significance.”
U.S. PURCHASERS’ COMMENTS REGARDING THE EFFECTS OF THE ORDER AND THELIKELY EFFECTS OF REVOCATION
Purchasers were asked what the likely effects of revocation of the antidumping duty order forimports of ICI forklift trucks from Japan would be and to discuss any potential effects of revocation of theantidumping duty order on (1) the future activities of the firm and (2) the U.S. markets as a whole, notingthe future time period to which the firm is referring. Their responses were as follows:
***
Activities of your firm:
“No effect - forklift produced in U.S.”
Entire U.S. market:
“Very little effect. Most major forklift manufacturers - manufacture in the US today.”
***
Activities of your firm:
“As a distributor we will continue to purchase from our primary vendor.”
Entire U.S. market:
“Unless there is some substantial cost savings not presently apparent, the manufacturing rationalizationthat has gone on since 1999, with worldwide component sourcing by all manufacturers, revocation shouldnot have a significant pricing impact.”
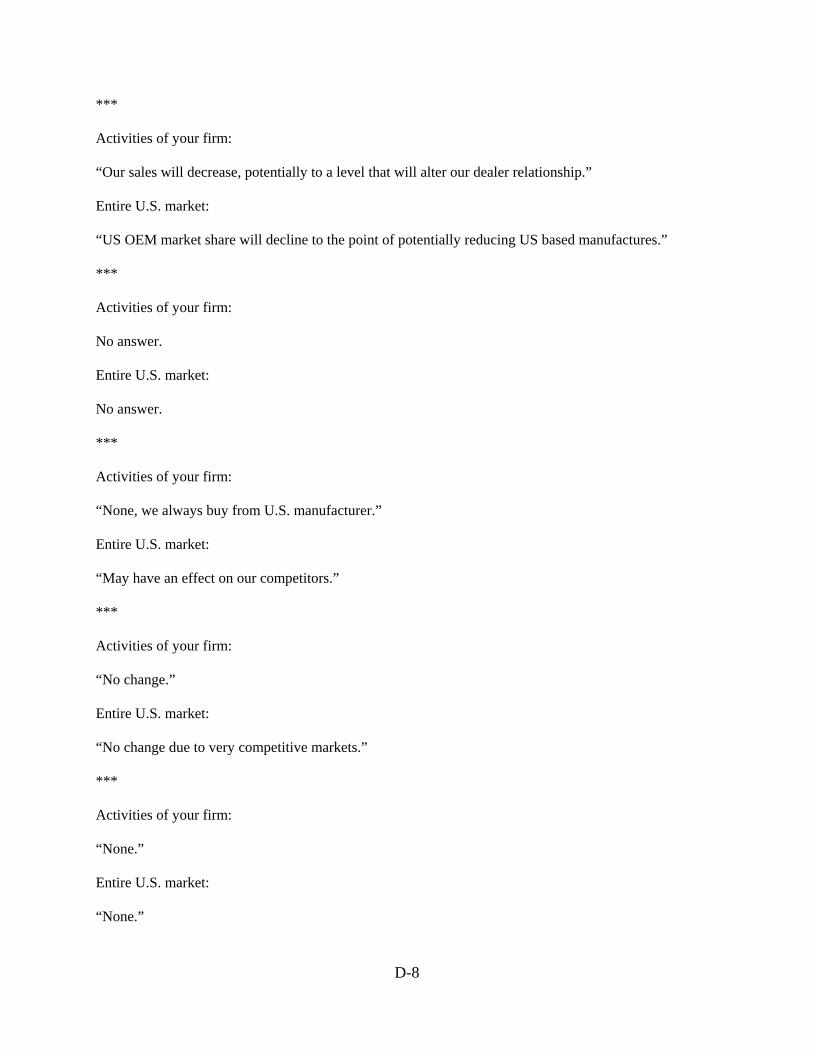
D-8
***
Activities of your firm:
“Our sales will decrease, potentially to a level that will alter our dealer relationship.”
Entire U.S. market:
“US OEM market share will decline to the point of potentially reducing US based manufactures.”
***
Activities of your firm:
No answer.
Entire U.S. market:
No answer.
***
Activities of your firm:
“None, we always buy from U.S. manufacturer.”
Entire U.S. market:
“May have an effect on our competitors.”
***
Activities of your firm:
“No change.”
Entire U.S. market:
“No change due to very competitive markets.”
***
Activities of your firm:
“None.”
Entire U.S. market:
“None.”
D-9
***
Activities of your firm:
No answer.
Entire U.S. market:
No answer.
***
Activities of your firm:
“None-The *** unit is always sold on features and benefits not price.”
Entire U.S. market:
“As in 2005-other companies are trying to become a “me too” as to the offerings of *** - in 2005 we haveseen several forklift mfg drop pricing to gain market share and copy features.
***
Activities of your firm:
Illegible
Entire U.S. market:
Illegible
***
Activities of your firm:
“Unknown”
Entire U.S. market:
“Unknown”
***
Activities of your firm:
“None”
Entire U.S. market:
“None”
D-10
***
Activities of your firm:
Illegible
Entire U.S. market:
Illegible
***
Activities of your firm:
“All we ask is a level playing field.”
Entire U.S. market:
“All we ask is a level playing field.”
***
Activities of your firm:
“No effect - all production is in USA.”
Entire U.S. market:
“No effect - all production is in USA.”
***
Activities of your firm:
“Revocation of the antidumping duty order would have little effect on our company. We believe in beinga global business with production operations close to our major markets. The U.S. is the largest market. Our customers want us here.”
Entire U.S. market:
“Revocation of the antidumping duty order would have little effect on our company. We believe in beinga global business with production operations close to our major markets. The U.S. is the largest market. Our customers want us here.”
***
Activities of your firm:
“None”

D-11
Entire U.S. market:
“None”
***
Activities of your firm:
“None”
Entire U.S. market:
“Unknown”
***
Activities of your firm:
*** expects to remain a dealer for *** for many years and will continue to represent the *** ICI forkliftproduct through sales and service. Should revocation of the antidumping duty order lead to the reductionin gross profits from the sale of *** ICI forklift, service parts, and service labor; *** would have toevaluate whether the reduced level of gross profits would be sufficient to remain a dealer for *** ICIforklifts or not.”
Entire U.S. market:
“We believe that the revocation of the antidumping duty order will lead to the deterioration of grossprofits from ICI forklift unit sales, parts sales and service sale. Such deterioration of gross profits willcause material injury to the U.S. manufacturers and U.S. dealers.”
***
Activities of your firm:
“If revocation resulted in Japanese manufacturers drastically lowering their prices, *** could be adverselyaffected.”
Entire U.S. market:
“If revocation resulted in Japanese manufacturers drastically lowering their prices, non-Japaneseequipment dealers could be adversely affected.”
***
Activities of your firm:
“None”
D-12
Entire U.S. market:
“None”
***
Activities of your firm:
No answer.
Entire U.S. market:
“Improvements in fuel economy, safety related items.”
***
Activities of your firm:
“Not known to us.”
Entire U.S. market:
“Not known to us.”
FOREIGN PRODUCERS’ COMMENTS REGARDING THE EFFECTS OF THE ORDER ANDTHE LIKELY EFFECTS OF REVOCATION
Foreign producers were asked whether they anticipated any changes in the character of theiroperations or organization relating to the production of ICI forklift trucks in the future if the antidumpingduty order were to be revoked. Their responses were as follows:
Sumitomo NACCO Materials Handling Co., Ltd.
***
Toyota Industrials Corp.
***
Komatsu Forklift Co., Ltd.
***

D-13
Foreign producers were asked whether they anticipated any changes in their production capacity,production, home market shipments, exports to the United States and other markets, or inventoriesrelating to the production of internal combustion industrial forklift trucks in the future if the antidumpingorder were to be revoked. (Question II-16) Their responses were as follows:
Sumitomo NACCO Materials Handling Co., Ltd.
***
Toyota Industrials Corp.
***
Komatsu Forklift Co., Ltd.
***
Foreign producers were asked to describe the significance of the existing antidumping duty ordercovering ICI forklift trucks from Japan in terms of its effects on their production capacity, production,home market shipments, exports to the United States and other markets, or inventories. Their responseswere as follows:
Sumitomo NACCO Materials Handling Co., Ltd.
***
Toyota Industrials Corp.
***
Komatsu Forklift Co., Ltd.
***


E-1
APPENDIX E
DOMESTIC VALUE ADDED FOR PRODUCERS’ LARGEST VOLUME SALES MODEL OF ICI FORKLIFT TRUCKS


E-3
Table E-1Domestic value added for the largest volume sales model of ICI forklift trucks (U.S.-producedframes only) produced by *** during its fiscal year ended ***
* * * * * * *
Table E-2Domestic value added for the largest volume sales model of ICI forklift trucks (all frames)produced by *** during its fiscal year ended ***
* * * * * * *
Table E-3Domestic value added for the largest volume sales model of ICI forklift trucks (U.S.-producedframes only or all frames) produced by *** during its fiscal year ended ***
* * * * * * *
Table E-4Domestic value added for the largest volume sales model of ICI forklift trucks (U.S.-producedframes only) produced by *** during its fiscal year ended ***
* * * * * * *
Table E-5Domestic value added for the largest volume sales model of ICI trucks (all frames) produced by ***during its fiscal year ended ***
* * * * * * *
Table E-6Domestic value added for the largest volume sales model of ICI forklift trucks (U.S.-producedframes only or all frames) produced by *** during its fiscal year ended ***
* * * * * * *
Table E-7Domestic value added for the largest volume sales model of ICI forklift trucks (U.S.-producedframes only or all frames) produced by *** during its fiscal year ended ***
* * * * * * *
Table E-8Domestic value added for the largest volume sales model of ICI forklift trucks (U.S.-producedframes only or all frames) produced by *** during its fiscal year ended ***
* * * * * * *


F-1
APPENDIX F
NET U.S. F.O.B SELLING PRICES REPORTED BY INDIVIDUAL U.S.PRODUCERS OF ICI FORKLIFT TRUCKS

F-3
Table F-1aICI forklift trucks: U.S. weighted-average net f.o.b. selling prices and quantities of U.S.-produced ICI forklifttrucks with domestic frames sold to U.S. dealers, products 1 and 2, by responding U.S. producers, and byquarters, January 1999-June 2005
* * * * * * *
Table F-1bICI forklift trucks: U.S. weighted-average net f.o.b. selling prices and quantities of U.S.-produced ICI forklifttrucks with domestic frames sold to U.S. dealers, products 3 and 4, by responding U.S. producers, and byquarters, January 1999-June 2005
* * * * * * *
Table F-1c ICI forklift trucks: U.S. weighted-average net f.o.b. selling prices and quantities of U.S.-produced ICI forklifttrucks with domestic frames sold to U.S. dealers, products 5 and 6, by responding U.S. producers, and byquarters, January 1999-June 2005
* * * * * * *
Table F-2aICI forklift trucks: U.S. weighted-average net f.o.b. selling prices and quantities of U.S.-produced ICI forklifttrucks with domestic and imported frames sold to U.S. dealers, products 1 and 2, by responding U.S.producers, and by quarters, January 1999-June 2005
* * * * * * *
Table F-2bICI forklift trucks: U.S. weighted-average net f.o.b. selling prices and quantities of U.S.-produced ICI forklifttrucks with domestic and imported frames sold to U.S. dealers, products 3 and 4, by responding U.S.producers, and by quarters, January 1999-June 2005
* * * * * * *
Table F-2c ICI forklift trucks: U.S. weighted-average net f.o.b. selling prices and quantities of U.S.-produced ICI forklifttrucks with domestic and imported frames sold to U.S. dealers, products 5 and 6, by responding U.S.producers, and by quarters, January 1999-June 2005
* * * * * * *
Table F-3aICI forklift trucks: U.S. weighted-average net f.o.b. selling prices and quantities of U.S.-produced ICI forklifttrucks with domestic frames sold to U.S. national-account end users, products 1 and 2, by responding U.S.producers, and by quarters, January 1999-June 2005
* * * * * * *

F-4
Table F-3bICI forklift trucks: U.S. weighted-average net f.o.b. selling prices and quantities of U.S.-produced ICI forklifttrucks with domestic frames sold to U.S. national-account end users, products 3 and 4, by responding U.S.producers, and by quarters, January 1999-June 2005
* * * * * * *
Table F-3cICI forklift trucks: U.S. weighted-average net f.o.b. selling prices and quantities of U.S.-produced ICI forklifttrucks with domestic frames sold to U.S. national-account end users, products 5 and 6, by responding U.S.producers, and by quarters, January 1999-June 2005
* * * * * * *
Table F-4aICI forklift trucks: U.S. weighted-average net f.o.b. selling prices and quantities of U.S.-produced ICI forklifttrucks with domestic and imported frames sold to U.S. national-account end users, products 1 and 2, byresponding U.S. producers, and by quarters, January 1999-June 2005
* * * * * * *
Table F-4bICI forklift trucks: U.S. weighted-average net f.o.b. selling prices and quantities of U.S.-produced ICI forklifttrucks with domestic and imported frames sold to U.S. national-account end users, products 3 and 4, byresponding U.S. producers, and by quarters, January 1999-June 2005
* * * * * * *
Table F-4cICI forklift trucks: U.S. weighted-average net f.o.b. selling prices and quantities of U.S.-produced ICI forklifttrucks with domestic and imported frames sold to U.S. national-account end users, products 5 and 6, byresponding U.S. producers, and by quarters, January 1999-June 2005
* * * * * * *