internal combustion engine: atkinson cycle - brandon · pdf fileinternal combustion engine:...
TRANSCRIPT
Internal Combustion Engine: Atkinson Cycle 1
[8f]
Internal Combustion
Engine: Atkinson Cycle Efficiency and Power Comparison to Otto Cycle
Josh Chen, James Chinn, Kevin Wan, Brandon Yang
MAE 133A, Spring 2013
Professor Amar, Ladan Amouzegar
June 7, 2013

Internal Combustion Engine: Atkinson Cycle 2
Abstract
The most common thermodynamic cycle used in modern internal combustion
engines is the Otto cycle. [1] This cycle provides satisfactory work for the majority of driving
situations, and has become the most popular cycle for automobiles. The downside to the
Otto cycle is in efficiency. The mechanics of typical Otto cycle engines constrain the
compression ratio to be the same as the expansion ratio because of crank design and valve
timing. Shortly after the Otto cycle’s conception in the mid 1800’s, James Atkinson
proposed a similar cycle that altered the crank design and allowed for greater
efficiency. This cycle was aptly named the ‘Atkinson Cycle.’ [2] Atkinson designed an
asymmetric crank design that allowed for a longer expansion stroke compared to the
compression stroke. The downside to the Atkinson cycle is that it has low torque output
compared to the Otto cycle, so it has been largely disregarded as an internal combustion
engine cycle. However, with the onset of hybrid gasoline-electric cars, the low torque
output of the Atkinson cycle can be supplemented by the high torque of electric motors,
specifically at low RPM. In this report, the advantages and disadvantages of the Atkinson
cycle are compared with those of the conventional Otto cycle, and proposals for
improvements, namely by incorporating superchargers, are made that make the Atkinson
cycle the superior cycle for typical civilian use. We will use thermodynamic efficiency and
financial costs as our selection criteria for deciding which configurations are the most
desirable.

Internal Combustion Engine: Atkinson Cycle 3
Table of Contents
Abstract ................................................................................................................. 2
1 List of Figures and Tables ................................................................................ 4
2 List of Symbols ................................................................................................ 5
3 Introduction ..................................................................................................... 7
3.1 Otto Cycle Overview ................................................................................ 7
3.2 Atkinson Cycle Overview ......................................................................... 9
4 First Law Thermo-mechanical Analysis of Internal Combustion Engine .......... 12
4.1 Introduction and Assumptions ................................................................ 12
4.2 Otto Cycle .............................................................................................. 14
4.3 Atkinson Cycle with Electric Motor ........................................................ 17
4.4 Supercharger as Possible Improvement .................................................... 19
4.5 Optimization and Comparison of Atkinson and Otto Cycle ..................... 21
4.6 Variable Valve Timing – Pumping Losses ................................................ 24
5 Combustion Analysis ..................................................................................... 29
6 Second Law Analysis – Exergetic Efficiency ................................................... 34
7 Cost Analysis and Recommendation .............................................................. 40
8 Conclusion .................................................................................................... 44
References ............................................................................................................ 45
Matlab Code ........................................................................................................ 47

Internal Combustion Engine: Atkinson Cycle 4
1 - List of Figures and Tables
Figure 1 – Ideal Otto Cycle ..................................................................................... 7
Figure 2 – Atkinson vs. Otto Cycle .......................................................................... 9
Figure 3 – Atkinson Cycle Achieved Through Late Valve Closure ......................... 10
Figure 4 - Compression Ratio vs. Qin for 120hp, 6000rpm ..................................... 21
Figure 5 - Compression Ratio vs. Qin for 70hp, 3000rpm ....................................... 22
Figure 6 – Pumping Losses at Partial Loading ....................................................... 25
Figure 7 – Variable Valve Timing Solution ............................................................ 28
Figure 8 – Schematic of engine as a control volume for combustion analysis .......... 30
Table 1 – Otto and Atkinson cycle analysis results ................................................. 23
Table 2 – Fuel Consumption From Combustion Analysis ...................................... 33
Table 3 – Exergy Analysis ..................................................................................... 36
Table 4 – Fuel Consumption Rates ....................................................................... 41
Table 5 – Mileage and Yearly Costs ...................................................................... 43

Internal Combustion Engine: Atkinson Cycle 5
2 – List of Symbols
P Power T Temperature
rpm Rotations per minute p Pressure
t Temperature u Specific Internal Energy
ε Exergetic Efficiency U Internal Energy
u Internal energy h Specific Enthaply
vr Relative specific volume H Enthalpy
rc Compression ratio hf0 Enthalpy of Formation
re Expansion ratio v Specific Volume
m Mass V Volume
AF Air/fuel ratio vr Reduced Specific Volume
R Ideal gas constant w Specific Work
M Molar mass W Work

Internal Combustion Engine: Atkinson Cycle 6
ncyl Number of cylinders in engine q Specific Heat
Wcyc Work per cycle Q Heat
Wsc Work used by supercharger η1 First Law Efficiency
Wact Actual work out,
accounting for supercharger
η2
Second Law Efficiency
qin Heat in per mass s Entropy
Qin Heat in ed Exergy Destruction
yi Molar ratio of the i-th component
ēch Chemical Exergy

Internal Combustion Engine: Atkinson Cycle 7
3 – Introduction 3.1 – Otto Cycle Overview
Modern cars use engines designed for the Otto cycle. An ideal Otto cycle consists of
four processes: two isentropic and two isochoric. When the Otto cycle is implemented in
an internal combustion engine, two more isobaric processes are added for the intake and
exhaust. Figure 1 shows the full cycle on a P-v diagram. In the ideal four-process cycle, 2-3
is isentropic compression, 3-4 is isochoric heat addition (combustion), 4-5 is adiabatic
expansion (the power stroke), and 5-6 is isochoric heat rejection. For internal combustion
engines, the two added isobaric process are 2-1 (exhaust) and 1-2 (intake). The key engine
components that define the cycle are the piston, crankshaft, intake valve, exhaust valve, and
spark plug. [2] The moving piston acts to both compress and expand the gas, as well as
acting as the delivery
system for work. The
crankshaft determines
the maximum and
minimum
displacements of the
piston, controlling
volume and
Figure 1 Ideal Otto Cycle [1f]

Internal Combustion Engine: Atkinson Cycle 8
compression/expansion ratios. The spark plug ignites the fuel, creating the heat input to
the cycle, and the intake and exhaust valves determine the timing of the isobaric processes,
as well as the supply of fresh fuel and the rejection of spent fuel. [3]

Internal Combustion Engine: Atkinson Cycle 9
3 – Introduction 3.2 – Atkinson Cycle Overview
In the original 1882 Atkinson model, a complicated cranking mechanism allowed
the piston to move further during the expansion stroke than the compression stroke. [5]
Figure 2 shows this change relative to the Otto cycle. Point 4O switches to point 4A so the
constant volume heat rejection (4O-1) is removed in exchange for a longer power stroke
(3-4A) to low pressure. After the exhaust and intake strokes (omitted from Figure 2),
process 4A-1 begins the
compression stroke at constant
pressure, and then follows the
rest of the Otto Cycle processes
described above. The increase in
work can be seen by the larger
area enclosed by the cycle, and
as the heat input (process 2-3) is
the same, the efficiency of the
Atkinson Cycle is greater
according to
eq. 1
Figure 2 Atkinson vs. Otto Cycle [2f]

Internal Combustion Engine: Atkinson Cycle 10
This is also what gives it lower torque, as the force of the expansion stroke is lower for the
longer expansion distance. The low torque, combined with the large and complicated
cranking mechanism, made the Atkinson cycle less appealing than the Otto cycle, which is
why the vast majority of modern cars use the Otto cycle. However, in recent years, as oil
prices climbed and people became more concerned about efficiency, research into practical
applications of the Atkinson cycle began yielding usable results. Today the higher
expansion-to-compression ratio can be achieved by implementing only a small
modification to an engine designed for an Otto cycle. By leaving the intake valve open for
the first part of the compression stroke, a constant pressure process is added, replacing the
first part of the compression stroke. The dotted line in figure 3 represents the modification
to the cycle obtained by leaving the intake valve open. Process 1-2 becomes processes 1-
2A-3A and the compression ratio is effectively reduced from
to
. This effectively
reduces the compression ratio, while keeping the expansion ratio the same, attaining the
increased expansion-to-
compression ratio of the Atkinson
cycle. The work per cycle decreases,
but so does the heat required. The
overall effect is to increase
efficiency while sacrificing engine
output.
Figure 3 Atkinson Cycle Achieved Through Late Valve Closure

Internal Combustion Engine: Atkinson Cycle 11
This poor output of the Atkinson cycle is its major drawback, and the reason why it is not
widely used as an internal combustion engine. The most popular solution to this problem is
coupling the gasoline engine with an electric motor to assist it in the low-torque rpm ranges.
These gasoline-electric hybrid cars have much better fuel economy than traditional vehicles,
and are still able to provide the torque necessary for quick acceleration. The first successful
hybrid car in the United States was the Honda Insight in 1999, followed shortly by the very
popular Toyota Prius in 2000. [4] To see how hybrid cars can compete with Otto cycle
engines in terms of torque while still maintaining a significantly higher efficiency, we will
look at the Toyota Prius in most of our calculations. We will examine ways to supplement
the Atkinson cycle’s low power and torque output, as well as ways to further improve its
efficiency, showing that it is superior to the Otto cycle for normal civilian use. We will
supplement both cycles with a supercharger and perform the necessary calculations and
observe the performance of each cycle with a supercharger.

Internal Combustion Engine: Atkinson Cycle 12
4 – First Law Thermo-mechanical Analysis of
Internal Combustion Engine 4.1 – Introduction and Assumptions
To analyze the performance of the Otto cycle, we performed a thermodynamic
analysis based on the First and Second Laws of Thermodynamics. Our aim was to find the
value of the total work output of the engine, given a known compression ratio and a heat
input. Before we begin the actual analysis, we list out all of our assumptions.
1. Compression and expansion stages are isentropic
2. Dry-air is the working fluid in the closed Otto cycle. Fuel is ignored
3. Kinetic and potential energy effects are neglected
4. Air is treated as an ideal gas
5. Air comes in at 298 K and 1 atm
Starting from point 1 in Figure 2, knowing the compression ratio and heat input, and
assuming isentropic compression and expansion, we can find the temperatures and
internal energy values at each point. The total specific work of the cycle can be evaluated as
eq. 2
We evaluated the thermal efficiency as a measure of the performance of the cycle. Thermal
efficiency is generally defined as the ratio of the desired value to the input cost to obtain
the desired quantity. For power cycles, this is simply the total work of the cycle divided by
the heat input, or

Internal Combustion Engine: Atkinson Cycle 13
eq. 3
The value of qin for an Otto cycle is
eq. 4
In order to compare the Otto cycle modeled after the Toyota Camry, the Otto cycle
with a supercharger, the Atkinson cycle with an electric motor modeled after the Toyota
Prius, and the same Atkinson cycle engine with a supercharger, we decided on two different
conditions of engine performance, a high power, high speed load and then a more moderate
load. Through the following calculations, we are able to determine how much heat is
needed from the combustion.
Internal Combustion Engine: Atkinson Cycle 14
4 – First Law Thermo-mechanical Analysis of
Internal Combustion Engine 4.2 – Otto Cycle
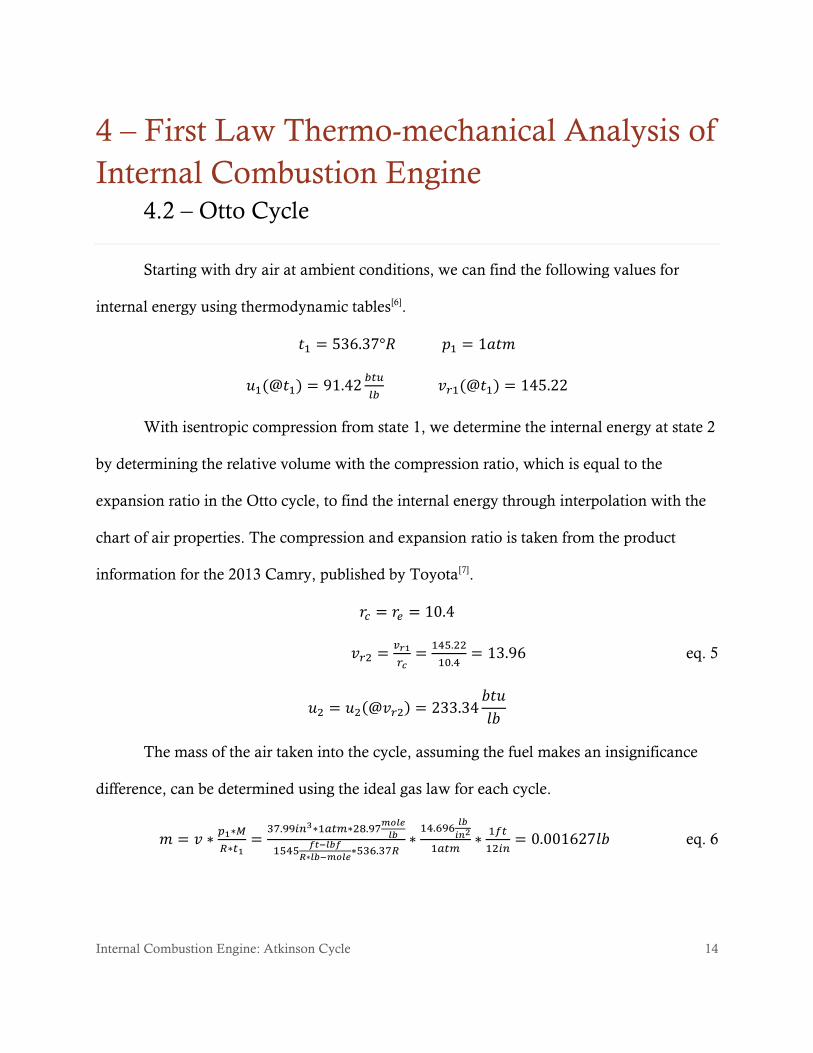
Starting with dry air at ambient conditions, we can find the following values for
internal energy using thermodynamic tables[6].
With isentropic compression from state 1, we determine the internal energy at state 2
by determining the relative volume with the compression ratio, which is equal to the
expansion ratio in the Otto cycle, to find the internal energy through interpolation with the
chart of air properties. The compression and expansion ratio is taken from the product
information for the 2013 Camry, published by Toyota[7].
eq. 5
The mass of the air taken into the cycle, assuming the fuel makes an insignificance
difference, can be determined using the ideal gas law for each cycle.
eq. 6

Internal Combustion Engine: Atkinson Cycle 15
The amount of work produced by each cycle can be determined by the power,
rotation speed, number of cylinders, and mass of the air.
eq. 7
The amount of heat produced by combustion per mass of air can be found using the
internal energies of state 3 and 4 with eq. 4. The amount of work per cycle is also equal the
difference in internal energy between states 3 and 4. Using eq. 2 and combining it with eq. 4,
we get the following equation.
eq. 8
To find the internal energy of state 4, we need to relate it with a known value. We
know that there is isentropic expansion between state 3 and 4. Using the three equations
below and eq. 8, we find eq. 10
eq. 9
[ [ ] ] eq.10
With eq. 10 and eq. 8, we can use Matlab to perform iterations to solve for the qin
and u4, as there are two unknowns and two equations. The internal energy of state 4 is then
used to interpolate the temperature of the gas at state 4, the exhaust.
With the heat entering the system and the work being done calculated, we can
determine the efficiency of the cycle using eq. 1.

Internal Combustion Engine: Atkinson Cycle 16
Since the mass entering the engine varies and qin is dependent on mass, we calculate
the amount of heat per cycle.
eq. 11
Internal Combustion Engine: Atkinson Cycle 17
4 – First Law Thermo-mechanical Analysis of
Internal Combustion Engine 4.3 – Atkinson Cycle with Electric Motor
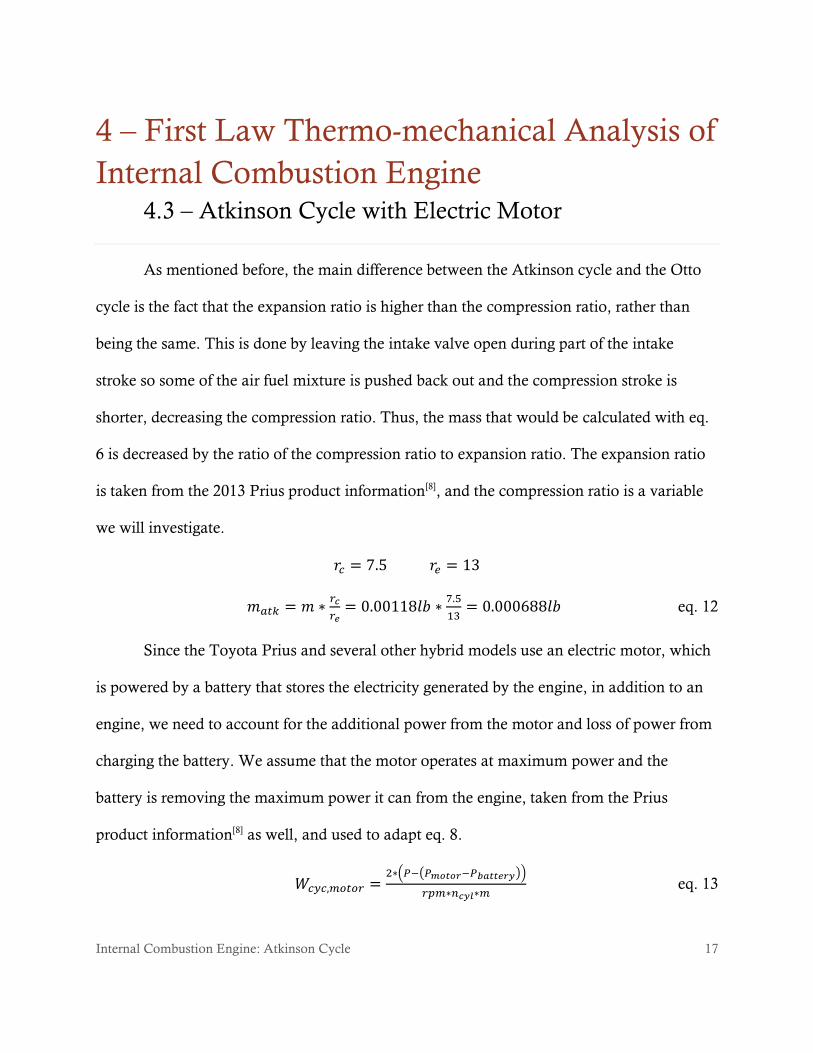
As mentioned before, the main difference between the Atkinson cycle and the Otto
cycle is the fact that the expansion ratio is higher than the compression ratio, rather than
being the same. This is done by leaving the intake valve open during part of the intake
stroke so some of the air fuel mixture is pushed back out and the compression stroke is
shorter, decreasing the compression ratio. Thus, the mass that would be calculated with eq.
6 is decreased by the ratio of the compression ratio to expansion ratio. The expansion ratio
is taken from the 2013 Prius product information[8], and the compression ratio is a variable
we will investigate.
eq. 12
Since the Toyota Prius and several other hybrid models use an electric motor, which
is powered by a battery that stores the electricity generated by the engine, in addition to an
engine, we need to account for the additional power from the motor and loss of power from
charging the battery. We assume that the motor operates at maximum power and the
battery is removing the maximum power it can from the engine, taken from the Prius
product information[8] as well, and used to adapt eq. 8.
( ( ))
eq. 13

Internal Combustion Engine: Atkinson Cycle 18
( ( )
)
The remainder of the calculations is the same as that of the Otto cycle.

Internal Combustion Engine: Atkinson Cycle 19
4 – First Law Thermo-mechanical Analysis of
Internal Combustion Engine 4.4 – Supercharger as Potential Improvement
The supercharger compresses the air fuel mixture entering the cylinder during intake
to increase the amount of fuel that can be combusted for more heat and thus more power.
We model the supercharger as a compressor that uses a set amount of work produced by the
engine at a set efficiency.
eq. 14
With the supercharger, the pressure now entering the engine is determined using eq.
15, with ambient air being state 0 and k, the specific heat ratio, being 1.4. The new
temperature at state is found using the ideal gas law.
(
)
eq. 15
(
)
Since the supercharger is not 100% efficient, we calculate the temperature accounting for the
inefficiency.
(
)
(
)
eq. 16
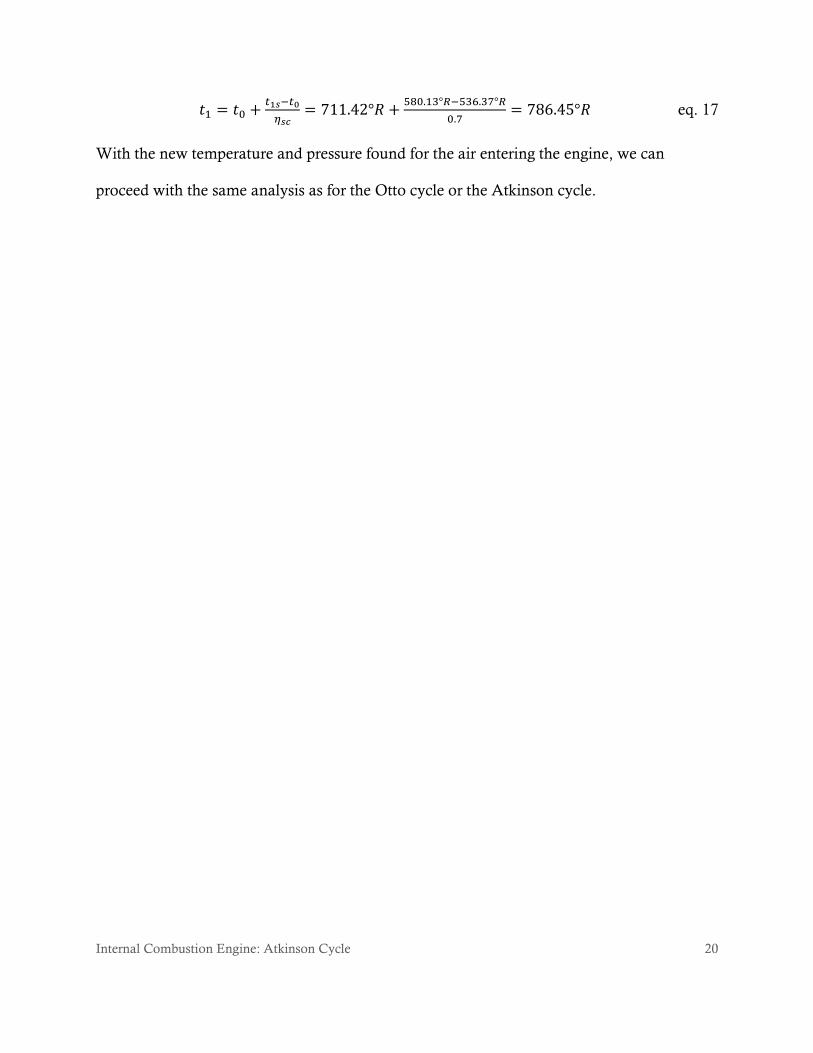
Internal Combustion Engine: Atkinson Cycle 20
eq. 17
With the new temperature and pressure found for the air entering the engine, we can
proceed with the same analysis as for the Otto cycle or the Atkinson cycle.

Internal Combustion Engine: Atkinson Cycle 21
4 – First Law Thermo-mechanical Analysis of
Internal Combustion Engine 4.5 – Optimization and Comparison of Atkinson and Otto Cycle
Since the compression ratio for the Atkinson cycle can be varied, we optimize the
ratio to require the least heat in needed to meet the specifications as possible. Looking at
figure 4 and figure 5, we see that for each condition, Qin will drop before rising again as
compression ratio increases, fluctuating as the mass and qin in eq. 11 vary with compression
ratio.
Figure 4 Compression Ratio vs. Qin for 120hp, 6000rpm

Internal Combustion Engine: Atkinson Cycle 22
Figure 5 Compression Ratio vs. Qin for 70hp, 3000rpm
From these two figures, we see that the compression ratio with the lowest Qin is
about 8 at the higher load and 7 for the moderate load. We take the average of the two, 7.5
and use that for our compression ratio for the Atkinson cycle in our analysis; the results are
shown in table 1.

Internal Combustion Engine: Atkinson Cycle 23
Table 1: Otto and Atkinson cycle analysis results
Otto:
Camry
Otto
+Super
Charger
Atkinson
+Motor:
Prius
Atkinson
+Super
Charger
rc 10.4 10.4 7.5 7.5
re 10.4 10.4 13 13
m (lb/cycle) 0.001627 0.002981 0.000688 0.001243
Wsc (btu/lb) 0 60 0 60
120 hp
6000 rpm
Wact (btu/lb) 260.725 142.253 395.907 341.068
qin (btu/lb) 470.368 370.803 647.549 654.834
Q (btu) 0.7651 1.1054 0.4393 0.8142
η 0.5543 0.3836 0.6114 0.5208
70 hp
3000 rpm
Wact (btu/lb) 304.179 165.962 270.884 397.913
qin (btu/lb) 553.782 416.212 422.849 760.311
Q (btu) 0.9007 1.2408 0.2869 0.9453
η 0.5493 0.3987 0.6406 0.5234
From Table 1, we can see that the Atkinson cycle engine with the motor has the best
efficiency, followed by the standard Otto cycle engine. By adding the supercharger to the
engines, we are able to decrease the amount of heat needed from combustion per pound of
air, but because more compressed air and fuel enters the cycle at a time, bringing more heat.
The supercharger also extracts some work from the engine to compress the air, further
decreasing the efficiency.

Internal Combustion Engine: Atkinson Cycle 24
4 – First Law Thermo-mechanical Analysis of
Internal Combustion Engine 4.6 – Variable Valve Timing – Pumping Losses
One of the big efficiency drains in Otto cycle engines is pumping losses. Pumping
losses refer to work the engine has to do to compress or intake charge. In the Otto Cycle,
the pumping losses for intake are unavoidable. In the Atkinson cycle however, they can be
essentially eliminated if the valve timing is made adjustable in real time. First, let’s see
how pumping losses change with engine load. Engines are designed for a maximum output
– some torque at some rpm. However, the full extent of this load is only realized during
acceleration up slopes. For the vast majority of the time – during acceleration or cruising
on flat ground – the engine is at partial load, meaning that less power output is required of
it. [9] To reduce the power output, fuel intake must be reduced. In traditional engines, this
is achieved through a throttle attached to the intake valve that restricts intake according to
the load of the engine. The reduced mass of gas within the piston during intake creates
lower pressure, and forces the engine to suck in air, using work to pull the piston against
the pressure differential. This can be a significant amount of work. Figure 4 shows the
pumping losses associated with partial loading. The exhaust stroke occurs at atmospheric
pressure and the intake stroke occurs below atmospheric pressure due to the throttle. The
grey area represents negative work being done, contributing to losses in efficiency.

Internal Combustion Engine: Atkinson Cycle 25
Figure 6. Pumping Losses at Partial Loading [6f]
Using the Prius engine specs for data on engine displacement, we will calculate the
pumping losses associated with an Otto cycle using about 40% of maximum fuel intake.
This corresponds to slightly above cruising speed at 65 mph for a typical sedan. [2] This
means that only 40% of the maximum air/fuel mixture is drawn in during the intake
process. The throttle maintains a pressure of about 0.4 bar as opposed to 1 bar to
accomplish this, which is where the loss of work comes from:
∫
eq. 18

Internal Combustion Engine: Atkinson Cycle 26
A couple key assumptions we will make are first, that these are two constant
pressure pumping processes (exhaust and intake) and that their endpoints are the
maximum and minimum volumes of the piston-cylinder assembly. The second assumption
is that these two processes do not affect the four-process Otto Cycle analyzed previously;
they are acting as a separate two-process cycle in series with the Otto Cycle. Now, working
in gage pressures, exhaust at 1 bar becomes 0 bar, and intake at 0.4 bar becomes negative
0.6 bar. Pressure is constant for each process, so it can come out of the integral:
{ [ ] ∫
} { [ ] ∫
} eq. 19
Now converting bars to kilopascals and using the maximum and minimum volumes for the
Prius engine of 1.798E-3 and 1.383E-4 cubic meters:
{ } { [ ]
[ ]
[ ] [ ] [ ] }
[ ] [ ]
So for freeway driving using an Otto cycle engine of similar size to the Prius’, 99.58
Joules are lost per cycle per cylinder. The first law efficiency reported for the four-process
Otto cycle must be reduced when we consider the extra exhaust and intake processes. We
assume this to be an average engine load for most people, as during cruising in city driving,
the load will be less, but during acceleration, the load will be greater. As people tend to be
inefficient drivers, the 40% of maximum fuel use is actually about 10% higher than needed
during freeway cruising. Because we assume that these processes are independent of the
four-process Otto cycle, we subtract this work done by the engine in “pumping losses” from
the originally calculated work to recalculate the first law efficiency. As calculated above,

Internal Combustion Engine: Atkinson Cycle 27
the full load engine output is 1146 KJ/kg. To find the energy per cycle, we must multiply
this by the mass of air per cycle. Using the temperature of air at intake (298 K), the density
of air is 1.184 kg/ . Using the volume per cylinder calculated above of 1.66E-3
,
eq. 20
[ ]
[ ] [
] [ ]
Multiplying this by the engine output per kg at full load, the output per cycle is
[ ]
[ ] [ ]
Now looking at the 40% of maximum fuel consumption typical of highway driving,
we calculate the engine output using our first law Otto Cycle analysis above to be 20% of
the maximum, or 0.45
. This means that pumping losses create a loss of work of
[ ]
[ ]
This is a significant number, typical of the Otto Cycle, and one of the main
complaints with the Otto Cycle in an internal combustion engine. [2] This brings our first law
efficiency down to
eq. 21
So the addition of the intake work into this equation reduces the efficiency from
54.9% down to 42.8%.
Now let’s look at how variable valve timing in an Atkinson cycle eliminates these
losses. As stated before, the way an Atkinson cycle is achieved in modern automobiles is by

Internal Combustion Engine: Atkinson Cycle 28
delaying the closure of the intake valve, allowing for a constant pressure process to replace
the beginning of the compression stroke (Figure 3). Recalling that the reason for the
pumping losses is that lower fuel intake is desired for partial engine loading, the Atkinson
cycle’s low power output is now used to its advantage. It allows for intake to occur at
atmospheric pressure, filling the cylinder with surplus fuel, but expelling this surplus as the
intake valve is left open during the beginning of compression. The variable valve timing
system allows the valve to close precisely when the required amount of fuel is present in
the cylinder, initiating compression. This eliminates the pumping losses that so negatively
affected static-valve systems. Figure 7 shows the variable valve timing strokes
superimposed over the static-valve system.
Figure 7. Variable Valve Timing Solution [7f]

Internal Combustion Engine: Atkinson Cycle 29
5 – Combustion Analysis
From the first law analysis, we also obtain T4, which is the temperature of the
exhaust gases. Based on this, we can perform a combustion analysis, and Figure 8 shows a
schematic of the control volume used for the combustion analysis. We list out all of our
assumptions for our combustion analysis.
1. The control volume encloses the engine, operating at steady state
2. Kinetic and potential energy effects are neglected
3. Dry air as an ideal gas is the combustion air (21% O2, 79% N2 on a molar
basis)
4. Fuel is treated as pure octane, C8H18, with no impurities
5. The combustion process is adiabatic (no heat losses)
6. Air and fuel enter separately at atmospheric conditions (298 K, 1 atm)
7. Complete combustion with no carbon monoxide products
8. Water exits the exhaust as water vapor
9. The reference environment is the atmospheric environment (298 K, 1 atm)
10. The engine has 100% volumetric efficiency (piston-cylinder always filled
with air)
Note that assuming adiabatic combustion is generally inaccurate, since in reality
most engines release significant quantities of heat. However, we made this assumption for
two reasons. Firstly, it greatly simplifies calculations. Finding the heat transfer from the

Internal Combustion Engine: Atkinson Cycle 30
engine would require complicated heat transfer analysis, which is outside the focus of this
analysis, as well as extensive knowledge of the engine’s geometry and material properties.
Furthermore, we would need to know the temperature of the boundary where heat
transfer occurs in order to calculate entropy, which we will show later. Secondly, assuming
adiabatic combustion means that no heat is lost to the environment, which results in
obtaining the greatest amount of heat input into the air. This gives us an upper bound on
the performance of our system, which we can use to compare to our other configurations.
Figure 8 Schematic of engine as a control volume for combustion analysis
Combustion analysis allows us to calculate the air/fuel ratio based on a given qin.
From the ideal gas law
pv=RT eq. 22
Internal Combustion Engine: Atkinson Cycle 31
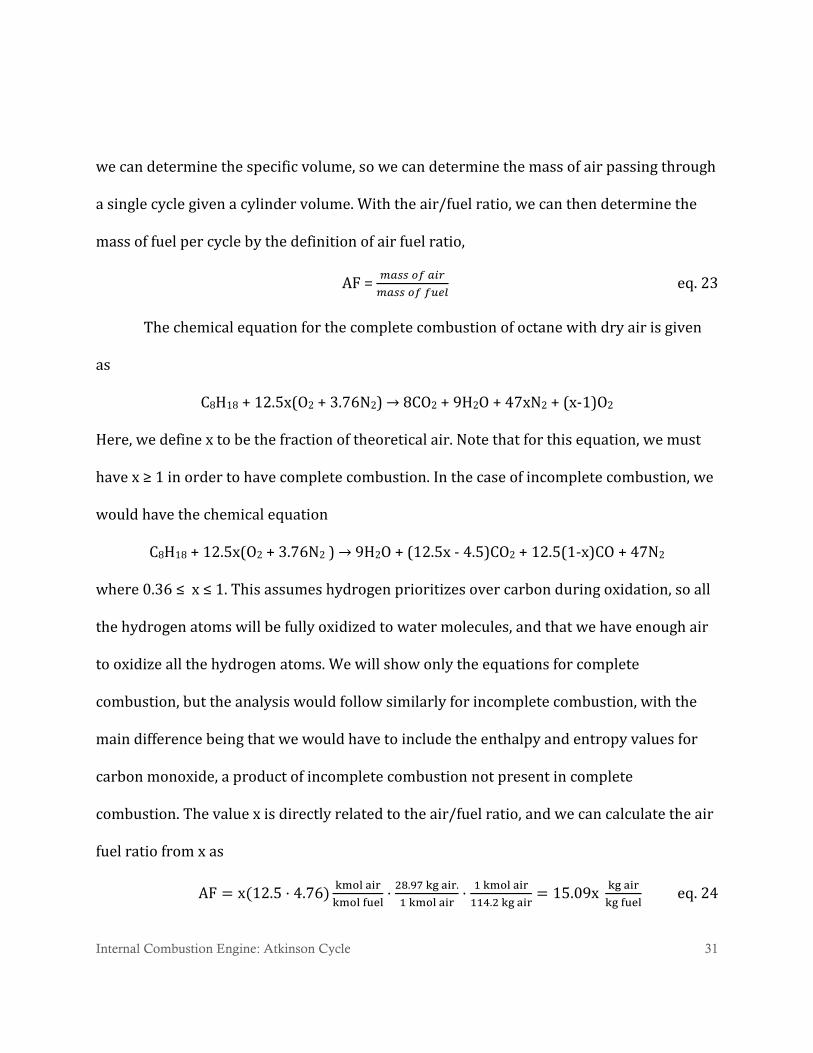
we can determine the specific volume, so we can determine the mass of air passing through
a single cycle given a cylinder volume. With the air/fuel ratio, we can then determine the
mass of fuel per cycle by the definition of air fuel ratio,
AF =
eq. 23
The chemical equation for the complete combustion of octane with dry air is given
as
C8H18 + 12.5x(O2 + 3.76N2) → 8CO2 + 9H2O + 47xN2 + (x-1)O2
Here, we define x to be the fraction of theoretical air. Note that for this equation, we must
have x ≥ 1 in order to have complete combustion. In the case of incomplete combustion, we
would have the chemical equation
C8H18 + 12.5x(O2 + 3.76N2 ) → 9H2O + (12.5x - 4.5)CO2 + 12.5(1-x)CO + 47N2
where 0.36 ≤ x ≤ 1. This assumes hydrogen prioritizes over carbon during oxidation, so all
the hydrogen atoms will be fully oxidized to water molecules, and that we have enough air
to oxidize all the hydrogen atoms. We will show only the equations for complete
combustion, but the analysis would follow similarly for incomplete combustion, with the
main difference being that we would have to include the enthalpy and entropy values for
carbon monoxide, a product of incomplete combustion not present in complete
combustion. The value x is directly related to the air/fuel ratio, and we can calculate the air
fuel ratio from x as
eq. 24

Internal Combustion Engine: Atkinson Cycle 32
Based on the first law on a per kilomole basis, an energy balance gives
∑ ∑ eq. 25
For each species, its enthalpy value is given as
eq. 26
The reference environment is 298 K, and after expanding the summation
expressions and disregarding terms that equal 0, we can express the total energy balance
by
eq. 27
We are given T4 and the cycle work per kg of air, so we can solve for x, and thus
solve for the air/fuel ratio if we assume adiabatic combustion by setting qcv = 0.
Rearranging terms, we can get an equation solving for x.
Once we have calculated x, we can directly calculate the air/fuel ratio from eq. 24, and then
calculate the mass of fuel given the mass of air using eq. 23.
As a sample, from the standard Otto cycle analysis, our exhaust temperature is
2243.3 °R = 1246 K, and the work per kg of air is 707 kJ/kg. This gives us enthalpies for
each relevant component of

Internal Combustion Engine: Atkinson Cycle 33
We can then calculate x and obtain a value of x = 2.00, an air/fuel ratio of 30.2. Given
a mass of 0.74 grams of air per cycle based on the ideal gas law given in eq. 22 and the
assumption of 100% volumetric efficiency, we calculate a mass of fuel of 24.4 micrograms
per cycle. Note that calculating x requires iterations; in order to obtain the cycle work per
kmol of fuel from the cycle work per kg of air, we need the air/fuel ratio, but we also need
the cycle work per kmol of fuel to determine the air/fuel ratio. Here are the results from
our combustion analysis, showing the fuel consumption rates for each engine condition.
Table 2. Fuel Consumption From Combustion Analysis
Otto Otto+SC Atkin Atkin+SC
120 hp
6000 rpm
kg fuel/cycle 2.204 * 10-5 3.19 * 10-5 1.25 * 10-5 2.33 * 10-5
kg fuel/s 11.0 * 10-4 15.9 * 10-4 6.25 * 10-4 11.7 * 10-4
kg fuel/hr 3.96 5.74 2.25 4.20
70 hp 3000 rpm
kg fuel/cycle 2.44 * 10-5 3.42 * 10-5 1.00 * 10-5 2.56 * 10-5
kg fuel/s 6.10 * 10-4 8.56 * 10-4 2.50 * 10-4 6.39 * 10-4
kg fuel/hr 2.20 3.08 0.901 2.30
From our results, we see that the Otto cycle requires more fuel overall, but it also
has a higher work output, which we showed in Table 1. However, between the lower and
higher loads, the fuel consumption increases more for the Atkinson cycle. The Otto cycle
requires about 80% more fuel for the higher load, while the Atkinson cycle without the

Internal Combustion Engine: Atkinson Cycle 34
supercharger requires about 250% more fuel for the higher load. We also observe that the
supercharger significantly increases fuel consumption for both cycles at both loads.

Internal Combustion Engine: Atkinson Cycle 35
6 – Second Law Analysis – Exergetic
Efficiency
Another useful parameter to measure the performance of the engine is to calculate
the exergy destruction and the exergetic efficiency of the engine. Exergy is defined as the
maximum potential to do work relative to a reference environment. Calculating the exergy
destruction allows us to figure out how much potential to do work was lost from the
engine. Minimal exergy destruction indicates minimal potential losses, and harnessing the
closest amount of work to the theoretical maximum is the most desirable. Here is a list of
the assumptions that we will make, along with all of the other assumptions made during
the combustion analysis.
1. All irreversibilities occur during combustion
2. Processes for the surrounding are reversible
3. The pressure of the exhaust gas is at atmospheric pressure
4. Exergy of the combustion air at the inlet is negligible
To calculate the exergy destruction, we first must perform an entropy analysis on
the system. The total entropy generated during a process is given by
Sgen=dSsys+dSsurr eq. 28
Since we are assuming the engine to be operating at steady state, the dSsys term is
zero, and we only have the dSsurr term. Processes for the surrounding are generally
assumed to be reversible, so the total specific entropy generation is given by

Internal Combustion Engine: Atkinson Cycle 36
∑ ∑
eq. 29
Note that the heat transfer term is relative to the surroundings, meaning heat
transfer from the engine to the surroundings means a positive qsurr, and vice versa. We are
assuming adiabatic combustion for our analysis, so this term goes to 0. The entropy of a
given species at a given temperature and partial pressure is given by
|
| eqn. 30
We assume the exhaust pressure is the atmospheric pressure, which is also the
reference pressure, so this expression simplifies to
eqn. 31
We assume that the fuel and air enter as separate streams, and we know the
temperature at each point, so we can calculate the entropy of each species. For example,
from our standard Otto cycle analysis, we obtain entropies at T4 = 1246 K of
From this we can calculate the total entropy generated by including the molar
coefficients. The specific exergy destruction is then given by
eq. 32
The exergetic efficiency is given by the total work performed divided by the exergy
given per cycle. For our case this is
Internal Combustion Engine: Atkinson Cycle 37
eq. 33
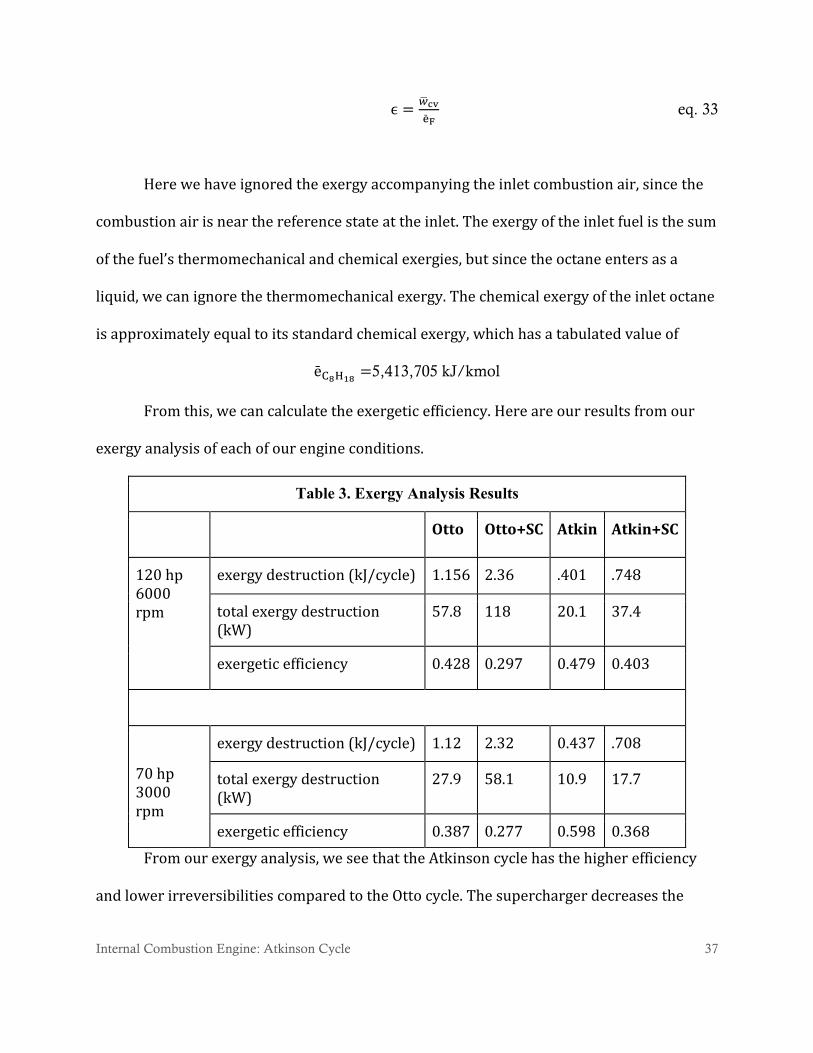
Here we have ignored the exergy accompanying the inlet combustion air, since the
combustion air is near the reference state at the inlet. The exergy of the inlet fuel is the sum
of the fuel’s thermomechanical and chemical exergies, but since the octane enters as a
liquid, we can ignore the thermomechanical exergy. The chemical exergy of the inlet octane
is approximately equal to its standard chemical exergy, which has a tabulated value of
5,413,705 kJ/kmol
From this, we can calculate the exergetic efficiency. Here are our results from our
exergy analysis of each of our engine conditions.
Table 3. Exergy Analysis Results
Otto Otto+SC Atkin Atkin+SC
120 hp
6000 rpm
exergy destruction (kJ/cycle) 1.156 2.36 .401 .748
total exergy destruction (kW)
57.8 118 20.1 37.4
exergetic efficiency 0.428 0.297 0.479 0.403
70 hp
3000 rpm
exergy destruction (kJ/cycle) 1.12 2.32 0.437 .708
total exergy destruction (kW)
27.9 58.1 10.9 17.7
exergetic efficiency 0.387 0.277 0.598 0.368
From our exergy analysis, we see that the Atkinson cycle has the higher efficiency
and lower irreversibilities compared to the Otto cycle. The supercharger decreases the

Internal Combustion Engine: Atkinson Cycle 38
exergetic efficiency of each cycle, and adding the supercharger also increases the exergy
destruction. These results parallel our first law analysis; the Atkinson cycle displays the
best overall performance in terms of efficiency and exergy destruction. Note that the
efficiency for the Atkinson decreases from the lower load to the higher load, while the
efficiency of the Otto cycle increases from the lower load to the higher load. While the
efficiency of the Atkinson cycle is still higher at the high load, this trend nevertheless
demonstrates one of the fundamental differences between the Otto and Atkinson cycles.
The Atkinson cycle sacrifices power for efficiency, but its performance decreases at higher
loads, while the Otto cycle is capable of performing at high power outputs while
maintaining or improving its efficiency.

Internal Combustion Engine: Atkinson Cycle 39
7 – Cost Analysis and Recommendation
Ultimately, our efficiency analysis is meaningless in industry without a thorough
analysis of its economic feasibility. In order for our analysis to be commercially fruitful, it is
important to evaluate whether the money invested in our proposed changes pays off
thermodynamically. By evaluating the relationship between thermodynamic and economic
benefits, we can have a better understanding of costs.
In the case of the thermodynamic analysis of internal combustion engines,
consumers are mostly interested in the engine’s power and its fuel consumption. Interest in
power is not easily quantifiable as it depends largely on individual consumer’s preferences
and needs. Fuel consumption, however, is largely a financial issue and can be quantified as
the fuel cost savings.
Finally, fuel efficiency is an area of high government interest. Because of ecological
concerns, the desire to reduce dependency on foreign oil, and numerous other factors, the
government takes a role in costs. In addition to funding research in this field, the
government also offers incentives for purchasing consumers. These benefits change
frequently depending on regulation and are different from state to state. Also, some of the
benefits such as California’s carpool incentive are not easily quantifiable. Because of this,
these factors were left off our calculations. However, the true final cost of any fuel savings
could potentially be lower based on these governmental benefits.
Internal Combustion Engine: Atkinson Cycle 40
In this thermodynamic analysis, we looked at internal combustion engines running
on the Otto and Atkinson cycles. We then addressed weaknesses of each design with
auxiliary features such as a hybrid-electric system and supercharger. The cost difference
between the two different cycles is negligible since the valve timing is easily adjusted
through the engine control unit. In the auxiliary systems, however, the costs of the
components are significant and may determine the viability of a certain option.
For the hybrid-electric vehicle system, along with the internal combustion engine
running an Atkinson cycle the hybrid system requires an electric propulsion motor, a high-
voltage battery pack, and a power control module. The costs of these components depends
on the amount that the electric system is involved in supplementing the internal
combustion engine with power. [10] The classification of these systems range from micro-
hybrid to full-hybrid. The Prius we are analyzing falls into the full-hybrid category. [11]
[12] The costs for a standard full-hybrid system’s components come out to be
approximately $3,000.
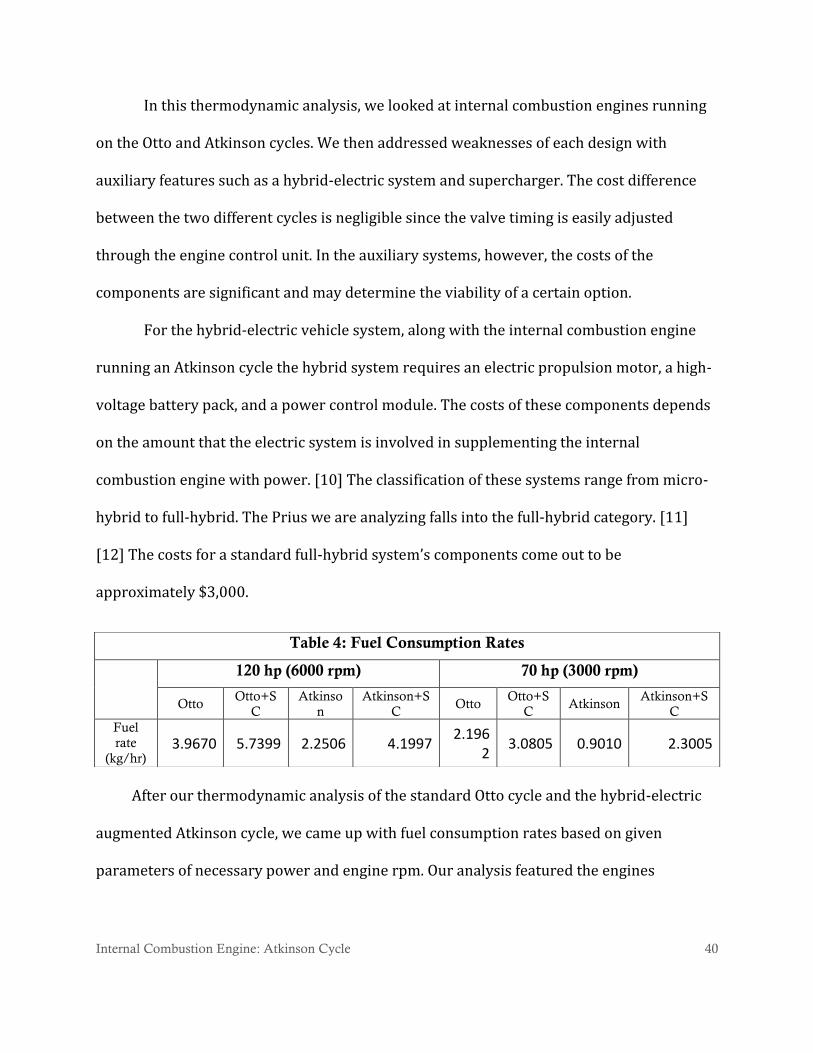
After our thermodynamic analysis of the standard Otto cycle and the hybrid-electric
augmented Atkinson cycle, we came up with fuel consumption rates based on given
parameters of necessary power and engine rpm. Our analysis featured the engines
Table 4: Fuel Consumption Rates
120 hp (6000 rpm) 70 hp (3000 rpm)
Otto Otto+S
C
Atkinso
n
Atkinson+S
C Otto
Otto+S
C Atkinson
Atkinson+S
C
Fuel
rate
(kg/hr) 3.9670 5.7399 2.2506 4.1997
2.1962
3.0805 0.9010 2.3005

Internal Combustion Engine: Atkinson Cycle 41
operating at approximately full power (120 hp) and approximately half power (70 hp).
Interestingly, for the two non-supercharged engines, the different necessary power outputs
revealed strengths and weaknesses in each of the systems.
At half load, the hybrid-Ackerman engine consumed fuel at about 41% the rate of that
of the Otto cycle engine, and at full load, the Ackerman engine consumes fuel at about 57%
of the Otto. This consumption confirms our analysis about the decreasing effectiveness of
the Ackerman cycle at high load. However, it is worth noting that normal operating
conditions for an engine usually do not reach full load powers. Therefore, under normal
(half-load) conditions, the engine uses less fuel. To convert this fuel consumption rate to a
more consumer-friendly miles-per-gallon, we look at the following equations.
Manufacturer’s specification for fuel economy of our given Otto cycle engine is 28 mpg.
Taking this data to analyze economic costs, we find that (assuming 15,000 mi/yr and $4
per gal of gasoline):

Internal Combustion Engine: Atkinson Cycle 42
Table 5: Mileage and Yearly Costs
Otto Otto+SC Atkinson Atkinson+SC
Miles per gallon (half-load)
28 20.0 68.3 26.7
Yearly fuel costs (assume half-load;
15,000 mi; $4/gal) $2143 $3006 $879 $2245
With these fuel savings for the hybrid vehicle, it would take approximately two and
a half years to recoup the $3000 costs of the hybrid-electric system. Modern automobiles’
life cycles are generally much greater than that time period, so the hybrid-electric vehicle
running on an Atkinson cycle engine is a very viable option for consumers looking to save
on overall costs.
Both of these engine cycles with superchargers, however, got lower fuel economy.
Therefore, adding a supercharger is not a relevant in the discussion of economics
regardless of its costs. Other factors such as power, responsiveness, etc. that a
supercharger may add to the vehicle are not factored into the cost analysis.

Internal Combustion Engine: Atkinson Cycle 43
8 - Conclusion
After analyzing and comparing the Atkinson Cycle to the Otto Cycle, their differences can
be summarized by saying that the Atkinson Cycle has better efficiency and reduced output. By
employing variable valve timing, the efficiency of the Atkinson Cycle can be increased over the Otto
Cycle even further. Both the first law analysis and the exergy analysis indicate that the Atkinson
cycle performs better per unit of energy or exergy input at the price of total power output. The
Atkinson cycle also reduces exergy destructions compared to the Otto cycle. However, the Atkinson
cycle engine alone does not have the power to meet our minimum power constraints.
By supplementing the Atkinson Cycle with an electric motor, the engine can compete with a
similarly sized Otto Cycle engine. This hybrid Atkinson-electric system can easily meet the
requirements of normal civilian use. However, these extra system components come at a price.
Overall, the equipment needed have significant costs at around $3000, but when offset by the fuel
savings, it becomes clear that the Atkinson-electric system is the superior system.
In contrast, our analysis of the supercharger indicates that the supercharger worsens the
performance of both cycles. Superchargers decrease first law efficiency and exergetic efficiency, as
well as increasing exergy destruction and fuel consumption, so we conclude that incorporating
superchargers onto either the Otto or the Atkinson cycle is an undesirable choice based on our
selection criteria of thermodynamic efficiency and costs.

Internal Combustion Engine: Atkinson Cycle 44
References
[1] Wu, Chih. Thermodynamic Cycles: Computer-aided Design and Optimization. New York: M.
Dekker, 2004. Print. [2] Yates, A. "The Atkinson Cycle Revisited for Improved Part-load Fuel Efficiency?" (1991): n.
pag. University of Capetown, Mechanical Engineering Department. Web. 4 June 2013. [3] Moran, Michael J., and Howard N. Shapiro. Fundamentals of Engineering Thermodynamics:
SI Version. Hoboken, NJ: Wiley, 2006.
[4] Berman, Bradley. "When Old Things Turn Into New Again." The New York Times, 24 Oct.
2007. Web. 05 June 2013.
[5] Rabia, Et Al. "Environmental Effect of New Approach in Petrol Engine for Abstract Saving
Energy." (1995): n. pag. University of El Jabal El Gharby.
[6] Bhattacharjee, S., "TEST: The Expert System for Thermodynamics," Electronic
Resource, Entropysoft, Del Mar, CA, http://www.thermofluids.net. Last accessed on: 06/06/2013 [7] Toyota, “2013 Camry Product Information.” [8] Toyota, “2013 Prius Product Information.”
[9] Part Load Pumping Losses In A Spark Ignited IC Engine. Mechadyne International, n.d. Web.
05 June 2013.
[10] Barcaro, Massimo Barcaro, Nicola Bianchi, and Freddy Magnussen. “PM Motors for
Hybrid Electric Vehicles.” The Open Fuels & Energy Science Journal. (2009): 135-141.Web. 5
June 2013.
[11] Cunningham, Wayne. “The Hybrid Premium: How much more does a hybrid car cost?”
CNET. 30 April 2012. Web. 6 June 2013.
[12] Gaylord, Chris. “Hybrid cars 101: How long should batteries last?” The Christian Science
Monitor. March 6, 2012. Web. 5 June 2013. Figure References

Internal Combustion Engine: Atkinson Cycle 45
[1f] http://www.grc.nasa.gov/WWW/k-12/airplane/Images/otto.gif
[2f] www.pbase.com [6f] http://www.mechadyne-int.com/vva-reference/part-load-pumping-losses-si-engine
[7f] http://www.mechadyne-int.com/vva-reference/part-load-pumping-losses-si-engine
[8f] http://2.bp.blogspot.com/-hMDv-
OdqWUI/UNnXbwEhzuI/AAAAAAAAC8c/VIQGVoAPoeA/s1600/Future-of-internal-
combustion-engine--.jpg

Internal Combustion Engine: Atkinson Cycle 46
Matlab Code
This code was used to compare the compression ratio to the heat in:
% Generates plot to compare compression ratio and Qin clear; clc; close all; % Loading air property table chart = load('chart.txt'); air1.t = chart(:,1); air1.h = chart(:,2); air1.pr = chart(:,3); air1.u = chart(:,4); air1.vr = chart(:,5); air1.s0 = chart(:,6); % Parameters Pow = [120 70]; RPM = [6000 3000]; er = 13; rat = (6:0.5:10)./13; cr = er.*rat; v = 27.4655; RG = 0.06855; % Thermodynamic analysis a.p1 = 1; a.t1 = 536.37; a.u1 = interp1(air1.t,air1.u,a.t1); a.vr1 = interp1(air1.t,air1.vr,a.t1); a.vr2 = a.vr1./cr; a.u2 = interp1(air1.vr,air1.u,a.vr2); a.m = v.*a.p1./(1545./28.97.*a.t1).*14.696./12.*rat; % Loops for the two cases for j=1:2; a.Pow = Pow(j)-44; a.W = a.Pow./RPM(j)./4*2./0.0235808867./a.m; % inital guess for iteration a.u4 = 255.5; qin = 426.1; x = [a.u4; qin]; % loops to solve for qin through iteration for i=1:length(cr); options = optimset('Display','iter','TolFun',10^(-10),'MaxIter',100);

Internal Combustion Engine: Atkinson Cycle 47
[x_sol0, fval] = fsolve(@(x) lceq(x, a.u2(i), a.u1, a.W(i), er), x, options); a.u4(i) = x_sol0(1); qin(i) = x_sol0(2); end a.t4 = interp1(air1.u,air1.t,a.u4); a.n = a.W./qin; Q = a.m.*qin; % generates plot showing compression ratio vs. Qin figure(j) hold on; plot(cr, Q) xlabel('compression ratio'); ylabel('Qin (btu)'); end
This code was used to analyze the cycles using the first law:
% Performs thermodynamic analysis on designs clear; clc; close all; % Loads air property tables chart = load('chart.txt'); air1.t = chart(:,1); air1.h = chart(:,2); air1.pr = chart(:,3); air1.u = chart(:,4); air1.vr = chart(:,5); air1.s0 = chart(:,6); % Engine parameters Pow = [100 70]; RPM = [6000 3000]; er = [10.4 10.4 13 13]; rat = [1 1 7.5/13 7.5/13]; cr = er.*rat; v = [37.99126 37.99126 27.4655 27.4655]; RG = 0.06855; % Ambient air conditions a.t0 = 536.37; a.p0 = 1; % Supercharger parameters a.Wsc = [0 60 0 60]; a.Nsc = 0.7;

Internal Combustion Engine: Atkinson Cycle 48
a.p1 = (a.Wsc.*a.Nsc.*0.4./1.4./RG./a.t0+1).^(1.4./0.4)*a.p0; a.t1s = a.t0.*(a.p1./a.p0).^(0.4./1.4); a.t1 = a.t0+(a.t1s-a.t0)./a.Nsc; a.u1 = interp1(air1.t,air1.u,a.t1); a.vr1 = interp1(air1.t,air1.vr,a.t1); a.vr2 = a.vr1./cr; a.u2 = interp1(air1.vr,air1.u,a.vr2); a.m = v.*a.p1./(1545./28.97.*a.t1).*14.696./12.*rat; % Loops for each case for j=1:2; a.Pow = Pow(j)-[0 0 44 0]; a.Wact = a.Pow./RPM(j)./4*2./0.0235808867./a.m; a.W = a.Wact+a.Wsc; % Initial guesses for iteration a.u4 = 255.5; qin = 426.1; x = [a.u4; qin]; % Loops to iterate for each design for i=1:4; options = optimset('Display','iter','TolFun',10^(-10),'MaxIter',100); [x_sol0, fval] = fsolve(@(x) lceq(x, a.u2(i), a.u1(i), a.W(i), er(i)), x, options); a.u4(i) = x_sol0(1); qin(i) = x_sol0(2); end a.t4 = interp1(air1.u,air1.t,a.u4); a.n = a.Wact./qin; end
This code is the solver function called by the previous two codes:
% Function with equations to solve for qin and u4 function [F] = lceq(x, u2, u1, W, er) chart = load('chart.txt'); u = chart(:,4); vr = chart(:,5); % sort uknowns u4 = x(1); qin = x(2); % equations for each case to be set to zero

Internal Combustion Engine: Atkinson Cycle 49
f1 = qin - u4 + u1 - W; f2 = u4 - interp1(vr,u,er*interp1(u,vr,qin+u2)); F = [f1, f2]; F = [real(F); imag(F)]; return