intermediate course in food dehydration and drying chapter 5: drying … · 2018-08-31 ·...
TRANSCRIPT

____________________________________________________________________________________
Intermediate Course in Food Dehydration and Drying Chapter 5: Page 1.
INTERMEDIATE COURSE IN FOOD DEHYDRATION AND DRYING
CHAPTER 5: DRYING CURVES
5.1 Introduction
We have now familiarized ourselves witha number of aspects involved in thedrying of food products. We haveexamined the basics of drying, wet anddry basis moistures, drying mechanisms,and the thermal properties of foodmaterials being dried. Using thisknowledge, we have performedcalculations of the amount of heat thatwould be required to dry a specific weightof product under a given set of dryingconditions.
Before we proceed to look at the varioustypes of dryers that are available, I wouldlike to examine methods of handlinginformation obtained from drying tests.This information will provide you with anunderstanding of how a material dries andwill assist you in determining how youmight want to approach the commercialscale drying of that material. Once theinformation from a drying test run hasbeen gathered, it can be organized andused to compile a series of graphs whichwe refer to as “drying curves”.
Drying curves are very useful inunderstanding the “kinetics” of how aparticular product dries under a specificset of conditions. Basically what thismeans is that you will know how thedrying process changes over the time thematerial is being dried. Very wet productwill certainly dry differently than the samematerial when it has a lower watercontent. Drying curves will alert you tothe changes that are taking place and will
allow you to adjust the drying processaccordingly.
A personal observation that I have madein the field of food product drying is thatmost dryer operators want to treat theproduct as if it were something like wetchunks of broken stone, or some otherequally as indestructible material. Theyfail to realize that most food products arerather delicate and require a great deal ofcare when reducing their moisturecontent. These operators use theapproach that all you have to do is get asmuch heat into the product as rapidly aspossible and you can keep pushingproduct through the dryer. The result ofthis fallacy is that they end up withproduct toasted or burnt on the outsideand wet in the middle. However, theaverage moisture most frequently meetstheir target specifications.
Keep in mind that you cannot speed upthe drying process of many food productswithout doing serious harm to their qualityand appearance. Knowing how yourproduct responds to the input of heat overthe course of the drying process is criticalfor achieving the desired quality andfinished product performance.
____________________________________________________________________________________
Intermediate Course in Food Dehydration and Drying Chapter 5: Page 2.
5.2 What Are Drying Curves?
Drying curves are generally graphs of themoisture of a food product versus time, orplots of the rate of water removal versustime. However, there are some ways ofmanipulating the drying information whichyou have that are more informative andenlightening than others.
Perhaps the best way to study this topic isthrough the use of a Case Study.
5.3 Case Study #3: Drying Curve Exercise
5.3.1 Drying Scenario
A food processor wanted to dry appleslices for use in a snack product. Fearingthat improper drying of the apple slices inan actual production dryer would result inlarge amounts of wasted product, theprocessor decided to do a some smallpilot-scale or bench-scale tests.
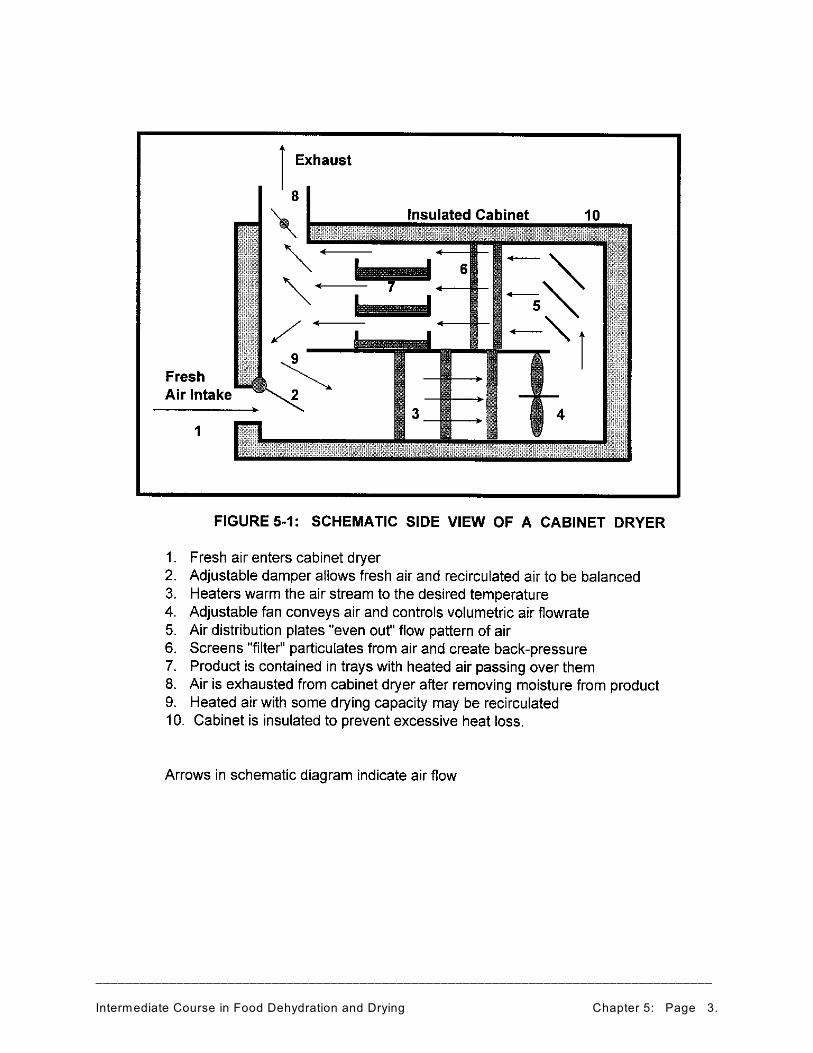
For these tests, a small cabinet dryer wasused as shown in Figure 5-1. Cabinetdryers offer a great degree of flexibilityand require only a small amount ofproduct.
After a few failed attempts, the processorfinally obtained the desired quality in thedried apple slices. Data from thesuccessful pilot-scale run were thenanalysed to determine how the productwas behaving under these dryingconditions.
It should be noted here that by using onlysmall amounts of the apple slices in thesmall cabinet dryer rather than doing thetests on a large production-scale dryer, agreat deal of expense was avoided. Thelarge dryers require much greaterquantities of raw materials and a largeamounts of waste product can beproduced while trying to identify the bestdrying conditions.
When doing drying tests such as these,you may often learn more from your“failures” than you do from your“successes”. In designing a set of testruns, you may need to push the limits ofyour drying to determine the conditionsunder which the final dried product fails tomeet your finished product specifications.By knowing the drying conditions underwhich your tests fail, you can set up adryer operating strategy that avoids theseundesirable conditions and stays withinwhat you consider to be a safe range ofdrying conditions.
____________________________________________________________________________________
Intermediate Course in Food Dehydration and Drying Chapter 5: Page 3.
____________________________________________________________________________________
Intermediate Course in Food Dehydration and Drying Chapter 5: Page 4.
5.3.2 Dryer Operating Data
We will only concern ourselves here witha portion of the data obtained. We willnot worry about air velocities and relativehumidities etc.
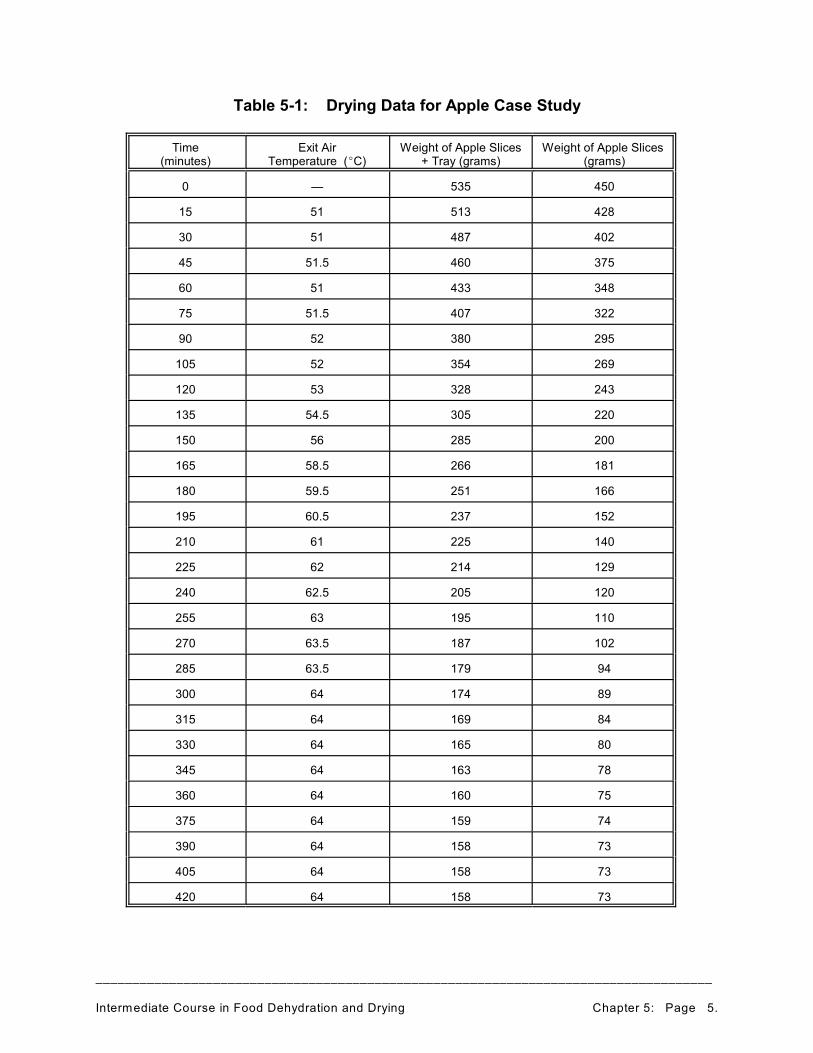
In our exercise, 450 g of apple slices withan initial moisture content of 84.4% (wetbasis) were placed in the dryer .
The air was heated to 65EC in the dryerand then blown through the dryingchamber containing the apple slices. Theapple slices were placed on a small wiremesh rack suspended from a balancemounted on top of the dryer for weighingthe sample. The weight of the wire meshrack was determined to be 85 gramsbefore the apple slices were placed on it.
The weight of the apple slices and thewire mesh rack were recorded every 15minutes throughout the course of the trial.By subtracting the weight of the rack (85g) from the total weight, the weight of theapple slices could be found. In addition,
the temperature of the exit air leaving thedryer was recorded. This information ispresented in Table 5-1. I have personallydone numerous test runs with differenttypes of small dryers (including solardryers which take the energy of the sunas their heat source) and have used thisbasic approach each time.
____________________________________________________________________________________
Intermediate Course in Food Dehydration and Drying Chapter 5: Page 5.
Table 5-1: Drying Data for Apple Case Study
Time(minutes)
Exit AirTemperature (EC)
Weight of Apple Slices+ Tray (grams)
Weight of Apple Slices (grams)
0 — 535 450
15 51 513 428
30 51 487 402
45 51.5 460 375
60 51 433 348
75 51.5 407 322
90 52 380 295
105 52 354 269
120 53 328 243
135 54.5 305 220
150 56 285 200
165 58.5 266 181
180 59.5 251 166
195 60.5 237 152
210 61 225 140
225 62 214 129
240 62.5 205 120
255 63 195 110
270 63.5 187 102
285 63.5 179 94
300 64 174 89
315 64 169 84
330 64 165 80
345 64 163 78
360 64 160 75
375 64 159 74
390 64 158 73
405 64 158 73
420 64 158 73
____________________________________________________________________________________
Intermediate Course in Food Dehydration and Drying Chapter 5: Page 6.
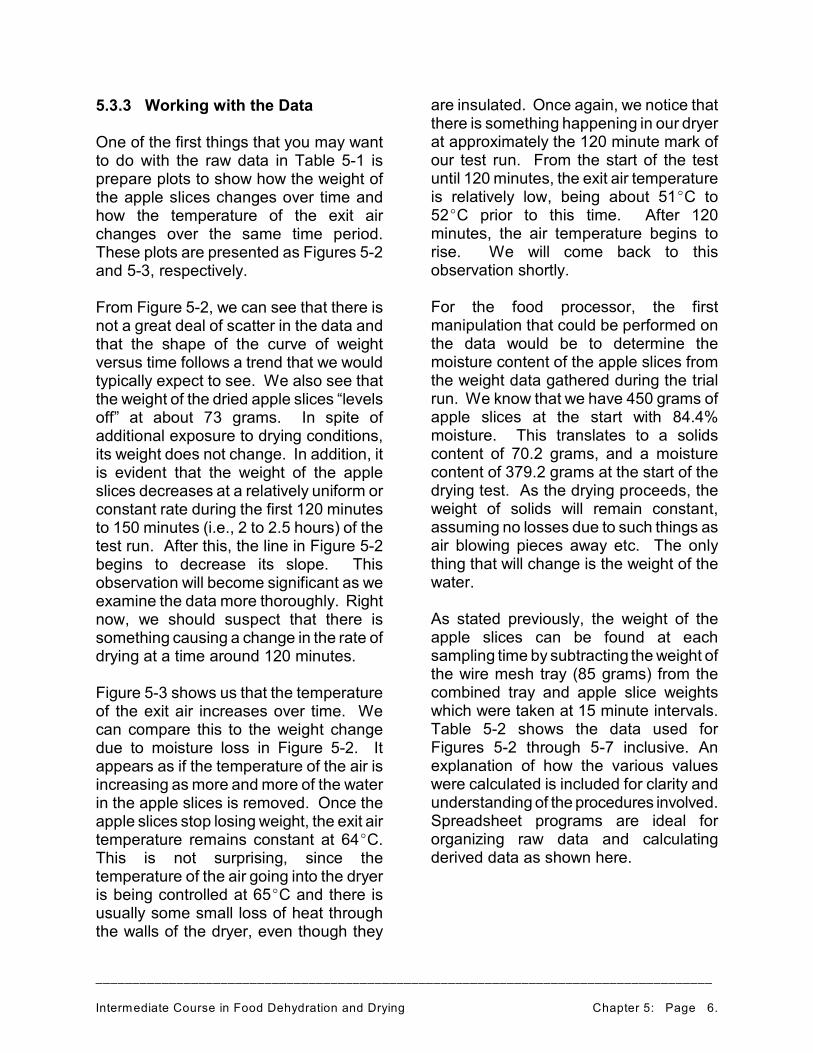
5.3.3 Working with the Data
One of the first things that you may wantto do with the raw data in Table 5-1 isprepare plots to show how the weight ofthe apple slices changes over time andhow the temperature of the exit airchanges over the same time period.These plots are presented as Figures 5-2and 5-3, respectively.
From Figure 5-2, we can see that there isnot a great deal of scatter in the data andthat the shape of the curve of weightversus time follows a trend that we wouldtypically expect to see. We also see thatthe weight of the dried apple slices “levelsoff” at about 73 grams. In spite ofadditional exposure to drying conditions,its weight does not change. In addition, itis evident that the weight of the appleslices decreases at a relatively uniform orconstant rate during the first 120 minutesto 150 minutes (i.e., 2 to 2.5 hours) of thetest run. After this, the line in Figure 5-2begins to decrease its slope. Thisobservation will become significant as weexamine the data more thoroughly. Rightnow, we should suspect that there issomething causing a change in the rate ofdrying at a time around 120 minutes.
Figure 5-3 shows us that the temperatureof the exit air increases over time. Wecan compare this to the weight changedue to moisture loss in Figure 5-2. Itappears as if the temperature of the air isincreasing as more and more of the waterin the apple slices is removed. Once theapple slices stop losing weight, the exit airtemperature remains constant at 64EC.This is not surprising, since thetemperature of the air going into the dryeris being controlled at 65EC and there isusually some small loss of heat throughthe walls of the dryer, even though they
are insulated. Once again, we notice thatthere is something happening in our dryerat approximately the 120 minute mark ofour test run. From the start of the testuntil 120 minutes, the exit air temperatureis relatively low, being about 51EC to52EC prior to this time. After 120minutes, the air temperature begins torise. We will come back to thisobservation shortly.
For the food processor, the firstmanipulation that could be performed onthe data would be to determine themoisture content of the apple slices fromthe weight data gathered during the trialrun. We know that we have 450 grams ofapple slices at the start with 84.4%moisture. This translates to a solidscontent of 70.2 grams, and a moisturecontent of 379.2 grams at the start of thedrying test. As the drying proceeds, theweight of solids will remain constant,assuming no losses due to such things asair blowing pieces away etc. The onlything that will change is the weight of thewater.
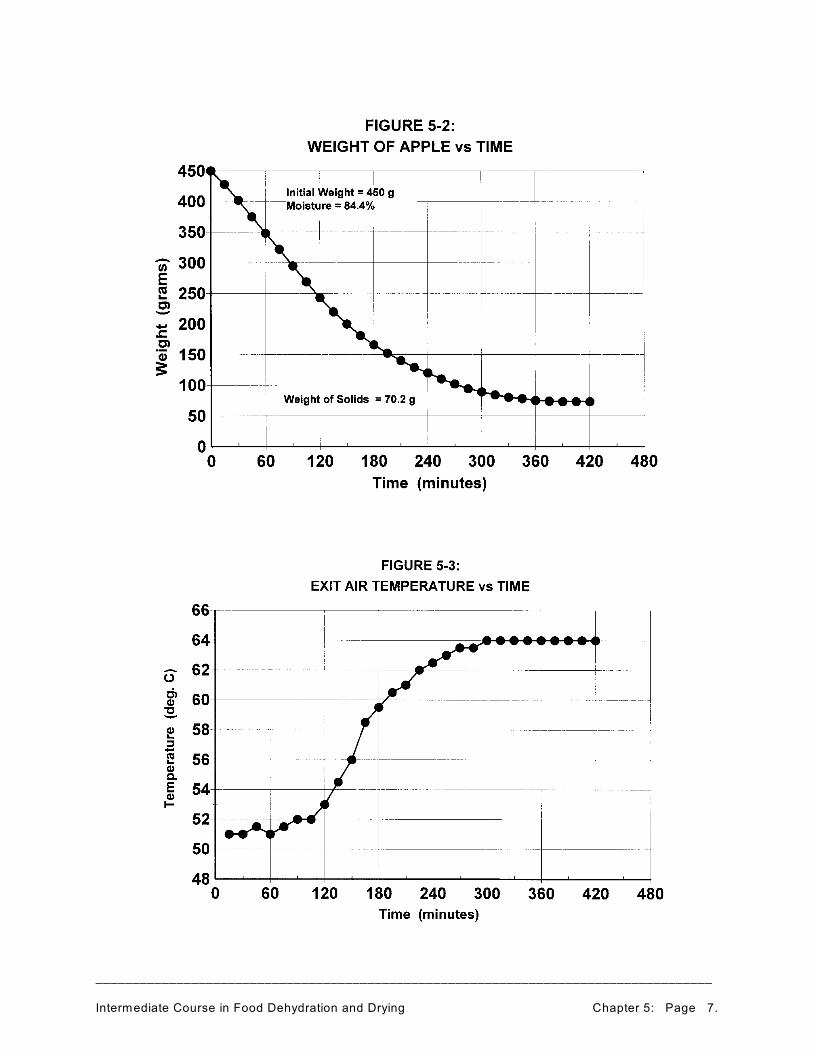
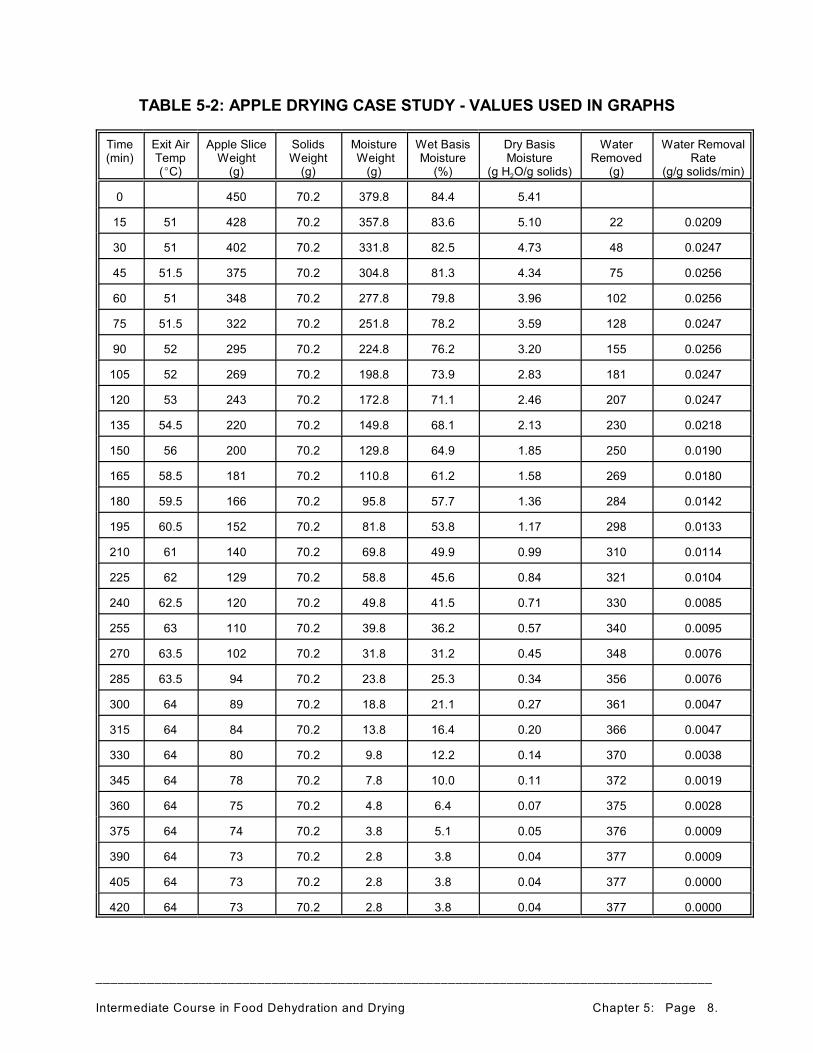
As stated previously, the weight of theapple slices can be found at eachsampling time by subtracting the weight ofthe wire mesh tray (85 grams) from thecombined tray and apple slice weightswhich were taken at 15 minute intervals.Table 5-2 shows the data used forFigures 5-2 through 5-7 inclusive. Anexplanation of how the various valueswere calculated is included for clarity andunderstanding of the procedures involved.Spreadsheet programs are ideal fororganizing raw data and calculatingderived data as shown here.
____________________________________________________________________________________
Intermediate Course in Food Dehydration and Drying Chapter 5: Page 7.
____________________________________________________________________________________
Intermediate Course in Food Dehydration and Drying Chapter 5: Page 8.
TABLE 5-2: APPLE DRYING CASE STUDY - VALUES USED IN GRAPHS
Time(min)
Exit AirTemp(EC)
Apple SliceWeight
(g)
SolidsWeight
(g)
Moisture Weight
(g)
Wet BasisMoisture
(%)
Dry BasisMoisture
2(g H O/g solids)
WaterRemoved
(g)
Water RemovalRate
(g/g solids/min)
0 450 70.2 379.8 84.4 5.41
15 51 428 70.2 357.8 83.6 5.10 22 0.0209
30 51 402 70.2 331.8 82.5 4.73 48 0.0247
45 51.5 375 70.2 304.8 81.3 4.34 75 0.0256
60 51 348 70.2 277.8 79.8 3.96 102 0.0256
75 51.5 322 70.2 251.8 78.2 3.59 128 0.0247
90 52 295 70.2 224.8 76.2 3.20 155 0.0256
105 52 269 70.2 198.8 73.9 2.83 181 0.0247
120 53 243 70.2 172.8 71.1 2.46 207 0.0247
135 54.5 220 70.2 149.8 68.1 2.13 230 0.0218
150 56 200 70.2 129.8 64.9 1.85 250 0.0190
165 58.5 181 70.2 110.8 61.2 1.58 269 0.0180
180 59.5 166 70.2 95.8 57.7 1.36 284 0.0142
195 60.5 152 70.2 81.8 53.8 1.17 298 0.0133
210 61 140 70.2 69.8 49.9 0.99 310 0.0114
225 62 129 70.2 58.8 45.6 0.84 321 0.0104
240 62.5 120 70.2 49.8 41.5 0.71 330 0.0085
255 63 110 70.2 39.8 36.2 0.57 340 0.0095
270 63.5 102 70.2 31.8 31.2 0.45 348 0.0076
285 63.5 94 70.2 23.8 25.3 0.34 356 0.0076
300 64 89 70.2 18.8 21.1 0.27 361 0.0047
315 64 84 70.2 13.8 16.4 0.20 366 0.0047
330 64 80 70.2 9.8 12.2 0.14 370 0.0038
345 64 78 70.2 7.8 10.0 0.11 372 0.0019
360 64 75 70.2 4.8 6.4 0.07 375 0.0028
375 64 74 70.2 3.8 5.1 0.05 376 0.0009
390 64 73 70.2 2.8 3.8 0.04 377 0.0009
405 64 73 70.2 2.8 3.8 0.04 377 0.0000
420 64 73 70.2 2.8 3.8 0.04 377 0.0000
____________________________________________________________________________________
Intermediate Course in Food Dehydration and Drying Chapter 5: Page 9.
By definition, the Wet Basis Moisture ofa product is:
Weight of water x 100% Total weight of material
Dividing the weight of water in the appleslices at each sampling time by theweight of the wet apple slices at that timewill give us the wet basis moisture.
We can find the weight of water presentin the apple slices at each sampling pointby subtracting the weight of solids (i.e.,70.2 grams) from the total weight of thesample at that time.
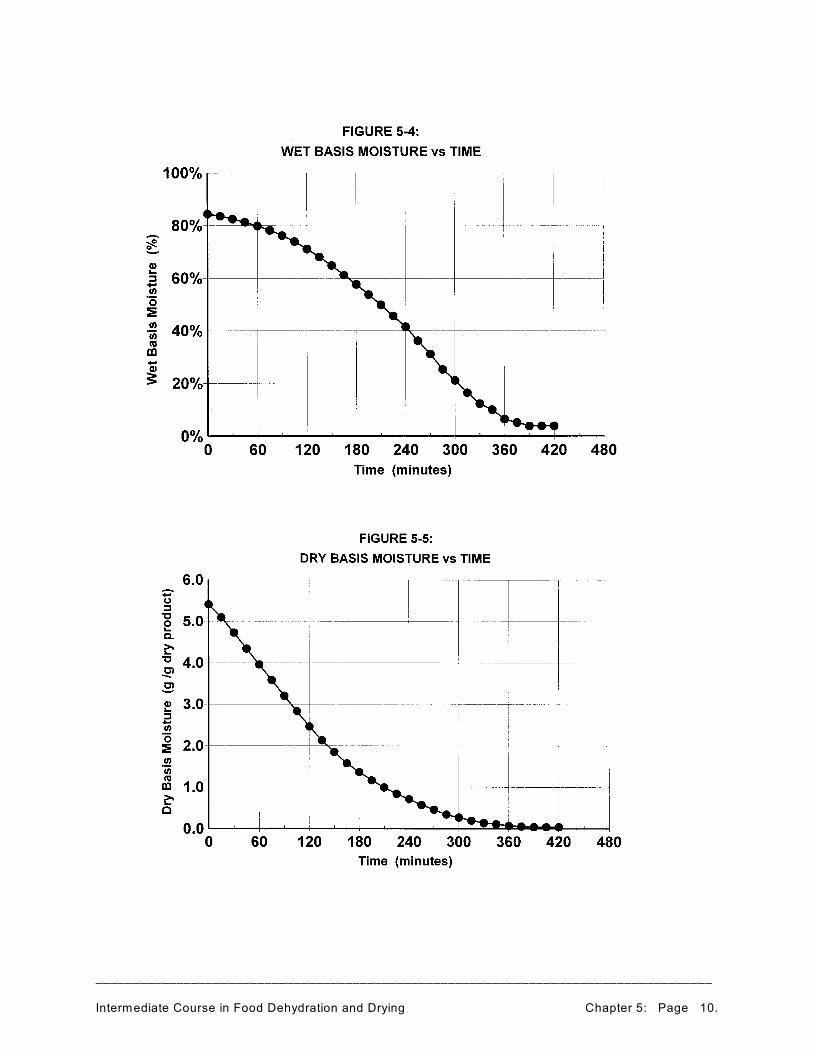
Wet basis moistures are plotted againsttime in Figure 5-4. However, there isnothing that really stands out and grabsour attention in this graph.
Even though we have calculated the wetbasis moisture, it is the dry basis moisturewhich tends to be more informative.
By definition, the Dry Basis Moisture ofa product is:
Weight of water Weight of dry solids present
= grams water / gram dry solid (or other appropriate weight units)
We have already determined the weightof water present in the apples at each 15minute interval. We can divide it by theweight of solids (i.e., 70.2 grams) presentin the sample at that time to get the drybasis moisture.
Dry basis moistures are plotted againsttime in Figure 5-5.
Figure 5-5 is remarkably similar in shape
to Figure 5-2. This is due to the fact thatthey are both based on a constant weightof dry solids. We can observe the sametrends in Figure 5-5 as we did in Figure 5-2 with respect to the slope of the curvebeing constant or linear up until about120 to 150 minutes in the trial run andthen becoming less and less as time goeson after that.
The most revealing information for theprocessor will be obtained by determininghow fast the water is removed from theapple as the drying progresses. Todetermine the rate of water removal, wecould take the slope of tangents to thecurve of dry basis moisture versus time(Figure 5-5), or we could use the raw dataand do some calculations.
The dimensions associated with the rateof water removal will be:
“grams of water per gram of drymaterial per minute”
Other appropriate dimensions of weightand time could also be used.
To calculate the water removal rate fromthe observed data, we will first determinehow much water is removed in each 15minute period between sample weighings.For example, 22 grams of water werecalculated to have been removed duringthe first 15 minutes of the drying process.Dividing this value by the number ofgrams of solids present (i.e., 70.2 g) aswell as the number of minutes that it tookto remove this amount of water (i.e., 15minutes), will give the following:
____________________________________________________________________________________
Intermediate Course in Food Dehydration and Drying Chapter 5: Page 10.
____________________________________________________________________________________
Intermediate Course in Food Dehydration and Drying Chapter 5: Page 11.
Water removal rate =
22 g water removed | |
| 70.2 g solids | 15 min
= 0.0209 g water / g solid / minute
or: 0 .0209 grams of water areremoved from each gram of drysolid material per minute
In the time interval from 15 minutes to 30minutes, an additional 26 grams of waterwere removed (i.e., 48 g water loss at 30minutes minus the 22 gram water loss at15 minutes). Dividing this water loss bythe weight of dry solids and the 15minutes time that it took to evaporate the26 grams of water gives us a waterremoval rate of 0.0247 grams of waterremoved per gram of dry solids perminute.
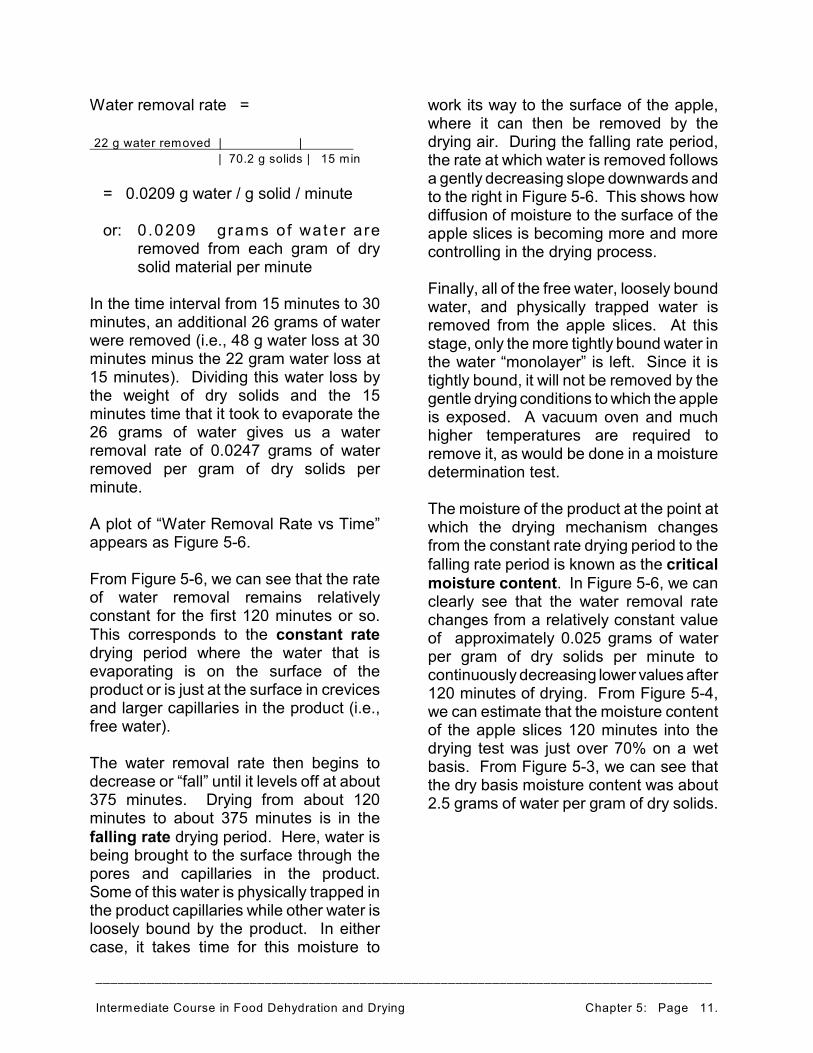
A plot of “Water Removal Rate vs Time”appears as Figure 5-6.
From Figure 5-6, we can see that the rateof water removal remains relativelyconstant for the first 120 minutes or so.This corresponds to the constant ratedrying period where the water that isevaporating is on the surface of theproduct or is just at the surface in crevicesand larger capillaries in the product (i.e.,free water).
The water removal rate then begins todecrease or “fall” until it levels off at about375 minutes. Drying from about 120minutes to about 375 minutes is in thefalling rate drying period. Here, water isbeing brought to the surface through thepores and capillaries in the product.Some of this water is physically trapped inthe product capillaries while other water isloosely bound by the product. In eithercase, it takes time for this moisture to
work its way to the surface of the apple,where it can then be removed by thedrying air. During the falling rate period,the rate at which water is removed followsa gently decreasing slope downwards andto the right in Figure 5-6. This shows howdiffusion of moisture to the surface of theapple slices is becoming more and morecontrolling in the drying process.
Finally, all of the free water, loosely boundwater, and physically trapped water isremoved from the apple slices. At thisstage, only the more tightly bound water inthe water “monolayer” is left. Since it istightly bound, it will not be removed by thegentle drying conditions to which the appleis exposed. A vacuum oven and muchhigher temperatures are required toremove it, as would be done in a moisturedetermination test.
The moisture of the product at the point atwhich the drying mechanism changesfrom the constant rate drying period to thefalling rate period is known as the criticalmoisture content. In Figure 5-6, we canclearly see that the water removal ratechanges from a relatively constant valueof approximately 0.025 grams of waterper gram of dry solids per minute tocontinuously decreasing lower values after120 minutes of drying. From Figure 5-4,we can estimate that the moisture contentof the apple slices 120 minutes into thedrying test was just over 70% on a wetbasis. From Figure 5-3, we can see thatthe dry basis moisture content was about2.5 grams of water per gram of dry solids.
____________________________________________________________________________________
Intermediate Course in Food Dehydration and Drying Chapter 5: Page 12.
____________________________________________________________________________________
Intermediate Course in Food Dehydration and Drying Chapter 5: Page 13.
The change from constant rate drying tofalling rate drying was what gave us thetemperature change in the air leaving thedryer as shown in Figure 5-3. Sinceevaporation of water was not as rapidafter the constant rate drying periodended, there was not as muchevaporative cooling of the air in the dryerbecause not as much heat was requiredper unit time to remove the moisture fromthe product. This change in the dryingmechanism is also what is responsible forthe change in the rate of weight changenoticed in Figure 5-2. You can see howthe slope of the curve in Figure 5-2changes at approximately 120 minutes ofdrying time, which is when we have thechange to the falling rate drying periodfrom the constant rate drying period.
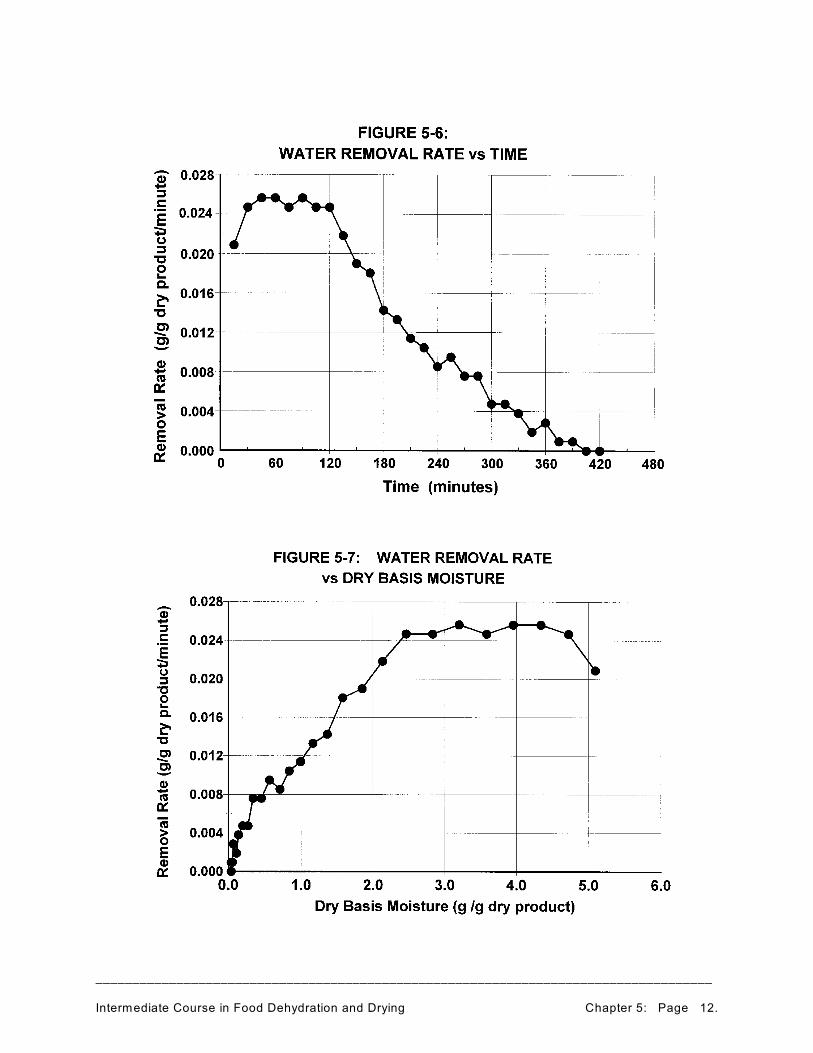
In Figure 5-7, we have plotted the waterremoval rate against the dry basismoisture of the product. This is aninteresting, although at times somewhatconfusing curve. The easiest way to readit is to start at the right side and work yourway towards the left. In this way, we cansee that when the water content is at itshighest, the water removal rate isconstant. At a certain point (i.e., about 2.4or 2.5 g water per g dry product) the waterremoval rate begins to fall. It drops untilthe moisture content is extremely low.This clearly shows us the criticalmoisture content as a dry basis moisturevalue.
In summary, Figure 5-6 and Figure 5-7 arethe two drying curves that allow us to mostclearly understand the apple dryingoperation. From Figure 5-6, we can seethat after 120 minutes drying shifts fromits constant rate period to its falling rateperiod. From Figure 5-7, we can tell thatthe constant rate period ends when themoisture content of the apple slices hits
about 2.5 g water per g dry product.
We then know that during the initial 120minutes of drying, water removal isprimarily from the surface of the appleslices. However, after 120 minutes,moisture is being pulled from inside theapple slices. If we heat the apple tooharshly during the falling rate period, theapple material could be damagedseverely. Therefore, we must tailor ourdrying process to address the dryingmechanism that is occurring within theapple itself. This could be done with amultiple zone continuous belt dryer thathas higher temperatures in the first zoneand lower temperatures in subsequentzones (more on this later). We could alsodesign a dryer that had different zonelengths to accommodate the variousdrying periods.
We can see in Table 5-2, that the watercontent of the apple slices at 120 minuteswas 71.1% wet basis moisture or 2.46grams of water per gram of dry solids drybasis moisture.
Therefore, in our drying work, we wouldneed to be aware of the critical moisturecontent of the apple slices being about71% wet basis moisture and we wouldhave to control our drying and theapplication of heat accordingly.
From Figures 5-4 , 5-5, and 5-6, we canalso see that drying the product beyond375 or 390 minutes will not give us anyadditional advantages. Therefore, wecould stop the drying process at this point.Figures 5-4 and 5-5 show no change inthe wet or dry basis moisture content ofthe apples after this time; and Figure 5-6indicates that the water removal rate isessentially “zero” beyond this time.
____________________________________________________________________________________
Intermediate Course in Food Dehydration and Drying Chapter 5: Page 14.
5.4 Caveats in Scaling up
BEWARE: Every caution must be takenin “scaling up” the apple dryer based onthe data generated in the cabinet dryertests.
Even though tests have been done todetermine the drying characteristics of theproduct being dried, there are otherfactors that play a major role in drying.Many of these factors can change as youscale up a dryer from a small unit to alarger size.
The following factors must be considered:
C bed loading characteristics C thickness C uniformity C permeability C changes during drying C throughput rates C etc.
C air distribution patterns
C product attributes C uniformity C seasonal variation C apple varietal differences C etc.
Once the conditions from the cabinetdryer have been established that bestmeet the needs of the processor,expanded testing should be consideredbefore committing to a larger dryer. Suchtests might be done on a small-scale beltdryer at a dryer manufacturer’s testingfacility. The dryer manufacturer wouldthen be able to offer advice on the finalscale-up to a production-scale unit.
Do not think that just because you knowhow your product behaves in a small dryerthat you will know how it behaves in alarger dryer. If you do fall into this trap,you may be setting yourself up for a nastyor unpleasant surprise later when youattempt to go into commercial production.
____________________________________________________________________________________
Intermediate Course in Food Dehydration and Drying Chapter 5: Page 15.
5.5 Practice Problems (with answers)
Question 1:
If a sample contains 10.5 grams of waterper gram of dry solids at the start of adrying process and after 3 hours of drying,its moisture content is down to 2.7 gramsof water per gram of dry solids, what is itsrate of water loss? Express your answerin units of grams of water per gram of drysolids per minute.
Answer: 0.043 grams of water per gramof dry solids per minute.
Question 2:
A sample of apple starts out at 84%moisture. Two hours later its moisture is75%. What is the rate of moistureremoval? Express your answer in units ofgrams of water per gram of dry solids perminute and grams of water per gram ofdry solids per hour.
Answer: 0.0188 grams of water per gramof dry solids per minute; or 1.125 grams ofwater per gram of dry solids per hour.
Be sure to convert the percent moisturesto a dry basis as the first steps in yourcalculations. Then take the differences inthe water content and divide by the time inthe appropriate units.
Question 3:
2.5 kg of tomatoes with a moisture contentof 93% by weight are dried in the sun.After 6 hours, they weigh 0.70 kg. What isthe final moisture content on a wet basis,and on a dry basis? How fast was themoisture removed ? Express the answerto the last part of the question as “gramsof water per gram of dry solids per hour”.
Answer: After six hours, the wet basismoisture content = 75%, and the dry basismoisture content = 3.0 g water per gramof dry solids.
Water removal rates:0.0286 grams of water per gram of drysolids per minute or 1.714 grams of waterper gram of dry solids per hour.
In your calculations, you need todetermine the weights of solids and waterat the start of the drying (0.175 kg solidsand 2.325 kg water). After drying, 0.175kg of solids would still be present. Of the0.70 kg of dried tomatoes, 0.525 kg wouldbe water (i.e., 0.70 kg - weight of the drysolids). The percent moisture on a wetbasis would be the weight of the water(i.e., 0.525 kg) divided by the total weight(i.e., 0.70 kg) times 100%. For the waterremoval rates, you remove 1.800 kg ofwater (i.e., weight of water at the start -weight of water at the end) from 0.175 kgof solids in 6 hours.
____________________________________________________________________________________
Intermediate Course in Food Dehydration and Drying Chapter 6: Page 1.
INTERMEDIATE COURSE IN FOOD DEHYDRATION AND DRYING
CHAPTER 6: TYPES OF DRYERS
6.1 Introduction:
Drying is an incredibly diverse activitycovering a wide variety of applications andproducts. As a result, many differenttypes of dryers are now available for foodprocessing and other applications. Inaddition, there are several new conceptsbeing developed that address highlyspecific needs for specialized dryingapplications.
The purpose of this chapter is to introducea number of these dryers to you and giveyou a brief overview of how they operateas well as their areas of application. It iscertainly beyond the scope of a coursesuch as this to provide detailedinformation regarding any individual typeof dryer.
We will begin by looking at variousmethods of applying heat to foodmaterials, and sources of heat commonlyused. Then we will look at batch andcontinuous methods of drying. Followingthis, we will discuss airflow in dryers,before we begin to look at individual typesof dryers. While we are examining thetypes of dryers, please keep in mind thatdevelopments are always happening inthe areas of design and operation. Wecannot possibly provide a in-depthexamination of each type of dryer. Forthis reason, you should consult othersources, such as the Internet andespecially dryer suppliers, for any detailsthat you may require for your particularapplications.
6.2 Direct and Indirect Heating
A key feature that separates oneclassification of dryers from another is themethod by which heat is delivered to theproduct being dried. Even freeze dryersutilize some heat in combination with avacuum at low temperatures to dryproducts.
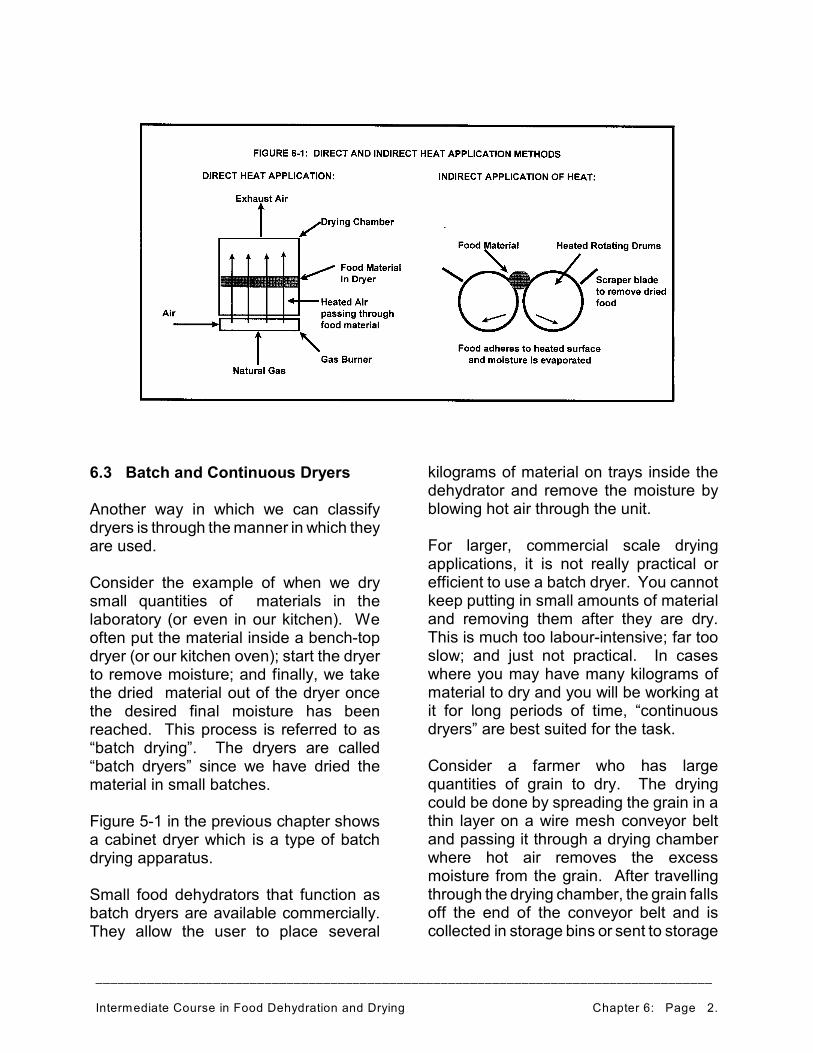
The most common method of deliveringheat to materials in a dryer is referred toas “direct” heating. Here, the dryingmedium is air which has been heated priorto entering the drying chamber. It may beheated by passing it through the flames ofa burner (such as a natural gas burner,etc.), or by passing it across heated metalsurfaces where it picks up heat which itthen carries and transfers to the materialbeing dried.
There may be cases where it is notsuitable to dry materials with the directapplication of heat from hot air. In theseinstances, the product may be broughtinto contact with heated surfaces and theheat can then be transferred to thematerial in this manner. Hot surfacessuch as those on the outside of rotatingmetal “drums” with steam circulatingthrough them are one method of indirectheating that may be used.
Figure 6-1 shows diagrams of direct andindirect heating for a food material in twotypes of dryers.
____________________________________________________________________________________
Intermediate Course in Food Dehydration and Drying Chapter 6: Page 2.
6.3 Batch and Continuous Dryers
Another way in which we can classifydryers is through the manner in which theyare used.
Consider the example of when we drysmall quantities of materials in thelaboratory (or even in our kitchen). Weoften put the material inside a bench-topdryer (or our kitchen oven); start the dryerto remove moisture; and finally, we takethe dried material out of the dryer oncethe desired final moisture has beenreached. This process is referred to as“batch drying”. The dryers are called“batch dryers” since we have dried thematerial in small batches.
Figure 5-1 in the previous chapter showsa cabinet dryer which is a type of batchdrying apparatus.
Small food dehydrators that function asbatch dryers are available commercially.They allow the user to place several
kilograms of material on trays inside thedehydrator and remove the moisture byblowing hot air through the unit.
For larger, commercial scale dryingapplications, it is not really practical orefficient to use a batch dryer. You cannotkeep putting in small amounts of materialand removing them after they are dry.This is much too labour-intensive; far tooslow; and just not practical. In caseswhere you may have many kilograms ofmaterial to dry and you will be working atit for long periods of time, “continuousdryers” are best suited for the task.
Consider a farmer who has largequantities of grain to dry. The dryingcould be done by spreading the grain in athin layer on a wire mesh conveyor beltand passing it through a drying chamberwhere hot air removes the excessmoisture from the grain. After travellingthrough the drying chamber, the grain fallsoff the end of the conveyor belt and iscollected in storage bins or sent to storage

____________________________________________________________________________________
Intermediate Course in Food Dehydration and Drying Chapter 6: Page 3.
silos for later use. Many industries usecontinuous dryers in their processes dueto their convenience, reliability, and waterremoving capabilities.
Figure 6-2 shows a diagram of acontinuous belt dryer.
____________________________________________________________________________________
Intermediate Course in Food Dehydration and Drying Chapter 6: Page 4.
6.4 Airflow in Dryers
Air is probably the most commonly useddrying medium in the food processingindustry.
Before we begin to examine the differenttypes of dryers available for variousapplications, it would be a good idea tolook at the ways in which air can beintroduced into the dryers.
If you look at the continuous belt dryershown in Figure 6-2, you can see that theheated air is being introduced into thebottom of the dryer and travels upwardsthrough the bed of material being dried.This is referred to as “updraft”. The airthen exits through the top of the dryer.The exhaust air is cooler and containsmore moisture than the air entering thedryer because it has given up some of itsheat to evaporate the moisture from thematerial in the dryer. Having air flowingupwards through the bed of material is agood way of avoiding problemsencountered with soft wet products. If theair was flowing downwards through thematerial, it could literally push the softmaterial into the wire mesh of theconveyor belt where it would dry andharden. In a very short time, the beltwould become plugged and no air couldflow through it to dry the product. With airtravelling in the upward direction, the wetmaterial is dried on the bottom of the bedwhich may harden it slightly and prevent itfrom being mashed into the wire mesh ofthe conveyor belt.
Once the bottom portion of the materialhas been dried somewhat, the flow of aircan be directed downwards to dry the topportion of the product bed. This“downdraft” can be accomplished byhaving the conveyor belt pass through
various “zones” in a dryer. The zones areseparated by walls or partitions in thedryer. More information regarding dryerzones will be presented later in thischapter.
In cases where very light fluffy productsare being dried, it might not be desirableto have air flowing in the upward directionsince this may blow the product aroundinside the dryer. Care must be taken tomatch the direction of air flow to thematerial being dried.
There may also be cases when it is notdesirable to have updraft or downdraftflow of air in a dryer. You may want tohave the air flowing along or across thesurface of the material in the dryer. Thereare several different options available thatmay be used. We will look at each one ofthese options in turn.
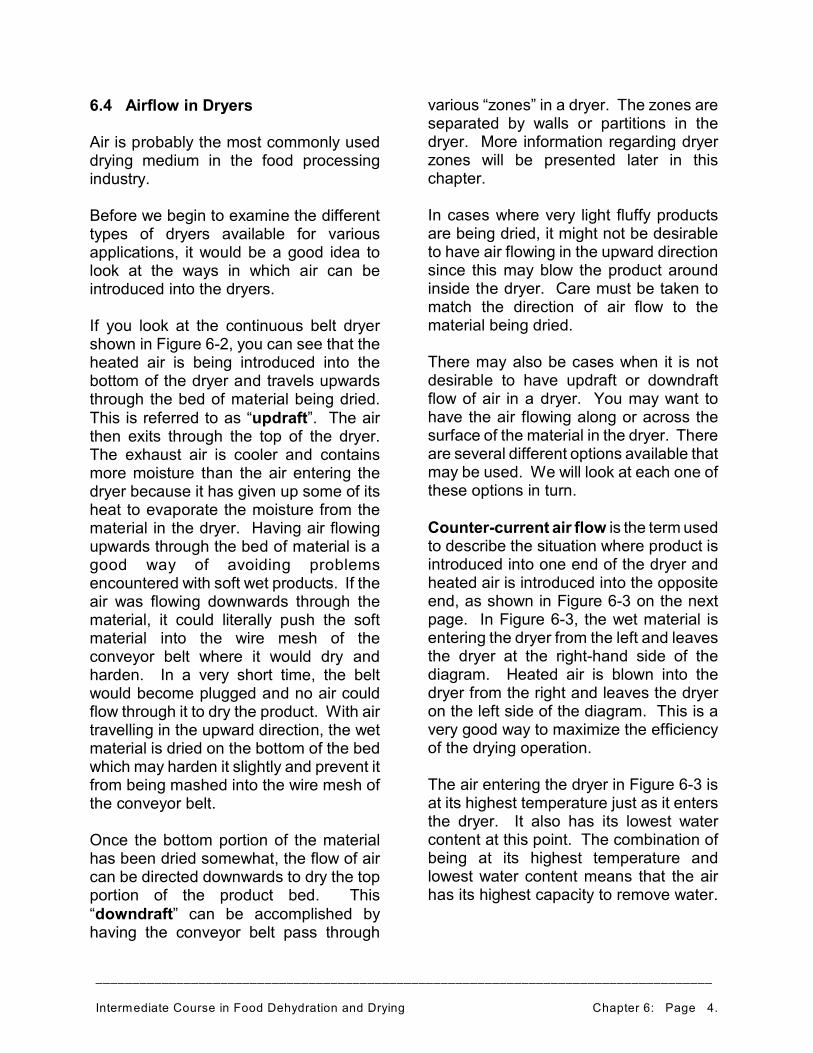
Counter-current air flow is the term usedto describe the situation where product isintroduced into one end of the dryer andheated air is introduced into the oppositeend, as shown in Figure 6-3 on the nextpage. In Figure 6-3, the wet material isentering the dryer from the left and leavesthe dryer at the right-hand side of thediagram. Heated air is blown into thedryer from the right and leaves the dryeron the left side of the diagram. This is avery good way to maximize the efficiencyof the drying operation.
The air entering the dryer in Figure 6-3 isat its highest temperature just as it entersthe dryer. It also has its lowest watercontent at this point. The combination ofbeing at its highest temperature andlowest water content means that the airhas its highest capacity to remove water.
____________________________________________________________________________________
Intermediate Course in Food Dehydration and Drying Chapter 6: Page 5.
This is also the point where it is mostdifficult to remove moisture from theproduct which is almost finished beingdried, but is in its falling rate drying periodwhere diffusion is slow .
As the air travels to the left of the dryer inFigure 6-3, it continues to lose heat as itevaporates moisture. As it is leaving thedryer at the left-hand side of the diagram,it still has sufficient heat to warm theincoming cool wet material. At this point,the air has its lowest water removalcapacity, but since it is in contact with verywet product, it may still be able to pick upsome moisture before it leaves the dryer.
While counter-current air flow maximizesthe driving forces of temperature andmoisture difference between the air andthe material being dried, it may pose aproblem in some applications. For thisreason, we should consider co-current airflow.
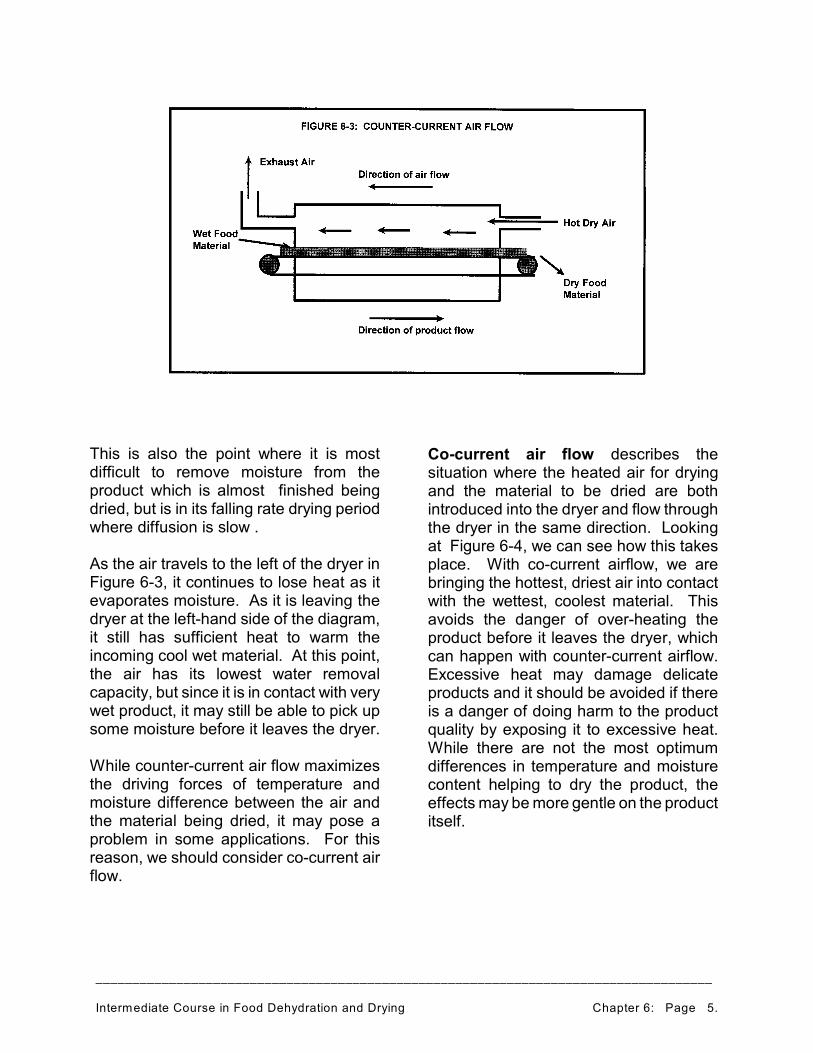
Co-current air flow describes thesituation where the heated air for dryingand the material to be dried are bothintroduced into the dryer and flow throughthe dryer in the same direction. Lookingat Figure 6-4, we can see how this takesplace. With co-current airflow, we arebringing the hottest, driest air into contactwith the wettest, coolest material. Thisavoids the danger of over-heating theproduct before it leaves the dryer, whichcan happen with counter-current airflow.Excessive heat may damage delicateproducts and it should be avoided if thereis a danger of doing harm to the productquality by exposing it to excessive heat.While there are not the most optimumdifferences in temperature and moisturecontent helping to dry the product, theeffects may be more gentle on the productitself.
____________________________________________________________________________________
Intermediate Course in Food Dehydration and Drying Chapter 6: Page 6.
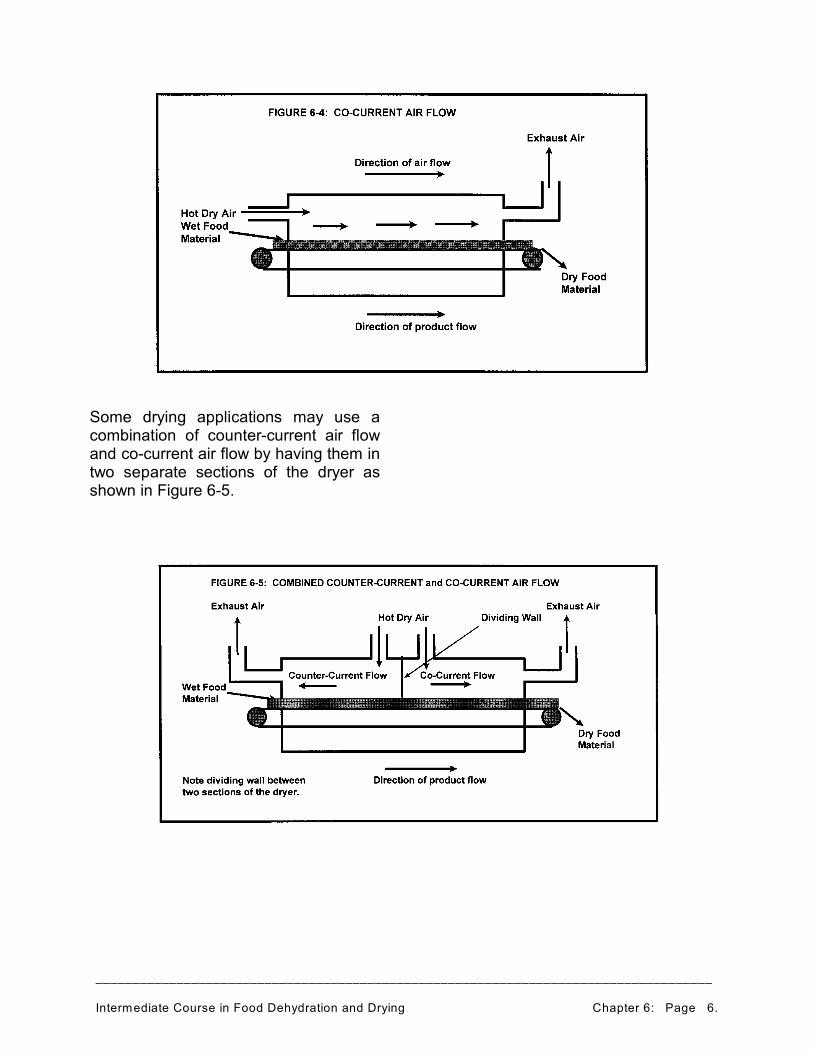
Some drying applications may use acombination of counter-current air flowand co-current air flow by having them intwo separate sections of the dryer asshown in Figure 6-5.
____________________________________________________________________________________
Intermediate Course in Food Dehydration and Drying Chapter 6: Page 7.
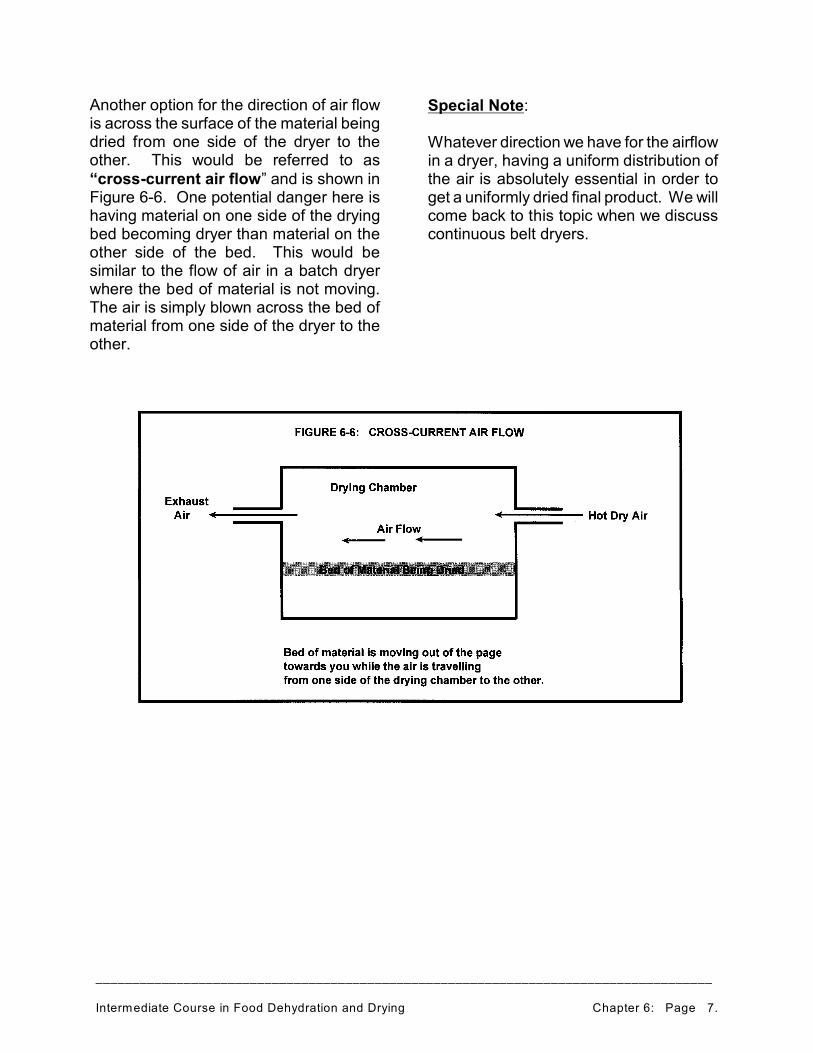
Another option for the direction of air flowis across the surface of the material beingdried from one side of the dryer to theother. This would be referred to as“cross-current air flow” and is shown inFigure 6-6. One potential danger here ishaving material on one side of the dryingbed becoming dryer than material on theother side of the bed. This would besimilar to the flow of air in a batch dryerwhere the bed of material is not moving.The air is simply blown across the bed ofmaterial from one side of the dryer to theother.
Special Note:
Whatever direction we have for the airflowin a dryer, having a uniform distribution ofthe air is absolutely essential in order toget a uniformly dried final product. We willcome back to this topic when we discusscontinuous belt dryers.
____________________________________________________________________________________
Intermediate Course in Food Dehydration and Drying Chapter 6: Page 8.
6.5 Types of Dryers
Now that we have had a look at how weget the heat to the product in dryers usinghot air, we should examine several of thedifferent types of dryers that are availableto the food processor. These dryers maybe divided into two main groups:“traditional” dryers and “emergingtechnology” dryers. Even though we mayonly be able to take a quick look at just afew different types of dryers, there aremany variations of dryer types that havebeen designed to meet various needs infood drying. You should consult a dryingspecialist for a dryer to meet your specificdrying requirements. We will consider the“traditional dryers first.
6.5.1 Traditional Dryers
6.5.1.1 Continuous Through-Circulation Dryers
This type of dryer is often called by namessuch as a “continuous belt dryer” or“conveyor belt dryer” etc. It is similar tothe dryers shown in Figures 6-2 through 6-5. Basically, the material to be dried isspread evenly on a wire mesh belt whichtravels through the drying chamber. Thetime that the material spends in the dryeris controlled by the speed of the belt. Theamount of heat delivered to the dryer isdetermined by the temperature of theheated air, and the volume of air blowninto the dryer in a given period of time.
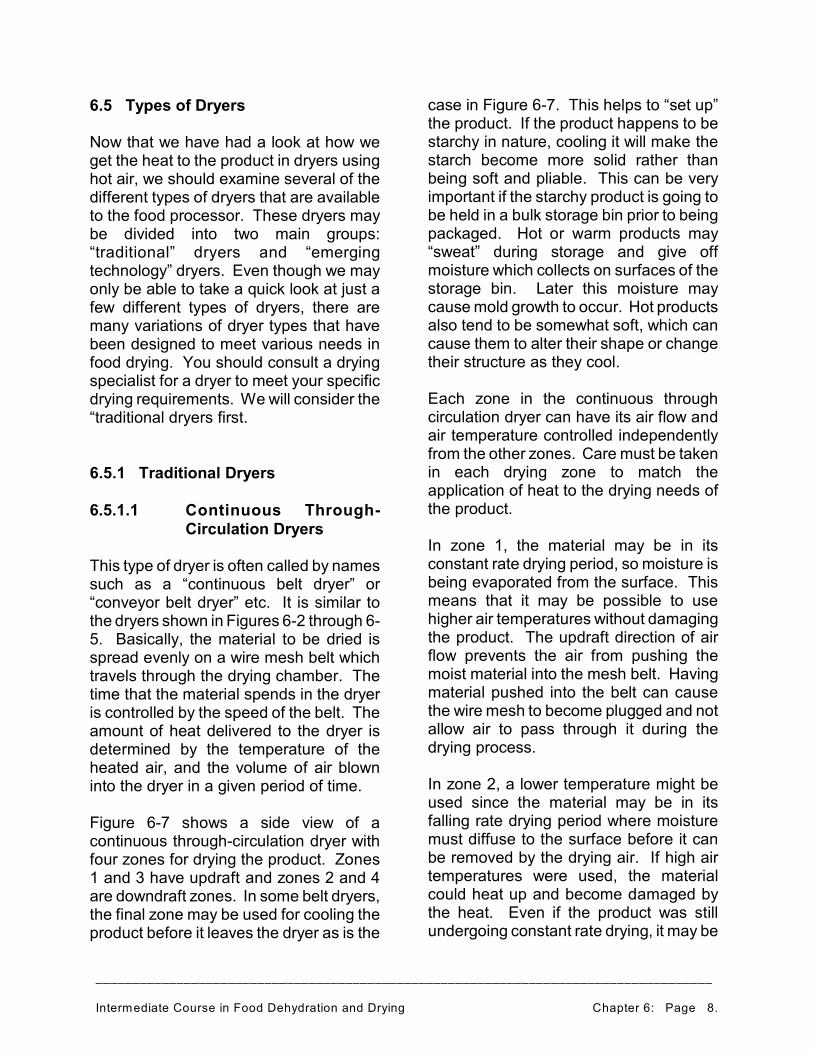
Figure 6-7 shows a side view of acontinuous through-circulation dryer withfour zones for drying the product. Zones1 and 3 have updraft and zones 2 and 4are downdraft zones. In some belt dryers,the final zone may be used for cooling theproduct before it leaves the dryer as is the
case in Figure 6-7. This helps to “set up”the product. If the product happens to bestarchy in nature, cooling it will make thestarch become more solid rather thanbeing soft and pliable. This can be veryimportant if the starchy product is going tobe held in a bulk storage bin prior to beingpackaged. Hot or warm products may“sweat” during storage and give offmoisture which collects on surfaces of thestorage bin. Later this moisture maycause mold growth to occur. Hot productsalso tend to be somewhat soft, which cancause them to alter their shape or changetheir structure as they cool.
Each zone in the continuous throughcirculation dryer can have its air flow andair temperature controlled independentlyfrom the other zones. Care must be takenin each drying zone to match theapplication of heat to the drying needs ofthe product.
In zone 1, the material may be in itsconstant rate drying period, so moisture isbeing evaporated from the surface. Thismeans that it may be possible to usehigher air temperatures without damagingthe product. The updraft direction of airflow prevents the air from pushing themoist material into the mesh belt. Havingmaterial pushed into the belt can causethe wire mesh to become plugged and notallow air to pass through it during thedrying process.
In zone 2, a lower temperature might beused since the material may be in itsfalling rate drying period where moisturemust diffuse to the surface before it canbe removed by the drying air. If high airtemperatures were used, the materialcould heat up and become damaged bythe heat. Even if the product was stillundergoing constant rate drying, it may be
____________________________________________________________________________________
Intermediate Course in Food Dehydration and Drying Chapter 6: Page 9.
considered to be a good idea to changethe direction of the airflow so that the topof the drying bed becomes dry and thebottom does not become overly dry.
Zone 3 is a second updraft zone. It wouldgenerally have a much lower air flow thanzone 1 because the product is lighter thanit was when it contained a lot of water asit did in zone 1. If high air flows wereused, the speed of the air could besufficient to lift pieces of material off thedrying belt and blow them around insidethe dryer. This would create uneven
drying and could also result in productbeing blown out of the dryer.
Continuous through-circulation dryers canhave any number of zones. The actualnumber depends on the nature of theproduct being dried and other suchconsiderations including air temperaturesduring drying and the air flowrates.
These dryers are used in many dryingapplications where the particles ofmaterial are easily handled and can bespread on a belt for drying. They may beused for drying grain and cereal products,animal feed, etc.
____________________________________________________________________________________
Intermediate Course in Food Dehydration and Drying Chapter 6: Page 10.
6.5.1.2 Tunnel Dryers
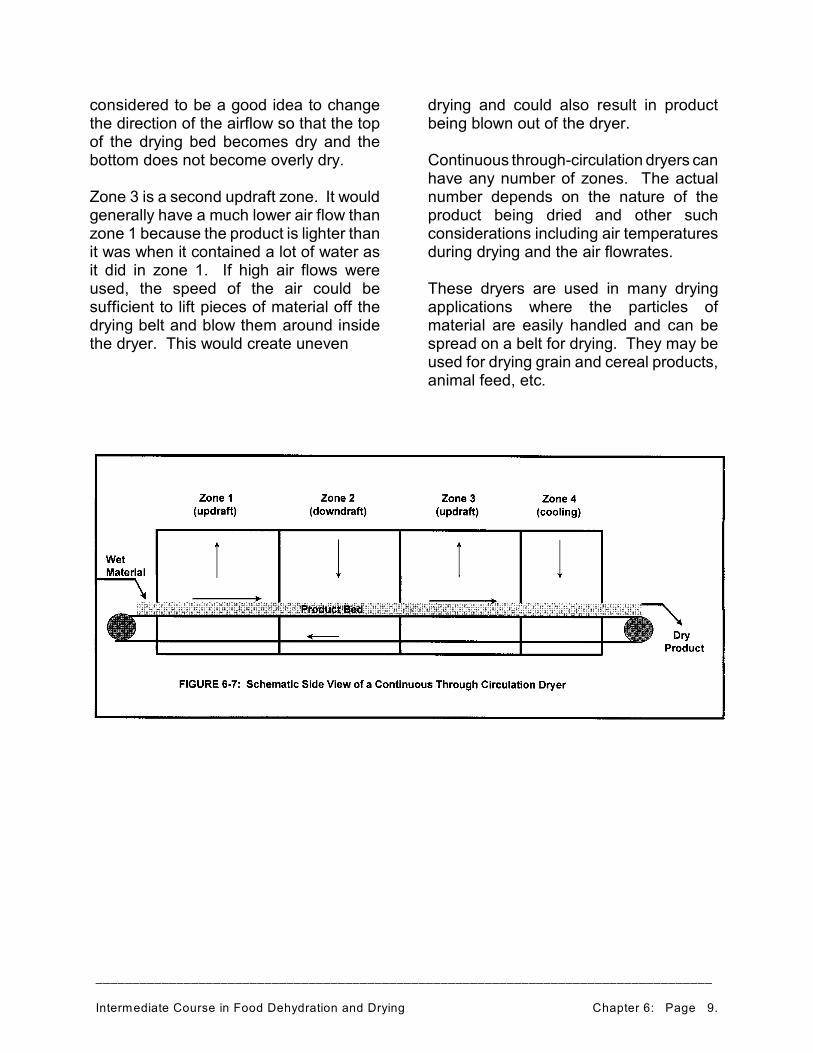
Tunnel dryers are similar in many respectsto continuous through-circulation dryers.The big difference is that the material isnot placed on a moving conveyor belt.Instead, the material to be dried is placedon trays or racks that are then placed oncarts which are pulled through longtunnels where heated air is blown acrossthe material. Figure 6-8 shows such adryer.
The carts are manually loaded andpushed into the “front end” of the dryer.They can either be fastened to a chainthat will pull them through the tunnel, or
the wheels of the cart may be grabbed inan assembly that will pull them throughthe tunnel. The speed at which they arepulled determines the time the materialspends in the dryer. Once the carts reachthe end of the dryer, they are pushed outand unloaded. The empty carts are thenreturned to the start of the dryer to bereloaded and sent through the dryer witha fresh load of wet product.
These dryers require much more labour tooperate than a continuous belt dryer andare not as commonly used as they oncewere.
____________________________________________________________________________________
Intermediate Course in Food Dehydration and Drying Chapter 6: Page 11.
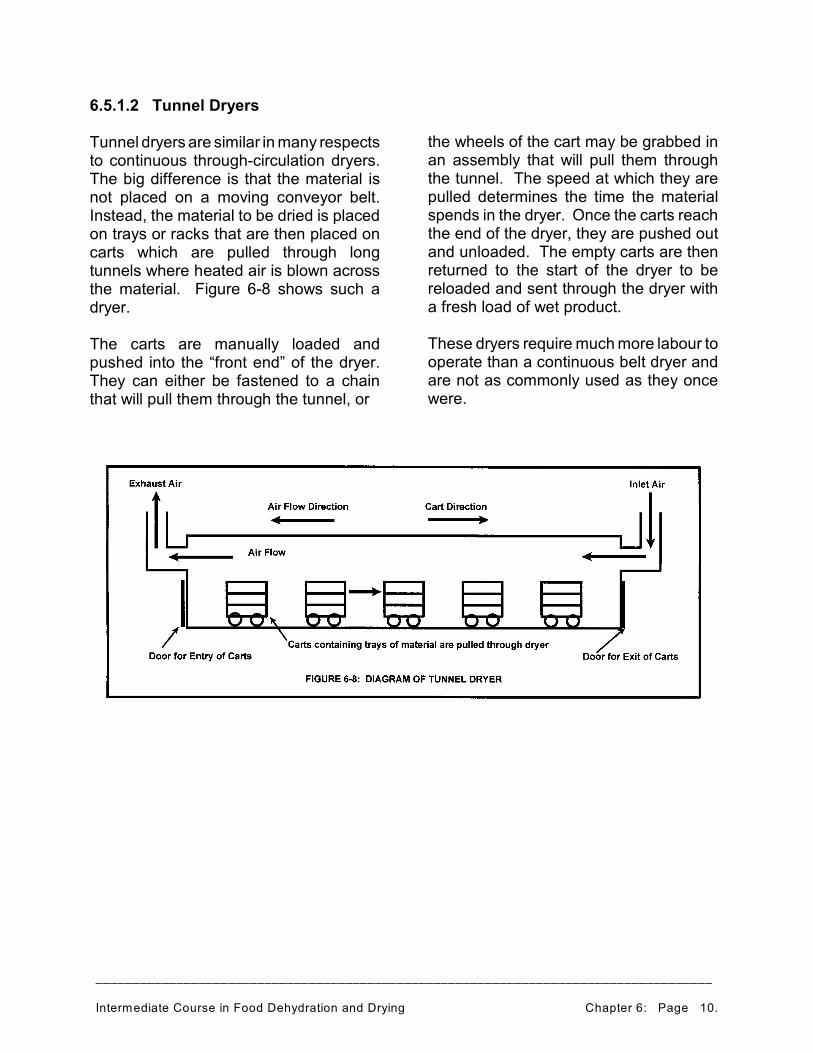
6.5.1.3 Cabinet Dryers
Cabinet dryers represent a basic type ofbatch style dryer. We have already seena cabinet dryer in Figure 5-1. It isreproduced here as Figure 6-9 for thesake of completeness.
Cabinet dryers are useful in drying smallquantities of food material or forlaboratory-scale drying studies.
____________________________________________________________________________________
Intermediate Course in Food Dehydration and Drying Chapter 6: Page 12.
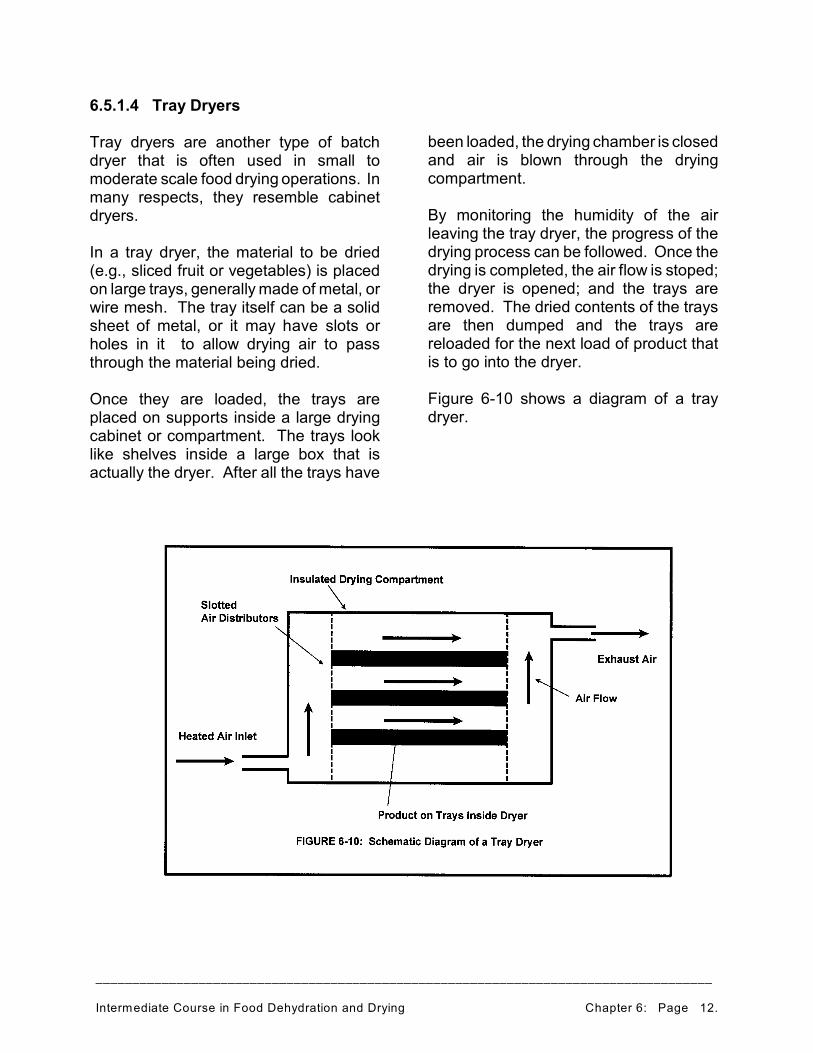
6.5.1.4 Tray Dryers
Tray dryers are another type of batchdryer that is often used in small tomoderate scale food drying operations. Inmany respects, they resemble cabinetdryers.
In a tray dryer, the material to be dried(e.g., sliced fruit or vegetables) is placedon large trays, generally made of metal, orwire mesh. The tray itself can be a solidsheet of metal, or it may have slots orholes in it to allow drying air to passthrough the material being dried.
Once they are loaded, the trays areplaced on supports inside a large dryingcabinet or compartment. The trays looklike shelves inside a large box that isactually the dryer. After all the trays have
been loaded, the drying chamber is closedand air is blown through the dryingcompartment.
By monitoring the humidity of the airleaving the tray dryer, the progress of thedrying process can be followed. Once thedrying is completed, the air flow is stoped;the dryer is opened; and the trays areremoved. The dried contents of the traysare then dumped and the trays arereloaded for the next load of product thatis to go into the dryer.
Figure 6-10 shows a diagram of a traydryer.
____________________________________________________________________________________
Intermediate Course in Food Dehydration and Drying Chapter 6: Page 13.
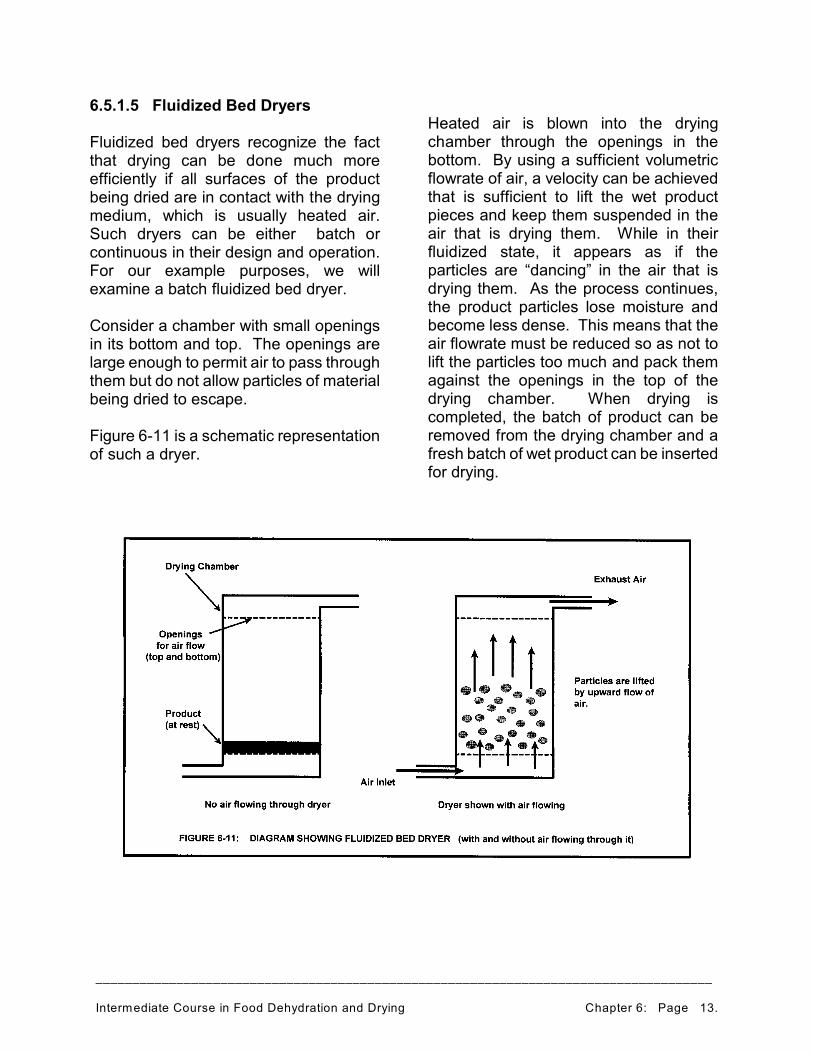
6.5.1.5 Fluidized Bed Dryers
Fluidized bed dryers recognize the factthat drying can be done much moreefficiently if all surfaces of the productbeing dried are in contact with the dryingmedium, which is usually heated air.Such dryers can be either batch orcontinuous in their design and operation.For our example purposes, we willexamine a batch fluidized bed dryer.
Consider a chamber with small openingsin its bottom and top. The openings arelarge enough to permit air to pass throughthem but do not allow particles of materialbeing dried to escape.
Figure 6-11 is a schematic representationof such a dryer.
Heated air is blown into the dryingchamber through the openings in thebottom. By using a sufficient volumetricflowrate of air, a velocity can be achievedthat is sufficient to lift the wet productpieces and keep them suspended in theair that is drying them. While in theirfluidized state, it appears as if theparticles are “dancing” in the air that isdrying them. As the process continues,the product particles lose moisture andbecome less dense. This means that theair flowrate must be reduced so as not tolift the particles too much and pack themagainst the openings in the top of thedrying chamber. When drying iscompleted, the batch of product can beremoved from the drying chamber and afresh batch of wet product can be insertedfor drying.
____________________________________________________________________________________
Intermediate Course in Food Dehydration and Drying Chapter 6: Page 14.
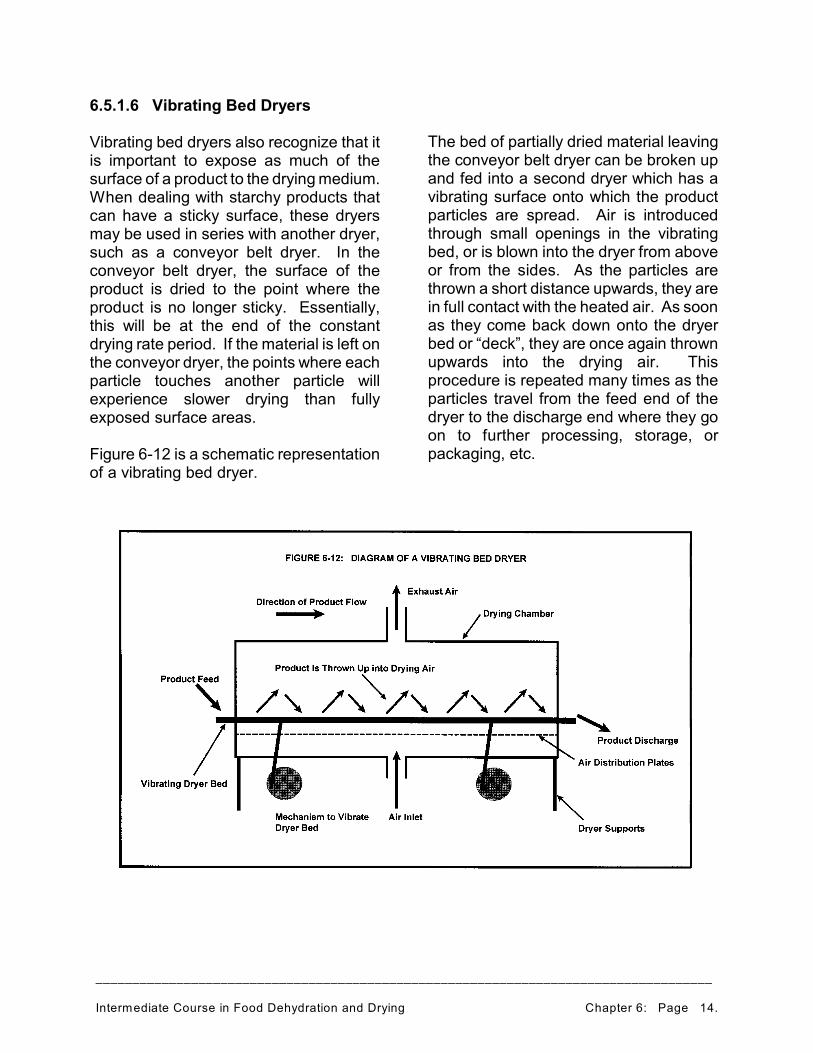
6.5.1.6 Vibrating Bed Dryers
Vibrating bed dryers also recognize that itis important to expose as much of thesurface of a product to the drying medium.When dealing with starchy products thatcan have a sticky surface, these dryersmay be used in series with another dryer,such as a conveyor belt dryer. In theconveyor belt dryer, the surface of theproduct is dried to the point where theproduct is no longer sticky. Essentially,this will be at the end of the constantdrying rate period. If the material is left onthe conveyor dryer, the points where eachparticle touches another particle willexperience slower drying than fullyexposed surface areas.
Figure 6-12 is a schematic representationof a vibrating bed dryer.
The bed of partially dried material leavingthe conveyor belt dryer can be broken upand fed into a second dryer which has avibrating surface onto which the productparticles are spread. Air is introducedthrough small openings in the vibratingbed, or is blown into the dryer from aboveor from the sides. As the particles arethrown a short distance upwards, they arein full contact with the heated air. As soonas they come back down onto the dryerbed or “deck”, they are once again thrownupwards into the drying air. Thisprocedure is repeated many times as theparticles travel from the feed end of thedryer to the discharge end where they goon to further processing, storage, orpackaging, etc.
____________________________________________________________________________________
Intermediate Course in Food Dehydration and Drying Chapter 6: Page 15.
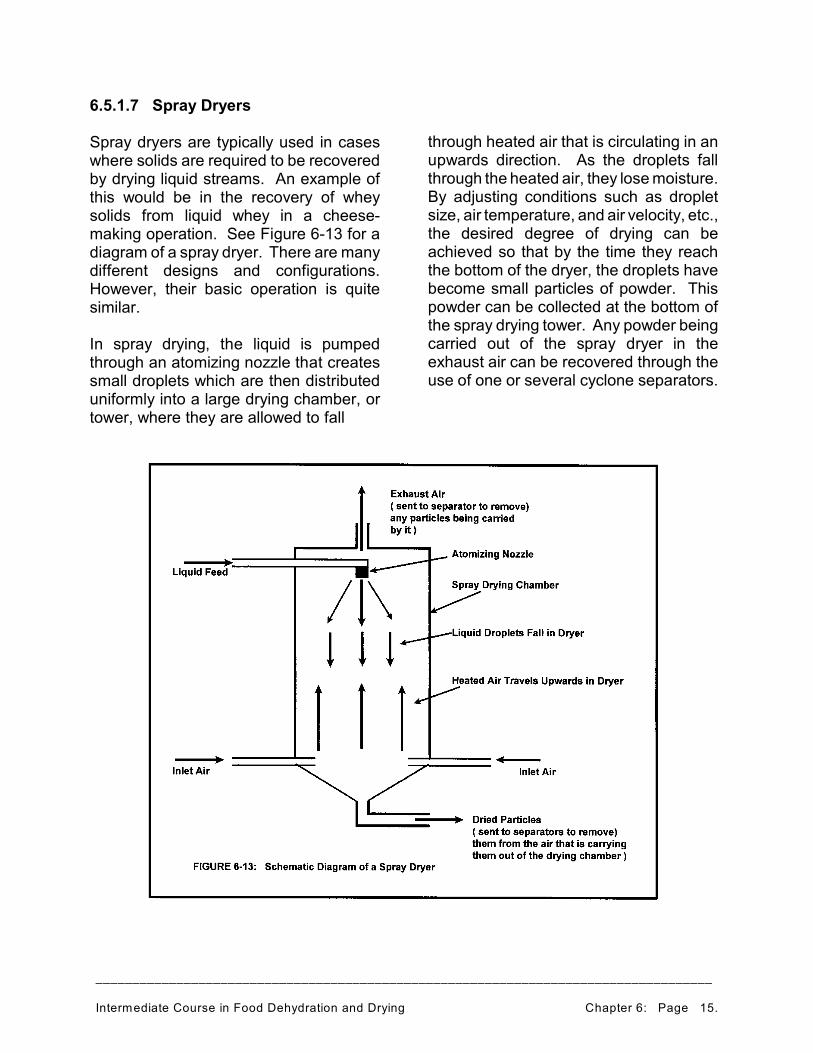
6.5.1.7 Spray Dryers
Spray dryers are typically used in caseswhere solids are required to be recoveredby drying liquid streams. An example ofthis would be in the recovery of wheysolids from liquid whey in a cheese-making operation. See Figure 6-13 for adiagram of a spray dryer. There are manydifferent designs and configurations.However, their basic operation is quitesimilar.
In spray drying, the liquid is pumpedthrough an atomizing nozzle that createssmall droplets which are then distributeduniformly into a large drying chamber, ortower, where they are allowed to fall
through heated air that is circulating in anupwards direction. As the droplets fallthrough the heated air, they lose moisture.By adjusting conditions such as dropletsize, air temperature, and air velocity, etc.,the desired degree of drying can beachieved so that by the time they reachthe bottom of the dryer, the droplets havebecome small particles of powder. Thispowder can be collected at the bottom ofthe spray drying tower. Any powder beingcarried out of the spray dryer in theexhaust air can be recovered through theuse of one or several cyclone separators.
____________________________________________________________________________________
Intermediate Course in Food Dehydration and Drying Chapter 6: Page 16.
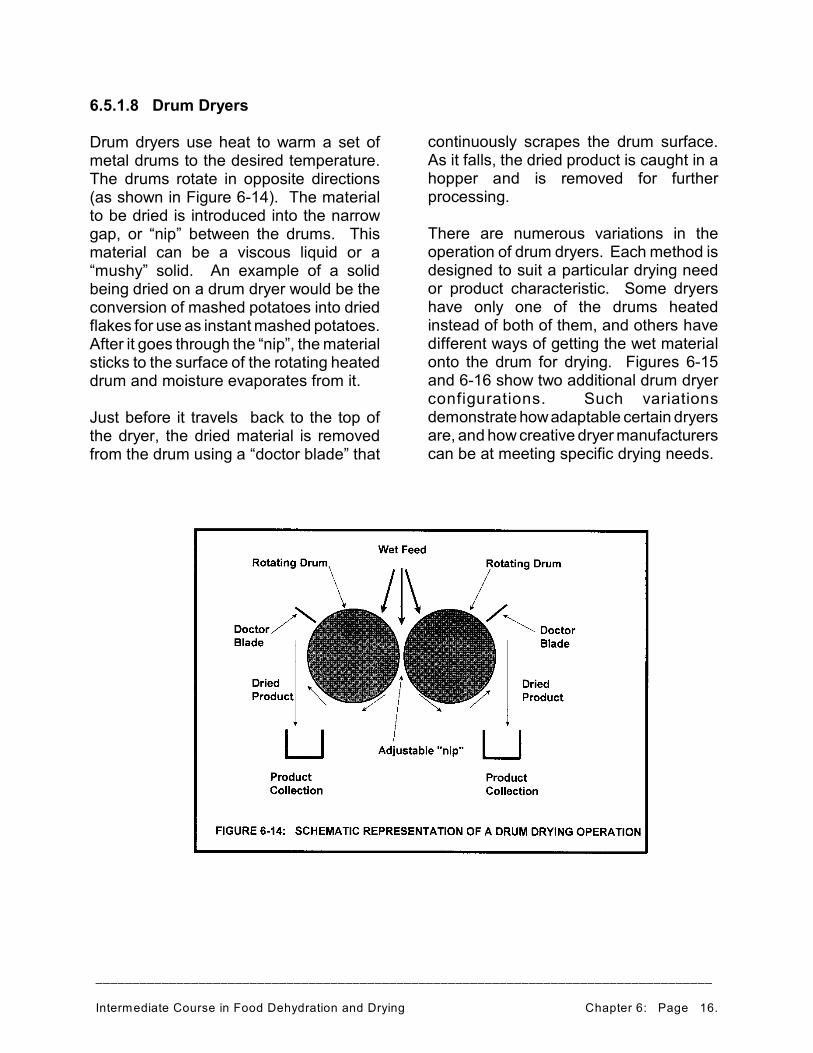
6.5.1.8 Drum Dryers
Drum dryers use heat to warm a set ofmetal drums to the desired temperature.The drums rotate in opposite directions(as shown in Figure 6-14). The materialto be dried is introduced into the narrowgap, or “nip” between the drums. Thismaterial can be a viscous liquid or a“mushy” solid. An example of a solidbeing dried on a drum dryer would be theconversion of mashed potatoes into driedflakes for use as instant mashed potatoes.After it goes through the “nip”, the materialsticks to the surface of the rotating heateddrum and moisture evaporates from it.
Just before it travels back to the top ofthe dryer, the dried material is removedfrom the drum using a “doctor blade” that
continuously scrapes the drum surface.As it falls, the dried product is caught in ahopper and is removed for furtherprocessing.
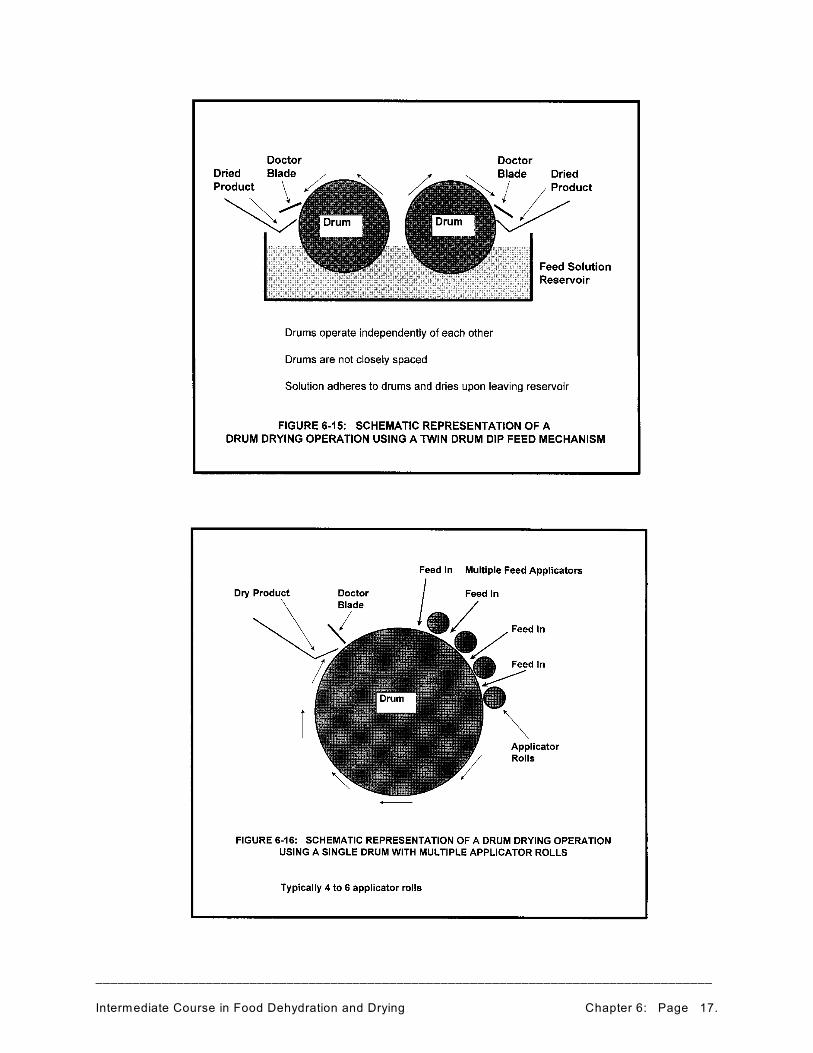
There are numerous variations in theoperation of drum dryers. Each method isdesigned to suit a particular drying needor product characteristic. Some dryershave only one of the drums heatedinstead of both of them, and others havedifferent ways of getting the wet materialonto the drum for drying. Figures 6-15and 6-16 show two additional drum dryerconfigurations. Such variationsdemonstrate how adaptable certain dryersare, and how creative dryer manufacturerscan be at meeting specific drying needs.
____________________________________________________________________________________
Intermediate Course in Food Dehydration and Drying Chapter 6: Page 17.
____________________________________________________________________________________
Intermediate Course in Food Dehydration and Drying Chapter 6: Page 18.
6.5.1.9 Other Types of TraditionalDryers
It is basically impossible to discuss in anygreat detail the full range of dryers thatare available to food processors today.Not only is it beyond the scope of a worksuch as this, but there are far too manyspecific applications of dryers that wouldhave to be considered to do justice to thetreatment of each dryer type. Completetextbooks have been written on thesubject of dryers. New styles of dyers arebeing developed continuously to meetnew drying demands.
In addition to those dryers describedabove, the following types of dryers arealso available for consideration in foodprocessing applications.
C Freeze dryersC Flash dryersC Plate dryersC Rotary dryersC Vacuum dryersC Solar dryersC Roto-louvre dryersC etc.
Should you wish to study any of theseadditional types of dryers, you may findthe Internet to be of particular assistance.
Before deciding upon a specific dryer fora processing task, care should be taken toinvestigate all suitable types of dryers andto pick the one most appropriate fro theproduct. You should work with a dryerspecialist or drying company andrecognize the needs to match the dryer tothe product being dried. The purchase ofa dryer is often a major capital expense.Mistakes made in the selection of a dryercannot be easily corrected in most cases.
6.5.2 Emerging Technologies
In a chapter of the book “Food Scienceand Food Biotechnology” (edited by G.F.Gutierrez-Lopez and G.V. Barbosa-Canovas; Food Preservation TechnologySeries, by CRC Press, 2003), Dr. ArunMujumdar, discusses a number of newdevelopments in the field of dryingtechnology.
He lists the following new dryer designs:
C Heat pump dryersC Intermittent batch dryersC Vacuum fluid-bed dryersC Sorption dryersC Pulse combustion dryersC Cyclic pressure / vacuum dryersC High electric field dryersC Superheated steam at low pressure dryers
Each one of these dryers addresses aspecial concern in the drying of aparticular product.
While it is not possible to examine eachone of these dryers here, it is important tomention them in order to show how newdryers are being developed to meet theneeds of various processors.
____________________________________________________________________________________
Intermediate Course in Food Dehydration and Drying Chapter 7: Page 1.
INTERMEDIATE COURSE IN FOOD DEHYDRATION AND DRYING
CHAPTER 7: DRYER OPERATION - CASE STUDY
7.1 Introduction
Setting up a food drying process is not amatter of simply running a few small-scaletests and having a supplier design a dryerthat meets your requirements. Once thedryer is installed and operating, conditionsmust be maintained to keep the dryerfunctioning properly.
In order to illustrate some of the situationsthat can arise during a food dryingprocess, a case study example involvinga continuous through-circulation dryer willbe used.
7.2 Case Study:Continuous Through-circulationDryers
7.2.1 Mode of Operation
The continuous through-circulation dryeris used in this chapter as a means ofintroducing drying or dehydration on anindustrial scale and to provide material fora “Case Study”. As previously stated,there are many types of dryers availableand each application must be assessedon an individual basis to optimize thedrying process.
7.2.2 Design Features
To ensure the best possible performancefor any type of dryer, it is essential to havea uniform bed of material on the dryerbelt. The material being dried must then
be exposed to a uniform, controlled dryingenvironment.
7.2.2.1 Creating a Uniform Product Bed
Methods of establishing a uniform productbed are varied and often imaginative.They are dependent upon the propertiesof the material being dried, and on thenature of the discharge stream from theprevious unit operation in the processsequence. Some materials may beconveyed in a water slurry and spread onthe dryer belt by dams or weirs, anddrained prior to entering the dryer itself.Other materials may be “airveyed” (i.e.,blown in a stream of high-velocity air) andblown onto the belt through tubes thatsweep from side-to-side across the dryerbelt.
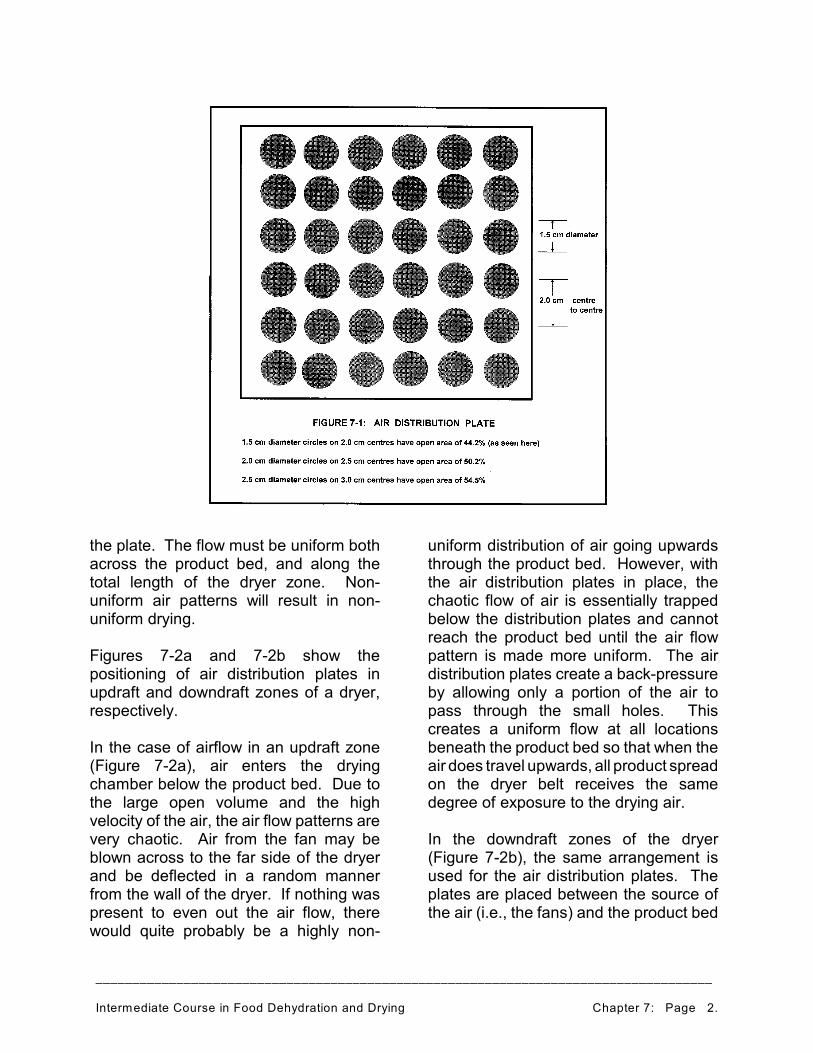
7.2.2.2 Creating Uniform Air Flow
Delivering the drying medium (usuallyheated air) to the product is a majorchallenge. “Air distribution plates” are themost commonly used method incontinuous through-circulation dryers.These plates are simply large sheet-metalpanels with small holes (typically 1 to 2cm) spaced at regular intervals to give anappropriate open area (perhaps 25% to50%). A schematic diagram of an airdistribution plate appears as Figure 7-1.Sufficient back pressure must be createdby the air distribution plates to establish auniform flow of air through the holes in
____________________________________________________________________________________
Intermediate Course in Food Dehydration and Drying Chapter 7: Page 2.
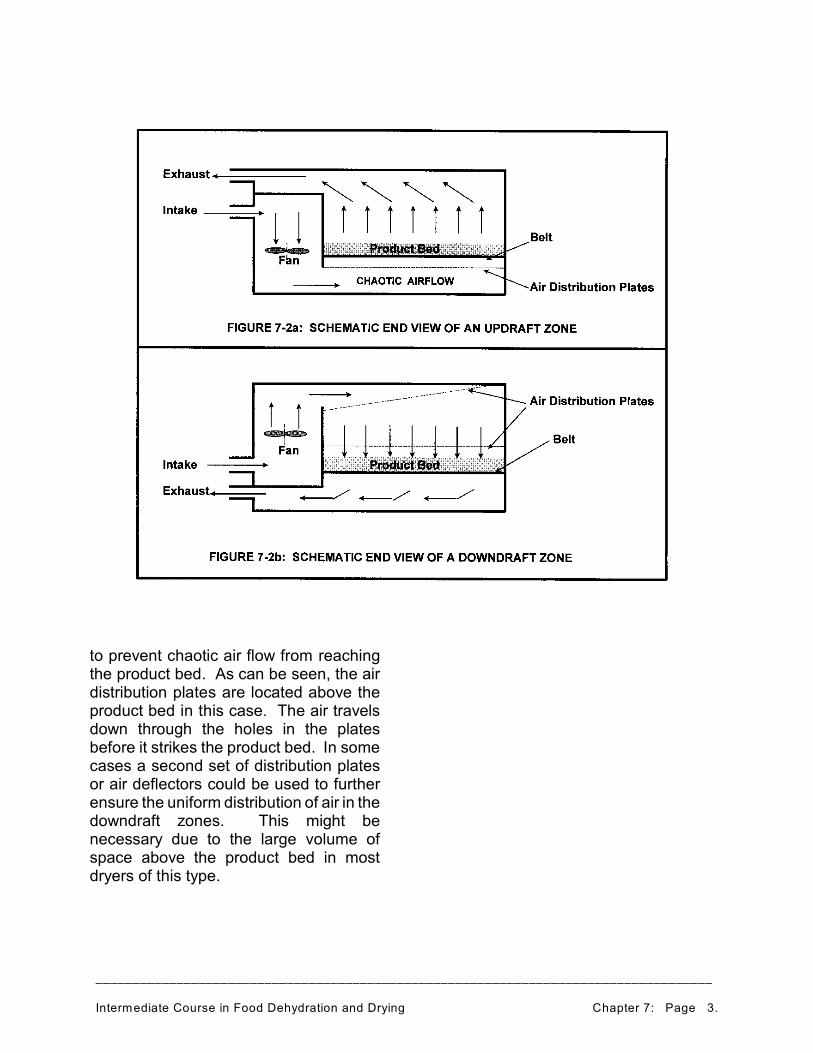
the plate. The flow must be uniform bothacross the product bed, and along thetotal length of the dryer zone. Non-uniform air patterns will result in non-uniform drying.
Figures 7-2a and 7-2b show thepositioning of air distribution plates inupdraft and downdraft zones of a dryer,respectively.
In the case of airflow in an updraft zone(Figure 7-2a), air enters the dryingchamber below the product bed. Due tothe large open volume and the highvelocity of the air, the air flow patterns arevery chaotic. Air from the fan may beblown across to the far side of the dryerand be deflected in a random mannerfrom the wall of the dryer. If nothing waspresent to even out the air flow, therewould quite probably be a highly non-
uniform distribution of air going upwardsthrough the product bed. However, withthe air distribution plates in place, thechaotic flow of air is essentially trappedbelow the distribution plates and cannotreach the product bed until the air flowpattern is made more uniform. The airdistribution plates create a back-pressureby allowing only a portion of the air topass through the small holes. Thiscreates a uniform flow at all locationsbeneath the product bed so that when theair does travel upwards, all product spreadon the dryer belt receives the samedegree of exposure to the drying air.
In the downdraft zones of the dryer(Figure 7-2b), the same arrangement isused for the air distribution plates. Theplates are placed between the source ofthe air (i.e., the fans) and the product bed
____________________________________________________________________________________
Intermediate Course in Food Dehydration and Drying Chapter 7: Page 3.
to prevent chaotic air flow from reachingthe product bed. As can be seen, the airdistribution plates are located above theproduct bed in this case. The air travelsdown through the holes in the platesbefore it strikes the product bed. In somecases a second set of distribution platesor air deflectors could be used to furtherensure the uniform distribution of air in thedowndraft zones. This might benecessary due to the large volume ofspace above the product bed in mostdryers of this type.
____________________________________________________________________________________
Intermediate Course in Food Dehydration and Drying Chapter 7: Page 4.
7.2.2.3 Volume of Air to the Dryer
The volume of air being sent to the dryermay be controlled in several differentways. If the dryer is so equipped,variable-speed drives can be used toadjust the speed of the fans. The fasterthe fan is spinning, the more air that willbe delivered to the dryer. Thespecifications of the manufacturer and theappropriate fan curves (i.e., curvesdefining the air delivery of a fan under aset of given conditions such as speed,temperature of the air, back-pressure,etc.) must be used to determine the actualdelivery rates. In addition, tests todetermine air velocities should beconducted to verify results. This is a topicbest left for other courses, or hands-ontraining.
A second way to control the amount of airdelivered by a fan is through the use oflouvres or dampers to control the opencross-sectional area of the plenumthrough which the air is flowing.
A third way to adjust the air delivered by afan is by using volume control disksmounted on the central shaft of the fan.These disks can be moved along the shaftto control the percentage of the blades ofthe fan available to blow air into the dryer.This concept is somewhat more complexthan the other two and is also moredifficult to use since the fans must be shutoff and the dryer cooled down to enablecrews to go in and physically adjust thevolume control disk positions.
7.2.3 Assessing Dryer Performance
7.2.3.1 Drying Uniformity
How well a dryer does its job isdetermined by a wide variety of factors. Ingeneral, however, the success of drying aproduct comes down to how well you as aprocessor understand the behaviour ofyour product while it is being dried, andhow well you match the operation of thedryer to your product’s drying needs.
The first thing that you must realize is thatthere is a limit to how much water canbe removed from a particular type ofmaterial by a given dryer in a specifiedperiod of time.
Suppose you buy a dryer that is designedto dry grain and remove a certain amountof water from it on an hourly basis. Let’sassume the dryer can remove 1,500 kg ofwater per hour from a specified input rate.You should not expect to dry more grainwhich requires that you remove 2,000 kgof water per hour. Some operators try todo this by turning the temperaturecontrollers up to their maximum settings toget the air as hot as possible. They alsoturn the fans up to their maximum settingsto deliver as much air as possible. Inspite of these measures, they still fail toget an acceptable product, since theyhave not taken into account the time ittakes for the moisture inside the kernels ofgrain to diffuse out to the surface and beremoved. Even if the conveyor belt isslowed down to allow the grain to spendmore time in the dryer, the results areusually not encouraging because thethickness of the drying bed increases andthe air cannot penetrate through it andremove the desired moisture.
Consider the following factors:
____________________________________________________________________________________
Intermediate Course in Food Dehydration and Drying Chapter 7: Page 5.
C Time: Kinetic factors (such as diffusion)control the removal of moisture. Itis not simply matter of blasting thematerial with abundant amounts ofhot air.
C Nature of the Product:This is critical. Not all products dryin the same way. You cannotexpect to have grain dry in thesame manner as flakes of parsleyor other leafy plant material.
C Temperature:Excessive temperatures candamage your product. You cannotkeep increasing the heat to driveoff moisture without scorching orburning your product or withoutdecreasing its nutritional orfunctional properties.
C Air Flow:The air entering a dryer must bedistributed uniformly to all productin a particular drying zone. Its rateof delivery (linear and volumetric)must be such that it does notdisrupt the product bed. The airmust also have a relatively lowmoisture content to maximize itsability to remove moisture from theproduct in the dryer.
C Material Bed Characteristics:The product must be distributedevenly from side-to-side and alongthe dryer belt. Its thickness mustbe sufficient to ensure that it is notdisrupted by the air passingthrough it and it cannot be so thickas to be impenetrable to the air.
C Other Factors:Other factors exist that are specific
to each dryer that impact itsoperation. The operator of thedryer must identify and understandhow these factors relate to thedrying of his or her specificproduct.
All of these factors are usually taken intoaccount by the dryer manufacturer. It israther amazing that dryer manufacturersare often blamed for problems when thedryer is not used in the manner in which itwas designed to be run. Processors maybe running a product that the dryer wasnot designed to dry; and they may beusing improper drying conditions.
No dryer can be expected to operateproperly if it is not run under itsappropriate design conditions.
7.2.3.2 Aspects to Consider
In operating a commercial-scale dryersuch as a continuous through-circulationdryer, keep in mind the following points:
C No matter what you do to try toduplicate drying on a small scale,nothing can be done to reproduceac tua l cond i t i ons du r i ngcommercial production.
C Small scale t r ia ls in lab unitsimpose wall effects and fail toduplicate air flow patterns (Note:some dryer types are scaleable).
C Lab tests can give very goodinformation about the dryingproperties of the material itself onan individual "chunk" or particlebasis.
e.g.: TGA - thermal gravimetric
____________________________________________________________________________________
Intermediate Course in Food Dehydration and Drying Chapter 7: Page 6.
analysis can detail howmoisture loss proceedswith temperature andtime
DSC - differential scanningcalorimetry can show howproperties of a materialchange over time as heat isapplied
C To assess the true operat ingcapacity of a dryer, you need tohave a test sequence that includesoverall water removal and waterremoval uniformity across andalong the dryer bed.
C Single or even mult ip le grabsamples of product cannot providesufficient data as to a dryer'soverall operation. We will discussthis more in the “Advanced Coursein Food Dehydration and Drying”.
We will look at a relatively simple methodof determining the uniformity of dryingtogether with the water removal capacityof a dryer later in this case study.
7.2.4 An Approach to Water RemovalCapacity Determination
7.2.4.1 Definition
We can define “water removal capacity”as:
The amount of water a dryer is capableof removing from a given product in agiven period of time (usually per hour).
It is highly dependent on a number offactors which are listed below.
7.2.4.2 Factors Influencing Water Removal
Factors influencing the water removalcapacity of a dryer include:
C characteristics of the product to bedried
C characteristics of the product bed(on the dryer belt)
C condition of the dryer C age of the dryer C characteristics of the drying air C etc.
You cannot always rely on themanufacturer’s rated capacity of thedryer.
Manufacturers of dryers build theirequipment to deliver a certain level ofperformance that can be demonstratedwhen the dryer is newly installed. Withage and other factors, the performance ofthe dryer can change. Insulation in thedryer can deteriorate and more heat canbe lost when the dryer is old than when itwas new. Burner performance candeteriorate over time and processors caneven change things on their own without
____________________________________________________________________________________
Intermediate Course in Food Dehydration and Drying Chapter 7: Page 7.
the manufacturer’s knowledge.
7.2.4.3 Water Removal Capacity Testing
One method of determining how muchwater the dryer is actually capable ofremoving and to determine how uniformthe drying is, is to do a series of simpletests.
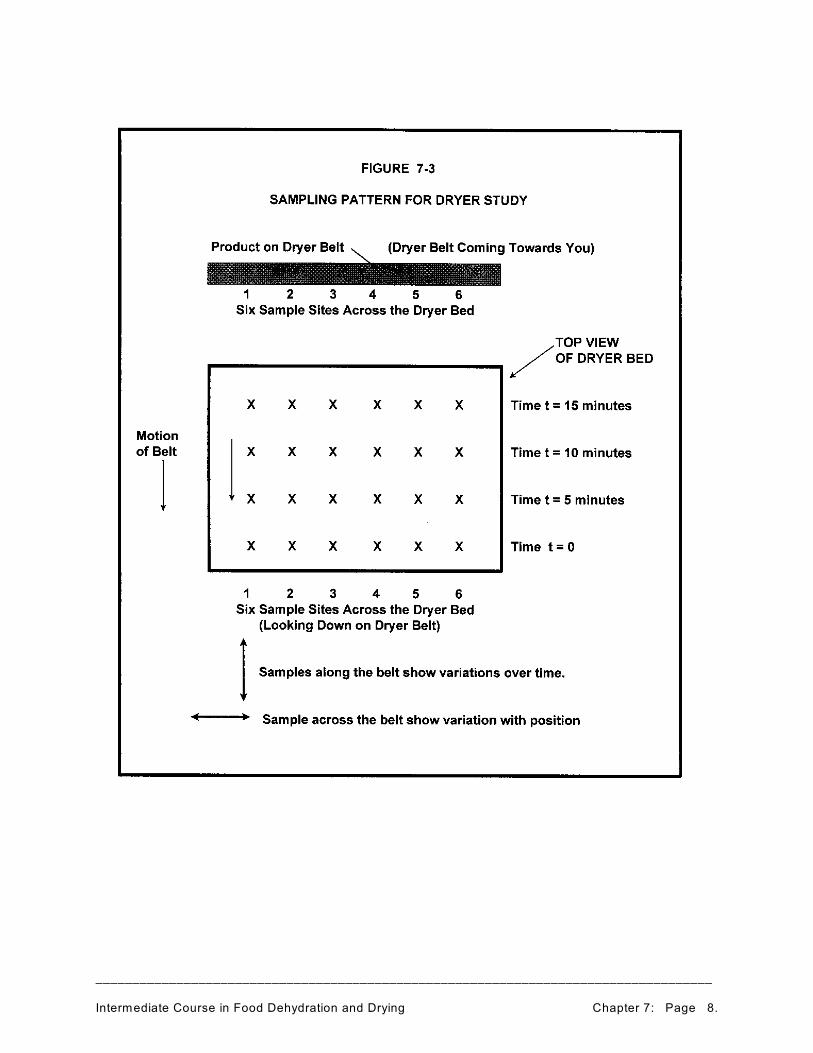
Imagine yourself standing at the dischargeend of a conveyor belt dryer with the driedproduct coming towards you. The bed ofdried product may be two or three metreswide and will fall off the belt into acollection hopper of some description justin front of you. What you want to do isdetermine the uniformity of moistureacross the dryer bed. If you do this at aseries of time intervals, you canalso determine the uniformity in moistureover time.
A procedure that I have used is to take aset of six samples across the end of thedryer at a particular time. Two otherhelpers are needed to get the samples atthe same time. Each sample is placedinto a labelled plastic bag and tied forfuture testing. The time of these sampleswill be “Time t = 0". Five minutes later, asecond set of samples is taken at thesame six locations and are labelled “Timet = 5 minutes”. Five minutes later, a thirdset of samples labelled “Time t = 10minutes” is taken; and five minutes afterthat, a fourth set of samples labelled“Time t = 15 minutes” is taken. Eachsample is then tested for moisture using arecognized moisture determinationmethod. Figure 7-3 shows how thesampling pattern would look.
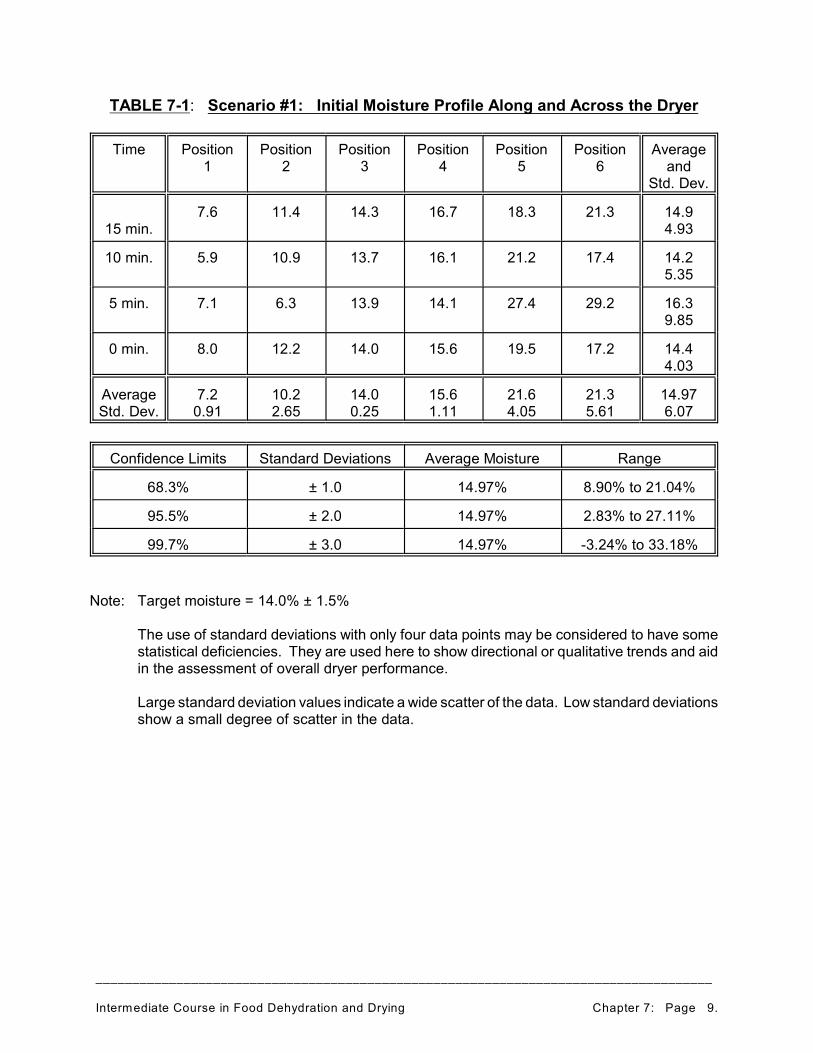
The results of the 24 moisture tests, inwhat is referred to as “Scenario 1", arethen arranged in a table format such asthat shown in Table 7-1. The first set ofsamples is in the bottom row to duplicatethe view of the dryer bed as if seen fromabove. Averages of moistures arecalculated across each row of six samplesand along each group of four samplestaken at each sample site. The overallaverage for the 24 samples is alsocalculated.
In order to get some idea of the variationor spread of the moisture results, standarddeviations are also taken for each row ofsix samples, each set of four moisturesfrom each sample location and for theentire 24 samples. While it is recognizedthat a standard deviation based on foursamples may not be statistically valid, theobjective is to have the standard deviationas small as possible to indicate a lowdegree of variability among any set ofsample results. The standard deviation isessentially used for qualitative purposes.
In Table 7-1, we can see the individualmoisture values and the calculatedaverages and standard deviations. Itappears as if the product along the leftside of the dryer (average moisture =7.2%) is much dryer than that along theright hand side of the dryer (averagemoisture in position 5 = 21.6% and inposition 6, average moisture = 21.3%).The degree of variation in the moistures isalso lower on the left hand side of thedryer than it is on the right hand side.
The average moisture across the dryer isreasonably uniform over time. It rangesfrom an average of 14.2% to 16.3%. Theoverall average moisture for the 24samples was found to be 14.97%, or
____________________________________________________________________________________
Intermediate Course in Food Dehydration and Drying Chapter 7: Page 8.
____________________________________________________________________________________
Intermediate Course in Food Dehydration and Drying Chapter 7: Page 9.
TABLE 7-1: Scenario #1: Initial Moisture Profile Along and Across the Dryer
Time Position1
Position2
Position3
Position4
Position5
Position6
Averageand
Std. Dev.
15 min.7.6 11.4 14.3 16.7 18.3 21.3 14.9
4.93
10 min. 5.9 10.9 13.7 16.1 21.2 17.4 14.25.35
5 min. 7.1 6.3 13.9 14.1 27.4 29.2 16.39.85
0 min. 8.0 12.2 14.0 15.6 19.5 17.2 14.44.03
AverageStd. Dev.
7.20.91
10.22.65
14.00.25
15.61.11
21.64.05
21.35.61
14.976.07
Confidence Limits Standard Deviations Average Moisture Range
68.3% ± 1.0 14.97% 8.90% to 21.04%
95.5% ± 2.0 14.97% 2.83% to 27.11%
99.7% ± 3.0 14.97% -3.24% to 33.18%
Note: Target moisture = 14.0% ± 1.5%
The use of standard deviations with only four data points may be considered to have somestatistical deficiencies. They are used here to show directional or qualitative trends and aidin the assessment of overall dryer performance.
Large standard deviation values indicate a wide scatter of the data. Low standard deviationsshow a small degree of scatter in the data.
____________________________________________________________________________________
Intermediate Course in Food Dehydration and Drying Chapter 7: Page 10.
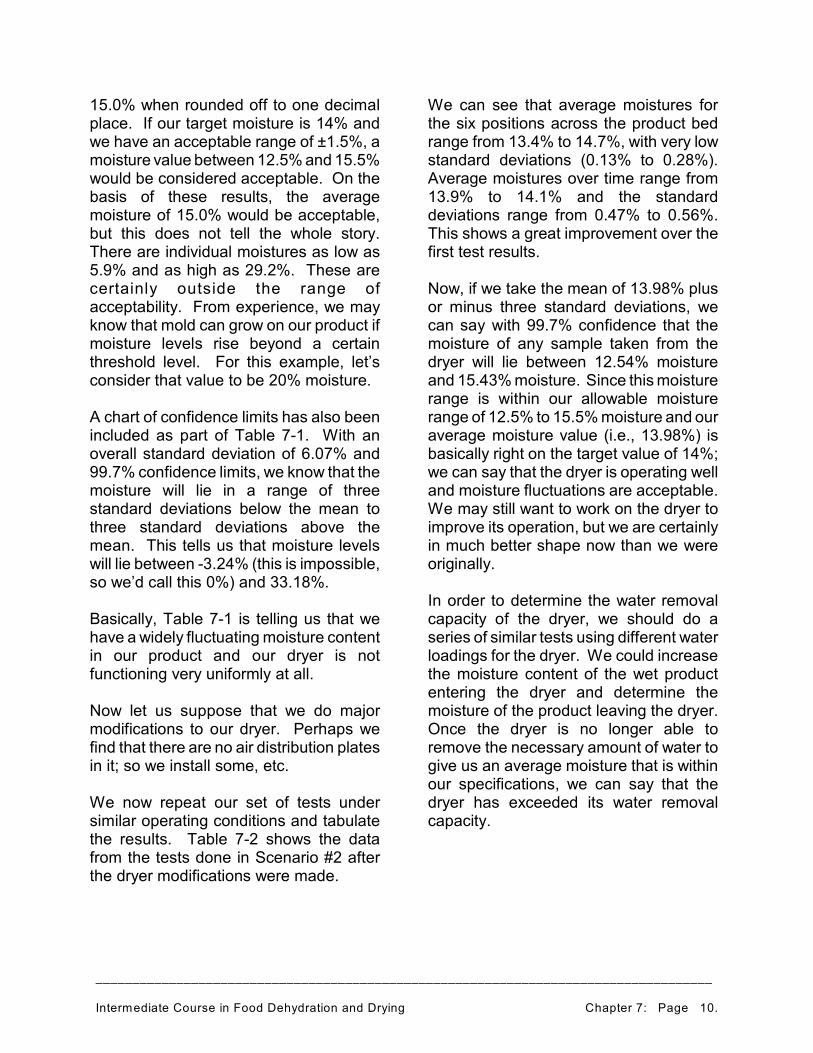
15.0% when rounded off to one decimalplace. If our target moisture is 14% andwe have an acceptable range of ±1.5%, amoisture value between 12.5% and 15.5%would be considered acceptable. On thebasis of these results, the averagemoisture of 15.0% would be acceptable,but this does not tell the whole story.There are individual moistures as low as5.9% and as high as 29.2%. These arecertainly outside the range ofacceptability. From experience, we mayknow that mold can grow on our product ifmoisture levels rise beyond a certainthreshold level. For this example, let’sconsider that value to be 20% moisture.
A chart of confidence limits has also beenincluded as part of Table 7-1. With anoverall standard deviation of 6.07% and99.7% confidence limits, we know that themoisture will lie in a range of threestandard deviations below the mean tothree standard deviations above themean. This tells us that moisture levelswill lie between -3.24% (this is impossible,so we’d call this 0%) and 33.18%.
Basically, Table 7-1 is telling us that wehave a widely fluctuating moisture contentin our product and our dryer is notfunctioning very uniformly at all.
Now let us suppose that we do majormodifications to our dryer. Perhaps wefind that there are no air distribution platesin it; so we install some, etc.
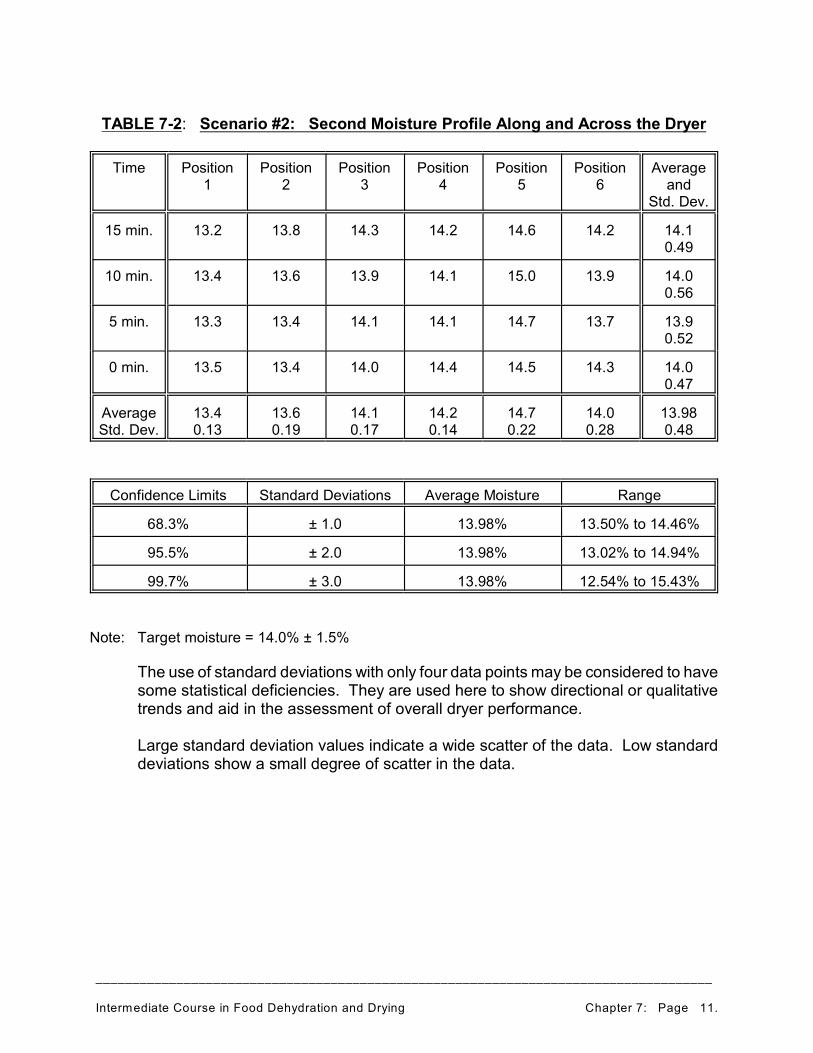
We now repeat our set of tests undersimilar operating conditions and tabulatethe results. Table 7-2 shows the datafrom the tests done in Scenario #2 afterthe dryer modifications were made.
We can see that average moistures forthe six positions across the product bedrange from 13.4% to 14.7%, with very lowstandard deviations (0.13% to 0.28%).Average moistures over time range from13.9% to 14.1% and the standarddeviations range from 0.47% to 0.56%.This shows a great improvement over thefirst test results.
Now, if we take the mean of 13.98% plusor minus three standard deviations, wecan say with 99.7% confidence that themoisture of any sample taken from thedryer will lie between 12.54% moistureand 15.43% moisture. Since this moisturerange is within our allowable moisturerange of 12.5% to 15.5% moisture and ouraverage moisture value (i.e., 13.98%) isbasically right on the target value of 14%;we can say that the dryer is operating welland moisture fluctuations are acceptable.We may still want to work on the dryer toimprove its operation, but we are certainlyin much better shape now than we wereoriginally.
In order to determine the water removalcapacity of the dryer, we should do aseries of similar tests using different waterloadings for the dryer. We could increasethe moisture content of the wet productentering the dryer and determine themoisture of the product leaving the dryer.Once the dryer is no longer able toremove the necessary amount of water togive us an average moisture that is withinour specifications, we can say that thedryer has exceeded its water removalcapacity.
____________________________________________________________________________________
Intermediate Course in Food Dehydration and Drying Chapter 7: Page 11.
TABLE 7-2: Scenario #2: Second Moisture Profile Along and Across the Dryer
Time Position1
Position2
Position3
Position4
Position5
Position6
Averageand
Std. Dev.
15 min. 13.2 13.8 14.3 14.2 14.6 14.2 14.10.49
10 min. 13.4 13.6 13.9 14.1 15.0 13.9 14.00.56
5 min. 13.3 13.4 14.1 14.1 14.7 13.7 13.90.52
0 min. 13.5 13.4 14.0 14.4 14.5 14.3 14.00.47
AverageStd. Dev.
13.40.13
13.60.19
14.10.17
14.20.14
14.70.22
14.00.28
13.980.48
Confidence Limits Standard Deviations Average Moisture Range
68.3% ± 1.0 13.98% 13.50% to 14.46%
95.5% ± 2.0 13.98% 13.02% to 14.94%
99.7% ± 3.0 13.98% 12.54% to 15.43%
Note: Target moisture = 14.0% ± 1.5%
The use of standard deviations with only four data points may be considered to havesome statistical deficiencies. They are used here to show directional or qualitativetrends and aid in the assessment of overall dryer performance.
Large standard deviation values indicate a wide scatter of the data. Low standarddeviations show a small degree of scatter in the data.

____________________________________________________________________________________
Intermediate Course in Food Dehydration and Drying Chapter 7: Page 12.
7.2.4.4 Summary of Points for Water Removal Capacity Determination
You should begin by conducting a seriesof tests similar to those outlined in Table7-1 to determine a bench-mark for howthe dryer is operating under currentconditions. You can run this procedureunder increasing moisture loads anddetermine at what point the dryer fails tomeet the desired target moisture anduniformity.
The maximum dryer capacity is thepoint at which the dryer last meets theperformance criteria.
To establish an operating strategy for adryer, you may want to operate at about90% of the maximum water removal whichyou determined. This will allow someextra capacity in the event of anemergency and does give an added rangeof control.
In actual fact, many processors seem tooperate a dryer at 110% (or more) of itsrated or designed maximum waterremoval capacity. In spite of demandingthat the dryer perform above its designcapacity, the operators still want the dryerto function perfectly and to still be capableof handling any “spikes” of high moisturein the incoming product.
As stated previously, the typical approachis to turn up the burners and maximize thevolumetric air flowrate. The dryer belt canthen be sped up to make a thinner bed ofmaterial or slowed down to make a thickerbed but give the material more exposuretime. Regardless of the approach, theresults are always the same -catastrophic. To make matters worse, thedryer manufacturer usually bears themajor portion of the unjustified blame for
this.
7.2.5 Typical Problems
If a dryer is not operated properly, thefollowing problems can be expected:
C wet pockets of material (moldgrowth may occur in the productlater).
C toasting / browning of product.
C case hardening + wet centres ofparticles. This means that theoutside of the product is dried toform a hard crusty shell around amoist wet centre of the material.Water cannot readily escape and iscaught inside the case-hardenedparticle.
C stress cracking due to unevenmoisture or temperature profiles ina product particle.
C holes in the dryer bed due to airlifting the product.
C dry top and bottom surfaces of thematerial bed but wet centre layer.
C non-uniformity of drying betweenproduct on one side of the dryerand the other.
C poor final product performance dueto changes in product propertiesand functionality.
C economic losses (fuel and productwaste).
____________________________________________________________________________________
Intermediate Course in Food Dehydration and Drying Chapter 7: Page 13.
7.2.6 Changes in Moisture After Drying:
If poorly dried product is packaged, thefollowing problems may arise. The actualpackaging material will certainly have animpact on how the product is affectedduring storage.
C Establishment of equilibrium withambient atmosphere. You wantthe product to be dried to a level ofmoisture that is as close aspossible to the moisture at which itwill be stored. In this way, theproduct will not experienceexcessive moisture losses or gainsthat can alter its properties andperformance.
C Moisture equilibrium of stored orpackaged product. You do notwant to have excessively wet anddry product in the same package.Moisture changes during storagewill affect the product in a negativemanner.
C Structural collapse (if improperlyprocessed). Moist product may besoft and collapse in on itself as itdries in the package.
C Spoilage. Mold growth can result ifmoisture levels are excessive.
C Product shrinkage. Some productsactually begin to “shrivel up” if theydry slowly under uncontrolledconditions.
C Nutritional degradation. Nutrientscan be lost during storage due toexcessive moisture levels.
7.2.7 Factors to Remember AboutProduct Drying:
Once you have established a dryer's waterremoval capacity and have optimized itsperformance, there are still some things tokeep in mind:
C Every product has its own dryingcharacteristics.
C In the case of agricultural crops,there will be crop to crop variationand seasonal changes based onfresh versus stored material:
There may be years when kernelsof grain are quite large and plump.In other years the kernels may notbe as plump. This difference indiameter can affect how fast thegrains take up water in a hydrationprocess and how fast they losewater in a drying process.
You must always be aware of thecharacteristics in your product tobe successful in any dryingoperation.
____________________________________________________________________________________
Intermediate Course in Food Dehydration and Drying Chapter 8: Page 1.
INTERMEDIATE COURSE IN FOOD DEHYDRATION AND DRYING
CHAPTER 8: SOURCES OF INFORMATION
8.1 Introduction
The Internet / World-Wide-Web is avaluable source of information and shoulddefinitely be considered as a primaryresource.
When looking for detailed information ondrying a particular product, dryermanufacturers and equipment suppliersare a valuable source of information.They often have useful websites withdetails on how to contact them for furtherinformation. Since website addresses areconstantly changing while new onesappear and others may disappear, nospecific website addresses are given here.
Scientific journals also offer in-depthstudies of food drying. These papers areoften highly specific and complex in theirmathematical treatment of a particulardrying phenomenon. For these reasons,scientific journal articles are not listedhere.
The following is a list of general referencebooks relating to food drying and foodprocessing in general. It is not intended tobe an exhaustive listing of availabletextbooks, etc. Once again, the Internetcan provide up-to-date information on newpublications and journal articles aboutdrying.
8.2 General References:
“Dehydration of Foods”; Gustavo V.Barbosa-Canovas and Humberto Vega-Mercado; Chapman and Hall; New York,1996. (ISBN 0-412-06421-9)
“Food Preservation and Safety -Principles and Practice”; Shirley J.VanGarde and Margy Woodburn; IowaState University Press, Ames, Iowa, 1994. (ISBN 0-8138-2133-9)
“Food Science - Fifth Edition”; NormanN. Potter and Joseph H. Hotchkiss;Chapman and Hall; New York, 1995. (ISBN 0-412-06451-0)
“ F o o d S c i e n c e a n d F o o dBiotechnology”; Gustavo F. Gutierrez-Lopez and Gustavo V. Barbosa-Canovas,editors; CRC Press; New York, 2003. (ISBN 1-56676-892-6)
“Food Process Engineering - Theoryand Laboratory Experiments”; Shri K.Sharma, Steven J. Mulvaney, and Syed S.H. Rizvi; Wiley-Interscience; New York,2000. (ISBN 0-471-32241-5)
“Food Processing Technology:Principles and Practice”; P.J. Fellows;Taylor and Francis, New York, 2000. (ISBN 0-8493-0887-9)
“Fruit and Vegetable Processing”; WJongen; Taylor and Francis; New York,2002. (ISBN 0-8493-1541-7)
____________________________________________________________________________________
Intermediate Course in Food Dehydration and Drying Chapter 8: Page 2.
”How to Dry Foods”; Deanna DeLong;HP Books, Division of Berkley PublishingGroup; New York, 1992. (ISBN 1-55788-050-6)
“Introduction to Food Engineering -Second Edition”; R. Paul Singh andDennis R. Heldman; Academic Press;New York, 1993. (ISBN 0-12-646381-6)
“Perry’s Chemical Engineers’Handbook - Seventh Edition”; RobertH. Perry and Don W. Green editors;McGraw-Hill, New York, 1997.(ISBN 0-07-049841-5, InternationalEdition ISBN 0-07-115448-5)
“Principles of Food Processing”;Dennis R. Heldman and Richard W.Hartel; Chapman and Hall, New York,1997. (ISBN 0-412-99451-8)