interim report - mediobanca s.p.a. · pdf fileparent company of the mediobanca banking group...
TRANSCRIPT

I n t e r im Repo r t
for the six months ended 31 December 2012

LIMITED COMPANySHARE CAPITAL € 430,564,606
HEAD OFFICE: PIAZZETTA ENRICO CuCCIA 1, MILAN, ITALy
REGISTERED AS A BANKPARENT COMPANy OF THE MEDIOBANCA BANKING GROuP
(as required pursuant to Article 154-ter of the Italian Consolidated Finance Act)
In t e r im Repor tfor the six months ended 31 December 2012

translation from the Italian original which remains the definitive version
www.mediobanca. i t

BOARD OF DIRECTORS
Term expires
* Renato Pagliaro Chairman 2014 Dieter Rampl Deputy Chairman 2014 Marco Tronchetti Provera » 2014 * Alberto Nagel Chief Executive Officer 2014* Francesco Saverio Vinci General Manager 2014 Tarak Ben Ammar Director 2014 Gilberto Benetton » 2014 Pier Silvio Berlusconi » 2014 Roberto Bertazzoni » 2014* Angelo Caso’ » 2014 * Maurizio Cereda » 2014 Christian Collin » 2014 Alessandro Decio » 2014* Massimo Di Carlo » 2014 Bruno Ermolli » 2014 Anne Marie Idrac » 2014* Vanessa Labérenne » 2014 Elisabetta Magistretti » 2014 Alberto Pecci » 2014 Carlo Pesenti » 2014 Fabio Roversi Monaco » 2014* Eric Strutz » 2014
* Member of Executive Committee
STATuTORy AuDIT COMMITTEE
Natale Freddi Chairman 2014Maurizia Angelo Comneno Standing Auditor 2014Gabriele Villa » » 2014Mario Busso Alternate Auditor 2014Guido Croci » » 2014
* * *
Massimo Bertolini Head of Company Financial Reporting and Secretary to the Board of Directors
translation from the Italian original which remains the definitive version
www.mediobanca. i t

CONTENTS
Review of Group operations 7
Consolidated financial statements 49
Consolidated balance sheet 50
Consolidated profit and loss account 52
Consolidated comprehensive profit and loss account 53
Statement of changes to consolidated net equity 54
Consolidated cash flow statement Direct method 56
Notes to the accounts 59
Part A - Accounting policies 62
Part B - Notes to consolidated balance sheet 82
Part C - Notes to consolidated profit and loss account 109
Part E - Information on risks and related hedging policies 126
Part F - Information on consolidated capital 171
Part H - Related party disclosure 177
Part I - Share-based payment schemes 179
Part L - Segment reporting 182
Independent auditors’ review report 185
Annexes 189 Consolidated financial statements (ias/ifrs-compliant) 190
Mediobanca S.p.A. financial statements (ias/ifrs-compliant) 194
Declaration by Head of company financial reporting 197
Contents 5

REVIEW OF GROuP
OPERATIONS

Review of Group operations 9
REVIEW OF GROuP
OPERATIONS
The Mediobanca Group earned a profit of €123.8m in the six months under review, virtually double the €63.4m posted at the same stage last year, driven chiefly by lower provisions for the securities and equity investments portfolios, down from €231.1m to €89.5m. The period saw a marked slowdown in the economic scenario and in business levels towards households and companies, along with a pronounced tightening of spreads on government bonds issued by the most highly-indebted Eurozone countries. In this scenario, total income fell by 6.4%, from €973.3m to €911m, with the various income items performing as follows:
– net interest income fell by 6.7%, from €554.6m to €517.7m; this reduction was due to the corporate and investment banking segment, where net interest income was down from €204.5m to €157.4m, reflecting the Bank’s ample liquidity levels despite sharply declining market interest rates and the cost of funding higher than last year;
– net trading income repeated last year’s healthy result, at €106.5m (€112.5m), helped mostly by the reduction in the spread on sovereign debt securities;
– net fee and commission income shows a 14.2% decrease to €201m (€234.4m), due largely to the reduced contribution from consumer credit activity;
– the contribution from the equity-accounted companies rose from €71.8m to €85.8m, due to Gemina (€27.2m, largely non-recurrent) which offset the operating losses incurred by RCS MediaGroup (€18.7m). The contribution from Assicurazioni Generali also increased, from €65.9m to €75.6m.
Operating costs fell by 5.9%, from €399.2m to €375.6m, due to reduced labour costs (down 3.4%) and administrative expenses (down 8.4%).
Loan loss provisions, in a recession scenario, grew by 9.7%, from €212.3m to €232.8m, largely due to the household segment where provisioning rose from €149.2m to €162.8m. The cost of risk, with loan volumes down 10%, rose from 116 bps to 129 bps.
10 Interim Report for the six months ended 31 December 2012
Writedowns to the securities and equity investments portfolios include impairment charges on the stake held in Telco totalling €95m (reflecting a net present value for the Telecom Italia shares of €1.20 per share), €12.2m in writebacks to Greek government securities, and other charges in respect of unlisted AFS shares totalling €6.7m.
Turning to the individual business areas:
– Corporate and investment banking (CIB) recorded a €124.2m net profit (compared with a €37.4m loss last year), helped by the lack of significant provisions for financial assets (this item, indeed, reflects a €9.1m surplus, as opposed to the €175.4m provisions charged last year). Total revenues fell by 13.1%, from €448.2m to €389.6m, while costs declined by 7% (from €161.8m to €150.5m);
– Retail and private banking (RPB) showed a profit of €49.4m, down slightly on the €51.5m posted last year (net of the one-off gain on disposal of a property by Compagnie Monégasque de Banque, worth €44.3m). Total income was flat at €491.9m (€493.5m), reflecting the reduced contribution from net fee and commission income, down 5.4% (from €128m to €121.1m), and resilient net interest income, which climbed from €361.5m to €364.2m. The net profit earned from consumer credit business fell from €58.3m to €33.8m, while the loss posted by CheBanca! reduced from €14.6m to €7.6m, and the profit delivered by private banking also improved significantly, from €8.3m to €25.7m;
– Principal investing (PI) showed a loss of €52m, reflecting the €95m Telco impairment charges referred to, and a reduction in the profits earned by the equity-accounted companies, totalling €54.4m (down from €61.5m last year).
Turning now to the balance-sheet aggregates, funding declined from €55.8bn to €54bn, due to the reduction in bond issuance (from €30bn to €28.1bn), partly offset by a 5.4% increase in CheBanca! retail deposits (up from €11.6bn to €12.3bn). The asset side reflects the reduction in loans and advances to customers (from €36.3bn to €34.1bn), partly offset by an increase in the bond portfolio (up from €11.8bn to €13bn). Treasury assets were stable, at €9.3bn (€9.1bn), as were equity investments (€4.3bn vs €4.4bn). Assets under management in private banking grew from €12.6bn to €13.5bn.

Review of Group operations 11
The Group’s main capital ratios show further improvement, with the core tier 1 ratio up from 11.49% to 11.84%, and the total capital ratio up from 14.16% to 14.76%.
* * *
Significant events that have taken place during the six months under review include:
– approval by the Board of Directors, at a meeting held on 5 September 2012, of the self-assessment process for governing bodies instituted pursuant to the Bank of Italy memo issued on 11 January 2012;
– appointment of PricewaterhouseCoopers to audit the accounts of Mediobanca for the 2013-2021 period;
– renewal of the authorization granted by shareholders, gathered in extraordinary general meeting, to the Board of Directors to increase the company’s share capital in a nominal amount of up to €40m, to be set aside for subscription by Italian and non-Italian professional investors with option rights excluded;
– approval of the internal capital adequacy assessment procedure (ICAAP) required by the regulations in force, and disclosure of the information required under Pillar 3 of the Basel II agreements, to provide a more accurate valuation of the Group’s capital solidity and exposure to risks;
– the new “Procedure in respect of transactions with related parties and their associates” enacting Consob resolution no. 17221 on 12 March 2010 and the Bank of Italy instructions in respect of “Risk assets and conflicts of interest with related parties” issued on 15 December 2011, coming into force on 31 December 2012;
– launch of the Mediobanca Historical Archive named after Vincenzo Maranghi.
* * *

12 Interim Report for the six months ended 31 December 2012
Consolidated financial statements*
The consolidated profit and loss account and balance sheet have been restated – including by business area – in the usual way, in order to provide the most accurate reflection of the Group’s operations. The results are also presented in the format recommended by the Bank of Italy as an annex, along with further details on how the various items have been restated.
CONSOLIDATED PROFIT AND LOSS ACCOUNT(€m)
6 mths to 31/12/11
12 mths to 30/6/12
6 mths to 31/12/12
Y.o.Y. chg. 12/11-12/12 (%)
Profit-and-loss data
Net interest income 554.6 1.069.8 517.7 -6.7
Net trading income 112.5 266.8 106.5 -5.3
Net fee and commission income 234.4 483.5 201.0 -14.2
Equity-accounted companies 71.8 169.5 85.8 +19.5
Total income 973.3 1.989.6 911.0 -6.4
Labour costs (201.3) (393.3) (194.4) -3.4
Administrative expenses (197.9) (395.7) (181.2) -8.4
OPERATING COSTS (399.2) (789.0) (375.6) -5.9
Gains (losses) on AFS, HTM and L&R (37.8) 32.4 (4.6) -87.8
Loan loss provisions (212.3) (468.3) (232.8) +9.7
Provisions for financial assets (231.1) (604.0) (89.5) -61.3
Other profits (losses) 43.7 45.2 — n.s.
Profit before tax 136.6 205.9 208.5 +52.6
Income tax for the period (71.4) (125.5) (85.7) +20.0
Minority interest (1.8) 0.5 1.0 n.m.
Net profit 63.4 80.9 123.8 n.m.
* For a description of the methods by which the data has been restated, see also the section entitled “Significant accounting policies”.
Review of Group operations 13
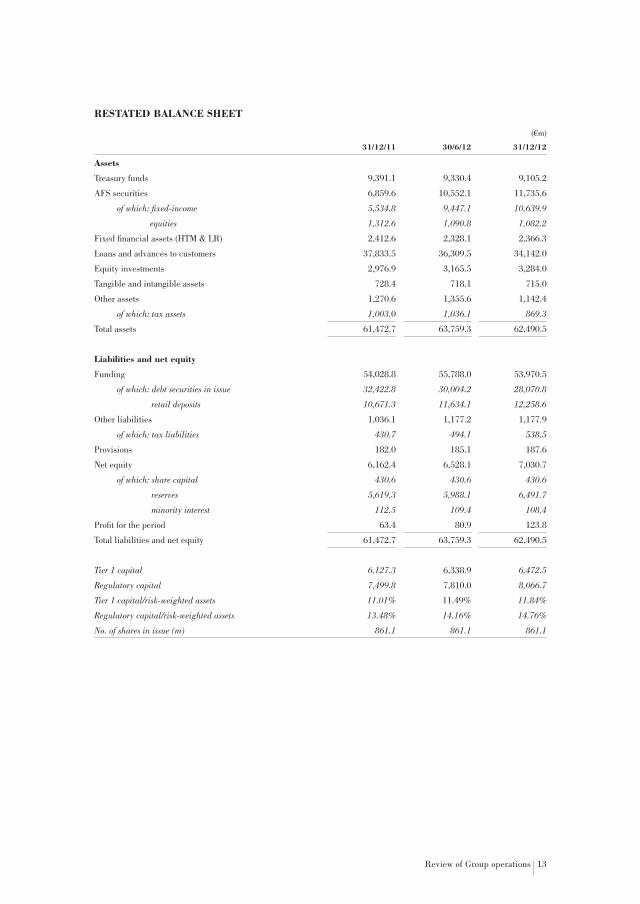
RESTATED BALANCE SHEET
(€m)
31/12/11 30/6/12 31/12/12
Assets
Treasury funds 9,391.1 9,330.4 9,105.2
AFS securities 6,859.6 10,552.1 11,735.6
of which: fixed-income 5,534.8 9,447.1 10,639.9
equities 1,312.6 1,090.8 1,082.2
Fixed financial assets (HTM & LR) 2,412.6 2,328.1 2,366.3
Loans and advances to customers 37,833.5 36,309.5 34,142.0
Equity investments 2,976.9 3,165.5 3,284.0
Tangible and intangible assets 728.4 718.1 715.0
Other assets 1,270.6 1,355.6 1,142.4
of which: tax assets 1,003.0 1,036.1 869.3
Total assets 61,472.7 63,759.3 62,490.5
Liabilities and net equity
Funding 54,028.8 55,788.0 53,970.5
of which: debt securities in issue 32,422.8 30,004.2 28,070.8
retail deposits 10,671.3 11,634.1 12,258.6
Other liabilities 1,036.1 1,177.2 1,177.9
of which: tax liabilities 430.7 494.1 538.5
Provisions 182.0 185.1 187.6
Net equity 6,162.4 6,528.1 7,030.7
of which: share capital 430.6 430.6 430.6
reserves 5,619.3 5,988.1 6,491.7
minority interest 112.5 109.4 108.4
Profit for the period 63.4 80.9 123.8
Total liabilities and net equity 61,472.7 63,759.3 62,490.5
Tier 1 capital 6,127.3 6,338.9 6,472.5
Regulatory capital 7,499.8 7,810.0 8,066.7
Tier 1 capital/risk-weighted assets 11.01% 11.49% 11.84%
Regulatory capital/risk-weighted assets 13.48% 14.16% 14.76%
No. of shares in issue (m) 861.1 861.1 861.1

14 Interim Report for the six months ended 31 December 2012
BALANCE-SHEET/PROFIT-AND-LOSS DATA BY DIVISION(€m)
31 December 2012 Corporate & Investment
Banking
Principal Investing
Retail & Private Banking
Group
Profit-and-loss data
Net interest income 157.4 (3.9) 364.2 517.7
Net trading income 100.3 — 6.6 106.5
Net fee and commission income 101.2 — 121.1 201.0
Equity-accounted companies 30.7 54.4 — 85.8
Total income 389.6 50.5 491.9 911.0
Labour costs (98.2) (2.4) (102.8) (194.4)
Administrative expenses (52.3) (1.7) (143.6) (181.2)
Operating costs (150.5) (4.1) (246.4) (375.6)
Gains (losses) on AFS, HTM and L&R (6.4) — 8.7 (4.6)
Loan loss provisions (58.2) — (174.6) (232.8)
Provisions for financial assets 9.1 (98.1) (3.6) (89.5)
Other profits (losses) — — (1.1) n.s.
Profit before tax 183.6 (51.7) 74.9 208.5
Income tax for the period (60.4) (0.3) (25.5) (85.7)
Minority interest 1.0 — — 1.0
Net profit 124.2 (52.0) 49.4 123.8
Cost/income ratio (%) 38.6 8.1 50.1 41.2
Balance-sheet data
Treasury funds 10,593.3 — 9.885.2 9,105.2
AFS securities 10,384.1 144.8 1,598.1 11,735.6
Fixed financial assets (HTM & LR) 4,050.4 — 2,096.4 2,366.3
Equity investments 414.2 2,779.5 — 3,284.0
Loans and advances to customers 27,955.9 — 14,703.5 34,142.0
of which: to Group companies 8.104.4 — — —
Funding (50,780.9) (259.8) (26,616.8) (53,970.5)
Risk-weighted assets 39,442.9 2,995.6 12,197.3 54,666.7
No. of staff 955 n.m. 2.665 * 3.493
* Includes 127 staff employed by Banca Esperia pro-forma, not included in the Group total.
Notes:
1 Divisions comprise: – CIB (Corporate and investment banking): comprises corporate and investment banking, including leasing, plus the Group’s trading
investments. The companies which form part of this division are Mediobanca, Mediobanca International, MB Securities uSA, Consortium, Prominvestment, SelmaBipiemme Leasing, Palladio Leasing and Teleleasing;
– Principal investing: comprises the Group’s shareholdings in Assicurazioni Generali, RCS MediaGroup and Telco, plus stakes acquired as part of merchant banking activity and investments in private equity funds;
– Retail and private banking: businesses targeting retail customers via consumer credit products, mortgages, deposit accounts, private banking and fiduciary activities. The companies which make up this division are: Compass, CheBanca!, Cofactor, Futuro, Compass RE and Creditech (consumer credit); and Compagnie Monégasque de Banque, Spafid and Prudentia Fiduciaria, plus 50% of Banca Esperia pro-forma (private banking).
2 Sum of divisional data differs from Group total due to: – Banca Esperia being consolidated pro-rata (50%) rather than equity-accounted; – adjustments/differences arising on consolidation between business areas (€2.4m as at 31 December 2011, and €1.7m as at 31 December 2012.

Review of Group operations 15
(€m)
31 December 2011 Corporate & Investment
Banking
Principal Investing
Retail & Private Banking
Group
Profit-and-loss data
Net interest income 204.5 (3.9) 361.5 554.6
Net trading income 107.5 — 4.0 112.5
Net fee and commission income 125.9 — 128.0 234.4
Equity-accounted companies 10.3 61.5 — 71.8
Total income 448.2 57.6 493.5 973.3
Labour costs (107.5) (2.8) (97.9) (201.3)
Administrative expenses (54.3) (1.4) (157.2) (197.9)
Operating costs (161.8) (4.2) (255.1) (399.2)
Gains (losses) on AFS, HTM and L&R 1 (46.7) — 0.5 (37.8)
Loan loss provisions (54.0) — (157.5) (212.3)
Provisions for financial assets (175.4) (55.3) (0.5) (231.1)
Other profits (losses) — — 45.5 43.7
Profit before tax 10.3 (1.9) 126.4 136.6
Income tax for the period (45.9) 4.4 (30.6) (71.4)
Minority interest (1.8) — — (1.8)
Net profit (37.4) 2.5 95.8 63.4
Cost/income ratio (%) 36.1 7.3 51.7 41.0
Balance-sheet data
Treasury funds 10,593.8 — 3,738.0 9,391.1
AFS securities 5,658.0 137.8 1,443.2 6,859.6
Fixed financial assets (HTM & LR) 4,101.1 — 3,671.1 2,412.6
Equity investments 384.2 2,511.2 — 2,976.9
Loans and advances to customers 29,182.8 — 14,606.9 37,833.5
of which: to Group companies 5.606.5 — — —
Funding (47,851.9) (259.8) (22,354.5) (54,028.8)
Risk-weighted assets 40,821.7 3,032.6 11,757.7 55,638.8
No. of staff 998 — 2.657 * 3.520
* Includes 135 staff employed by Banca Esperia pro-forma, not included in the Group total.

16 Interim Report for the six months ended 31 December 2012
Balance sheet
The main balance-sheet items, of which Mediobanca contributes slightly over 60%, performed as follows during the six months under review (comparative data as at 30 June 2012):
Funding – this item fell by 3.3%, from €55,788m to €53,970.5m, due to the reductions in debt securities (from €30,004.2m to €28,070.8m) and bank debt (from €3,284.8m to €2,828.3m), only partly offset by the growth in the CheBanca! retail share (from €11,634.1m to €12,258.6m). The almost €2bn reduction in debt securities in issue (from €30,004.2m to €28,070.8m) reflects redemptions totalling €2.3bn, new issues worth €850m, buybacks on the market amounting to €439m (yielding gains of €13m), and other downward adjustments (exchange rates, amortized cost and hedges) totalling €25m.
Loans and advances to customers – the 6% reduction in this item, from €36,309.5m to € 34,142m, involves all the main segments, in particular corporate lending (down 10.3%, from €17,969.2m to €16,072.2m), which reflects the strong pressure on margins linked to the higher cost of funding, and the early repayment of certain positions; while private banking by CMB bucked the trend.
(€m)
30/6/12 31/12/12 Change (%)
Corporate and investment banking 22,028.3 19,852.9 -9.9
– of which: leasing 4,119.1 3,780.7 -8.2
Retail and private banking 14,281.2 14,289.1 +0.1
– of which: consumer credit 9,197.7 9,174.2 -0.3
mortgage loans 4,310.8 4,273.0 -0.9
private banking 772,7 841,9 +9.0
TOTAL LOANS AND ADVANCES TO CuSTOMERS 36,309.5 34,142.0 -6.0
As a result of these developments, the retail segment’s share of the total loan book increased from 39% to 42%, at the expense of corporate and investment banking (down from 61% to 58%).
Impaired assets (non-performing, sub-standard, restructured and overdue items) rose by 10.7%, from €904.4m to €1,001.3m, increasing as a percentage of total loans in all segments, in part because of the reduction in loans generally: from 1.11% to 1.62% in the large corporate segment, from 5.12% to 6.17% in leasing, from 3.58% to 3.74% in consumer credit, and from 2.42% to 2.73% in mortgage loans. The coverage ratios also generally increased, to reflect the

Review of Group operations 17
following levels: 54% for consumer business (46%), 47% for mortgage loans (unchanged), and 39% for corporate finance (35%). Non-performing items, by contrast, remained stable at €245.7m (30/6/12: €242m), equal to 0.72% of total loans, and concentrated in the property segment (mortgage loans and leasing).
Equity investments – these showed a slight improvement, from €3,165.5m to €3,284m, reflecting a €213.5m increase in book value, €85.8m of which was due to profits for the period and despite the €95m writedown charged to the Telco investment. In particular the value of the following investments increased during the period: Assicurazioni Generali (from €2,356.3m to €2,560.7m, on profit for the period totalling €75.6m); Pirelli (from €117.5m to €123.8m, profit for the period €8.3m); and Gemina (from €194.1m to €221.9m, profit for the period €27.2m). Conversely, the value of the following investments declined: RCS MediaGroup (from €109.4m to €89.5m); Burgo (from €74.1m to €68.5m); and Telco (from €205.9m to €107m). The Telco investment was adjusted in line with the Group’s pro rata share in the company’s net equity, which reflects the writedown charged to the value of the Telecom Italia shares held, with net asset value of €1.20 per share (previously €1.50 per share), and generating a €95m adjustment taken through the profit and loss account. Based on the information currently available, no further impairment charges have been made to the other investments.
Based on prices and holdings as at 31 December 2012, the portfolio of listed equity investments reflects a surplus of market over book value totalling €361m (€233m) based on current prices and holdings.
Percentage of entire share capital *
Book value
Market value at 31.12.12
Gain (Loss)
LISTED EQUITY INVESTMENTS
Assicurazioni Generali 13.24 2,560.7 2,831.7 271.0
RCS MediaGroup, ordinary 14.36 89.5 137.3 47.8
Pirelli & C., ordinary 4.49 123.8 189.7 65.9
Gemina ordinary 12.53 221.9 198.2 (23.7)
2,995.9 3,356.9 361.0
OTHER INVESTMENTS
Telco 11.62 107.0
Banca Esperia 50.0 90.3
Burgo Group 22.13 68.5
Athena Private Equity 24.27 21.5
Fidia 25.0 0.8
288.1
Total Investments 3,284.0
* Percentage of entire share capital.

18 Interim Report for the six months ended 31 December 2012
Fixed financial assets – this portfolio brings together the Group’s holdings in securities held to maturity, worth €1,722.5m (€1,723.3m) and unlisted debt securities (recognized at cost) worth €643.8m (€604.8m). For the six months under review this portfolio shows an increase of €38.2m, following purchases of €65.7m, redemptions and sales worth €32.6m and other upward adjustments totalling €5.1m. Based on prices and holdings at the reporting date, the portfolio showed an implicit gain of €52.8m, compared with a €42m loss as at 30 June 2012. Some 15% of the portfolio consists of Italian debt securities, 55% of bonds issued by banks, insurances and financial companies, and 30% of corporate bonds.
AFS securities – this portfolio is made up of debt securities totalling €10,639.9m (€9,447.1m), equities worth €1,082.2m (€1,090.8m), and stock units in funds held by Compagnie Monégasque de Banque amounting to €13.5m (€14.2m). Some 74% of the bond portfolio consists of sovereign debt securities with an average duration of slightly over two, 21% of bonds issued by banks, insurances and financial companies and the remainder of corporate bonds. Movements during the six months included purchases totalling €4,175.8m (almost all of which in Italian government bonds), disposals and redemptions worth €3,502.6m (yielding a net loss of €1.4m), and other upward adjustments of €509.4m (€38m in adjustments to reflect amortized cost, €459.2m in adjustments to reflect fair value, and €12.2m in writebacks booked as a result of the Greek sovereign debt exchanges). Movements on the equity side consisted of purchases totalling €28.9m, disposals of €43.3m (yielding a net loss of €10m) and upward adjustments to reflect fair value at the reporting date totalling €7.4m net of €6.1m in writedowns.
Percentage shareholding *
Book value at 31/12/12
Adjustments to fair value
Impairment recognized in P&L
Total AFS reserve
Sintonia S.p.A. 6.23 336.3 — — —
Cashes UCI 135.4 0.2 — 0.2
Delmi S.p.A., ordinary 6.0 60.2 — — —
Santè S.A. 9.92 54.4 — (0.8) —
Italmobiliare 9.5 – 5.47 27.0 1.1 — (7.6)
Other listed shares 232.9 15.3 (0.1) 12.1
Other unlisted shares 236.0 (3.1) (5.2) 11.0
Total shares 1,082.2 13.5 (6.1) 15.7
* First figure refers to percentage of shares held in respective category; second figure refers to percentage of total share capital held.
The valuation reserve returned to positive territory, at €139m (compared to minus €349.5m last year), with both segments contributing positively:
Review of Group operations 19
€15.7m for the equity component (as against minus €6.2m) and €121.3m for the bond component (as against minus €344.4m). The latter in particular was boosted by the increase in prices of Italian sovereign debt securities (€37.6m, compared with minus €249.6m), owing to the reduction in the spread, which also impacted positively on bonds issued by financial institutions (€7.1m, compared with minus €86.3m) and on corporate bonds (€53.4m, compared with minus €17.8m).
Treasury assets – these show a slight reduction, from €9,330.4m to €9,105.2m, and include €5,145.8m (€5,427.2m) in short-term liquidity (cash, money market assets and repos), €3,474.6m (€3,992m) in fixed-income securities, €1,151.2m (€833.6m) in equities, and €666.4m (€922.4m) in negative value adjustments to derivatives contracts. Some 54% of the fixed-income securities consist of government securities, 42% of bonds issued by banks, insurances and financial companies, and the remainder of corporate bonds.
Tangible and intangible assets – these fell from €718.1m to €715m, taking into account depreciation and amortization charges for the period totalling €19.8m; the increases chiefly involve upgrades to IT systems (€4.1m), collection of a leased property after the leasing contract was converted (€7.8m), costs incurred in refurbishing and expanding the Seteci property in Milan (€4.9m, including the systems). Goodwill and brands continue to be held at book values of €365.9m and €6.3m respectively. Provisions – this item comprises the provision for liabilities and charges, which stands at €160.8m (€160.4m) and the staff severance indemnity provision amounting to €26.8m (€24.7m); the former reflects further provisions amounting to €1.2m, while the latter reflects the adjustment made to the actuarial reserve.
Net equity – net equity increased by €503.6m, from €6,418.7m to €6,922.3m, on the back of the €329.6m rise in the valuation reserve, provision of undistributed earnings from the previous financial year (€38.7m), and application of the equity method (€127.6m, €126.3m of which in the valuation reserve). The AFS securities portfolio reserve returned to positive territory at €99.7m (compared with minus €236m), while the cash flow hedge reserve remained negative at minus €127.2m (minus €121m), and the share in the equity-accounted companies’ valuation reserve increased from €6.5m to €132.8m. In detail, the AFS securities portfolio reserve was boosted by a €320.2m increase due to adjustments to reflect fair value

20 Interim Report for the six months ended 31 December 2012
at the reporting date, plus the reversal of negative reserves arising on disposals and impairment totalling €15.5m. All three segments closed the period under review in positive territory: fixed-income €83.4m (minus €231.2m); equities €14.4m (minus €6m), and other securities €1.9m (€1.1m).
* * *
At the reporting date there were a total of ten significant exposures to groups of customers (including market risk and equity investments), i.e. above 10% of regulatory capital (one more than at 30 June 2012), corresponding to a gross exposure of €15,074.2m (€12,579.3m).

Review of Group operations 21
Profit and loss account
Net interest income – this item fell by 6.7%, from €554.6m to €517.7m, due to the widespread increase in the cost of funding in connection with the repayment of amounts deposited on favourable terms that has accompanied the reduction in returns on treasury assets.
Net trading income – net trading income remained more or less stable at €103.6m (31/12/11: €105m), reflecting a contribution spread evenly across the two quarters, amounting to €59.8m and €43.8m respectively. Overall fixed-income trading contributed €83.1m, while equity trading added €20.5m. The heading also includes dividends received on AFS shares totalling €2.9m (€7.5m).
Net fee and commission income – this item fell by 14.2%, from €234.4m to €201m, due to lower business volumes in corporate and investment banking (down from €125.3m to €100.4m) and consumer activities (down from €87.9m to €72.3m).
Operating costs – this item fell by 5.9%, from €399.2m to €375.6m, in line with the reduced business volumes, and consisting of:
– labour costs amounting to €194.4m (€201.3m), down 3.4%. These include €3.9m (€4.5m) in directors’ emoluments, and €7.8m (€5m) in notional expenses linked to performance share and stock option schemes;
– sundry costs and expenses amounting to €181.2m (€197.9m), down 8.4%; including €20.8m (€21.6m) in depreciation charges, and administrative expenses totalling €159.1m (€174.9m), made up as follows:

22 Interim Report for the six months ended 31 December 2012
(€m)
6 mths to 31/12/11 6 mths to 31/12/12
Legal, tax and other professional services 16.8 14.1
Bad debt recovery 14.4 15.7
Marketing and communications 33.5 26.2
Rent and property maintenance charges 20.0 17.9
EDP 17.1 17.2
Financial information subscriptions 12.9 13.4
Banking services, collection and payment charges 10.8 10.7
Operating expenses 26.2 24.6
Other labour costs 11.8 9.3
Other costs 3.9 4.9
Direct and indirect taxes (net of amounts withheld) 7.5 5.1
TOTAL 174.9 159.1
Loan loss provisions – these grew by 9.7% during the six months under review, from €212.3m to €232.8m, due to a deterioration in the risk profile of households and companies; the provisions chiefly affect consumer credit (where provisioning increased from €149.2m to €162.8m) and wholesale banking (up from €40.1m to €46.5m).
Provisions for other financial assets – this item reflects the adjustments taken in respect of Telco (€95m) and unlisted AFS equities (€6.7m), but also the reversal of charges taken previously on Greek government securities (€12.2m).
Taxation – this item totalled €85.7m, as against €71.4m last year. Mediobanca (as consolidating entity) has adopted tax consolidation, which includes Compass, SelmaBipiemme Leasing, Palladio Leasing, CheBanca!, Cofactor and Futuro. Relations between the consolidating and consolidated entities are governed by bilateral agreements regulating cash flows, exchanges of information and the individual companies’ responsibilities versus the revenue authorities.

Review of Group operations 23
Balance-sheet/profit-and-loss data by division
A review of the Group’s performance in its main areas of operation is provided below, according to the customary segmentation.
CORPORATE AND INVESTMENT BANkING (wHOLESALE BANkING AND LEASING)(€m)
6 mths to 31/12/11
12 mths to 30/6/12
6 mths to 31/12/12
Y.o.Y. chg. 12/11-12/12
Profit-and-loss data
Net interest income 204.5 381.6 157.4 -23.0
Net trading income 107.5 256.4 100.3 -6.7
Net fee and commission income 125.9 275.6 101.2 -19.6
Equity-accounted companies 10.3 19.7 30.7 n.m.
Total income 448.2 933.3 389.6 -13.1
Labour costs (107.5) (202.2) (98.2) -8.7
Administrative expenses (54.3) (110.9) (52.3) -3.7
Operating costs (161.8) (313.1) (150.5) -7.0
Gains (losses) on AFS, HTM and L&R (46.7) 23.8 (6.4) -86.3
Loan loss provisions (54.0) (134.2) (58.2) +7.8
Provisions for financial assets (175.4) (405.5) 9.1 n.m.
Other profits (losses) — — — n.m.
Profit before tax 10.3 104.3 183.6 n.m.
Income tax for the period (45.9) (85.1) (60.4) +31.6
Minority interest (1.8) 0.5 1.0 n.m.
Net profit (37.4) 19.7 124.2 n.m.
Cost/income ratio (%) 36.1 33.5 38.6
6 mths to 31/12/11
12 mths to 30/6/12
6 mths to 31/12/12
Balnnce-sheet data
Treasury funds 10,593.8 10,641.7 10,593.3
AFS securities 5,658.0 9,210.3 10,384.1
Fixed financial assets (HTM & LR) 4,101.1 4,013.4 4,050.4
Equity investments 384.2 385.8 414.2
Loans and advances to customers 29,182.8 30,519.7 27,955.9
of which: to Group companies 5,606.5 8,493.3 8,104.4
Funding (47,851.9) (52,552.8) (50,780.9)

24 Interim Report for the six months ended 31 December 2012
(€m)
Corporate e Investment Banking 31 December 2012 wholesale Leasing Total
Net interest income 133.9 23.5 157.4
Net trading income 100.6 (0.3) 100.3
Net fee and commission income 100.4 0.8 101.2
Equity-accounted companies 30.7 — 30.7
Total income 365.6 24.0 389.6
Labour costs (89.3) (8.9) (98.2)
Administrative expenses (45.8) (6.5) (52.3)
Operating costs (135.1) (15.4) (150.5)
Gains (losses) on AFS, HTM and L&R (6.4) — (6.4)
Loan loss provisions (46.5) (11.7) (58.2)
Provisions for financial assets 9.1 — 9.1
Other profits (losses) — — —
Profit before tax 186.7 (3.1) 183.6
Income tax for the period (60.7) 0.3 (60.4)
Minority interest — 1.0 1.0
Net profit 126.0 (1.8) 124.2
Cost/income ratio (%) 37.0 64.2 38.6
Other assets 25,317.4 124.6 25,442.0
Loans and advances to customers 24,175.1 3,780.8 27,955.9
of which: to Group companies 8,104.4 — 8,104.4
New loans — 126.2 —
No. of staff 786 169 955

Review of Group operations 25
(€m)
Corporate e Investment Banking 31 December 2011 wholesale Leasing Total
Net interest income 171.2 33.3 204.5
Net trading income 108.2 (0.7) 107.5
Net fee and commission income 123.0 2.9 125.9
Equity-accounted companies 10.3 — 10.3
Total income 412.7 35.5 448.2
Labour costs (97.9) (9.6) (107.5)
Administrative expenses (48.7) (5.6) (54.3)
Operating costs (146.6) (15.2) (161.8)
Gains (losses) on AFS, HTM and L&R (46.7) — (46.7)
Loan loss provisions (40.1) (13.9) (54.0)
Provisions for financial assets (175.4) — (175.4)
Other profits (losses) — — —
Profit before tax 3.9 6.4 10.3
Income tax for the period (42.1) (3.8) (45.9)
Minority interest — (1.8) (1.8)
Net profit (38.2) 0.8 (37.4)
Cost/income ratio (%) 35.5 42.8 36.1
Other assets 20,665.6 71.5 20,737.1
Loans and advances to customers 24,869.2 4,313.6 29,182.8
of which: to Group companies 5,606.5 — 5,606.5
New loans n.a. 494.9 —
No. of staff 794 204 998
This division showed a net profit of €124.2m for the six months, compared with a €37.4m loss at the same time last year, due to lower net provisions for to financial assets (€175.4m in provisions last year, as against €9.1m in writebacks this year). Total income fell by 13.1%, from €448.2 to €389.6m, reflecting the following performances by the individual items:
– net interest income fell, from €204.5m to €157.4m, reflecting the reduction in risk profile and declining returns; the contribution from leasing business fell from €33.3m to €23.5m;
– net trading income showed resilience, closing at €100.3m (€107.5m), due to a good performance from the fixed-income segment (€76.9m);
– net fee and commission income declined from €125.9m to €101.2m, chiefly as a result of the reduction in lending activity linked to the shrinking margins available given the widespread deterioration in borrowers’ credit profiles.
The fall in operating costs, which were down 7% (from €161.8m to €150.5m), was due to both labour costs (down from €107.5m to €98.2m) and administrative expenses (from €54.3m to €52.3m).

26 Interim Report for the six months ended 31 December 2012
Loan loss provisions of €58.2m reflect a slight increase compared to the same time last year (€54m), in particular in the wholesale banking segment, where provisions were up from €40.1m to €46.5m.
The securities portfolio showed a profit of €2.7m, compared with a loss of €222.1m at the same time last year, representing the combined effect of net losses on AFS securities (€6.4m), writebacks in respect of Greek sovereign debt instruments (€12.2m), and writedowns to holdings in unlisted equities (€3.1m).
Lending and structured finance – lending to corporates, excluding Group companies, declined from €22,026.4m to €19,851.5m during the six months under review. The higher cost of funding drove a reduction in the exposure to non-domestic customers, from 40% to 36%: Germany 7.7% (10.8%), France 7.9% (10.6%), and Spain 6.3% (7.3%). At the reporting date bad debts (i.e. non-performing, sub-standard, restructured and items more than 90 days overdue) totalled €272.1m (€198.5m), net of €174.3m (€107.9m) in provisions; net impaired assets (with no non-performing items) accounted for 1.62% (1.11%) of the total loan book. Overall this area generated around 40% of the Group’s wholesale revenues.
Funding and treasury accounts – funding, which declined from €52,552.8m to €50,780.9m, consists of: €30,223.2m (€33,090.5m) in debt securities in issue, €10,239.4m (€9,289.3m) in deposits and current accounts, a €7.5bn long-term loan from the European Central Bank (unchanged), and €2,818.3m (€2,641.5m) in other forms of funding. Treasury accounts consist of €6,972.2m (€7,282.4m) in short-term liquidity, €3,143m (€3,578.3m) in debt securities, €983.7m (€553.9m) in equities, €505.6m (€772.9m) in downward adjustments to derivatives contracts, €2,368.3m (€2,401.2m) of which versus other Group companies. Some 58% of the fixed-income portfolio consists of government securities, 38% of bonds issued by banks, insurances and financial companies, and the remainder of corporate bonds. Overall this area generated approx. 30% of the Group’s revenues from wholesale banking.
Fixed financial assets and AFS bonds – these include financial assets held to maturity totalling €1,715m (€1,716.1m), unlisted debt securities (recognized at cost) worth €2,335.4m (€2,297.3m) and AFS bonds amounting to €9,459.6m (€8,281.6m). During the period under review there were purchases totalling €4,217.8m (90% of which Italian government securities in the AFS segment), disposals and redemptions worth €3,460.5m, writebacks amounting to €12.2m (in respect of Greek sovereign debt securities), upward adjustments of €42.9m

Review of Group operations 27
to reflect amortized cost, and upward adjustments to reflect fair value totalling €395.3m. Overall the implicit loss on this portfolio at the reporting date came to €164.6m, €127.8m of which is recognized in the net equity valuation reserves (60% of which is attributable to Italian government securities).
Equity investments and AFS shares – for operating purposes this portfolio brings together the Group’s holdings in equities and convertible bonds held as available for sale, plus its investments in Gemina, Pirelli & C. and Burgo Group. As at 31 December 2012, the portfolio was worth €1,338.7m (€1,314.5m) after purchases totalling €24m, disposals of €38.3m (generating losses of €13.4m), impairment charges on AFS shares amounting to €3m, upward adjustments to reflect fair value at the reporting date of €14.7m, and pro-rata upward adjustments to net equity amounting to €28.4m (representing the difference between €30.7m in profits and €2.3m in negative reserves). The net equity reserve for AFS shares returned to positive territory at €6.1m (compared with minus €20.4m as at 30 June 2012).
As for the equity-accounted companies:
Gemina: the 12.53% stake owned in this company is recognized in consolidated net equity at €221.9m, after booking profits for the period totalling €27.2m (€25.9m of which in respect of a non-recurring asset disposal), and positive asset adjustments totalling €0.5m.
Pirelli & C.: the 4.49% stake owned in this company is recognized at €123.8m, after profits for the period totalling €8.3m, and writedowns to assets totalling €1.9m.
Burgo Group: the 22.13% stake in this company is recognized pro-rata to the Group’s share in its net equity at €68.5m, after losses for the period totalling €4.8m and €0.9m in asset adjustments, linked to the positive performance of the valuation reserves (AFS holdings and cash flow hedges).
Investment banking – the results for the six months in this area show advisory mandates holding up well with €25m (€19m) in fee income generated from around 20 deals, which include the sale of Valentino to Mayhoola, the Seat PG debt restructuring, the sale of a 30% stake in SNAM to Cassa Depositi e Prestiti, the acquisition of Oystar North America by the Coesia group, the sale of Biverbanca by the MPS group, and the acquisition of Marcolin by the PAI fund. Capital market activity was more dynamic, with virtually double the number of mandates but fees stable (at €32m). The most important deals on the equity side during the six-month period were the Fondiaria-SAI, uGF and Banco Popular rights issues, plus sale by ENI of part its stake in Galp via a
28 Interim Report for the six months ended 31 December 2012
placement to institutional investors and issuance of a convertible bond. The main DCM deals, meanwhile, saw the Bank take senior roles in subordinated issues by Assicurazioni Generali and SNAM (four issues in total), Enel, Atlantia, Telefonica, Terna, A2A, Enagas and Rottapharm. Overall this area generated around 15% of the Group’s revenues from wholesale banking.
Leasing – this area of operations generated a €1.8m loss in the six months, compared to a €0.8m profit at the same time last year, due above all to the reduction in net interest income, which fell by 29.4% from €33.3m to €23.5m, on basically flat operating costs (at €15.4m) and declining cost of risk (down from €13.9m to €11.7m). During the period under review loans and advances to customers fell from €4,119.2m to €3,780.8m, partly as a result of the reduced demand for credit which led to a sharp reduction in new loans being granted (down from €494.9m to €126.2m). Bad debts (i.e. non-performing, sub-standard, restructured and items more than 90 days overdue) rose from €210.8m to €233.2m, but with a reduction of almost 15% in the non-performing items (from €58m to €50m).
PRINCIPAL INVESTING(€m)
6 mths to 31/12/11
12 mths to 30/6/12
6 mths to 31/12/12
Y.o.Y. chg.12/11-12/12 (%)
Profit-and-loss data
Net interest income (3.9) (8.8) (3.9) n.m.
Net trading income — — — n.m.
Net fee and commission income — — — n.m.
Equity-accounted companies 61.5 147.8 54.4 -11.5
Total income 57.6 139.0 50.5 -12.3
Labour costs (2.8) (5.6) (2.4) -14.3
Administrative expenses (1.4) (2.8) (1.7) +21.4
Operating costs (4.2) (8.4) (4.1) -2.4
Gains (losses) on AFS, HTM and L&R — — — n.m.
Loan loss provisions — — — n.m.
Provisions for financial assets (55.3) (197.8) (98.1) +77.4
Other profits (losses) — — — n.m.
Profit before tax (1.9) (67.2) (51.7) n.m.
Income tax for the period 4.4 3.7 (0.3) n.m.
Net profit 2.5 (63.5) (52.0) n.m.
(€m)
6 mths to 31/12/11
12 mths to 30/6/12
6 mths to 31/12/12
AFS securities 137.8 146.3 144.8
Equity investments 2,511.2 2,696.4 2,779.5

Review of Group operations 29
This division’s results for the six months show a loss of €52m, following the writedown to the Telco investment (€95m) and the reduced contribution from the equity-accounted companies (€54.4m, compared with €61.5m), reflecting in particular the operating losses incurred by RCS MediaGroup (€18.7m).
The book value of the investments increased from €2,696.4m to €2,779.5m, due to asset differences arising from application of the equity method (€123.7m). The remainder of the portfolio, which consists of investments made as part of merchant banking activity and in private equity funds, and accounted for as part of the AFS securities portfolio, declined from €146.3m to €144.8m, following calls on capital amounting to €3.2m, adjustments taken through profit and loss account totalling €3.1m, and upward adjustments to reflect fair value of €1.7m.
With respect to the individual shareholdings:
– Assicurazioni Generali: at 31 December 2012, this investment, stable at 13.24% of the company’s share capital was carried at €2,560.7m (€2,356.3m) reflecting the Group’s pro-rata share in the profits for the period (€75.6m) and asset adjustments totalling €128.8m.
– Telco: this investment, which represents 11.62% of Telco’s share capital, is carried at €107m (€205.9m), and reflects the Group’s pro-rata share in the company’s net equity following the writedown to the investment in Telecom Italia (22.4% of this company’s ordinary share capital) to reflect a book value of €1.20 per share (previously €1.50 per share).
– RCS MediaGroup: the Group holds an interest of 14.94% in the ordinary share capital of this company, and 14.36% of its total share capital, which is carried at €89.5m, reflecting a pro-rata loss of €18.7m following the operating losses incurred by the company in the second and third quarters of its financial year.
– Athena Private Equity: the Group holds an interest of 24.27% in the fund, the book value of which declines to €21.5m following a €2.4m downward adjustmentreflecting writedowns to certain assets.

30 Interim Report for the six months ended 31 December 2012
RETAIL AND PRIVATE BANkING(€m)
6 mths to 31/12/11
12 mths to 30/6/12
6 mths to 31/12/12
Y.o.Y. chg.12/11-12/12 (%)
Profit-and-loss data
Net interest income 361.5 707.2 364.2 +0.7
Net trading income 4.0 9.9 6.6 +65.0
Net fee and commission income 128.0 246.4 121.1 -5.4
Total income 493.5 963.5 491.9 -0.3
Labour costs (97.9) (199.4) (102.8) +5.0
Administrative expenses (157.2) (311.6) (143.6) -8.7
Operating costs (255.1) (511.0) (246.4) -3.4
Gains (losses) on AFS, HTM and L&R 0.5 1.5 8.7 n.m.
Loan loss provisions (157.5) (333.3) (174.6) +10.9
Provisions for financial assets (0.5) (0.7) (3.6) n.m.
Other profits (losses) 45.5 47.5 (1.1) n.m.
Profit before tax 126.4 167.5 74.9 -40.7
Income tax for the period (30.6) (46.3) (25.5) -16.7
Net profit 95.8 121.2 49.4 -48.4
(€m)
6 mths to 31/12/11
12 mths to 30/6/12
6 mths to 31/12/12
Balance-sheet data
Treasury funds 3,738.0 8,816.5 9,885.2
AFS securities 1,443.2 1,694.6 1,598.1
Fixed financial assets (HTM & LR) 3,671.1 2,731.4 2,096.4
Loans and advances to customers 14,606.9 14,661.0 14,703.5
Funding (22,354.5) (26,574.1) (26,616.8)
This division reported a profit of €49.4m for the six months, down slightly on the €51.5m reported last year (net of the €44.3m gain realized on disposal of the property owned by CMB), as a result of:
– revenues flat at €491.9m (€493.5), due to a slight, 0.7% increase in net interest income (from €361.5m to €364.2m), which offset the reduced contribution from net fee and commission income (down 5.4%, from €128m to €121.1m) following a reduction in the volumes of new loans granted (down from €2,878.7m to €2,464.6m);
– operating costs down 3.4%, from €255.1m to €246.4m, due to a 19% reduction in costs incurred by CheBanca! (down from €89.1m to €72.2m);
– loan loss provisions up 10.9% (from €157.5m to €174.6m) for both segments: consumer credit (up from €149.2m to €162.8m) and retail (up from €7.1m to €10.8m).

Review of Group operations 31
Loans and advances to customers, virtually all of which are attributable to consumer finance and residential mortgage loans, were unchanged at €14.7bn. CheBanca! retail deposits, meanwhile, rose from €11.6bn to €12.3bn.
A breakdown of this division’s results by business segment is provided below:
(€m)
Retail & Private Banking 31 December 2012 Consumer Credit
Retail Banking
Private Banking
Total
Net interest income 270.6 72.3 21.3 364.2
Net trading income — (0.3) 6.9 6.6
Net fee and commission income 76.3 6.5 38.3 121.1
Equity-accounted companies — — — —
Total income 346.9 78.5 66.5 491.9
Labour costs (44.8) (29.8) (28.2) (102.8)
Administrative expenses (84.5) (42.4) (16.7) (143.6)
Operating costs (129.3) (72.2) (44.9) (246.4)
Gains (losses) on AFS, HTM and L&R — — 8.7 8.7
Loan loss provisions (162.8) (10.8) (1.0) (174.6)
Provisions for financial assets — — (3.6) (3.6)
Other profits (losses) — — (1.1) (1.1)
Profit before tax 54.8 (4.5) 24.6 74.9
Income tax for the period (21.0) (3.1) (1.4) (25.5)
Minority interest — — — —
Net profit 33.8 (7.6) 23.2 49.4
Cost/Income (%) 37.3 n.m. 67.5 50.1
Other assets 457.8 11,666.3 1,455.6 13,579.7
Loans and advances to customers 9,174.2 4,273.0 1,256.3 14,703.5
New loans 2,338.6 126.0 — 2,464.6
No. of branches 158 44 — 202
No. of staff 1,412 914 339 2,665

32 Interim Report for the six months ended 31 December 2012
(€m)
Retail & Private Banking 31 December 2011 Consumer Credit
Retail Banking
Private Banking
Total
Net interest income 269.5 77.9 14.1 361.5
Net trading income 0.2 0.1 3.7 4.0
Net fee and commission income 91.6 3.6 32.8 128.0
Valorizzazione equity method — — — —
TOTAL INCOME 361.3 81.6 50.6 493.5
Labour costs (42.4) (30.2) (25.3) (97.9)
Administrative expenses (83.1) (58.9) (15.2) (157.2)
OPERATING COSTS (125.5) (89.1) (40.5) (255.1)
Gains (losses) on AFS, HTM and L&R — 0.6 (0.1) 0.5
Loan loss provisions (149.2) (7.1) (1.2) (157.5)
Provisions for financial assets — — (0.5) (0.5)
Other profits (losses) — — 45.5 45.5
PROFIT BEFORE TAX 86.6 (14.0) 53.8 126.4
Income tax for the period (28.3) (0.6) (1.7) (30.6)
Minority interest — — — —
NET PROFIT 58.3 (14.6) 52.1 95.8
Cost/Income (%) 34.7 n.m. 80.0 51.7
Other assets 437.8 7,005.5 1,409.0 8,852.3
Loans and advances to customers 9,131.4 4,327.1 1,148.4 14,606.9
New loans 2,467.5 411.2 — 2,878.7
No. of branches 150 44 — 194
No. of staff 1,364 938 355 2,657
Turning now to the individual sectors:
– consumer credit showed net profit declining from €58.3m to €33.8m, reflecting a 4% reduction in total income, from €361.3m to €346.9m, linked to the 16.7% reduction in fee income from €91.6m to €76.3m, despite net interest income increasing by 0.4%, from €269.5m to €270.6m. Operating costs rose slightly, by 3%, from €125.5m to €129.3m, mostly due to staff expenses, while loan loss provisions grew from €149.2m to €162.8m, with the cost of risk rising from 340 bps to 356 bps, in line with expectations. New loans for the six months totalled €2,338.6m, down 5% on the €2,467.5m recorded in the corresponding period last year, as a result of the widespread reduction in demand and a more selective approach to new lending; while loans and advances to customers declined 0.3%, from €9,197.7m to €9,174.2m. Bad debts (i.e. non-performing, sub-standard, restructured and items more than 90 days overdue) increased from €328.3m to €342.1m, and account for 3.7% (3.6%) of the total loan book.

Review of Group operations 33
– Retail banking reflects a net loss of €7.6m, representing an improvement on the €14.6m net loss at the same stage last year, following a 3.8% reduction in total income (from €81.6m to €78.5m), as well as a significant decrease in operating costs (which were down 19%, from €89.1m to €72.2m) and a rise in the cost of risk (which grew from €7.1m to €10.8m). Mortgage loans decreased slightly, by 0.9%, from €4,310.8m to €4,273m, on a significant reduction in new loans (down from €441.2 to €126m); dad debts (i.e. non-performing, sub-standard, restructured and items more than 90 days overdue) increased from €104.4m to €116.6m, or from 2.4% of the loan book to 2.7%, with the coverage ratio unchanged at 47%. Funding raised from the retail channel amounted to €12,258.6m, up 5.4% on the €11,634.1m reported at 30 June 2012, €398.4m (€334.8m) of which consisting of current accounts and prepaid cards.
– Private banking showed a profit of €23.2m, on a 31.4% increase in total revenues (from €50.6m to €66.5m) and despite a slight increase in operating costs (which rose from €40.5m to €44.9m). During the six months under review gains on the AFS portfolio of €8.7m were recorded, offset by €3.6m in adjustments to securities, loan loss provisions totalling €1m and extraordinary charges amounting to €1.1m. Assets under management on a discretionary/non-discretionary basis totalled €13.5bn (30/6/12: €12.6bn), €6.6bn (€6bn) of which attributable to CMB and €6.9bn (€6.6bn) to Banca Esperia.

34 Interim Report for the six months ended 31 December 2012
(€m)
Private Banking 31 December 2012 CMB Esperia Others Total
Net interest income 17.2 3.9 0.2 21.3
Net trading income 7.0 (0.1) — 6.9
Net fee and commission income 19.8 16.0 2.5 38.3
TOTAL INCOME 44.0 19.8 2.7 66.5
Labour costs (13.3) (12.9) (2.0) (28.2)
Administrative expenses (9.7) (6.4) (0.6) (16.7)
OPERATING COSTS (23.0) (19.3) (2.6) (44.9)
Gains (losses) on AFS, HTM and L&R 3.4 5.3 — 8.7
Loan loss provisions (1.0) (0.1) 0.1 (1.0)
Provisions for financial assets (0.6) (3.1) 0.1 (3.6)
Other profits (losses) — (1.1) — (1.1)
PROFIT BEFORE TAX 22.8 1.5 0.3 24.6
Income tax for the period — (0.8) (0.6) (1.4)
NET PROFIT 22.8 0.7 (0.3) 23.2
Cost/Income (%) 52.3 n.a. n.a. 67.5
Asset under management 6,554.0 6,911.1 n.a. 13,465.1
Securities held on a trustee basis n.a. n.a. 1,481.9 1,481.9

Review of Group operations 35
(€m)
Private Banking 31 December 2011 CMB Esperia Others Total
Net interest income 12.3 1.6 0.2 14.1
Net trading income 4.1 (0.4) — 3.7
Net fee and commission income 15.9 14.1 2.8 32.8
Equity-accounted companies — — — n.m.
TOTAL INCOME 32.3 15.3 3.0 50.6
Labour costs (13.4) (10.3) (1.6) (25.3)
Administrative expenses (9.1) (5.6) (0.5) (15.2)
OPERATING COSTS (22.5) (15.9) (2.1) (40.5)
Gains (losses) on AFS, HTM and L&R — (0.3) 0.2 (0.1)
Loan loss provisions (2.0) 0.8 — (1.2)
Provisions for financial assets (0.5) — — (0.5)
Other profits (losses) 43.9 1.6 — 45.5
PROFIT BEFORE TAX 51.2 1.5 1.1 53.8
Income tax for the period — (1.3) (0.4) (1.7)
Minority interest — — — n.m.
NET PROFIT 51.2 0.2 0.7 52.1
Cost/Income (%) 69.7 n.m. 70.0 80.0
Asset under management 6,202.0 6,408.5 — 12,610.5
Securities held on a trustee basis n.a. n.a. 1,458.7 1,458.7

36 Interim Report for the six months ended 31 December 2012
Review of Group Company performances
Mediobanca
For the six months ended 31 December 2012, Mediobanca reported to net loss of €21.2m, compared with €124.3m last year, reflecting the writedown to the Telco investment (€99.5m) and the reduction in total income, from €374.9m to €320.3m, with the main items performing as follows:
– net interest income fell by 21%, from €150.9m to €119.2m, due to decreasing returns;
– net trading income (profits from trading activities and dividends) was virtually unchanged at €102.7m (€104.1m);
– net fee and commission income fell by 17.9%, to reach €98.4m (down from €119.9m last year), as a result of the reduced contribution from lending activity.
The 7.2% decrease in operating costs, from €150.9m to €140.1m, reflects an €8.9m reduction in labour costs due to a gradual scaling down of the variable remuneration component, and a €1.9m reduction in other administrative expenses.
Movements in the fixed investments and AFS securities portfolios generated losses totalling €6.4m, representing an improvement on the €38m loss reported last year.
Loan loss provisions totalled €46.5m, compared to €39.7m twelve months previously, whereas provisions for financial assets, as well as the charge taken on Telco, reflect net writebacks totalling €6.1m, boosted by the decision to participate in the Greek public debt buyback (€12.2m).
With regard to the main balance-sheet items:
– funding declined by €2,065.4m, from €50,056.4m to €47,991m, due to the reduction in debt securities in issue (from €31,561.8m to €29,218.5m) following redemptions and buybacks of over €3bn (€1bn of which involved intra-group deals) partly offset by €727.2m worth of new placements;

Review of Group operations 37
– loans and advances to customers fell 9.4%, from €27,219.5m, to €24,673m, with €10,860.6m (€12,448.1m) representing the share of loans to Group companies;
– equity investments increased in value from €3,214.4m to €3,283.7m, following the €150m capital increase by CheBanca!, the acquisition of 1,384,240 Assicurazioni Generali shares (€18.8m) from Spafid, and the writedown to the Telco investment totalling €99.5m already referred to on several occasions. Market prices as at end-December 2012 reflected a surplus of fair over book value of €1,821.2m (€1,693m based on current prices);
– fixed financial assets increased from €4,013.4m to €4,050.4m, following purchases totalling €64.8m and redemptions amounting to €31.5m; the implicit gain on this portfolio as at end-December 2012 amounted to €36.8m, compared with a €34.6m loss at the same stage one year previously;
– AFS securities increased from €9,356.7m to €10,528.9m, and comprise €9,459.6m (€8,281.7m) in debt securities, and €1,069.3m (€1,075m) in equities and convertible bonds. The increase in debt securities is the result of net purchases of €724.6m, and upward value adjustments to reflect fair value at the reporting date of €395.3m, plus writebacks to holdings in Greek government bonds amounting to €12.2m. As for equities, these fell by €5.7m during the period, as a result of net disposals totalling €11.1m, upward value adjustments to reflect fair value of €13m and writedowns amounting to €6.1m;
– treasury funds totalled €10,408.3m (€10,760.6m), and include €6,736.8m (€7,380.8m) in short-term liquidity, €4,154.4m (€4,148.9m) in securities, €24.7m in loans, and €507.9m (€769.1m) in negative valuations of derivatives contracts; intra-group positions amount to €2,837.7m (€3,315.4m);
– the Bank’s net equity of €4,675.4m (30/6/12: €4,621.7m), includes: share capital amounting to €430.6m, positive valuation reserves totalling €91.5m, and other reserves and retained earnings amounting to €4,153.3m.
* * *

38 Interim Report for the six months ended 31 December 2012
RESTATED PROFIT AND LOSS ACCOUNT (*)(€m)
6 mths to 31/12/11
12 mths to 30/6/12
6 mths to 31/12/12
Y.o.Y. chg. 12/11-12/12
Net interest income 150.9 276.3 119.2 -21.0
Net trading income 104.1 253.1 102.7 -1.3
Net fee and commission income 119.9 264.8 98.4 -17.9
Equity-accounted companies — 47.4 — n.m.
TOTAL INCOME 374.9 841.6 320.3 -14.6
Labour costs (101.5) (188.7) (92.6) -8.8
Administrative expenses (49.4) (100.3) (47.5) -3.8
OPERATING COSTS (150.9) (289.0) (140.1) -7.2
Gains (losses) on AFS, HTM and L&R (38.0) 32.3 (6.4) -83.2
Loan loss provisions (39.7) (106.8) (46.5) +17.1
Provisions for financial assets (175.4) (412.4) 6.0 n.m.
Impairment to equity investment (57.2) (198.4) (99.5) +74.0
PROFIT BEFORE TAX (86.3) (132.7) 33.8 n.s.
Income tax for the period (38.0) (67.5) (55.0) +44.7
NET PROFIT (124.3) (200.2) (21.2) -82.9
(*) The financial statements are also reported in accordance with the recommendations made by the Bank of Italy in the annex hereto, along with further details on how the various items have been restated.

Review of Group operations 39
RESTATED BALANCE SHEET (*)(€m)
31/12/11 30/6/12 31/12/12
Assets
Treasury funds 11,027.4 10,760.6 10,408.3
AFS securities 5,795.7 9,356.7 10,528.9
Fixed financial assets (HTM & LR) 4,101.1 4,013.4 4,050.4
Loans and advances to customers 25,287.6 27,219.5 24,673.0
Equity investments 2,637.3 3,214.4 3,283.7
Tangible and intangible assets 132.7 138.1 133.6
Other assets 470.9 538.1 332.2
Total assets 49,452.7 55,240.8 53,410.1
Liabilities and net equity
Funding 44,421.3 50,056.4 47,991.0
Other liabilities 543.4 602.8 603.8
Provisions 159.3 160.1 161.1
Net equity 4,453.0 4,621.7 4,675.4
Profit for the period (124.3) (200.2) (21.2)
Total liabilities and net equity 49,452.7 55,240.8 53,410.1
(*) The financial statements are also reported in accordance with the recommendations made by the Bank of Italy in the annex hereto, along with further details on how the various items have been restated.

40 Interim Report for the six months ended 31 December 2012
A review of the other Group companies’ performance is provided below:
– Mediobanca International (Luxembourg) S.A., Luxembourg, Luxembourg (wholesale bank; 99%-owned by Mediobanca; 1%-owned by Compass): this company recorded a profit of €8.2m for the six months (31/12/11: €15.1m), reflecting the reduction in net interest income (from €16.2m to €10.9m) and net fee and commission income (from €6.3m to €4.5m), only in part offset by the fall in operating costs (from €4.9m to €4.2m). Loans and advances to customers decreased appreciably to €2,672.8m (€3,839.7m), as a result of repayments during the period, and in line with the reduction in funding (from €4,397.2m to €3,347.5m). Net equity stood at €239.2m (€231.1m).
The company employs eight staff at its head office in Luxembourg, one of whom is seconded from Mediobanca S.p.A.
– Prominvestment in liquidation, Rome (100%-owned by Mediobanca): Prominvestment made a loss of €253,000 (€389,000), after net fee and commission income of €128,000 (€122,000).
The company employs 6 staff.
– MB Securities USA LLC., New york (securities brokerage; 100%-owned by Mediobanca): this company, which performs order collection services, made a profit of $69,000 in the six months ($26,000), on fee income of $0.9m ($1m).
The company employs four staff.
– SelmaBipiemme Leasing S.p.A., Milan (leasing; 60%-owned by Compass): this company made a net loss of €3.2m in the six months, similar to the loss incurred at the same stage last year (€3.4m) The result reflects a reduction in net interest income (from €14.1m to €12.4m) and the parallel reduction in the cost of risk, from €8.5 to €7.2m.
The company executed 905 leases during the period, worth a total of €54.8m (as compared with 2,893 leases worth €234.4m last year). As at 31 December 2012 amounts leased to customers had fallen by 10%, to €2,043.4m (€2,270.8m).
The company employs 110 staff.
– Palladio Leasing S.p.A., Vicenza (leasing; 95%-owned by SelmaBipiemme; 5% treasury shares): Palladio Leasing’s accounts for the six months under review reflect a net profit of €461,000, less than the €2.2m profit recorded in the first six months of last year, due to lower net interest income (down from

Review of Group operations 41
€11.4 to €9.4m) and a slight increase in loan loss provisions (up from €4.3m to €4.6m).
The company executed 552 leases during the period, worth a total of €61.3m (as compared with 909 leases worth €170.6m last year). As at 31 December 2012 amounts leased to customers were down 3.8% compared to one year previously (from €1,620m to €1,558.8m).
The company employs 58 staff.
– Teleleasing in liquidation S.p.A., Milano (leasing; 80%-owned by SelmaBipiemme): this company earned a net profit of €150,000 (€4.3m) during the period, on revenues of €2.7m (€10.3m).
As at 31 December 2012 amounts leased to customers had fallen by 22.5% since the balance-sheet date, from €396.4m to €307.2m.
The company employs 4 staff.
– Compass S.p.A., Milan (consumer credit; 100%-owned by Mediobanca): the company’s accounts for the six months ended 31 December 2012 reflect a net profit of €25.6m (€44.8m), on revenues of €318.7m (€325.1m), costs of €116.2m (€113.5m) and loan loss provisions of €160.2m (€113.5m).
During the period under review, Compass granted 739,509 new loans worth a total of €2,230m, an increase of 10.8% in the number of contracts but a 2.8% fall in the value terms compared to the previous year (667,130 loans worth €2,295m). Loans and advances to customers were down slightly since the balance-sheet date, (by 0.7%, from €8,507.7m to €8,452.3m).
The company employs 1,222 staff between its headquarters and 158 branches.
– Futuro S.p.A., Milan (salary-backed finance; 100%-owned by Compass): Futuro recorded a net profit for the six months of €2.5m (€3.6m), on revenues of €8.5m (€10.9m), costs of €4.2m (€4.4m), and loan loss provisions of €0.5m (€0.7m).
During the period under review the company granted 7,073 new loans worth a total of €108.7m (compared with 10,274 loans worth a total of €172.8m last year). Accounts outstanding at year-end 2012 were up 5.1% on the balance-sheet date, from €822.2m to €864m.
The company employs 64 staff.
– CheBanca! S.p.A., Milan (retail banking; 100%-owned by Mediobanca): CheBanca! reported a net loss of €8.2m for the period, barely half the €14.8m

42 Interim Report for the six months ended 31 December 2012
recorded at the same stage last year, boosted by substantial savings in operating costs, which fell from €89.1m to €72.5m but were partly offset by the decline in revenues (down from €81.4m to €78.2m) and the increase in the cost of risk (up from €7.1m to €10.8m).
Retail deposits of €12,275.6m at the reporting date were up 5.4% on the €11,651m recorded at 30 June 2012, while indirect funding totalled €373m (€227m). With reference to mortgage lending activity, the company executed 978 loans in the six months worth a total of €126m (as compared with 2,549 loans worth €411m last year).
As at 31 December 2012 the company had a total of 914 staff on its books, between headquarters and its 44 branches.
– Cofactor S.p.A., Milan (non-recourse factoring; 100%-owned by Compass): Cofactor recorded a net profit for the six months of €455,000 (€315,000), on revenues of €6.5m (€6.9m), and income tax of €211,000 (€283,000).
The nominal and book value of accounts receivable outstanding at the reporting date were €2,483.1m and €95.4m respectively.
The company employs 56 staff.
– Creditech S.p.A., Milan (credit management; 100%-owned by Compass): this company reported a net profit of €2.2m (€1.9m) for the six months, on net fee and commission income of €7.6m (€6.9m), the increase in which is linked to the growth in orders external to the Group (which were up 10%, from €5m to €5.5m).
The company employs 72 staff.
– Compass RE S.A., Luxemburg (reinsurance; 100%-owned by Compass): this company reinsured €24.1m (€31.5m) worth of premiums during the period, which translates to net premium income attributable to the company (taking into account the movements in the technical reserve) of €15.2m (€9.4m). The company recorded an even balance for the six months under review, after setting aside €9.7m (€4m) to the technical reserves.
– Compagnie Monégasque de Banque, Monaco (private banking; 100%-owned by Mediobanca): the draft consolidated accounts as at 31 December 2012 reflect a profit of €48.7m (€18.9m last year net of the gain on the real estate disposal and transfers to the provision for general banking risks), on net fee and commission income of €38.2m (€34.5m) and net interest income of €21.8m (€16.8m). Lendings totalled €843m (€795m) and deposits €1,339m (€1,519m). Assets

Review of Group operations 43
managed on a discretionary and non-discretionary basis amounted to €6.6bn (€6.2bn), up approx. 10% taking into account disposal of the Swiss operations.
– Banca Esperia S.p.A., Milan (private banking; 50%-owned by Mediobanca): the draft consolidated accounts as at 31 December 2012 reflect a profit of €5.4m, higher than the the €1.4m posted last year, due to a healthy increase in revenues, from €63.4m to €89.8m, boosted by a higher contribution from net interest income (up €10.2m) and gains on AFS securities (up €14.3m). The period under review reflects higher operating costs, up €11.7m, largely due to the turnaround process, and higher writedowns to securities (up €6.3m), most of which were non-recurring. Assets under management increased from €12.8bn to €13.8bn, due mainly to the positive performance of financial markets.
– Spafid - Società per Amministrazioni Fiduciarie S.p.A., Milan (fiduciary business; 100%-owned by Mediobanca): this company recorded a profit of €412,000 (€367,000), on net fee and commission income of €1.7m (€1.8m) and costs of €1.7m (€1.5m). In December 2012 the company sold Mediobanca its share in Assicurazioni Generali for a consideration of €18.8m, generating a €664,000 profit. Securities under trust at 31 December 2012 totalled €1,948.8m (30/6/12: €1,989.2m).
The company employs 19 staff.
– Prudentia Fiduciaria S.p.A., Milan (fiduciary business; 100%-owned by Mediobanca): Prudentia recorded a profit of €45,000 (€300,000) in the six months, on net fee and commission income of €1.5m (€1.6m) and costs of €1.5m (€1.2m). Securities under trust as at 31 December 2012 amounted to €66.9m (30/6/12: €66.8m).
The company employs 18 staff.
– R. & S. – Ricerche & Studi S.p.A., Milan (100%-owned by Mediobanca): this company recorded a profit of €3,000, for the six months, after charging Mediobanca €0.5m (€0.5m) for services and expenses. R&S produced the thirty-seventh edition of its Annual Directory, which includes analysis of leading Italian listed companies, the seventeenth edition of its survey of global multinationals, the fifth update to its survey of European banks based on interim data, and continued with its publication of the quarterly survey of blue chip companies’ results in conjunction with Italian daily newspaper Il Sole 24 Ore. It also collaborated with the Fondazione Ugo La Malfa on a study of industrial companies in southern Italy.

44 Interim Report for the six months ended 31 December 2012
Other information
Review of Board members’ status as independent directors
At a meeting held on 20 December 2012, the Board of Mediobanca established that the following Directors qualify as independent according to the definition provided in the Code of conduct in respect of listed companies: Tarak Ben Ammar, Roberto Bertazzoni, Angelo Casò, Bruno Ermolli, Anne Marie Idrac, Vanessa Labérenne, Elisabetta Magistretti, Dieter Rampl, Fabio Roversi Monaco and Eric Strutz. With reference to Angelo Casò’s status as independent, the Board shared the arguments and conclusions set out in an independent legal opinon commissioned regarding Mr Casò’s independence. In particular, the Board noted and acknowledged the fact that the post of chairman of parties to the Mediobanca shareholders’ agreement entails powers that are largely administrative and organizational in nature, as confirmed by the duties and powers of the steering committee to the agreement, and governed by the terms of the agreement itself. Furthermore, at the same meeting on 20 December 2012, given that the opinion referred to suggests a series of solutions for the agreement’s governance which could enhance Mr Casò’s status as independent in both form and appearance, the Board stated that such suggestions would be submitted to the governing bodies of the agreement at the meeting scheduled to be held on today’s date.
With reference to the fact that some of the directors qualifying as independent are also members of the Bank’s Executive Committee, it should be noted that the Code itself makes provision for the possibility of directors who are members of an Executive Committee still to qualify as “non-executive and independent” when “they are not assigned individual management powers”, while the opposite is the case in situations where there is no Chief Executive Officer, or where participation in an Executive Committee, on account of the frequency of the meetings or the nature of the subjects discussed at them, entails systematic involvement in the day-to-day running of the Bank or significantly higher remuneration being paid to such directors than to others. It has therefore been decided that the nature of the Bank’s governance does not automatically mean that the Executive Committee members qualify automatically as “executive” merely on account of their forming part of this body, in view in particular of its composition, which includes not only the Chairman but also four other members of the Bank’s senior management, including the Chief Executive Officer and General Manager, who are responsible for running the Bank’s day-to-day

Review of Group operations 45
operations. The Chairman and the other non-managerial Committee members are not vested with individual management powers, and under the governance model in force other managerial committees have been instituted with broad powers in respect of the Bank’s current management.
Litigation pending
A total of thirteen claims against Mediobanca, jointly with the other parties in their alleged failure to launch a full takeover bid for Fondiaria in 2002, are still pending for damages amounting to approx. €100m. The present status of the trials in respect of these claims is as follows:
– the court of cassation has ruled against Mediobanca on three claims, which have now reverted to the court of appeals for the rulings to be prosecuted;
– four claims, in which the court of appeals has ruled in favour of Mediobanca, are pending at the court of cassation; for one other claim where again the ruling has gone in favour of Mediobanca, the term for presenting appeals to the court of cassation is now pending;
– three claims, in which the ruling went against Mediobanca, are pending before the court of appeals in Milan;
– one claim, in which the court of Florence ruled in favour of Mediobanca, has been appealed by the plaintiff;
– a new claim has been submitted to the court of Milan.
Tax disputes
In December 2012, the Lombard regional tax office again charged Compass, with having unduly deducted part of the losses on non-recourse disposal of receivables, for the 2007/2008 financial year as well, leading to higher tax of €39.8m plus interest and fines. The company is still waiting to hear the outcome of the appeal it submitted in respect of the same charge for 2006/2007.
Meanwhile, the provincial tax tribunal upheld SelmaBipiemme’s appeal against the charge of undue deduction of amortization (resulting in €1.6m in higher taxes) and a part of the VAT receivables (€9.5m); however, the company intends to challenge the ruling to have its full rights duly recognized.

46 Interim Report for the six months ended 31 December 2012
Outlook
Estimates for the current financial year continue to be influenced by the extremely weak economic scenario, despite signs of increasing stability in the cost of refinancing sovereign and bank debt. In this scenario the Group expects its performance in the second half-year to be characterized by: ongoing weakness in revenues, strict control of operating costs and the cost of risk. The valuations of the equity investment portfolio will continue to depend on the performance of markets and the investee companies, as will the contribution from trading activity, with the impact on earnings potentially significant.
* * *

Review of Group operations 47
Reconciliation of shareholders’ equity and net profit
(€ ’000)
Shareholders’ equity Net profit
Balance at 31/12 as per Mediobanca S.p.A. accounts 4,675,434 (21,228)
Net surplus over book value for consolidated companies 14,719 58,921
Other adjustments and restatements on consolidation, including the effects of accounting for companies on an equity basis 2,232,113 86,103
Dividends received during the period — —
TOTAL 6,922,266 123,796
Milan, 26 February 2013
The Board of direcTors

CONSOLIDATEDFINANCIAL STATEMENTS

50 Interim Report for the six months ended 31 December 2012
Consolidated balance sheet(€’000)
Assets 31/12/12 30/6/12
10. Cash and cash equivalents 35,511 29,741
20. Financial assets held for trading 14,697,875 13,838,216
40. Financial assets available for sale 11,735,588 10,552,149
50. Financial assets held to maturity 1,722,548 1,723,279
60. Due from banks 5,203,928 3,962,850
70. Due from customers 39,477,243 41,871,148
80. Hedging derivatives 1,688,407 1,571,778
100. Equity investments 3,284,009 3,165,512
120. Property, plant and equipment 298,468 293,680
130. Intangible assets 416,527 424,373
of which:
goodwill 365,934 365,934
140. Tax assets: 869,295 1,037,078
a) current 223,464 299,590
b) advance 645,831 737,488
of which L.214/2011 402,597 393,101
160. Other assets 207,162 209,324
TOTAL ASSETS 79,636,561 78,679,128

Consolidated Financial Statements 51
(€’000)
Liabilities and net equity 31/12/12 30/6/12
10. Due to banks 13,168,623 12,000,012
20. Due to customers 17,505,154 17,149,027
30. Debt securities in issue 29,513,282 31,300,331
40. Trading liabilities 10,647,573 9,935,010
60. Hedging derivatives 345,677 364,954
80. Tax liabilities: 538,463 494,093
a) current 188,588 197,975
b) deferred 349,875 296,118
100. Other liabilities 464,644 542,371
110. Staff severance indemnity provision 26,846 24,652
120. Provisions: 160,772 160,471
b) other provisions 160,772 160,471
130. Insurance reserve 111,072 99,282
140. Revaluation reserves 118,779 (337,118)
170. Reserves 4,466,623 4,418,901
180. Share premium reserve 2,120,143 2,120,143
190. Share capital 430,565 430,565
200. Treasury shares (213,844) (213,844)
210. Minority interest 108,393 109,391
220. Profit for the period 123,796 80,887
TOTAL LIABILITIES AND NET EQUITY 79,636,561 78,679,128

52 Interim Report for the six months ended 31 December 2012
Consolidated profit and loss account(€’000)
Item 6 mths to 31/12/12 12 mths to 30/6/12 6 mths to 31/12/11
10. Interest and similar income 1,454,994 3,037,190 1,552,298 20. Interest expense and similar charges (922,449) (1,949,111) (993,801)
30. Net interest income 532,545 1,088,079 558,497 40. Fee and commission income 179,076 438,596 207,017 50. Fee and commission expense (24,265) (47,288) (18,025)
60. Net fee and commission income 154,811 391,308 188,992 70. Dividends and similar income 8,206 90,819 35,868 80. Net trading income 66,823 116,798 43,648 90. Net hedging income (expense) 4,316 4,065 4,429
100. Gain (loss) on disposal/repurchase of: 8,686 69,939 (13,188)a) loans and advances 6,275 (5) 24 b) AFS securities (11,377) 34,368 (38,019)c) financial assets held to maturity 478 (1,946) 201 d) financial liabilities 13,310 37,522 24,606
120. Total income 775,387 1,761,008 818,246 130. Adjustments for impairment to: (227,291) (881,333) (388,216)
a) loans and advances (217,311) (429,130) (189,545)b) AFS securities 5,478 (411,515) (174,381)c) financial assets held to maturity 158 (1,320) (1,454)d) financial liabilities (15,616) (39,368) (22,836)
140. Net income from financial operations 548,096 879,675 430,030 150. Premiums earned (net) 15,161 22,094 9,434 160. Other income (net) from insurance activities (7,463) (9,698) (3,629)
170. Net profit from financial and insurance activities 555,794 892,071 435,835
180. Administrative expenses: (374,956) (784,283) (399,121)a) personnel costs (194,416) (393,312) (201,329)b) other administrative expenses (180,540) (390,971) (197,792)
190. Net transfers to provisions (1,224) (4,014) (1,375)200. Net adjustments to tangible assets (9,718) (18,866) (8,538)210. Net adjustments to intangible assets (11,146) (25,801) (13,107)220. Other operating income (expense) 58,885 123,033 62,499
230. Operating costs (338,159) (709,931) (359,642)240. Gain (loss) on equity investments (9,192) (21,491) 16,600 270. Gain (loss) on disposal of investments in: 2 45,214 43,750
a) property — 44,295 44,295b) other assets 2 919 (545)
280. Profit (loss) on ordinary activities before tax 208,445 205,863 136,543
290. Income tax for the year on ordinary activities (85,675) (125,504) (71,360)300. Profit (loss) on ordinary
activities after tax 122,770 80,359 65,183 320. Net profit (loss) for the period 122,770 80,359 65,183 330. Net profit (loss) for the period attributable
to minorities 1,026 528 (1,758)340. Net profit (loss) for the period
attributable to Mediobanca 123,796 80,887 63,425

Consolidated Financial Statements 53
Consolidated comprehensive profit and loss account
Headings 31/12/12 31/12/11
10. Gain (loss) for the period 122,770 65,183
Other income items net of tax20. AFS securities 335,862 (405,077)
30. Property, plant and equipment — —
40. Intangible assets — —
50. Foreign investment hedges — —
60. Cash flow hedges (6,213) (104,347)
70. Exchange rate differences — (196)
80. Non-current assets being sold — —
90. Actuarial gains (losses) on defined-benefit pension schemes — —
100. Share of valuation reserves for equity-accounted companies 126,276 (212,690)
110. Total other income items net of tax 455,925 (722,310)
120. Aggregate profit (Heading 10 + Heading 110) 578,695 (657,127)
130. Overall consolidated profit attrubutable to minorities (998) (2,277)
140. Overall consolidated profit attributable to Mediobanca 579,693 (654,850)

54 Interim Report for the six months ended 31 December 2012
Stat
emen
t of
cha
nges
to
cons
olid
ated
net
equ
ity
(€’0
00)
Pre
viou
sly
repo
rted
ba
lanc
e at
3
0/6
/12
Allo
cati
on o
f pr
ofit
fo
r pr
evio
us p
erio
dC
hang
es d
urin
g th
e re
fere
nce
peri
odO
vera
ll co
nsol
idat
ed
profi
t 2
01
2
Bal
ance
at
31
/12
/12
Net
pro
fit
attr
ibut
able
to
the
Gro
up
at 3
1/1
2/1
2
Net
pro
fit
attr
ibut
able
to
m
inor
itie
s at
31
/12
/12
Res
erve
sD
ivid
ends
an
d ot
her
fund
ap
plic
atio
ns
Cha
nges
to
rese
rves
Tran
sact
ions
invo
lvin
g ne
t eq
uity
New
sh
ares
is
sued
Trea
sury
sh
ares
ac
quir
ed
Ext
ra-
ordi
nary
di
vide
nd
payo
uts
Cha
nges
to
equ
ity
inst
rum
ents
Trea
sury
sh
ares
de
riva
tes
Stoc
k op
tion
s(1
)
Shar
e ca
pita
l: 4
55,5
13
—
—
—
—
—
—
—
—
—
—
45
5,5
13
4
30,5
65
24,
948
a) o
rdin
ary
shar
es 4
55,5
13
—
—
—
—
—
—
—
—
—
—
45
5,5
13
4
30,5
65
24,
948
b) o
ther
sha
res
—
—
—
—
—
—
—
—
—
—
—
—
—
—
Shar
e pr
emiu
m
rese
rve
2,1
27,3
59
—
—
—
—
—
—
—
—
—
— 2
,12
7,3
59
2
,120
,143
7
,216
Res
erve
s: 4
,502
,779
80
,359
(42,
206)
1,3
23
—
—
—
—
—
7,7
18
— 4
,54
9,9
73
4
,466
,623
8
3,35
0
a) r
etai
ned
earn
ings
4,4
33,8
57
80,3
59(4
2,20
6) 1
,323
—
—
—
—
—
—
—
4,4
73
,33
3
4,3
89,9
83
83,
350
b) o
ther
s 6
8,92
2 —
—
—
—
—
—
—
—
7
,718
—
7
6,6
40
7
6,64
0 —
Valu
atio
n re
serv
es (3
43,2
41)
—
—
—
—
—
—
—
—
—
455
,925
1
12
,68
4
118
,779
(6
,095
)
Equ
ity in
stru
men
ts—
—
—
—
—
—
—
—
—
—
—
—
—
—
Trea
sury
sha
res
(213
,844
)—
—
—
—
—
—
—
—
—
—
(2
13
,84
4)
(213
,844
)—
Profi
t (lo
ss) f
or th
e pe
riod
80,
359
(80,
359)
—
—
—
—
—
—
—
—
122
,770
1
22
,77
0
123
,796
(1
,026
)
Net
equ
ity 6
,608
,925
—
(4
2,20
6) 1
,323
—
—
—
—
—
7
,718
5
78,6
95 7
,15
4,4
55
Net
pro
fit a
ttrib
utab
le
to th
e G
roup
6,4
99,5
34
— (4
2,20
6) 1
,323
—
——
——
7,7
18
579
,693
7
,046
,062
Net
pro
fit a
ttrib
utab
le
to m
inor
ities
109
,391
—
—
—
—
—
—
—
—
—
(9
98)
108
,393
(1 ) R
epre
sent
s th
e ef
fect
on
the
stoc
k op
tions
and
per
form
ance
sha
res
rela
ted
to th
e E
SOP
sche
mes
.

Consolidated Financial Statements 55
Stat
emen
t of
cha
nges
to
cons
olid
ated
net
equ
ity
(€’0
00)
Pre
viou
sly
repo
rted
ba
lanc
e at
3
0/6
/11
Allo
cati
on o
f pr
ofit
for
prev
ious
per
iod
Cha
nges
dur
ing
the
refe
renc
e pe
riod
Ove
rall
cons
olid
ated
pr
ofit
20
11
Bal
ance
at
31
/12
/11
Net
pro
fit
attr
ibut
able
to
the
Gro
up
at 3
1/1
2/1
1
Net
pro
fit
attr
ibut
able
to
m
inor
itie
s at
31
/12
/11
Res
erve
sD
ivid
ends
an
d ot
her
fund
ap
plic
atio
ns
Cha
nges
to
rese
rves
Tran
sact
ions
invo
lvin
g ne
t eq
uity
New
sh
ares
is
sued
Trea
sury
sh
ares
ac
quir
ed
Ext
ra-
ordi
nary
di
vide
nd
payo
uts
Cha
nges
to
equ
ity
inst
rum
ents
Trea
sury
sh
ares
de
riva
tes
Stoc
k op
tion
s(1
)
Shar
e ca
pita
l: 4
55,5
13
——
——
——
——
——
45
5,5
13
4
30,5
65
24,
948
a) o
rdin
ary
shar
es 4
55,5
13
—
—
—
—
—
—
—
—
—
—
45
5,5
13
4
30,5
65
24,
948
b) o
ther
sha
res
—
—
—
—
—
—
—
—
—
—
—
—
—
—
Shar
e pr
emiu
m
rese
rve
2,1
27,3
59
—
—
—
—
—
—
—
—
—
— 2
,12
7,3
59
2
,120
,143
7
,216
Res
erve
s: 4
,279
,846
23
0,06
7 —
(6
,462
)—
—
—
—
—
5
,011
—
4,5
08
,46
2
4,4
24,5
84
83,
878
a) r
etai
ned
earn
ings
4,2
23,7
40
230,
067
—
(6,4
62)
—
—
—
—
—
—
— 4
,44
7,3
45
4
,363
,467
8
3,87
8
b) o
ther
s 5
6,10
6 —
—
—
—
—
—
—
—
5
,011
—
6
1,1
17
6
1,11
7 —
Valu
atio
n re
serv
es 5
,380
—
—
—
—
—
—
—
—
—
(7
22,3
10)
(7
16
,93
0)
(711
,598
) (5
,332
)
Equ
ity in
stru
men
ts—
—
—
—
—
—
—
—
—
—
—
—
—
—
Trea
sury
sha
res
(213
,844
)—
—
—
—
—
—
—
—
—
—
(2
13
,84
4)
(213
,844
)—
Profi
t (lo
ss) f
or
the
peri
od 3
73,5
67 (2
30,0
67)
(143
,500
)—
—
—
—
—
—
65,
183
65
,18
3
63,
425
1,7
58
Net
equ
ity 7
,027
,821
—
(1
43,5
00)
(6,4
62)
—
—
—
—
—
5,0
11
(657
,126
) 6
,22
5,7
43
Net
pro
fit a
ttrib
utab
le
to th
e G
roup
6,9
13,0
76
— (1
43,5
00)
(6,4
62)
——
——
— 5
,011
(6
54,8
50)
6,1
13,2
75
Net
pro
fit a
ttrib
utab
le
to m
inor
ities
114
,745
—
—
—
—
—
—
—
—
—
(2
,277
) 1
12,4
68
(1 ) R
epre
sent
s th
e ef
fect
on
the
stoc
k op
tions
and
per
form
ance
sha
res
rela
ted
to th
e E
SOP
sche
mes
.

56 Interim Report for the six months ended 31 December 2012
Consolidated cash flow statement Direct method
Amounts
31/12/12 31/12/11
A. Cash flow from operating activities1. Operating activities (165,910) 421,147
-interest received 2,166,894 3,072,839 -interest paid (1,741,014) (2,594,651)-dividends and similar income 20,860 56,462 -net fees and commission income 95,428 155,999 -cash payments to employees (168,756) (182,581)-net premium income 27,086 30,870 -other premium from insurance activities (38,463) (50,956)-other expenses paid (1,023,270) (943,404)-other income received 518,958 937,387 -income taxes paid (23,633) (60,818)-net expense/income from groups of assets being sold — —
2. Cash generated/absorbed by financial assets 2,935,886 566,997 - financial assets held for trading 876,508 2,316,455 -financial assets recognized at fair value — —-AFS securities (760,730) (289,782)-due from customers 2,764,735 (886,997)-due from banks: on demand 1,498,608 3,173,899 -due from banks: other (1,413,554) (3,744,205)-other assets (29,681) (2,373)
3. Cash generated/absorbed by financial liabilities (2,717,918) 331,089 -due to banks: on demand (172,375) (738,017)-due to banks: other 299,433 2,095,551 -due to customers 265,518 1,375,308 -debt securities (2,593,840) (2,570,158)-trading liabilities (491,525) 203,859 -financial liabilities assets recognized at fair value — —-other liabilities (25,129) (35,454)Net cash flow (outflow) from operating activities 52,058 1,319,233
B. Investment activities1. Cash generated from 7,117 109,296
-disposals of shareholdings — —-dividends received in respect of equity investments — —-disposals/redemptions of financial assets held to maturity 6,336 155 -disposals of tangible assets 5 109,141 -disposals of intangible assets 776 —-disposals of subsidiaries or business units — —
2. Cash absorbed by (11,199) (161,834)-acquisitions of shareholdings — (23,465)-acquisitions of held-to-maturity investments (915) (101,982)-acquisitions of tangible assets (6,182) (29,569)-acquisitions of intangible assets (4,102) (6,818)-acquisitions of subsidiaries or business units — —-Net cash flow (outflow) from investment/servicing of finance (4,082) (52,538)
C. Funding activities-issuance/acquisition of treasury shares — —-issuance/acquisitions of equity instruments — —-dividends payout and other applications of funds (42,206) (143,500)Net cash flow (outflow) from funding activities (42,206) (143,500)NET CASH FLOw (OUTFLOw) DURING PERIOD 5,770 1,123,195

Consolidated Financial Statements 57
Reconciliation of movements in cash flow duriing period under review
Amounts
31/12/12 31/12/11
Cash and cash equivalents: balance at start of period 29,741 31,492
Total cash flow (ouflow) during period 5,770 1,123,195
Cash and cash equivalents: exchange rate effect — —
Cash and cash equivalents: balance at end of period 35,511 1,154,687

NOTES TO THE ACCOUNTS

60 Interim Report for the six months ended 31 December 2012
NOTES TO THE ACCOUNTS
Part A - Accounting policies 62
Part A.1 - General part 62Section 1 - Statement of conformity with IAS/IFRS 62
Section 2 - General principles 62
Section 3 - Areas and methods of consolidation 63
Part A.2 - Significant accounting policies 65
Part A.3 - Information on Fair Value 78
Part B - Notes to consolidated balance sheet 82
Assets 82Section 1 - Heading 10: Cash and cash equivalents 82
Section 2 - Heading 20: Financial assets held for trading 83
Section 4 - Heading 40: Available for sale (AFS) securities 84
Section 5 - Heading 50: Financial assets held to maturity 85
Section 6 - Heading 60: Due from banks 86
Section 7 - Heading 70: Due from customers 87
Section 8 - Heading 80: Hedging derivatives 87
Section 10 - Heading 100: Equity investments 88
Section 12 - Heading 120: Property, plant and equipment 90
Section 13 - Heading 130: Intangible assets 92
Section 14 - Asset heading 140 and liability heading 80: Tax assets and liabilities 94
Section 16 - Heading 160: Other assets 97
Liabilities 98Section 1 - Heading 10: Due to banks 98
Section 2 - Heading 20: Due to customers 99
Section 3 - Heading 30: Debt securities in issue 99
Section 4 - Heading 40: Trading liabilities 100
Section 6 - Heading 60: Hedging derivatives 101
Section 8 - Heading 80: Tax liabilities 102
Section 10 - Heading 100: Other liabilities 102
Section 11 - Heading 110: Staff severance indemnity provision 102
Section 12 - Heading 120: Provisions 103
Section 13 - Heading 130: Technical reserves 104
Section 15 - Headings 140, 160, 170, 180, 190, 200 and 220: Net equity 105
Section 16 - Heading 210: Net equity attributable to minorities 106
Other information 107

Notes to the accounts 61
Part C - Notes to consolidated profit and loss account 109
Section 1 - Headings 10 and 20: Net interest income 109
Section 2 - Headings 40 and 50: Net fee and commission income 110
Section 3 - Heading 70: Dividends and similar income 111
Section 4 - Heading 80: Net trading income 112
Section 5 - Heading 90: Net hedging income (expense) 113
Section 6 - Heading 100: Gains (losses) on disposals/repurchases 114
Section 8 - Heading 130: Adjustments for impairment 115
Section 9 - Heading 150: Net premium income 117
Section 10 - Heading 160: Income less expense from insurance operations 117
Section 11 - Heading 180: Administrative expenses 119
Section 12 - Heading 190: Net transfers to provisions 120
Section 13 - Heading 200: Net adjustments to tangible assets 121
Section 14 - Heading 210: Net adjustments to intangible assets 121
Section 15 - Heading 220: Other operating income (expense) 122
Section 16 - Heading 240: Gains (losses) on equity investments 123
Section 19 - Heading 270: Net gain (loss) upon disposal of investments 124
Section 20 - Heading 290: Income tax on ordinary activities 124
Section 24 - Earnings per share 125
Part E - Information on risks and related hedging policies 126Section 1 - Banking Group risks 126
Part F - Information on consolidated capital 171Section 1 - Consolidated capital 171
Section 2 - Regulatory and supervisory capital requirements for banks 173
Part H - Related party disclosure 177
Part I - Share-based payment schemes 179
Part L - Segment reporting 182

62 Interim Report for the six months ended 31 December 2012
Part A - Accounting policies
A.1 - General Part
SECTION 1
Statement of conformity with IAS/IFRS
The Mediobanca Group’s consolidated financial statements for the period ended 31 December 2012 have, as required by Italian Legislative Decree 38/05, been drawn up in accordance with the International Financial Reporting Standards (IFRS) and International Accounting Standards (IAS) issued by the International Accounting Standards Board (IASB), which were adopted by the European Commission in accordance with the procedure laid down in Article 6 of regulation CE 1606/02 issued by the European Council and Commission on 19 July 2002. Adoption of the new accounting standards with respect to financial reporting by banks was governed by Bank of Italy circular no. 262 issued on 22 December 2005 (and its first update issued on 18 November 2009). The condensed interim report has been drawn up in conformity with IAS 34 on interim financial reporting.
SECTION 2
General principles
These consolidated financial statements comprise:
– balance sheet;
– profit and loss account;
– comprehensive profit and loss account;
– statement of changes in net equity;
– cash flow statement (direct method);
– notes to the accounts.
All the statements have been drawn up in conformity with the general principles provided for under IAS and the accounting policies illustrated in

Notes to the accounts | Part A - Accounting policies 63
section 4, and show data for the period under review compared with that for the previous financial year in the case of balance-sheet figures or the corresponding period of the previous financial year in the case of profit-and-loss account data.
SECTION 3
Area and method of consolidation
Subsidiaries are consolidated on the line-by-line basis, whereas investments in associates and jointly-controlled operations are consolidated and accounted for using the equity method.
When a subsidiary is fully consolidated, the carrying amount of the parent’s investment and its share of the subsidiary’s equity are eliminated against the addition of that company’s assets and liabilities, income and expenses to the parent company’s totals. Any surplus arising following allocation of asset and liability items to the subsidiary is recorded as goodwill. Intra-group balances, transactions, income and expenses are eliminated upon consolidation.
For equity-accounted companies, any differences in the carrying amount of the investment and investee company’s net equity are reflected in the book value of the investment, the fairness of which is tested at the reporting date or when evidence emerges of possible impairment. The profit made or loss incurred by the investee company is recorded pro-rata in the profit and loss account under a specific heading.

64 Interim Report for the six months ended 31 December 2012
1. Subsidiaries and jointly-controlled companies (consolidated pro-rata)Name Registered
officeType of relation-ship (1)
Shareholding % voting rights (2)
Investee company
% interest
A. COMPANIES INCLUDED IN AREA OF CONSOLIDATION
A.1 Line-by-line
1. MEDIOBANCA - Banca di Credito Finanziario S.p.A. Milan 1 — — —
2. PROMINVESTMENT S.p.A. - in liquidation Milan 1 A.1.1 100.00 100.00
3. PRUDENTIA FIDUCIARIA S.p.A. Milan 1 A.1.1 100.00 100.00
4. SETECI - Società Consortile per l’Elaborazione, Trasmissione dati, Engineering e Consulenza Informatica S.c.p.A.
Milan 1 A.1.1 100.00 100.00
5. SPAFID S.p.A. Milan 1 A.1.1 100.00 100.00
6. COMPAGNIE MONEGASQUE DE BANQUE - CMB S.A.M. Monte Carlo 1 A.1.1 100.00 100.00
7. C.M.I. COMPAGNIE MONEGASQUE IMMOBILIERE SCI Monte Carlo 1 A.1.6 99.94 99.94
A.1.8 0.06 0.06
8. C.M.G. COMPAGNIE MONEGASQUE DE GESTION S.A.M. Monte Carlo 1 A.1.6 99.89 99.89
9. SMEF SOCIETE MONEGASQUE DES ETUDES FINANCIERE S.A.M.
Monte Carlo 1 A.1.6 99.96 99.96
10. CMB ASSET MANAGEMENT S.A.M. Monte Carlo 1 A.1.6 99.50 99.50
11. MONOECI SOCIETE CIVILE IMMOBILIERE Monte Carlo 1 A.1.6 99.00 99.00
A.1.8 1.00 1.00
12. MOULINS 700 S.A.M. Monte Carlo 1 A.1.7 99.90 99.90
13. MEDIOBANCA INTERNATIONAL (Luxembourg) S.A. Luxembourg 1 A.1.1 99.00 99.00
1 A.1.14 1.00 1.00
14. COMPASS S.p.A. Milan 1 A.1.1 100.00 100.00
15. CHEBANCA! S.p.A. Milan 1 A.1.1 100.00 100.00
16. COFACTOR S.p.A. Milan 1 A.1.14 100.00 100.00
17. SELMABIPIEMME LEASING S.p.A. Milan 1 A.1.1 60.00 60.00
18. PALLADIO LEASING S.p.A. Vicenza 1 A.1.17 95.00 100.00
A.1.18 5.00
19. TELELEASING S.p.A. - in liquidation Milan 1 A.1.17 80.00 80.00
20. SADE FINANZIARIA - INTERSOMER S.r.l. Milan 1 A.1.1 100.00 100.00
21. RICERCHE E STUDI S.p.A. Milan 1 A.1.1 100.00 100.00
22. CREDITECH S.p.A. Milan 1 A.1.14 100.00 100.00
23. MEDIOBANCA SECURITIES USA LLC New York 1 A.1.1 100.00 100.00
24. CONSORTIUM S.r.l. Milan 1 A.1.1 100.00 100.00
25. QUARZO S.r.l. Milan 1 A.1.14 90.00 90.00
26. QUARZO LEASE S.r.l. Milan 1 A.1.17 90.00 90.00
27. FUTURO S.p.A Milan 1 A.1.14 100.00 100.00
28. JUMP S.r.l. Milan 4 A.1.14 — —
29. MEDIOBANCA COVERED BOND S.r.l. Milan 1 A.1.15 90.00 90.00
30. COMPASS RE (Luxembourg) S.A. Luxembourg 1 A.1.14 100.00 100.00
31. MEDIOBANCA INTERNATIONAL IMMOBILIERE S.a r.l. Luxembourg 1 A.1.13 100.00 100.00
Legend
(1) Type of relationship: 1 = majority of voting rights in ordinary AGMs. 5 = unity of direction as defined in Article 26, paragraph 1 of Italian Legislative Decree 87/92. 2 = dominant influence in ordinary AGMs. 6 = unity of direction as defined in Article 26, paragraph 2 of Italian Legislative Decree 87/92. 3 = agreements with other shareholders. 7 = joint control. 4 = other forms of control.
(2) Effective and potential voting rights in ordinary AGMs.

Notes to the accounts | Part A - Accounting policies 65
A.2 - Significant accounting policies
Financial assets held for trading
This category comprises debt securities, equities, and the positive value of derivatives held for trading including those embedded in complex instruments such as structured bonds (recorded separately).
At the settlement date for securities and subscription date for derivatives, such assets are recognized at fair value not including any transaction expenses or income directly attributable to the asset concerned, which are taken through the profit and loss account.
After initial recognition they continue to be measured at fair value, which for listed instruments is calculated on the basis of market prices ruling at the reporting date (Level 1 assets). If no market prices are available, other valuation models are used (Level 2 assets) based on market-derived data, e.g. valuations of listed instruments with similar features, discounted cash flow analysis, option price calculation methods, or valuations used in comparable transactions, or alternatively valuations based on internal estimates (Level 3 assets). Equities and linked derivatives for which it is not possible to reliably determine fair value using the methods described above are stated at cost (these too qualify as Level 3 assets). If the assets suffer impairment, they are written down to their current value.
Gains and losses upon disposal and/or redemption and the positive and negative effects of changes in fair value over time are reflected in the profit and loss account under the heading Net trading income.
AFS securities
This category includes all financial assets apart from derivatives not booked under the headings Financial assets held for trading, Financial assets held to maturity or Loans and receivables.

66 Interim Report for the six months ended 31 December 2012
AFS assets are initially recognized at fair value, which includes transaction costs and income directly attributable to them. Thereafter they continue to be measured at fair value. Changes in fair value are recognized in a separate net equity reserve, which is then eliminated against the corresponding item in the profit and loss account as and when an asset is disposed of or impairment is recognized. Fair value is measured on the same principles as described for trading instruments. Equities for which it is not possible to reliably determine fair value are stated at cost. For debt securities included in this category the value of amortized cost is also recognized against the corresponding item in the profit and loss account.
Assets are subjected to impairment tests at annual and interim reporting dates. If there is evidence of a long-term reduction in the value of the asset concerned, this is recognized in the profit and loss account on the basis of market prices in the case of listed instruments, and of estimated future cash flows discounted according to the original effective interest rate in the case of unlisted securities. For shares, in particular, the criteria used to determine impairment are a reduction in fair value of over one half or for longer than twenty-four months, compared to the initial recognition value. If the reasons for which the loss was recorded subsequently cease to apply, the impairment is written back to the profit and loss account for debt securities to and net equity for shares.
Financial assets held to maturity
These comprise debt securities with fixed or otherwise determinable payments and fixed maturities which the Group’s management has the positive intention and ability to hold to maturity.
Such assets are initially recognized at fair value, which is calculated as at the settlement date and includes any transaction costs or income directly attributable to them. Following their initial recognition they are measured at amortized cost using the effective interest method. Differences between the initial recognition value and the amount receivable at maturity are booked to the profit and loss account pro-rata.

Notes to the accounts | Part A - Accounting policies 67
Assets are tested for impairment at annual and interim reporting dates. If there is evidence of a long-term reduction in the value of the asset concerned, this is recognized in the profit and loss account on the basis of market prices in the case of listed instruments, and of estimated future cash flows discounted according to the original effective interest rate in the case of unlisted securities. If the reasons which brought about the loss of value subsequently cease to apply, the impairment is written back to the profit and loss account up to the value of amortized cost.
Loans and receivables
These comprise loans to customers and banks which provide for fixed or otherwise determinable payments that are not quoted in an active market and which cannot therefore be classified as available for sale. Repos and receivables due in respect of finance leasing transactions are also included, as are illiquid and/or unlisted fixed securities.
Loans and receivables are booked on disbursement at a value equal to the amount drawn plus (less) any income (expenses) directly attributable to individual transactions and determinable from the outset despite being payable at a later date. The item does not, however, include costs subject to separate repayment by the borrower, or which may otherwise be accounted for as ordinary internal administrative costs. Repos and reverse repos are booked as funding or lending transactions for the spot amount received or paid. Non-performing loans acquired are booked at amortized cost on the basis of an internal rate of return calculated using estimates of expected recoverable amounts.
Loans and receivables are stated at amortized cost, i.e. initial values adjusted upwards or downwards to reflect: repayments of principal, amounts written down/back, and the difference between amounts drawn at disbursement and repayable at maturity amortized on the basis of the effective interest rate. The latter is defined as the rate of interest which renders the discounted value of future cash flows deriving from the loan or receivable by way of principal and interest equal to the initial recognition value of the loan or receivable.

68 Interim Report for the six months ended 31 December 2012
Individual items are tested at annual and interim reporting dates to show whether or not there is evidence of impairment. Items reflecting such evidence are then subjected to analytical testing, and, if appropriate, adjusted to reflect the difference between their carrying amount at the time of the impairment test (amortized cost), and the present value of estimated future cash flows discounted at the asset’s original effective interest rate. Future cash flows are estimated to take account of anticipated collection times, the presumed value of receivables upon disposal of any collateral, and costs likely to be incurred in order to recover the exposure. Cash flows from loans expected to be recovered in the short term are not discounted.
The original effective interest rate for each loan remains unchanged in subsequent years, even if new terms are negotiated leading to a reduction to below market rates, including non-interest-bearing loans. The relevant value adjustment is taken through the profit and loss account.
If the reasons which brought about the loss of value cease to apply, the original value of the loan is recovered in the profit and loss account in subsequent accounting periods up to the value of amortized cost.
Accounts for which there is no objective evidence of impairment, including those involving counterparties in countries deemed to be at risk, are subject to collective tests. Loans are grouped on the basis of similar credit risk characteristics, and the related loss percentages are estimated at the impairment date on the basis of historical series of internal and external data. Collective value adjustments are credited or charged to the profit and loss account, as appropriate. At each annual and interim reporting date, any writedowns or writebacks are remeasured on a differentiated basis with respect to the entire portfolio of loans deemed to be performing at that date.
Leasing
IAS 17 defines finance leases as transactions whereby risks and benefits involved in owning the asset concerned are transferred to the lessee, and stipulates the criteria for identifying whether or not a lease is a finance or operating lease. All leases entered into by the Group qualify as finance leases under the terms of IAS 17. Accordingly, a receivable is booked at an amount equal to the net outlay involved in the finance lease transaction,

Notes to the accounts | Part A - Accounting policies 69
plus any costs directly incurred in respect of negotiating and/or performing the contract.
Hedges
There are two types of hedge:– fair value hedges, which are intended to offset the exposure of recognized
assets and liabilities to changes in their fair value;
– cash flow hedges, which are intended to offset the exposure of recognized assets and liabilities to changes in future cash flows attributable to specific risks relating to the items concerned.
For the process to be effective, the item must be hedged with a counterparty from outside the Group.
Hedge derivatives are recognized at fair value as follows:– changes in fair value of derivatives that are designated and qualify as
fair value hedges are recorded in the profit and loss account, together with any changes in the fair value of the hedged asset, where a difference between the two emerges as a result of the partial ineffectiveness of the hedge;
– designated and qualify as cash flow hedges are recognized in net equity, while the gain or loss deriving from the ineffective portion is recognized through the profit and loss account only as and when, with reference to the hedged item, the change in cash flow to be offset crystallizes.
Hedge accounting is permitted for derivatives where the hedging relationship is formally designated and documented and provided that the hedge is effective at its inception and is expected to be so for its entire life.
A hedge is considered to be effective when the changes in fair value or cash flow of the hedging instrument offset those of the hedged item within a range of 80-125%. The effectiveness of a hedge is assessed both prospectively and retrospectively at annual and interim reporting dates, the former to show expectations regarding effectiveness, the latter to show the degree of effectiveness actually achieved by the hedge during the period concerned. If an instrument proves to be ineffective, hedge accounting is

70 Interim Report for the six months ended 31 December 2012
discontinued and the derivative concerned is accounted for under trading securities.
Equity investments
This heading consists of investments in:– associates, which are equity-accounted. Associates are defined as
companies in which at least 20% of the voting rights are held, and those in which the size of the investment is sufficient to ensure an influence in the governance of the investee company;
– jointly-controlled companies, which are also equity-accounted;
– other investments of negligible value, which are recognized at cost.
Where there is objective evidence that the value of an investment may be impaired, estimates are made of its current value using market prices if possible, and of the present value of estimated cash flows generated by the investment, including its terminal value. Where the value thus calculated is lower than the asset’s carrying amount, the difference is taken through the profit and loss account.
Property, plant and equipment
This heading comprises land, core and investment properties, plant, furniture, fittings, equipment and assets used under the terms of finance leases, despite the fact that such assets remain the legal property of the lessor rather than the lessee.
Assets held for investment purposes refer to investments in real estate, if any (whether owned or acquired under leases), which are not core to the Group’s main activities and/or are chiefly leased out to third parties.
These are stated at historical cost, which in addition to the purchase price, includes any ancillary charges directly resulting from their acquisition and/or usage. Extraordinary maintenance charges are reflected by increasing the asset’s value, while ordinary maintenance charges are recorded in the profit and loss account.

Notes to the accounts | Part A - Accounting policies 71
Fixed assets are depreciated over the length of their useful life on a straight-line basis, with the exception of land, which is not depreciated on the grounds that it has unlimited useful life. Properties built on land owned by the Group are recorded separately, on the basis of valuations prepared by independent experts.
At annual and interim reporting dates, where there is objective evidence that the value of an asset may be impaired, its carrying amount is compared to its current value, which is defined as the higher of its fair value net of any sales costs and its related value of use, and adjustments, if any, are recognized through the profit and loss account. If the reasons which gave rise to the loss in value cease to apply, the adjustment is written back to earnings with the proviso that the amount credited may not exceed the value which the asset would have had net of depreciation, which is calculated assuming no impairment took place.
Intangible assets
These chiefly comprise goodwill and long-term computer software applications.
Goodwill may be recognized where this is representative of the investee company’s ability to generate future income. At annual and interim reporting dates assets are tested for impairment, which is calculated as the difference between the initial recognition value of the goodwill and its realizable value, the latter being equal to the higher of the fair value of the cash-generating unit concerned net of any sales costs and its assumed value of use. Any adjustments are taken through the profit and loss account.
Other intangible assets are recognized at cost, adjusted to reflect ancillary charges only where it is likely that future earnings will derive from the asset and the cost of the asset itself may be reliably determined. Otherwise the cost of the asset is booked to the profit and loss account in the year in which the expense was incurred.

72 Interim Report for the six months ended 31 December 2012
The cost of intangible assets is amortized on the straight-line basis over the useful life of the asset concerned. If useful life is not determinable the cost of the asset is not amortized, but the value at which it is initially recognized is tested for impairment on a regular basis.
At annual and interim reporting dates, where there is evidence of impairment the realizable value of the asset is estimated, and the impairment is recognized in the profit and loss account as the difference between the carrying amount and the recoverable value of the asset concerned.
Derecognition of assets
Financial assets are derecognized as and when the Group is no longer entitled to receive cash flows deriving from them, or when they are sold and the related risks and benefits are transferred accordingly. Tangible and intangible assets are derecognized upon disposal, or when an asset is permanently retired from use and no further earnings are expected to derive from it.
Assets or groups of assets which are sold continue to be recognized if the risks and benefits associated with them (in the relevant technical form) continue to be attributable to the Group. A corresponding amount is then entered as a liability to offset any amounts received (as Other amounts receivable or Repos).
The main forms of activity currently carried out by the Group which do not require underlying assets to be derecognized are the securitization of receivables, repo trading and securities lending.
Conversely, items received as part of deposit bank activity, the return on which is collected in the form of a commission, are not recorded, as the related risks and benefits continue to accrue entirely to the end-investor.
Payables, debt securities in issue and subordinated liabilities
These include the items Due to banks, Due to customers and Debt securities in issue less any shares bought back. Amounts payable by the lessee under the terms of finance leasing transactions are also included.

Notes to the accounts | Part A - Accounting policies 73
Initial recognition takes place when funds raised are collected or debt securities are issued, and occurs at fair value, which is equal to the amount collected net of transaction costs incurred directly or indirectly in connection with the liability concerned. Thereafter liabilities are stated at amortized cost on the basis of the original effective interest rate, with the exception of short-term liabilities which continue to be stated at the original amount collected.
Derivatives embedded in structured bonds are stripped out from the underlying contract and recognized at fair value. Subsequent changes in fair value are recognized through the profit and loss account.
Financial liabilities are derecognized upon expiry or repayment, even if buybacks of previously issued bonds are involved. The difference between the liabilities’ carrying value and the amount paid to repurchase them is recorded through the profit and loss account.
The sale of treasury shares over the market following a buyback (even in the form of repos and securities lending transactions) is treated as a new issue. The new sale price is recorded as a liability without passing through the profit and loss account.
Trading liabilities
This item includes the negative value of trading derivatives and any derivatives embedded in complex instruments. Liabilities in respect of technical shortfalls deriving from securities trading activity are also included. All trading liabilities are recognized at fair value.
Staff severance indemnity provision
This is stated to reflect the actuarial value of the provision as calculated in line with regulations used for defined benefit schemes. Future obligations are estimated on the basis of historical statistical analysis (e.g. staff turnover, retirements, etc.) and demographic trends. These are then discounted to obtain their present value on the basis of market interest rates. The values thus obtain are booked under labour costs as the net amount of contributions

74 Interim Report for the six months ended 31 December 2012
paid, prior years’ contributions not yet capitalized, interest accrued, and actuarial gains and losses.
All actuarial profits and/or losses are included under labour costs.
Units accruing as from 1 January 2007 paid into complementary pension schemes or the Italian national insurance system are recorded on the basis of contributions accrued during the period.
Provisions for liabilities and charges
These regard risks linked with the Group’s operations but not necessarily associated with failure to repay loans, and which could lead to expenses in the future. If the time effect is material, provisions are discounted using current market rates. Provisions are recognized in the profit and loss account.
Provisions are reviewed on a regular basis, and where the charges that gave rise to them are deemed unlikely to crystallize, the amounts involved are written back to the profit and loss account in part or in full.
Withdrawals are only made from provisions to cover the expenses for which the provision was originally made.
Foreign currency transactions
Transactions in foreign currencies are recorded by applying the exchange rates as at the date of the transaction to the amount in the foreign currency concerned.
Assets and liabilities denominated in currencies other than the Euro are translated into Euros using exchange rates ruling at the dates of the transactions. Differences on cash items due to translation are recorded through the profit and loss account, whereas those on non-cash items are recorded according to the valuation criteria used in respect of the category they belong to (i.e. at cost, through the profit and loss account or on an equity basis).

Notes to the accounts | Part A - Accounting policies 75
Tax assets and liabilities
Income taxes are recorded in the profit and loss account, with the exception of tax payable on items debited or credited directly to net equity. Provisions for income tax are calculated on the basis of current, advance and deferred obligations. Advance and deferred tax is calculated on the basis of temporary differences – without time limits – between the carrying amount of an asset or liability and its tax base, according to statutory criteria and the corresponding values used for tax purposes.
Advance tax assets are recognized in the balance sheet based on the likelihood of their being recovered.
Deferred tax liabilities are recognized in the balance sheet with the exception of tax-suspended reserves, if the size of the reserves available already subjected to taxation is such that it may be reasonably assumed that no transactions will be carried out on the Group’s own initiative that might lead to their being taxed.
Deferred tax arising upon business combinations is recognized when this is likely to result in a charge for one of the companies concerned.
Tax assets and liabilities are adjusted as and when changes occur in the regulatory framework or in applicable tax rates, inter alia to cover charges that might arise in connection with inspections by or disputes with the tax revenue authorities.
Stock options and performance shares
The stock option and performance share schemes operated on behalf of Group staff members and collaborators are treated as a component of labour costs. The fair value of the instruments is measured and recognized in net equity at the grant date using a share/option pricing method adjusted to reflect historical series for previous financial years. The value thus determined is taken to the profit and loss account pro-rata to the vesting period for the individual awards.

76 Interim Report for the six months ended 31 December 2012
Treasury shares
These are deducted from net equity, and any gains/losses realized on disposal are recognized in net equity.
Dividends and commissions
These are recognized as and when they are realized, provided there is reasonable likelihood that future benefits will accrue.
Fees included in amortized cost for purposes of calculating the effective interest rate are not included, but are recorded under Net interest income.
Related parties (IAS 24)
In accordance with IAS 24, related parties are defined as:a) individuals or entities which directly or indirectly:
1. are subject to joint control by Mediobanca;
2. hold an interest in Mediobanca which allows them to exert a significant influence over Mediobanca; the scope of this definition includes parties to the Mediobanca shareholders’ agreement with interests of over 5% of the company’s share capital, along with the entitlement to appoint at least one member of the Board of Directors, and the entities controlled by them;
b) associate companies, joint ventures and entities controlled by them;
c) management with strategic responsibilities, that is, individuals with powers and responsibilities, directly or indirectly, for the planning, direction and control of the parent company’s activities, including the members of the Board of Directors and Statutory Audit Committee;
d) entities controlled or jointly controlled by one or more of the individuals listed under the foregoing letter c);

Notes to the accounts | Part A - Accounting policies 77
e) close family members of the individuals referred to in letter c) above, that is, individuals who may be expected to influence them or be influenced by them in their relations with Mediobanca (this category includes partners, children, partners’ children, dependents and partners’ dependents) as well as any entities controlled, jointly controlled or subject to significant influence by such individuals;
f) pension funds for employees of the parent company or any other entity related to it.

78 Interim Report for the six months ended 31 December 2012
A.3 - Information on Fair value
A.3.1 Transfers between portfolios
A.3.1.1 Reclassified financial assets: book value, fair value and effects on overall profitability
(€’000)
Type of instrument Transferred from Transferred to Book value at 31/12/12
Fair value at 31/12/12
Additions to P&L if assets not transferred
(pre-tax)
Additions to P&L made during the year (pre-tax)
Valuation Other Valuation Other
Debt securities (ABS) 1
Financial assets held for trading
Due from customers 146,442 127,855 6,672 1,585 — 1,585
Debt securities (ABS) 1 AFS securities
Due from customers 46,642 43,096 1,966 549 — 549
Debt securities 2 AFS securities Financial assets held to maturity 475,432 504,540 31,664 11,487 — 11,487
Total 668,516 675,491 40,302 13,621 — 13,621
1 Made during FY 08/092 Made during FY 10/11.

Notes to the accounts | Part A - Accounting policies 79
A.3.2 Fair value ranking
A.3.2.1 Asset portfolios by fair value ranking(€’000)
Financial assets/Liabilities measured at fair value
31/12/12 30/6/12
Level 1 Level 2 Level 3 Level 1 Level 2 Level 3
1. Financial assets held for trading 7,860,202 5,896,194 941,479 ¹ 7,253,842 5,643,274 941,100 ¹
2. Financial assets recognized at fair value — — — — — —
3. AFS securities 9,981,954 916,585 837,049 2 8,800,953 906,415 844,781 2
4. Hedge derivatives — 1,688,407 — — 1,571,778 —
Total 17,842,156 8,501,186 1,778,528 16,054,795 8,121,467 1,785,881
1. Financial liabilities held for trading (4,570,340) (5,060,740) (1,016,492) ¹ (3,826,564) (4,955,828) (1,152,618) ¹
2. Financial liabilities recognized at fair value — — — — — —
3. Hedge derivatives — (345,677) — — (364,954) —
Total (4,570,340) (5,406,417) (1,016,492) (3,826,564) (5,320,782) (1,152,618)
¹ Includes market value of options covering those attached to bond issues by Mediobanca and Mediobanca International (€227m at 31/12/12 and €208m at 30/6/12) as well as options traded (€659m and €679m respectively), the values of which are recorded as both assets and liabilities for the same amount.
² Includes investments in unlisted companies valued on the basis of internal models.
Level 2 financial assets held for trading include various basis deals (in particular negative basis trades, bonds covered by credit derivatives and specific funding of the same duration). The difference between the mark-to-market on the various instruments is taken through the profit and loss account pro rata for the duration of the transaction.

80 Interim Report for the six months ended 31 December 2012
A.3.2.2 Annual changes in financial assets recognized at fair value (level 3 assets)(€’000)
FINANCIAL ASSETS
Held for trading¹ Recognized at fair value
AFS² Hedges
1. Balance at start of period 53,464 — 844,781 —
2. Additions 14,557 — 13,312 —
2.1 Purchases 10,612 — 5,630 —
2.2 Profits recognized in: 3,196 — 7,572 —
2.2.1 profit and loss 3,196 — 3,438 —
- of which, gains 3,145 — — —
2.2.2 net equity X X 4,134 —
2.3 Transfers from other levels — — — —
2.4 Other additions 749 — 110 —
3. Reductions 12,631 — 21,044 —
3.1 Disposals 7,743 — 6,111 —
3.2 Redemptions 123 — — —
3.3 Losses recognized in: 4,765 — 11,652 —
3.3.1 profit and loss 4,765 — 6,634 —
- of which, losses 4,765 — 6,611 —
3.3.2 net equity X X 5,018 —
3.4 Transfers to other levels — — — —
3.5 Other reductions — — 3,281 —
4. Balance at end of period 55,390 — 837,049 —
¹ Includes market value of options covering those attached to bond issues by Mediobanca and Mediobanca International (€227m at 31/12/12 and €208m at 30/6/12) as well as options traded (€659m and €679m respectively), the values of which are recorded as both assets and liabilities for the same amount.
² Includes investments in unlisted companies valued on the basis of internal models.
For more complex Level 3 instruments, the valuation models reflect a fine-tuning in the parameters used (“model reserve”) which allows the initial mark-to-market to be reduced to zero and released pro rata for the duration of the contract. This technique has only been applied to three contracts, with an aggregate residual impact of €1.5m (30/6/12: €2.9m), after €1.4m was charged to the profit and loss account for the period.

Notes to the accounts | Part A - Accounting policies 81
A.3.2.3 Annual changes in financial liabilities recognized at fair value (level 3 liabilities)
(€’000)
FINANCIAL LIABILITIES
Held for trading 1-2 Recognized at fair value
Hedges
1. Balance at start of period 264,980 — —
2. Additions 50,311 — —
2.1 Issues 24,360 — —
2.2 Losses recognized in: 25,951 — —
2.2.1 profit and loss 25,951 — —
- of which, losses 25,951 — —
2.2.2 net equity X X —
2.3 Transfers from other levels — — —
2.4 Other additions — — —
3. Reductions 184,889 — —
3.1 Redemptions 172,278 — —
3.2 Buybacks — — —
3.3 Profits recognized in: 12,611 — —
3.3.1 profit and loss 12,611 — —
- of which, gains 4,442 — —
3.3.2 net equity X X —
3.4 Transfers to other levels — — —
3.5 Other reductions — — —
4. Balance at end of period 130,402 — —
¹ Includes market value of options covering those attached to bond issues by Mediobanca and Mediobanca International (€227m at 31/12/12 and €208m at 30/6/12) as well as options traded (€659m and €679m respectively), the values of which are recorded as both assets and liabilities for the same amount.
² The amount of the redemptions is entirely due to trading involving options on listed securities forming part of delta hedging strategies, the values of which are recorded as both assets and liabilities in the accounts for the same amount.

82 Interim Report for the six months ended 31 December 2012
Part B - Notes to consolidated balance sheet*
Assets
SECTION 1
Heading 10: Cash and cash equivalents
1.1 Cash and cash equivalents 31/12/12 30/6/12
a) Cash 28,642 26,307
b) Demand deposits held at central banks 6,869 3,434
Total 35,511 29,741
* Figures in €’000 save in footnotes, where figures are provided in full.

Notes to the accounts | Part B - Notes to the consolidated balance sheet 83
SECTION 2
Heading 20: Financial assets held for trading
2.1 Financial assets held for trading: compositionItem/value 31/12/12 30/6/12
Level 1 Level 2 Level 3 Level 1 Level 2 Level 3
A. Cash assets
1. Debt securities 4,744,829 1,034,085 1 3,831,088 1,197,361 1
1.1 Structured 69,904 59,919 — 139,556 67,838 —
1.2 Other debt securities 4,674,925 974,166 1 3,691,532 1,129,523 1
2. Equities1 1,027,506 — 22,814 536,817 — 26,800
3. UCITS units 88,824 169,495 18,395 215,943 292,206 20,006
4. Loans and advances — 90,857 — — 5,180 —
4.1 Repos — — — — — —
4.2 Others — 90,857 — — 5,180 —
Total A 5,861,159 1,294,437 41,210 4,583,848 1,494,747 46,807
B. Derivative products
1. Financial derivatives 898,956 4,424,896 900,269 1,104,548 3,925,776 894,293
1.1 Trading 898,956 4,233,482 666,765 ² 1,104,548 3,745,183 685,476 ²
1.2 Linked to fair value options — — — — — —
1.3 Others — 191,414 233,504 ³ — 180,593 208,817 ³
2. Credit derivatives 1,100,087 176,861 — 1,565,446 222,751 —
2.1 Trading 1,100,087 176,861 — 1,565,446 222,751 —
2.2 Linked to fair value options — — — — — —
2.3 Others — — — — — —
Total B 1,999,043 4,601,757 900,269 2,669,994 4,148,527 894,293
Total (A+B) 7,860,202 5,896,194 941,479 7,253,842 5,643,274 941,100
¹ Equities as at 31 December 2012 include shares committed as part of securities lending transactions in an amount of €555,810,000.
² Respectively €658,903,000 and €679,392,000 in respect of options traded, with the equivalent amount being recorded as trading liabilities.3 Market value of options covering options implicit in bonds issued by Mediobanca S.p.A. and Mediobanca International, with the equivalent
amount being recorded as trading liabilities.

84 Interim Report for the six months ended 31 December 2012
2.3 Cash assets held for trading: movements during the periodDebt
securities Equities UCITS unitsLoans and advances Total
A. Balance at start of period 5,028,450 563,617 528,155 5,180 6,125,402
B. Additions 17,684,239 3,678,656 246,525 91,338 21,700,758
B.1 Acquisitions 16,124,761 3,561,403 235,767 90,713 20,012,644
B.2 Increases in fair value 170,699 45,758 4,950 448 221,855
B.3 Other additions 1,388,779 71,495 5,808 177 1,466,259
C. Reductions 16,933,774 3,191,953 497,966 5,661 20,629,354
C.1 Disposals 16,284,238 3,021,108 488,168 5,360 19,798,874
C.2 Redemptions 497,362 — — 47 497,409
C.3 Reductions in fair value 74,474 49,021 6,158 183 129,836
C.4 Transfers to other portfolios — — — — —
C.5 Other reductions 77,700 121,824 3,640 71 203,235
D. Balance at end of period 5,778,915 1,050,320 276,714 90,857 7,196,806
SECTION 4
Heading 40: Available for sale (AFS) securities
4.1 AFS securities: compositionItem/value 31/12/12 30/6/12
Level 1 Level 2 Level 3* Level 1 Level 2 Level 3*
1. Debt securities 9,721,714 906,364 11,825 8,540,602 896,810 9,713
1.1 Structured — — — — — —
1.2 Other debt securities 9,721,714 906,364 11,825 8,540,602 896,810 9,713
2. Equities 259,876 643 731,649 260,002 643 737,357
2.1 Recognized at fair value 259,876 643 731,597 260,002 643 737,305
2.2 Recognized at cost — — 52 — — 52
3. UCITS units 364 9,578 93,575 349 8,962 97,711
4. Loans and advances — — — — — —
Total 9,981,954 916,585 837,049 8,800,953 906,415 844,781
* Includes investments in unlisted companies valued on the basis of internal models.

Notes to the accounts | Part B - Notes to the consolidated balance sheet 85
4.4 AFS securities: movements during the periodDebt securities Equities UCITS units Loans and
advances Total
A. Balance at start of period 9,447,125 998,002 107,022 — 10,552,149
B. Additions 4,701,705 52,169 3,424 — 4,757,298
B.1 Acquisitions 4,175,752 27,300 1,507 — 4,204,559
B.2 Increases in fair value 460,874 19,614 1,910 — 482,398
B.3 Writebacks 12,169 — — — 12,169
- recognized in profit and loss account 12,169 X — — 12,169
- recognized in net equity — — — — —
B.4 Transfers from other asset classes — — — — —
B.5 Other additions 52,910 5,255 7 — 58,172
C. Reductions 3,508,927 58,003 6,929 — 3,573,859
C.1 Disposals 2,097,517 43,072 177 — 2,140,766
C.2 Redemptions 1,405,056 — — — 1,405,056
C.3 Reductions in fair value 1,717 8,394 2,333 — 12,444
C.4 Writedowns due to impairment — 3,977 3,669 — 7,646
- taken to profit and loss account — 3,021 3,669 — 6,690
- taken to net equity — 956 — — 956
C.5 Transfers to other asset classes — — 750 — 750
C.6 Other reductions 4,637 2,560 — — 7,197
D. Balance at end of period 10,639,903 992,168 103,517 — 11,735,588
SECTION 5
Heading 50: Financial assets held to maturity
5.1 Financial assets held to maturity: compositionType of transactions/group components
31/12/12 30/6/12
Book value Fair Value Book value Fair Value
Level 1 Level 2 Level 3 Level 1 Level 2 Level 3
1. Debt securities 1,722,548 1,565,207 223,250 11,498 1,723,279 1,472,810 218,713 22,305
1.1 Structured — — — — — — — —
1.2 Other debt securities 1,722,548 1,565,207 223,250 11,498 1,723,279 1,472,810 218,713 22,305
2. Loans and advances — — — — — — — —
Total 1,722,548 1,565,207 223,250 11,498 1,723,279 1,472,810 218,713 22,305

86 Interim Report for the six months ended 31 December 2012
5.4 Financial assets held to maturity: movements during the periodDebt securities Loans and advances Total
A. Balance at start of period 1,723,279 — 1,723,279
B. Additions 6,270 — 6,270
B.1 Acquisitions 922 — 922
B.2 Writebacks 405 — 405
B.3 Transfers from other asset classes — — —
B.4 Other additions 4,943 — 4,943
C. Reductions 7,001 — 7,001
C.1 Disposal 653 — 653
C.2 Redemptions 5,683 — 5,683
C.3 Value adjustments 247 — 247
C.4 Transfers to other asset classes — — —
C.5 Other reductions 418 — 418
D. Balance at end of period 1,722,548 — 1,722,548
SECTION 6
Heading 60 - Due from banks
6.1 Due from banks: compositionType of transactions/value 31/12/12 30/6/12
A. Due from central banks 136,781 133,774
1. Term deposits — —
2. Compulsory reserves 136,781 133,774
3. Amounts due under repo agreements — —
4. Other amounts due — —
B. Due from banks 5,067,147 3,829,076
1. Current accounts and demand deposits 3,099,418 2,229,732
2. Term deposits 50,102 121,538
3. Other receivables: 1,887,664 1,477,806
3.1 amounts due under repo agreements 645,312 177,119
3.2 amounts due under finance leases 5,585 8,604
3.3 other amounts due 1,236,767 1,292,083
4. Debt securities 29,963 —
4.1 structured — —
4.2 other debt securities 29,963 —
Total book value 5,203,928 3,962,850
Total fair value 5,204,036 3,959,793

Notes to the accounts | Part B - Notes to the consolidated balance sheet 87
SECTION 7
Heading 70: Due from customers
7.1 Due from customers: compositionType of transactions/amounts 31/12/12 30/6/12
Performing Non-performing Performing Non-performing
1. Current accounts 144,062 64 69,478 55
2. Amounts due under repo agreements 3,841,412 — 4,585,819 —
3. Mortgages 18,842,697 377,567 20,772,946 302,766
4. Credit cards, personal loans and salary-guaranteed finance 8,807,381 373,746 8,840,762 361,227
5. Amounts due under finance leasing 3,541,099 231,199 3,898,907 208,537
6. Factoring — — — —
7. Other transactions 2,685,489 18,688 2,194,010 31,789
8. Debt securities 613,839 — 604,852 —
8.1 structured — — — —
8.2 other debt securities 613,839 — 604,852 —
Total book value 38,475,979 1,001,264 40,966,774 904,374
Total fair value 38,112,299 40,583,672
SECTION 8
Heading 80: Hedging derivatives
8.1 Hedging derivatives: by type and ranking 31/12/12 Notional
value 30/6/12 Notional
valueFair value Fair value
Level 1 Level 2 Level 3 Level 1 Level 2 Level 3
A. Financial derivates — 1,688,407 — 21,766,767 — 1,571,778 — 22,071,789
1) Fair value — 1,688,407 — 21,766,767 — 1,571,778 — 22,071,789
2) Cash flow — — — — — — — —
3) Non-Italian investments — — — — — — — —
B. Credit derivatives — — — — — — — —
1) Fair value — — — — — — — —
2) Cash flow — — — — — — — —
Total — 1,688,407 — 21,766,767 — 1,571,778 — 22,071,789

88 Interim Report for the six months ended 31 December 2012
8.2 Hedging derivatives: by portfolio hedged and hedge type (book value)Operations/type of hedging Fair value Cash flow hedges Non-Italian
investments Specific General Specific General
Interest rate risk
Exchange rate risk
Credit risk
Price risk
More than one
risk
1. AFS securities 3,394 — — — — X — X X
2. Loans and advances — — — X — X — X X
3. Financial assets held to maturity X — — X — X — X X
4. Portfolio X X X X X — X — X
5. Non-Italian investments — — — — — X — X —
Total assets 3,394 — — — — — — — —
1. Financial liabilities 1,683,405 1,608 — X — X — X X
2. Portfolio X X X X X — X — X
Total liabilities 1,683,405 1,608 — X — — — — X
1. Estimated transactions X X X X X X — X X
2. Portfolio of financial assets and liabilities X X X X X — X — —
SECTION 10
Heading 100: Equity investments
10.1 Investments in jointly-controlled companies (equity-accounted) and companies subject to significant influence: disclosures on shareholdings
Name Registered office Type of relationship
Shareholding % of voting rightsInvestor
company% interest
Companies
1. Banca Esperia S.p.A. Milan 1 Mediobanca 50.00 50.00
2. Fidia SGR S.p.A. (in liquidation) Milan 2 Mediobanca 25.00 25.00
3. Athena Private Equity S.A. Luxembourg 2 Mediobanca 24.27 24.27
4. Burgo Group S.p.A. Altavilla Vicentina (VI) 2 Mediobanca 22.13 22.13
5. RCS MediaGroup S.p.A. Milan 2 Mediobanca 14.36 14.94
6. Assicurazioni Generali S.p.A. Trieste 2 Mediobanca 13.24 13.24
7. Gemina S.p.A Milan 2 Mediobanca 12.53 12.56
8. Telco S.p.A. Milan 2 Mediobanca 11.62 11.62
9. Pirelli & C. S.p.A. Milan 2 Mediobanca 4.49 4.61
Legend:1 Joint control.2 Subject to significant influence.3 Subsidiaries owned 100% and not consolidated.

Notes to the accounts | Part B - Notes to the consolidated balance sheet 89
10.2 Investments in jointly-controlled companies and companies subject to significant influence: accounting information
Name Book value Fair value
B. JOINTLY-CONTROLLED COMPANIES (IAS 31)
1. Banca Esperia S.p.A. 90,281 1 —
C. COMPANIES SUBJECT TO SIGNIFICANT INFLUENCE (IAS 28)
1. Burgo Group S.p.A. 68,463 —
2. Assicurazioni Generali S.p.A. 2,560,705 2,831,747
3. RCS MediaGroup S.p.A. 89,538 ² 137,336
4. Fidia SGR S.p.A. (into liquidation) 748 —
5. Athena Private Equity S.A. 21,466 —
6. Telco S.p.A. 107,033 —
7. Pirelli & C. S.p.A. 123,849 3 189,737
8. Gemina S.p.A. 221,874 198,186
Other minor investments 52 —
Total 3,284,009 —1 Includes goodwill amounting to €4,781,000.
2 Includes goodwill amounting to €51,533,000.
3 Includes goodwill amounting to €24,272,000.
The Telco investment has been adjusted in line with a net asset value as shown in the company’s interim accounts for the period ended 31 October 2012 (IAS-compliant) reflecting the writedown to the Telecom Italia investment from €1.5 to €1.2 per share. This book value has been deemed not to be in excess of the net present value as defined in IAS 28, section 33, based on the following considerations: – with a 22.4% interest in the share capital of Telecom Italia, Telco is the
group’s leading shareholder;
– the time horizon of the investment is medium/long-term;
– the value assigned to the Telecom Italia stock is consistent with the result derived from applying a discounted cash flow model based on the strategic guidance and objectives for the 2013-2018 period presented by Telecom Italia to investors on 8 February 2013. Based on the information currently available, no further impairment charges
have been made to the other investments.

90 Interim Report for the six months ended 31 December 2012
SECTION 12
Heading 120: Property, plant and equipment
12.1 Tangible assets stated at costAssets/value 31/12/12 30/6/12
A. Core assets
1.1 owned by the Group 236,658 238,191
a) land 84,883 84,883
b) buildings 111,398 109,428
c) furniture 15,736 17,686
d) electronic equipment 10,536 11,119
e) other assets 14,105 15,075
1.2 acquired under finance leases: — —
a) land — —
b) buildings — —
c) furniture — —
d) electronic equipment — —
e) other assets — —
Total A 236,658 238,191
B. Assets held for investment purposes
2.1 owned by the Group: 61,810 55,489
a) land 23,739 23,038
b) buildings 38,071 32,451
2.2 acquired under finance leases: — —
a) land — —
b) buildings — —
Total B 61,810 55,489
Total (A+B) 298,468 293,680

Notes to the accounts | Part B - Notes to the consolidated balance sheet 91
12.3 Core tangible assets: movements during the periodLand Buildings Furniture Electronic
equipmentOther assets Total
A. Gross opening balance 84,883 139,489 45,293 33,204 57,325 360,194
A.1 Total net value reductions — (30,061) (27,607) (22,085) (42,250) (122,003)
A.2 Net opening balance 84,883 109,428 17,686 11,119 15,075 238,191
B. Additions: — 3,739 289 910 1,827 6,765
B.1 Purchases — 3,620 281 893 1,827 6,621
B.2 Improvement expenses, capitalized — 119 8 10 — 137
B.3 Writebacks — — — — — —
B.4 Increases in fair value recognized in: — — — — — —
a) net equity — — — — — —
b) profit and loss account — — — — — —
B.5 Increases arising due to exchange rates — — — — — —
B.6 Transfers from properties held for investment purposes — — — — — —
B.7 Other additions — — — 7 — 7
C. Reductions: — 1,769 2,239 1,493 2,797 8,298
C.1 Disposals — — — — 5 5
C.2 Depreciation charges — 1,769 2,239 1,486 2,792 8,286
C.3 Value adjustments for impairment taken to: — — — — — —
a) net equity — — — — — —
b) profit and loss account — — — — — —
C.4 Reductions in fair value charged to: — — — — — —
a) net equity — — — — — —
b) profit and loss account — — — — — —
C.5 Reductions due to exchange rates — — — — — —
C.6 Transfers to: — — — — — —
a) assets held for investment purposes — — — — — —
b) assets being sold — — — — — —
C.7 Other reductions — — — 7 — 7
D. Net closing balance 84,883 111,398 15,736 10,536 14,105 236,658
D.1 Total net value reductions — (31,830) (29,777) (23,455) (44,500) (129,562)
D.2 Gross closing balance 84,883 143,228 45,513 33,991 58,605 366,220
E. Stated at cost — — — — — —

92 Interim Report for the six months ended 31 December 2012
12.4 Tangible assets held for investment purposes: movements during the period
Total
Land Buildings
A. Gross opening balance 23,038 32,451
B. Additions 701 7,052
B.1 Purchases 1 701 7,052
B.2 Improvement expenses, capitalized — —
B.3 Net increases in fair value — —
B.4 Writebacks — —
B.5 Increases arising due to exchange rates — —
B.6 Transfers from core assets — —
B.7 Other additions — —
C. Reductions — 1,432
C.1 Disposals — —
C.2 Depreciation charges — 1,432
C.3 Reductions in fair value — —
C.4 Value adjustments for impairment — —
C.5 Reductions arising due to exchange rates — —
C.6 Transfers to other asset portfolios — —
a) core assets — —
b) non-current assets being sold — —
C.7 Other reductions — —
D. Closing balance 23,739 38,071
E. Stated at fair value 90,714 68,930
1 Related to collection of a leased property after leasing contract was converted.
SECTION 13
Heading 130: Intangible assets
13.1 Intangible assetsAssets/ amounts 31/12/12 30/6/12
Limited useful life Unlimited useful life Limited useful life Unlimited useful life
A.1 Goodwill X 365,934 X 365,934
A.1.1 attributable to the Group X 365,934 X 365,934
A.1.2 attributable to third parties X — X —
A.2 Other intangible assets 44,293 6,300 52,139 6,300
A.2.1 Recognized at cost: 44,293 6,300 52,139 6,300
a) intangible assets generated internally — — — —
b) other assets 44,293 6,300 52,139 6,300
A.2.2 Recognized at fair value: — — — —
a) intangible assets generated internally — — — —
b) other assets — — — —
Total 44,293 372,234 52,139 372,234

Notes to the accounts | Part B - Notes to the consolidated balance sheet 93
13.2 Intangible assets: movements during the periodGoodwill Other intangible assets:
generated internallyOther intangible assets:
otherTotal
Limited useful life
Unlimited useful life
Limited useful life
Unlimited useful life
A. Balance at start of period 365,934 — — 134,552 6,300 506,786
A.1 Total net value reductions — — — (82,413) — (82,413)
A.2 Net opening balance 365,934 — — 52,139 6,300 424,373
B. Additions — — — 3,300 — 3,300
B.1 Purchases — — — 3,300 — 3,300
B.2 Increases in internally generated assets X — — — — —
B.3 Revaluations X — — — — —
B.4 Increases in fair value taken to: X — — — — —
– net equity X — — — — —
– profit and loss account X — — — — —
B.5 Increases arising on exchange rates — — — — — —
B.6 Other additions — — — — — —
C. Reductions — — — 11,146 — 11,146
C.1 Disposals — — — — — —
C.2 Value adjustments — — — 11,146 — 11,146
– amortization X — — 11,146 — 11,146
– writedowns — — — — — —
+ net equity X — — — — —
+ profit and loss account — — — — — —
C.3 Reductions in fair value charged to: — — — — — —
– net equity X — — — — —
– profit and loss account X — — — — —
C.4 Transfers to non-current assets being sold — — — — — —
C.5 Reductions due to exchange rate differences — — — — — —
C.6 Other reductions — — — — — —
D. Balance at end of period 365,934 — — 44,293 6,300 416,527
D.1 Total net value adjustments — — — (89,918) — (89,918)
E. Gross closing balance 365,934 — — 134,211 6,300 506,445
F. Stated at cost — — — — — —

94 Interim Report for the six months ended 31 December 2012
SECTION 14
Asset heading 140 and Liability heading 80: Tax assets and liabilities
14.1 Advance tax assets: composition 31/12/12 30/6/12
Corporate income tax (IRES) 592,336 662,943
Regional production tax (IRAP) 53,495 74,545
Total 645,831 737,488
14.2 Deferred tax liabilities: composition 31/12/12 30/6/12
Corporate income tax (IRES) 334,611 289,557
Regional production tax (IRAP) 15,264 6,561
Total 349,875 296,118
14.3 Changes in advance tax during the period 31/12/12 30/6/12
1. Opening balance 528,382 522,367
2. Additions 67,173 69,113
2.1 Advance tax originating during the period 67,173 69,113
a) for previous years 825 5
b) due to changes in accounting policies — —
c) amounts written back 11 99
d) other additions 66,337 69,009
2.2 New taxes or increases in tax rates — —
2.3 Other additions — —
3. Reductions 47,816 63,098
3.1 Advance tax reversed during the period 41,547 49,992
a) reclassifications 41,236 48,409
b) amounts written off as unrecoverable — —
c) due to changes in accounting policies — —
d) other 311 1,583
3.2 Reductions in tax rates — —
3.3 Other reductions 6,269 13,106
a) trasformation into tax credit due to L. n. 214/2011 6,269 2,823
b) others — 10,283
4. Balance at end of period 547,739 528,382

Notes to the accounts | Part B - Notes to the consolidated balance sheet 95
14.3.1 Changes in advance tax during the period pursuant to Italian Law 214/11: movements during the period
31/12/12 30/6/12
1. Opening balance 393,101 —
2. Additions 47,433 426,310
3. Reductions (37,937) (33,209)
3.1 Reclassification (31,659) (30,387)
3.2 Trasformation into tax credit due to L. n. 214/2011 (6,269) (2,822)
a) due to loss for the period — —
b) due to fiscal loss (6,269) (2,822)
3.3 Other reductions (9) —
4. Balance at end of period 402,597 393,101
14.4 Changes in deferred tax during the period 31/12/12 30/6/12
1. Opening balance 274,814 270,701
2. Additions 6,771 6,548
2.1 Deferred tax originating during period 3,409 6,523
a) relating to previous years 16 —
b) due to changes in accounting policies — —
c) others 3,393 6,523
2.2 New taxes or increases in tax rates — —
2.3 Other additions 3,362 25
3. Reductions 992 2,435
3.1 Deferred tax reversed during period 779 2,432
a) reclassifications 487 2,377
b) due to changes in accounting policies — —
c) others 292 55
3.2 Reductions in tax rates — —
3.3 Other reductions 213 3
4. Balance at end of period 280,593 274,814

96 Interim Report for the six months ended 31 December 2012
14.5 Changes in advance tax during the period 1
31/12/12 30/6/12
1. Opening balance 209,106 69,084
2. Additions 37,585 195,722
2.1 Advance tax originating during period 37,431 195,722
a) for previous years — —
b) due to changes in accounting policies — —
c) others 37,431 195,722
2.2 New taxes or increases in tax rates — —
2.3 Other additions 154 —
3. Reductions 148,600 55,700
3.1 Advance tax reversed during period 148,600 55,661
a) reclassifications 119,586 55,410
b) writedowns of non-recoverable items — —
c) due to changes in accounting policies — —
d) others 29,014 251
3.2 Reductions in tax rates — —
3.3 Other reductions — 39
4. Balance at end of period 98,091 209,106
1 Taxes on cash flow hedges and AFS securities valuations.
14.6 Changes in deferred tax during the period 1
31/12/12 30/6/12
1. Opening balance 21,304 42,360
2. Additions 69,037 21,288
2.1 Deferred tax originating during period 69,037 21,288
a) for previous years — —
b) due to changes in accounting policies — —
c) others 69,037 21,288
2.2 New taxes or increases in tax rates — —
2.3 Other additions — —
3. Reductions 21,059 42,344
3.1 Advance tax reversed during the period 21,041 42,310
a) reclassifications 21,041 39,235
b) due to changes in accounting policies — —
c) others — 3,075
3.2 Reductions in tax rates — —
3.3 Other reductions 18 34
4. Balance at end of period 69,282 21,304
1 Taxes on cash flow hedges and AFS securities valuations.

Notes to the accounts | Part B - Notes to the consolidated balance sheet 97
SECTION 16
Heading 160: Other assets
16.1 Other assets: composition 31/12/12 30/6/12
1. Gold, silver and precious metals 695 695
2. Accrued income other than capitalized income from financial assets 8,608 8,223
3. Trade receivables or invoices to be issued 53,867 53,023
4. Amounts due from tax revenue authorities (not recorded under Heading 140) 38,157 58,457
5. Other items 105,835 88,924
- bills for collection 9,158 16,648
- amounts due in respect of premiums, grants, indemnities and other items in respect of lending transactions 55,360 51,444
- futures and other securities transactions 143 1,058
- advance payments on deposit commissions 9,918 6,728
- other items in transit 22,848 7,795
- sundry other items 8,408 5,251
6. Adjustment arising on consolidation — 2
Total 207,162 209,324

98 Interim Report for the six months ended 31 December 2012
Liabilities
SECTION 1
Heading 10: Due to banks
1.1 Due to banks: compositionType of transaction/amounts 31/12/12 30/6/12
1. Due to central banks 7,561,050 7,531,506
2. Due to banks 5,607,573 4,468,506
2.1 Current accounts and demand deposits 2,825,699 1,731,667
2.2 Term deposits 50,036 4,405
2.3 Borrowings 2,701,225 2,637,259
2.3.1 Reverse repos 195,828 8,492
2.3.2 Others 2,505,397 2,628,767
2.4 Liabilities in respect of assets sold but not derecognized — —
2.5 Other amounts due 30,613 95,175
Total book value 13,168,623 12,000,012
Total fair value 13,168,623 11,972,463
1.2 Breakdown of Heading 10: “Due to banks”: subordinated debt
Subordinated liabilities included under the heading Due to banks amount to €43,447, and refer to amounts payable by Linea to its former shareholders.

Notes to the accounts | Part B - Notes to the consolidated balance sheet 99
SECTION 2
Heading 20: Due to customers
2.1 Due to customers: compositionType of transaction/amounts 31/12/12 30/6/12
1. Current accounts and demand deposits 2,715,023 3,050,765
2. Term deposits 11,076,931 10,680,682
3. Borrowings 3,713,193 3,417,479
3.1 Reverse repos 1,910,684 1,501,521
3.2 others 1,802,509 1,915,958
4. Liabilities in respect of assets sold but not derecognized — —
5. Other amounts due 7 101
Total book value 17,505,154 17,149,027
Total fair value 17,505,154 17,149,027
SECTION 3
Heading 30: Debt securities in issue
3.1 Debt securities in issue: compositionType of transaction/amounts
31/12/12 30/6/12
Book value Fair value Book value Fair value
Level 1 Level 2 Level 3 Level 1 Level 2 Level 3
A. Listed securities
1. bonds 29,495,023 2,147,945 27,860,303 — 31,279,519 3,297,251 28,354,327 —
1.1 structured 13,217,589 800,714 12,618,538 — 14,199,132 1,209,423 13,142,904 —
1.2 others 16,277,434 1,347,231 15,241,765 — 17,080,387 2,087,828 15,211,423 —
2. other securities 18,259 — — 18,259 20,812 — — 20,812
2.1 structured — — — — — — — —
2.2 others 18,259 — — 18,259 20,812 — — 20,812
Total 29,513,282 2,147,945 27,860,303 18,259 31,300,331 3,297,251 28,354,327 20,812
Subordinated liabilities included under the heading Debt securities in issue total €1,547,435 and are attributable to Mediobanca S.p.A.

100 Interim Report for the six months ended 31 December 2012
SECTION 4
Heading 40: Trading liabilities
4.1 Trading liabilities: compositionType of transaction/amounts
31/12/12 30/6/12
Nominal value
Fair value Fair Value
(*)
Nominal value
Fair value Fair Value
(*)Level 1 Level 2 Level 3 Level 1 Level 2 Level 3
A. Cash liabilities
1. Due to banks 1,533,423 1,577,397 236 — 1,577,633 398,563 393,112 — — 393,112
2. Due to customers 877,250 902,406 64 — 902,470 919,249 906,677 — — 906,677
3. Debt securities — — — — X — — — — X
3.1 Bonds — — — — X — — — — X
3.1.1 Structured — — — — X — — — — X
3.1.2 Other — — — — X — — — — X
3.2 Other securities — — — — X — — — — X
3.2.1 Structured — — — — X — — — — X
3.2.2 Other — — — — X — — — — X
Total A 2,410,673 2,479,803 300 — 2,480,103 1,317,812 1,299,789 — — 1,299,789
B. Derivative products
1. Financial derivatives X 999,473 4,590,789 1,016,428 X X 1,048,006 4,374,553 1,152,220 X
1.1 Trading X 999,473 4,399,914 780,595 (¹) X X 1,048,006 4,195,419 940,567 (¹) X
1.2 Linked to fair value options X — — — X X — — — X
1.3 Other X — 190,875 235,833 (²) X X — 179,134 211,653 (²) X
2. Credit derivatives X 1,091,064 469,652 64 X X 1,478,769 581,275 398 X
2.1 Trading X 1,091,064 469,652 64 X X 1,478,769 581,275 398 X
2.2 Linked to fair value options X — — — X X — — — X
2.3 Other X — — — X X — — — X
Total B X 2,090,537 5,060,441 1,016,492 X X 2,526,775 4,955,828 1,152,618 X
Total (A+B) X 4,570,340 5,060,741 1,016,492 X X 3,826,564 4,955,828 1,152,618 X
* Fair value does not reflect changes in valuation due to changes in issuers’ credit standing versus the issue date.
¹ €658,903,000 and €679,932,000 respectively in respect of options traded, against equivalent amounts recorded as financial assets held for trading.
² Market value of options embedded in bonds issued by the Mediobanca S.p.A. and Mediobanca International, with the equivalent amounts being recorded as financial assets held for trading.

Notes to the accounts | Part B - Notes to the consolidated balance sheet 101
SECTION 6
Heading 60: Hedging derivatives
6.1 Hedging derivatives: by type of product/underlying assetItems/amounts 31/12/12 Fair value Nominal
value 30/6/12 Fair value Nominal
valueLevel 1 Level 2 Level 3 Level 1 Level 2 Level 3
A. Financial derivatives — 345,677 — 5,616,543 — 364,954 — 9,896,258
1) Fair value — 293,380 — 5,057,230 — 318,737 — 9,118,258
2) Cash flow — 52,297 — 559,313 — 46,217 — 778,000
3) Non-Italian investments — — — — — — — —
B. Financial derivatives — — — — — — — —
1) Fair value — — — — — — — —
2) Cash flow — — — — — — — —
Total — 345,677 — 5,616,543 — 364,954 — 9,896,258
6.2 Hedging derivatives: by portfolio hedged/hedge typeOperations/type of hedging
Fair value Cash flow hedges Non-Italian investments
Specific General Specific General
Interest rate risk
Exchange rate risk
Credit risk Price risk More than one risk
1. AFS securities 7,969 — — — — X — X X
2. Loans and advances 33,280 — — X — X — X X
3. Financial assets held to maturity X — — X — X — X X
4. Portfolio X X X X X — X — X
5. Other operations — — — — — X — X —
Total assets 41,249 — — — — — — — —
1. Financial liabilities 249,521 2,610 — X — X 52,297 X X
2. Portfolio X X X X X — X — X
Total liabilities 249,521 2,610 — X — — 52,297 — X
1. Expected transactions X X X X X X — X X
2. Portfolio of financial assets and liabilities X X X X X — X — —

102 Interim Report for the six months ended 31 December 2012
SECTION 8
Heading 80: Tax liabilities
See Assets, Section 14.
SECTION 10
Heading 100: Other liabilities
10.1 Other liabilities: composition 31/12/12 30/6/12
1. Payment agreements (IFRS 2) 9 9 2. Impaired endorsements 14,489 16,969 3. Working capital payables and invoices pending receipt 179,079 191,826 4. Amounts due to revenue authorities 75,435 87,805 5. Amounts due to staff 99,584 131,338 6. Other items: 96,048 114,424 - bills for collection 25,980 27,908 - coupons and dividends pending collection 2,217 2,212 - available sums payable to third parties 25,961 36,474 - premiums, grants and other items in respect of lending transactions 17,334 27,528 - credit notes to be issued 17,653 13,948 - other 6,903 6,354 7. Adjustments upon consolidation — — Total 464,644 542,371
SECTION 11
Heading 110: Staff severance indemnity provision
11.1 Staff severance indemnity provision: changes during the period 31/12/12 30/6/12
A. Balance at start of period 24,652 26,036 B. Additions 8,425 12,951
B.1 Transfers during period 5,711 12,030 B.2 Other additions 2,714 921
C. Reductions 6,231 14,335 C.1 Indemnities paid out 922 2,910 C.2 Other reductions ¹ 5,309 11,425
D. Balance at end of period 26,846 24,652
¹ Includes €4,272,000 in transfers to external, defined contribution pension schemes (€9,067,000 at 30/6/12).

Notes to the accounts | Part B - Notes to the consolidated balance sheet 103
SECTION 12
Heading 120: Provisions
12.1 Provisions: compositionItem/amounts 31/12/12 30/6/12
1. Company post-employment benefit provision — —
2. Other provisions 160,772 160,471
2.1 litigation 2,933 2,546
2.2 staff-related — 468
2.3 other 157,839 157,457
Total 160,772 160,471
12.2 Provisions: movements during the periodItem/amounts Post-
employment benefit
provision
Litigation Staff costs Other provisions
Total
A. Balance at start of period — 2,546 468 157,457 160,471
B. Additions — 393 — 831 1,224
B.1 Transfers during period — 393 — 831 1,224
B.2 Changes due to passing of time — — — — —
B.3 Additions due to changes in discount rate — — — — —
B.4 Other additions — — — — —
C. Reductions — 6 468 449 923
C.1 Transfers during period — 6 164 448 618
C.2 Reductions due to changes in discount rate — — — — —
C.3 Other reductions — — 304 1 305
D. Balance at end of period — 2,933 — 157,839 160,772

104 Interim Report for the six months ended 31 December 2012
SECTION 13
Heading 130: Technical reserves
13.1 Technical reserves: compositionDirect business Indirect business 6 mths ended
31/12/1212 mths ended
30/6/12
A. Non-life business
A.1 Reserves for premiums — 101,694 101,694 93,042
A.2 Reserves for claims — 9,378 9,378 6,240
A.3 Other reserves — — — —
B. Life business
B.1 Mathematical reserves — — — —
B.2 Reserves for sums to be paid out — — — —
B.3 Other reserves — — — —
C. Technical reserves where risk of investment is borne by insured parties
C.1 Reserves for contracts in which performance is related to investment funds and market indexes — — — —
C.2 Reserves deriving from pension fund management — — — —
D. Total technical reserves — 111,072 111,072 99,282
13.2 Technical reserves: movements during the period 31/12/12 30/6/12
A. Non-life business
Balance at start of period 99,282 54,828
Combinations involving group companies — —
Changes to reserves (+/-) 11,790 30,235
Other additions — 14,219
Balance at end of period 111,072 99,282
B. Life business and other reserves
Balance at start of period — 14,219
Combinations involving group companies — —
Changes due to premiums — —
Changes due to sums to be paid out — —
Changes due to payments — —
Changes due to incomes and other bonuses recognized to insured parties (+/-) — —
Changes to other technical reserves (+/-) — —
Other reductions — (14,219)
Balance at end of period — —
C. Total technical reserves 111,072 99,282

Notes to the accounts | Part B - Notes to the consolidated balance sheet 105
SECTION 15
Headings 140, 160, 170, 180, 190, 200 and 220: Net equity
15.1 Group capital: composition
For the composition of the Group’s capital, please see part F of the notes to the accounts.
15.2 Share capital: changes in no. of Mediobanca S.p.A. shares in issue during periodItem/type Ordinary
A. Shares in issue at start of period 861,129,212
– entirely unrestricted 861,129,212
– with restrictions —
A.1 Treasury shares (17,010,000)
A.2 Shares in issue: balance at start of period 844,119,212
B. Additions —
B.1 New share issuance as a result of: —
– rights issues —
- business combinations —
- bond conversions —
- exercise of warrants —
- others —
– bonus issues —
- to staff members —
- to Board members —
- others —
B.2 Treasury share disposals —
B.3 Other additions —
C. Reductions —
C.1 Cancellations —
C.2 Treasury share buybacks —
C.3 Disposals of businesses —
C.4 Other reductions —
D. Shares in issue: balance at end of period 844,119,212
D.1 Add: treasury shares (17,010,000)
D.2 Shares in issue at end of period 861,129,212
– entirely unrestricted 861,129,212
– with restrictions —

106 Interim Report for the six months ended 31 December 2012
15.4 Profit reserves: other informationItem 6 mths ended 31/12/12 12 mths ended 30/6/12
1. Legal reserve 86,113 86,113
2. Statutory reserves 1,077,282 1,077,282
3. Treasury shares 213,844 213,844
4. Others 3,089,384 3,041,662
Total 4,466,623 4,418,901
SECTION 16
Heading 210: Net equity attributable to minorities
16.1 Net equity attributable to minorities: compositionItem/amounts 6 mths ended 31/12/12 12 mths ended 30/6/12
1. Share capital 24,948 24,948
2. Share premium reserve 7,216 7,216
3. Reserves 83,350 83,878
4. Treasury shares — —
5. Valuation reserves¹ (6,095) (6,123)
6. Equity instruments — —
7. Profit (loss) for the period attributable to minorities (1,026) (528)
Total 108,393 109,391
¹ Refers to cash flow hedges.

Notes to the accounts | Part B - Notes to the consolidated balance sheet 107
Other information
1. Guarantees and commitmentsTransactions 6 mths ended 31/12/12 12 mths ended 30/6/12
1. Financial guarantees given to: 174,904 259,912
a) Banks 29,632 29,631
b) Customers 145,272 230,281
2. Commercial guarantees given to: — —
a) Banks — —
b) Customers — —
3. Irrevocable commitments to lend funds to: 12,027,369 14,571,200
a) Banks 67,800 65,699
i) specific 67,800 65,699
ii) standby basis — —
b) Customers 11,959,569 14,505,501
i) specific 9,197,690 10,351,135
ii) standby basis 2,761,879 4,154,366
4. Commitments underlying credit derivatives: hedge sales 1 62,426,813 82,916,472
5. Assets pledged as collateral for customer obligations — —
6. Other commitments 4,921,409 6,243,498
Total 79,550,495 103,991,082
¹ Balance includes transactions fully matched by hedge buys (€57,675,805,000 and €72,496,783,000 respectively).

108 Interim Report for the six months ended 31 December 2012
5. Assets managed and traded on behalf of customers: Banking GroupTransactions 6 mths ended 31/12/12 12 mths ended 30/6/12
1. Securities traded on behalf of customers 15,769,900 16,964,927
a) Purchases 7,218,093 8,268,052
1. settled 7,158,837 8,219,503
2. pending settlement 59,256 48,549
b) Disposals 8,551,807 8,696,875
1. settled 8,492,551 8,648,326
2. pending settlement 59,256 48,549
2. Asset management¹ 3,336,000 3,038,000
a) individuals 847,000 809,000
b) groups 2,489,000 2,229,000
3. Securities under custody/managed on a non discretionary basis 56,298,202 58,585,764
a) customers’ securities held on deposit: in connection with the Bank’s activity as deposit bank (not including asset management)² 8,496,277 9,751,031
1. securities issued by bank drawing up consolidated financial statements 2,606,647 3,109,620
2. other securities 5,889,630 6,641,411
b) other customers’ securities held on deposit (not including asset management): others 6,554,621 6,151,229
1. securities issued by bank drawing up consolidated financial statements 34 34
2. other securities 6,554,587 6,151,195
c) customers’ securities held on deposit with customers 10,408,780 12,330,553
d) own securities held on deposit with customers 30,838,524 30,352,951
4. Other transactions — —
¹ The Esperia group has assets under management worth €6,765,000 (€6,840,000 at 30/6/12).
² The Esperia group manages assets on a non-discretionary basis worth €6,192,000 (€5,995,000 at 30/6/12).

Notes to the accounts | Part C - Notes to consolidated profit and loss account 109
Part C - Notes to consolidated profit and loss account
SECTION 1
Headings 10 and 20: Net interest income
1.1 Interest and similar income: compositionLine items/technical forms Debt
securitiesLoans and advances
Other transactions
6 mths ended
31/12/12
6 mths ended
31/12/11
1. Financial assets held for trading 62,050 189 — 62,239 96,819
2. Financial assets recognized at fair value — — — — —
3. AFS securities 154,357 — — 154,357 125,998
4. Financial assets held to maturity 38,696 — — 38,696 38,395
5. Due from banks 49,030 24,574 — 73,604 98,562
6. Due from customers 7,864 786,717 — 794,581 917,420
7. Hedge derivatives X X 330,405 330,405 272,645
8. Other assets X X 1,112 1,112 2,459
Total 311,997 811,480 331,517 1,454,994 1,552,298
1.4 Interest expense and similar charges: compositionLine items/technical forms Accounts
payableSecurities Other
liabilities6 mths ended
31/12/126 mths ended
31/12/11
1. Due to central banks (29,560) X — (29,560) (4,436)
2. Due to banks (24,540) X — (24,540) (60,887)
3. Due to customers (214,517) X — (214,517) (151,290)
4. Debt securities in issue — (653,825) — (653,825) (777,185)
5. Trading liabilities X — — — —
6. Financial liabilities recognized at fair value — — — — —
7. Other liabilities X X (7) (7) (3)
8. Hedging derivatives X X — — —
Total (268,617) (653,825) (7) (922,449) (993,801)

110 Interim Report for the six months ended 31 December 2012
SECTION 2
Headings 40 and 50: Net fee and commission income
2.1 Net fee and commission income: compositionType of service/sectors 6 mths ended 31/12/12 6 mths ended 31/12/11
a) guarantees given 872 1,230
b) credit derivatives — —
c) management, trading and advisory services: 80,745 90,620
1. securities trading 3,320 3,533
2. foreign currency trading — —
3. asset management 4,212 2,531
3.1 individuals 4,212 2,531
3.2 groups — —
4. securities under custody and non-discretionary management 3,299 2,850
5. deposit bank services 537 600
6. securities placement 30,361 23,494
7. procurement of orders 3,064 3,453
8. advisory services — —
8.1 investment advisory services — —
8.2 structured finance advisory services — —
9. agency fees 35,952 54,159
9.1 asset management 10,693 8,591
9.1.1 individuals 10,693 8,591
9.1.2 groups — —
9.2 insurance products 25,223 45,555
9.3 other products 36 13
d) collection and payment services 3,145 2,449
e) securitization services — —
f) factoring services — —
g) tax collection and receipt services — —
h) multilateral trading systems activity — —
i) current account keeping and management 529 311
j) other services 93,785 112,407
Total 179,076 207,017

Notes to the accounts | Part C - Notes to consolidated profit and loss account 111
2.2 Fee and commission expense: compositionServices/amounts 6 mths ended 31/12/12 6 mths ended 31/12/11
a) guarantees received — —
b) credit derivatives — —
c) management and trading services: (5,942) (4,875)
1. securities trading (2,258) (1,423)
2. foreign currency trading — —
3. asset management: — —
3.1 proprietary — —
3.2 on behalf of customers — —
4. securities under custody/held on a non-discretionary basis (1,374) (1,391)
5. securities placement (2,310) (2,061)
6. door-to-door sales of securities, products and services — —
d) collection and payment services (3,250) (2,452)
e) other services (15,073) (10,698)
Total (24,265) (18,025)
SECTION 3
Heading 70: Dividends and similar income
3.1 Dividends and similar income: compositionLine items/income 6 mths ended 31/12/12 6 mths ended 31/12/11
Dividends Income from UCITS units
Dividends Income from UCITS units
A. Financial assets held for trading 5,360 — 28,363 —
B. AFS securities 2,846 — 7,505 —
C. Financial assets recognized at fair value — — — —
D. Equity investments — X — X
Total 8,206 — 35,868 —

112 Interim Report for the six months ended 31 December 2012
SECTION 4
Heading 80: Net trading income
4.1 Net trading income: compositionTransactions/income elements Gains
(A)Dealing profits
(B)
Value reductions
(C)
Dealing losses
(D)
Net trading income
[(A+B)-(C+D)]
1. Trading assets 214,193 216,936 (125,282) (92,152) 213,695
1.1 Debt securities 165,896 135,971 (74,587) (48,967) 178,313
1.2 Equities 44,923 74,660 (44,869) (42,576) 32,138
1.3 UCITS units 3,024 6,234 (5,742) (609) 2,907
1.4 Loans and advances 350 71 (84) — 337
1.5 Others — — — — —
2. Trading liabities — — — — —
2.1 Debt securities — — — — —
2.2 Debts — — — — —
2.3 Others — — — — —
3. Other assets and liabilities: differences arising on exchange rates X X X X (16,293)
4. Derivative products 4,115,884 2,023,898 (3,863,922) (2,436,786) (130,579)
4.1 Financial derivatives: 2,538,247 1,350,059 (2,276,686) (1,767,649) (125,682)
– debt securities and interest rates¹ 1,098,519 272,157 (1,108,254) (391,739) (129,317)
– equities and stock market indexes 1,178,963 1,071,909 (1,108,203) (1,372,607) (229,938)
– foreign currency and gold X X X X 30,345
– others 260,765 5,993 (60,229) (3,303) 203,228
4.2 Credit derivatives 1,577,637 673,839 (1,587,236) (669,137) (4,897)
Total 4,330,077 2,240,834 (3,989,204) (2,528,938) 66,823
1 Of which €19,170,000 in margins on interest rate derivatives (31/12/11: €8,072,000).

Notes to the accounts | Part C - Notes to consolidated profit and loss account 113
SECTION 5
Heading 90: Net hedging income (expense)
5.1 Net hedging income (expense): compositionIncome elements/amounts 6 mths ended 31/12/12 6 mths ended 31/12/11
A. Income from:
A.1 Fair value hedge derivatives 213,464 997,744
A.2 Financial assets hedged (fair value) 2,742 62,694
A.3 Financial liabilities hedged (fair value) 147,057 70,974
A.4 Cash flow hedge derivatives — 11
A.5 Assets and liabilities in foreign currencies — —
Total hedging income (A) 363,263 1,131,423
B. Expense related to:
B.1 Fair value hedge derivatives (113,219) (79,534)
B.2 Financial assets hedged (fair value) (1,278) (140)
B.3 Financial liabilities hedged (fair value) (244,416) (1,047,282)
B.4 Cash flow hedge derivatives (34) (38)
B.5 Assets and liabilities in foreign currencies — —
Total hedging expense (B) (358,947) (1,126,994)
Net hedging income (A–B) 4,316 4,429

114 Interim Report for the six months ended 31 December 2012
SECTION 6
Heading 100: Gains (losses) on disposals/repurchases
6.1 Gains (losses) on disposals/repurchases: compositionLine items/income elements 6 mths ended 31/12/12 6 mths ended 31/12/11
Gains Losses Net profit (loss)
Gains Losses Net profit (loss)
Financial assets
1. Due from banks — (32) (32) — — —
2. Due from customers 15,777 (9,470) 6,307 24 — 24
3. AFS securities 10,747 (22,124) (11,377) 27,701 (65,720) (38,019)
3.1 Debt securities 7,114 (8,530) (1,416) 13,334 (446) 12,888
3.2 Equities 3,623 (13,594) (9,971) 14,108 (65,012) (50,904)
3.3 UCITS units 10 — 10 259 (262) (3)
3.4 Loans and advances — — — — — —
4. Financial assets held to maturity 478 — 478 201 — 201
Total assets 27,002 (31,626) (4,624) 27,926 (65,720) (37,794)
Financial liabilities
1. Due to banks — — — 3,875 — 3,875
2. Due to customers — — — 124 — 124
3. Debt securities in issue 13,545 (235) 13,310 21,401 (794) 20,607
Total liabilities 13,545 (235) 13,310 25,400 (794) 24,606

Notes to the accounts | Part C - Notes to consolidated profit and loss account 115
SECTION 8
Heading 130: Adjustments for impairment
8.1 Adjustments for impairment: compositionTransactions/income elements
Value adjustments Amounts recovered 6 mths ended
31/12/12
6 mths ended
31/12/11Specific Portfolio Specific Portfolio
writeoffs Others A B A B
A. Due from banks — — — — — — 349 349 (3,333)
- Loans — — — — — — 349 349 (3,333)
- Debt securities — — — — — — — — —
B. Due from customers (27,651) (248,290) (32,612) 2,112 84,716 — 4,065 (217,660) (186,212)
- Loans (27,651) (248,290) (32,612) 2,112 84,716 — 4,065 (217,660) (186,212)
- Debt securities — — — — — — — — —
C. Total (27,651) (248,290) (32,612) 2,112 84,716 — 4,414 (217,311) (189,545)
Legend:
A = interest
B = other amounts recovered
8.2 Net value adjustments for impairment to AFS securities: compositionTransactions/income elements Value adjustments Amounts recovered 6 mths ended
31/12/126 mths ended
31/12/11Specific Specific
writeoffs Others A B
A. Debt securities — — — 12,168 12,168 (114,490)
B. Equities — (6,121) X X (6,121) (59,339)
C. UCITS units — (569) X — (569) (552)
D. Loans and advances to banks — — — — — —
E. Loans and advances to customers — — — — — —
F. Total — (6,690) — 12,168 5,478 (174,381)
Legend:
A = interest
B = other amounts recovered

116 Interim Report for the six months ended 31 December 2012
8.3 Adjustments for impairment to financial assets held to maturity: compositionTransactions/income elements
Value adjustments Amounts recovered 6 mths ended
31/12/12
6 mths ended
31/12/11Specific Portfolio Specific Portfolio
writeoffs Others A B A B
A. Debt securities — (247) — 268 137 — — 158 (1,454)
B. Loans and advances to banks — — — — — — — — —
C. Loans and advances to customers — — — — — — — — —
D. Total — (247) — 268 137 — — 158 (1,454)
Legend:
A = interest
B = other amounts recovered
8.4 Adjustments for impairment to other financial transactions: compositionTransactions/income-linked components
Value adjustments Amounts recovered 6 mths ended
31/12/12
6 mths ended
31/12/11Specific Portfolio Specific Portfolio
writeoffs Others A B A B
A. Guarantees given — (53,656) (1) — — — 35,223 (18,434) (23,440)
B. Credit derivatives — — — — — — — — —
C. Commitments — — (147) — 523 — 2,442 2,818 604
D. Other transactions — — — — — — — — —
E. Total — (53,656) (148) — 523 — 37,665 (15,616) (22,836)
Legend:
A = interest
B = other amounts recovered

Notes to the accounts | Part C - Notes to consolidated profit and loss account 117
SECTION 9
Heading 150: Net premium income
9.1 Net premium income: compositionPremium income from insurance operations Direct business Indirect business 6 mths ended
31/12/126 mths ended
31/12/11
A. Life business
A.1 Gross premiums written (+) — — — —
A.2 Premiums ceded to reinsurers (-) — X — —
A.3 Total — — — —
B. Non-life business
B.1 Gross premiums written (+) — 23,814 23,814 31,463
B.2 Premiums ceded to reinsurers (-) — X — (226)
B.3 Changes in gross amount of reserve for premiums (+/-) — (8,653) (8,653) (21,803)
B.4 Changes in reserve for premiums payable by reinsurers (-/+) — — — —
B.5 Total — 15,161 15,161 9,434
D. Total net premium income — 15,161 15,161 9,434
SECTION 10
Heading 160: Income less expense from insurance operations
10.1 Income less expense from insurance operations: compositionItems 6 mths ended 31/12/12 6 mths ended 31/12/11
1. Net change in technical reserves — —
2. Claims paid out during the year (4,975) (2,147)
3. Other income (expenses) from insurance operations (2,488) (1,482)
Total (7,463) (3,629)

118 Interim Report for the six months ended 31 December 2012
10.3 Breakdown of sub-heading “Changes to technical reserves”Claims expenses 6 mths ended 31/12/12 6 mths ended 31/12/11
Life business: expenses for claims net of amounts ceded to reinsurers
A. Amounts paid — —
A.1 Gross annual amount — —
A.2 (-) Share payable by reinsurers — —
B. Changes to reserve due to sums to be paid — —
B.1 Gross annual amount — —
B.2 (-) Share payable by reinsurers — —
Total claims life business — —
Non-life business: expenses for claims net of amounts recovered and ceded to reinsurers
C. Amounts paid (1,838) (730)
C.1 Gross annual amount (1,838) (730)
C.2 (-) Share payable by reinsurers — —
D. Changes to amounts recovered net of shares payable by reinsurers — —
E. Changes to reserve for claims (3,137) (1,417)
E.1 Gross annual amount (3,137) (1,417)
E.2 Share payable by reinsurers (-) — —
Total claims non-life business (4,975) (2,147)

Notes to the accounts | Part C - Notes to consolidated profit and loss account 119
SECTION 11
Heading 180: Administrative expenses
11.1 Personnel costs: compositionType of expense/sectors 6 mths ended 31/12/12 6 mths ended 31/12/11
1. Employees (184,699) (190,137)
a) wages and salaries (127,346) (137,016)
b) social security contributions (30,172) (31,526)
c) severance indemnities — —
d) pension contributions — —
e) transfers to severance indemnity provisions (7,710) (5,083)
f) transfers to post-employment and similar benefits provisions: — —
– defined benefit — —
– defined contribution — —
g) amounts paid to external complementary pension schemes: (5,347) (6,348)
– defined benefit (5,347) (6,348)
– defined contribution — —
h) expenses incurred in connection with share payment schemes (7,809) (5,029)
– stock options (2,672) (2,849)
– performance shares (5,137) (2,180)
i) other staff benefits (6,315) (5,135)
2. Other staff (3,638) (4,017)
3. Board members (3,876) (4,586)
4. Expenses incurred in connection with staff retiring (2,203) (2,589)
Total (194,416) (201,329)
11.2 Average number of staff by category6 mths ended 31/12/12 6 mths ended 31/12/11
Employees:
a) Senior executives 195 189
b) Excutives 1,183 1,165
c) Other employees 2,086 2,133
Other staff 210 205
Total 3,674 3,692

120 Interim Report for the six months ended 31 December 2012
11.5 Other administrative expenses: composition6 mths ended 31/12/12 6 mths ended 31/12/11
OTHER ADMINISTRATIVE EXPENSES
– legal, tax and professional services (14,185) (17,059)
– loan recovery activity (22,398) (22,102)
– marketing and communications (26,177) (33,514)
– property (17,947) (20,028)
– EDP (17,202) (17,052)
– info-provider (13,364) (12,919)
– bank charges, collection and payment fees (10,698) (10,805)
– operating expenses (24,565) (26,243)
– other staff expenses (9,319) (11,798)
– other costs (4,576) (3,905)
– indirect and other taxes (20,109) (22,367)
Total other administrative expenses (180,540) (197,792)
SECTION 12
Heading 190: Net transfers to provisions
12.1 Net transfers to provisions: composition6 mths ended 31/12/12 6 mths ended 31/12/11
TRANSFERS MADE TO COVER:
– litigation — —
– advertising expenses — —
– certain or probable exposures or commitments1 (1,224) (1,375)
Total net transfers to provisions (1,224) (1,375)
1 Includes effect of discounting provisions.

Notes to the accounts | Part C - Notes to consolidated profit and loss account 121
SECTION 13
Heading 200: Net adjustments to tangible assets
13.1 Net adjustments to tangible assets: compositionAssets/income elements Depreciation
(a)Value adjustments for
impairment (b)Amounts
recovered (c)Net result
(a+b+c)
A. Tangible assets
A.1 Owned (9,718) — — (9,718)
– core (8,286) — — (8,286)
– for investment purposes (1,432) — — (1,432)
A.2 Acquired under finance leases — — — —
– core — — — —
– for investment purposes — — — —
Total (9,718) — — (9,718)
SECTION 14
Heading 210: Net adjustments to intangible assets
14.1 Net adjustments to intangible assets: compositionAssets/income elements Depreciation
(a)Value adjustments for
impairment (b)Amounts
recovered (c)Net result
(a+b+c)
A. Intangible assets
A.1 Owned (11,146) — — (11,146)
– software (6,741) — — (6,741)
– other (4,405) — — (4,405)
A.2 Acquired under finance leases — — — —
Total (11,146) — — (11,146)

122 Interim Report for the six months ended 31 December 2012
SECTION 15
Heading 220: Other operating income (expense)
15.1 Other operating expense: compositionIncome-based components/values 6 mths ended 31/12/12 6 mths ended 31/12/11
a) Leasing activity (11,128) (11,408)
b) Sundry costs and expenses (6,674) (1,194)
Total (17,802) (12,602)
15.2 Other operating income: compositionIncome-based components/values 6 mths ended 31/12/12 6 mths ended 31/12/11
a) Amounts recovered from customers 23,903 23,481
b) Leasing activity 11,236 13,093
c) Other income 41,548 38,527
Total 76,687 75,101

Notes to the accounts | Part C - Notes to consolidated profit and loss account 123
SECTION 16
Heading 240: Gains (losses) on equity investments
16.1 Gains (losses) on equity investments: compositionIncome-based components/values 6 mths ended 31/12/12 6 mths ended 31/12/11
1. Jointly-controlled companies
A. Income — —
1. Revaluations — —
2. Gains on disposals — —
3. Amounts recovered — —
4. Other increases — —
B. Expenses — —
1. Writedowns — —
2. Adjustments for impairment — —
3. Losses from disposals — —
4. Other reductions — —
Net income — —
2. Companies subject to significant influence
A. Income 107,079 76,483
1. Revaluations 107,079 76,483
2. Gains on disposals — —
3. Amounts recovered — —
4. Other increases — —
B. Expenses (116,271) (59,883)
1. Writedowns (21,254) (4,637)
2. Adjustments for impairment (95,017) (55,246)
3. Losses from disposals — —
4. Other reductions — —
Net income (9,192) 16,600
Total (9,192) 16,600

124 Interim Report for the six months ended 31 December 2012
SECTION 19
Heading 270: Net gain (loss) upon disposal of investments
19.1 Net gain (loss) upon disposal of investments: compositionIncome elements/sectors 6 mths ended 31/12/12 6 mths ended 31/12/11
A. Properties — 44,295
– gains on disposals — 44,295
– losses on disposals — —
B. Other assets 2 (545)
– gains on disposals 2 —
– losses on disposals — (545)
Net gain (loss) 2 43,750
SECTION 20
Heading 290: Income tax on ordinary activities
20.1 Income tax on ordinary activities: compositionIncome elements/sectors 6 mths ended 31/12/12 6 mths ended 31/12/11
1. Current taxes (97,953) (62,110)
2. Changes in current taxes for previous financial years (1,338) (723)
3. Reductions in current tax for the period 123 163
3bis. Reductions in current tax for the period due to tax credit of L. 214/2011 (+) (6,269) —
4. Changes in advance tax 15,409 (6,365)
4bis. Changes in advance tax due to tax credit of L. 214/2011 (-) 6,269 —
5. Changes in deferred tax (1,916) (2,325)
6. Income tax for the year (85,675) (71,360)

Notes to the accounts | Part C - Notes to consolidated profit and loss account 125
SECTION 24
Earnings per share
24.1 Average number of ordinary shares on a diluted basis6 mths ended 31/12/12 6 mths ended 31/12/11
Net profit 123,796 63,425
Avg. no. of shares in issue 844,119,212 844,119,212
Avg. no. of potentially diluted shares 47,425,494 43,467,447
Avg. no. of diluted shares 891,544,706 887,586,659
Earnings per share 0.15 0.07
Earnings per share, diluted 0.14 0.07

126 Interim Report for the six months ended 31 December 2012
Part E - Information on risks and related hedging policies
SEctIon 1
Banking Group risks
1.1 crEdIt rISk
QUALItAtIVE InForMAtIon
Basel II project
In compliance with the Basel II New Capital Accord transposed into the Italian regulatory framework under Bank of Italy circular no. 263 issued on 27 December 2006 (“New regulations on capital requirements for banks”), the Mediobanca Group has set itself the objective of measuring credit risk using internal ratings.
A specific project has therefore been launched with a view to obtaining ratification by the Bank of Italy of the internal rating models to be used in calculating the capital requirements for credit risk. The internal rating models regard the following customer segments: Banks, Insurances, Large corporate, and Holding companies (customers mostly targeted by Mediobanca S.p.A.), Mid corporate and Small businesses (customers targeted mostly by the leasing companies) and Private individuals (targeted by Compass for consumer credit and CheBanca! for mortgage lending).
Given the above, the timeframe for submitting the application for the IRB system to be validated to the Bank of Italy is still being reviewed; and until the system has been validated, the Mediobanca Group will continue to use the standardized methodology it has adopted since 1 January 2008.
corporate banking (Mediobanca)
The Group’s internal system for managing, evaluating and controlling credit risk reflects its traditional policy based on a prudent and highly

Notes to the accounts | Part E - Information on risks and related hedging policies 127
selective approach. Lending decisions are based on individual analysis, which builds on adequate and often extensive knowledge of the borrower’s business, assets and management, as well as the macro-economic framework in which it operates. Where possible, covenants are incorporated into the terms and conditions of the loan (having regard inter alia to the maturity and average size of the facilities concerned) in order to provide for protection against impairment. Applications for finance are processed through the different operating levels, and, if successful, are submitted for approval to the relevant bodies, i.e. the Risks Committee and Executive Committee, depending on the amount required and the credit rating of the counterparty involved, including both internal and external ratings. Once the finance has been disbursed the account is monitored on an ongoing basis, via analysis of published financial statements and a series of other controls to ensure that the covenants have not been breached. Any deterioration in the risk profile of a loan is brought swiftly to the attention of the Bank’s operating unit’s management.
Leasing
Individual applications are processed using similar methods to those described above for corporate banking. Applications for leases below a predetermined limit received via banks with which Mediobanca has agreements in place are approved by the banks themselves, against written guarantees from them covering a portion of the risk. At SelmaBipiemme and Teleleasing, applications for assets worth less than €75,000 are approved using a credit scoring system developed on the basis of historical series of data, tailored to both asset type and the counterparty’s legal status (type of applicant company).
Sub-standard accounts are managed in a variety of ways which prioritize either recovery of the amount owed or the asset under lease, according to the specific risk profile of the account concerned. All non-performing, sub-standard and restructured accounts plus impaired, overdue exposures are tested analytically to establish the relative estimated loss against the value of the security provided and/or any other form of real or personal guarantees issued. Other performing accounts are measured individually on the basis of statistics.

128 Interim Report for the six months ended 31 December 2012
consumer credit (compass)
Applications for finance are approved on the basis of a credit scoring system tailored to individual products. The scoring grids have been developed from internal historical series, enhanced by data provided by central credit bureaux. Points of sale are linked electronically to the company’s headquarters, in order to ensure that applications and credit scoring results are processed and transmitted swiftly. Applications for finance above a certain limit are approved by the relevant bodies at headquarters, in accordance with the authorization levels established by the Board of Directors.
From the first instance of non-payment, accounts are managed using the entire range of recovery procedures, including postal and telephone reminders, external recovery agents, etc. After six overdue instalments (or four in particular cases, such as credit cards), accounts are held to be officially in default, and the client is deemed to have lapsed from the time benefit allowed under Article 1186 of the Italian Civil Code. Accounts for which legal action has been certified as impossible are sold to Cofactor or to other factoring companies, usually between the ninth and the twelfth overdue instalment, for a percentage of the value of the principal outstanding, which reflects their estimated realizable value.
Mortgage lending (cheBanca!)
Mortgage applications are processed and approved centrally at head office. Approval depends partly on the outcome of a credit scoring system, which is largely determined through individual appraisal of the applicant’s income and maximum borrowing levels, as well as the value of the property itself. Risks are monitored on a monthly basis, ensuring the company’s loan book is regularly appraised in view of a wide range of indicators, such as amount, sales channel, loan-to-value, etc.
Irregular accounts are managed through monthly reports analysing the commercial, personal and financial aspects of the accounts in order to flag up promptly any potential problem areas using advanced early warning systems linked to public and private databases. Procedurally mortgage loans with four or more unpaid instalments are designated as sub-standard accounts, and generally after the eighth or ninth unpaid instalment become non-performing. Impaired accounts are managed, for out-of-court credit recovery procedures,

Notes to the accounts | Part E - Information on risks and related hedging policies 129
by a dedicated organizational structure with the help of external collectors. If further signs of deterioration are noted, property enforcement procedures are instigated through external lawyers.
QUAntItAtIVE InForMAtIon
credit quality
A.1 Impaired and performing accounts: amounts, adjustments, trends, segmentation by performance and geography
A.1.1 Financial assets by portfolio and credit quality (book value)Portfolio/quality Banking Group others total
non-performing
Potential problem
restructured overdue other assets
overdue other assets
1. Financial assets held for trading — — — — 13,421,627 — — 13,421,627
2. AFS securities — — 10,996 — 10,778,047 — 55,351 10,844,394
3. Financial assets held to maturity — — — — 1,722,548 — — 1,722,548
4. Due from banks — — — — 5,127,486 — 65,615 5,193,101
5. Due from customers 245,688 303,867 246,845 204,864 38,888,598 — 13,950 39,903,812
6. Financial assets recognized at fair value — — — — — — — —
7. Financial assets being sold — — — — — — — —
8. Hedging derivatives — — — — 1,688,407 — — 1,688,407
Total at 31/12/12 245,688 303,867 257,841 204,864 71,626,713 — 134,916 72,773,889
Total at 30/6/12 241,982 271,847 203,108 206,280 70,843,090 — 112,146 71,878,453
1 Includes pro-rata consolidation of Banca Esperia.2 Includes Compass RE (reinsurance company), Creditech, R&S and Sade (other companies).

130 Interim Report for the six months ended 31 December 2012
A.1.2 Financial assets by portfolio/credit quality (gross/net values)Portfolio/quality Impaired assets Performing total
Gross exposure
Specific adjustments
net exposure Gross exposure
Portfolio adjustments
net exposure
A. Banking group
1. Financial assets held for trading — — — X X 13,366,276 13,366,276
2. AFS securities 17,867 (6,871) 10,996 10,833,398 — 10,833,398 10,844,394
3. Financial assets held to maturity — — — 1,733,688 (11,140) 1,722,548 1,722,548
4. Due from banks — — — 5,134,437 (6,950) 5,127,487 5,127,487
5. Due from customers 1,696,462 (695,199) 1,001,263 39,167,772 (279,174) 38,888,598 39,889,862
6. Financial assets
recognized at fair value — — — X X — —
7. Financial assets being sold — — — — — — —
8. Hedging derivatives — — — X X 1,688,407 1,688,407
Total A 1,714,329 (702,070) 1,012,259 56,869,295 (297,264) 71,626,714 72,638,974
B. Others
1. Financial assets held for trading — — — X X 55,351 55,351
2. AFS securities — — — — — — —
3. Financial assets held to maturity — — — — — — —
4. Due from banks — — — 65,615 — 65,615 65,615
5. Due from customers — — — 13,950 — 13,950 13,950
6. Financial assets recognized at fair value — — — X X — —
7. Financial assets being sold — — — — —
8. Hedging derivatives — — — X X — —
Total B — — — 79,565 — 134,916 134,916
Total at 31/12/12 1,714,329 (702,070) 1,012,259 56,948,860 (297,264) 71,761,630 72,773,889
Total at 30/6/12 1,467,954 (544,737) 923,217 56,910,151 (333,559) 70,955,236 71,878,453
¹ The gross exposures include €31.7m towards Iranian counterparties, with unpaid instalments amounting to €7.8m.
² The performing assets include €72.3m in unpaid instalments, corresponding to a gross exposure (including the share not yet overdue) of €761.4m (equal to 2% of the performing assets), €316.3m of which is attributable to leasing (or 9% of the performing assets in this segment), €239.8m to consumer credit (3%), and €137.1m to CheBanca! mortgages (3%). Gross exposures being renegotiated under the terms of collective agreements amount to €68.5m, 85% of which is attributable to consumer credit, and 15% to mortgages granted by CheBanca!.

Notes to the accounts | Part E - Information on risks and related hedging policies 131
Information on sovereign debt exposures
A.1.2.a Exposures to sovereign debt securities by state, counterparty and portfolio*
Asset portfolio/quality Impaired assets¹ Performing assets total (net
exposure) ²Gross exposure
Specific adjustments
collective adjustments
net exposure
Gross exposure
collective adjustments
net exposure
1. Financial assets held for trading — — — — — — 1,908,044 1,908,044
Italy — — — — — — 640,340 640,340
Germany — — — — — — 1,034,093 1,034,093
Spain — — — — — — 147,650 147,650
Turkey — — — — — — 29,966 29,966
Others — — — — — — 55,995 55,995
2. AFS securities 17,004 (6,871) — 10,133 8,051,597 — 8,051,597 8,061,730
Italy — — — — 7,624,637 — 7,624,637 7,624,637
Greece 17,004 (6,871) — 10,133 — — — 10,133
Germany — — — — 303,121 — 303,121 303,121
France — — — — 20,167 — 20,167 20,167
European Union — — — — 103,672 — 103,672 103,672
3. Financial assets held to maturity — — — — 353,647 — 353,647 353,647
Italy — — — — 352,966 — 352,966 352,966
Others — — — — 681 — 681 681
Total at 31/12/12 17,004 (6,871) — 10,133 8,405,244 — 10,313,288 10,323,421
* Does not include financial and credit derivatives.
¹ Impaired assets only include the Greek government securities held in the AFS portfolio as a result of the restructuring agreement.
² Net exposure includes positions in securities (long and short) recognized at fair value (including the outstanding accrual) except for assets held to maturity which are stated at amortized cost, the implied fair value of which is €33.6m.

132 Interim Report for the six months ended 31 December 2012
A.1.2.b Exposures to sovereign debt securities by portfolioAsset portfolio/quality trading book¹ Banking book
nominal value
Book value
duration nominal value
Book value
Fair value duration
Italy 610,720 640,340 4,79 7,896,298 7,982,453 7,999,824 2,31
Germany 984,372 1,034,093 4,53 270,000 303,121 303,121 3,23
France 20,400 20,167 20,167 1,35
Spain 150,000 147,650 0,72
Turkey 26,900 29,966 1,11
Greece 2 — — — 22,094 10,133 10,133 12,69
European Union — — — 102,374 103,672 103,672 0,84
Others 60,263 55,994 — 14,314 681 16,884 —
Total at 31/12/12 1,832,255 1,908,043 8,325,480 8,420,227 8,453,801
¹ Does not include sales of €0.9bn on the Bund/Schatz future (Germany), of €0.3bn on the BTP future (Italy), or of €0.2bn on the Oat future (France), which have values of -€3.7m, -€1.4m and +€0.1m respectively; net hedge purchases of €359.6m have also not been included, with a positive fair value of €5.2m (including one position versus Spain country risk in a notional amount of €150m, with a positive fair value of €343,000).
² Item does not include GDP-linked securities in a notional amount of €127m recorded at a book value of € 863,000.
A.1.3 Banking Group - cash and off-balance-sheet exposures: gross/net valuestype of exposure/amounts Gross exposure Specific value
adjustmentsPortfolio value
adjustmentsnet exposure
A. CASH EXPOSURES
a) Non-performing — — X —
b) Potential problem — — X —
c) Restructured — — X —
d) Overdue — — X —
e) Other assets 7,841,127 X (6,950) 7,834,177
Total A 7,841,127 — (6,950) 7,834,177
B. OFF-BALANCE-SHEET EXPOSURES
a) Impaired — — X —
b) Other assets 1 80,218,117 X — 80,218,117
Total B 80,218,117 — — 80,218,117
Total (A + B) 88,059,244 — (6,950) 88,052,294
1 The balance as at 31/12/12 includes €57,675,805,000 in deals matched 100% by hedge buys.

Notes to the accounts | Part E - Information on risks and related hedging policies 133
A.1.6 Banking Group: cash and off-balance-sheet exposures to customers – gross/net values
type of exposure/amounts Gross exposure Specific value adjustments
Portfolio value adjustments
net exposure
A. CASH EXPOSURES
a) Non-performing 1 561,050 (315,362) X 245,688
b) Potential problem 524,759 (220,892) X 303,867
c) Restructured 357,535 (99,694) X 257,841
d) Overdue 270,986 (66,122) X 204,864
e) Other assets 54,893,102 X (290,390) 54,602,712
Total A 56,607,432 (702,070) (290,390) 55,614,972
B. OFF-BALANCE-SHEET EXPOSURES
a) Impaired 8,020 (431) X 7,589
b) Other assets 19,505,573 X (17,054) 19,488,519
Total B 19,513,593 (431) (17,054) 19,496,108
Total (A+B) 76,121,025 (702,501) (307,444) 75,111,080
1 Includes accounts acquired from third parties as part of Cofactor’s business.
A.1.7 Banking Group: cash exposures to customers – trends in gross impaired positions
description/category non-performing Potential problem restructured overdue
A. Gross exposure at start of period 463,406 445,637 294,658 264,255
of which: accounts sold but not derecognized 20,400 9,306 10,945 11,083
B. Additions 153,007 377,066 116,119 346,922
B.1 transfers from performing loans 8,840 134,661 79,912 332,432
B.2 transfers from other categories of impaired assets 132,399 229,037 20,326 6,249
B.3 other additions 11,768 13,368 15,881 8,241
C. Reductions (55,363) (297,944) (53,242) (340,191)
C.1 transfers to performing loans (6,702) (33,251) (473) (88,286)
C.2 amounts written off (9,901) (67,887) (1) (689)
C.3 amounts collected (22,588) (33,620) (4,395) (19,394)
C.4 gains realized on disposals (224) (2,441) (40,685) (5)
C.5 transfers to other categories of impaired assets (3,299) (151,649) (3,374) (229,688)
C.6 other reductions (12,649) (9,096) (4,314) (2,129)
D. Gross exposure at end of period 561,050 524,759 357,535 270,986
of which: accounts sold but not derecognized 14,951 21,677 5,934 25,260

134 Interim Report for the six months ended 31 December 2012
A.1.8 Banking Group: cash exposures to customers – trends in collective value adjustments
description/category non-performing Potential problem restructured overdue
A. Adjustments at start of period (221,424) (173,790) (91,550) (57,975)
of which: accounts sold but not derecognized (4,208) (1,315) (1,836) (3,740)
B. Additions (135,176) (180,017) (33,054) (64,867)
B.1 value adjustments (84,163) (146,568) (18,459) (63,514)
B.2 transfers from other categories of impaired assets (49,856) (32,130) (14,595) (1,162)
B.3 other additions (1,157) (1,319) — (191)
C. Reductions 41,238 132,915 24,910 56,720
C.1 writebacks based on valuations 11,370 31,681 214 11,535
C.2 writebacks due to amounts collected 7,661 6,120 19,736 1,582
C.3 amounts written off 15,140 28,566 1 4,248
C.4 transfers to other categories of impaired assets 2,321 63,678 — 31,716
C.5 other reductions 4,746 2,870 4,959 7,639
D. Adjustments at end of period (315,362) (220,892) (99,694) (66,122)
of which: accounts sold but not derecognized (9,021) (4,664) — (640)
B. Exposures: distribution and concentration
B.4a Credit risk indicators30/6/12 31/12/12
a) Gross NPLs/total loans 0.95% 1.17%
b) Irregular items/total loans 2.47% 2.94%
c) Net NPLs/regulatory capital 3.10% 3.05%
B.4b Large risks30/6/12 31/12/12
a) Book value 12,579,265 15,074,214
b) Total weighted amount 12,364,283 13,117,540
c) No. of exposures 9 10
d) Large risks/regulatory capital 1.6 1.9

Notes to the accounts | Part E - Information on risks and related hedging policies 135
Leveraged finance transactions
As part of its corporate lending activity, the Mediobanca Group takes an active part in buyout transactions promoted or sponsored almost entirely by private equity funds in order to take over companies with promising growth prospects, low debt levels and stable cash flow over time. Such transactions have a sub-investment grade rating, a non-recourse contractual structure, and borrowing is commensurate with future cash flow levels. The purpose of such transactions is never for Mediobanca to acquire target companies, as the majority stakes are held directly by the private equity funds.
As at 31 December 2012, deals of this nature amounted to €1,573.8m – down sharply from the €2,023.9m recorded at the balance-sheet date – equal to 10% of the corporate loan book, some 24% of which in respect of domestic Italian deals and the remainder of EU area transactions. Movements for the period reflect repayments of €477.1m and additions totalling €27m.
c. Securitizations and asset disposals
C.1 Securitizations
QUALItAtIVE InForMAtIon
The Group has a portfolio of securities originating from securitizations by other issuers worth €295.4m at the reporting date, down sharply from the €330.7m reported at 30 June 2012, following disposals and redemptions amounting to €45m (generating gains of €1.1m), purchases of €5m (collateralized loan obligations with investment-grade rating held as part of the trading book), upward adjustments to reflect fair value totalling €3.4m (€2.5m of which taken through net equity), and €0.2m in adjustments to amortized cost. The implicit loss on this portfolio fell from €42.4m to €34.3m.
These balance-sheet valuations are made based on prices supplied by the leading financial information providers, i.e. Reuters, Bloomberg and Mark-it, giving priority to marked-to-market data rather than fair value models (which have been used only for certain unlisted positions), and for the most part made using a pricing model supplied by the main rating agencies.

136 Interim Report for the six months ended 31 December 2012
The portfolio is still concentrated on securities with domestic underlying assets (mortgage receivables, state-owned properties and leasing receivables). The other deals involve CLOs, two synthetic securities (Entasi and ELM) and European mortgage loans (UK and German). The junior and mezzanine tranches remain under 10% of the portfolio. Some 85% of the portfolio has a rating consistent with securities of high credit standing attributed by at least one of the main credit rating agencies (Standard & Poor’s, Moody’s and Fitch) and more than half of the portfolio is eligible for refinancing with the European Central Bank. The only positions which are unrated involve deals where Mediobanca has played an active role in the securitization process, e.g. as sponsor, manager, etc.
Mediobanca does not have on its books, and indeed never has had, any credit exposures backed by US subprime or Alt-A mortgages (Alternative – A, i.e. positions with underlying mortgages featuring incomplete documentation that does not allow them to be classified). Neither does it have any exposures to monoline insurers, i.e. insurance companies specializing in covering default risk on public and corporate bond issues, with the exception of one credit default swap worth a nominal USD 10m entered into with MBIA (Municipal Bond Insurance Association), with a negative fair value of €0.3m (30/6/12: €0.6m).
Turning now to analysis of the trends in the main sectors of activity underlying the securities held by the Group, there has been a generalized improvement in market conditions, in line with the higher returns on peripheral EU member states’ sovereign debt and bank bonds, along with expectations of a broadening in the collateral that can be eligible for refinancing by the European Central Bank. The abundant liquidity available on the market has allowed new deals to take place, due to the good yields on offer. As for the individual segments:
– Italian mortgage loans: there was a widespread improvement in prices in this segment during the six months under review, helped by the interest in the type of collateral, which is similar to that for covered bonds and regardless of the specific features of the originator, with preference being given to mezzanine tranches by virtue of the higher yields which they offer. In general repayments have been respected, and delinquency and default continue to be as normal;
– Italian state-owned and commercial properties: this sector has shown declining spreads, despite uneven performances due to the still faltering property market, on healthy demand from investors looking for high yields.
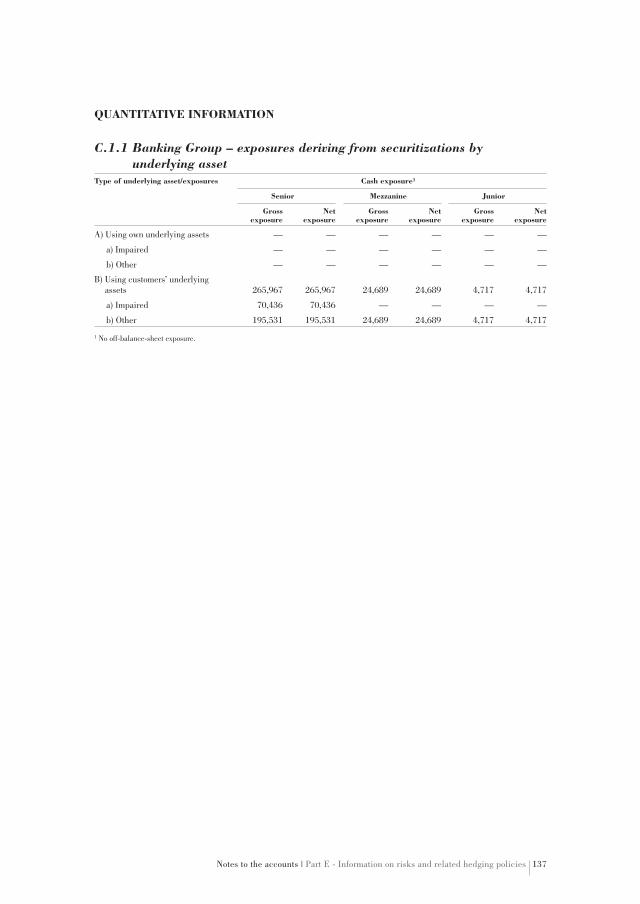
Notes to the accounts | Part E - Information on risks and related hedging policies 137
QUAntItAtIVE InForMAtIon
C.1.1 Banking Group – exposures deriving from securitizations by underlying asset
type of underlying asset/exposures cash exposure¹
Senior Mezzanine Junior
Gross exposure
net exposure
Gross exposure
net exposure
Gross exposure
net exposure
A) Using own underlying assets — — — — — —
a) Impaired — — — — — —
b) Other — — — — — —
B) Using customers’ underlying assets 265,967 265,967 24,689 24,689 4,717 4,717
a) Impaired 70,436 70,436 — — — —
b) Other 195,531 195,531 24,689 24,689 4,717 4,717
1 No off-balance-sheet exposure.

138 Interim Report for the six months ended 31 December 2012
C.1.3 Banking Group – exposures deriving from main customer securitizations by asset type/exposure
type of securitized asset/exposure cash exposures1
Senior Mezzanine Junior
Book valueWritedowns writebacks Book value
Writedowns writebacks Book value
Writedowns writebacks
A. Mortgage loans on Italian properties
A.1 Mantegna-37 A2 ind IT0003443527 120 3 — — — —
A.2 CASAFORTE srl 30/06 IT0004644677 — — — — 2,403 —
A.3 Velah 4 A2 IT0004102007 26,758 — — — — —
A.4 Cordusio 3 A2 06-42 TV IT0004144892 88 4 — — — —
A.5 BPM Securitisation Srl 06-43 IT0004083033 — — 3,278 451 — —
A.6 Zeus F07-25 A FRN IT0004306186 20,247 — — — — —
A.7 BP MORTG-43 A2 ind IT0004215320 6,296 192 — — — —
A.8 Island Ref-25 A FRN IT0004293558 8,801 — — — — —
A.9 E-MAC XS0475282322 6,272 295 — — — —
A.10 RMAC PLC 12/12/2043 XS0235778106 — — 3,234 (65) — —
A.11 IMSER21(ST18)) 5.830 IT0003382972 — — 18,177 — — —
A.12 IMSER-2A2B MTG IT0004082746 1,993 58 — — — —
A.13 BCC Mrtg-38 A FRN XS0256813048 3,912 217 — — — —
A.14 BCCM1B 0 Mar38 XS0256815688 — — — — 1,298 197
A.15 LOGGI 2001-1 SUB FR0000488470 — — — — 1,016 30
TOTAL A MORTGAGE LOANS ON PROPERTIES 74,487 769 24,689 386 4,717 227
B. State-owned properties B.1 Fip Fund-23 A2 FRN IT0003872774 95,890 — — — — —
TOTAL B STATE-OWNED PROPERTIES 95,890 — — — — —
C. Leasing receivables
C.1 Locat 12/12/2028 A2 IT0004153679 278 6 — — — —
C.2 Quarzo-13 CL1 FRN IT0003487011 15,004 3 — — — —
TOTAL C LEASING RECEIVABLES 15,282 9 — — — —
D. Other receivables D.1 ELM BB.V. FL XS0247902587 22,428 — — — — —
D.2 ENTASI 16/08/2016 IT0003142996 53,213 2,003 — — — —
D.3 ROMULUS 20/02/2013 XS0161620439 1,020 — — — — —
TOTAL D OTHER RECEIVABLES 76,661 2,003 — — — —
E. Collateralized Loan Obligation E.1 ASTREA SRL 17/01/2013 IT0003331292 10 — — — — —
E.2 MAYFAIR MTG 05/13 XS0131362898 1,699 — — — — —
E.3 BASE2008-1XB MTG XS0353810079 1,939 (2) — — — —
TOTAL E COLLATERALIZED LOAN OBLIGATIONS 3,648 (2)
Total as at 31/12/12 265,967 2,779 24,689 386 4,717 227
Total as at 30/6/12 297,297 (3,056) 24,778 (1,550) 4,596 (505)
1 No off-balance-sheet exposure.

Notes to the accounts | Part E - Information on risks and related hedging policies 139
C.1.4 Banking Group – exposures to securitizations by asset/portfolio typeExposure/portfolio
Held for trading
recognized at fair value
Available for sale
Held to maturity
Loans and advances
31/12/12 30/6/12
1. Cash exposures 36,252 — 24,412 41,624 193,085 295,373 326,671
- Senior 27,426 — 22,009 23,447 193,085 265,967 297,297
- Mezzanine 6,512 — — 18,177 — 24,689 24,778
- Junior 2,314 — 2,403 — — 4,717 4,596
2. Off-balance-sheet exposures — — — — — — —
- Senior — — — — — — —
- Mezzanine — — — — — — —
- Junior — — — — — — —
C.1.7 Banking Group: servicing – collecting securitized receivables and redeeming securities issued by vehicle companies
Servicer Vehicle company
Securitized assets 31/12/12
receivables collected during the year
Percentage share of securities repaid 31/12/12
Impaired Performing Impaired Performing Senior Mezzanine Junior
Impaired Performing Impaired Performing Impaired Performing
SelmaBipiemme S.p.A.
Quarzo Lease S.r.l. 26,716 649,802 2,866 105,408 — — — — — —
SelmaBipiemme S.p.A.
Quarzo Lease S.r.l. 21,686 298,296 2,349 57,335 — 31.0% — — — —
Compass S.p.A. Jump S.r.l. 5,094 153,559 598 44,730 — 41.0% — — — —
Compass S.p.A.Quarzo S.r.l. 57,239 2,161,230 2,668 503,729 — — — — — —
C.3 Banking Group – covered bond issues
On 1 December 2012, under the terms of a €1.5bn covered issue (part of a ten-year programme of up to €5bn) executed in December 2011 with a four-year duration, CheBanca! sold a further €177.9m in residential mortgage receivables to the SPV on a non-recourse basis; taking repayments (including early repayments) into accounts, the residential mortgage portfolio underlying the issuance now stands at €1.7bn.

140 Interim Report for the six months ended 31 December 2012
1.2 BAnkInG GroUP MArkEt rISk
1.2.1 IntErESt rAtE And PrIcE rISk – trAdInG Book
QUALItAtIVE InForMAtIon
Mediobanca monitors interest rate risk on its trading book on a daily basis, by calculating two main indicators:
– sensitivity to 1 basis-point changes in the interest rate curve;
– the share of the value-at-risk1 linked to interest rates as part of the global measurement of market risks.
Such analysis regards not just the trading book but the Bank’s entire asset structure, including the banking book but net of the equity investments. Analysis of VaR takes into consideration risks deriving from changes in market interest rates and credit spreads. In order to regulate the various business units’ operations, limits have been introduced on sensitivities (known as the “Greeks”) to movements of different factors (1 basis point for interest rates and credit spreads, 1 percentage points for shares, exchange rates and volatility).
VaR is still calculated based on expected volatility and the correlation between risk factors concerned, assuming a disposal period of a single trading day and based on a 99% confidence level. The indicator used to check the limits is calculated by using Monte Carlo simulations, along with historical simulations for indicative purposes.2 This measurement is also used to calculate the expected shortfall, which measures average loss in 1% of the most unfavourable scenarios.
In addition to these indicators, stress tests are also carried out weekly on the main risk factors, to show the impact which significant movements in the main market data (such as share prices and interest or exchange rates).
After the high volatility that marked last year, the six months under review showed less instability, with shares and peripheral Eurozone member state bond prices both recovering: the spread between the ten-year Italian BTP decennale
1 VaR: maximum potential loss over to specified time horizon and to given confidence level.2 Determines portfolio values based on random and historical variations in risk factors respectively.

Notes to the accounts | Part E - Information on risks and related hedging policies 141
and its Bund equivalent fell below 300 basis points in December, reaching a low of 250 bps at the start of January.
The overall VaR reading, including also the available-for-sale portfolio, benefited significantly from these developments, bearing in mind the Bank’s substantial exposure to Italian government securities. Indeed, the reading went from a high of €124.9m at the start of August (when the ten-year spread was above 500 basis points) to a low of €30m at the start of December, while the average reading was affected by the high starting levels, and showed a less marked reduction accordingly, down from €77.7m to €66.7m.
This downward movement was apparent above all in the interest rate component, which went from a high of €111.3m to a low of €24m (recorded at the start of December) due to the reduction in the general risk associated with government securities (which declined from €85m to €20m) as well as the specific risk as a result of the recovery in corporate and financial bond prices. Equity risk also improved significantly, from €18.2m to €7.7m, as did volatility (from €5.4m to €2.5m) and exchange rate risk (from €9.1m to €0.6m); the latter due also to the dollar exposure being rehedged.
Table 1: Value at risk and expected shortfall of asset structurerisk factors(€’000)
6 mths to 31/12/12 2011-2012Avg.
31/12 Min Max Avg.
Interest rates 25,875 24,000 111,286 57,637 60,038
- of which: specific risk 9,350 9,350 29,817 19,644 33,879
Share prices 7,681 7,681 18,218 11,564 21,293
Exchange rates 847 646 9,082 3,335 3,816
Inflation 748 625 1,923 1,083 942
Volatility 2,470 2,466 5,431 3,637 4,334
Diversification effect* (4,810) (3,311) (24,303) (10,556) (12,697)
TOTAL 40,871 30,402 124,947 66,701 77,739
Expected shortfall 110,196 101,958 128,147 115,445 108,962
* Due to mismatches between risk factors.

142 Interim Report for the six months ended 31 December 2012
Conversely, the expected shortfall3 remained at high levels (on average over €115m), as this indicator is more geared towards historical simulation (in particular the conditions of stress recorded in 2011), with less of a correlation to more recent market conditions.
Despite showing a comparable reduction, VaR for the trading book reflects differing trends for the individual risk factors. Not only is the reduction in the average figure more pronounced, at more than 30% (from €17.4m to €11.4m), but the low was recorded as early as end-October, due to the strong reduction in the contributions from exchange rate risk (down from €10m to €4.5m) and interest rate risk (down from €12m to €4m). For these two components the reduction is more closely correlated to the positions in corporate and financial bonds (specific risk) rather than those in government securities (general risk), the importance of which in the trading book is marginal. While the contribution largely stabilized in later months, the reduction in the VaR deriving from exchange rates continued, alongside a gradual reduction in the reading for volatility. The equity component’s performance, by contrast, was more erratic, as the share portfolio reflected a higher degree of movement: the addition of new positions caused the VaR to peak early in September, while their gradual disposal brought about the subsequent decline.
Table 2: Value at risk and expected shortfall: trading bookrisk factors(€’000)
6 mths to 31/12/12 12 mths to 30/6/12
Avg.31/12 Min Max Avg.
Interest rates 5,287 3,396 20,681 8,529 14,780
- of which: specific risk 2,244 1,298 8,574 5,248 13,184
Share prices 3,775 2,533 21,408 4,545 4,561
Exchange rates 1,487 659 11,315 4,931 4,240
Inflation 901 739 2,335 1,290 1,209
Volatility 2,470 2,466 5,431 3,641 4,289
Diversification effect* (5,973) (5,127) (20,401) (11,566) (11,664)
TOTAL 7,947 5,559 32,806 11,369 17,415
Expected shortfall 20,204 13,061 33,502 20,266 25,499
* Due to mismatches between risk factors.
The expected shortfall on the trading book reduced far more sharply than the AFS positions as a whole did, down 20% based on average figures, the lowest recorded in the last three years, confirming the reduced weight of positions in Italian government securities.
3 Average of losses recorded in 1% of the most unfavourable scenarios.

Notes to the accounts | Part E - Information on risks and related hedging policies 143
Trends in VaR
Trends in VaR constituents

144 Interim Report for the six months ended 31 December 2012
The trading portfolios of the other Group companies continue to be negligible. The most significant contributor after Mediobanca S.p.A. is Compagnie Monégasque de Banque, whose average VaR reading for the period, again based on a 99% confidence level, was €337,000, higher than the €209,000 recorded last year but still extremely low.
The effectiveness of VaR as a risk management instrument is confirmed by the results of back-testing, which is based on the calculation of implied profits and losses.4 The VaR limit for losses was breached on only one occasion during the six months with reference to the aggregate portfolio (including the available-for-sale positions), compared with three times last year, and in line with the theoretical level of 1% of the data recorded. This event occurred following one of the worst days’ trading on Italian markets (when the stock market shed more than 4%), confirming the substantial weight of equities contained in the AFS portfolio. Even if we limit our analysis to the trading book only just the one breach was recorded, in this case on a trading day marked by strong interest rate volatility.
As for the sensitivity of net interest income, the trading book (represented exclusively by Mediobanca S.p.A.) showed a gain of €21.2m at the reporting date based on a 100 bps increase in interest rates, while the loss in the opposite scenario would be a minor loss of some €6m.
data at 31/12/12 (€m) trading Book
Net interest income sensitivity + 100 bps 21.2
- 100 bps (5.9)
Discounted value of future cash flows sensitivity + 100 bps (166.9)
- 100 bps 117.2
4 Based on repricing the previous days’ positions using data from the following business day, in order to eliminate intraday trading items.

Notes to the accounts | Part E - Information on risks and related hedging policies 145
1.2.2 IntErESt rAtE And PrIcE rISk – BAnkInG Book
QUALItAtIVE InForMAtIon
The Mediobanca Group monitors and manages interest rate risk by analysing the sensitivity of net interest income and cash flow to interest rate changes. The first type of sensitivity analysis quantifies the impact of a parallel, instantaneous 100 basis point change in the interest rate curve on current earnings (until the end of the period). The second type of sensitivity is calculated by comparing the discounted value of estimated cash flows obtained with the return curve at the current date and the value obtained using a return curve increased or reduced by 100 basis points (“parallel shock”).
In the event of such an increase in interest rates, there would be an approx. €8m reduction in net interest income on the positions held in the banking book of Mediobanca S.p.A. as at 31 December 2012, due to a higher exposure to floating-rate funding compared to the comparable amount on the asset side. However, the less pronounced exposure to fixed-rate assets for Compass (some €1m lower) and CheBanca! (€3.5m lower) allowed the Group to report a sensitivity to net interest income in line with the previous reading. By contrast, in the event of a reduction in interest rates the loss that would be incurred by Mediobanca, of €6.5m, would partly be offset by the profits that would be earned by Compass (€3.8m) and CheBanca! (€0.2m).
A positive, 100 basis-point shock on the discounted value of future cash flows from Mediobanca’s banking book would generate a €40.2m reduction, reflecting the duration of its funding which continues to exceed that of its loan and bond books. The same trend is also seen for Compass and CheBanca!, with reductions of €89.5m and €133m respectively. A reduction in interest rates, conversely, would generate increases in all three companies, of €20.8m, €89.4m and €82.2m accordingly. At Group level both scenarios, duly contemplated in the operating regulations, remained within the set limits at 7.5% (net interest income sensitivity (including trading book)/regulatory capital) and 15% (economic value sensitivity/regulatory capital).

146 Interim Report for the six months ended 31 December 2012
The data described above are summarized in the following table:
data at 31/12/12 (€m) Banking Book
Mediobanca SpA cheBanca! compass
Net interest income sensitivity + 100 bps (7.9) (3.5) (0.8)
- 100 bps (6.4) 0.2 3.9
Discounted value of future cash flows sensitivity + 100 bps (40.2) (133.0) (89.6)
- 100 bps 20.8 82.2 89.4
Hedging
Hedges transactions are used to cover risk by neutralizing potential losses on a given asset or liability due to volatility in a specific financial risk factor, such as interest rates, exchange rates, credit or other risk factors, via gains that may be obtained on a hedging instrument offsetting the changes in either the fair value or cash flows deriving from them. For fair value hedges in particular, the Group’s objective is to minimize the financial risk on interest rates, bringing the interest-bearing exposure in line with the Euribor rate (generally 3 months).1
B. Fair value hedges
Fair value hedges are used to neutralize exposure to interest rate, price or credit risk for particular asset or liability positions, via derivative contracts entered into with leading counterparties of high credit standing. For interest rate risk in particular, fixed-rate, zero coupon and structured bond issues are fair value-hedged. Structured bonds, if they do not presents risks related to the principal risk, are split between the interest rate component (which is hedged) and the other risks, which are represented in the trading book and normally covered by opposing external positions.
Fair value hedges are also used in corporate finance for certain bilateral, fixed-rate transactions and to mitigate price risk on equity investments held as available for sale.
1 This target is maintained even where there are hedging contracts executed with market counterparties featuring netting and collateralization agreements (collateralized standard agreements, or CSAs), the valuations for which are made on the basis of Eonia rather than Euribor rates.
Notes to the accounts | Part E - Information on risks and related hedging policies 147
c. cash flow hedges
These are used chiefly as part of the operations of some Group companies (those operating in consumer credit and leasing in particular). The numerous, generally fixed-rate and relatively small-sized transactions are hedged by floating-rate deposits for large amounts. The hedge is made in order to transform floating-rate deposits into fixed rate positions by correlating the relevant cash flows to those of the loans. Normally the Group uses the derivative to fix the estimated cost of funding during the period covered by the outstanding fixed-rate loans and the future transactions linked to systematic renewals of such them once they have reached their maturity. Cash flow hedges are also implemented by Mediobanca itself to cover the equity risk faced in connection with AFS shares, via forward contracts.
counterparty risk
This is measured in terms of expected potential market value, thus doing away with the need to set arbitrary weightings for each type of fund employed. As far as regards derivatives and loan collateralization products (repos and securities lending), the calculation is based on determining the maximum potential exposure (assuming a 95% confidence level) at various points on a time horizon that reaches up to 30 years. The scope of application regards all groups of counterparties which have relations with Mediobanca, taking into account the existence or otherwise of netting agreements (e.g. ISDA, GMSLA or GMRA) and collateralization (e.g. CSA), plus exposures deriving from interbank market transactions. For each type of operations there are different ceilings split by counterparty and/or group.
148 Interim Report for the six months ended 31 December 2012
1.2.3 EXcHAnGE rAtE rISk
QUALItAtIVE InForMAtIon
A. General aspects, operating processes and measurement techniques
B. Hedging activity
Risks deriving from movements in exchange rates for all the Bank’s positions (trading and banking books), are managed by the Financial Markets division. The degree of risk in this area is thus effectively represented by the respective VaR component as shown on p.140. At the start of the financial year there were holdings in directional positions used to macro-hedge the other positions (securities and loans) held in the portfolio, which drove the VaR reading on exchange rates above €9m. Subsequently, the gradual by constant reduction of such positions decreased the overall risk to a minimum of around €650,000, at an average value of €3.3m for the six months, compared with €3.8m last financial year.

Notes to the accounts | Part E - Information on risks and related hedging policies 149
QUAntItAtIVE InForMAtIon
1.2.4 dErIVAtIVE FInAncIAL ProdUctS
A. Financial derivatives
A.1 Regulatory trading book: average and reporting-date notional valuestype of transaction 31/12/12 30/6/12
over the countercentral
counterparties over the countercentral
counterparties
1. Debt securities and interest rates 107,519,211 3,785,478 109,668,791 13,473,584
a) Options 104,000 182,500 — 4,225,500
b) Swaps 96,794,866 — 99,892,289 —
c) Forwards — — — —
d) Futures — 3,602,978 — 9,248,084
e) Others 10,620,345 — 9,776,502 —
2. Equities and share indexes 37,230,335 27,538,146 43,946,742 31,844,057
a) Options 35,375,532 27,256,994 40,775,779 31,649,118
b) Swaps 1,854,803 — 3,170,842 —
c) Forwards — — 121 —
d) Futures — 281,152 — 194,939
e) Others — — — —
3. Exchange rates and gold 10,147,052 — 9,522,300 132
a) Options 458,106 — 59,161 —
b) Swaps 1,313,846 — 1,498,372 —
c) Forwards 8,375,100 — 7,964,767 —
d) Futures — — — 132
e) Others — — — —
4. Commodities — — — 1,264
5. Other assets — — — —
Total 154,896,598 31,323,624 163,137,833 45,319,037
Average values 159,006,905 38,321,331 163,236,379 53,094,119

150 Interim Report for the six months ended 31 December 2012
A.2. Banking book: average and reporting-date notional values
A.2.1 Hedge derivativestype of transaction 31/12/12 30/6/12
over the countercentral
counterparties over the countercentral
counterparties
1. Debt securities and interest rates 29,346,295 — 30,998,853 —
a) Options — — — —
b) Swaps 28,970,775 — 30,807,897 —
c) Forwards 195,520 — 10,956 —
d) Futures — — — —
e) Others 180,000 — 180,000 —
2. Equities and share indexes 2,598 — 2,560 —
a) Options 162 — 183 —
b) Swaps — — — —
c) Forwards 2,436 — 2,377 —
d) Futures — — — —
e) Others — — — —
3. Exchange rates and gold 35,691 — 33,539 —
a) Options — — — —
b) Swaps 35,691 — 33,539 —
c) Forwards — — — —
d) Futures — — — —
e) Others — — — —
4. Commodities — — — —
5. Other assets — — — —
Total 29,384,584 — 31,034,952 —
Average values 30,406,681 — 32,744,916 —

Notes to the accounts | Part E - Information on risks and related hedging policies 151
A.2.2 Other derivativestype of transaction 31/12/12 30/6/12
over the countercentral
counterparties over the countercentral
counterparties
1. Debt securities and interest rates 307,251 — 12,251 —
a) Options — — — —
b) Swaps 307,251 — 12,251 —
c) Forwards — — — —
d) Futures — — — —
e) Others — — — —
2. Equities and share indexes 7,885,228 — 8,240,895 —
a) Options 7,885,228 — 8,240,895 —
b) Swaps — — — —
c) Forwards — — — —
d) Futures — — — —
e) Others — — — —
3. Exchange rates and gold — — 10,613 —
a) Options — — 10,613 —
b) Swaps — — — —
c) Forwards — — — —
d) Futures — — — —
e) Others — — — —
4. Commodities — — — —
5. Other assets — — — —
Total 8,192,479 — 8,263,759 —
Average values 8,192,256 — 8,783,947 —

152 Interim Report for the six months ended 31 December 2012
A.3 Financial derivatives: gross positive fair value, by producttype of transactions Positive fair value
31/12/12 30/6/12
over the countercentral
counterparties over the countercentral
counterparties
A. Regulatory trading book 4,867,604 876,350 4,412,338 1,096,518
a) Options 1,446,826 865,793 1,302,514 1,082,876
b) Interest rate swaps 3,249,532 — 2,939,169 —
c) Cross currency swaps 54,381 — 52,725 —
d) Equity swaps 25,319 — 41,738 —
e) Forwards 91,546 — 76,192 —
f) Futures — 10,557 — 13,642
g) Others — — — —
B. Banking book: hedge derivatives 1,847,974 — 1,735,298 —
a) Options — — — —
b) Interest rate swaps 1,699,886 — 1,586,718 —
c) Cross currency swaps 1,225 — 1,619 —
d) Equity swaps — — — —
e) Forwards 96 — — —
f) Futures — — — —
g) Others 146,767 — 146,961 —
C. Banking book: other derivatives 144,032 — 131,863 —
a) Options 124,091 — 127,912 —
b) Interest rate swaps 19,941 — 3,951 —
c) Cross currency swaps — — — —
d) Equity swaps — — — —
e) Forwards — — — —
f) Futures — — — —
g) Others — — — —
Total 6,859,610 876,350 6,279,499 1,096,518

Notes to the accounts | Part E - Information on risks and related hedging policies 153
A.4 Financial derivatives: gross negative fair value, by producttype of transaction negative fair value
31/12/12 30/6/12
over the countercentral
counterparties over the countercentral
counterparties
A. Regulatory trading book (5,127,295) (974,623) (5,136,695) (1,044,228)
a) Options (1,222,470) (957,135) (1,408,537) (1,025,783)
b) Interest rate swaps (3,649,951) — (3,273,728) —
c) Cross currency swaps (63,582) — (108,589) —
d) Equity swaps (101,557) — (264,259) —
e) Forwards (89,735) — (81,582) —
f) Futures — (17,488) — (18,445)
g) Others — — — —
B. Banking book: hedge derivatives (488,139) — (507,544) —
a) Options (146,850) — (147,056) —
b) Interest rate swaps (338,478) — (357,861) —
c) Cross currency swaps (2,587) — (2,526) —
d) Equity swaps — — — —
e) Forwards (224) — (101) —
f) Futures — — — —
g) Others — — — —
C. Banking book: other derivatives (165,768) — (119,069) —
a) Options (165,768) — (119,069) —
b) Interest rate swaps — — — —
c) Cross currency swaps — — — —
d) Equity swaps — — — —
e) Forwards — — — —
f) Futures — — — —
g) Others — — — —
Total (5,781,202) (974,623) (5,763,308) (1,044,228)

154 Interim Report for the six months ended 31 December 2012
A.5 OTC financial derivatives: regulatory trading book – notional values, gross positive and negative fair values by counterparty, contracts not forming part of netting arrangements
contracts not forming part of netting arrangements
Governments and central
banks
other public agencies
Banks Financial companies
Insurances non-financial companies
other counterparties
1. Debt securities and interest rates
- notional value — — 701,402 3,984,648 44,475 6,237,570 —
- positive fair value — — 33,439 92,244 14 289,945 —
- negative fair value — — (9,885) (21,726) (6,163) (97,958) —
- future exposure — — 7,445 9,834 321 42,556 —
2. Equities and share indexes
- notional value — — 37,619 470,860 24,583 432,056 —
- positive fair value — — 1,205 47,111 — 14,778 —
- negative fair value — — — (58,843) — (9,765) —
- future exposure — — 1,978 28,948 2,458 25,934 —
3. Exchange rates and gold
- notional value — — 7,171 169,915 — 291,209 39
- positive fair value — — 60 491 — 21,638 —
- negative fair value — — (67) (45) — (12,243) —
- future exposure — — 72 6,658 — 14,836 1
4. Other assets
- notional value — — — — — — —
- positive fair value — — — — — — —
- negative fair value — — — — — — —
- future exposure — — — — — — —

Notes to the accounts | Part E - Information on risks and related hedging policies 155
A.6 OTC financial derivatives: regulatory trading book – notional values, gross positive and negative fair values by counterparty, contracts forming part of netting arrangements
contracts forming part of netting arrangements
Governments and central
banks
other public agencies
Banks Financial companies
Insurances non-financial companies
other counterparties
1. Debt securities and interest rates
- notional value — — 77,230,947 17,044,091 1,856,078 420,000 —
- positive fair value — — 2,421,889 400,546 208,140 83,205 —
- negative fair value — — (3,148,599) (432,408) (30,206) (2,614) —
2. Equities and share indexes
- notional value — — 11,312,225 24,716,451 236,417 125 —
- positive fair value — — 287,353 837,729 3,823 — —
- negative fair value — — (251,220) (893,622) (10,713) — —
3. Exchange rates and gold
- notional value — — 9,152,766 374,369 — 151,584 —
- positive fair value — — 96,394 27,599 — — —
- negative fair value — — (114,601) (2,394) — (24,220) —
4. Other assets
- notional value — — — — — — —
- positive fair value — — — — — — —
- negative fair value — — — — — — —
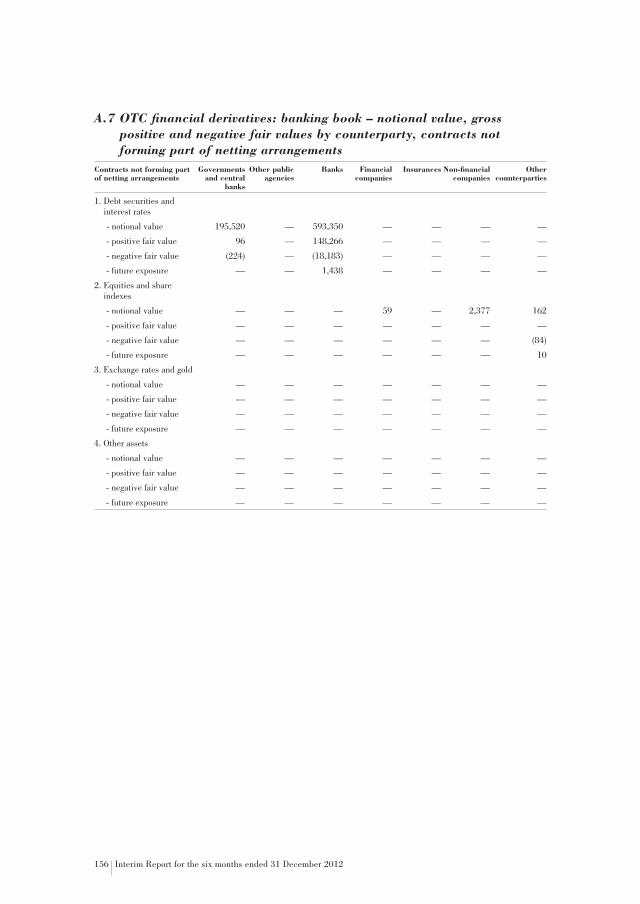
156 Interim Report for the six months ended 31 December 2012
A.7 OTC financial derivatives: banking book – notional value, gross positive and negative fair values by counterparty, contracts not forming part of netting arrangements
contracts not forming part of netting arrangements
Governments and central
banks
other public agencies
Banks Financial companies
Insurances non-financial companies
other counterparties
1. Debt securities and interest rates
- notional value 195,520 — 593,350 — — — —
- positive fair value 96 — 148,266 — — — —
- negative fair value (224) — (18,183) — — — —
- future exposure — — 1,438 — — — —
2. Equities and share indexes
- notional value — — — 59 — 2,377 162
- positive fair value — — — — — — —
- negative fair value — — — — — — (84)
- future exposure — — — — — — 10
3. Exchange rates and gold
- notional value — — — — — — —
- positive fair value — — — — — — —
- negative fair value — — — — — — —
- future exposure — — — — — — —
4. Other assets
- notional value — — — — — — —
- positive fair value — — — — — — —
- negative fair value — — — — — — —
- future exposure — — — — — — —

Notes to the accounts | Part E - Information on risks and related hedging policies 157
A.8 OTC financial derivatives: banking book – notional value, gross positive and negative fair values by counterparty, contracts forming part of netting arrangements
contracts forming part of netting arrangements
Governments and central
banks
other public agencies
Banks Financial companies
Insurances non-financial companies
other counterparties
1. Debt securities and interest rates
- notional value — — 27,038,762 1,518,663 — — —
- positive fair value — — 1,645,079 53,308 — — —
- negative fair value — — (447,282) (19,780) — — —
2. Equities and share indexes
- notional value — — — — — — —
- positive fair value — — — — — — —
- negative fair value — — — — — — —
3. Exchange rates and gold
- notional value — — 35,691 — — — —
- positive fair value — — 1,225 — — — —
- negative fair value — — (2,587) — — — —
4. Other assets
- notional value — — — — — — —
- positive fair value — — — — — — —
- negative fair value — — — — — — —
158 Interim Report for the six months ended 31 December 2012
B. credit derivatives
B.1 Credit derivatives: average and reporting-date notional valuestransaction categories regulatory trading book other transactions
Individual assets Baskets Individual assets Baskets
1. Hedge buys
a) Credit default 1,758,171 60,442,767 386,767 68,040
b) Credit spread products — — — —
c) Total rate of return swaps — — — —
d) Others — — — —
Total A at 31/12/12 1,758,171 60,442,767 386,767 68,040
Average values 1,620,891 69,741,609 376,735 49,681
Total A at 30/6/12 1,439,830 79,058,450 446,498 40,525
2. Hedge sales
a) Credit default 1,348,992 59,963,011 43,425 1,079,150
b) Credit spread products — — — —
c) Total rate of return swaps — — — —
d) Others — — — —
Total B at 31/12/12 1,348,992 59,963,011 43,425 1,079,150
Average values 1,412,426 70,292,587 60,463 1,146,650
Total B at 30/6/12 1,485,945 79,485,412 110,114 1,835,000
B.2 OTC credit derivatives: gross positive fair value, by productPortfolio/derivative instrument type Positive fair value
31/12/12 30/6/12
A. Regulatory trading book 1,212,348 1,717,268
a) Credit default products 1,212,348 1,717,268
b) Credit spread products — —
c) Total rate of returns swaps — —
d) Others — —
B. Banking book 64,971 70,901
a) Credit default products 64,971 70,901
b) Credit spread products — —
c) Total rate of returns swaps — —
d) Others — —
Total 1,277,319 1,788,169

Notes to the accounts | Part E - Information on risks and related hedging policies 159
B.3 OTC credit derivatives: gross negative fair value, by productPortfolios/derivative instruments type negative fair value
31/12/12 30/6/12
A. Regulatory trading book (1,215,934) (1,723,332)
a) Credit default products (1,215,934) (1,723,332)
b) Credit spread products — —
c) Total rate of returns swaps — —
d) Others — —
B. Banking book (1,183) (34,915)
a) Credit default products (1,183) (34,915)
b) Credit spread products — —
c) Total rate of returns swaps — —
d) Others — —
Total (1,217,117) (1,758,247)

160 Interim Report for the six months ended 31 December 2012
B.4 OTC credit derivatives: gross positive and negative fair values by counterparty – contracts not forming part of netting arrangements
contracts not forming part of netting arrangements
Governments and central
banks
other public agencies
Banks Financial companies
Insurances non-financial companies
other counterparties
Regulatory trading book
1. Hedge buys
- notional value — — — 50,000 — 50,000 —
- positive fair value — — — 52 — 2,199 —
- negative fair value — — — — — — —
- future exposure — — — 2,500 — 2,500 —
2. Hedge sales
- notional value — — 7,765 16,250 — — —
- positive fair value — — 6 — — — —
- negative fair value — — (3) (2,795) — — —
- future exposure — — 77 — — — —
Banking book*
1. Hedge buys
- notional value — — — — — — —
- positive fair value — — — — — — —
- negative fair value — — — — — — —
2. Hedge sales
- notional value — — — — — — —
- positive fair value — — — — — — —
- negative fair value — — — — — — —
* Derivatives embedded in bonds issued not included.

Notes to the accounts | Part E - Information on risks and related hedging policies 161
B.5 OTC credit derivatives: gross positive and negative fair values by counterparty – contracts forming part of netting arrangements
contracts forming part of netting arrangements
Governments and central
banks
other public agencies
Banks Financial companies
Insurances non-financial companies
other counterparties
Regulatory trading book
1. Hedge buys
- notional value — — 61,203,825 897,113 — — —
- positive fair value — — 414,434 6,624 — — —
- negative fair value — — (814,558) (7,631) — — —
2. Hedge sales
- notional value — — 60,710,782 577,206 — — —
- positive fair value — — 783,687 5,348 — — —
- negative fair value — — (384,949) (5,998) — — —
Banking book*
1. Hedge buys
- notional value — — — — — — —
- positive fair value — — — — — — —
- negative fair value — — — — — — —
2. Hedge sales
- notional value — — — — — — —
- positive fair value — — — — — — —
- negative fair value — — — — — — —
* Derivatives embedded in bonds issued not included.

162 Interim Report for the six months ended 31 December 2012
c. credit and financial derivatives
C.1 OTC financial and credit derivatives: net fair values and future exposure by counterparty
Governments and central
banks
other public agencies
Banks Financial companies
Insurances non-financial companies
other counterparties
1) Financial derivatives bilateral agreements
- positive fair value — — — — — — —
- negative fair value — — — — — — —
- future exposure — — — — — — —
- net counterparty risk — — — — — — —
2) Credit derivatives bilateral agreeements
- positive fair value — — — — — — —
- negative fair value — — — — — — —
- future exposure — — — — — — —
- net counterparty risk — — — — — — —
3) "Cross product" agreements*
- positive fair value — — 867,488 181,834 171,007 58,985 —
- negative fair value — — (382,016) (115,567) (8) (2,614) —
- future exposure — — 774,407 134,748 23,705 10,497 —
- net counterparty risk — — 785,845 308,762 188,442 69,481 —
* Representing the sum of the positive fair value and the future exposure net of cash collateral received amounting to €870,140,000, €856,050,000 of which in respect of banks, €7,820,000 of financial companies and €6,270,000 of insurances; conversely, to cover negative fair value readings, cash collateral of €496,033,000 was paid in, €366,713,000 in respect of banks, €125,830,000 of financial companies, €1,460,000 of insurances, and €2,030,000 of non-financial companies.

Notes to the accounts | Part E - Information on risks and related hedging policies 163
1.3 BAnkInG GroUP: LIQUIdIty rISk
QUALItAtIVE InForMAtIon
The Mediobanca Group monitors and manages liquidty risk in accordance with the Liquidity risk management policy (the “Policy”) and Contingency funding plan (“CFP”), documents approved in December 2011 in accordance with Bank of Italy circular no. 263/06 (“New supervisory regulations for banks”). The basic principles on which the Policy is based are as follows:
– identifying the parties, responsibilities and duties for controlling liquidity risk for the Group as a whole and for the individual Group companies;
– defining and monitoring the short-term risk limits (operating liquidity) within a time frame of up to 12 months;
– monitoring medium-/long-term liquidity (structural liquidity, more than 12 months);
– defining a pricing system of internal fund transfers between the Group’s various units and companies.
Operating liquidity guarantees an adequate ratio between counterbalancing capacity (available cash and securities eligible for refinancing with the ECB) and net cash outflows as calculated in stress scenarios.
Structural liquidity analyses the maturity profiles for both assets and liabilites, checking that inflows cover 100% of outflows for maturities of more than one year, and at least 90% of outflows for maturities of more than five years.
The Group has also prepared a plan for managing the possibility of liquidity crises which identifies parties, responsibilities and reporting procedures for dealing with emergency situations (the CFP). The CFP also provides for an early warning indicator (EWI) report to be drawn up once a week to identify systemic or specific crisis situations ahead of time.
A steering committee monitors fortnightly both the Bank’s liquidity and the sustainability of the business development on the Bank’s asset structure.
Stress testing is carried out assuming extraordinary factors such as drawdowns on committed lines granted to customers, reductions in funding (in the interbank, debt security and retail channels), plus the possibility of certain instruments being wound up early.

164 Interim Report for the six months ended 31 December 2012
During the six months under review, the Group’s liquidity position has remained within the limits and thresholds stipulated by the Regulations.
The Group has taken part in the Quantitative Impact Study promoted by the European Banking Authority (EBA), which involves calculation of the liquidity coverage ratio (LCR) and net stable funding ratio (NSFR), showing rations which are above the minimum levels stipulated.

Notes to the accounts | Part E - Information on risks and related hedging policies 165
QU
An
tIt
At
IVE
In
Fo
rM
At
Ion
1.
Fin
anci
al a
sset
s an
d lia
bilit
ies
by o
utst
andi
ng li
fe:
Cur
renc
y of
den
omin
atio
n: E
UR
OIt
ems/
mat
urit
ies
on
dem
and
Fro
m 1
da
ys t
o 7
day
s
Fro
m 7
da
ys t
o 1
5 d
ays
Fro
m 1
5
days
to
1 m
onth
Fro
m 1
m
onth
to
3 m
onth
s
Fro
m 3
m
onth
s to
6
mon
ths
Fro
m 6
m
onth
s to
1
yea
r
Fro
m 1
ye
ar t
o 5
yea
rs
ove
r 5
yea
rsn
ot
spec
ified
Cash
ass
ets
5,0
69,6
65
3,0
69,3
42
683
,461
2
,424
,338
4
,371
,688
3
,309
,425
6
,791
,862
2
5,25
6,63
2 1
2,63
2,61
2 20
,665
A.1
Gov
ernm
ent s
ecur
ities
22,
267
21,
882
180
,594
7
5,00
0 1
,289
,463
6
09,6
26
1,7
39,1
24
6,9
97,3
86
1,5
77,1
00
—
A.2
Oth
er d
ebt s
ecur
ities
13
19,
926
55,
776
255
,891
3
50,3
00
359
,878
5
12,6
95
2,7
70,7
72
2,1
73,4
47
—
A.3
UCI
TS u
nits
—
—
—
—
—
—
—
—
—
—
A.4
Loa
ns a
nd a
dvan
ces
5,0
47,3
85
3,0
27,5
34
447
,091
2
,093
,447
2
,731
,925
2
,339
,921
4
,540
,043
1
5,48
8,47
4 8
,882
,065
2
0,65
5
–
to b
anks
2,5
92,1
22
231
,950
4
8,90
8 7
4,47
5 4
72,0
01
354
,181
3
25,4
58
402
,678
1
96,2
90
5,7
16
–
to c
usto
mer
s 2
,455
,263
2
,795
,584
3
98,1
83
2,0
18,9
72
2,2
59,9
24
1,9
85,7
40
4,2
14,5
85
15,
085,
796
8,6
85,7
75
14,
939
Cash
liab
ilitie
s 5
,130
,872
2
,510
,103
1
,360
,738
1
,041
,359
6
,314
,063
4
,748
,613
5
,660
,152
3
0,80
7,73
4 4
,017
,802
9
,624
B.1
Dep
osits
and
cur
rent
acc
ount
s 5
,125
,497
2
,507
,152
1
,323
,421
1
,009
,993
3
,069
,665
3
,605
,371
3
,996
,570
8
,542
,510
1
,035
,595
9
,575
–
to b
anks
2,6
94,5
80
321
,214
9
05,5
28
242
,416
1
85,3
73
221
,040
1
71,0
69
7,8
06,7
52
288
,635
3
4
–
to c
usto
mer
s 2
,430
,917
2
,185
,938
4
17,8
93
767
,577
2
,884
,292
3
,384
,331
3
,825
,501
7
35,7
58
746
,960
9
,541
B.2
Deb
t sec
uriti
es 1
,390
1
,170
3
6,66
7 7
,042
9
65,4
29
1,1
43,2
42
1,6
63,5
82
22,
265,
224
2,9
82,2
07
49
B.3
Oth
er li
abili
ties
3,9
85
1,7
81
650
2
4,32
4 2
,278
,969
—
—
—
—
—
Off-
bala
nce-
shee
t tra
nsac
tions
10,
809,
497
12,
766,
781
873
,950
1
,463
,970
8
,201
,901
1
3,29
1,68
4 5
,338
,327
4
0,30
3,70
4 5
,902
,826
6
50
C.1
Fina
ncia
l der
ivat
ives
with
exc
hang
e of
prin
cipa
l—
1
97,5
51
14,
681
241
,855
5
,189
,541
1
43,8
43
721
,009
4
13,4
93
180
,000
—
–
long
pos
ition
s—
1
96,5
26
14,
667
38,
319
335
,306
8
3,76
2 3
19,1
86
136
,638
9
0,00
0 —
–
shor
t pos
ition
s—
1
,025
1
4 2
03,5
36
4,8
54,2
35
60,
081
401
,823
2
76,8
55
90,
000
—
C.2
Fina
ncia
l der
ivat
ives
with
out p
rinci
pal e
xcha
nge
of 8
,705
,446
5
,543
5
,742
6
0,96
8 3
11,7
08
177
,269
3
49,1
17
11,
296
—
—
–
long
pos
ition
s 4
,265
,081
4
,470
3
,091
3
7,81
0 2
64,7
34
118
,610
2
13,5
54
1,1
41
—
—
–
shor
t pos
ition
s 4
,440
,365
1
,073
2
,651
2
3,15
8 4
6,97
4 5
8,65
9 1
35,5
63
10,
155
—
—
C.3
Dep
osits
and
loan
s for
col
lect
ion
—
6,7
78,3
87
581
,046
8
64,1
10
1,5
41,4
03
1,4
58,5
23
1,0
20,9
40
3,1
84,6
21
1,9
46,1
76
—
–
long
pos
ition
s—
6
,778
,387
4
21,5
56
794
,117
6
54,3
94
—
39,
149
—
—
—
–
shor
t pos
ition
s—
—
1
59,4
90
69,
993
887
,009
1
,458
,523
9
81,7
91
3,1
84,6
21
1,9
46,1
76
—
C.4
Irre
voca
ble
com
mitm
ents
to d
isbu
rse
fund
s * 2
,077
,146
5
,785
,300
2
72,4
81
297
,037
1
,159
,249
1
1,51
2,04
9 3
,247
,261
3
6,69
4,29
4 3
,776
,650
6
50
–
long
pos
ition
s—
—
2
72,4
81
149
,983
1
,014
,249
6
,182
,274
1
,986
,761
1
9,29
4,97
3 2
,455
,800
3
25
–
shor
t pos
ition
s 2
,077
,146
5
,785
,300
—
1
47,0
54
145
,000
5
,329
,775
1
,260
,500
1
7,39
9,32
1 1
,320
,850
3
25
C.5
Fina
nced
gua
rant
ees i
ssue
d—
—
—
—
—
—
—
—
—
—
C.6
Fina
nced
gua
rant
ees r
ecei
ved
26,
905
—
—
—
—
—
—
—
—
—
* In
clud
es h
edge
sal
es p
erfe
ctly
mat
ched
by
purc
hase
s fo
r th
e sa
me
amou
nt.

166 Interim Report for the six months ended 31 December 2012
Cur
renc
y of
den
omin
atio
n: U
S D
OLL
AR
SIt
ems/
mat
urit
ies
on
dem
and
Fro
m 1
da
ys t
o 7
day
s
Fro
m 7
da
ys t
o 1
5 d
ays
Fro
m 1
5
days
to
1 m
onth
Fro
m 1
m
onth
to
3 m
onth
s
Fro
m 3
m
onth
s to
6
mon
ths
Fro
m 6
m
onth
s to
1
yea
r
Fro
m 1
ye
ar t
o 5
yea
rs
ove
r 5
yea
rsn
ot
spec
ified
Cash
ass
ets
283
,968
1
7,80
3 9
4,75
4 5
7,58
0 3
1,25
4 5
8,22
1 6
6,48
5 5
27,9
81
154
,170
56
A.1
Gov
ernm
ent s
ecur
ities
—
—
—
—
26
371
2
6 2
11
418
—
A.2
Oth
er d
ebt s
ecur
ities
—
—
93,
702
26,
810
10,
403
50,
571
12,
731
169
,372
7
6,26
6 —
A.3
UCI
TS u
nits
—
—
—
—
—
—
—
—
—
—
A.4
Loa
ns a
nd a
dvan
ces
283
,968
1
7,80
3 1
,052
3
0,77
0 2
0,82
5 7
,279
5
3,72
8 3
58,3
98
77,
486
56
–
to b
anks
282
,518
1
0,59
1 5
7 3
26
—
—
316
1
,918
—
5
6
–
to c
usto
mer
s 1
,450
7
,212
9
95
30,
444
20,
825
7,2
79
53,
412
356
,480
7
7,48
6 —
Cash
liab
ilitie
s 5
17,7
20
132
,547
3
1,51
7 1
0,97
4 5
0,34
5 5
,355
5
0,81
7 1
82,4
70
5,8
24
6
B.1
Dep
osits
and
cur
rent
acc
ount
s 5
17,7
16
132
,458
3
1,51
7 1
0,95
5 1
6,92
2 4
,144
1
2,27
4 —
5
,824
6
–
to b
anks
253
,559
5
0,03
7 2
9 —
5
1 1
—
—
5
,824
—
–
to c
usto
mer
s 2
64,1
57
82,
421
31,
488
10,
955
16,
871
4,1
43
12,
274
—
—
6
B.2
Deb
t sec
uriti
es 4
8
9 —
1
9 3
3,42
3 1
,211
3
8,54
3 1
82,4
70
—
—
B.3
Oth
er li
abili
ties
—
—
—
—
—
—
—
—
—
—
Off-
bala
nce-
shee
t tra
nsac
tions
436
,654
1
11,7
27
2,9
52
356
,562
3
9,66
9 1
,898
,142
6
42,0
74
68,
393,
171
706
,117
—
C.1
Fina
ncia
l der
ivat
ives
with
exc
hang
e of
prin
cipa
l—
1
11,7
27
2,9
52
72,
827
39,
669
6,2
19
47,
514
318
,824
2
32,6
05
—
–
long
pos
ition
s—
1
10,8
58
2,9
52
68,
855
32,
988
6,2
19
9,6
18
12,
430
—
—
–
shor
t pos
ition
s—
8
69
—
3,9
72
6,6
81
—
37,
896
306
,394
2
32,6
05
—
C.2
Fina
ncia
l der
ivat
ives
with
out p
rinci
pal e
xcha
nge
of 4
36,6
54
—
—
273
—
2
0 4
2 —
—
—
–
long
pos
ition
s 2
26,5
07
—
—
232
—
—
—
—
—
—
–
shor
t pos
ition
s 2
10,1
47
—
—
41
—
20
42
—
—
—
C.3
Dep
osits
and
loan
s for
col
lect
ion
—
—
—
100
,046
—
—
—
—
—
—
–
long
pos
ition
s—
—
—
5
0,02
3 —
—
—
—
—
—
–
shor
t pos
ition
s—
—
—
5
0,02
3 —
—
—
—
—
—
C.4
Irre
voca
ble
com
mitm
ents
to d
isbu
rse
fund
s *—
—
—
1
83,4
16
—
1,8
91,9
03
594
,518
6
8,07
4,34
7 4
73,5
12
—
–
long
pos
ition
s—
—
—
9
1,70
8 —
9
42,1
62
306
,733
3
4,02
5,82
3 2
42,4
22
—
–
shor
t pos
ition
s—
—
—
9
1,70
8 —
9
49,7
41
287
,785
3
4,04
8,52
4 2
31,0
90
—
C.5
Fina
nced
gua
rant
ees i
ssue
d—
—
—
—
—
—
—
—
—
—
C.6
Fina
nced
gua
rant
ees r
ecei
ved
—
—
—
—
—
—
—
—
—
—
* In
clud
es h
edge
sal
es p
erfe
ctly
mat
ched
by
purc
hase
s fo
r th
e sa
me
amou
nt.

Notes to the accounts | Part E - Information on risks and related hedging policies 167
Cur
renc
y of
den
omin
atio
n: O
TH
ER
Item
s/m
atur
itie
so
n de
man
dF
rom
1
days
to
7 d
ays
Fro
m 7
da
ys t
o 1
5 d
ays
Fro
m 1
5
days
to
1 m
onth
Fro
m 1
m
onth
to
3 m
onth
s
Fro
m 3
m
onth
s to
6
mon
ths
Fro
m 6
m
onth
s to
1
yea
r
Fro
m 1
ye
ar t
o 5
yea
rs
ove
r 5
yea
rsn
ot
spec
ified
Cash
ass
ets
105
,602
4
2,03
6 6
5,84
9 1
14,6
31
48,
745
10,
969
14,
276
249
,605
1
6,25
1 —
A.1
Gov
ernm
ent s
ecur
ities
—
—
—
—
—
550
—
1
2,25
3 —
—
A.2
Oth
er d
ebt s
ecur
ities
—
4,3
83
42,
030
30,
462
16
16
31
18,
434
7,3
52
—
A.3
UCI
TS u
nits
—
—
—
—
—
—
—
—
—
—
A.4
Loa
ns a
nd a
dvan
ces
105
,602
3
7,65
3 2
3,81
9 8
4,16
9 4
8,72
9 1
0,40
3 1
4,24
5 2
18,9
18
8,8
99
—
–
to b
anks
104
,250
3
2,36
6 5
6 —
—
—
—
—
—
—
–
to c
usto
mer
s 1
,352
5
,287
2
3,76
3 8
4,16
9 4
8,72
9 1
0,40
3 1
4,24
5 2
18,9
18
8,8
99
—
Cash
liab
ilitie
s 1
23,1
18
9,0
80
4,2
43
24,
016
5,0
00
29,
815
15,
338
27,
746
237
,753
—
B.1
Dep
osits
and
cur
rent
acc
ount
s 1
23,1
18
9,0
80
4,2
43
24,
016
5,0
00
9,5
36
1,6
89
—
—
—
–
to b
anks
493
—
—
3
,873
—
—
—
—
—
—
–
to c
usto
mer
s 1
22,6
25
9,0
80
4,2
43
20,
143
5,0
00
9,5
36
1,6
89
—
—
—
B.2
Deb
t sec
uriti
es—
—
—
—
—
2
0,27
9 1
3,64
9 2
7,74
6 2
37,7
53
—
B.3
Oth
er li
abili
ties
—
—
—
—
—
—
—
—
—
—
Off-
bala
nce-
shee
t tra
nsac
tions
585
,736
2
71,8
61
199
,853
1
,561
,346
1
,969
,911
2
,108
,211
8
52,8
26
4,4
35,2
36
189
,265
—
C.1
Fina
ncia
l der
ivat
ives
with
exc
hang
e of
prin
cipa
l—
2
71,8
61
199
,581
1
,561
,346
1
,969
,437
2
,107
,807
8
40,3
17
1,6
80,1
96
189
,265
—
–
long
pos
ition
s—
1
19,3
00
101
,821
7
48,9
03
1,0
00,2
16
1,0
54,8
53
420
,411
6
05,1
27
—
—
–
shor
t pos
ition
s—
1
52,5
61
97,
760
812
,443
9
69,2
21
1,0
52,9
54
419
,906
1
,075
,069
1
89,2
65
—
C.2
Fina
ncia
l der
ivat
ives
with
out p
rinci
pal e
xcha
nge
of 5
85,7
36
—
272
—
4
74
404
1
2,50
9 —
—
—
–
long
pos
ition
s 3
00,2
45
—
—
—
—
—
11,
686
—
—
—
–
shor
t pos
ition
s 2
85,4
91
—
272
—
4
74
404
8
23
—
—
—
C.3
Dep
osits
and
loan
s for
col
lect
ion
—
—
—
—
—
—
—
—
—
—
–
long
pos
ition
s—
—
—
—
—
—
—
—
—
—
–
shor
t pos
ition
s—
—
—
—
—
—
—
—
—
—
C.4
Irre
voca
ble
com
mitm
ents
to d
isbu
rse
fund
s *—
—
—
—
—
—
—
2
,755
,040
—
—
–
long
pos
ition
s—
—
—
—
—
—
—
1
,377
,520
—
—
–
shor
t pos
ition
s—
—
—
—
—
—
—
1
,377
,520
—
—
C.5
Fina
nced
gua
rant
ees i
ssue
d—
—
—
—
—
—
—
—
—
—
C.6
Fina
nced
gua
rant
ees r
ecei
ved
—
—
—
—
—
—
—
—
—
—
* In
clud
es h
edge
sal
es p
erfe
ctly
mat
ched
by
purc
hase
s fo
r th
e sa
me
amou
nt.

168 Interim Report for the six months ended 31 December 2012
1.4 BAnkInG GroUP – oPErAtIonAL rISk
QUALItAtIVE InForMAtIon
definition
Operating risk is the risk of incurring losses as a result of the inadequacy or malfunctioning of procedures, staff and IT systems, human error or external events.
capital requirements for operational risk
Mediobanca has decided to adopt the Basic Indicator Approach (BIA) in order to calculate the capital requirement for covering operating risk, applying a margin of 15% to the average of the last three years’ readings of total income. Based on this method of calculation, the capital requirement as at the reporting date unchanged from the figure recorded at 30 June 2012, namely €265.3m.
risk mitigation
Operational risks are managed, in Mediobanca and the main Group companies, by a specific Operational risk management team instituted in accordance with the Group’s policy for managing operational risk.
The processes of identifying, assessing and mitigating operational risks involve liaising with the other bodies and persons responsible for controls, such as the head of company financial reporting and the Compliance and Group Audit unit, in accordance with their respective duties and responsibilities.
With reference to the possibility of losses caused by interruptions in operations or systems being unavailable, the Group has drawn up operating continuity and disaster recovery plans to ensure that activity can continue and to limit operating losses in the event of prolonged interruptions. The Group reviews the operating continuity and emergency plans regularly, to ensure that these are consistent with its activities and current operating strategies.

Notes to the accounts | Part E - Information on risks and related hedging policies 169
Insurance policies have been taken out to cover the most valuable staff members and assets and as protection for management of cash.
As for the possibility of risks deriving from outsourcing activities, the Group has implemented a continuous monitoring and regular review system to assess the continuity and level of the service provided by outsourcers.
Legal risk: risks deriving from litigation pending
Apart from the claim pending against Mediobanca for the alleged failure to launch a full takeover bid for La Fondiaria in 2002 (cf. p. 44), the Group faces no legal risk worthy of note.

170 Interim Report for the six months ended 31 December 2012
1.5 BAnkInG GroUP – otHEr rISkS
QUALItAtIVE InForMAtIon
As part of the process of assessing the current and future capital required for the company to perform its business (ICAAP) required by the regulations in force, the Group has identified the following types of risk as relevant (in addition to those discussed previously, i.e. credit risk, counterparty risk, market risk, liquidity risk and operating risk:
– concentration risk, i.e. risk deriving from a concentration of exposures to individual counterparties or groups of counterparties (“single name concentration risk”) or to counterparties operating in the same economic sector or which operate in the same business or belong to the same geographical area (geographical/sector concentration risk);
– strategic risk, both in the sense of risk deriving from current and future changes in profits/margins compared to estimated data, due to volatility in volumes or changes in customer behaviour (business risk), and of current and future risk of reductions in profits or capital deriving from disruption to business as a result of adopting new strategic choices, wrong management decisions or inadequate execution of decisions taken (pure strategic risk);
– compliance risk, i.e. the risk of incurring legal or administrative penalties, significant financial losses or damages to the Bank’s reputation as a result of breaches of external laws and regulations or self-imposed regulations;
– reputational risk, i.e. the current and future risk of reductions in profits or capital deriving from a negative perception of the Bank’s image by customers, counterparties, shareholders, investors or regulatory authorities;
– residual risk, i.e. the risk that the recognized techniques used by the Bank to mitigate credit risk should prove to be less effective than anticipated.
Risks are monitored and managed via the respective internal units (risk management, planning and control, compliance and internal audit units) and by specific committees (risks and ALM committees).

Part F - Information on consolidated capital
SectIon 1
consolidated capital
B. Quantitative information
B.1 Consolidated net equity: breakdown by type of company *net equity constituents Banking
groupInsurance companies
other companies
elisions/adjustments
upon-consolidation
total of which third parties
Share capital 455,513 — — — 455,513 24,948
Share premium 2,127,359 — — — 2,127,359 7,216
Reserves 4,549,973 15,000 310 (15,310) 4,549,973 83,350
Equity instruments — — — — — —
Treasury shares (213,844) — — — (213,844) —
Valuation reserves: 112,684 1,524 — (1,524) 112,684 (6,095)
- AFS securities 95,617 1,524 — 2,603 99,744 —
- Property, plant and equipment — — — — — —
- Intangible assets — — — — — —
- Foreign investment hedges — — — — — —
- Cash flow hedges (134,883) — — — (134,883) (7,687)
- Exchange rate differences — — — — — —
- Non-current assets being sold — — — — — —
- Actuarial gains (losses) on defined-benefit pension schemes — — — — — —
- Share of valuation reserves represented by equity-accounted companies 136,888 — — (4,127) 132,761 —
- Special valuation laws 15,062 — — — 15,062 1,592
Gain (loss) for the period attributable to the Group/minorities 122,574 5,713 2,169 (7,686) 122,770 (1,026)
Total 7,154,259 22,237 2,479 (24,520) 7,154,455 108,393 * Includes Banca Esperia, consolidated pro rata, plus Compass RE (insurance), Creditech, R&S and Sade (other companies), equity-consolidated.
Notes to the accounts | Part F - Information on consolidated capital 171

172 Interim Report for the six months ended 31 December 2012
B.2 AFS valuation reserves: compositionAssets/amounts Banking group Insurance
companiesother companies elisions/adjustments
upon consolidationtotal
Positive reserve
negative reserve
Positive reserve
negative reserve
Positive reserve
negative reserve
Positive reserve
negative reserve
Positive reserve
negative reserve
1. Debt securities 116,388 (38,896) 1,542 (18) — — 4,417 — 122,347 (38,914)
2. Equities 31,528 (25,395) — — — — — — 31,528 (25,395)
3. UCITS units 12,612 (2,144) — — — — — (290) 12,612 (2,434)
4. Loans and advances — — — — — — — — — —
Total at 31/12/12 160,528 (66,435) 1,542 (18) — — 4,417 (290) 166,487 (66,743)
Total at 30/6/12 80,997 (320,807) 735 (1,014) — — 279 3,699 82,011 (318,122)
B.3 AFS valuation reserves: movements during the periodDebt securities equities UcItS units Loans total
1. Opening balance (231,242) (15,183) 10,314 — (236,111)
2. Additions 319,761 30,570 2,062 — 352,393
2.1 Increases in fair value 309,123 18,356 1,842 — 329,321
2.2 Negative reserves charged back to profit and loss as a result of 10,638 12,214 5 — 22,857
– impairment — — — — —
– disposals 10,638 12,214 5 — 22,857
2.3 Other additions — — 215 — 215
3. Reductions 5,086 9,254 2,198 — 16,538
3.1 Reductions in fair value 2,181 8,106 2,196 — 12,483
3.2 Adjustments for impairment — 889 — — 889
3.3 Positive reserves credited back to profit and loss as a result of: disposals 2,824 148 2 — 2,974
3.4 Other reductions 81 111 — — 192
4. Balance at end of period 83,433 6,133 10,178 — 99,744

Notes to the accounts | Part F - Information on consolidated capital 173
SectIon 2
Regulatory and supervisory capital requirements for banks
Capital is the first and most important safeguard of a bank’s stability. For this reason, the international and domestic supervisory bodies have established rigorous rules for calculating regulatory capital and the minimum capital requirements with which banks are bound to comply. Once a year the supervisory authorities carry out a supervisory review and evaluation process (SREP) which includes risk profiles and the systems and controls for governing them, setting the target capitalization for the Group and its international banking subsidiaries.
Since its inception one of the distinguishing features of the Mediobanca Group has been the solidity of its financial structure, with capital ratios that have been consistently and significantly higher than those required by the regulatory guidelines, as shown by the Internal Capital Adequacy Assessment Process (ICAAP) and the information disclosed to the public as required under Pillar III of Basel II, with the latter document published on the Bank’s website at www.mediobanca.it. Based on the valuations carried out in 2012, the authorities considered the capital of the Group and its non-Italian banking subsidiary to be adequate to cover the risks contemplated under Pillar I and Pillar II.
2.1 Scope of application of regulations
Regulatory capital has been calculated on the basis of Bank of Italy circulars no. 263 issued on 27 December 2006 (thirteenth update 29 May 2012) and no. 155 (fourteenth update 21 December 2011), which transpose the new prudential guidelines for banks and banking groups introduced by the New Basel Capital Accord (Basel II) into the Italian regulatory framework.
The Bank has opted for the “full neutralization” permitted by the Bank of Italy in its guidance issued on 18 May 2010, whereby the valuation reserves for sovereign debt issued by EU member states and held as AFS financial assets can be neutralized for the purpose of calculating regulatory capital.
The regulations on banks’ capital and corporate governance known as the Capital Requirements Directive (“CRD IV”) are currently in the process of being approved by the European Council and Parliament, based on the proposals made

174 Interim Report for the six months ended 31 December 2012
by the European Commission. This document incorporates the new prudential guidelines for banks known as Basel III, which involve a general strengthening of the quality of regulatory capital. The definitive version of the new regulations should be issued by the end of the current year, and applied gradually starting from January 2014, becoming fully operative as from 2019.
2.2 Regulatory capital requirements for banks
A. Qualitative information
1. Tier 1 and Tier 2 capital
Tier 1 capital consists of the share attributable to the Group and to minority shareholders of capital paid up, reserves, and profit for the period net of treasury shares (€213.8m), intangible assets (€43.9m), goodwill (€446.5m), and 50% of the book value of the Bank’s investments in banks and financial services companies (equal to €57.7m).
Tier 2 capital includes 50% of the positive reserves for AFS securities (€93.6m, €48.4m of which relative to the Group companies pro rata), reserves for property valuations (€15.1m), Tier 2 subordinated liabilities (€1,428.5m), positive exchange rate differences (€83.2m), and net unrealized gains on investments (€31.5m), less the remaining share of the investments’ book value (€57.7m).

Notes to the accounts | Part F - Information on consolidated capital 175
B. Quantitative information31/12/12 30/6/12
A. Tier 1 capital prior to application of prudential filters 6,530,226 6,230,438
B. Tier 1 prudential filters:
B.1 IAS/IFRS positive filters — 163,750
B.2 IAS/IFRS negative filters — —
C. Tier 1 capital gross of items to be deducted 6,530,226 6,394,188
D. Items for deduction from Tier 1 capital (57,747) (55,275)
E. Total Tier 1 capital 6,472,479 6,338,913
F. Tier 2 capital prior to application of prudential filters 1,783,619 1,529,983
G. Tier 2 prudential filters:
G.1 IAS/IFRS positive filters — —
G.2 IAS/IFRS negative filters (131,652) (3,594)
H. Tier 2 capital gross of items to be deducted 1,651,966 1,526,389
I. Items for deduction from Tier 2 capital (57,747) (55,275)
L. Total Tier 2 capital 1,594,219 1,471,114
M. Items for deduction from Total Tier 1 and Tier 2 capital — —
N. Regulatory capital 8,066,698 7,810,027
O. Total Tier 3 capital — —
P. Total regulatory capital including Tier 3 8,066,698 7,810,027
2.3 Capital adequacy
A. Qualitative information
As at 31 December 2012, the Group’s Tier 1 ratio, calculated as Tier 1 capital as a percentage of risk-weighted assets, amounted to 11.84%, up slightly compared to the figure posted at 30 June 2012 (11.49%), chiefly due to the increase in capital owing to the recovery by the AFS reserves, with risk-weighted assets down slightly (from €55.2bn to €54.7bn); the Total Capital Ratio also increased accordingly, from 14.16% to 14.76%.

176 Interim Report for the six months ended 31 December 2012
B. Quantitative informationcategories/amounts Unweighted amounts Weighted amounts/requirements
31/12/12 30/6/12 31/12/12 30/6/12
A. RISK ASSETS
A.1 Credit and counterpart risk 68,439,122 70,554,508 44,095,763 44,937,731
1. Standard methodology 68,179,849 70,282,306 43,713,478 44,612,976
2. Internal rating methodology — — — —
2.1 Basic — — — —
2.2 Advanced — — — —
3. Securitization 259,273 272,202 382,285 324,755
B. REGULATORY CAPITAL REQUIREMENTS
B.1 Credit and counterpart risk 3,527,661 3,595,018
B.2 Market risk 580,426 552,853
1. Standard methodology 551,786 533,792
2. Internal models — —
3. Concentration risk 28,640 19,061
B.3 Operational risk 265,251 265,251
1. Basic Indicator Approach (BIA) 265,251 265,251
2. Standard methodology — —
3. Advanced methodology — —
B.4 Other prudential requirements — —
B.5 Other calculation elements — —
B.6 Total prudential requirements 4,373,338 4,413,122
C. RISK ASSETS AND REGULATORY RATIOS
C.1 Risk-weighted assets 54,666,725 55,164,025
C.2 Tier 1 capital/Risk-weighted assets (Tier 1 Capital Ratio) 11.84% 11.49%
C.3 Regulatory capital/Risk-weighted assets (Total Capital Ratio) 14.76% 14.16%

Notes to the accounts | Part H - Related party disclosure 177
Part H - Related party disclosure
1. Related party disclosure
At a Board meeting held on 27 June 2012, the directors of Mediobanca, having received favourable opinions from the Related Parties Committee and Statutory Audit Committee, approved the “Procedure in respect of related parties and their associates” in pursuance of Consob resolution no. 17221 dated 12 March 2010 and the Bank of Italy’s instructions on “Risk assets and conflicts of interest with related parties” dated 15 December 2011. The new procedure came into force on 31 December 2012, and the full document is available at www.mediobanca.it.
For the definition of related parties adopted, please see part A (Accounting policies) of the notes to the accounts.
Accounts with related parties fall within the ordinary operations of the Group companies, are maintained on an arm’s length basis, and are entered into in the interests of the individual companies concerned. Details of Directors’ and strategic management compensation are provided in a footnote to the table.
1.1 Regular financial disclosure: most significant transactions
No transactions defined as “most significant” were executed during the period.
1.2 Quantitative information
The exposure (representing the sum of assets plus guarantees and commitments) fell from €4.3bn as at 30 June 2012 to €4.2bn at the reporting date. Overall, accounts with related parties represent some 5.5% of the total asset aggregates and 5% of interest income (5.3% and 4.7% respectively last year).

178 Interim Report for the six months ended 31 December 2012
Situation as at 31 December 2012(€m)
Directors, statutory auditors
and strategic management Associates
other related parties total
Assets 1.4 2,494.9 952.9 3,449.2
of which: other assets — 1,039.1 292.0 1,331.1
loans and advances 1.4 1,455.8 660.9 2,118.1
Liabilities 32.7 108.4 277.8 418.9
Guarantees and commitments — 465.2 306.3 771.5
Interest income — 57.3 14.6 71.9
Interest expense (0.5) (6.3) (2.7) (9.5)
Net fee income — 17.6 2.3 19.9
Other income (costs) (16.8)1 47.1 3.2 33.5
1 Of which: short-term benefits amounting to €15.8m, stock options worth €0.5m and performance shares worth €0.4m. The figure includes those staff comprised in the aggregate “Strategic management” during the year..
Situation at 30 June 2012(€m)
Directors, statutory auditors
and strategic management Associates
other related parties total
Assets 0.3 2,306.0 1,045.7 3,352.0
of which: other assets — 1,027.5 315.8 1,343.3
loans and advances 0.3 1,278.5 729.9 2,008.7
Liabilities 28.1 26.5 68.6 123.2
Guarantees and commitments — 152.7 772.1 924.8
Interest income — 96.5 45.2 141.7
Interest expense (0.8) (4.5) (3.3) (8.6)
Net fee income — 31.8 42.1 73.9
Other income (costs) (30.6)1 82.8 (11.7) 40.5
1 Of which: short-term benefits amounting to €28.7m, stock options worth €0.9m and performance shares worth €0.7m. The figure includes those staff comprised in the aggregate “Strategic management” during the year.

Notes to the accounts | Part I - Share-based payment schemes 179
Part I - Share-based payment schemes
A. QUALItAtIVe InFoRMAtIon
1. Information on capital increases for use in share-based payment schemes using the Bank’s own equity instruments
The increases in the Bank’s share capital for use in connection with the stock option and performance share schemes approved reflect the following situation:
extraordinary general meeting held on no. of shares approved
Awards expire on Deadline for exercising options
no. of shares awarded
29 March 1999 3,130,000 30 July 2006 31 December 2011 3,130,000
30 July 2001 50,000,000 30 July 2006 1 July 2015 49,500,250
28 October 2004 15,000,000 28 October 2009 1 July 2020 14,040,000
of which to directors 1 4,000,000 28 October 2009 1 July 2020 3,375,000 2
27 October 2007 40,000,000 27 June 2012 1 July 2022 16,921,000
TOTAL STOCK OPTIONS 108,130,000 X X 83,591,250
28 October 2010 20,000,000 X X 8,313,494
TOTAL PERFORMANCE SHARES 20,000,000 X X 8,313,494
1 At a general meeting held on 27 June 2007, shareholders approved a proposal to grant stock options to Board members.2 2,000,000 of which granted to one former director.
2. Description of stock option schemes
The stock option schemes approved pursuant to Article 2441, paragraphs 8 and 5, of the Italian Civil Code, provide for a maximum duration of ten years and a vesting period of thirty-six months.
The schemes were launched with the dual purpose of encouraging loyalty retention among key staff members, i.e. persuading employees with essential and/or critical roles within the Group to stay with Mediobanca, and making the remuneration package offered to them more diversified and flexible.
The choice of beneficiaries and decisions as to the number of options to be allotted are taken in view of the role performed by the person concerned with the company’s organization and their importance in terms of creating value.
No stock options were awarded during the six months under review.

180 Interim Report for the six months ended 31 December 2012
Mediobanca, along with Mediolanum, also participates in the stock option scheme operated by Banca Esperia for its staff, reserving a portion of its investment in the company for use in connection with this scheme.
3. Description of performance share scheme
As part of its use of equity instruments for staff remuneration purposes, Mediobanca has chosen to adopt a performance share scheme, which was approved by the Bank’s shareholders at the annual general meeting held on 28 October 2010. Under the terms of the scheme, in certain conditions Mediobanca shares may be awarded to staff free of charge at the end of a vesting period. The rationale for the scheme is to:
– bring the Bank’s remuneration structure into line with guidance issued by regulatory authorities requiring that significant percentages of the variable remuneration component annually assigned be paid in the form of equity instruments, making it consistent with results sustainable over time;
– encourage the involvement of key staff in a mechanism for co-investing in the share capital of Mediobanca;
– introduce a new instrument alongside the stock options, with a limited number of newly-issued shares and by using the treasury shares owned by the Bank, in order to limit the dilutive impact on the ownership structure.
In connection with this proposal, a resolution to increase the company’s share capital was adopted by shareholders at the annual general meeting referred to above, with up to 20 million new Mediobanca shares being issued, and treasury shares owned by the Bank used for this purpose.
On 27 September 2012, as part of staff variable remuneration for the 2012 financial year, a total of 5,861,494 performance shares were awarded; the shares, which are conditional upon certain performance targets being met over a three-year time horizon, will be made available in tranches in November 2014 (up to 1,941,206), November 2015 (up to 3,347,604) and November 2016 (up to 572,684), considering the additional holding period of one year. The overall notional cost of these shares is €19.5m.

Notes to the accounts | Part I - Share-based payment schemes 181
B. QUAntItAtIVe InFoRMAtIon
1. 1. Changes to stock option scheme during the periodItems/options number and strike price
30/6/12 31/12/12
no. of options Avg. price Avg. expiry no. of options Avg. price Avg. expiry
A. Balance at start of period 40,355,750 9.90September 2016 40,642,000 9.86 October 2016
B. Additions
B.1 New issues 650,000 6.43 August 2019 — — —
B.2 Other additions — — X — — —
C. Reductions
C.1 Options cancelled 103,750 12.16 X 1,135,000 10.36 X
C.2 Options exercised — — X — — X
C.3 Options expired — — X — — X
C.4 Other reductions 260,000 6.56 X 395,000 6.54 X
D. Balance at end of period 40,642,000 9.86 October 2016 39,112,000 9.88 October 2016
E. Options exercisable as at reporting date 23,642,000 12.24 X 22,687,000 12.30 X
2. Changes to performance shares during the periodItems/Performance shares 31/12/12 30/6/12
no. of performance
shares
Avg. price no. of performance
shares
Avg. price
A. Balance at start of period 2,494,424 6.23 — —
B. Additions
B.1 New issues 5,861,494 3.32 2,521,697 6.23
B.2 Other eadditions — — — —
C. Reductions
C.1 Options cancelled — — — —
C.2 Options exercised — — — —
C.3 Options expired — — — —
C.4 Other reductions 42,424 6.23 27,273 6.21
D. Balance at end of period 8,313,494 4.18 2,494,424 6.23
E. Performance shares exercisable as at reporting date — — — —

182 Interim Report for the six months ended 31 December 2012
Part L - Segment reporting
A. PRIMARY SeGMent RePoRtInG
A.1 Primary segment reporting (€m)
Profit-and-loss figures corporate & Investment
Banking
Principal Investing
Retail & Private
Banking
others Writeoffs ¹ Group
Net interest income 157.4 (3.9) 364.2 (0.1) 0.1 517.7
Net trading income 100.3 — 6.6 — (0.4) 106.5
Net fee and commission income 101.2 — 121.1 11.3 (32.6) 201.0
Share in profits earned by equity-accounted companies 30.7 54.4 — — 0.7 85.8
total income 389.6 50.5 491.9 11.2 (32.2) 911.0
Personnel costs (98.2) (2.4) (102.8) (3.2) 12.2 (194.4)
Administrative expenses (52.3) (1.7) (143.6) (7.4) 23.8 (181.2)
operating costs (150.5) (4.1) (246.4) (10.6) 36.0 (375.6)
Gains (losses) on AFS, HTM and L&R (6.4) — 8.7 — (6.9) (4.6)
Gain (loss) on disposal of AFS securities (58.2) — (174.6) — — (232.8)
Gain (loss) on disposal of other securities 9.1 (98.1) (3.6) — 3.1 (89.5)
Others — — (1.1) — 1.1 —
Profit before tax 183.6 (51.7) 74.9 0.6 1.1 208.5
Income tax for the period (60.4) (0.3) (25.5) (0.1) 0.6 (85.7)
Minority interest 1.0 — — — — 1.0
net profit 124.2 (52.0) 49.4 0.5 1.7 123.8
Cost/income ratio (%) 38.6 8.1 50.1 n.m. n.m. 41.2
Business divisions comprise:
– CIB (Corporate and investment banking): comprises corporate and investment banking activities, including leasing, plus the Group’s trading portfolio, The companies which contribute to this line of business are: Mediobanca, Mediobanca International,, MI Immobilière, MB Securities USA, Consortium, Prominvestment, SelmaBipiemme Leasing, Palladio Leasing and Teleleasing;
– Principal investing: this comprises the Group’s shareholdings in Assicurazioni Generali, RCS MediaGroup and Telco, plus stakes acquired as part of merchant banking activity and investments in private equity funds;
– Retail and private banking: this division comprises activities targeting retail customers through consumer credit products, mortgages, deposit accounts, private banking and fiduciary business, The companies which form part of this division are Compass, CheBanca!, Cofactor, Futuro and Creditech and Compass RE (consumer finance), Compagnie Monégasque de Banque, Spafid and Prudentia Fiduciaria plus 50% of Banca Esperia (private banking).
¹ The column headed “Adjustments” includes the contribution of Banca Esperia, which for operating purposes is consolidated pro-rata, plus any adjustments made upon consolidation (including elimination of inter-company positions) between the different business areas.

Notes to the accounts | Part L - Segment reporting 183
A.2 Balance-sheet data by business segment: asset data (€m)
Balance-sheet data corporate & Investment
Banking
Principal Investing
Retail & Private
Banking
others Writeoffs ¹ Group
Treasury funds 10,593.3 — 9,885.2 0.3 (11,373.6) 9,105.2
AFS securities 10,384.1 144.8 1,598.1 — (391.4) 11,735.6
Financial assets held to maturity (HTM & LR) 4,050.4 — 2,096.4 — (3,780.5) 2,366.3
Equity investments 414.2 2,779.5 — — 90.3 3,284.0
Loans and advances to customers 27,955.9 — 14,703.5 — (8,517.4) 34,142.0
Funding (50,780.9) (259.8) (26,616.8) (34.6) 23,721.6 (53,970.5)
¹ The column headed “Adjustments” includes the contribution of Banca Esperia, which for operating purposes is consolidated pro-rata, plus any adjustments made upon consolidation (including elimination of inter-company positions) between the different business areas..

INDEPENDENTAUDITORS’ REVIEW REPORT

Independent Auditors’ Review Report 187

188 Interim Report for the six months ended 31 December 2012

ANNEXES

190 Interim Report for the six months ended 31 December 2012
consolidated Balance Sheet (IAS/IFRS-compliant)*
Assets IAS-compliant 31/12/12
IAS-compliant 30/6/12
IAS-compliant 31/12/11
10. Cash and cash equivalents 35.5 29.7 1,154.7
20. Financial assets held for trading 14,697.9 13,838.2 14,157.2
30. Financial assets recognized at fair value — — —
40. AFS securities 11,735.6 10,552.1 6,859.6
50. Financial assets held to maturity 1,722.6 1,723.3 1,747.9
60. Due from banks 5,203.9 3,962.9 5,599.4
of which:
other trading items 3,980.5 2,742.5 3,621.3
securities 30.0 — —
other items 11.8 16.2 1.0
70. Due from customers 39,477.2 41,871.1 40,644.7
of which:
other trading items 5,769.2 5,998.9 3,943.4
securities 613.8 604.9 664.7
other items 70.5 100.6 81.4
80. Hedging derivatives 1,688.4 1,571.8 1,402.1
of which:
funding hedge derivatives 1,688.4 1,571.8 1,402.1
lending hedge derivatives — — —
90. Value adjustments to financial assets subject to general hedging — — —
100. Equity investments 3,284.0 3,165.5 2,976.9
120. Property, plant and equipment 298.5 293.7 297.4
130. Intangible assets 416.5 424.4 431.1
of which:
goodwill 365.9 365.9 365.9
140. Tax assets 869.3 1,037.1 1,003.1
a) current 223.5 299.6 243.1
b) advance 645.8 737.5 760.0
150. Other non-current and Group assets being sold — — —
160. Other assets 207.2 209.3 194.0
of which:
other trading items 16.4 7.5 9.0
totAL ASSetS 79,636.6 78,679.1 76,468.1
* Figures in €m
The balance sheet provided on p. 24 reflects the following restatements:– Treasury funds comprise asset headings 10 and 20 and liability heading 40, plus the “other trading items” shown under asset headings 60, 70 and
160 and liability headings 10 and 20, with the latter chiefly consisting of repos, interbank accounts and margins on derivatives;– Funding comprises the balances shown under liability headings 10, 20 and 30 (excluding amounts restated as trading items in respect of repos
and interbank accounts), plus the relevant amounts in respect of hedging derivatives;– Loans and advances to customers comprise asset headings 60 and 70 (excluding amounts restated as Treasury funds), the relevant amounts in respect
of hedging derivatives shown under asset heading 80 and liability heading 60, and the impairment charges taken under liability heading 100;– Fixed financial assets (HTM & LR) include asset heading 50 and the securities held as Loans and receivables and accounted for under asset
headings 60 and 70.

Notes to the accounts | Annexes 191
(€m)
Liabilities and net equity IAS-compliant 31/12/12
IAS-compliant 30/6/12
IAS-compliant 31/12/11
10. Due to banks 13,168.6 12,000.0 9,365.4
of which:
other trading items 2,761.8 1,183.3 1,210.8
other liabilities 17.5 0.4 7.1
20. Due to customers 17,505.2 17,149.0 15,431.5
of which:
other trading items 1,985.0 2,168.0 1,460.6
other liabilities 9.8 13.4 9.9
30. Debt securities 29,513.3 31,300.3 33,516.6
40. Trading liabilities 10,647.5 9,935.0 10,320.2
50. Liabilities recognized at fair value — — —
60. Hedging derivatives 345.7 365.0 426.6
of which:
funding hedge derivatives 246.0 275.7 308.3
lending hedge derivatives 48.8 44.5 72.3
70. Value adjustments to financial liabilities subject to general hedging — — —
80. Tax liabilities 538.5 494.1 430.7
a) current 188.6 198.0 133.3
b) deferred 349.9 296.1 297.4
90. Liabilities in respect of Group assets being sold — — —
100. Other liabilities 464.6 542.3 491.3
of which:
other trading items — 0.2 0.1
loan loss provisions 14.5 17.0 26.6
110. Staff severance indemnity provision 26.8 24.6 24.2
120. Provisions 160.8 160.5 157.8
a) post-employment and similar benefits — — —
b) other provisions 160.8 160.5 157.8
130. Technical reserves 111.1 99.3 78.0
140. Valuation reserves 118.8 (337.1) (711.6)
150. Shares with right of withdrawal — — —
160. Equity instruments — — —
170. Reserves 4,466.6 4,418.9 4,424.6
180. Share premium reserve 2,120.1 2,120.1 2,120.1
190. Share capital 430.6 430.6 430.6
200. Treasury shares (213.8) (213.8) (213.8)
210. Net equity attributable to minorities 108.4 109.4 112.5
220. Profit (loss) for the year 123.8 80.9 63.4
totAL LIABILItIeS AnD net eQUItY 79,636.6 78,679.1 76,468.1

Notes to the accounts | Annexes 193
consolidated Profit and Loss account (IAS/IFRS-compliant)*
(€m)
Profit and loss account 6 mths to31/12/12
12 mths to30/6/12
6 mths to31/12/11
10. Interest and similar income 1,455.0 3,037.2 1,552.3 20. Interest expense and similar charges (922.5) (1,949.1) (993.8)
30. net interest income 532.5 1,088.1 558.5 40. Fee and commission income 179.1 438.6 207.0 50. Fee and commission expense (24.3) (47.3) (18.0)
60. net fee and commission income 154.8 391.3 189.0 70. Dividends and similar income 8.2 90.8 35.9 80. Net trading income 66.8 116.8 43.6 90. Net hedging income (expense) 4.3 4.1 4.4
100. Gain (loss) on disposal of: 8.7 70.0 (13.2)a) loans and receivables 6.3 — —b) AFS securities (11.4) 34.4 (38.0)c) financial assets held to maturity 0.5 (1.9) 0.2d) other financial liabilities 13.3 37.5 24.6
120. total income 775.3 1,761.1 818.2 130. Adjustments for impairment to: (227.2) (881.3) (388.2)
a) loans and receivables (217.3) (429.1) (189.5)b) AFS securities 5.5 (411.5) (174.4)c) financial assets held to maturity 0.2 (1.3) (1.5)d) other financial liabilities (15.6) (39.4) (22.8)
140. net income from financial operations 548.1 879.8 430.0 150. Net premium income 15.2 22.1 9.4 160. Income less expense from insurance operations (7.5) (9.7) (3.6)170. net income from financial and insurance operations 555.8 892.2 435.8 180. Administrative expenses: (375.0) (784.3) (399.1)
a) personnel costs (194.4) (393.3) (201.3)b) other administrative expenses (180.6) (391.0) (197.8)
190. Net transfers to provisions for liabilities and charges (1.2) (4.0) (1.4) 200. Net adjustments to property, plant and equipment (9.7) (18.9) (8.5) 210. Net adjustments to intangible assets (11.1) (25.8) (13.1)
of which: goodwill — — — 220. Other operating income (expenses) 58.9 123.0 62.5230. operating costs (338.1) (710.0) (359.6) 240. Profit (loss) from equity-accounted companies (9.2) (21.5) 16.6 270. Gain (loss) on disposal of investments — 45.2 43.8280. Profit (loss) before tax on ordinary activities 208.5 205.9 136.6 290. Income tax on ordinary activities for the year (85.7) (125.5) (71.4)300. Profit (loss) after tax on ordinary activities 122.8 80.4 65.2 310. Net gain (loss) on non-current assets being sold — — —320. Profit (loss) for the year 122.8 80.4 65.2 330. Profit (loss) for the year attributable to minorities 1.0 0.5 (1.8)340. net profit (loss) for the year attributable to Mediobanca 123.8 80.9 63.4
* Figures in €m
The profit and loss account shown on p. 12 reflects the following restatements:– Net interest income includes the result of funding and lending hedging activity (€4.3m, €4.5m and €4.4m respectively), plus the margins on swaps
reported under heading 80 (€19.2m, €22.6m and €8.1m respectively), net of interest expense on securities lending totalling €0.3m at 30 June 2012 and 31 December 2011, which is accounted for as Net trading income;
– amounts under Heading 220 have been restated as Net fee and commission income, save for amounts refunded/recovered totalling €21.5m, €42.5m and €22.9m respectively which net operating costs; the amounts stated under headings 150 and 160 have also been accounted for as Net fee and commission income, as has the provision for invoices issued under heading 190 (which amounted to €1.5m as at 30 June 2012) net of fees payable in respect of securities lending (minus €1m and minus €0.7m respectively shown here under heading 80;
– net of or in addition to the items already stated, Net trading income also includes the amounts shown under headings 70 and 80, and the gains (losses) on disposal of financial liabilities reported under heading 100;
– Provisions for other financial assets include both the AFS securities and HTM financial assets accounted for here under heading 130, plus the €95m net adjustments for Telco shown under heading 240 (as at 30 June 2012 this item included €77.7m for RCS MediaGroup and €113.3m for Telco; while at 31 December 2011 it included €55.2m in adjustments relative again to RCS MediaGroup).

194 Interim Report for the six months ended 31 December 2012
Mediobanca S.p.A. Balance Sheet (IAS/IFRS-compliant)*
(€m)
Assets IAS-compliant 31/12/12
IAS-compliant 30/6/12
IAS-compliant 31/12/11
10. Cash and cash equivalents 6.5 2.1 1,118.1
20. Financial assets held for trading 14,332.0 13,311.6 13,677.6
40. AFS securities 10,528.9 9,356.7 5,795.7
50. Financial assets held to maturity 1,715.0 1,716.1 1,742.6
60. Due from banks 10,277.4 10,601.2 8,857.9
of which:
other trading items 4,926.1 3,870.8 4,675.9
securities 30.0 — —
other items 23.7 26.9 10.3
70. Due from customers 28,807.2 30,026.4 28,552.7
of which:
other trading items 6,928.0 6,990.1 4,896.1
securities 2,305.4 2,297.3 2,358.5
other items 44.4 84.0 33.4
80. Hedging derivatives 1,801.2 1,683.8 1,485.4
of which:
funding hedge derivatives 1,783.2 1,670.5 1,470.5
lending hedge derivatives 18.0 13.4 14.9
100. Equity investments 3,283.7 3,214.4 2,637.3
120. Property, plant and equipment 125.7 126.9 120.0
130. Intangible assets 8.0 11.2 12.7
140. Tax assets 242.4 405.2 400.0
a) current 102.9 182.3 133.0
b) advance 139.5 222.9 267.1
150. Other assets 21.8 22.1 27.0
total assets 71,149.8 70,477.7 64,427.0
* Figures in €m
The balance sheet provided on p. 247 reflects the following restatements:– Treasury funds comprise asset headings 10 and 20 and liability heading 40, plus the “other trading items” shown under asset headings 60, 70
and liability headings 10 and 20, with the latter chiefly consisting of repos, interbank accounts and margins on derivatives;– Funding comprises the balances shown under liability headings 10, 20 and 30 (excluding amounts restated as trading items in respect of repos
and interbank accounts), plus the relevant amounts in respect of hedging derivatives;– Loans and advances to customers comprise asset headings 60 and 70 (excluding amounts restated as Treasury funds), the relevant amounts
in respect of hedging derivatives shown under asset heading 80 and liability heading 60, and the impairment charges taken under liability heading 100;
– Fixed financial assets (HTM & LR) include asset heading 50 and the securities held as Loans and receivables and accounted for under asset headings 60 and 70.

Notes to the accounts | Annexes 195
(€m)
Liabilities and net equity IAS-compliant 31/12/12
IAS- compliant
30/6/12
IAS- compliant 31/12/11
10. Due to banks 21,536.6 19,649.5 11,479.0
of which:
other trading items 3,166.9 1,525.7 2,057.5
other liabilities 17.9 5.8 11.4
20. Due to customers 2,404.5 2,390.3 1,118.5
of which:
other trading items 1,955.9 1,956.5 915.5
other liabilities 27.9 57.2 71.8
30. Debt securities 30,524.3 32,731.0 35,841.4
40. Trading liabilities 10,660.8 9,931.8 10,367.2
60. Hedging derivatives 559.3 572.7 611.0
of which:
funding hedge derivatives 477.5 501.3 509.1
lending hedge derivatives 48.8 44.5 72.3
80. Tax liabilities 430.8 389.1 341.3
a) current 130.5 136.0 82.8
b) deferred 300.3 253.1 258.5
100. Other liabilities 218.1 231.7 180.7
of which:
adjustments to L & R 123.4 107.9 91.3
other trading items 0.7 0.1 0.1
110. Staff severance indemnity provision 9.1 8.1 8.5
120. Provisions 152.0 152.0 150.8
a) post-employment and similar benefits — — —
b) other provisions 152.0 152.0 150.8
130. Valuation reserves 91.6 (196.8) (359.8)
160. Reserves 2,246.6 2,481.2 2,475.4
170. Share premium reserve 2,120.1 2,120.1 2,120.1
180. Share capital 430.6 430.6 430.6
190. Treasury shares (–) (213.4) (213.4) (213.4)
200. Profit (loss) for the period (21.2) (200.2) (124.3)
total liabilities and net equity 71,149.8 70,477.7 64,427.0

196 Interim Report for the six months ended 31 December 2012
Mediobanca S.p.A. Profit and loss account *
(€m)
Profit and loss account 6 mths to31/12/12
12 mths to30/6/12
6 mths to31/12/11
10. Interest and similar income 980.0 1,999.5 1,023.8 20. Interest expense and similar charges (889.5) (1,736.7) (874.7)
30. net interest income 90.5 262.8 149.1 40. Fee and commission income 101.4 265.4 117.3 50. Fee and commission expense (10.1) (18.5) (5.1)
60. net fee and commission income 91.3 246.9 112.2 70. Dividends and similar income 8.2 138.2 35.9 80. Net trading income 109.0 135.4 41.6 90. Net hedging income (expense) 2.3 3.9 3.6
100. Gain (loss) on disposal of: 6.5 70.2 (13.2)a) loans and receivables 6.3 — —b) AFS securities (13.2) 34.5 (37.9)c) financial assets held to maturity 0.5 (1.9) —d) other financial liabilities 12.9 37.6 24.7
120. total income 307.8 857.4 329.2 130. Adjustments for impairment to: (40.5) (519.1) (215.1)
a) loans and receivables (31.0) (67.5) (16.9)b) AFS securities 6.0 (410.7) (173.9)c) financial assets held to maturity — (1.6) (1.6)d) other financial liabilities (15.5) (39.3) (22.7)
140. net income from financial operations 267.3 338.3 114.1 180. Administrative expenses: (135.6) (275.7) (144.4)
a) personnel costs (92.6) (188.7) (101.5)b) other administrative expenses (43.0) (87.0) (42.9)
190. Net transfers to provisions for liabilities and charges — (1.5) — 200. Net adjustments to property, plant and equipment (1.8) (3.4) (1.7) 210. Net adjustments to intangible assets (4.6) (11.3) (6.0)
of which: goodwill — — — 220. Other operating income (expenses) 8.0 19.6 8.9
230. operating costs (134.0) (272.3) (143.2) 240. Profit (loss) from equity investments (99.5) (198.7) (57.2) 270. Gain (loss) on disposal of investments — — —
280. Profit (loss) before tax on ordinary activities 33.8 (132.7) (86.3) 290. Income tax on ordinary activities for the year (55.0) (67.5) (38.0)
300. Profit (loss) after tax on ordinary activities (21.2) (200.2) (124.3)330. net profit (loss) for the period (21.2) (200.2) (124.3)
* Figures in €m.
The profit and loss account shown on p. 38 reflects the following restatements:– Net interest income includes the result of funding and lending hedging activity (€2.3m, €3.9m and €3.6m respectively), plus the margins on swaps
reported under heading 80 (€26.4m, €9.2m and minus €1.8m respectively), net of interest expense on securities lending totalling €0.3m at 30 June 2012, which is accounted for as Net trading income; amounts under Heading 220 have been restated as Net fee and commission income, save for amounts refunded/recovered totalling €1.9m, €1.4m and €1.1m respectively which net operating costs; the amounts stated under headings 150 and 160 have also been accounted for as Net fee and commission income, as has the provision for invoices issued under heading 190 (which amounted to €1.5m as at 30 June 2012) net of fees payable in respect of securities lending (minus €1m and minus €1.2m respectively shown here under heading 80);
– net of or in addition to the items already stated, Net trading income also includes the amounts shown under headings 70 (net of dividends on equity investments) and 80, and the gains (losses) on disposal of financial liabilities reported under heading 100.

Notes to the accounts | Annexes 197
Declaration in respect of interim financial statements as required by Article 81-ter of consob resolution no. 11971
issued on 14 May 1999 as amended
1. The undersigned Alberto Nagel and Massimo Bertolini, in their respective capacities as Chief Executive Officer and Head of Financial Reporting of Mediobanca, hereby declare, and in view inter alia of the provisions contained in Article 154-bis, paragraphs 3 and 4, of Italian Legislative Decree 58/98, that the administrative and accounting procedures used in the preparation of the interim financial statements:
– were adequate in view of the company’s characteristics; and that
– were effectively applied during the six months ended 31 December 2012.
2. Assessment of the adequacy of said administrative and accounting procedures for the financial statements for the six months ended 31 December 2012 was based on a model defined by Mediobanca in accordance with benchmark standards for internal control systems generally accepted at international level (i.e. the CoSO and CobiT frameworks).
3. It is further hereby declared that: 3.1 the interim financial statements:
– have been drawn up in accordance with the international accounting standards recognized in the European Community adopted pursuant to CE regulation no. 1606/02 issued by the European Council and Parliament on 19 July 2002;
– correspond to the data recorded in the company’s books and account ledgers;
– are such as to provide a truthful and accurate representation of the capital, earnings and financial situation of the issuer and the group of companies included within its area of consolidation.
3.2 the interim review of operations contains reliable analysis of the most important events to take place in the first six months of the financial year and their impact on the interim financial statements, along with a description of the main risks and uncertainties for the remaining six months. The interim review of operations also contains reliable analysis of information on major transactions involving related parties.
Milan, 26 February 2013
Chief Executive Officer Head of Company Financial Reporting Alberto Nagel Massimo Bertolini

Mercurio GP - Milan