interim report january–june 2015–s fastigheter ab interim report january–june 2015 5 property...
TRANSCRIPT

Q2INTERIM REPORT JANUARY–JUNE 2015

DIÖS FASTIGHETER AB INTERIM REPORT JANUARY–JUNE 20152
c Rental income for the period was SEK 647 million (649)
c Property management income was SEK 254 million (207)
c Changes in value on properties were SEK 104 million (-33)
c Changes in value on financial instruments were SEK 21 million (-57)
c Earnings per share were SEK 4.11 (1.16)
PROFIT FOR THE PERIOD, SEKm
2015 6 months
Jan-Jun
2014 6 months
Jan-Jun
2014 12 months
Jan-Dec
Rental income 647 649 1,291
Other revenue 10 10 21
Operating and central costs -297 -311 -608
Net financial items -106 -141 -283
Property management income 254 207 421
Changes in value of properties and derivatives 125 -90 -29
Current tax -12 -5 -10
Deferred tax -64 -27 -80
Profit after tax 303 85 302
Surplus ratio, % 58.8 58.0 59.0
Occupancy rate, % 88.4 89.5 89.2
Equity ratio, % 27.3 26.0 27.3
Loan-to-value ratio, properties, % 61.2 63.9 62.9
Equity per share, SEK 46.3 42.1 45.0
OVERVIEW OF THE PERIOD
JANUARY-JUNE 2015
FOR FURTHER INFORMATION, PLEASE CONTACT
Knut Rost, CEO, tel +46 (0)770-33 22 00, +46 (0)70-555 89 33, [email protected]
Rolf Larsson, CFO, tel +46 (0)770-33 22 00, +46 (0)70-666 14 83, [email protected]
Cover: Daniel Viklund, caretaker, Sundsvall. This page: Pantbanken 1, Östersund.
DIÖS FASTIGHETER AB INTERIM REPORT JANUARY–JUNE 2015 3
With our clear focus on northern Sweden’s growth cities, and on acquisitions and investments in our existing property portfolio, we have continued to strengthen our position as a market-leading player in the property industry.
CEO’S REVIEWc c c
FOR FURTHER INFORMATION, PLEASE CONTACT
Knut Rost, CEO, tel +46 (0)770-33 22 00, +46 (0)70-555 89 33, [email protected]
Rolf Larsson, CFO, tel +46 (0)770-33 22 00, +46 (0)70-666 14 83, [email protected]
Our adopted strategy of targeting a more concentrated market, maintaining a high level of investment in conversion and extension projects, a strong emphasis on tenant relations and a clearer organisational structure is having positive effects. Our income from property management for the period was SEK 254 million (207) and the surplus ratio 58.8 per cent (58.0).
During the period we invested SEK 215 million in conversion and extension projects. Our single largest project, Centralpalatset, a new mixed-used property in central Östersund, opened in May. All commercial and residential space in the building had been fully let even before the opening.
We are seeing increased demand for centrally located premises in our growth locations as well as rising rent levels. During the period we concluded several strategically important contracts for extensions to and expansions of existing leases, notably with Sweco in Luleå and the Swedish Migration Board in Sundsvall. The organisational changes that were implemented at the beginning of the year are starting to have an impact. Longer-term, these changes will have a positive impact on net leasing. Net leasing for the period was SEK 14 million (20) and the occupancy rate was 88.4 per cent (89.5).
The implemented changes to the company’s capital structure and conditions are having positive effects in the form of a reduced cost of capital and continued improvement in our financial key ratios. The loan-to-value ratio for the period was 61.2 per cent (63.9) and the equity ratio 27.3 per cent (26.0). In May we participated in a third securities issue under the Nya Svensk Fastighetsfinansiering AB (Nya SFF) partnership, issuing a SEK 500 million two-year covered bond with a fixed annual interest rate of 0.4375 per cent.
I am confident that our adopted strategy will ensure sustainable growth over time. By maintaining a high pace in our conversion and extension work, we can offer improved flexibility and customised solutions for our tenants. This, coupled with hard-working employees who have a good knowledge about our tenants and our local sub-market, gives us every opportunity to be even more active and become an even more sought-after landlord.
Knut Rost, CEO
KNUT ROST, CEO
CONTINUED STABLE PERFORMANCE

DIÖS FASTIGHETER AB INTERIM REPORT JANUARY–JUNE 20154 Jenny Svensson, property manager, Sundsvall.

DIÖS FASTIGHETER AB INTERIM REPORT JANUARY–JUNE 2015 5
Property management income for the period, i.e. income excluding changes in value and tax, was SEK 254 million (207).
The operating surplus was SEK 380 million (376), representing a surplus ratio of 58.8 per cent (58.0). The improved surplus ratio is primarily due to reduced property costs.
– Rental income for the reporting period was SEK 647 million (649), representing an economic occupancy rate of 88.4 per cent (89.5).
– Other property management income totalled SEK 10 million (10) and consisted mainly of re-billing to tenants regarding work carried out in leased premises.
– Total property costs were SEK 277 million (283). The reduction in costs is chiefly attributable to lower tariff-based costs and reduced repair work. Of total property costs, SEK 3.2 million (3.7) refers to work in leased premises that is re-billed to tenants.
CHANGES IN VALUE OF PROPERTIES AND DERIVATIVESA valuation of all properties was conducted in the period. Diös’ valuation model is based on an exterior valuation of 25 per cent of the 100 properties with the highest value every quarter on a rolling basis and an interior valuation of the remaining 75 per cent of the properties. Internal valuations are carried out quarterly on other properties and the quality is assessed by external valuers. The positive change in value is attributable to improved cash flows and a lower required rate of return. The valuation shows an increase of 0.8 per cent (-0.3), which is equivalent to SEK 100 million (-33). At 30 June the market value was SEK 12,498 million (11,970).
During the period one property (3) was sold and one property was partially sold, resulting in a realised change in value before tax of SEK 3.8 million (0.3).
The derivatives portfolio has been valued at the present value of future cash flows. If the contracted interest rate deviates from the market rate, a theoretical fair value gain or loss arises on the interest rate derivatives. The change in value is of a reporting nature and does not affect the cash flow.
Due to the low interest rate environment, we have recognised a fair value loss on the interest rate derivatives As long as interest rates remain low the value of the derivatives portfolio will be negative, but as market interest rates go up so will the value of the portfolio, resulting in positive changes in value in the income statement and thus also an increase in equity. The market value of the derivatives is always zero upon maturity.
During the period, unrealised changes in value on Diös’ derivatives totalled SEK 21 million (-57), which have been fully recognised in the income statement. The change in the derivatives’ market values is attributable to a long-term forecast for higher interest rates.
NET FINANCIAL ITEMSNet financial items for the period were SEK -106 million (-141). The interest expense for the period, including expenses for interest-rate derivatives and loan commitments, represents borrowings at an average annual interest rate of 2.7 per cent (3.6). The average annual interest rate on interest-bearing liabilities based on the applicable terms and market interest rates at 30 June was 1.1 per cent (2.8).
PROFIT BEFORE TAXProfit before tax was SEK 379 million (117). The improved profit is mainly attributable to positive unrealised changes in value on properties and interest rate derivatives as well as a change in the net financial items.
PROFIT AFTER TAXProfit after tax was SEK 303 million (85). Current tax totalled SEK -12 million (-5). This is mainly attributable to tax in subsidiaries, which are not permitted to offset losses against Group contributions. The calculation of deferred tax has given rise to a deferred tax expense of SEK -64 million (-27).
Property management income for the second quarter, i.e. income excluding changes in value and tax, was SEK 153 million (114). The operating surplus was SEK 207 million (198), representing a surplus ratio of 63.9 per cent (60.6). The improved surplus ratio is primarily due to reduced property costs.
– Rental income for the second quarter was SEK 323 million (327), representing an economic occupancy rate of 88.3 per cent (89.6).
– Total property costs were SEK 123 million (133). The reduction in costs is chiefly attributable to lower tariff-based costs and reduced repair work
Net financial items for the second quarter were SEK -48 million (-71). The profit before tax was SEK 282 million (55) and the profit after tax SEK 228 million (41). Changes in the value of properties had a positive impact on earnings of SEK 102 million (-35) while changes in the market values of interest rate derivatives had a positive impact of SEK 27 million (-24). The positive change in value of the properties is attributable to improved cash flows and lower required rates of return. The change in the market values of derivatives is attributable to an expected future increase in interest rates. Negative deferred tax of SEK -45 million (-11) and current tax of SEK -9 million (-3) were recorded in the income statement.
In the second quarter one property (0) was sold, resulting in a net realised change in value of SEK 1.2 million (0).
REVENUE, EXPENSES AND RESULTS, JANUARY–JUNE 2015c c c
SECOND QUARTER OF 2015c c c

DIÖS FASTIGHETER AB INTERIM REPORT JANUARY–JUNE 20156
Diös owned 353 properties in 15 locations, from Borlänge in the south to Luleå in the north. The total leasable area was 1,420,228 square metres and the economic occupancy rate, based on concluded leases at 30 June, 89.1 per cent. Diös invested SEK 215 million in the construction, extension and conversion of premises over the period. In terms of value, the largest share of the portfolio is property in Gävle, Sundsvall and Östersund. The total market value of the properties was SEK 12,498 million.
PROPERTY PORTFOLIO AT 30 JUNE 2015c c c
Figures refer to SEK millions unless otherwise indicated.
By business area Dalarna GävleborgVäster-
norrland JämtlandVäster- botten
Norr- botten
Diös Group
Rental income 131 96 124 149 73 75 647
Other revenue 1 2 5 0 0 2 10
Repair and maintenance -9 -5 -9 -9 -5 -4 -41
Tariff-based costs -19 -13 -20 -26 -11 -7 -96
Property tax -6 -5 -6 -7 -4 -4 -32
Other property costs -15 -11 -18 -17 -8 -9 -78
Property management -5 -4 -7 -6 -3 -5 -31
Operating surplus 78 60 69 84 42 48 380
Undistributed items
Central administration - - - - - - -20
Net financial items - - - - - - -106
Property management income - - - - - - 254
74 58 78 41 48
Changes in value
Property, realised - 2 - 1 - - 4
Property, unrealised 17 26 -5 -8 23 46 100
Interest rate derivatives - - - - - - 21
Profit before tax - - - - - - 379
Current tax - - - - - - -12
Deferred tax - - - - - - -64
Non-controlling interests - - - - - - 4
Profit for period attributable to shareholders of the parent
- - - - - - 307
Leasable area, sq.m 266,682 250,733 279,187 326,520 177,031 120,075 1,420,228
Construction, extension,
conversion investments, SEKm 40 18 30 60 28 39 215
Carrying amount, SEKm 2,555 1,789 2,262 2,927 1,385 1,581 12,498
Rental value, SEKm 146 109 145 168 81 83 732
Economic occupancy rate, % 89.2 88.0 85.7 88.8 89.2 90.8 88.4
Surplus ratio, % 59.8 62.7 55.3 56.1 57.9 63.8 58.8

DIÖS FASTIGHETER AB INTERIM REPORT JANUARY–JUNE 2015 7
Diös owned 362 properties in 15 locations, from Borlänge in the south to Luleå in the north. The total leasable area was 1,433,108 square metres and the economic occupancy rate, based on concluded leases at 30 June, 89.5 per cent. Diös invested SEK 177 million in the construction, extension and conversion of premises over the period. In terms of value, the largest share of the portfolio is property in Gävle, Sundsvall and Östersund. The total market value of the properties was SEK 11,970 million.
PROPERTY PORTFOLIO AT 30 JUNE 2014c c c
Figures refer to SEK millions unless otherwise indicated.
By business area Dalarna GävleborgVäster-
norrland JämtlandVäster- botten
Norr- botten
Diös Group
Rental income 125 97 132 146 74 74 649
Other revenue 2 0 3 2 0 2 10
Repair and maintenance -13 -5 -9 -10 -5 -4 -45
Tariff-based costs -19 -13 -21 -27 -11 -8 -99
Property tax -6 -5 -7 -7 -4 -4 -32
Other property costs -13 -9 -18 -18 -8 -8 -74
Property management -5 -4 -7 -8 -3 -5 -32
Operating surplus 71 61 74 79 43 48 376
Undistributed items
Central administration - - - - - - -28
Net financial items - - - - - - -141
Property management income - - - - - - 207
74 58 41 48
Changes in value
Property, realised - - - - - - 0
Property, unrealised -23 21 15 -40 -8 1 -33
Interest rate derivatives - - - - - - -57
Profit before tax - - - - - - 117
Current tax - - - - - - -5
Deferred tax - - - - - - -27
Non-controlling interests - - - - - - 2
Profit for period attributable to shareholders of the parent
- - - - - - 86
Leasable area, sq.m 266,682 253,509 280,351 335,460 177,031 120,075 1,433,108
Construction, extension,
conversion investments, SEKm 37 20 24 59 15 22 177
Carrying amount, SEKm 2,450 1,738 2,228 2,798 1,310 1,446 11,970
Rental value, SEKm 138 109 149 168 81 80 725
Economic occupancy rate, % 90.4 89.3 88.7 87.2 91.3 92.3 89.5
Surplus ratio, % 57.1 63.1 56.2 53.9 58.0 64.5 58.0

DIÖS FASTIGHETER AB INTERIM REPORT JANUARY–JUNE 20158
BUSINESS AREASc c c
Diös is northern Sweden’s largest private property company and a market leader in several of the localities in which it operates. The company’s market, which stretches from Borlänge in the south to Luleå in the north, is divided into the business areas Dalarna, Gävleborg, Västernorrland, Jämtland, Västerbotten and Norrbotten.
The portfolio comprises a well balanced mix of residential, office, retail and industrial space with a range of small and large premises, creating wide scope to offer flexible solutions. We have a decentralised property management organisation with a strong local base.
FALUN
BORLÄNGE
DALARNA
GÄVLEBORG
GÄVLE
MORA
TENANTNo.
contracts
Annual contract value,
SEK ‘000
Share of total contract
value, %*
Average contract term,
years
Public Employment Service 8 7,417 4.0% 2.2
Swedish Transport Administration 3 6,977 3.8% 3.2
Internationella Engelska Skolan 2 5,653 3.0% 8.3
Gavlefastigheter Gävle Kommun 7 4,183 2.3% 1.8
Åhléns 3 2,909 1.6% 1.3
Total, largest tenants 23 27,139 14.6% 3.6
GÄVLEBORG - LARGEST TENANTS
TENANTNo.
contracts
Annual contract value,
SEK ‘000
Share of total contract
value, %*
Average contract
term, years
Swedish Transport Administration 4 39,968 15.4% 5.0
Municipality of Falun 8 18,003 7.0% 2.8
Swedish Police Authority 8 10,013 3.9% 4.1
Pysslingen Förskolor och Skolor 1 8,335 3.2% 9.1
County Administrative Board of Dalarna 13 7,741 3.0% 4.5
Total, largest tenants 34 84,060 32.5% 4.8
DALARNA - LARGEST TENANTS
*In relation to the annual contract value for each business area.
*In relation to the annual contract value for each business area.
ANDEL AV TOTALT FASTIGHETSVÄRDE
Dalarna, 21%
Övriga affärs-områden, 79%
YTFÖRDELNING PER LOKALSLAG
Kontor, 46%
Industri/lager, 15%
Butik, 24%
Bostäder, 5%
Övrigt, 10%
ANDEL AV TOTALT FASTIGHETSVÄRDE
Gävleborg, 14%
Övriga affärs-områden, 86%
YTFÖRDELNING PER LOKALSLAG
Kontor, 30%
Industri/lager, 38%
Butik, 20%
Bostäder, 5%
Övrigt, 7%
PROPERTY HOLDINGS
No. of properties 44
Area, ‘000 sq.m 267
Property value, SEKm 2,555
Operating surplus, SEKm 78
Surplus ratio, % 60
PROPERTY HOLDINGS
No. of properties 51
Area, ‘000 sq.m 251
Property value, SEKm 1,789
Operating surplus, SEKm 60
Surplus ratio, % 63
SHARE OF TOTAL CONTRACT VALUE
Office 46%Industrial/warehouse 15%Retail 24%Residential 5%Other 10%
Dalarna 20%Other businessareas, 80%
FLOOR AREA BY TYPE OF PREMISES
SHARE OF TOTAL CONTRACT VALUE
FLOOR AREA BY TYPE OF PREMISES
Office 30%Industrial/warehouse 38%Retail 20%Residential 4%Other 8%
Gävleborg 14%Other businessareas, 86%
FASTIGHETSBESTÅNDET PER DEN 31 MARS 2015
Kontor, 40%
Industri/lager, 21%
Butik, 19%
Bostäder, 12%
Övrigt, 8%
PROPERTY PORTFOLIO AT 30 JUNE 2015
Office 40%
Industrial/warehouse 21%
Retail 20%
Residential 11%
Other 8%

DIÖS FASTIGHETER AB INTERIM REPORT JANUARY–JUNE 2015 9
VÄSTERNORRLAND
HÄRNÖSAND
SUNDSVALL
SHARE OF TOTAL CONTRACT VALUE
FLOOR AREA BY TYPE OF PREMISESOffice 50%Industrial/warehouse 16%Retail 19%Residential 10%Other 5%
Västernorrland 18%Other businessareas, 82%
TENANTNo.
contracts
Annual contract value,
SEK ‘000
Share of total contract
value, %*
Average contract
term, years
Norrlidens Kunskapscentrum 1 7,014 2.9% 1.0
Länsförsäkringar Västernorrland 17 5,703 2.4% 4.6
Com Hem AB 4 5,224 2.2% 1.5
Municipality of Sundsvall 12 4,675 1.9% 2.5
Åhléns 1 4,528 1.9% 3.3
Total, largest tenants 35 27,144 11.3% 2.5
VÄSTERNORRLAND LARGEST TENANTS
*In relation to the annual contract value for each business area.
PROPERTY HOLDINGS
No. of properties 78
Area, ‘000 sq.m 279
Property value, SEKm 2,262
Operating surplus, SEKm 69
Surplus ratio, % 55
ANDEL AV TOTALT FASTIGHETSVÄRDE
Västernorrland, 18%
Övriga affärs-områden, 82%
YTFÖRDELNING PER LOKALSLAG
Kontor, 50%
Industri/lager, 16%
Butik, 19%
Bostäder, 10%
Övrigt, 5%
JÄMTLAND
ÅRE
ÖSTERSUND
TENANTNo.
contracts
Annual contract value,
SEK ‘000
Share of total contract
value, %*
Average contract
term, years
Municipality of Östersund 105 26,719 9.0% 4.5
Region Jämtland Härjedalen 18 11,382 3.8% 2.5
SkiStar AB 10 11,233 3.8% 0.6
Swedbank AB 7 7,421 2.5% 2.1
Public Employment Service 3 7,048 2.4% 3.2
Total, largest tenants 143 63,803 21.6% 3.0
JÄMTLAND - LARGEST TENANTS
*In relation to the annual contract value for each business area.
ANDEL AV TOTALT FASTIGHETSVÄRDE
Jämtland, 24%
Övriga affärs-områden, 76%
YTFÖRDELNING PER LOKALSLAG
Kontor, 29%
Industri/lager, 16%
Butik, 14%
Bostäder, 27%
Övrigt, 14%
PROPERTY HOLDINGS
No. of properties 121
Area, ‘000 sq.m 327
Property value, SEKm 2,927
Operating surplus, SEKm 84
Surplus ratio, % 56
SHARE OF TOTAL CONTRACT VALUE
FLOOR AREA BY TYPE OF PREMISES
Office 29%Industrial/warehouse 16%Retail 15%Residential 26%Other 14%
Jämtland 24%Other businessareas, 76%

DIÖS FASTIGHETER AB INTERIM REPORT JANUARY–JUNE 201510
CONT. BUSINESS AREASc c c
VÄSTERBOTTEN
Umeå
NORRBOTTEN
SKELLEFTEÅ
UMEÅ
LULEÅ
TENANTNo.
contracts
Annual contract value,
SEK ‘000
Share of total contract
value, %*
Average contract
term, years
Municipality of Umeå 9 6,952 4.8% 1.7
PostNord Sverige AB 3 3,927 2.7% 0.9
Swedbank AB 1 3,694 2.5% 2.5
Balticgruppen Centrumhandel AB 4 3,602 2.5% 0.5
Åhléns AB 1 2,703 1.9% 3.0
Total, largest tenants 18 20,878 14.3% 1.6
VÄSTERBOTTEN - LARGEST TENANTS
TENANTNo.
contracts
Annual contract value,
SEK ‘000
Share of total contract
value, %*
Average contract
term, years
Municipality of Luleå 7 10,897 7.3% 2.3
Swedish Customs IT Department 3 7,297 4.9% 1.7
Swedbank AB 3 6,195 4.1% 3.7
Folksam ömsesidig sakförsäkring 18 5,949 4.0% 6.1
SWECO Sverige AB 6 5,308 3.5% 3.6
Total, largest tenants 37 35,646 23.8% 3.3
NORRBOTTEN - LARGEST TENANTS
*In relation to the annual contract value for each business area.
*In relation to the annual contract value for each business area.
ANDEL AV TOTALT FASTIGHETSVÄRDE
Västerbotten, 11%
Övriga affärs-områden, 89%
YTFÖRDELNING PER LOKALSLAG
Kontor, 32%
Industri/lager, 28%
Butik, 22%
Bostäder, 13%
Övrigt, 5%
ANDEL AV TOTALT FASTIGHETSVÄRDE
Norrbotten, 12%
Övriga affärs-områden, 88%
YTFÖRDELNING PER LOKALSLAG
Kontor, 62%
Industri/lager, 12%
Butik, 19%
Bostäder, 3%
Övrigt, 4%
PROPERTY HOLDINGS
No. of properties 41
Area, ‘000 sq.m 177
Property value, SEKm 1,385
Operating surplus, SEKm 42
Surplus ratio, % 58
PROPERTY HOLDINGS
No. of properties 18
Area, ‘000 sq.m 120
Property value, SEKm 1,581
Operating surplus, SEKm 48
Surplus ratio, % 64
SHARE OF TOTAL CONTRACT VALUE
FLOOR AREA BY TYPE OF PREMISES
Office 32%Industrial/warehouse 28%Retail 22%Residential 13%Other 5%
Västerbotten 11%Other businessareas, 89%
SHARE OF TOTAL CONTRACT VALUE
FLOOR AREA BY TYPE OF PREMISES
Office 62%Industrial/warehouse 12%Retail 19%Residential 3%Other 4%
Norrbotten 13%Other businessareas, 87%
DIÖS FASTIGHETER AB INTERIM REPORT JANUARY–JUNE 2015 11
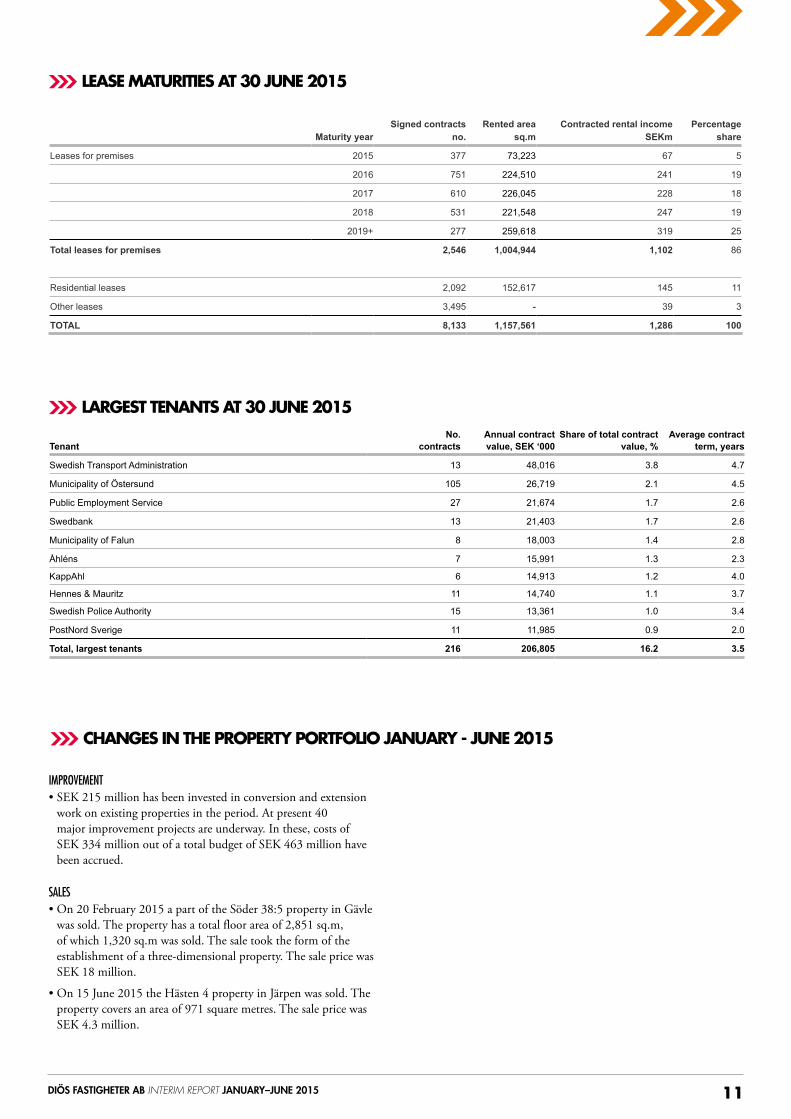
IMPROVEMENT • SEK 215 million has been invested in conversion and extension
work on existing properties in the period. At present 40 major improvement projects are underway. In these, costs of SEK 334 million out of a total budget of SEK 463 million have been accrued.
SALES • On 20 February 2015 a part of the Söder 38:5 property in Gävle
was sold. The property has a total floor area of 2,851 sq.m, of which 1,320 sq.m was sold. The sale took the form of the establishment of a three-dimensional property. The sale price was SEK 18 million.
• On 15 June 2015 the Hästen 4 property in Järpen was sold. The property covers an area of 971 square metres. The sale price was SEK 4.3 million.
Signed contracts Rented area Contracted rental income Percentage Maturity year no. sq.m SEKm share
Leases for premises 2015 377 73,223 67 5
2016 751 224,510 241 19
2017 610 226,045 228 18
2018 531 221,548 247 19
2019+ 277 259,618 319 25
Total leases for premises 2,546 1,004,944 1,102 86
Residential leases 2,092 152,617 145 11
Other leases 3,495 - 39 3
TOTAL 8,133 1,157,561 1,286 100
LEASE MATURITIES AT 30 JUNE 2015c c c
CHANGES IN THE PROPERTY PORTFOLIO JANUARY - JUNE 2015c c c
LARGEST TENANTS AT 30 JUNE 2015c c c
TenantNo.
contractsAnnual contract value, SEK ‘000
Share of total contract value, %
Average contract
term, years
Swedish Transport Administration 13 48,016 3.8 4.7
Municipality of Östersund 105 26,719 2.1 4.5
Public Employment Service 27 21,674 1.7 2.6
Swedbank 13 21,403 1.7 2.6
Municipality of Falun 8 18,003 1.4 2.8
Åhléns 7 15,991 1.3 2.3
KappAhl 6 14,913 1.2 4.0
Hennes & Mauritz 11 14,740 1.1 3.7
Swedish Police Authority 15 13,361 1.0 3.4
PostNord Sverige 11 11,985 0.9 2.0
Total, largest tenants 216 206,805 16.2 3.5

DIÖS FASTIGHETER AB INTERIM REPORT JANUARY–JUNE 201512
In the period, Diös’ average interest-bearing liabilities amounted to SEK 7,661 million (7,655). The actual interest expense, including expenses related to undrawn credit facilities and the performance of financial instruments, amounted to SEK 104 million (137), which
represents an average annual interest rate of 2.7 per cent (3.6). During the period, unrealised changes in value arising on derivatives held totalled SEK 21 million (-57), which are fully recognised in the income statement.
EQUITY AND EQUITY RATIOShareholders’ equity was SEK 3,455 million (3,148) and the equity ratio 27.3 per cent (26.0). The target is an equity ratio of 25 per cent in the short term and 30 per cent over the longer term.
CASH AND CASH EQUIVALENTSConsolidated cash and cash equivalents were SEK 0 million (0) at the end of the period and drawn overdraft facilities were SEK 186 million (70).
INTEREST-BEARING LIABILITIES AND AVERAGE INTEREST RATE AT 30 JUNE 2015The Group’s interest-bearing liabilities totalled SEK 7,650 million (7,646) with an average annual interest rate of 1.1 per cent (2.8), including loan commitments. The loans had an average fixed-rate term of 3.5 months (2.9). The average interest rate commitment period was 1.2 years (1.7) when the impact of the derivative portfolio is included. The average maturity was 1.8 years (1.6). Of the Group’s total interest-bearing liabilities, SEK 4,200 million (4,200) is hedged through derivatives. The average remaining term is 1.6 years (2.6). The average annual interest rate, including costs related to derivatives, amounted to 2.5 per cent (3.6), including loan
commitments. Diös’ financial instruments restrict any impact from increased interest rates on the company’s average borrowing rate. If interest rates had been increased by 1 percentage point as of 30 June 2015, Diös’ average interest rate would have risen by 0.4 percentage points (0.4). The market value of the derivative portfolio on 30 June 2015 was SEK -177 million (-164) and the weighted average annual interest rate was 2.4 per cent (2.4). With a derivatives portfolio of SEK 4,200 million and fixed-rate bonds of SEK 500 million, 61.4 per cent cent (54.9) of the Group’s total outstanding loans are covered by interest rate hedges.
Amount, SEKm Cost, SEKm Weighted average
interest rate, %
Interest-bearing liability 7,661 56 1.5
Undrawn credit facility 1 553 1 0.0
Cost of financial instruments 4,200 47 1.2
TOTAL 104 2.7
Interest rate and margin expiration Loan maturity
Maturity year Loan amount, SEKm Average annual interest rate1, % Credit agreements, SEKm Drawn2, SEKm
2015 849 1.0 926 849
2016 4,063 1.0 2,658 2,358
2017 2,737 1.1 3,238 2,737
2018 - - 1,705 1,705
Drawn credit facilities 7,650 1.0 8,527 7,650
Undrawn credit facilities 877 0.1
Financial instruments 4,200 1.4
TOTAL 2.5
² Of which SEK 500 million is financed through bond loans.
Average maturity 1.8 years
Average fixed-rate term 1.2 years
FINANCIAL POSITION AT 30 JUNE 2015c c c
INTEREST EXPENSE JANUARY–JUNE 2015c c c
INTEREST RATES AND LOAN MATURITY AT 30 JUNE 2015c c c
1 The impact of costs related to undrawn credit facilities on the average annual interest rate is 0.03 percentage points.
DERIVATIVE CONTRACTS
Counterparty Nominal value, SEKm Remaining maturity, years Interest rate level, % Market value, SEKm
Handelsbanken 2,000 1.2 2.3 -60
Handelsbanken 600 3.2 3.7 -65
Swedbank 1,600 1.6 1.9 -52
TOTAL 4,200 1.6 2.4 -177
It is Diös’ view that the interest rate market is stable and the company has thus not entered into any new derivative contracts in the period.
1 Average annual interest rate refers to the average interest rate based on interest rate terms and the outstanding debt at 31 June 2015, with STIBOR-90 as reference rate.

DIÖS FASTIGHETER AB INTERIM REPORT JANUARY–JUNE 2015 13
Diös Fastigheter AB had 9,004 shareholders (5,997) on 31 May. A significant proportion, 82.9 per cent (89.7), of the shareholders were in Sweden. The largest single shareholder of Diös was AB Persson Invest with a stake of 15.4 per cent (15.4). The ten largest shareholders accounted for 63.2 per cent (65.0) of the shares and votes.
Diös Fastigheter AB is a publicly traded company listed on the NASDAQ OMX Nordic Exchange Stockholm, Mid Cap list. The ticker symbol is DIOS and the ISIN code SE0001634262.
The number of shares in Diös on 30 June 2015 was 74,729,134 (74,729,134). The closing price of SEK 53.25 (58.5) gave the company a stock market value of SEK 3,979 million (4,372).
The graph shows Diös’ share price performance and the indexes for the past 12 months. Over the past 12 months Diös has gained -9.0 per cent (56.4), compared with a gain of 12.0 per cent for the OMX Stockholm 30 Index (19.6) and 12.4 per cent for the OMX Stockholm Real Estate PI (35.9). In the past 12 months Diös’ total return (return including reinvested dividends) was -4.2 per cent (63.3).
SHAREHOLDER No. of shares
Shareholding and
votes, %
AB Persson Invest 11,499,691 15.4
Brinova Inter 7,830,754 10.5
Bengtssons Tidnings Aktiebolag 7,518,222 10.1
Länsförsäkringar Fondförvaltning 7,387,452 9.9
Pensionskassan SHB Försäkringsförening 4,498,239 6.0
Försäkringsaktiebolaget, Avanza Pension 2,249,811 3.0
SEB Investment Management 1,992,842 2.7
Fourth AP Fund 1,868,660 2.5
Staffan Rasjö 1,263,846 1.7
Ssb Client Omibus Ac Om07 (15pct) 1,146,402 1.5
Total, largest shareholders 47,255,919 63.2
Other shareholders 27,473,215 36.8
TOTAL 74,729,134 100.0
SHARE-HOLDING
No. of share-holders
No. of shares
Holding (%)
Votes (%)
Market value (SEKm)
1 - 500 5,978 898,482 1.2 1.2 53
501 - 1,000 1,255 1,073,501 1.4 1.4 63
1,001 - 5,000 1,326 3,099,869 4.2 4.2 182
5,001 - 10,000 191 1,444,340 1.9 1.9 85
10,001 - 15,000 46 575,558 0.8 0.8 34
15,001 - 20,000 38 694,515 0.9 0.9 41
20,001 - 170 66,942,869 89.6 89.6 3,933
TOTAL 9,004 74,729,134 100.0 100.0 4,390
DATE Event Increase in number of shares Increase in share capital, SEK Total number of shares Total share capital Par value
1 Jan 2005 At the start of the period - - 10,000 100,000 10.00
21 Jun 2005 Split 990,000 - 1,000,000 100,000 0.10
21 Jun 2005 New issue 1,489,903 148,990 2,489,903 248,990 0.10
14 Sep 2005 Non-cash issue 1,503,760 150,376 3,993,663 399,366 0.10
2 Jan 2006 Bonus issue - 39,537,264 3,993,663 39,936,630 10.00
2 Jan 2006 Split 15,974,652 - 19,968,315 39,936,630 2.00
18 May 2006 New issue 8,333,400 16,666,800 28,301,715 56,603,430 2.00
11 Jul 2006 Non-cash issue 5,000,000 10,000,000 33,301,715 66,603,430 2.00
19 Apr 2007 Non-cash issue 666,250 1,332,500 33,967,965 67,935,930 2.00
29 Oct 2010 Non-cash issue 99,729 199,458 34,067,694 68,135,388 2.00
14 Dec 2010 New issue 3,285,466 6,570,332 37,353,160 74,705,720 2.00
17 Dec 2010 New issue 11,407 22,814 37,364,567 74,728,534 2.00
5 Dec 2011 New issue 22,854,136 45,708,272 60,218,703 120,436,806 2.00
14 Dec 2011 New issue 14,510,431 29,020,862 74,729,134 149,457,668 2.00
SHARE PRICE PERFORMANCEc c c
SHARE CAPITAL HISTORYc c c
LARGEST SHAREHOLDERS OF DIÖS FASTIGHETER AB AT 31 MAY 2015
c c c SHAREHOLDINGSAT 31 MAY 2015
c c c

DIÖS FASTIGHETER AB INTERIM REPORT JANUARY–JUNE 201514
c c c EMPLOYEES AND ORGANISATION The number of employees at 30 June 2015 was 149 (152), of whom 57 were women (54). Diös Fastigheter is geographically divided into the six business areas of Gävleborg, Dalarna, Västernorrland, Jämtland, Väster-botten and Norrbotten. The company’s head office and central Group functions are located in Östersund. Most of the employees, 107 (101) of them, work in the business areas, 53 (53) of them with the physical aspects of property management.
c c c PARENT COMPANYThe activities of the parent company consist of central Group functions as well as the ownership and operation of the Group’s subsidiaries. Sales to-talled SEK 65 million (63) and post-tax profit was SEK 8 million (8). Net sales refer chiefly to services sold to the Group’s subsidiaries. Cash and cash equivalents were SEK 0 million (33) at 30 June 2015 and drawn overdraft facilities were SEK 61 million (0). The change in parent company cash and cash equivalents and intercompany balances is attributable to a change in the Group’s liquidity account structure. External interest-bearing liabilities, excluding overdraft facilities, amounted to SEK 2,662 million (1,474). The average annual interest rate based on the situation at 30 June 2015 was 1.2 per cent (2.6). The parent company prepares its financial reports in compliance with RFR 2 Accounting for Legal Entities.
c c c DEFERRED TAXESIn April 2005 Diös’ original owners acquired a group consisting of dormant limited companies. The aim of the acquisition was to create a basis for the formation of the new property company. The only assets of the acquired companies at the time of acquisition were approximately SEK 40 million in cash and, according to the 2005 income tax returns, approximately SEK 1,026 million in unused tax losses carried forward.
The reported deferred tax liability was SEK 799 million (682) at 30 June 2015. The value of the deferred tax liability will be assessed at the end of each accounting period and, if necessary, re-valuation will be carried out.
Diös’ reported temporary differences, i.e. the properties’ fair values less tax residual values, amounted to SEK 3,800 million (3,365) at 30 June 2015. At a tax rate of 22.0 per cent, the deferred tax liability on tempo-rary differences was SEK 836 million (740).
Diös’ tax losses carried forward on 30 June 2015 are estimated at SEK 282 million (364). At a tax rate of 22.0 per cent, deferred tax asset relat-ing to tax losses carried forward was SEK 62 million (80), which in Diös’ financial statements has been offset against deferred tax liability. Other deferred tax liabilities were SEK 25 million (22) at 30 June 2015.
The change since 31 December 2014 is attributable to a decrease in deferred tax assets of SEK 12 million and an increase in deferred tax on temporary differences of SEK 52 million.
Accounts of taxes comply with accounting rules but note that the tax paid over a period generally differs from that reported. Tax regulations are also complex and difficult to interpret. The application of the regula-tions may also change over time.
c c c CURRENT TAX CASEOn 19 June Diös decided to appeal the ruling of the administrative court in the tax case concerning a claim for deduction of capital losses relating to the tax year 2006. The claim is based on a tax loss which arose in con-nection with an external acquisition of properties in 2005. The loss was an effect of transactions undertaken in connection with the acquisition with the aim of incorporating the properties in the Diös Group.
The conclusion in the analysis which Diös initiated based on the ruling of the administrative court is that the court has overlooked a number of important aspects and that the ruling is therefore incorrect. The compa-ny’s view is that the acquisitions concerned, which were made in 2005, were handled in accordance with the applicable tax rules. This view is shared by the company’s tax advisor, who has studied the acquisitions and the Tax Agency’s reasoning.
The total increase in the tax assessment under the ruling of the adminis-trative court is SEK 421 million. If Diös Fastigheter were to lose the case in the court of final instance, the company would incur an additional tax and interest charge of around SEK 136 million. Diös has applied for and been granted a reprieve on payment by the Tax Agency. No provisions have therefore been made in the company’s balance sheet.
On 16 June verbal negotiations were conducted at the Administrative Court of Appeal in Sundsvall. A ruling in the case is expected in Septem-ber 2015. The company maintains its previous assessment, and the total tax, including interest, is therefore still regarded as a contingent liability.See also the press releases from 20 and 21 May and 19 June 2014.
c c c SIGNIFICANT RISKS AND UNCERTAINTIESDiös Fastigheters’ principal risks and uncertainties are described in the 2014 annual report on pages 40-42. Apart from the following, there have not been any substantial changes to Diös’ risks and uncertainties. At its monetary policy meeting on 1 july the Riksbank decided to lower the repo rate to -0.35 per cent. The Riksbank also announced that it would buy a further SEK 45 billion in government bonds. Only in the second half of 2016 is it expected that the repo rate will be raised gradu-ally. On balance, this will help to ensure that funding costs for Swedish businesses and households remain low. According to the June 2015 edition of Swedish Economy, a publication of the National Institute of Economic Research (NIER), the Swedish economy has continued to recover although the first quarter of the year was slightly weaker than expected. The global recovery and the relatively weak krona are fuelling a recovery in Swedish exports after a several years of weak performance. Over the next two years exports are expected to grow by around 5 per cent annually. Swedish GDP is forecast to increase by 3 per cent in 2015 while unemployed is seen at 7.7 per cent. Thanks to Sweden’s strong public finances, healthy banks and growing GDP, the prospects for growth in our markets are deemed to be good. As our property operations continue to generate strong cash flows, we are seeing a stabilisation of the yield levels in the market valuation of our properties and our property values. These combined factors should strengthen property as an asset class.
c c c RELATED-PARTY TRANSACTIONSThere were no significant related party transactions in the period. Those related party transactions which did occur are deemed to have been concluded on market terms.
c c c ACCOUNTING PRINCIPLESDiös complies with EU-adopted IFRS standards and the interpretations of these (IFRIC). This interim report has been prepared in accordance with IAS 34, Interim Financial Reporting and the Swedish Annual Accounts Act. The report for the parent company has been prepared in accordance with RFR 2, Accounting for Legal Entities and the Swedish Annual Accounts Act. The accounting principles applied in the interim report are consistent with the accounting principles applied in preparing the consolidated financial statements and Annual Report for 2014, Note 1, with the exceptions indicated in the following. New and amended standards which entered into force in 2015 have not had any impact on the interim report.
IFRS 11 JOINT ARRANGEMENTSA joint arrangement is an arrangement of which two or more parties have joint control. A joint arrangement is classified as either a joint venture or a joint operation. Diös has assessed its joint arrangements and determined that its interest in Nya Svensk Fastighetsfinansiering AB constitutes a joint operation. The interest was acquired in the fourth quarter of 2014 and the company had no operations in the prior financial year. The interest was recognised at cost at 31 December 2014. Accounting for the interest in accordance with the principles for joint operations has, however, had no material impact on the consolidated financial statements.
In respect of its interest in the joint operation Diös has recognised its assets and liabilities (including its share of all joint assets and liabilities) as well as its revenue and expenses (including its share of all joint revenue and expenses).
The Group’s other joint arrangements constitute joint ventures and are accounted for in accordance with the equity method. Under the equity method, interests in joint ventures are recognised at cost in the balance sheet after adjusting for the Group’s share of the profit or loss of joint ventures after the acquisition date. Dividends received reduce the carry-ing amount of the interest.
¹ Annual Report 2014 is available at www.dios.se

DIÖS FASTIGHETER AB INTERIM REPORT JANUARY–JUNE 2015 15 Emma Dahlin, Accounts Officer, Östersund.

DIÖS FASTIGHETER AB INTERIM REPORT JANUARY–JUNE 201516
At least 50 per cent of the company’s profit after tax, excluding unrealised changes in value and deferred tax, should be distributed to the shareholders in the form of dividends.
There have been no significant events since the reporting date.
DIVIDEND POLICYc c c
EVENTS AFTER THE REPORTING PERIODc c c
The Board of Directors and Chief Executive Officer declare that the interim report gives a true and fair view of the company’s and Group’s operations, financial position and income, and describes the principal risks and uncertainties faced by the company and the companies in the Group. This interim report has not been subject to review by the company’s auditor.
Financial reports can be viewed in full on Diös’ website www.dios.se
Knut RostChief Executive Officer
Östersund, 06 July 2015
Bob PerssonChairman
Ragnhild BackmanBoard member
Anders BengtssonBoard member
Maud OlofssonBoard member
Svante PaulssonBoard member
Tomas MellbergBoard member
Employee representative

DIÖS FASTIGHETER AB INTERIM REPORT JANUARY–JUNE 2015 17
2015 3 mths
2014 3 mths
2015 6 mths
2014 6 mths
2014 12 mths
INCOME STATEMENT April-June April-June Jan-Jun Jan-Jun Jan-Dec
Rental income and other property management income 330 331 657 659 1,312
Property costs -123 -133 -277 -283 -550
Operating surplus 207 198 380 376 762
Central administration -61 -13 -201 -28 -58
Net financial items -48 -71 -106 -141 -283
Property management income 153 114 254 207 421
Change in value of properties 102 -35 104 -33 62
Change in value of interest rate derivatives 27 -24 21 -57 -91
Profit before tax 282 55 379 117 392
Current tax -9 -3 -12 -5 -10
Deferred tax -45 -11 -64 -27 -80
Profit after tax 228 41 303 85 302
Profit attributable to shareholders of the parent 232 40 307 86 297
Profit attributable to non-controlling interests -4 1 -4 -1 5
Total 228 41 303 85 302
STATEMENT OF COMPREHENSIVE INCOME
Profit after tax 228 41 303 85 302
Comprehensive income for the period 228 41 303 85 302
Comprehensive income attributable to shareholders of the parent 232 40 307 86 297
Comprehensive income attributable to non-controlling interests -4 1 -4 -1 5
Total 228 41 303 85 302
Profit per share after tax, SEK 3.10 0.54 4.11 1.16 3.97
Number of shares at end of period (thousands) 74,729 74,729 74,729 74,729 74,729
Average number of shares (thousands) 74,729 74,729 74,729 74,729 74,729
CONDENSED CONSOLIDATED INCOME STATEMENT AND STATEMENT OF COMPREHENSIVE INCOME, SEKM
c c c
1 The central administration item includes reversals of previous provisions for staff-related costs that were made in connection with the acquisition of Norrvidden.

DIÖS FASTIGHETER AB INTERIM REPORT JANUARY–JUNE 201518
ASSETS
2015
30 June
2014
30 June
2014
31 Dec
Non-current assets
Investment properties 12,498 11,970 12,200
Other property, plant and equipment 6 8 7
Intangible assets 4 4 4
Financial assets 9 9 7
Total non-current assets 12,517 11,991 12,218
Current assets
Current receivables 137 107 43
Cash and cash equivalents - - 79
Total current assets 137 107 122
TOTAL ASSETS 12,654 12,098 12,340
EQUITY AND LIABILITIES
Equity 3,455 3,148 3,365
Deferred tax liability 799 682 735
Non-current liabilities 7,652 7,648 7,673
Overdraft facilities 186 70 -
Current liabilities 562 550 567
TOTAL LIABILITIES AND EQUITY 12,654 12,098 12,340
Contingent liabilities 136 135 135
0.270 0.264
Equity
Attributable to shareholders
of the parentAttributable to
minority interests
Equity at 31 Dec 2013 3,235 3,216 19
Profit for the period after tax 85 86 -1
Comprehensive income for the period 85 86 -1
Cash dividend -172 -172 -
Equity at 30 Jun 2014 3,148 3,130 18
Profit for the period after tax 217 211 6
Comprehensive income for the period 217 211 6
Equity at 31 Dec 2014 3,365 3,341 24
Profit for the period after tax 303 307 -4
Comprehensive income for the period 303 307 -4
Cash dividend -213 -213 -
Equity at 30 Jun 2015 3,455 3,435 20
CONDENSED CONSOLIDATED BALANCE SHEET, SEKMc c c
CONDENSED STATEMENT OF CHANGES IN EQUITY, SEKMc c c

DIÖS FASTIGHETER AB INTERIM REPORT JANUARY–JUNE 2015 19
20153 months
2014 3 months
20156 months
20146 months
2014 12 mths
OPERATING ACTIVITIES April-June April-June Jan-Jun Jan-Jun Jan-Dec
Property management income 153 114 254 207 421
Adjustments for non-cash items 9 9 -13 -15 -
Tax paid -9 -3 -12 -5 -10
Operating cash flows before change in working capital 153 120 229 187 411
Changes in working capital
Decrease (+)/increase (-) in receivables -25 12 -94 -17 48
Decrease (-)/increase (+) in current liabilities -14 -35 5 -27 -37
Total change in working capital -39 -23 -89 -44 11
Operating cash flow 114 97 140 143 422
INVESTING ACTIVITIES
Investment in financial assets -2 - -2 - -
Proceeds from sale of property, plant and equipment 4 21 22 21 101
Acquisition of intangible assets - - - - -1
Purchases of property, plant and equipment -108 -114 -191 -165 -399
Investing cash flow -106 -93 -171 -144 -299
FINANCING ACTIVITIES
Dividends paid -213 -172 -213 -172 -172
Change in non-current liabilities -13 -16 -21 -18 7
Change in overdraft facility 67 701 186 701 -
Financing cash flow -159 -118 -48 -120 -165
Cash flow for the period -151 -114 -79 -121 -42
Cash and cash equivalents at beginning of period 151 114 79 121 121
Cash and cash equivalents at end of period 0 01 0 01 79
CONDENSED CONSOLIDATED CASH FLOW STATEMENT, SEKMc c c
1 Cash and cash equivalents at the end of the period have been reclassified to change in overdraft facility.

DIÖS FASTIGHETER AB INTERIM REPORT JANUARY–JUNE 201520
20153 months
April-June
20143 months
April-June
20156 months
Jan-Jun
20146 months
Jan-Jun
201412 months
Jan-Dec
Return on equity, % 6.7 1.3 9.0 2.7 9.0
Equity ratio, % 27.3 26.0 27.3 26.0 27.3
Loan-to-value ratio, properties, % 61.2 63.9 61.2 63.9 62.9
Interest coverage ratio, times 4.1 2.6 3.4 2.5 2.5
Equity per share, SEK 46.3 42.1 46.3 42.1 45.0
Net asset value (EPRA NAV) per share, SEK 59.5 54.0 59.5 54.0 57.9
Cash flow per share, SEK 1.9 1.5 3.3 2.7 5.5
Number of properties at end of period 353 362 353 362 354
Leasable area at end of period, sq.m. 1,420,228 1,433,108 1,420,228 1,433,108 1,422,519
Market value of properties, SEKm 12,498 11,970 12,498 11,970 12,200
Rental value, SEKm 365 365 732 725 1,448
Economic occupancy rate, % 88.3 89.6 88.4 89.5 89.2
Yield, % 1.6 1.7 3.0 3.1 6.2
Surplus ratio, % 63.9 60.6 58.8 58.0 59.0
KEY RATIOSc c c

DIÖS FASTIGHETER AB INTERIM REPORT JANUARY–JUNE 2015 21
2015 2014 20146 months 6 months 12 months
INCOME STATEMENT Jan-Jun Jan-Jun Jan-Dec
Net sales 65 63 118
Gross profit 65 63 118
Central administration -85 -82 -159
Operating profit -20 -19 -41
Financial income 123 86 147
Financial costs -95 -59 -115
Profit after financial items 8 8 -9
Current tax - - -
Profit after tax 8 8 -9
STATEMENT OF COMPREHENSIVE INCOME
Profit after tax 8 8 -9
Comprehensive income for the year 8 8 -9
Condensed parent company balance sheet, SEKm 2015 2014 2014ASSETS 30 June 30 June 31 Dec
Projects in progress - 1 1
Intangible assets 4 4 4
Machinery and equipment 2 2 2
Interests in Group companies 171 171 171
Non-current receivables from Group companies 7,802 3,416 7,390
Total non-current assets 7,979 3,594 7,568
Current receivables from Group companies 123 153 186
Other current receivables 11 7 13
Cash and cash equivalents - 33 145
Total current assets 134 193 344
TOTAL ASSETS 8,113 3,787 7,912
EQUITY AND LIABILITIES
Equity 1,048 1,270 1,253
Non-current liabilities to credit institutions 2,655 1,467 3,311
Non-current liabilities to Group companies 2,955 928 2,947
Current liabilities to credit institutions 7 7 7
Current liabilities to Group companies 1,355 85 365
Overdraft facilities 61 - -
Trade payables 1 - 1
Other current liabilities 31 30 28
Total current liabilities 1,455 122 401
TOTAL LIABILITIES AND EQUITY 8,113 3,787 7,912
CONDENSED PARENT COMPANY BALANCE SHEET, SEKMc c c
CONDENSED PARENT COMPANY INCOME STATEMENT AND STATEMENT OF COMPREHENSIVE INCOME, SEKM
c c c
1SEK 4 million has been reclassified between projects in progress and intangible assets for 31 March 2014.

DIÖS FASTIGHETER AB INTERIM REPORT JANUARY–JUNE 201522
RETURN ON EQUITYProfit for the period in relation to average equity. Average equity is calculated as the sum of the opening and closing balance divided by two.
EQUITY RATIOEquity divided by total assets at the end of the period.
LOAN-TO-VALUE RATIO, PROPERTIESInterest-bearing and other liabilities relating to properties divided by the carrying amount at the end of the period.
INTEREST COVERAGE RATIOProfit after financial items, excluding unrealised changes in value plus financial expenses, in relation to financial expenses during the period.
EARNINGS PER SHARE Profit for the period after tax, attributable to shareholders, divided by the average number of shares.
EQUITY PER SHAREEquity at the end of the period divided by the number of shares outstanding at the end of the period.
NET ASSET VALUE (EPRA NAV) PER SHAREEquity at the end of the period after reversal of interest rate derivatives and deferred tax in accordance with the balance sheet, divided by the number of outstanding shares at the end of the period.
CASH FLOW PER SHAREProfit before tax, adjusted for unrealised changes in value plus depreciation/amortisation less current tax, divided by the average number of shares.
AVERAGE NUMBER OF SHARES Number of shares outstanding at the beginning of the period, adjusted by the number of shares issued or withdrawn during the period weighted by the number of days that the shares were outstanding, in relation to the total number of days in the period.
NUMBER OF SHARES AT END OF PERIOD Actual number of shares outstanding at the end of the period.
RENTAL VALUERent at the end of the period plus addition for estimated market rent for unoccupied floor space.
NET LEASINGNet annual rent, excluding discounts and supplements, for newly signed, terminated and renegotiated contracts. No account is taken of the length of contracts.
ECONOMIC OCCUPANCY RATEThe rental income for the period divided by the rental value at the end of the period.
RENTAL INCOMERents invoiced for the period minus rent losses and rent discounts.
YIELDOperating surplus for the period divided by the properties’ market value at the end of the period.
SURPLUS RATIOOperating surplus for the period divided by the rental income for the period.
PROFIT FROM IMPROVEMENTSSale price minus capital invested.
DEFINITIONSc c c
CALENDAR 2015c c c
Q3 Interim report January-September 2015 23 October 2015
LIST OF PROPERTY TRANSACTIONS JANUARY–JUNE 2015c c c
Property Business area Municipality Category Area, sq.m.
SALES
Quarter 1
Söder 38:5 (part of property) Gävleborg Gävle Residential 1,320
Total property sales January-March 1,320
Quarter 2
Hästen 4 Jämtland Åre Residential 971
Total property sales April-June 971
Total property sales January-June 2,291

DIÖS FASTIGHETER AB INTERIM REPORT JANUARY–JUNE 2015 23Pantbanken 1, Östersund.

DIÖS FASTIGHETER AB INTERIM REPORT JANUARY–JUNE 201524
DIÖ
S KO
MM
UN
IKAT
ION
201
5, P
HO
TOG
RAPH
S: T
INA
STA
FRÉN
DIÖS FASTIGHETER AB (PUBL)RINGVÄGEN 4, BOX 188, SE-831 22 ÖSTERSUND, TEL: +46 (0)770 - 33 22 00 CRN: 556501-1771. REGISTERED OFFICE IN ÖSTERSUND. WWW.DIOS.SE