interim report january-june 2015 report q2 2015 i ramirent plc 1 ramirent’s january–june 2015...
TRANSCRIPT

Interim Report January-June 2015
Q2PERFORMANCE IMPROVING DUE TO HIGHER DEMAND AND EFFICIENCY ACTIONS

INTERIM REPORT Q2 2015 I RAMIRENT PLC 1
RAMIRENT’S JANUARY–JUNE 2015 INTERIM REPORT: PERFORMANCE IMPROVING DUE TO HIGHER DEMAND AND EFFICIENCY ACTIONS PERFORMANCE APRIL–JUNE 2015
• Net sales EUR 159.4 (151.8) million, up by 5.0% or by 6.9% at comparable exchange rates
• EBITDA EUR 46.0 (42.2) million or 28.9% (27.8%) of net sales
• EBITA EUR 21.0 (16.2) million or 13.2% (10.7%) of net sales
• EBITA excluding non-recurring items1) EUR 17.2 (16.2) million or 10.8% (10.7%) of net sales
• Profit for the period EUR 13.2 (7.1) million and EPS EUR 0.12 (0.07) 1) Non-recurring items includes a non-recurring income of 3.8 MEUR recognised from the settlement of earn-out in the weather shelter and scaffolding company DCC acquired in 2014.
PERFORMANCE JANUARY–JUNE 2015
• Net sales EUR 300.0 (289.3) million, up by 3.7% or by 6.2% at comparable exchange rates
• EBITDA EUR 74.6 (73.9) million or 24.9% (25.5%) of net sales
• EBITA EUR 25.2 (23.3) million or 8.4% (8.0%) of net sales
• EBITA excluding non-recurring items EUR 21.3 (23.3) million or 7.1% (8.0%) of net sales
• Profit for the period EUR 13.1 (9.7) million and EPS EUR 0.12 (0.09)
• Return on invested capital (ROI) on a rolling 12 months basis improved to 12.3% (11.9%)
• Return on equity (ROE) on a rolling 12 months basis was 11.5% (12.1%)
• Gross capital expenditure EUR 65.0 (101.8) million
• Cash flow after investments EUR −21.4 (−24.5) million
• Net debt EUR 297.1 (273.4) million and net debt to EBITDA was 1.8x (1.6x) (Figures in brackets, unless otherwise indicated, refer to the corresponding period a year earlier.)
RAMIRENT OUTLOOK FOR FULL YEAR 2015 UNCHANGED
Ramirent expects the market picture for 2015 to remain mixed, with challenging market conditions especially in Finland and Norway. We expect full-year 2015 net sales and EBITA margin to be similar to the level of 2014 when measured in local currencies.
INTERIM REPORT Q2 2015 I RAMIRENT GROUP 2
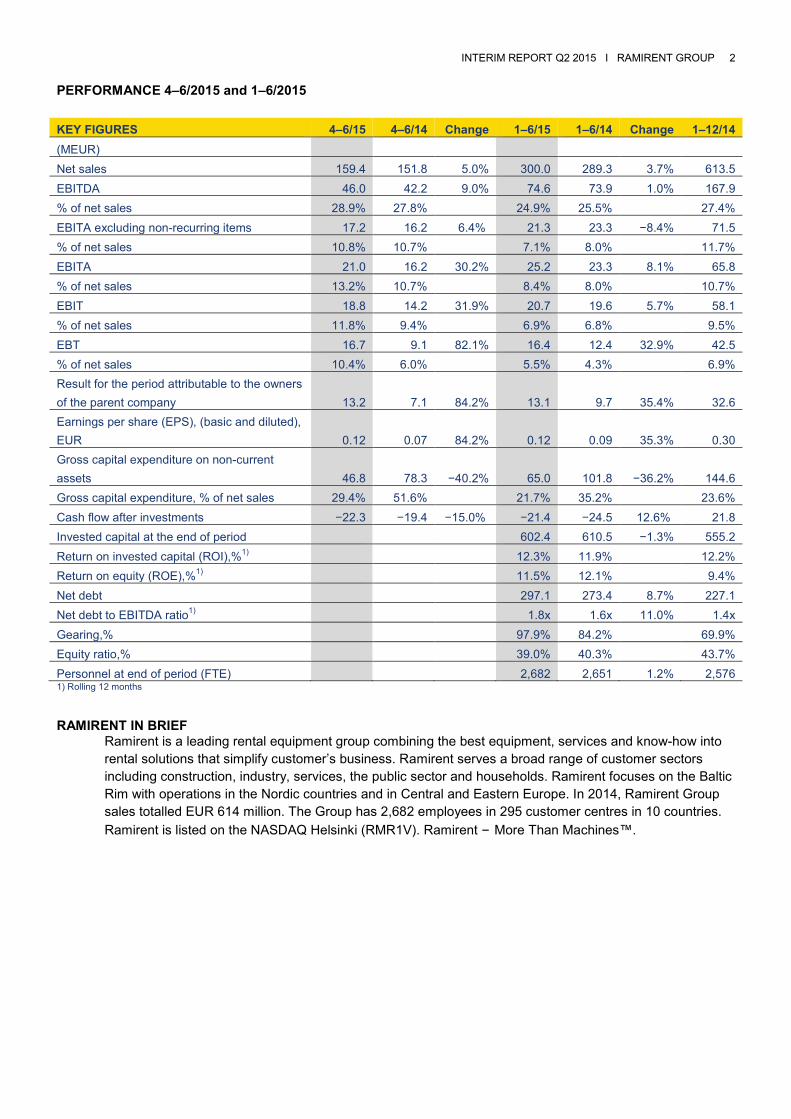
PERFORMANCE 4–6/2015 and 1–6/2015
KEY FIGURES 4–6/15 4–6/14 Change 1–6/15 1–6/14 Change 1–12/14 (MEUR) Net sales 159.4 151.8 5.0% 300.0 289.3 3.7% 613.5 EBITDA 46.0 42.2 9.0% 74.6 73.9 1.0% 167.9 % of net sales 28.9% 27.8% 24.9% 25.5% 27.4% EBITA excluding non-recurring items 17.2 16.2 6.4% 21.3 23.3 −8.4% 71.5 % of net sales 10.8% 10.7% 7.1% 8.0% 11.7% EBITA 21.0 16.2 30.2% 25.2 23.3 8.1% 65.8 % of net sales 13.2% 10.7% 8.4% 8.0% 10.7% EBIT 18.8 14.2 31.9% 20.7 19.6 5.7% 58.1 % of net sales 11.8% 9.4% 6.9% 6.8% 9.5% EBT 16.7 9.1 82.1% 16.4 12.4 32.9% 42.5 % of net sales 10.4% 6.0% 5.5% 4.3% 6.9% Result for the period attributable to the owners of the parent company 13.2 7.1 84.2% 13.1 9.7 35.4% 32.6 Earnings per share (EPS), (basic and diluted), EUR 0.12 0.07 84.2% 0.12 0.09 35.3% 0.30 Gross capital expenditure on non-current assets 46.8 78.3 −40.2% 65.0 101.8 −36.2% 144.6 Gross capital expenditure, % of net sales 29.4% 51.6% 21.7% 35.2% 23.6% Cash flow after investments −22.3 −19.4 −15.0% −21.4 −24.5 12.6% 21.8 Invested capital at the end of period 602.4 610.5 −1.3% 555.2 Return on invested capital (ROI),%1) 12.3% 11.9% 12.2% Return on equity (ROE),%1) 11.5% 12.1% 9.4% Net debt 297.1 273.4 8.7% 227.1 Net debt to EBITDA ratio1) 1.8x 1.6x 11.0% 1.4x Gearing,% 97.9% 84.2% 69.9% Equity ratio,% 39.0% 40.3% 43.7% Personnel at end of period (FTE) 2,682 2,651 1.2% 2,576 1) Rolling 12 months RAMIRENT IN BRIEF
Ramirent is a leading rental equipment group combining the best equipment, services and know-how into rental solutions that simplify customer’s business. Ramirent serves a broad range of customer sectors including construction, industry, services, the public sector and households. Ramirent focuses on the Baltic Rim with operations in the Nordic countries and in Central and Eastern Europe. In 2014, Ramirent Group sales totalled EUR 614 million. The Group has 2,682 employees in 295 customer centres in 10 countries. Ramirent is listed on the NASDAQ Helsinki (RMR1V). Ramirent – More Than Machines™.
INTERIM REPORT Q2 2015 I RAMIRENT GROUP 3
COMMENTS FROM CEO MAGNUS ROSÉN: “Overall the second quarter developed according to our expectations. Ramirent’s second-quarter net sales grew by 5.0% to EUR 159.4 million or 6.9% at comparable exchange rates. Second-quarter sales grew in all segments except for Norway. Demand improved topline especially towards the end of the quarter. After a weaker first quarter, our Group EBITA excluding non-recurring items improved somewhat to EUR 17.2 (16.2) million. The EBITA–margin was 10.8% (10.7%) for the second quarter and 7.1% (8.0%) for the first half. EBITA was supported by an increase in Customer Centre sales, progress in Solutions projects as well as good fixed cost control in the operations. We continue to focus on improving the profitability level. Our efficiency programme and work on the improvement agenda NextRamirent proceeded in the second quarter. We continued to develop our offering of solutions and value added services to sharpen differentiation. Among other things, we signed a letter of intent with NCC Roads to start exploring possibilities for closer cooperation in road and traffic safety. Our determined work on developing the common business platform targeted to drive efficiency and harmonise our operational model continued. We are seeing performance improving from implemented efficiency actions in particular the centralising of maintenance and repair operations, reduction of non-productive fleet and from establishing a shared service centre for financial services. In the quarter, we also continued enhancing pricing management procedures and improving fleet utilisation by developing the productivity of our supply chain management. As communicated earlier, the margin improvement stemming from these actions is expected to materialise mainly in 2016 and onwards. Sales growth accelerated in Sweden supported by high overall construction activity and our profitability improved as the large solution projects advanced. In Denmark, our activity levels picked up and cost reduction measures started to show results. Also in Europe Central, net sales picked up owing to an increase in construction of roads, industrial buildings and especially in Poland power plants. In Baltics, we saw continued strong performance supported by a healthy construction activity. In Norway, on the other hand, our performance weakened compared to the previous year due to
lower demand in residential construction as well as softness in the oil and gas sector. Demand in the Finnish market continued to be sluggish, except for Southern Finland where growth was supported by ongoing construction projects. As demand started to accelerate towards the end of the quarter, we expect overall demand to continue improving in the second half of the year in Sweden, Denmark, Europe East and Europe Central, whilst we expect challenging market conditions to prevail in Finland and Norway. Ramirent is on a journey of change moving from a product based company to a solutions and knowledge based company with the ambition to offer a unique customer experience. We will achieve this by continuing our determined work to achieve sustainable profitable growth, improve our differentiation developing complementary services for our customers and enhance our operational productivity creating a solid foundation for competitive operations also in the future.”

INTERIM REPORT Q2 2015 I RAMIRENT GROUP 4
MARKET REVIEW JANUARY–JUNE 2015 The market situation in the Finnish equipment rental market was strong in Southern Finland, while challenging market conditions continued in the rest of Finland mainly due to low construction activity. The Swedish equipment rental market remained strong in the second quarter fuelled by large ongoing construction projects and high activity in all construction sectors. In Norway, challenging market conditions for equipment rental continued in the second quarter especially due to slow growth outside infrastructure construction and uncertainty in the oil and gas sector. In Denmark, increased construction and industrial activity supported market recovery although price competition remained fierce in the market. The overall demand in the Baltics remained balanced supported by stable activity in the building construction sector. In Europe Central, market conditions were favourable supported by increased infrastructure construction and construction of industrial buildings. High uncertainty continued in Fortrent’s markets, Russia and Ukraine, due to the prolonged Ukrainian crisis. NET SALES 4–6/2015 Ramirent Group’s second–quarter net sales increased by 5.0%, amounting to EUR 159.4 (151.8)
million. At comparable exchange rates, the Group’s second–quarter net sales increased by 6.9%. Net sales increased in Finland by 1.0%, in Sweden by 16.6%, in Denmark by 17.2%, in Europe East by 4.1% and in Europe Central by 2.7% in the second quarter. Second–quarter net sales decreased in Norway by 8.4% compared to the previous year. 1–6/2015 Ramirent Group’s January–June net sales increased by 3.7%, amounting to EUR 300.0 (289.3) million. At comparable exchange rates, the Group’s first half net sales increased by 6.2%. On a rolling 12 months basis Group’s net sales amounted to EUR 624.2 (623.0), up by 0.2% or by 2.7% at comparable exchange rates compared to the previous year. In the first half of 2015, net sales increased in Finland by 1.1%, in Sweden by 14.6%, in Denmark by 7.2% and in Europe East by 4.9%. Net sales decreased in Norway by 8.6% and in Europe Central by 1.8% compared to the previous year. In January–June 2015, the geographical distribution of net sales was Sweden 35.8% (32.4%), Finland 23.7% (24.3%), Norway 20.6% (23.3%), Denmark 6.6% (6.4%), Europe East 5.0% (5.0%) and Europe Central 8.2% (8.7%).
Net sales development by segment was as follows: NET SALES 4–6/15 4–6/14 Change 1–6/15 1–6/14 Change 1–12/14 (MEUR) FINLAND 39.4 39.0 1.0% 71.5 70.6 1.1% 152.8 SWEDEN 56.8 48.7 16.6% 107.8 94.1 14.6% 201.0 NORWAY 31.0 33.8 −8.4% 62.0 67.8 −8.6% 135.7 DENMARK 10.6 9.1 17.2% 20.0 18.7 7.2% 39.4 EUROPE EAST 8.5 8.2 4.1% 15.1 14.4 4.9% 33.9 EUROPE CENTRAL 13.7 13.3 2.7% 24.7 25.2 −1.8% 53.2 Elimination of sales between segments −0.6 −0.4 −1.0 −1.5 −2.4
NET SALES, TOTAL 159.4 151.8 5.0% 300.0 289.3 3.7% 613.5 FINANCIAL RESULTS 4–6/2015 Ramirent Group’s second–quarter EBITDA increased by 9.0% from the previous year and amounted to EUR 46.0 (42.2) million. EBITDA margin was 28.9% (27.8%) of the net sales. Credit losses and change in the allowance for bad debt amounted to EUR −1.2 (0.0) million.
Depreciation and amortisation decreased to EUR 27.3 (28.0) million in the second quarter. In the second quarter 2015, Group’s EBITA improved by 30.2% and amounted to EUR 21.0 (16.2) million, representing 13.2% (10.7%) of net sales. Second-quarter EBITA excluding non-recurring items was

INTERIM REPORT Q2 2015 I RAMIRENT GROUP 5
17.2 (16.2) million or 10.8% (10.7%). The settlement of earn-out from the weather shelter and scaffolding company DCC acquired in 2014, resulted in EUR 3.8 million of non-recurring income in the second quarter. The non-recurring income is accounted for in the Sweden segment. Second–quarter EBIT was EUR 18.8 (14.2) million or 11.8% (9.4%) of net sales. Net financial items were EUR –2.1 (−5.1) million, including EUR 0.6 (−1.4) million net effects of exchange rate gains and losses. Second–quarter profit for the period attributable to the owners of the parent company improved by 84.2% and amounted to EUR 13.2 (7.1) million. Earnings per share increased also by 84.2% and amounted to EUR 0.12 (0.07). 1–6/2015 Ramirent Group’s January–June EBITDA increased by 1.0% from the previous year to EUR 74.6 (73.9) million. EBITDA margin was 24.9% (25.5%) of the net sales. Credit losses and change in the allowance for bad debt amounted to EUR −2.1 (−1.5) million. Depreciation and amortisation was slightly below the previous year’s level at EUR 53.9 (54.3) million. Group’s January–June EBITA improved by 8.1% and amounted to EUR 25.2 (23.3) million, representing 8.4% (8.0%) of net sales.
January–June EBIT was EUR 20.7 (19.6) million or 6.9% (6.8%) of net sales. Net financial items were EUR −4.3 (−7.2) million, including EUR 1.1 (−0.6) million net effects of exchange rate gains and losses. The Group’s result before taxes improved to EUR 16.4 (12.4) million. Income taxes amounted to EUR −3.4 (−2.8) million. January–June 2015 effective tax rate for the Group decreased to 20.4% (22.7%) mainly due to the non-taxable non-recurring income recognised from the settlement of earn-out in the weather shelter and scaffolding company, DCC. January–June 2015 profit for the period attributable to the owners of the parent company improved from the previous year and amounted to EUR 13.1 (9.7) million. Earnings per share increased by 35.3% and amounted to EUR 0.12 (0.09). On a rolling 12 months basis, the Return on invested capital (ROI) improved to 12.3% (11.9%). Return on equity (ROE) was 11.5% (12.1%) at the end of the second quarter. The equity per share was EUR 2.81 (3.00) at the end of the second quarter. Ramirent has published return on capital employed (ROCE, %) and capital employed in million euros by operating segment as of the first quarter of 2015. Segment ROCE, % and capital employed are presented in the segment key figures tables starting from page 9.

INTERIM REPORT Q2 2015 I RAMIRENT GROUP 6
EBITA margin by segment were as follows: EBITA 4–6/15 4–6/14 Change 1–6/15 1–6/14 Change 1–12/14 (MEUR and % of net sales) FINLAND 4.5 6.0 −25.7% 5.3 8.9 −41.1% 20.8 % of net sales 11.3% 15.4% 7.4% 12.7% 13.6% SWEDEN 12.1 6.7 80.7% 17.2 10.9 57.9% 29.4 % of net sales 21.4% 13.8% 16.0% 11.6% 14.6% NORWAY 2.9 4.2 −31.3% 3.9 6.8 −42.5% 14.0 % of net sales 9.4% 12.5% 6.3% 10.0% 10.3% DENMARK 0.3 −1.7 n/a −1.1 −2.9 62.0% −3.9 % of net sales 2.8% −19.1% −5.4% −15.3% −10.0% EUROPE EAST 1.7 1.0 76.7% 1.9 0.9 113.6% 6.7 % of net sales 20.4% 12.1% 12.4% 6.1% 19.6% EUROPE CENTRAL 0.9 0.8 9.7% 0.3 −0.4 n/a 1.7 % of net sales 6.2% 5.8% 1.2% −1.7% 3.2% Net items not allocated to segments −1.4 −0.8 −2.3 −1.0 −2.8 GROUP EBITA 21.0 16.2 30.2% 25.2 23.3 8.1% 65.8 % of net sales 13.2% 10.7% 8.4% 8.0% 10.7%
Non-recurring items impacting EBITA 4–6/15 4–6/14 1–6/15 1–6/14 1–12/14 (MEUR) FINLAND − − − − −1.52) SWEDEN 3.81) − 3.81) − −0.73) NORWAY − − − − −2.24) DENMARK − − − − −0.15) EUROPE EAST − − − − − EUROPE CENTRAL − − − − −1.16) Unallocated items and eliminations − − − − − TOTAL 3.8 − 3.8 − −5.7 1) The settlement of earn-out on DCC, the weather shelter and scaffolding division acquired in 2014, resulted in EUR 3.8 million of non-recurring income in the second quarter of 2015. 2) EUR 1.5 million of restructuring costs and asset write-downs were booked in the fourth quarter of 2014. 3) EUR 0.7 million of restructuring costs were booked in the fourth quarter of 2014. 4) EUR 2.2 million of restructuring costs were booked in the second half of the 2014. 5) EUR 0.1 million of restructuring costs were booked in the fourth quarter of 2014. 6) EUR 1.1 million of restructuring costs and asset write-downs were booked in the fourth quarter of 2014.

INTERIM REPORT Q2 2015 I RAMIRENT GROUP 7
EBITA excluding non-recurring items 4–6/15 4–6/14 Change 1–6/15 1–6/14 Change 1–12/14 (MEUR and % of net sales) FINLAND 4.5 6.0 −25.7% 5.3 8.9 −41.1% 22.3 % of net sales 11.3% 15.4% 7.4% 12.7% 14.6% SWEDEN 8.3 6.7 23.5% 13.4 10.9 22.7% 30.1 % of net sales 14.6% 13.8% 12.4% 11.6% 14.9% NORWAY 2.9 4.2 −31.3% 3.9 6.8 −42.5% 16.2 % of net sales 9.4% 12.5% 6.3% 10.0% 11.9% DENMARK 0.3 −1.7 n/a −1.1 −2.9 62.0% −3.8 % of net sales 2.8% −19.1% −5.4% −15.3% −9.6% EUROPE EAST 1.7 1.0 76.7% 1.9 0.9 113.6% 6.7 % of net sales 20.4% 12.1% 12.4% 6.1% 19.6% EUROPE CENTRAL 0.9 0.8 9.7% 0.3 −0.4 n/a 2.8 % of net sales 6.2% 5.8% 1.2% −1.7% 5.3% Net items not allocated to segments −1.4 −0.8 −2.3 −1.0 −2.8 Group EBITA excluding non-recurring items 17.2 16.2 6.4% 21.3 23.3 −8.4% 71.5 % of net sales 10.8% 10.7% 7.1% 8.0% 11.7% CAPITAL EXPENDITURE AND CASH FLOWS 4–6/2015 Ramirent Group’s second–quarter gross capital expenditure on non-current assets decreased to EUR 46.8 (78.3) million of which EUR 0.0 (46.0) million related to acquisitions. In some of the acquisitions Ramirent has agreed to pay contingent consideration to the sellers. The estimated contingent considerations are included in the gross capital expenditure. Investments in machinery and equipment amounted to EUR 44.5 (50.1) million. Sales of tangible non-current assets at sales value were EUR 4.8 (13.8) million, of which EUR 4.7 (5.8) million was attributable to rental machinery and equipment. The book value of sold tangible assets was EUR 1.7 (9.4) million, of which EUR 1.7 (2.5) million related to rental machinery and equipment. The Group’s second-quarter cash flow from operating activities decreased to EUR 29.1 (39.8) million, of which the change in working capital was EUR −5.4 (2.0) million. Cash flow from investing activities was EUR −51.4 (−59.2) million. Cash flow after investments amounted to EUR −22.3 (−19.4) million. Second-quarter cash flow after investments was affected by earn-out payments connected to the
acquisition of weather shelter and scaffolding company, DCC. 1–6/2015 Ramirent Group’s January–June gross capital expenditure on non-current assets totalled EUR 65.0 (101.8) million of which EUR 0.0 (46.0) million related to acquisitions. Investments in machinery and equipment amounted to EUR 60.4 (72.1) million. Sales of tangible non-current assets at sales value were EUR 10.1 (19.5) million, of which EUR 9.9 (11.3) million was attributable to rental machinery and equipment. The book value of sold tangible assets was EUR 3.9 (11.9) million, of which EUR 3.6 (5.0) million related to rental machinery and equipment. The Group’s first half cash flow from operating activities decreased to EUR 47.4 (51.1) million, of which the change in working capital was EUR −8.3 (20.9) million. Cash flow from investing activities was EUR −68.8 (−75.6) million. Cash flow after investments improved by 12.6% and amounted to EUR −21.4 (−24.5) million. Committed investments on rental machinery at the end of the second quarter amounted to EUR 25.2 (17.0) million.
INTERIM REPORT Q2 2015 I RAMIRENT GROUP 8
On 10 April 2015, Ramirent paid EUR 43.1 (39.9) million in dividends to shareholders. No own shares were repurchased during the first half of 2015. FINANCIAL POSITION At the end of June 2015, interest-bearing liabilities amounted to EUR 298.8 (285.7) million. Net debt amounted to EUR 297.1 (273.4) million at the end of the second quarter. Gearing increased to 97.9% (84.2%). Net debt to EBITDA ratio on a rolling 12 months basis was 1.8x (1.6x) at the end of June 2015. At the end of June 2015, Ramirent had unused committed back-up loan facilities of EUR 118.1 (140.6) million available. The average interest rate of the loan portfolio was 2.1% (2.4%) at the end of June. The average interest rate including interest rate hedges was 2.4% (2.9%) at the end of the second quarter. Ramirent has committed long-term senior credit facilities of EUR 415.0 million in total. Total assets amounted to EUR 779.4 (805.7) million at the end of June 2015, of which property, plant and equipment amounted to EUR 420.5 (438.8) million. The Group’s equity attributable to the parent company shareholders amounted to EUR 303.2
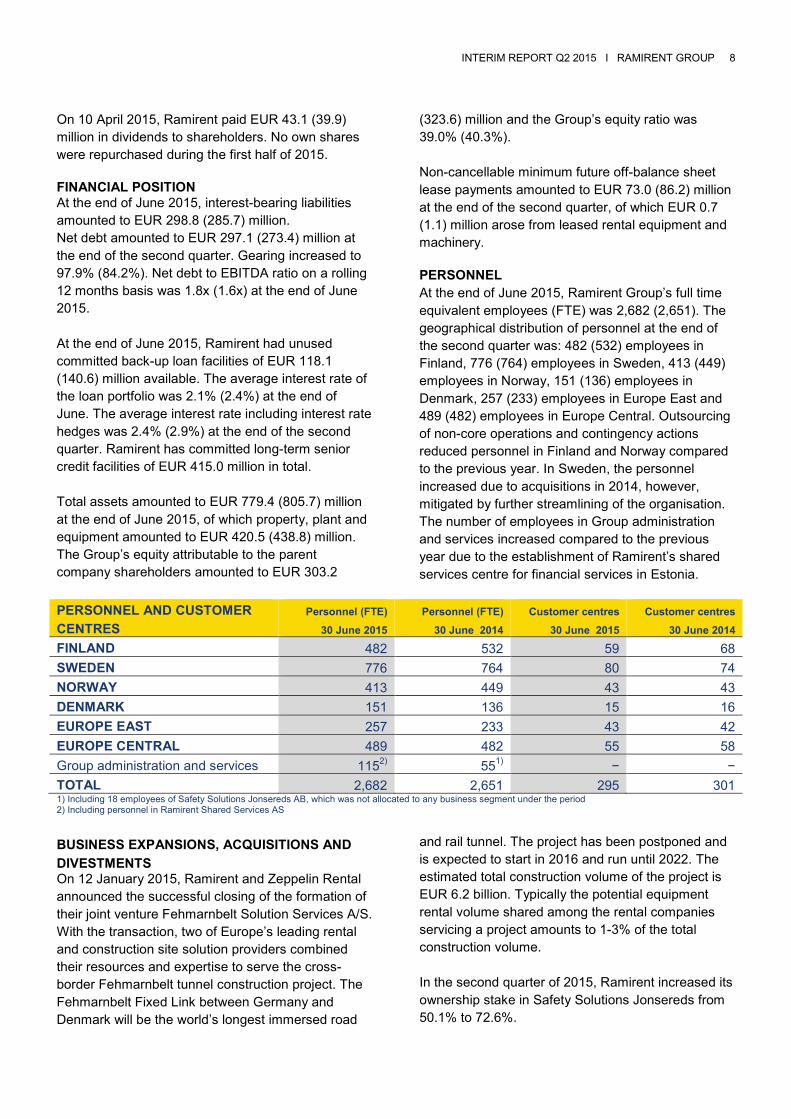
(323.6) million and the Group’s equity ratio was 39.0% (40.3%). Non-cancellable minimum future off-balance sheet lease payments amounted to EUR 73.0 (86.2) million at the end of the second quarter, of which EUR 0.7 (1.1) million arose from leased rental equipment and machinery. PERSONNEL At the end of June 2015, Ramirent Group’s full time equivalent employees (FTE) was 2,682 (2,651). The geographical distribution of personnel at the end of the second quarter was: 482 (532) employees in Finland, 776 (764) employees in Sweden, 413 (449) employees in Norway, 151 (136) employees in Denmark, 257 (233) employees in Europe East and 489 (482) employees in Europe Central. Outsourcing of non-core operations and contingency actions reduced personnel in Finland and Norway compared to the previous year. In Sweden, the personnel increased due to acquisitions in 2014, however, mitigated by further streamlining of the organisation. The number of employees in Group administration and services increased compared to the previous year due to the establishment of Ramirent’s shared services centre for financial services in Estonia.
PERSONNEL AND CUSTOMER CENTRES
Personnel (FTE) 30 June 2015
Personnel (FTE) 30 June 2014
Customer centres 30 June 2015
Customer centres 30 June 2014
FINLAND 482 532 59 68 SWEDEN 776 764 80 74 NORWAY 413 449 43 43 DENMARK 151 136 15 16 EUROPE EAST 257 233 43 42 EUROPE CENTRAL 489 482 55 58 Group administration and services 1152) 551) − − TOTAL 2,682 2,651 295 301 1) Including 18 employees of Safety Solutions Jonsereds AB, which was not allocated to any business segment under the period 2) Including personnel in Ramirent Shared Services AS
BUSINESS EXPANSIONS, ACQUISITIONS AND DIVESTMENTS On 12 January 2015, Ramirent and Zeppelin Rental announced the successful closing of the formation of their joint venture Fehmarnbelt Solution Services A/S. With the transaction, two of Europe’s leading rental and construction site solution providers combined their resources and expertise to serve the cross-border Fehmarnbelt tunnel construction project. The Fehmarnbelt Fixed Link between Germany and Denmark will be the world’s longest immersed road
and rail tunnel. The project has been postponed and is expected to start in 2016 and run until 2022. The estimated total construction volume of the project is EUR 6.2 billion. Typically the potential equipment rental volume shared among the rental companies servicing a project amounts to 1-3% of the total construction volume. In the second quarter of 2015, Ramirent increased its ownership stake in Safety Solutions Jonsereds from 50.1% to 72.6%.

INTERIM REPORT Q2 2015 I RAMIRENT GROUP 9
CHANGES IN GROUP STRUCTURE In the first half of 2015, Ramirent established a shared service centre in Tallinn in Estonia. Ramirent Plc owns 100% of the shares in Ramirent Shared Services AS. The shared service centre enables efficient production of financial services by a condensed Finance organisation to realise synergies of harmonised processes in accordance with Ramirent’s strategy of operating a common business platform and to increase focus on business controlling and customer activities on country level. DEVELOPMENT PROGRAMMES Ramirent started in 2014 an improvement agenda, NextRamirent, to clarify its ambition to offer a unique
customer experience and to differentiate from competitors. NextRamirent targets the company to become more competent, proactive, conscious, safe and green as well as more efficient in all its operations. Implementation of defined efficiency actions continued in the second quarter across all segments related to developing integrated solutions, the common Ramirent platform, improving pricing management, optimising the customer centre network, improving fleet utilisation and the governance of sourcing operations. The defined efficiency actions are planned to deliver a Group EBITA margin level of 17%.
PERFORMANCE BY SEGMENT FINLAND KEY FIGURES 4–6/15 4–6/14 Change 1–6/15 1–6/14 Change 1–12/14 (MEUR) Net sales 39.4 39.0 1.0% 71.5 70.6 1.1% 152.8 EBITA 4.5 6.0 −25.7% 5.3 8.9 −41.1% 20.81) % of net sales 11.3% 15.4% 7.4% 12.7% 13.6%1) Capital expenditure 9.9 22.3 −55.6% 14.0 26.5 −47.1% 35.8 Capital employed 117.2 127.0 −7.7% 124.4 ROCE (%)2) 12.9% 19.9% 15.6% Personnel (FTE) 482 532 −9.4% 497 Customer centres 59 68 −13.2% 66 1) EBITA excluding non–recurring items was EUR 22.3 million or 14.6% in January–December 2014. The non–recurring items included EUR 1.5 million of restructuring costs and asset write-downs booked in the fourth quarter of 2014. 2) Rolling 12 months
Net sales 4–6/2015 Ramirent’s second–quarter net sales in Finland increased by 1.0% to EUR 39.4 (39.0) million. Demand in the Finnish market was sluggish, except for Southern Finland where demand for rental equipment was supported by ongoing construction activity. Lower sales of used equipment compared to the previous year had a negative impact on sales. 1–6/2015 Ramirent’s January–June net sales in Finland increased by 1.1% and amounted to EUR 71.5 (70.6) million. Net sales were supported by favourable demand among small and medium sized projects especially in Southern Finland in the first half of 2015. Market activity was low in the rest of Finland. Uncertainty related to the Russian economy hampered rental activity especially in Eastern parts of
Finland. Centralisation of fleet maintenance and repair improved availability of the rental fleet in the first half of the 2015. Profitability 4–6/2015 Second–quarter EBITA in Finland decreased by 25.7% from the previous year and amounted to EUR 4.5 (6.0) million. The second−quarter EBITA margin was 11.3% (15.4%). Profitability was impaired by a higher share of service sales and scaffolding business compared to the previous year. Price pressure and slow underlying demand impacted negatively on EBITA. Ramirent also continued to optimise and adapt its customer centre network to the current market environment and closed three customer centres in the quarter. The number of customer centres in Finland amounted to 59 (68) at the end of the second quarter. Second−quarter rolling

INTERIM REPORT Q2 2015 I RAMIRENT GROUP 10
12 months Return on capital employed (ROCE) in Finland was 12.9% (19.9%). ROCE was negatively impacted by lower margins and restructuring of operations in the fourth quarter of 2014. 1–6/2015 January–June EBITA in Finland decreased by 41.1% from the previous year and amounted to EUR 5.3 (8.9) million. January–June EBITA margin was 7.4% (12.7%). Increased handling costs due to a larger number of small and medium sized projects as well internal development work burdened profitability. The comparative period’s result was positively impacted by cost savings from temporary lay-offs, which were not done in 2015. Ramirent made a collective agreement with the labour union in order to improve flexibility through work time and holiday planning to better adapt to the seasonal changes in activity levels in this business.
Market outlook for 2015 Ramirent expects market conditions for equipment rental to remain challenging in Finland in the second half of the 2015. According to a forecast published by Euroconstruct in June 2015, the Finnish construction market is expected to be flat in 2015. Demand for renovation is estimated to increase due to ageing residential stock and government assistance for renovation projects. Weak market conditions are expected to continue in the new residential construction sector especially outside the capital city region. Demand for equipment rental in non-residential construction is supported by start-ups of certain large commercial and industrial building projects. The new government is planning to increase infrastructure spending in order to stimulate the stagnant economy in the second half of 2015. The Confederation of Finnish Industries (EK) expects full-year industrial investments in the general manufacturing sector as well as in the energy sector to increase in 2015.
SWEDEN KEY FIGURES 4–6/15 4–6/14 Change 1–6/15 1–6/14 Change 1–12/14 (MEUR) Net sales 56.8 48.7 16.6% 107.8 94.1 14.6% 201.0 EBITA 12.12) 6.7 80.7% 17.22) 10.9 57.9% 29.41) % of net sales 21.4%2) 13.8% 16.0%2) 11.6% 14.6%1) Capital expenditure 18.4 35.9 −48.9% 22.3 45.8 −51.3% 67.3 Capital employed 187.7 167.5 12.0% 155.0 ROCE (%)3) 17.9% 16.7% 16.9% Personnel (FTE) 776 764 1.6% 759 Customer centres 80 74 8.1% 77 1) EBITA excluding non–recurring items was EUR 30.1 million or 14.9% of net sales in January–December 2014. The non–recurring items included EUR 0.7 million restructuring costs booked in the fourth quarter of 2014. 2) EBITA excluding non-recurring items was EUR 8.3 million or 14.6% of net sales in April–June 2015 and EUR 13.4 million or 12.4% in January–June 2015. The settlement of earn-out on DCC, the weather shelter and scaffolding division acquired in 2014, resulted an EUR 3.8 million of non-recurring income in the second quarter of 2015. 3) Rolling 12 months
Net sales 4–6/2015 Ramirent’s second–quarter net sales in Sweden increased by 16.6% and amounted to EUR 56.8 (48.7) million. At comparable exchange rates, net sales increased by 20.0%. Second–quarter sales growth was driven by high construction activity especially in the Stockholm and Gothenburg areas and progress in Solutions projects. Demand improved clearly in Western Sweden whereas a lack of large projects in Northern Sweden weighed down
on sales. A healthy demand among industrial customers supported sales in the quarter. 1–6/2015 Ramirent’s January–June net sales in Sweden increased by 14.6% and amounted to EUR 107.8 (94.1) million. At comparable exchange rates, net sales increased by 19.5%. In the first half, sales growth was driven by new start-ups of large Solutions projects. Sales growth was also supported by increasing residential and infrastructure construction in the Stockholm and Gothenburg areas. In Southern
INTERIM REPORT Q2 2015 I RAMIRENT GROUP 11
parts of Sweden, demand for rental equipment improved in large cities as well as in the industrial sector. Strategic acquisitions completed in 2014 contributed to the positive sales growth in the first half of 2015. In the first quarter, Ramirent signed an agreement with AMF Fastigheter to provide a total rental solution for machines and related services during the implementation of the Urban Escape project in Stockholm that will run until 2018. Profitability 4–6/2015 Second–quarter EBITA in Sweden increased by 80.7% from the previous year and amounted to EUR 12.1 (6.7) million. The second–quarter EBITA margin was 21.4% (13.8%). EBITA was positively impacted by the settlement of earn-out from the weather shelter and scaffolding company DCC acquired in June 2014, which resulted in EUR 3.8 million of non-recurring income in the second quarter. EBITA in Sweden excluding non-recurring items was EUR 8.3 (6.7) million or 14.6% (13.8%). EBITA improvement was driven by strong sales growth in both Solution sales and Customer centre sales. Improving fleet utilisation and higher price levels supported the profitability in the second quarter. Second–quarter rolling 12 months Return on capital employed (ROCE) in Sweden was 17.9% (16.7%). ROCE was positively impacted by higher service sales and improved margins in the second quarter of the 2015.
1–6/2015 January–June EBITA in Sweden increased by 57.9% from the previous year and amounted to EUR 17.2 (10.9) million. January–June EBITA margin was 16.0% (11.6%). Profitability strengthened mainly as a result of the strong sales growth in large Solutions projects. A higher share of service sales and start-up costs in new Solutions projects weighed down on the EBITA margin in the first half of the year. Market outlook for 2015 Ramirent expects the demand for equipment rental to remain favourable in Sweden in 2015, driven by high activity in all construction sectors. According to a forecast published by Euroconstruct in June 2015, the Swedish construction market is expected to grow by 5.0% in 2015. The market conditions are strong especially in many of Sweden’s major cities. New residential start-ups will remain at a high level due to continuous housing shortage in the market. Non-residential construction is expected to increase supported by growth in office and commercial building projects. The government’s transport infrastructure plan, approved in 2014, will fuel activity within infrastructure construction especially in the Stockholm and Gothenburg areas also in the second half of the year. Due to a continuously expanding and ageing building stock, renovation is expected to grow in 2015. Demand for equipment rental in the industrial sector is anticipated to remain fairly stable in Sweden.
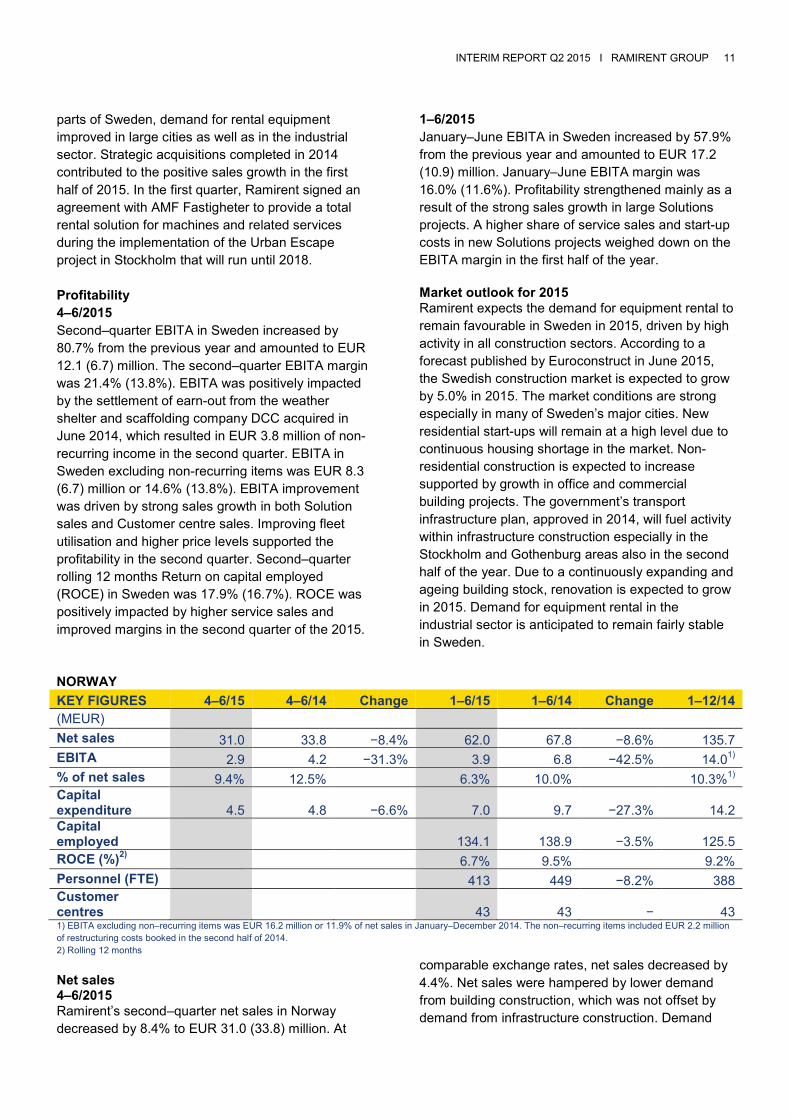
NORWAY KEY FIGURES 4–6/15 4–6/14 Change 1–6/15 1–6/14 Change 1–12/14 (MEUR) Net sales 31.0 33.8 −8.4% 62.0 67.8 −8.6% 135.7 EBITA 2.9 4.2 −31.3% 3.9 6.8 −42.5% 14.01) % of net sales 9.4% 12.5% 6.3% 10.0% 10.3%1) Capital expenditure 4.5 4.8 −6.6% 7.0 9.7 −27.3% 14.2 Capital employed 134.1 138.9 −3.5% 125.5 ROCE (%)2) 6.7% 9.5% 9.2% Personnel (FTE) 413 449 −8.2% 388 Customer centres 43 43 − 43 1) EBITA excluding non–recurring items was EUR 16.2 million or 11.9% of net sales in January–December 2014. The non–recurring items included EUR 2.2 million of restructuring costs booked in the second half of 2014. 2) Rolling 12 months
Net sales 4–6/2015 Ramirent’s second–quarter net sales in Norway decreased by 8.4% to EUR 31.0 (33.8) million. At
comparable exchange rates, net sales decreased by 4.4%. Net sales were hampered by lower demand from building construction, which was not offset by demand from infrastructure construction. Demand

INTERIM REPORT Q2 2015 I RAMIRENT GROUP 12
from the oil and gas sector remained cautious in the second quarter. Having mainly supplied the sector with High Class Temporary Space in the past, Ramirent expanded by signing a four-year lift rental agreement with Statoil for their onshore facilities in Norway. 1–6/2015 Ramirent’s January–June net sales in Norway decreased by 8.6% to EUR 62.0 (67.8) million. At comparable exchange rates, net sales decreased by 4.5%. Net sales were impacted negatively by a slow start of the year especially in the building construction sector. Sales of used equipment declined clearly compared to the previous year. Continued uncertainty in the oil and gas sector softened the demand for equipment rental. In the first half of 2015, Solutions sales increased compared to the previous year, supported by new project start-ups. Profitability 4–6/2015 Ramirent’s second–quarter EBITA in Norway decreased by 31.3% from the comparative period and amounted to EUR 2.9 (4.2) million. The second–quarter EBITA margin was 9.4% (12.5%). EBITA was affected negatively by lower net sales and continued price pressure in the market. Second–quarter rolling 12 months Return on capital employed (ROCE) in Norway was 6.7% (9.5%). ROCE was negatively impacted by lower margins. Actions to improve cost efficiency continued in the second quarter.
1–6/2015 Ramirent’s January–June EBITA in Norway decreased by 42.5% from the comparative period and amounted to EUR 3.9 (6.8) million. January–June EBITA margin was 6.3% (10.0%). Price pressure increased due to low activity in the building construction sector. EBITA was also impaired by low sales of used temporary space modules to end-customers mainly in the oil and gas sector. Reorganisation of maintenance and repair operations increased services and transportation costs in the first half. Market outlook for 2015 Ramirent expects market conditions for equipment rental to remain challenging in Norway in the second half of 2015 due to macroeconomic uncertainty connected to the low oil price. According to a forecast published by Euroconstruct in June 2015, the Norwegian construction market is expected to grow by 2.6% in 2015. Infrastructure construction supported by government stimulus measures will be the main growth driver fuelled by several road, railway and metro projects. Residential construction is estimated to remain at the previous year’s level in 2015. Non-residential construction sector is expected to increase supported by public sector projects. Renovation construction is expected to increase in 2015. According to an estimate by Statistics Norway, investments in the oil and gas sector are estimated to decline clearly in 2015.
DENMARK KEY FIGURES 4–6/15 4–6/14 Change 1–6/15 1–6/14 Change 1–12/14 (MEUR) Net sales 10.6 9.1 17.2% 20.0 18.7 7.2% 39.4 EBITA 0.3 −1.7 n/a −1.1 −2.9 62.0% −3.91) % of net sales 2.8% −19.1% −5.4% −15.3% −10.0%1) Capital expenditure 0.7 1.7 −60.4% 1.6 1.7 −7.7% 3.6 Capital employed 26.6 25.8 3.2% 25.4 ROCE (%)2) −9.0% −20.8% −14.9% Personnel (FTE) 151 136 11.0% 147 Customer centres 15 16 −6.3% 16
1) EBITA excluding non–recurring items was EUR −3.8 million or −9.6% of net sales in January–December 2014. The non–recurring items included EUR 0.1 million restructuring costs that were booked in the fourth quarter of 2014. 2) Rolling 12 months

INTERIM REPORT Q2 2015 I RAMIRENT GROUP 13
Net sales 4–6/2015 Ramirent’s second–quarter net sales in Denmark increased by 17.2% or by 17.1% at comparable exchange rates and amounted to EUR 10.6 (9.1) million. Sales growth was driven by Solutions projects mainly in the public sector and strong construction activity in the Copenhagen area. Ramirent’s performance in Western parts of Denmark started to recover towards the end of the quarter as a result of corrective actions. 1–6/2015 Ramirent’s January–June net sales in Denmark increased by 7.2% or by 7.1% at comparable exchange rates and amounted to EUR 20.0 (18.7) million. Demand for equipment rental developed favourably in the Copenhagen area. Corrective actions were taken to improve the weak performance in Western parts of Denmark especially in the first quarter. Good progress in several Solutions projects supported sales in the first half of the year. Overall demand in the Danish equipment rental market picked up compared to the previous year in the start of the summer season. Profitability 4–6/2015 Ramirent’s second–quarter EBITA in Denmark improved markedly and amounted to EUR 0.3 (−1.7) million. The second–quarter EBITA margin was 2.8% (−19.1%). Profitability improved mainly due to increased sales and improved fleet utilisation in the second quarter. Profitability was also supported by a lower fixed cost level due to cost savings
implemented in the previous year. Development of the Danish organisation and customer centre network will continue in the second half of 2015 to improve profitability. Second–quarter rolling 12 months Return on capital employed (ROCE) in Denmark was –9.0% (–20.8%). ROCE was supported by higher service sales but remained still negative due to a low margin level. 1–6/2015 Ramirent’s January–June EBITA in Denmark improved and amounted to EUR −1.1 (−2.9) million. January–June EBITA margin was −5.4% (−15.3%). Continued price pressure and a higher share of service sales hampered profitability in the first half of 2015. Market outlook for 2015 Ramirent expects market conditions for equipment rental to be balanced in Denmark in the second half of 2015. According to a forecast published by Euroconstruct in June 2015, the Danish construction market is expected to increase by 1.2% in 2015. Demand in the renovation market is expected to soften clearly while new residential construction is estimated to remain stable backed by a healthy underlying demand in the major cities. In the second half of 2015, public investments are expected to increase infrastructure construction and building activity in the health and education sector. Activity in the industrial sector is expected to support the demand for equipment rental in the second half of the year.
EUROPE EAST - The Baltics and Fortrent Group, the joint venture in Russia and Ukraine KEY FIGURES 4–6/15 4–6/14 Change 1–6/15 1–6/14 Change 1–12/14 (MEUR) Net sales 8.5 8.2 4.1% 15.1 14.4 4.9% 33.9 EBITA 1.7 1.0 76.7% 1.9 0.9 113.6% 6.7 % of net sales 20.4% 12.1% 12.4% 6.1% 19.6% Capital expenditure 9.3 4.7 96.2% 13.0 7.4 76.0% 10.6 Capital employed 52.2 63.5 −17.8% 46.6 ROCE (%)1) 13.4% 10.0% 11.3% Personnel (FTE) 257 233 10.3% 240 Customer centres 43 42 2.4% 42 1) Rolling 12 months

INTERIM REPORT Q2 2015 I RAMIRENT PLC 14
Segment Europe East consists of Ramirent Group’s operations in Baltics and the share of profit from Fortrent Group. Fortrent is owned and controlled 50/50 by Ramirent and Cramo, and its parent company Fortrent Ltd is a Finnish limited liability company. Ramirent’s 50% share of the consolidated net result from the joint venture is presented above EBITDA in the consolidated income statement in accordance with the equity method of accounting. Only the sales in Baltics is reported in the segment’s Net sales figure. Net sales 4–6/2015 Ramirent’s second–quarter net sales in the Baltics increased by 4.1% to EUR 8.5 (8.2) million. Net sales were supported by healthy activity in the construction sector and increased demand for rental related services. 1–6/2015 Ramirent’s January–June net sales in Baltics increased by 4.9% to EUR 15.1 (14.4) million. In the Baltics, sales increased thanks to favourable demand among small and medium sized customers in the first half of 2015. Net sales from rental related services grew strongly compared to the previous year. The comparative period included large energy related projects that were completed at the end of 2014. Profitability 4–6/2015 Ramirent’s second–quarter EBITA in Europe East improved from the comparative period by 76.7% and amounted to EUR 1.7 (1.0) million. The second–quarter EBITA margin was 20.4% (12.1%). Ramirent’s second–quarter EBITA in the Baltics improved to EUR 1.7 (1.2) million. The second-quarter EBITA margin was 19.5% (14.1%). As a result of strict cost control in all Baltic countries, EBITA improved in the second quarter compared to the previous year. The share of the consolidated net result from Fortrent Group to Ramirent for the second quarter 2015 was EUR 0.1 (−0.2) million. Second–quarter rolling 12 months Return on capital employed (ROCE) in Europe East improved to 13.4% (10.0%). ROCE strengthened mainly as a result of improved margins especially in the Baltics and lower capital employed in Fortrent Group due to the changes in foreign exchange rates.
1–6/2015 Ramirent’s January–June EBITA in Europe East improved from the comparative period by 113.6% and amounted to EUR 1.9 (0.9) million. January–June EBITA margin was 12.4% (6.1%). Ramirent’s January–June EBITA in the Baltics was EUR 1.9 (1.5) million. January–June EBITA margin was 12.7% (10.2%) of net sales. EBITA was supported by strong operative performance and control of fixed costs by maintaining a lean and effective organisational structure in the Baltics. The share of the consolidated net result from Fortrent Group to Ramirent for January–June 2015 was EUR −0.0 (−0.6) million. Market outlook for 2015 in the Baltics Ramirent expects the overall demand in the Baltic equipment rental market to remain balanced in the second half of 2015. According to a forecast published by Euroconstruct in June 2015, the total construction market in the Baltics is expected to decrease by 2.5% in 2015. In Estonia the construction market is expected to decline by 4% in 2015. The main construction projects will be located in the capital city region and southern parts of Estonia. The Latvian construction market is estimated to decline by 6% in 2015. Residential construction is expected to remain stable, but construction activity in the non-residential sector will slow down due to the continued economic uncertainty caused by the Ukrainian crisis. In Lithuania the construction market is expected to grow by 1% in 2015. Increasing residential construction and high activity in renovation will be the main growth drivers in the Lithuanian market. Several EU funded projects are expected to start in the second half of 2015, supporting especially infrastructure and renovation construction in the Baltics. Separate financial information on Fortrent Group (joint venture company in Russia and Ukraine)
Net sales 4–6/2015 Fortrent Group’s second–quarter net sales decreased by 16.0% to EUR 8.1 (9.6) million. At comparable exchange rates, net sales increased by 3.0%. Euro-denominated sales were negatively impacted by the weaker Russian rouble and Ukrainian hryvnia against the euro compared to the previous year. Demand for rental equipment was favourable in Southern parts of Russia. The market situation in Ukraine remained
INTERIM REPORT Q2 2015 I RAMIRENT GROUP 15
challenging and Fortrent is increasing focus towards industrial customers. 1–6/2015 Fortrent Group’s January–June net sales decreased by 19.0% to EUR 15.3 (18.8) million. At comparable exchange rates, net sales increased by 9.6%. Sales increased due to higher prices and strong growth in new regions, such as Volga and the southern parts of Russia. Competition among rental companies in the St. Petersburg and Moscow areas increased due to softening rental volumes in the market. In Ukraine, the crisis has slowed down the construction market and many construction sites remained inactive due to lack of available funding. Profitability 4–6/2015 Fortrent Group’s second–quarter EBITA amounted to EUR 0.3 (0.0) million. The second–quarter EBITA margin was 3.0% (0.0%) of net sales. Fortrent Group’s profitability was supported by lower fixed cost level as a result of contingency measures implemented in 2014. In addition, higher price level in the Russian equipment rental market strengthened the profitability in the second quarter. Fortrent will implement further cost saving actions and continue a tight control of investments in the second half of the 2015.
1–6/2015 Fortrent Group’s January–June EBITA amounted to EUR 0.2 (−0.2) million. January–June EBITA margin was 1.3% (−1.1%) of net sales. In the first half of 2015, the result improved due to cost saving actions, improved pricing and the strong development in the new markets in Russia. The consolidated net result for the period was EUR −0.1 (−1.2) million. Market outlook for 2015 in Russia and Ukraine Ramirent expects the demand for equipment rental to be modest in Russia in 2015. The low oil price is impacting negatively on the economy and construction markets. The volatility of the rouble and the Russian financial market hinder economic growth in Russia. EU and US economic sanctions against Russia due to the Ukrainian crisis remain in place, creating further uncertainty over the development of the Russian economy. According to the forecast published by Euroconstruct in June 2015, the Russian construction market is estimated to decrease by approximately 2% in 2015. Building construction is estimated to remain close to the previous year’s level supported by large ongoing projects but infrastructure construction is expected to decline clearly. In Ukraine, construction activity has slowed down considerably and market conditions are expected to remain challenging throughout the 2015.
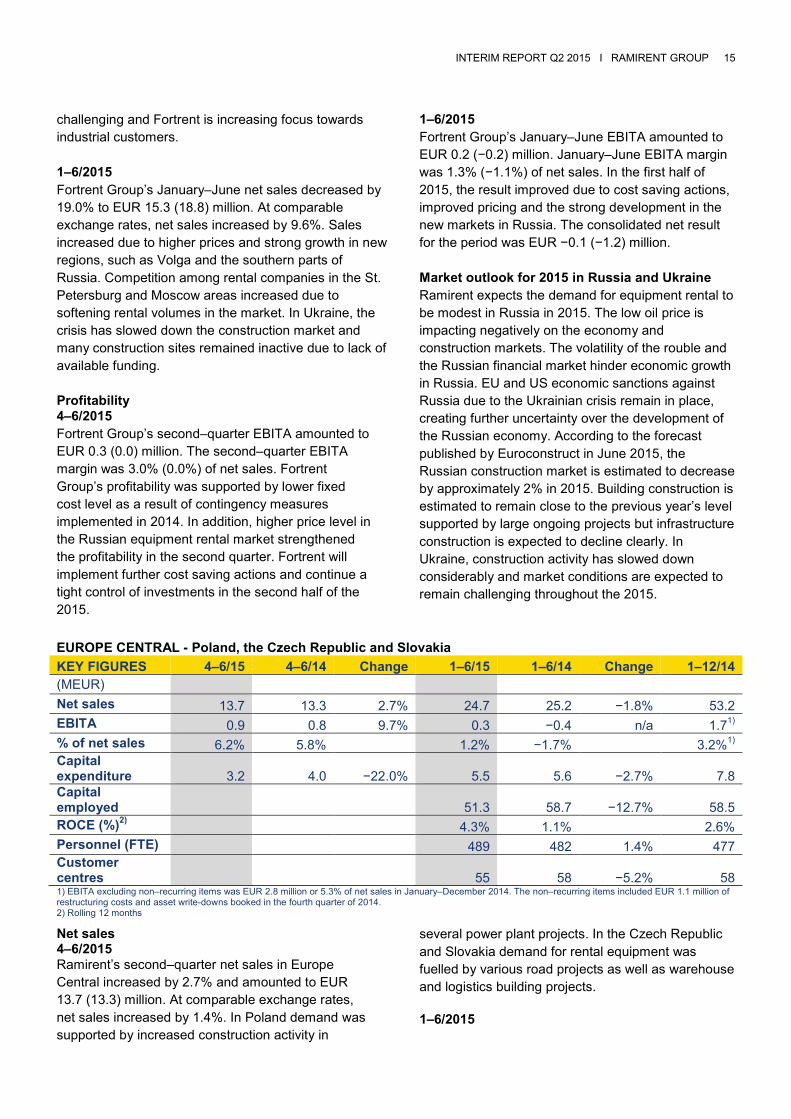
EUROPE CENTRAL - Poland, the Czech Republic and Slovakia KEY FIGURES 4–6/15 4–6/14 Change 1–6/15 1–6/14 Change 1–12/14 (MEUR) Net sales 13.7 13.3 2.7% 24.7 25.2 −1.8% 53.2 EBITA 0.9 0.8 9.7% 0.3 −0.4 n/a 1.71) % of net sales 6.2% 5.8% 1.2% −1.7% 3.2%1) Capital expenditure 3.2 4.0 −22.0% 5.5 5.6 −2.7% 7.8 Capital employed 51.3 58.7 −12.7% 58.5 ROCE (%)2) 4.3% 1.1% 2.6% Personnel (FTE) 489 482 1.4% 477 Customer centres 55 58 −5.2% 58 1) EBITA excluding non–recurring items was EUR 2.8 million or 5.3% of net sales in January–December 2014. The non–recurring items included EUR 1.1 million of restructuring costs and asset write-downs booked in the fourth quarter of 2014. 2) Rolling 12 months Net sales 4–6/2015 Ramirent’s second–quarter net sales in Europe Central increased by 2.7% and amounted to EUR 13.7 (13.3) million. At comparable exchange rates, net sales increased by 1.4%. In Poland demand was supported by increased construction activity in
several power plant projects. In the Czech Republic and Slovakia demand for rental equipment was fuelled by various road projects as well as warehouse and logistics building projects. 1–6/2015

INTERIM REPORT Q2 2015 I RAMIRENT GROUP 16
Ramirent’s January–June net sales in Europe Central decreased by 1.8% and amounted to EUR 24.7 (25.2) million. At comparable exchange rates, net sales decreased by 2.4%. In Poland demand was driven by improving construction activity and new projects especially in the power plant sector. The comparative period included a large industrial project in Slovenia that was completed in the fourth quarter of 2014. In the Czech Republic and Slovakia, demand for equipment rental continued to be strong especially in the non-residential and infrastructure construction sectors. Profitability 4–6/2015 Second–quarter EBITA in Europe Central improved by 9.7% and amounted to EUR 0.9 (0.8) million. The second–quarter EBITA margin was 6.2% (5.8%). EBITA improved mainly due to improving performance of Customer Centre sales and higher rental prices compared to the previous year. Profitability was slightly negatively impacted by increased repair and maintenance costs compared to the previous year. Second–quarter rolling 12 months Return on capital employed (ROCE) in Europe Central improved to 4.2% (1.1%). Improved margins and reduction of non-productive fleet contributed positively to the ROCE. 1–6/2015 January–June EBITA in Europe Central improved from the comparative period and amounted to EUR 0.3 (−0.4) million. January–June EBITA margin was 1.2% (−1.7%). The profitability improved mainly as a result of increased net sales and strict cost control in all operations. Europe Central’s fleet utilisation strengthened from the previous year due to start of new projects, reduction of non-productive fleet and improved supply chain management. Profitability strengthened in the Czech and Slovakian operations based on favourable underlying demand for equipment rental and increasing price levels. Market outlook for 2015 in Europe Central Ramirent expects the overall demand in Europe Central equipment rental markets to remain favourable in the second half of 2015. According to a forecast published by Euroconstruct in June 2015, the Polish construction market is estimated to grow by 9.7% in 2015. Infrastructure construction projects, funded largely by EU, will be the primary driver of growth in the construction sector. Market conditions are expected to be favourable in residential
construction as new start-ups are forecasted to increase clearly. Construction activity is expected to continue to pick up in the non-residential sector supported especially by construction of industrial buildings. Increasing renovation as well as high project activity in the power plant and wind power sector is estimated to support the equipment rental market. In the Czech Republic and Slovakia, the construction market is expected to grow by 4.3% and by 2.1% respectively in 2015. Demand for equipment rental is expected to remain strong especially in the construction sector. CHANGES IN THE GROUP MANAGEMENT TEAM IN JANUARY–JUNE 2015 Ramirent announced on 23 January 2015 a renewed management structure where operating segments are organised under two new market areas, Scandinavia and North Central Europe. President and CEO Magnus Rosén will head the Scandinavia market area which covers the operating segments Sweden, Denmark and Norway. Anna Hyvönen was appointed Executive Vice President, North Central Europe which covers the operating segments Finland, Europe East and Europe Central. SHARES Trading in shares Ramirent Plc’s market capitalisation at the end of June 2015 was EUR 712.0 (888.1) million. The market capitalisation was EUR 705.7 (880.1) million excluding the company’s treasury shares. The share price closed at EUR 6.55 (8.17). The highest quotation for the period was EUR 7.45 (10.25), and the lowest EUR 6.33 (7.21). The volume weighted average trading price was EUR 6.91 (8.46). The share price decreased by 1.6% in January–June 2015. The value of share turnover during January–June was EUR 142.8 (206.9) million, equivalent to 20,679,540 (24,295,000) traded Ramirent shares, i.e. 19.1% (22.6%) of Ramirent’s total number of shares outstanding. The average daily trading volume during January–June was 169,504 (199,193) shares, representing an average daily turnover of EUR 1,170,744 (1,928,793). At the end of June 2015, the number of registered

INTERIM REPORT Q2 2015 I RAMIRENT GROUP 17
shareholders was 14,149 (14,383). At the end of the second quarter, a total of 54.4% (50.7%) of the company’s shares were owned by nominee-registered and non-Finnish investors. Shareholders with higher than 5.0% ownership in Ramirent at the end of June 2015 were Nordstjernan AB with 27.96% of the shares and Oy Julius Tallberg Ab with 11.23% of the shares. Share capital and number of shares At the end of the second quarter, Ramirent Plc’s share capital was EUR 25.0 million, and the total number of Ramirent shares outstanding was 107,736,679. Own shares At the end of June 2015, Ramirent Plc held 960,649 of the Company’s own shares, representing 0.88% of the total number of Ramirent’s shares. No own shares were acquired during January–June 2015. LONG-TERM INCENTIVE PROGRAM (LTI) 2015 On 11 February 2015, the Board of Directors of Ramirent Plc approved a new Long-term incentive program for the executives of the company. The aim of the new program is to combine the objectives of the shareholders and the executives in order to increase the value of the company, to commit the executives to the company and to offer the executives a competitive reward program based on holding the Company’s shares. The new program includes matching shares and performance shares, and the program is targeted at approximately 60 executives for the earning period 2015–2017.The potential reward from the program for the earning period 2015–2017 will be based on the Group's cumulative Economic Profit and on the Group's Total Shareholder Return (TSR). The maximum reward to be paid will correspond to the value of up to 450,000 Ramirent Plc shares (including also the proportion to be paid in cash).
SETTLEMENT OF THE LONG-TERM INCENTIVE PROGRAM 2012 On 11 February 2015, the Board decided, based on the share issue authorisation granted by the AGM, to convey 13,308 of the company’s own shares, currently held by the company, without cash payment to the key persons of the Group as a settlement of the Long-term incentive program 2012. The program was set forth to combine the objectives of the
shareholders and the key persons of the Group in order to increase the value of the company. The value of the issued shares of EUR 95 038 was recognised in the invested unrestricted equity fund.
DECISIONS AT THE AGM 2015 AND THE BOARD OF DIRECTORSˈ FORMATIVE MEETING Ramirent Plc's Annual General Meeting, which was held on 25 March 2015, adopted the 2014 annual financial accounts and discharged the members of the Board of Directors and the President and CEO from liability.
Dividend for 2014 The Annual General Meeting adopted the Board’s proposal that a dividend of EUR 0.40 per share be paid based on the adopted balance sheet for the financial year ended on 31 December 2014. The date of record for dividend distribution was 27 March 2015 and the dividend was paid on 10 April 2015.
Potential additional dividend The Annual General Meeting adopted further the Board’s proposal to decide at its discretion on the payment of additional dividend based on the adopted balance sheet for the financial year ended on 31 December 2014. The amount of the additional dividend may not exceed EUR 0.60 per share. The potential additional dividend will be paid to the shareholders registered in the company’s shareholders’ register maintained by Euroclear Finland Ltd on the record date decided by the Board of Directors. The Board of Directors shall decide the date of payment of the dividend, which can at the earliest be the 5th banking day from the record date. All other terms and conditions connected to the additional dividend will be decided by the Board of Directors. The authorisation is valid until the next Annual General Meeting. Composition of the Board of Directors and their remuneration The Annual General Meeting resolved that the number of members of the Board of Directors is confirmed to be seven (7) and re-elected the Board members Kevin Appleton, Kaj-Gustaf Bergh, Ulf Lundahl, Mats O Paulsson and Susanna Renlund, and elected as new Board members Anette Frumerie and Tobias Lönnevall for the term that will continue until the end of the next Annual General Meeting.
Ramirent Plc’s Board of Directors held its formative meeting on 25 March 2015. In the meeting the Board
INTERIM REPORT Q2 2015 I RAMIRENT GROUP 18
elected from among its members Ulf Lundahl as its Chairman and Susanna Renlund as Deputy Chairman. In the meeting the Board also decided on the composition of the Working Committee, to which among other, the duties of an audit committee are assigned. Ulf Lundahl, Susanna Renlund and Tobias Lönnevall were elected members and Ulf Lundahl was elected Chairman of the Working Committee.
The Annual General Meeting adopted the proposal that the remunerations of the members of the Board of Directors would be as follows: for the Chairman EUR 3,800 per month and additionally EUR 1,600 for attendance at board and committee meetings and other similar board assignments; for the Vice-Chairman EUR 2,500 per month and additionally EUR 1,300 for attendance at board and committee meetings and other similar board assignments; and for the members of the Board of Directors EUR 2,250 per month and additionally EUR 1,000 for attendance at board and committee meetings and other similar board assignments. Travel expenses and other out-of-pocket expenses due to the board work shall be compensated in accordance with the Company’s established practice and travel rules.
Company auditor and compensation The Annual General Meeting adopted the proposal that the number of auditors shall be one (1) and re-elected PricewaterhouseCoopers Oy (“PWC”) as the company’s auditor with APA Ylva Eriksson as principally responsible auditor for the term that will continue until the end of the next Annual General Meeting. The auditor’s compensation will be paid against an invoice as approved by the Company.
Authorisation to decide on purchase of own shares The Annual General Meeting authorised the Board of Directors to decide on the repurchase of a maximum of 10,869,732 Company’s own shares as proposed by the Board of Directors. The authorisation also contains an entitlement for the Company to accept its own shares as pledge. The share repurchase authorisation is valid until the next Annual General Meeting.
STRATEGY AND FINANCIAL TARGETS Ramirent’s strategy is focused on four major objectives:
1. Sustainable profitable growth through pursuing our objectives of always putting the Customer First,
Building One Company and maintaining agility in Business. Ramirent also seeks growth and increasing market share by strengthening the customer offering, widening the customer portfolio and, through outsourcing deals, selected acquisitions and joint venture opportunities.
2. Pursuing growth requires that we always put the Customer First. We aim to provide tailored offerings and approaches for different customer segments with an increased focus on sustainability, safety and quality. Through the NextRamirent improvement agenda we ensure this mind-set and target the company to become more competent, proactive, conscious, safe and green, as well as more efficient in all its operations. 3. Building One Company to realise operational excellence, scale benefits and synergies throughout the Group. Developing the common Ramirent platform is an integral part of the activities that will deliver a 300 bps EBITA margin improvement at Group level, from 14% in 2012 to 17% by the end of 2016. 4. Maintaining agility in business through a diversified business portfolio of customers, products, competences and geographies. To offset its dependency on the construction sector, Ramirent targets the share of non–construction dependent customer segments to account for up to approximately 40% of the Group’s net sales. The aim of Ramirent Group’s strategy is to generate healthy returns to the shareholders under financial stability. The long–term financial targets are as follows: 1. Profit generation: Return on equity, ROE, of 18% over a business cycle 2. Leverage and risk: Net debt to EBITDA below 1.6x at the end of each fiscal year 3. Dividend: Dividend pay–out ratio of at least 40% of the net profit RISK MANAGEMENT AND BUSINESS RISKS Risks are events or circumstances, which, if materialised, can either positively or negatively affect the chances of Ramirent achieving its targets. The purpose of risk management in Ramirent is to ensure

INTERIM REPORT Q2 2015 I RAMIRENT GROUP 19
continuity of operations and that Ramirent Group reaches its objectives. The Board of Directors approves the risk policy principles. Risk mapping and assessment is conducted as a part of the annual strategy process at the country, segment and Group level. Management sets indicators to follow and measures to take in case the risks materialise which are described in action plans prepared during the assessment of risks. Action plans include the risk owner and timeline for the actions to be completed. The Group Management Team, together with the segment and country management, is responsible for monitoring risk indicators regularly and implementing risk management measures whenever needed. An essential part of Ramirent’s risk management is to maintain and develop appropriate insurance coverage of our fleet. Group insures all personnel, financial, operative and hazard risks which after risk management measures are above Group´s risk retention limit and cost-effective to insure. The Ramirent risk management policy was developed in 2014 based on the COSO ERM Framework and the ISO 31000 'Risk management - Principles and guidelines' standard. Risk Management Policy has a direct linkage to the Internal Control Policy which was developed in parallel and is based on COSO 2013 framework. The risk management process is directly linked to Ramirent’s objectives. The Risk Management process identifies and assesses the relevant risks in relation to the objectives. The strategic risks described below comprise the key risks that Ramirent and its shareholders are exposed to. Changes in the demand of customer industries may affect Ramirent’s operations as well as its financial position. Such changes may be related to, among other things, economic cycles, and changed strategies in customer companies, product requirements or environmental aspects. Ramirent strives to reduce risk of being overly dependent on any sector by seeking new customer groups outside the construction sector and contracts with longer durations. Ramirent operates in a highly competitive environment and existing competitors or new entrants
to the market may take actions to establish sustainable competitive advantage over Ramirent. Ramirent focuses on active sales, fleet availability and competitive product and service offering. Ramirent operates flexibly by offering general rental services from single product to managing the entire fleet capacity for a project site, technical support and local presence. Ramirent continues to invest in education and to develop tools for project management in order to run projects professionally and cost-efficiently. A common fleet structure has been created in order to optimise utilisation and defend price levels. Ramirent will continue to streamline its fleet in accordance with the fleet strategy prepared for each market and within the selected brands. Special attention has been paid to fleet management processes such as maintenance and repair in order to optimise fleet utilisation. Ramirent’s operations are dependent on external, internal and embedded information technology services and solutions. Ramirent aims to use reliable information technology solutions and information security management to avoid interruptions, exposure to data loss and compromised confidentiality or usability of information. A common platform is being built to realise synergies in the Group and to ensure long-term profitability. As many other changes in the business model are planned to take place at the same time, the adequacy of resources, the schedule and scope remain challenging. More internal resources have been allocated for the project and higher focus has been put on communicating the change beforehand in order to prepare the organisation for the change. Organisation structures are also being further developed to support realisation of synergies. Operating in diversified markets includes risks related to the local laws and regulations which need to be taken into account when drafting uniform operating principles. Ramirent applies a decentralised organisational model, which implies a high degree of autonomy for its business units. Business control in such an organisation imposes requirements on reporting and supervision, which may be cumbersome for certain parts of the organisation and could make it difficult for

INTERIM REPORT Q2 2015 I RAMIRENT GROUP 20
Group management to implement measures quickly at the business unit level in changing circumstances. Ramirent has developed the communication and training of Group instructions, and continues to improve reporting quality. The whistle blowing system has been published on the home pages and intranet of all countries and Group to encourage both employees and third party to report any misconduct. All reported matters are investigated and responsible persons will be made accountable. Ramirent is subject to certain financial risks such as foreign currency, interest rate, liquidity and funding risks. The financial risk management in Ramirent strives to secure the sufficient funding for operational needs and to minimise the funding costs and the effects of changes in foreign exchange rates, interest rates and other financial risks cost-effectively. Fluctuations in currency exchange rates can significantly affect Ramirent’s financial result. The effect of exchange rate fluctuations is visible when translating the net sales and financial results of our subsidiaries outside the eurozone into euros. Changes in the exchange rates may increase or decrease net sales or results. Hedging operations are managed centrally by Group Treasury. Credit risk is defined as the possibility of a customer not fulfilling its commitments towards Ramirent. Ramirent’s business units are responsible for credit risks related to sales activities and assess the credit quality of their customers by taking into account the customer’s financial position, past experience and other relevant factors. When appropriate, advance payments, deposits, letters of credit and third party guarantees are used to mitigate credit risks. Customer credit risks in Ramirent are diversified as trade receivables are generated by a large number of customers.
RAMIRENT OUTLOOK FOR FULL YEAR 2015 UNCHANGED Ramirent expects the market picture in 2015 to remain mixed, with challenging market conditions especially in Finland and Norway. We expect full-year 2015 net sales and EBITA margin to be similar to the level of 2014 when measured in local currencies. FORWARD−LOOKING STATEMENTS Certain statements in this report, which are not historical facts, including, without limitation, those regarding expectations for general economic development and market situation; regarding customer industry profitability and investment willingness; regarding Company growth, development and profitability; regarding cost savings; regarding fluctuations in exchange rates and interest levels; regarding the success of pending and future acquisitions and restructurings; and statements preceded by "believes," "expects," "anticipates," "foresees" or similar expressions are forward−looking statements. These statements are based on current expectations and currently known facts. Therefore, they involve risks and uncertainties that may cause actual results to differ materially from results currently expected by the Company. In conjunction with the strategy process, Ramirent’s Board of Directors assesses the need to revise the financial targets. Changes in financial targets are published as a stock exchange release. Based on its financial targets and the current market outlook, Ramirent gives a general outlook for the current financial year in conjunction with the full year report and interim reports. The outlook is given for the entire year and not for each quarter .

INTERIM REPORT Q2 2015 I RAMIRENT GROUP 21
TABLES This interim report is prepared in accordance with IAS 34 Interim financial reporting. The accounting principles described in the Group's annual financial statements for the year ended 31 December 2014 have been applied except for the new and revised IFRS standards adopted from 1 January 2015.
Consolidated financial statements have been presented in thousand euros unless otherwise stated. All figures in the accounts have been rounded and consequently the sum of individual figures can deviate from the presented sum figure.
The financial information in this interim report has not been audited.

INTERIM REPORT Q2 2015 I RAMIRENT GROUP 22
CONSOLIDATED STATEMENT OF INCOME 4–6/15 4–6/14 1–6/15 1–6/14 1–12/14 (EUR 1,000)
Rental income 99,834 98,146 187,439 184,870 395,341 Ancillary income 54,881 47,886 102,638 93,178 193,481 Sales of equipment 4,719 5,755 9,933 11,276 24,714 NET SALES 159,435 151,786 300,010 289,324 613,536 Other operating income 4,765 804 5,433 1,153 2,290 Materials and services −58,334 −51,563 −111,273 −96,420 −209,162 Employee benefit expenses −37,608 −37,468 −75,380 −74,597 −150,305 Other operating expenses −22,357 −21,178 −44,238 −44,971 −88,003 Share of result in associates and joint ventures 108 −152 58 −582 −486 Depreciation, amortisation and impairment charges −27,253 −28,009 −53,893 −54,312 −109,728 EBIT 18,755 14,219 20,718 19,595 58,143 Financial income 3,005 2,076 8,026 4,171 11,292 Financial expenses −5,108 −7,148 −12,307 −11,399 −26,974 Total financial income and expenses −2,103 −5,072 −4,280 −7,229 −15,683 EBT 16,652 9,147 16,437 12,367 42,460 Income taxes −3,410 −2,145 −3,361 −2,805 −10,370 RESULT FOR THE PERIOD 13,243 7,002 13,077 9,562 32,090
Result for the period attributable to: Shareholders of the parent company 13,166 7,147 13,139 9,707 32,632 Non-controlling interest 77 −145 −62 −145 −542 TOTAL 13,243 7,002 13,077 9,562 32,090 Earnings per share (EPS) on parent company shareholders’ share of result
Basic, EUR 0.12 0.07 0.12 0.09 0.30 Diluted, EUR 0.12 0.07 0.12 0.09 0.30

INTERIM REPORT Q2 2015 I RAMIRENT GROUP 23
CONSOLIDATED STATEMENT OF FINANCIAL POSITION 30/6/2015 30/6/2014 31/12/2014 (EUR 1,000)
ASSETS
NON–CURRENT ASSETS
Goodwill 141,952 140,529 139,780 Other intangible assets 45,495 45,745 46,720 Property, plant and equipment 420,476 438,805 406,001 Investments in associates and joint ventures 8,877 16,314 5,278 Non–current loan receivables 16,416 19,261 17,666 Available–for–sale investments 142 147 139 Deferred tax assets 619 677 605 TOTAL NON–CURRENT ASSETS 633,977 661,477 616,189 CURRENT ASSETS Inventories 18,400 13,247 12,431 Trade and other receivables 118,732 115,576 109,370 Current tax assets 6,588 3,026 2,775 Cash and cash equivalents 1,728 12,356 3,129 TOTAL CURRENT ASSETS 145,449 144,205 127,705
CONSOLIDATED STATEMENT OF COMPREHENSIVE INCOME 4–6/15
4–6/14 1–6/15
1–6/14
1–12/14
(EUR 1,000) RESULT FOR THE PERIOD 13,243 7,002 13,077 9,562 32,090 Other comprehensive income: Items that will not be reclassified to profit or loss: Actuarial gains/(losses) on defined benefit plans, net of tax − − − − −2,567
Items that may be reclassified to profit or loss in subsequent periods:
Translation differences −886 −4,377 5,350 −5,135 −14,677 Cash flow hedges, net of tax 34 −203 109 6 597 Share of other comprehensive income in associates and joint ventures 62 1,479 2,963 −1,624 −12,689 Available for sale investments −1 −64 3 −63 −70 TOTAL −791 −3,166 8,426 −6,816 −26,840 OTHER COMPREHENSIVE INCOME FOR THE PERIOD −791 −3,166 8,426 −6,816 −29,407 TOTAL COMPREHENSIVE INCOME FOR THE PERIOD 12,452 3,837 21,502 2,746 2,683 Total comprehensive income for the period attributable to: Shareholders of the parent company 12,375 3,982 21,564 2,891 3,225 Non-controlling interest 77 −145 −62 −145 −542 TOTAL 12,452 3,837 21,502 2,746 2,683
INTERIM REPORT Q2 2015 I RAMIRENT GROUP 24
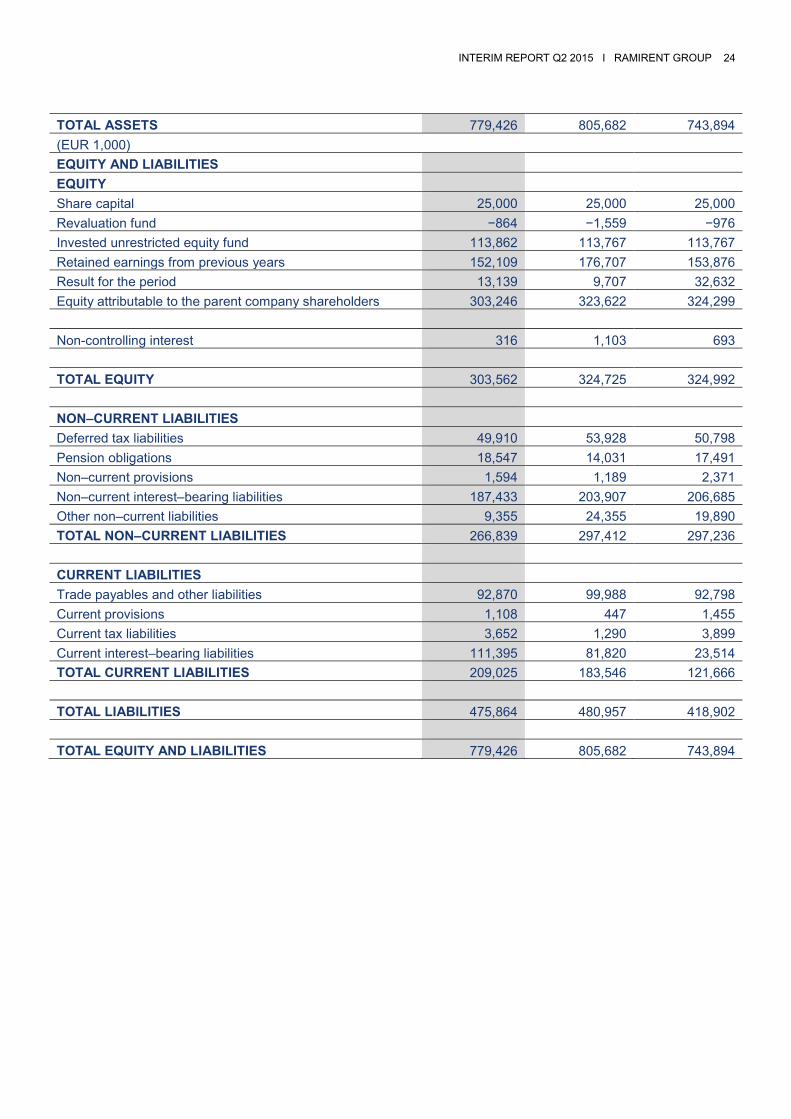
TOTAL ASSETS 779,426 805,682 743,894 (EUR 1,000)
EQUITY AND LIABILITIES
EQUITY
Share capital 25,000 25,000 25,000 Revaluation fund −864 −1,559 −976 Invested unrestricted equity fund 113,862 113,767 113,767 Retained earnings from previous years 152,109 176,707 153,876 Result for the period 13,139 9,707 32,632 Equity attributable to the parent company shareholders 303,246 323,622 324,299 Non-controlling interest 316 1,103 693 TOTAL EQUITY 303,562 324,725 324,992 NON–CURRENT LIABILITIES Deferred tax liabilities 49,910 53,928 50,798 Pension obligations 18,547 14,031 17,491 Non–current provisions 1,594 1,189 2,371 Non–current interest–bearing liabilities 187,433 203,907 206,685 Other non–current liabilities 9,355 24,355 19,890 TOTAL NON–CURRENT LIABILITIES 266,839 297,412 297,236 CURRENT LIABILITIES Trade payables and other liabilities 92,870 99,988 92,798 Current provisions 1,108 447 1,455 Current tax liabilities 3,652 1,290 3,899 Current interest–bearing liabilities 111,395 81,820 23,514 TOTAL CURRENT LIABILITIES 209,025 183,546 121,666 TOTAL LIABILITIES 475,864 480,957 418,902 TOTAL EQUITY AND LIABILITIES 779,426 805,682 743,894

INTERIM REPORT Q2 2015 I RAMIRENT GROUP 25
CONSOLIDATED CASH FLOW STATEMENT 4–6/15 4–6/14 1–6/15 1–6/14 1–12/14 (EUR 1,000) CASH FLOW FROM OPERATING ACTIVITIES EBT 16,652 9,147 16,437 12,367 42,460 Adjustments Depreciation, amortisation and impairment charges 27,253 28,009 53,893 54,312 109,728 Adjustment for proceeds from sale of used rental equipment 1,613 8,258 3,730 10,870 17,136 Financial income and expenses 2,103 5,072 4,280 7,229 15,683 Other adjustments −6,150 −3,071 −6,042 1,018 −6,140 Cash flow from operating activities before change in working capital 41,470 47,415 72,298 85,796 178,867 Change in working capital Change in trade and other receivables −11,536 −4,044 −12,485 −2,015 −2,150 Change in inventories 1,250 −893 −5,900 −1,537 −1,472 Change in non–interest–bearing liabilities 4,879 6,892 9,470 −17,299 −12,302 Cash flow from operating activities before interest and taxes 36,064 49,370 63,384 64,944 162,942 Interest paid −2,855 −7,688 −6,597 −7,845 −10,418 Interest received 291 703 354 703 620 Income tax paid −4,379 −2,601 −9,719 −6,660 −12,646 NET CASH FLOW FROM OPERATING ACTIVITIES 29,120 39,784 47,423 51,141 140,499 CASH FLOW FROM INVESTING ACTIVITIES Acquisition of businesses and subsidiaries, net of cash −6,200 −27,272 −6,200 −27,272 −29,872 Investments in associates and joint ventures − − −736 − − Investment in tangible non–current asset (rental equipment) −44,452 −32,109 −60,243 −52,767 −88,902 Investment in other tangible non–current assets −582 −493 −1,011 −578 −504 Investment in intangible non–current assets −1,760 −2,138 −2,798 −3,459 −9,680 Proceeds from sale of tangible and intangible non–current assets (excluding used rental equipment) 77 1,850 186 7,482 7,713 Proceeds from sales of other investments 750 − 750 − − Loan receivables, increase, decrease and other changes 755 1,000 1,250 1,000 2,594 NET CASH FLOW FROM INVESTING ACTIVITIES −51,411 −59,163 −68,802 −75,594 −118,651 CASH FLOW FROM FINANCING ACTIVITIES Dividends paid −43,095 -39,858 −43,095 −39,858 −39,858 Changes in ownership interests in subsidiaries −5,475 − −5,475 − − Borrowings and repayments of current debt (net) 70,177 74,053 87,880 80,063 22,686 Borrowings of non–current debt − − − − 2,651 Repayments of non–current debt −654 −5,245 −19,332 −5,245 −6,047 NET CASH FLOW FROM FINANCING ACTIVITIES 20,953 28,950 19,978 34,960 −20,567 NET CHANGE IN CASH AND CASH EQUIVALENTS DURING THE FINANCIAL YEAR −1,338 9,572 −1,401 10,507 1,281 Cash at the beginning of the period 3,066 2,784 3,129 1,849 1,849 Translation differences − − − − − Change in cash −1,338 9,572 −1,401 10,507 1,281 Cash at the end of the period 1,728 12,356 1,728 12,356 3,129
Presentation of the figures in the consolidated cash flow statement for January–June 2014 has been adjusted. After adjustment the cash flows reflect better the impact of acquired businesses.

INTERIM REPORT Q2 2015 I RAMIRENT GROUP 26
CONSOLIDATED STATEMENT OF CHANGES IN EQUITY
(EUR 1,000) Share capital
Revaluation fund
Invested unrestricted equity fund
Translation differences
Retained earnings
Equity attributable
to sharehol-ders of the
parent company
Non-controlling
interest
Total equity
EQUITY 1.1.2014 25,000 −1,502 113,568 −8,346 242,258 370,978 − 370,978
Translation differences − − − −5,135 − −5,135 − −5,135
Cash flow hedges − 6 − − − 6 − 6
Share of other comprehensive
income in associates and joint
ventures − − − −1,624 − −1,624 − −1,624
Available for sales investments − −63 − − − −63 − −63
Result for the period − − − − 9,707 9,707 −145 9,562
TOTAL COMPREHENSIVE INCOME
FOR THE PERIOD − −57 − −6,759 9,707 2,891 −145 2,746
Share based payments − − − − 129 129 − 129
Issue of treasury shares − − 199 − − 199 − 199
Dividend distribution − − − − −39,858 −39,858 − −39,858
Acquisition of subsidiary with non-
controlling interest − − − − − − 1,248 1,248
Redemption liability on non-
controlling interest option − − − − −10,717 −10,717 − −10,717
TOTAL TRANSACTIONS WITH
SHAREHOLDERS − − 199 − −50,446 −50,246 1,248 −48,998
EQUITY 30.6.2014 25,000 −1,559 113,767 −15,105 201,519 323,622 1,103 324,725
Translation differences − − − −9,542 − −9,542 − −9,542
Actuarial gains/losses on defined
benefit plans − − − - −2,567 −2,567 − −2,567
Cash flow hedges − 590 − − − 590 − 590
Share of other comprehensive
income
in associates and joint ventures − − − −11,065 − −11,065 − −11,065
Available–for–sale investments − −7 − − − −7 − −7
Result for the period − − − − 22,925 22,925 −397 22,528
TOTAL COMPREHENSIVE
INCOME
FOR THE PERIOD − 583 − −20,607 20,359 334 −397 −63
Share based payments − − − − −32 −32 − −32
Acquisition of subsidiary with non-
controlling interest − − − − − − −12 −12
Redemption liability on non-
controlling
interest option − − − − 375 375 − 375
TOTAL TRANSACTIONS WITH SHAREHOLDERS − − − - 343 343 −12 330
EQUITY 31.12.2014 25,000 −976 113,767 −35,712 222,220 324,299 693 324,992
Translation differences − − − 5,350 − 5,350 − 5,350

INTERIM REPORT Q2 2015 I RAMIRENT GROUP 27
Cash flow hedges − 109 − − − 109 − 109
Share of other comprehensive
income in associates and joint
ventures − − − 2,963 − 2,963 − 2,963
Available for sale investments − 3 − − − 3 − 3
Result for the period − − − − 13,139 13,139 −62 13,077
TOTAL COMPREHENSIVE INCOME FOR THE PERIOD − 112 − 8,313 13,139 21,564 −62 21,502
Share based payments − − − − 67 67 − 67
Issue of treasury shares − − 95 − − 95 − 95
Dividend distribution − − − − −43,095 −43,095 − −43,095
Changes in ownership interests in
subsidiaries − − − − 315 315 −315 −
TOTAL TRANSACTIONS WITH
SHAREHOLDERS − − 95 − −42,713 −42,618 −315 −42,933
EQUITY 30.6.2015 25,000 −864 113,862 −27,399 192,646 303,246 316 303,562
1) The figures are calculated on a rolling twelve month basis
KEY FINANCIAL FIGURES 4–6/15 4–6/14 1–6/15 1–6/14 1–12/14 (MEUR)
Net sales, EUR million 159.4 151.8 300.0 289.3 613.5 Change in net sales, % 5.0% −5.6% 3.7% −7.7% −5.2% EBITDA, EUR million 46.0 42.2 74.6 73.9 167.9 % of net sales 28.9% 27.8% 24.9% 25.5% 27.4% EBITA, EUR million 21.0 16.2 25.2 23.3 65.8 % net sales 13.2% 10.7% 8.4% 8.0% 10.7% EBIT, EUR million 18.8 14.2 20.7 19.6 58.1 % of net sales 11.8% 9.4% 6.9% 6.8% 9.5% EBT, EUR million 16.7 9.1 16.4 12.4 42.5 % of net sales 10.4% 6.0% 5.5% 4.3% 6.9% Result for the period attributable to the owners of the parent company, EUR million 13.2 7.1 13.1 9.7 32.6 % of net sales 8.3% 4.7% 4.4% 3.4% 5.3% Gross capital expenditure, EUR million 46.8 78.3 65.0 101.8 144.6 % of net sales 29.4% 51.6% 21.7% 35.2% 23.6% Invested capital, EUR million, end of period 602.4 610.5 555.2 Return on invested capital (ROI), %1) 12.3% 11.9% 12.2% Return on equity (ROE), %1) 11.5% 12.1% 9.4% Interest–bearing debt, EUR million 298.8 285.7 230.2 Net debt, EUR million 297.1 273.4 227.1 Net debt to EBITDA ratio1) 1.8x 1.6x 1.4x Gearing, % 97.9% 84.2% 69.9% Equity ratio, % 39.0% 40.3% 43.7% Personnel, average during reporting period 2,620 2,553 2,566 Personnel, at end of reporting period 2,682 2,651 2,576

INTERIM REPORT Q2 2015 I RAMIRENT GROUP 28
1) The figures are calculated on a rolling twelve month basis 2) Excluding treasury shares
SHARE–RELATED KEY FIGURES 4–6/15 4–6/14 1–6/15 1–6/14 1–12/14
Earnings per share (EPS), diluted, EUR 0.12 0.07 0.12 0.09 0.30
Earnings per share (EPS), non–diluted, EUR 0.12 0.07 0.12 0.09 0.30
Equity per share, at end of reporting period, diluted, EUR
2.81 3.00 3.01
Equity per share, at end of reporting period, non–diluted EUR
2.81 3.00 3.01
Dividend per share, EUR 0.40
Payout ratio, % 132.0%
Effective dividend yield, % 6.2%
Price/earnings ratio (P/E)1) 19.6 21.8 21.3
Highest share price, EUR 7.45 10.25 10.25
Lowest share price, EUR 6.33 7.21 5.61
Average share price, EUR 6.91 8.46 7.71
Share price at end of reporting period, EUR 6.55 8.17 6.45
Market capitalisation at end of reporting period, EUR million2)
705.7 880.1 694.8
Number of shares traded (thousands) 20,697.5 24,295.1 40,519.4
Shares traded, % of total number of shares 19.1% 22.6% 37.6%
Number of shares, weighted average, diluted 107,732,415 107,711,647 107,717,557
Number of shares, weighted average, non–diluted 107,732,415 107,711,647 107,717,557
Number of shares, at end of reporting period, diluted 107,736,679 107,723,371 107,723,371
Number of shares, at end of reporting period, non–diluted 107,736,679 107,723,371 107,723,371

INTERIM REPORT Q2 2015 I RAMIRENT GROUP 29
NOTES TO THE INTERIM FINANCIAL STATEMENTS Segment information Segment information is presented according to the IFRS standards. Items below EBIT – financial items and taxes – are not allocated to the segments. NET SALES 4–6/15 4–6/14 1–6/15 1–6/14 1–12/14 (MEUR)
FINLAND - Net sales (external) 39.3 38.7 71.3 70.2 151.9 - Inter–segment sales 0.1 0.3 0.1 0.5 0.9 SWEDEN - Net sales (external) 56.4 48.5 107.2 93.8 200.4 - Inter–segment sales 0.3 0.2 0.6 0.2 0.7 NORWAY - Net sales (external) 30.9 33.9 61.8 67.3 135.1 - Inter–segment sales 0.1 −0.1 0.2 0.5 0.6 DENMARK - Net sales (external) 10.6 9.1 20.0 18.7 39.4 - Inter–segment sales 0.0 − 0.0 − − EUROPE EAST - Net sales (external) 8.5 8.2 15.1 14.4 33.8 - Inter–segment sales 0.0 0.0 0.0 0.0 0.1 EUROPE CENTRAL - Net sales (external) 13.7 13.3 24.7 24.9 52.9 - Inter–segment sales 0.0 0.0 0.0 0.3 0.3 Elimination of sales between segments −0.6 −0.4 −1.0 −1.5 −2.4 GROUP NET SALES 159.4 151.8 300.0 289.3 613.5
EBITA 4–6/15 4–6/14 1–6/15 1–6/14 1–12/14 (MEUR and % of net sales) FINLAND 4.5 6.0 5.3 8.9 20.8 % of net sales 11.3% 15.4% 7.4% 12.7% 13.6% SWEDEN 12.1 6.7 17.2 10.9 29.4 % of net sales 21.4% 13.8% 16.0% 11.6% 14.6% NORWAY 2.9 4.2 3.9 6.8 14.0 % of net sales 9.4% 12.5% 6.3% 10.0% 10.3% DENMARK 0.3 −1.7 −1.1 −2.9 −3.9 % of net sales 2.8% −19.1% −5.4% −15.3% −10.0% EUROPE EAST 1.7 1.0 1.9 0.9 6.7 % of net sales 20.4% 12.1% 12.4% 6.1% 19.6% EUROPE CENTRAL 0.9 0.8 0.3 −0.4 1.7 % of net sales 6.2% 5.8% 1.2% −1.7% 3.2% Net items not allocated to segments −1.4 −0.8 −2.3 −1.0 −2.8 GROUP EBITA 21.0 16.2 25.2 23.3 65.8 % of net sales 13.2% 10.7% 8.4% 8.0% 10.7%

INTERIM REPORT Q2 2015 I RAMIRENT GROUP 30
DEPRECIATION, AMORTISATION AND IMPAIRMENT CHARGES 4–6/15
4–6/14
1–6/15
1–6/14
1–12/14
(MEUR) FINLAND Depreciation 6.0 6.2 12.0 11.7 24.5 Amortisation 0.3 0.4 0.7 0.7 1.5 SWEDEN Depreciation 7.4 7.6 14.7 15.0 29.8 Amortisation 1.1 0.7 2.1 1.3 3.0 NORWAY Depreciation 5.6 6.1 11.0 11.7 23.2 Amortisation 0.6 0.5 1.3 1.1 1.8 DENMARK Depreciation 1.3 1.5 2.8 3.1 6.0 Amortisation 0.1 − 0.2 − − EUROPE EAST Depreciation 1.8 1.8 3.5 3.4 6.9 Amortisation 0.0 0.0 0.1 0.1 0.1 EUROPE CENTRAL Depreciation 2.9 3.0 5.7 5.8 12.1 Amortisation and impairment charges 0.0 0.0 0.1 0.1 0.1 Unallocated items and eliminations 0.0 0.2 −0.2 0.3 0.8 Depreciation total 25.0 26.1 49.4 50.6 102.0 Amortisation total 2.3 1.9 4.5 3.7 7.7 TOTAL 27.3 28.0 53.9 54.3 109.7
EBIT 4–6/15 4–6/14 1–6/15 1–6/14 1–12/14 (MEUR and % of net sales) FINLAND 4.1 5.6 4.6 8.3 19.3 % of net sales 10.5% 14.4% 6.4% 11.7% 12.6% SWEDEN 11.0 6.0 15.1 9.6 26.3 % of net sales 19.4% 12.4% 14.0% 10.2% 13.1% NORWAY 2.3 3.7 2.6 5.7 12.2 % of net sales 7.5% 10.9% 4.3% 8.5% 9.0% DENMARK 0.2 −1.7 −1.3 −2.9 −3.9 % of net sales 2.0% −19.1% −6.4% −15.3% −10.0% EUROPE EAST 1.7 1.0 1.8 0.8 6.5 % of net sales 20.2% 11.7% 12.0% 5.6% 19.3% EUROPE CENTRAL 0.8 0.7 0.2 −0.5 1.6 % of net sales 6.1% 5.6% 0.9% −1.9% 3.0% Net items not allocated to segments −1.3 −1.1 −2.3 −1.5 −3.9 GROUP EBIT 18.8 14.2 20.7 19.6 58.1 % of net sales 11.8% 9.4% 6.9% 6.8% 9.5%
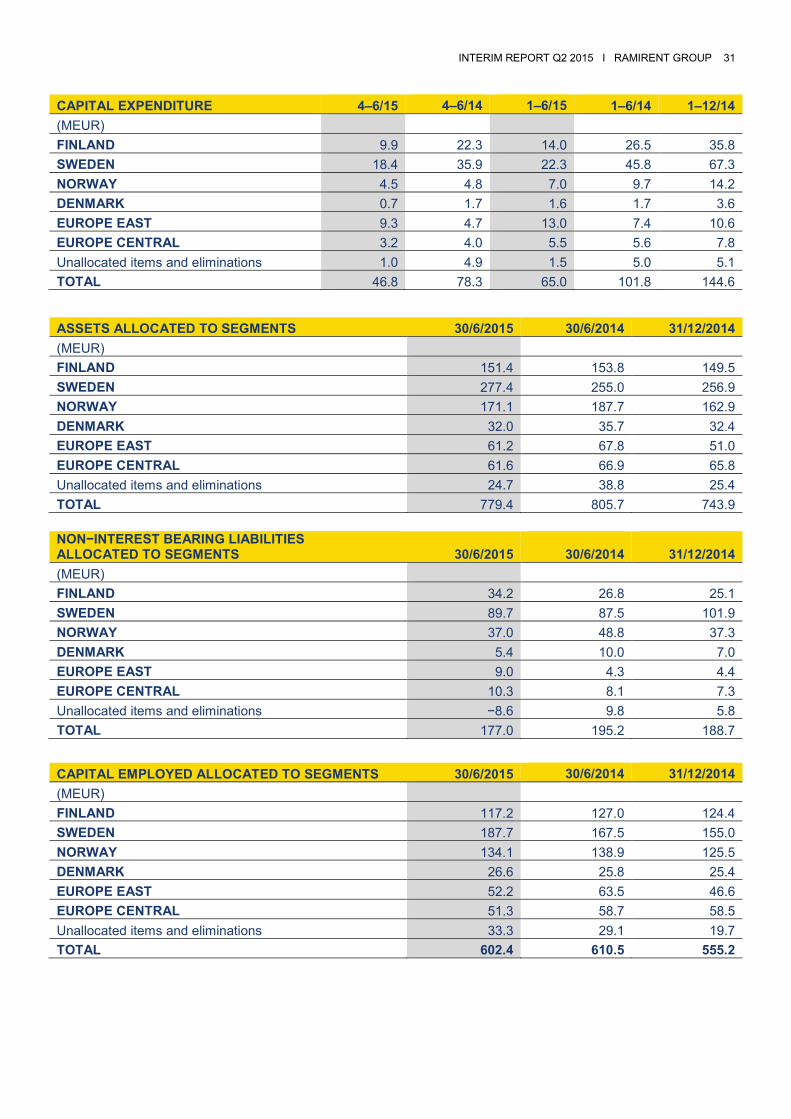
INTERIM REPORT Q2 2015 I RAMIRENT GROUP 31
NON−INTEREST BEARING LIABILITIES ALLOCATED TO SEGMENTS 30/6/2015
30/6/2014
31/12/2014
(MEUR)
FINLAND 34.2 26.8 25.1 SWEDEN 89.7 87.5 101.9 NORWAY 37.0 48.8 37.3 DENMARK 5.4 10.0 7.0 EUROPE EAST 9.0 4.3 4.4 EUROPE CENTRAL 10.3 8.1 7.3 Unallocated items and eliminations −8.6 9.8 5.8 TOTAL 177.0 195.2 188.7
CAPITAL EXPENDITURE 4–6/15 4–6/14 1–6/15 1–6/14 1–12/14 (MEUR)
FINLAND 9.9 22.3 14.0 26.5 35.8 SWEDEN 18.4 35.9 22.3 45.8 67.3 NORWAY 4.5 4.8 7.0 9.7 14.2 DENMARK 0.7 1.7 1.6 1.7 3.6 EUROPE EAST 9.3 4.7 13.0 7.4 10.6 EUROPE CENTRAL 3.2 4.0 5.5 5.6 7.8 Unallocated items and eliminations 1.0 4.9 1.5 5.0 5.1 TOTAL 46.8 78.3 65.0 101.8 144.6
ASSETS ALLOCATED TO SEGMENTS 30/6/2015 30/6/2014 31/12/2014 (MEUR)
FINLAND 151.4 153.8 149.5 SWEDEN 277.4 255.0 256.9 NORWAY 171.1 187.7 162.9 DENMARK 32.0 35.7 32.4 EUROPE EAST 61.2 67.8 51.0 EUROPE CENTRAL 61.6 66.9 65.8 Unallocated items and eliminations 24.7 38.8 25.4 TOTAL 779.4 805.7 743.9
CAPITAL EMPLOYED ALLOCATED TO SEGMENTS 30/6/2015 30/6/2014 31/12/2014 (MEUR) FINLAND 117.2 127.0 124.4 SWEDEN 187.7 167.5 155.0 NORWAY 134.1 138.9 125.5 DENMARK 26.6 25.8 25.4 EUROPE EAST 52.2 63.5 46.6 EUROPE CENTRAL 51.3 58.7 58.5 Unallocated items and eliminations 33.3 29.1 19.7 TOTAL 602.4 610.5 555.2
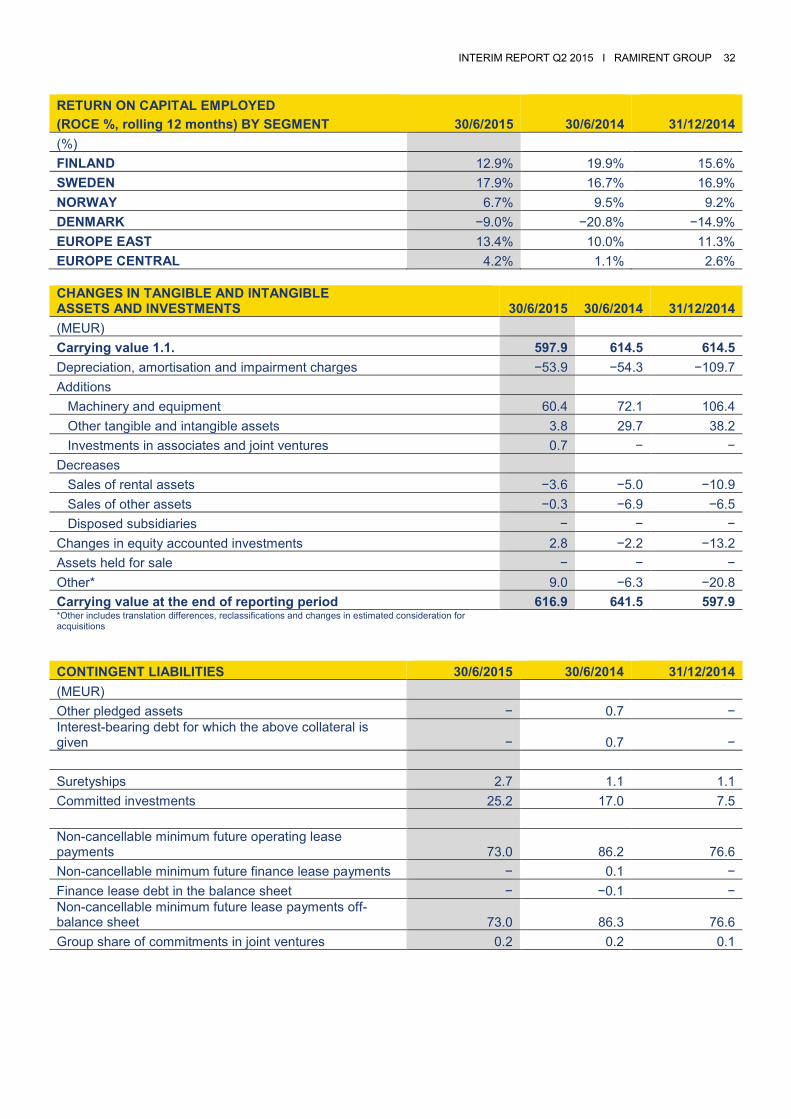
INTERIM REPORT Q2 2015 I RAMIRENT GROUP 32
CONTINGENT LIABILITIES 30/6/2015 30/6/2014 31/12/2014 (MEUR)
Other pledged assets − 0.7 − Interest-bearing debt for which the above collateral is given − 0.7 − Suretyships 2.7 1.1 1.1 Committed investments 25.2 17.0 7.5 Non-cancellable minimum future operating lease payments 73.0 86.2 76.6 Non-cancellable minimum future finance lease payments − 0.1 − Finance lease debt in the balance sheet − −0.1 − Non-cancellable minimum future lease payments off-balance sheet 73.0 86.3 76.6 Group share of commitments in joint ventures 0.2 0.2 0.1
RETURN ON CAPITAL EMPLOYED (ROCE %, rolling 12 months) BY SEGMENT 30/6/2015
30/6/2014
31/12/2014
(%) FINLAND 12.9% 19.9% 15.6% SWEDEN 17.9% 16.7% 16.9% NORWAY 6.7% 9.5% 9.2% DENMARK −9.0% −20.8% −14.9% EUROPE EAST 13.4% 10.0% 11.3% EUROPE CENTRAL 4.2% 1.1% 2.6%
CHANGES IN TANGIBLE AND INTANGIBLE ASSETS AND INVESTMENTS 30/6/2015 30/6/2014 31/12/2014 (MEUR)
Carrying value 1.1. 597.9 614.5 614.5 Depreciation, amortisation and impairment charges −53.9 −54.3 −109.7 Additions Machinery and equipment 60.4 72.1 106.4 Other tangible and intangible assets 3.8 29.7 38.2 Investments in associates and joint ventures 0.7 − − Decreases Sales of rental assets −3.6 −5.0 −10.9 Sales of other assets −0.3 −6.9 −6.5 Disposed subsidiaries − − − Changes in equity accounted investments 2.8 −2.2 −13.2 Assets held for sale − − − Other* 9.0 −6.3 −20.8 Carrying value at the end of reporting period 616.9 641.5 597.9 *Other includes translation differences, reclassifications and changes in estimated consideration for acquisitions

INTERIM REPORT Q2 2015 I RAMIRENT GROUP 33
OBLIGATIONS ARISING FROM DERIVATIVE INSTRUMENTS 30/6/2015
30/6/2014 31/12/2014
(MEUR)
Cross–currency and interest rate swaps
Nominal value of underlying object 58.1 88.7 52.7 Fair value of the derivative instruments −1.3 −2.2 −1.7 Foreign currency forwards Nominal value of underlying object 40.2 53.6 32.7 Fair value of the derivative instruments 0.3 0.3 −0.0
The table below analyses financial instruments carried at fair value, by valuation method. The different levels have been defined as follows: Level 1: quoted prices (unadjusted) in active markets for identical assets or liabilities Level 2: inputs other than quoted prices included within Level 1 that are observable for the asset or liability, either directly (i.e., as prices) or indirectly (i.e., derived from prices) Level 3: inputs for the asset or liability that are not based on observable market data (unobservable inputs). 30/6/2015 Level 1 Level 2 Level 3 (MEUR) Cross currency and interest rate swaps − −1.3 − Foreign currency forwards − 0.3 − Contingent considerations − − 10.8
30/6/2014 Level 1 Level 2 Level 3 (MEUR) Cross currency and interest rate swaps − −2.2 − Foreign currency forwards − 0.3 − Contingent considerations − − 33.3 RECONCILIATION OF LEVEL 3 FAIR VALUES 30/6/2015 30/6/2014 31/12/2014 (MEUR)
Carrying value 1.1. 25.5 10.2 10.2 Translation differences 0.4 0.0 −0.8 Additions – 25.2 25.3 Payments of contingent considerations −11.7 −2.7 −10.9 Recognised in other operating income −4.3 – – Discount interest recognised in financial expenses 0.9 0.7 1.7 Carrying value at the end of reporting period 10.8 33.3 25.5
FAIR VALUED FINANCIAL ASSETS LEVELS

INTERIM REPORT Q2 2015 I RAMIRENT GROUP 34
FAIR VALUES VERSUS CARRYING AMOUNTS OF FINANCIAL ASSETS AND LIABILITIES
Carrying Fair Carrying Fair amount value Amount value
30/6/2015 30/6/2015 30/6/2014 30/6/2014 (MEUR) FINANCIAL ASSETS Non–current loan receivables 16.4 16.4 19.3 19.3 Available–for–sale investments 0.1 0.1 0.1 0.1 Trade receivables 101.0 101.0 96.8 96.8 Cash and cash equivalents 1.7 1.7 12.3 12.3 Total 119.3 119.3 128.5 128.5 FINANCIAL LIABILITIES Loans from financial institutions 89.4 89.4 102.3 102.3 Bond 99.4 106.0 99.2 106.0 Commercial papers 110.0 110.0 83.0 83.0 Finance lease liabilities 0.0 0.0 0.1 0.1 Other non–current liabilities 9.5 9.5 25.5 25.5 Other liabilities 1.4 1.4 8.9 8.9 Trade payables 31.5 31.5 36.8 36.8 Total 341.1 347.7 355.8 362.6 Cross currency and interest rate swaps 58.1 −1.3 88.7 −2.2 Foreign exchange forwards 40.2 0.3 53.6 0.3

INTERIM REPORT Q2 2015 I RAMIRENT GROUP 35
DEFINITION OF KEY FINANCIAL FIGURES Return on equity (ROE) %: Result for the period x 100 Total equity (average over the financial period) Return on invested capital (ROI) %: (Result before taxes + interest and other financial expenses) x 100 Total assets – non–interest–bearing debt (average over the financial period)
Return on capital employed (ROCE) %: (EBIT) x 100 Segment capital employed (average over the financial period) Equity ratio %: Total equity x 100
Total assets – advances received
Earnings per share (EPS) EUR: Result for the period +/– non–controlling interest's share of result for the period
Average number of shares adjusted for share issues during the financial period Shareholders' equity per share EUR: Equity attributable to the parent company's shareholders
Number of shares adjusted for share issues on reporting date Payout ratio %: Dividend per share x 100
Earnings per share Net debt: Interest–bearing debt – cash and cash equivalents Net debt to EBITDA ratio: Net debt Earnings before interest, taxes, amortisation and depreciation Gearing % Net debt x 100
Total equity Dividend per share EUR: Dividend paid
Number of shares on the registration date for dividend distribution Effective dividend yield %: Share-issued-adjusted dividend per share x 100
Share-issued-adjusted final trading price at the end of financial year
Price/earnings ratio: Share-issued-adjusted final trading price Earnings per share

INTERIM REPORT Q2 2015 I RAMIRENT GROUP 36
QUARTERLY SEGMENT INFORMATION
EXCHANGE RATES APPLIED Average Average Average Closing Closing Closing
rates rates rates rates rates rates
1–6/2015 1–6/2014 1–12/2014 30/6/2015 30/6/2014 31/12/2014
DKK 7.4562 7.4627 7.4549 7.4604 7.4557 7.4453 LTL − 3.4528 3.4528 − 3.4528 3.4528 NOK 8.6442 8.2750 8.3548 8.7910 8.4035 9.0420 PLN 4.1397 4.1753 4.1845 4.1911 4.1568 4.2732 SEK 9.3422 8.9540 9.0964 9.2150 9.1762 9.3930 CZK 27.5042 27.4436 27.5353 27.2530 27.4530 27.7350
NET SALES Q2
2015 Q1
2015 Q4
2014 Q3
2014 Q2
2014 Q1
2014 (MEUR) FINLAND 39.4 32.0 38.7 43.5 39.0 31.6 SWEDEN 56.8 51.0 55.0 52.0 48.7 45.4 NORWAY 31.0 31.0 33.9 34.0 33.8 34.0 DENMARK 10.6 9.4 10.6 10.1 9.1 9.6 EUROPE EAST 8.5 6.6 9.2 10.3 8.2 6.2 EUROPE CENTRAL 13.7 11.0 13.8 14.2 13.3 11.8
Elimination of sales between segments −0.6 −0.4
−0.5 −0.5
−0.4 −1.1
NET SALES TOTAL 159.4 140.6 160.7 163.6 151.8 137.5

INTERIM REPORT Q2 2015 I RAMIRENT GROUP 37
EBITA Q2
2015 Q1
2015 Q4
2014 Q3
2014 Q2
2014 Q1
2014 (MEUR and % of net sales)
FINLAND 4.5 0.8 3.6 8.3 6.0 2.9 % of net sales 11.3% 2.5% 9.2% 19.0% 15.4% 9.3% SWEDEN 12.1 5.1 9.5 8.9 6.7 4.2 % of net sales 21.4% 10.0% 17.3% 17.2% 13.8% 9.3% NORWAY 2.9 1.0 3.2 4.0 4.2 2.6 % of net sales 9.4% 3.3% 9.4% 11.8% 12.5% 7.6% DENMARK 0.3 −1.4 −0.9 −0.1 −1.7 −1.1 % of net sales 2.8% −14.8% −8.9% −1.2% −19.1% −11.7% EUROPE EAST 1.7 0.1 2.1 3.7 1.0 −0.1 % of net sales 20.4% 1.9% 22.7% 35.8% 12.1% −1.8% EUROPE CENTRAL 0.9 −0.6 0.5 1.6 0.8 −1.2 % of net sales 6.2% −5.1% 3.9% 11.3% 5.8% −10.2%
Costs not allocated to segments −1.4 −1.0
−3.4 1.6 −0.8 −0.2 GROUP EBITA 21.0 4.1 14.5 28.0 16.2 7.1 % of net sales 13.2% 2.9% 9.0% 17.1% 10.7% 5.2%
EBIT Q2
2015 Q1
2015 Q4
2014 Q3
2014 Q2
2014 Q1
2014 (MEUR and % of net sales)
FINLAND 4.1 0.4 3.2 7.9 5.6 2.6 % of net sales 10.5% 1.4% 8.2% 18.1% 14.4% 8.3% SWEDEN 11.0 4.1 8.7 8.0 6.0 3.6 % of net sales 19.4% 8.0% 15.8% 15.5% 12.4% 7.9% NORWAY 2.3 0.3 2.8 3.6 3.7 2.0 % of net sales 7.5% 1.0% 8.3% 10.6% 10.9% 6.0% DENMARK 0.2 −1.5 −0.9 −0.1 −1.7 −1.1 % of net sales 2.0% −16.0% −8.9% −1.2% −19.1% −11.7% EUROPE EAST 1.7 0.1 2.1 3.7 1.0 −0.1 % of net sales 20.2% 1.3% 22.5% 35.5% 11.7% −2.3% EUROPE CENTRAL 0.8 −0.6 0.5 1.6 0.7 −1.2 % of net sales 6.1% −5.5% 3.7% 11.1% 5.6% −10.5% Costs not allocated to segments −1.3 −0.9 −3.8 1.4 −1.1 −0.4 GROUP EBIT 18.8 2.0 12.5 26.0 14.2 5.4 % of net sales 11.8% 1.4% 7.8% 15.9% 9.4% 3.9%
INTERIM REPORT Q2 2015 I RAMIRENT GROUP 38
ANALYST AND PRESS BRIEFING A briefing for investment analysts and the press will be arranged on Thursday 6 August 2015 at 11:00 a.m. Finnish time at the Ramirent Group head office located at Äyritie 16, Vantaa, Finland. WEBCAST AND CONFERENCE CALL You can participate in the analyst briefing on Thursday 6 August 2015 at 11:00 a.m. Finnish time (EET) through a live webcast at www.ramirent.com and conference call. Dial−in numbers are: +358 981 710 495 (FI), +46 856 642 702 (SE), +44 203 194 0552 (UK), +1 8 557 161 597 (US). Recording of the webcast will be available at www.ramirent.com later the same day. FINANCIAL CALENDAR 2015 Ramirent observes a silent period during 21 days prior to the publication of annual and interim financial results. Interim report January–September 2015 4 November 2015 at 9:00 a.m. The financial information in this stock exchange release has not been audited. Vantaa 6 August 2015 RAMIRENT PLC Board of Directors
INFORMATION Group President and CEO Magnus Rosén tel.+358 20 750 2845 [email protected] CFO and EVP Corporate Functions Jonas Söderkvist tel.+358 20 750 3248 [email protected] SVP Marketing, Communications and IR Franciska Janzon tel.+358 20 750 2859 [email protected] DISTRIBUTION NASDAQ Helsinki Main news media www.ramirent.com

Ramirent Plc | P.O.Box 116 (Äyritie 16), FI-01511 Vantaa, FinlandTel. +358 20 750 200 | Fax +358 20 750 2810 | www.ramirent.comBusiness ID 09771354