interim report ir -15-012 towards innovative solutions ...pure.iiasa.ac.at/11677/1/ir-15-012.pdf ·...
TRANSCRIPT
International Institute for
Applied Systems Analysis
Schlossplatz 1
A-2361 Laxenburg, Austria
Tel: +43 2236 807 342
Fax: +43 2236 71313
E-mail: [email protected]
Web: www.iiasa.ac.at
Interim Reports on work of the International Institute for Applied Systems Analysis receive only limited review. Views or opinions expressed herein do not necessarily represent those of the Institute, its National Member Organizations, or other organizations supporting the work.
Interim Report IR-15-012
Towards Innovative Solutions through Integrative Futures Analysis - Preliminary qualitative scenarios William Cosgrove ([email protected]), Guenther Fischer ([email protected]),
Martina Floerke ([email protected]), Eva Hizsnyik ([email protected]), Piotr
Magnuszewski ([email protected]), Claudia Pahl-Wostl (cpahlwos@uni-
osnabrueck.de), Angelika Scherzer ([email protected]), Andrew Segrave
([email protected]), Geza Toth ([email protected]), Sylvia Tramberend
([email protected]), Michelle van Vliet ([email protected]), David Wiberg
([email protected]), Paul Yillia ([email protected]), Deirdre Zeller ([email protected])
Approved by
Pavel Kabat Director General CeO, IIASA
May 6, 2015

ii
Contents
1. Introduction 1
2. Preliminary Qualitative Scenarios 6
2.1. SCENARIO 1: Sustainability Quest 6
2.1.1 Summary of Scenario 1 6
2.1.2 Analysis under Scenario 1 7
2.2. SCENARIO 2: Business as Usual 14
2.1.3 Summary of Scenario 2 14
2.1.4 Analysis under Scenario 2 15
2.3. SCENARIO 3: Fragmentation 21
2.1.5 Summary of Scenario 3 21
2.1.6 Analysis under Scenario 3 22
3. Conclusions – challenges of the global water scenarios development 28
4. References 30

iii
Abstract
This report presents preliminary results of developing qualitative global water scenarios.
The water scenarios are developed to be consistent with the underlying Shared Socio-
Economic Pathways (SSPs). In this way different stakeholders in different contexts
(climate, water) can be presented with consistent set of scenarios avoiding confusion and
increasing policy impact. Water scenarios are based on the conceptual framework that
has been developed specifically for this effort. The framework provides clear
representation of important dimensions in the areas of Nature, Economy and Society and
Water dimensions that are embedded in them. These critical dimensions are used to
describe future changes in a consistent way for all scenarios. Three scenarios are
presented based on SSP1, SSP2 and SSP3 respectively. Hydro-economic classes are
introduced to further differentiate within scenarios based on economic and water
conditions for specific regions and/or countries. In the process of building these
preliminary water scenarios assumptions that are presented in this report, the number of
challenges have been met. In the conclusions section these challenges are summarized
and possible ways of tackling them are described.

iv
About the Authors
William Cosgrove
William (Bill) Cosgrove joined IIASA’s Water (WAT) Program as a Senior Research
Scholar in March 2012. His initial work has been related to the integration of the next
phases of a world water scenarios project into IIASA’s Water Program.
Cosgrove received his B.Eng. and M.Eng. (sanitary engineering) and Honorary Doctorate
of Science from McGill University and is an Honorary Fellow of UNESCO-IHE. He has
followed other graduate courses in economics, management and cross-cultural studies at
McGill and Georgetown Universities and the Harvard Business School. He is Manager
of the World Water Scenarios Project of the UN World Water Assessment Program, a
member of the Calouste Gulbenkian Foundation Think Tank on Water and the Future of
Humanity, and of several professional associations including the Association of
Professional Futurists.
Guenther Fischer
Professor DI Günther Fischer is a senior researcher in land use systems of the Food and
Water thematic area at IIASA. He also holds the position of adjunct professor in the
Department of Geography at the University of Maryland, USA. His main fields of
research are mathematical modeling of ecological-economic systems, econometrics,
optimization, applied multi-criteria decision analysis, integrated systems and policy
analysis, spatial agro-ecosystems modeling, and climate change impacts and adaptation.
He participated in the development of IIASA's world food systems model and was a key
contributor to several major food and agricultural studies: On welfare implications of
trade liberalization in agriculture; on poverty and hunger; on biofuels and food security;
on the climate-water-food-energy-ecosystem nexus; and on climate change and world
agriculture. He is collaborating with the United Nations Food and Agriculture
Organization (FAO) on the development and application of the Agro-Ecological Zones
methodology and has contributed to major FAO agricultural perspective studies, to IPCC
assessment reports, the Millennium Ecosystem Assessment, WSSD Johannesburg Report
Climate Change and Agricultural Vulnerability.
Professor Fischer is recognized as one of 23 IIASA scientists that have contributed to the
large body of IPCC reports. The Nobel Peace Prize (2007) was awarded to the
Intergovernmental Panel on Climate Change (IPCC) and Al Gore for "their efforts to
build up and disseminate greater knowledge about man-made climate change, and to lay
the foundations for the measures that are needed to counteract such change."
Martina Flörke
Dr. Martina Flörke is a senior researcher at the Center for Environmental Systems
Research (CESR) at the University of Kassel in Germany and is, since 2011, heading the
GRID-Water group. Her research focuses on model development, especially with a view
to water use, and project management. All of her research interests are related to global
change, climate change and water resources; The impact of global change on freshwater

v
resources: Where are the hotspots and where will they be in the future?; Climate change
and its impact on the energy sector.; Indicator development.; Further model
improvements and developments of WaterGAP model(s).; Temporal dynamics of
different water use sectors: past - present - future.; Urbanisation and water use.;
Vulnerability and adaptation strategies.
Since the beginning of the WFaS Initiative Dr. Flörke has been actively involved in the
development of its research.
Eva Hizsnyik
Eva Hizsnyik joined IIASA’s former Land Use Change and Agriculture (LUC) Program,
now Ecosystems Services and Management (ESM) Program, as a Research Scholar in
2003. She holds a master's degree in economics, and has been dealing with socioeconomic
aspects of global environmental change for several years. Her current responsibilities
include data mining, updating and harmonizing databases for various ongoing research
projects, and estimating and analyzing possible socioeconomic impacts of land use and
land cover change.
Piotr Magnuszewski
Piotr Magnuszewski has a background in mathematics (MSc) and physics (PhD). He later
gained experience in the area of complexity science. He is presently working in the Water
and the Risk, Policy and Vulnerability (RPV) Program of IIASA. He is furthermore co-
founder and managing director of the ISIS Academy/Centre for Systems Solutions.
Dr. Magnuszewski has been working for many years as a systems modeler, professional
trainer, facilitator and researcher. He is particularly involved in linking theory and
practice, science and policy, knowledge and action through diverse systems and
knowledge management tools. He has been applying and teaching systems tools with
diverse groups of scientists, NGOs, businesses and administration in many countries.
Dr. Magnuszewski was engaged in many international projects on resilience adaptive
management of complex socio-ecological systems. In this context he facilitated multi-
party collaboration. He also developed and applied, in a participatory way, a range of
system dynamics models. He designed and applied many simulation and role-playing
games as research and educational tools. He is author of many research and educational
publications.
Claudia Pahl-Wostl
Claudia Pahl-Wostl is professor for resources management, an endowed chair of the
German Environmental Foundation, at the Institute for Environmental Systems Research
in Osnabrück, Germany.
She is an internationally well known expert in adaptive management, water governance
and participatory integrated assessment and agent based modelling. Before moving to
USF Claudia Pahl-Wostl worked for more than ten years in the field of mathematical
modelling, integrated assessment and human ecology at the Swiss Federal Institute for

vi
Science and Technology, Zürich and the Swiss Federal Institute for Aquatic Science and
Technology, EAWAG, one of the leading water research institutes in Europe.
Angelika Scherzer
Ms. Angelika Scherzer is the program assistant for the IIASA Water program, where she
fulfills program coordination activities. Ms. Scherzer has more than ten years of working
experience in international organizations and NGOs in Austria and abroad, including
developing countries. In her positions she coordinated the implementation of projects and
programs dedicated to poverty reduction, food security, agricultural development,
migration, return and reintegration as well as peacebuilding and advocacy for the
concerns of less and least developed countries. Ms. Scherzer holds a Masters degree in
International Relations & Development Studies from the University of East Anglia, a
postgraduate diploma in International Development Studies from the Polytechnic
University of Catalonia and an undergraduate degree in Business Administration from
the International Business College in Vienna.
Andrew Segrave
Dr. Andrew Segrave is Scientific Researcher and the KWR Watercycle Research
Institute. He spearheads scientific futures studies at KWR Watercycle Research Institute.
As coordinator responsible for the thematic research on trends and future perspectives for
the Joint Water Sector Research Programme of the Dutch water companies, Andrew also
has much experience at applying methods for horizon scanning and strategic planning in
practice. His work and active contribution to the WFaS Initiative has been substantial to
the development of this and other reports.
Geza Toth
Geza Toth has been a research affiliate with IIASA since 2007. He served as the Program
Officer of IIASA's Greenhouse Gas Initiative and as a Research Assistant with the
Atmospheric Pollution and Economic Development (APD) Program, working within the
Policy Assessment Framework between 2007 and 2010. He then moved to IIASA's
Ecosystems Services and Management (ESM) Program, specializing in mitigation
strategies for land-based systems, including agriculture and forestry. In his last position
at IIASA he was affiliated with IIASA's flagship activity, the Water Futures and Solutions
Initiative (WFaS), where after an initial period devoted to program coordination- he
carries out his own research activities on pilot case studies and real world implications of
systems analysis.
Currently he is Project Developer at Ferrero Trading Lux S.A. and maintains a guest
research contract at IIASA.
Sylvia Tramberend
Sylvia Tramberend is a research scholar in IIASA’s interdisciplinary and policy oriented
research focused in the food and water thematic area. Since joining the Land Use Change
and Agriculture Program in 1997 (Ecosystems Services and Management Program as of

vii
2011), she has contributed to research in systems analysis of agriculture, land use change
and ecosystem studies. In 1994, Dr. Tramberend participated in IIASA’s Young Summer
Scientists Program, after which she continued working as a research scholar with the
Program "Regional Material Balance Approaches to Long-Term Environmental
Planning".
Her responsibilities as a land use and GIS expert have included the development of large
spatial databases serving the modeling and analysis needs in the areas of food-
environment-bioenergy-water linkages, food-system analysis, land use and water
scenarios and environmental transition. She was involved in Agro-Ecological Zones
Methodology assessments for agricultural development planning, worked on several
assessments of biofuels and food security, and the mobilization of resources for the bio-
economy. In sustainable consumption research she has been a principal investigator in
analysis tracing embodied land use and deforestation in agricultural and forestry products
from primary production to final utilization. The geographic focus of her research has
been both global and regional (e.g. Europe, China, and Brazil).
Michelle van Vliet
Michelle T.H. van Vliet is a Postdoctoral Research Scholar with IIASA’s Water (WAT)
Program. She is participating in the World Water Scenarios Project and focusses on the
‘water-energy nexus’ (i.e. complex linkages among water and energy security) under
future climate and socio-economic changes. Global and regional water assessments of
water resources and cross-sectoral water uses are performed with the aim to develop
management strategies for sustainable water, food and energy supply under future climate
and socio-economic changes.
Since January 2013, she has been working as a postdoctoral researcher both at IIASA and
at Wageningen University, the Netherlands.
David Wiberg
David Wiberg is the Acting Director of IIASA’s Water Program and is managing the
Water Futures and Solutions Initiative (WFaS), applying systems analysis to build and
explore with stakeholders consistent scenarios of the freshwater system across scales and
sectors, and exploring the synergies and tradeoffs of intervention options in order to
inform decisions focused on more effective and robust water management.
Dr. Wiberg received a degree in physics, with an economics minor, from Gustavus
Adolphus College and master’s and PhD degrees in civil engineering, water resource
engineering and management, from the University of Colorado, Boulder. He designed
river basin management software as a consultant for the Bureau of Reclamation, US DOI,
and also consulted with the EPA and DOE in the USA. In 1997 he started working with
IIASA in the Land-Use Change and Agriculture program, assessing the impact of land
use and climate changes on basin water resource availability, demand, required storage
capacity, development costs and management options, as well as helping develop the
Harmonized World Soil Database and Global Agro-Ecological zoning methodologies and
assessments. He consulted concurrently for the World Water Assessment Program and
the Dialogue for Water and Climate, and is now helping to launch IIASA’s Water

viii
Program and the Water Futures and Solutions Initiative, incorporating water science into
IIASA’s integrated assessments. Dr. Wiberg’s primary fields of interest are efficient and
sustainable water management strategies, water modeling and the development of
decision support tools, and climate change impact assessments.
Paul Yillia
Paul T. Yillia (Dr. techn.) joined the Water (WAT) Program at IIASA in November 2012
to support research on the Water-Energy Nexus and the World Water Scenarios Project.
Previously, he was a research and teaching assistant at the Vienna University of
Technology, Institute for Water Quality, Resources and Waste Management, where he
accomplished joint research and transnational exchange of knowledge and skills on water
science and technology, especially in developing countries and countries in transition.
Prior to this, Dr. Yillia undertook various assignments in the Netherlands with UNESCO-
IHE Institute for Water Education and Cap-Net (Capacity Building Network for
Integrated Water Resources Management), with progressive responsibility in training
materials development, research, education and partnership in the water sector. He was
also lecturer and research fellow on aquatic systems at the University of Sierra Leone and
has undertaken various capacity building responsibilities within the framework of
development co-operation in several countries in sub-Saharan Africa.
With a mixed background in applied science, Dr. Yillia has a range of research interests
in the water sector, from natural and induced processes and applications in aquatic
systems to water quality implications on human health and the environment. His research
and publication record covers a range of topics, including water resources evaluation and
planning, water-related health risk assessment and catchment vulnerability assessment
and management.
Deirdre Zeller
Ms. Deirdre Zeller was formerly associated with IIASA as program assistant for the
Water program.

1
1. Introduction
Scenario planning, also called scenario thinking or scenario analysis, is a strategic planning
method that some organizations use to make flexible long-term plans. Scenarios enable
improved decision-making. Insightful analysis, structural thinking and challenging outlooks
are central elements to good scenarios. These, in turn, allow for more objective and robust
responses to current and future needs.
Philippe van Notten (Notten, P. van, 2006) defines scenarios as: consistent and coherent
descriptions of alternative hypothetical futures that reflect different perspectives on past,
present, and future developments, which can serve as a basis for action.
Decision makers can use scenarios to think about the uncertain aspects of the future that worry
them most – or to discover the aspects about which they should be concerned – and to explore
ways in which these might unfold. Because there is no single answer to such enquires, scenario
builders create sets of scenarios. These scenarios all address the same important questions and
all include those aspects of the future that are likely to persist, but each one describes a different
way in which the uncertain aspects could play out.
Good scenarios are ones that explore the possible, not just the probable – providing a relevant
challenge to the conventional wisdom of their users, and helping them prepare for the major
changes ahead. They will provide a useful context for debate, leading to better policy and
strategy, and a shared understanding of, and commitment to actions.
This report presents preliminary qualitative water scenarios based on three Shared Socio-
Economic Pathways (SSPs) – see Figure 1. Information about the scenario process and the SSP
framework can be found in Moss et al. (2010), Arnell et al. (2011), van Vuuren et al. (2012)
and Kriegler et al. (2012).
Figure 1. Internal logic of SSPs

2
Water scenarios are built on the conceptual framework developed specifically for this effort –
see Figure 2.
The conceptual framework captures both specific sectors (Nature, Economy and Society) as
well as relationships between them including feedback loops.
While not all of these relationships have been quantified yet, they are already represented in
the framework, providing clear qualitative view and progress direction for quantitative efforts.
Although water is presented as a separate module in the 2-dimensional diagram it is actually
embedded in the environmental, social and economic dimensions. Similarly, Options (or
solution options) are not coming from outside but within the other framework dimensions.
Well-being dimensions including water security provide targets that effectiveness of solution
options can be measured against.
In the water scenarios presented in this report the conceptual framework and its dimensions are
used to consistently describe how selected futures are different along those dimensions. All
future changes are clearly attributed to one of the dimensions within broader sectors/categories
of Nature, Economy, Society, Water and Well-being. In this way all scenarios can be compared
against each other.
Figure 2. Conceptual framework for developing water scenarios

3
Figure 3. Main axes for water scenarios linked with the SSPs.
The original axis of SSPs (Figure 1) are specific to climate scenarios and may not be a good
starting point for developing water scenarios. Because of this we propose alternative axes that
are more familiar for anyone acquainted with previous global scenarios efforts such as
Millenium Ecosystem Assessment, GEO-4, IPCC SRES, OECD Environmental Outlook (van
Vuuren et al 2012). The horizontal axis represents the difference between the world where
solidarity is an important concern that is not only discussed but also implemented influencing
political and economic outcomes. The vertical axis represents the difference between unified
and divided world. In the globalized world important problems are tackled to a large extent
internationally, in a divided world different regions and countries are focusing on their own
specific solutions, not coordinated with other countries and regions.
Developing global scenarios is always a challenge because of diversity of trajectories that
specific regions and countries are following. In order to tackle this challenge the hydro-
economic classes have been defined (Tramberend S., Fischer G., 2015, in publication) that
create a possibility to further diversify future storylines in the specific scenarios based on
economic and water conditions.
Following Grey’s approach (Grey et.al, 2013) to consider water security in a risk framework
entails quantifying economic capacity and, often closely related, viable institutions for
managing watersheds on the one hand and the prevailing natural conditions affecting the
hydrology of water systems and water use on the other hand. Both dimensions, socio-
economics and hydrological complexity are in principle quantifiable using appropriate proxies.
For each country two normalized compound indicators are calculated to describe:
(i) the economic-socio-institutional coping capacity,
(ii) the hydrological complexity.
Each of these compound indicator is computed from a number of component indicators,
including:

4
Economic-Institutional coping capacity:
i. GDP per capita (purchasing power parity corrected) as a measure of economic strength and
financial resources that could be invested in risk management; and
ii. The Corruption Perception Index (CPI) indicator as a measure of institutional capacity to
adopt good governance principles (efficiency, effectiveness, transparency, accountability,
inclusiveness, rule of law) in governance and management of risks.
Hydrological complexity:
i. Total renewable water resources per capita as a measure of water availability
ii. Ratio of total water withdrawal to total renewable water resources availability as a proxy for
relative intensity of water use
iii. The coefficient of variation over 30 years of monthly runoff as a proxy for both inter- and
intra-annual variability of water resources
iv. The share of external (from outside national boundaries) to total renewable water resources
as a measure for the dependency of external water resources
For developing water scenario assumptions it is useful to group the countries into a few
classes. In the WFaS ‘fast-track’ analysis it has been decided to divide the space of hydro-
economic development challenges into four quadrants (Figure 4). For simplicity these are
termed: HE-1 (water secure, poor); HE-2 (water secure, rich); HE-3 (water stress, rich);
HE-4 (water stress, poor).
Figure 4. “Hydro-Economic” quadrants for human-natural water development challenges
Hydro-economic classes provide an opportunity to represent divergent tendencies in the world
that is characterized by dominant trends. This variability is important to represent and account
for because different regional and national conditions may require different types of policies
and solutions to be developed and applied. The scenarios with these branches based on hydro-
economic classes are presented conceptually on Figure 5.

5
Figure 5. Representation of water scenarios with hydro-economic classes

6
2. Preliminary Qualitative Scenarios
2.1. SCENARIO 1: Sustainability Quest
Analysis based on SSP 1
2.1.1 Summary of Scenario 1
The world shifts gradually but dramatically toward a more sustainable path, emphasizing more
inclusive human development that respects perceived environmental limits. Sustainable
development goals are set with well-defined targets. The role of water in achieving most of
them is recognized. Increasing evidence of and accounting for the social, cultural, and
economic costs of inequity and environmental degradation facilitate progress towards the
targets. Management of the global commons slowly improves, facilitated by increasingly
effective and persistent cooperation and collaboration of local, national, and international
organizations and institutions, the private sector, and
civil society. Educational and health investments
accelerate the demographic transition, leading towards
a lower population. Beginning with current high-
income countries, concerns with economic growth
shift toward a focus on human well-being, even at the
expense of somewhat slower growth over the longer
term. Consumption is oriented towards low material
growth and lower resource and energy intensity. In
response to changed perceptions, tax incentives
encourage increased investment, lower unit costs, and
increase the proportion of renewable energy resources
with smaller water footprints. Through better
forecasting of precipitation and access to it through

7
low-cost information technology farmers increase their food production. Water efficient
irrigation systems are subsidized by governments with focused aid from donors. Early warning
systems use these forecasts to reduce risks of damage from floods. Technological development
with agricultural, energy and urban applications combined with strong and flexible national
and regional institutions and institutions that favor international cooperation and trade together
make it possible through water security to move towards human well-being and environmental
sustainability.
2.1.2 Analysis under Scenario 1
Nature
Climate Change Low challenges to both mitigation and adaption
Land Use and
Agriculture
Strong land use change regulation.
Low environmental impacts.
Tropical deforestation rates are strongly reduced.
Emphasis on regional production.
Risk management and related measures implemented to reduce and spread
yield risks.
Land Productivity Improvements in agricultural productivity through rapid diffusion of best
practices and development of new cultivars and other technologies decrease
challenges to food security.
Crop yields are rapidly increasing in low- and medium-income regions,
leading to a faster catching-up with high income countries.
Agricultural Technology Quite rapid reduction of prevailing yield gaps toward environmentally
sustainable and advanced technology yield levels.
Economy
Economic
Development Globally the service sector grows relatively quickly. In developing
countries there is a continued focus on economic growth.
Relatively high transportation costs.
The importance of the manufacturing sector in the overall economy
decreases further due to the increasing importance of the non-resource
using service sector.
Trade Markets are globally connected, but an emphasis on regional production
reduces the incentives for specialization and limits the increase in trade
volumes.
8
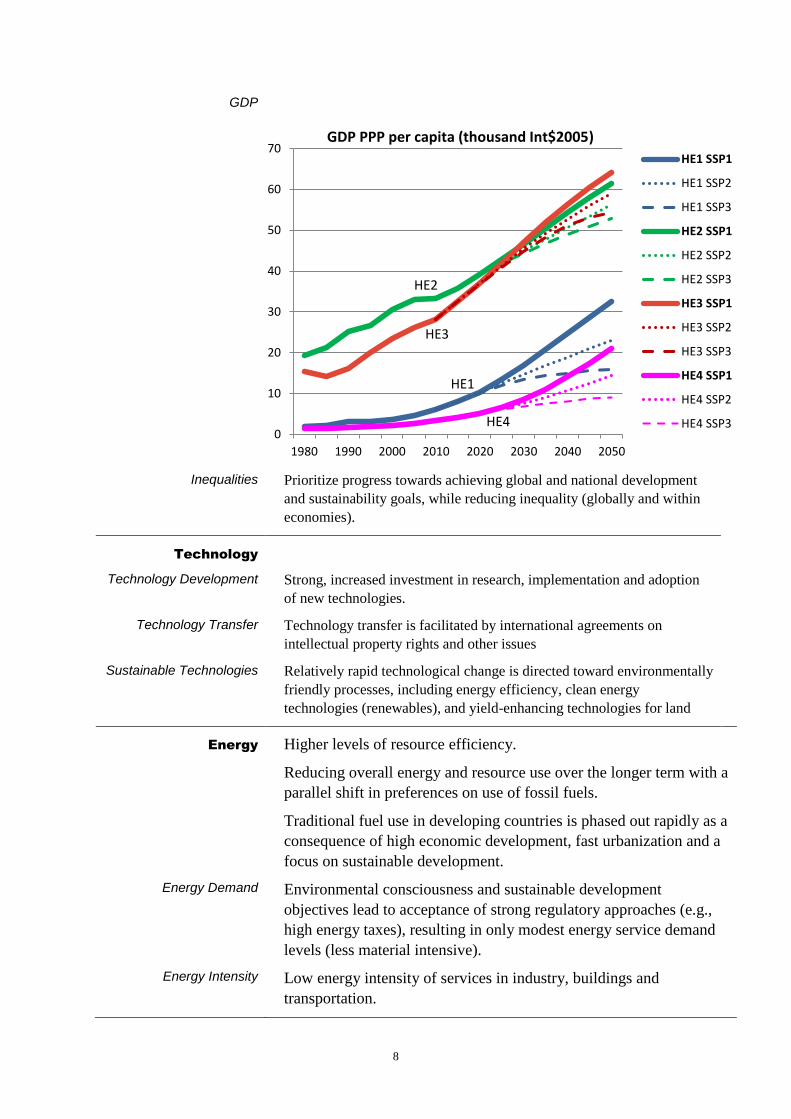
GDP
Inequalities Prioritize progress towards achieving global and national development
and sustainability goals, while reducing inequality (globally and within
economies).
Technology
Technology Development Strong, increased investment in research, implementation and adoption
of new technologies.
Technology Transfer Technology transfer is facilitated by international agreements on
intellectual property rights and other issues
Sustainable Technologies Relatively rapid technological change is directed toward environmentally
friendly processes, including energy efficiency, clean energy
technologies (renewables), and yield-enhancing technologies for land
Energy Higher levels of resource efficiency.
Reducing overall energy and resource use over the longer term with a
parallel shift in preferences on use of fossil fuels.
Traditional fuel use in developing countries is phased out rapidly as a
consequence of high economic development, fast urbanization and a
focus on sustainable development.
Energy Demand Environmental consciousness and sustainable development
objectives lead to acceptance of strong regulatory approaches (e.g.,
high energy taxes), resulting in only modest energy service demand
levels (less material intensive).
Energy Intensity Low energy intensity of services in industry, buildings and
transportation.
0
10
20
30
40
50
60
70
1980 1990 2000 2010 2020 2030 2040 2050
HE1 SSP1
HE1 SSP2
HE1 SSP3
HE2 SSP1
HE2 SSP2
HE2 SSP3
HE3 SSP1
HE3 SSP2
HE3 SSP3
HE4 SSP1
HE4 SSP2
HE4 SSP3
HE1
HE4
HE2
HE3
GDP PPP per capita (thousand Int$2005)

9
GHG Emissions (RCP) Representative concentration pathways
a. Changes in radiative forcing relative
to pre-industrial conditions. Bold
coloured lines show the four RCPs;
thin lines show individual scenarios
from approximately 30 candidate
RCP scenarios that provide
information on all key factors
affecting radiative forcing from ref.
47 and the larger set analysed by
IPCC Working Group III during
development of the Fourth
Assessment Report.
b. Energy and industry CO2 emissions for
the RCP candidates. The range of
emissions in the post-SRES literature is
presented for the maximum and
minimum (thick dashed curve) and 10th
to 90th percentile (shaded area). Blue
shaded area corresponds to mitigation
scenarios; grey shaded area
corresponds to reference scenarios;
pink area represents the overlap
between reference and mitigation
scenarios.
Society
Demography
Population The demographic transition leads to a relatively low population with
migration at intermediate levels (as an effect of improved regional
livelihoods and the renewed emphasis on regional production)

10
Education Improved access to education and gender equality.
Urbanization Urbanization proceeds rapidly in all parts of the world.
Values, Lifestyles
Pro-environmental Values
High environmental awareness.
Formal and informal actions over time, help to fundamentally restructure
the relationships between humans and the environment.
Consumption, Diets There are shifts in public and private behavior reflected in changing
consumption and investment patterns. Consumption is oriented towards low
material growth and lower resource and energy intensity.
Healthy diets with low animal-calorie shares and low waste prevail.
Governance
Policy Orientation Policies shift to align incentives with development and sustainability goals,
including measures such as the adoption and use of standardized measures
of well-being to complement GDP.
Increased attention to ensuring the growth is broad-based and does not
come at the expense of long-term degradation of local environments. There
are also changes in policies enhancing universal access to education,
promoting higher education levels and gender equality. Policies shift to
align incentives with development and sustainability goals, including
measures such as improving the access of developing countries to
international markets, including the opening of agricultural markets.
The governance and institutions are re-oriented toward sustainability
principles and support cooperation on sustainable development.
Quality of Governance Reductions in corruption levels, policies calling for greater transparency in
all sectors of society, and strengthening of the rule of law gradually lead to
0
1000
2000
3000
4000
5000
6000
1960 1970 1980 1990 2000 2010 2020 2030 2040 2050
HE1 SSP1
HE1 SSP2
HE1 SSP3
HE2 SSP1
HE2 SSP2
HE2 SSP3
HE3 SSP1
HE3 SSP2
HE3 SSP3
HE4 SSP1
HE4 SSP2
HE4 SSP3
HE1
HE4
HE2
HE3
Population (millions)

11
greater effectiveness of development policies. Effective institutions and
governance support an open, globalized economy.
Environmental Policy Stronger recognition of environmental considerations (including phase out
of subsidies on fossil fuels -particularly coal and oil) and tightening of
environmental regulation on the national and regional level.
There is a stricter environmental regulation successfully implemented on
such issues as air pollution oil spill safety levels which improve health in
developing countries.
If and when severe climate impacts do occur, coordination structures (e.g.
integrated early warning systems, security alliances, and disaster relief
services) are in place to assist those most at risk.
The transition from increased environmental degradation in the short-term
to improved management of the local environment and the global commons
over the longer term.
Global Cooperation Relatively effective and persistent cooperation and collaboration of national
and international organizations and institutions, the private sector, and civil
society linked with an increasing integration of labor markets. Willingness
to cooperate support an open, globalized economy. New global institutions
and governance evolve to support cooperation on sustainable development.
Water
Water Governance Enforced limits to groundwater over-exploitation.
Enhanced treatment and reuse of water.
Concern for pollution reduction and water quality, implying
widespread application of precision farming and nutrient
management.
Water Infrastructure Reliable water infrastructure and water sources
Water Pollution Improved water quality
Available Water
Resources
The map below shows calculated ratios of mean annual runoff
around 2050 relative to the base period 1971-2000.
In these ratio maps values above 1 indicate an increase of
mean annual runoff, values below 1 a decrease of future
runoff.

12
Water Demand
Agriculture Area equipped for irrigation stagnates or slightly declines
while irrigation efficiency is improving fast. Economic and
water scarcity will somewhat limit further increases of
cropping intensity.
Energy Reduction in energy demand will decrease the demand for
water from the energy sector substantially even if world
population, primary energy production, and electricity
generation were to increase.
A shift away from traditional biomass toward less
consumptive energy carriers, as well as the changing energy
mix in electricity generation leads to water savings.
A favorable outlook for renewables will cause big structural
and efficiency shifts in the choice of technology with variable
consequences for water use intensity and efficiency,
depending on the renewable type. For example, an expanding
output of biofuels leads to a rise in water consumption,
whereas a shift towards photovoltaic solar power or wind
energy leads to a decrease in water use intensity.
Higher energy efficiency translates into a relatively lower
water demand, improvements in water quality, following high
standards that commit industry to continually improving
environmental performance.
Overall, structural & technological changes results in
decreasing water use intensities in the energy sector. For
example the widespread application of water-saving
technologies in the energy sector significantly reduces the
amount of water used not only for fuel extraction and
processing but also for electricity generation as well.

13
Manufacturing Manufacturing industries with efficient water use and low
environmental impacts are favored and increase their
competitive position against water intensive industries.
Enhanced reuse of water and treatment.
Widespread application of water-saving technologies in
industry.
Overall, both structural & technological changes result in
decreasing industrial water use intensities.
Domestic Significant structural and technological improvements in
domestic water use intensity.
Freshwater Ecosystems
Health
work in progress …
Well-Being
Overview Relatively high economic growth in low-income countries reduces poverty,
and a global focus on increasing equity also increases social cohesion,
while maintaining high levels of social and cultural diversity within and
across countries. There is a shift in emphasis from growth per se to well-
being, equity, and sustainability. The overall standards of living are high.
Improved regional livelihoods.
Water Security Improved access to safe water
Health Improved health in developing countries.
Improved sanitation, and medical care.
Energy Access Improved energy access
Food Security Improved food security.
Improved nutrition.
Equity Improved equity

14
2.2. SCENARIO 2: Business as Usual
Analysis based on SSP 2
2.1.3 Summary of Scenario 2
This world experiences only moderate progress towards a multitude of goals and interests.
Development and income growth proceeds unevenly, with only some countries making
relatively good progress. Most economies are politically stable. Globally connected markets
continue to function imperfectly. Sustainable development goals are set for access to
education, food, energy, safe drinking water, health care and a sustainable environment.
Unfortunately, the dependence on water of achieving most of them and competition among
them makes progress slow. Technological developments proceed apace, but without
fundamental breakthroughs. Overall the intensity of energy use declines, with slowly
decreasing water-dependent fossil fuel use.
While improved weather forecasting is
developed, it remains unavailable to those in
less developed countries who need it to
improve food production and reduce flood
risks. Environmental systems experience
more degradation, although economic
benefits drive some improvements. Global
population growth is moderate and levels
off in the second half of the century as a
consequence of completion of the
demographic transition. However,
education investments in low-income
countries are not high enough to accelerate
the transition to low fertility rates and slow
population growth. This growth, along with
persistent income inequality (globally and

15
within economies), stagnant institutions, societal stratification, and limited social cohesion,
maintain challenges to societal and environmental change and constrain significant advances
in human well-being.
2.1.4 Analysis under Scenario 2
Nature
Climate Change Medium challenges to both mitigation and adaption.
Only moderate success in reducing climate risks and vulnerability.
Land Use and
Agriculture
Medium land use change regulation.
Land use change is incompletely regulated, i.e. tropical deforestation
continues, although at slowly declining rates over time.
No effective measures to prevent pollution and degradation by agricultural
practices; environmental risks caused by intensive application of fertilizers
and agro-chemicals, and intensive and concentrated livestock production
systems.
Environmental systems experience degradation.
Land Productivity Rates of crop yield increase decline slowly over time, but low-income
regions catch up to a certain extent. Declining growth rate for high-income
countries, converging rates for low-income countries.
Agricultural Technology Moderate pace of technological change in the agricultural sectors.
Economy
Economic Development High growth for some low-income countries. Emerging economies
continue their rapid development for an initial period, but experience a
slowdown as their economies mature. High-income countries continue to
grow at moderate rates.
Manufacturing GVA further declines in relative terms (as % of GDP).
Trade Markets are globally connected but function imperfectly. Some trade
barriers continue to exist. International trade remains to large extent
regionalized.
Access to global oil and gas markets continues to play a large role in
international relations.
GDP Development occurs at moderate rates on average.

16
Inequalities Development with substantial differences on a regional level. Tensions
within countries periodically threaten to boil over, but do so only rarely,
and never catastrophically.
Tensions between countries periodically threaten to boil over, but do so
only rarely, and never catastrophically.
Technology
Technology Development Technological progress but no major breakthrough.
Some international cooperation and investment in research and
technology on providing access to modern energy and promoting
sustainable development.
Technology Transfer New energy technologies developed in industrialized countries are only
slowly shared with middle- and low-income countries, in part because of
challenges to resolving intellectual property rights and other issues with
technology transfer.
Sustainable Technologies Only moderate transformation toward environmentally friendly
processes.
Energy Continued reliance on fossil fuels, including unconventional oil and gas
resources. Moderate pace of technological change in the energy sectors.
Regional diversity in energy demand and intensity.
Energy Demand Intermediate phase-out of traditional fuel use, regionally diverse speed.
Medium service demands (generally material intensive).
Energy Intensity Medium energy intensity of services in industry, buildings and
transportation.
Some progress towards reductions in energy and resource use intensity.
GHG Emissions (RCP) Representative concentration pathways
0
10
20
30
40
50
60
70
1980 1990 2000 2010 2020 2030 2040 2050
GDP PPP per capita (thousand Int$2005)HE1 SSP1
HE1 SSP2
HE1 SSP3
HE2 SSP1
HE2 SSP2
HE2 SSP3
HE3 SSP1
HE3 SSP2
HE3 SSP3
HE4 SSP1
HE4 SSP2
HE4 SSP3
HE1
HE4
HE2
HE3

17
c. Changes in radiative forcing relative
to pre-industrial conditions. Bold
coloured lines show the four RCPs;
thin lines show individual scenarios
from approximately 30 candidate
RCP scenarios that provide
information on all key factors
affecting radiative forcing from ref.
47 and the larger set analysed by
IPCC Working Group III during
development of the Fourth
Assessment Report.
d. Energy and industry CO2 emissions for
the RCP candidates. The range of
emissions in the post-SRES literature is
presented for the maximum and
minimum (thick dashed curve) and 10th
to 90th percentile (shaded area). Blue
shaded area corresponds to mitigation
scenarios; grey shaded area
corresponds to reference scenarios;
pink area represents the overlap
between reference and mitigation
scenarios.
Society
Demography
Population Population growth is moderate, with higher growth in low-income
countries, slowing population growth in middle-income countries, and
limited to negative population growth in most industrialized countries.
Migration between countries continues at intermediate levels owing to the
restriction of labor markets.

18
Education Some progress towards universal education.
Education investments are not high enough to rapidly slow population
growth, particularly in low-income countries.
Urbanization Urbanization proceeds at rates and in patterns consistent with historical
experience in different world regions.
Values, Lifestyles
Pro-environmental Values Moderate awareness of the environmental consequences of choices when
using natural resources.
Consumption, Diets Consumption is oriented towards material growth.
Caloric consumption and animal calorie shares converge towards medium
levels. Increasing per capita consumption of livestock products with
growing incomes.
Governance
Policy Orientation
Quality of Governance Most economies are politically stable.
Moderate corruption levels and limited access to the rule of law slows
effectiveness of development policies.
Environmental Policy
Global Cooperation Globally connected markets function imperfectly.
Relatively weak coordination and cooperation among national and
international institutions, the private sector, and civil society for addressing
environmental concerns.
0
1000
2000
3000
4000
5000
6000
1960 1970 1980 1990 2000 2010 2020 2030 2040 2050
Population (millions)
HE1 SSP1
HE1 SSP2
HE1 SSP3
HE2 SSP1
HE2 SSP2
HE2 SSP3
HE3 SSP1
HE3 SSP2
HE3 SSP3
HE4 SSP1
HE4 SSP2
HE1
HE4
HE2
HE3

19
Water
Water Governance No effective halt to groundwater over-exploitation.
Water Infrastructure
Water Pollution Water pollution remains a significant problem in many (especially less
developed parts of the world).
Available Water Resources The map below shows calculated ratios of mean annual runoff around
2050 relative to the base period 1971-2000.
In these ratio maps values above 1 indicate an increase of mean annual
runoff, values below 1 a decrease of future runoff.
Water Demand Weak environmental regulation and enforcement trigger only slow
technological progress in water use efficiencies.
Some improvements of water use efficiency, but only limited advances
in low-income countries.
In general, water use intensities will continue to decrease in the most
developed regions. However, there will be slow progress in Africa,
Latin America and other emerging economics.
Agriculture Further increase of irrigation cropping intensity with warming in most
regions.
Medium growth of area equipped for irrigation.
Medium increase in irrigation efficiency.
Energy Reliance on fossil fuels may lead to only minor structural and
efficiency shifts in technology.

20
Stabilization of overall energy demand over the long run will lead to
little or no change in water demand for fuel extraction, processing and
electricity generation.
A moderate pace in technological change will cause minor structural
and efficiency shifts in technology and ultimately water use intensity
will change only slightly.
Regional stress points will increase globally. Power generation in
regional stress points will likely have to deploy more and more
technologies fit for water-constrained conditions to manage water-
related risks, though this can involve trade-offs in cost, energy output
and project siting.
Manufacturing Moderate & regionally different decreases of manufacturing water use
intensities.
Domestic Medium structural and technological improvements in domestic water
use intensity.
Freshwater Ecosystems
Health
work in progress …
Well-Being
Overview Slow progress in achieving development goals of education, safe water,
health care.
Water Security Water and food insecurity remain as problems in some areas of low-income
countries.
Health There is some progress towards access to health care.
Energy Access Intermediate success in improving energy access for the poor.
Food Security Moderate progress in reducing food insecurity. Some reduction of food
insecurity due to trickle down of economic development.
Food insecurity continue to be problems in disadvantaged areas of low-
income countries.
Equity Societal stratification, and limited social cohesion.

21
2.3. SCENARIO 3: Fragmentation
Analysis based on SSP 3
2.1.5 Summary of Scenario 3
Strengthening regional identities, competitiveness between them and concerns for national
security push countries to increasingly focus on domestic or, at most, regional issues. This
trend is reinforced by the weakness of a number of global institutions, with uneven coordination
and cooperation for addressing human well-being and environmental sustainability. Policies
are oriented towards security, including barriers to trade, particularly in the energy resource
and agricultural markets. Countries
focus on achieving energy and food
security goals within their own
region, at the expense of broader-
based development. A low
international priority for addressing
environmental concerns leads to
environmental degradation in some
regions. Water resources are
considered to be the property of
upstream countries which enjoy the
precipitation without consideration
of the needs of their neighbors.
Population growth is low in
industrialized and high in developing
countries. There are pockets of
extreme poverty alongside pockets
of moderate wealth. Some countries

22
are struggling to maintain living standards and to provide access to safe water, improved
sanitation, and health care for disadvantaged populations. In others, the wealthier have access
to food, energy and safe drinking water and live in a clean environment without concern for
their fellow citizens or those in neighboring countries. Global economic production increases
through their contribution while they pay lip service to internationally agreed sustainable
development goals and targets.
2.1.6 Analysis under Scenario 3
Nature
Climate Change High challenges to both mitigation and adaptation.
Land Use and
Agriculture
Land use change is hardly regulated, i.e. tropical deforestation continues at
current rates.
Growing protection of national agricultural sectors and increasing
agricultural trade barriers.
Low priority to halt environmental degradation caused by agriculture
(erosion, deforestation, poor nutrient management, water pollution and
exploitation).
Land Productivity Lower rates of land productivity growth everywhere. Rates of crop yield increase
decline strongly over time, due to little investment. • Widespread lack of
sufficient investment and capacity for yield gap reduction in developing countries.
Agricultural Technology
Serious degradation of the environment in some regions.
Economy
Economic Development Growing concerns about globalization and focus on national/regional
issues and interests.
Manufacturing GVA in relative terms (% of GDP) declines slower than
historic trends.
Trade The world has de-globalized, and international trade, including energy
resource and agricultural markets, is restricted because of security
concerns.
GDP Slow economic growth in all regions.

23
Inequalities Persistent inequality within countries with pockets of extreme poverty
alongside pockets of moderate wealth, with many countries struggling to
maintain living standards.
World with high inequalities across countries separated into regional
blocks with little interaction between them, resembling the Cold War
period.
Technology Low technological capacity, and little investment in research and
development
Technology Development
Technology Transfer
Sustainable Technologies
Energy Little progress in reducing fossil fuel dependency. Continued reliance on
traditional fuels. Increase in resource use intensity. Reliance on fossil fuels
leads to only minor structural and efficiency shifts in technology.
Energy Demand Increased energy demand driven by high population growth and little
progress in efficiency.
Energy Intensity Medium energy intensity of services in industry, buildings and
transportation.
GHG Emissions (RCP) Representative concentration pathways
0
10
20
30
40
50
60
70
1980 1990 2000 2010 2020 2030 2040 2050
GDP PPP per capita (thousand Int$2005)
HE1 SSP1
HE1 SSP2
HE1 SSP3
HE2 SSP1
HE2 SSP2
HE2 SSP3
HE3 SSP1
HE3 SSP2
HE3 SSP3
HE4 SSP1
HE4 SSP2
HE4 SSP3
HE1
HE4
HE2
HE3

24
e. Changes in radiative forcing relative
to pre-industrial conditions. Bold
coloured lines show the four RCPs;
thin lines show individual scenarios
from approximately 30 candidate
RCP scenarios that provide
information on all key factors
affecting radiative forcing from ref.
47 and the larger set analysed by
IPCC Working Group III during
development of the Fourth
Assessment Report.
f. Energy and industry CO2 emissions for
the RCP candidates. The range of
emissions in the post-SRES literature is
presented for the maximum and
minimum (thick dashed curve) and 10th
to 90th percentile (shaded area). Blue
shaded area corresponds to mitigation
scenarios; grey shaded area
corresponds to reference scenarios;
pink area represents the overlap
between reference and mitigation
scenarios.
Society
Demography
Population Global population growth is high. High mortality rates in developing
countries, with many children dying from preventable diseases
(malnutrition, diarrheal disease, malaria).

25
Education Low investments in human capital and education with poorly educated
populations in some regions.
Urbanization Urbanization is slow in all regions. Disadvantaged populations continue to
move to unplanned settlements around large urban areas, particularly in
low-income countries.
Disadvantaged populations continue to move to unplanned settlements
around large urban areas, particularly in low-income countries, often in
places that are particularly vulnerable to weather and climate events.
Values, Lifestyles
Pro-environmental Values Low environmental awareness.
Consumption, Diets Unhealthy diets with high animal shares and high waste prevail.
Governance
Policy Orientation Countries focus on achieving energy and food security goals within their
own region. Policies are oriented towards security, including barriers to
trade.
Quality of Governance Government institutions dominate societal decision-making. Authoritarian
regimes emerge or are strengthened in many parts of the world. The
remaining participatory societies are increasingly bound by a strong ethic of
supporting national priorities.
There is a considerable level of corruption from the entanglement of the
private and public sectors.
Global governance and institutions are weak.
Environmental Policy Low priority for addressing environmental concerns.
Global Cooperation Growing concerns with respect to international competitiveness and
national security, aided by renewed interest in regional identity and culture,
0
1000
2000
3000
4000
5000
6000
1960 1970 1980 1990 2000 2010 2020 2030 2040 2050
Population (millions)
HE1 SSP1
HE1 SSP2
HE1 SSP3
HE2 SSP1
HE2 SSP2
HE2 SSP3
HE3 SSP1
HE3 SSP2
HE3 SSP3
HE4 SSP1
HE4 SSP2
HE1
HE4
HE2
HE3

26
push societies to become more skeptical about globalization and
increasingly focus on domestic or, at most, regional issues and interests.
Global governance, institutions, and leadership are weak, also in addressing
the multiple dimensions of vulnerability. There is a lack of or little
cooperation and consensus because of the absence of institutions to
facilitate global cooperative action.
Water
Water Governance
Water Infrastructure
Water Pollution
Available Water Resources Persistent over-exploitation of groundwater aquifers.
Unreliable water and energy supply for agricultural producers.
The map below shows calculated ratios of mean annual runoff around
2050 relative to the base period 1971-2000.
In these ratio maps values above 1 indicate an increase of mean annual
runoff, values below 1 a decrease of future runoff.
Water Demand Barriers in trade may trigger slow technological progress in water use
efficiencies. A moderate pace in technological change will cause minor
structural and efficiency shifts in technology and ultimately water use
intensity will change only slightly.
Weak environmental regulation and enforcement hamper technological
progress in water use efficiencies, hence very low progress in water-
saving technologies.

27
Agriculture Further increase of irrigation cropping intensity with warming.
Only modest improvements of irrigation water use efficiency.
Area equipped for irrigation is expected to increase.
Energy An increase in energy intensity will increase water demand where as
little progress in efficiency would trigger increased water demand as
energy use intensifies.
Manufacturing Water use intensities increase only marginally, primarily in the most
developed regions.
Domestic Only small structural and technological improvements in domestic
water use intensity.
Freshwater Ecosystems
Health
work in progress …
Well-Being
Overview Failed attempts to achieve global development goals. Large numbers of
people vulnerable to climate change and many parts of the world with low
adaptive capacity.
High population growth and insufficient development leave behind highly
vulnerable human and environmental systems.
Water Security Widespread lack of access to safe water and sanitation.
Water insecurity persist as major problems in low-income countries.
Health Many disadvantaged populations without access to improved sanitation and
health care.
Energy Access Widespread problems with energy access.
Food Security Food insecurity persist as major problems in low-income countries.
Equity Trends work against the reduction of social stratification, with little
improvement for disadvantaged population groups.

28
3. Conclusions – challenges of the global water scenarios development
Global scenarios are significantly different than scenarios established in other decision
domains. Although high stakes and deep uncertainties about the future make the case for using
the scenario method to prepare ourselves for a wide range of future possibilities, a big challenge
remains concerning how to address the specific needs of diverse user groups (see Parsons
2008). Users’ engagement is considered critical to the effectiveness of scenarios (van der
Heijden 1996). Scenario users jointly delineate their sphere of influence (where they can
effectively make decisions and develop strategies) and a sphere of uncertainty (where they need
to agree on most important but uncertain drivers and their possible trends).
When integrating scenarios across sectors and scales globally, the problem becomes for more
complex due to overlapping spheres of influence and uncertainty. One single, small stakeholder
group cannot be completely representative of all geographical, demographic, economic,
institutional experience through all sectors, disciplines and scales. Drivers and decision
variables also cannot then be fixed, since the drivers in one sector are the decision variables in
another. Finally, scenario producers are not fully aware of the needs of all relevant decision
and policy makers.
Another well know problem in developing global scenarios is that such scenarios tend to
concentrate on variables that have available global data and can be easily aggregated (Parsons
2008). Variables that depend on local contexts are often discarded.
Despite the challenges, scenarios are useful to support policy-making process at different
stages. Many reviews and evaluations of scenarios processes reveal that they have been quite
successful in the business context, supporting strategic decisions at all stages of policy cycle.
Their impact in the public sector has so far been mostly limited to the first stage of the policy
cycle (Volkery and Ribeiro 2009), which can be called an indirect support. The beneficial
uses of scenarios in this context are summarized in the table below.
How to bridge the gap?
Scenario
Developers
Scenario
Users
Science Policy

29
Policy stage Form of scenario-based decision support
Policy issue
identification
and framing
Stimulating wider debate about possible futures
Getting stakeholders engagement and buy-in
Clarifying issues importance with respect to stakeholders’ needs and
expectations
Agreeing objectives
Policy measure
development
Generating options for future actions
Appraising robustness of options for future actions
Policy measure
implementation
Using scenario framework and indicators for monitoring of results
Policy evaluation Using shared understanding about stakeholders’ needs, expectations
and objectives as well as monitoring results to assess policy
effectiveness and efficiency.
The distance from the more direct scenario-based decision support has been even greater for
global scenarios. Many scenarios studies were described as “hollow diamonds, that sparkle
alluringly but fail to contain real value to the decision-making process.” These findings stand
in sharp contrast with the clear need for public policy at the global level to address future
challenges and uncertainties. Can the success of the private sector in successful application of
scenarios to tackle critical strategic problems be replicated?
Although this short analysis may sound pessimistic, many steps can be taken, and potential
benefits are substantial even if moderate progress will be done. To this end it is recommended
to establish a typology of scenario users and their needs to better tailor scenarios for those
needs. Produced scenarios should be more transparent– especially with respect to judgments
on uncertain factors. Finally there is need to institutionalize use of scenarios for policy
development. Scenarios development and use is not a one-shot effort – its biggest worth lies in
continued long term application, helping to achieve long-term goals in spite of complexity and
uncertainty.

30
4. References
Notten, P. van, 2006. Chapter 4 Scenario development: a typology of approaches, Published in
Think Scenarios, Rethink Education, available at:
http://www.oecd.org/dataoecd/27/38/37246431.pdf
Moss, R. H., Edmonds, J. A., Hibbard, K. A., Manning, M. R., Rose, S. K., Van Vuuren, D. P.,
... & Wilbanks, T. J. (2010). The next generation of scenarios for climate change research
and assessment. Nature, 463(7282), 747-756.
Van Vuuren, D. P., Riahi, K., Moss, R., Edmonds, J., Thomson, A., Nakicenovic, N., ... &
Arnell, N. (2012). A proposal for a new scenario framework to support research and
assessment in different climate research communities. Global Environmental
Change, 22(1), 21-35.
Kriegler, E., O’Neill, B. C., Hallegatte, S., Kram, T., Lempert, R. J., Moss, R. H., & Wilbanks,
T. (2012). The need for and use of socio-economic scenarios for climate change analysis:
a new approach based on shared socio-economic pathways. Global Environmental
Change, 22(4), 807-822.
Parson, E. A. (2008). Useful global-change scenarios: current issues and challenges.
Environmental Research Letters, 3(4), 045016.
Volkery, A., & Ribeiro, T. (2009). Scenario planning in public policy: Understanding use,
impacts and the role of institutional context factors. Technological forecasting and social
change, 76(9), 1198-1207.
Van der Heijden, K. (1996). Scenarios: the art of strategic conversation.
van Vuuren, D. P., Kok, M. T., Girod, B., Lucas, P. L., & de Vries, B. (2012). Scenarios in
global environmental assessments: key characteristics and lessons for future use. Global
Environmental Change.
Grey D. and Sadoff C. W. 2007. Sink or Swim? Water security for growth and development.
Water Policy 9 (2007) 545–571